Pringle borough, PA Map & Demographics
Pringle borough Overview
$39,220
PER CAPITA INCOME
$83,125
AVG FAMILY INCOME
$68,229
AVG HOUSEHOLD INCOME
5.1%
WAGE / INCOME GAP [ % ]
94.9¢/ $1
WAGE / INCOME GAP [ $ ]
0.41
INEQUALITY / GINI INDEX
877
TOTAL POPULATION
425
MALE POPULATION
452
FEMALE POPULATION
94.03
MALES / 100 FEMALES
106.35
FEMALES / 100 MALES
43.3
MEDIAN AGE
3.0
AVG FAMILY SIZE
2.2
AVG HOUSEHOLD SIZE
502
LABOR FORCE [ PEOPLE ]
68.4%
PERCENT IN LABOR FORCE
3.8%
UNEMPLOYMENT RATE
Income in Pringle borough
Income Overview in Pringle borough
Per Capita Income in Pringle borough is $39,220, while median incomes of families and households are $83,125 and $68,229 respectively.
| Characteristic | Number | Measure |
| Per Capita Income | 877 | $39,220 |
| Median Family Income | 220 | $83,125 |
| Mean Family Income | 220 | $89,964 |
| Median Household Income | 397 | $68,229 |
| Mean Household Income | 397 | $86,324 |
| Income Deficit | 220 | $0 |
| Wage / Income Gap (%) | 877 | 5.06% |
| Wage / Income Gap ($) | 877 | 94.94¢ per $1 |
| Gini / Inequality Index | 877 | 0.41 |
Earnings by Sex in Pringle borough
Average Earnings in Pringle borough are $39,432, $40,375 for men and $38,333 for women, a difference of 5.1%.
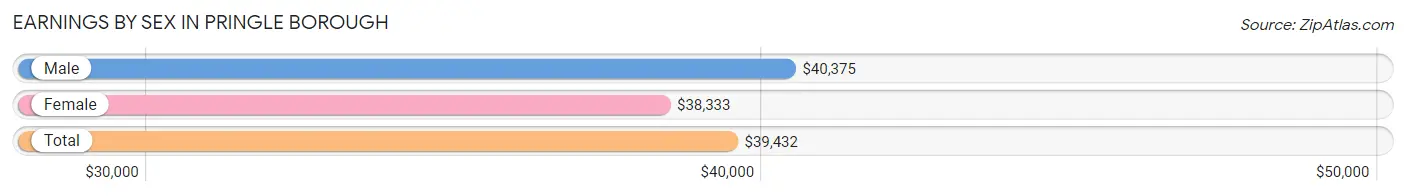
| Sex | Number | Average Earnings |
| Male | 285 (56.4%) | $40,375 |
| Female | 220 (43.6%) | $38,333 |
| Total | 505 (100.0%) | $39,432 |
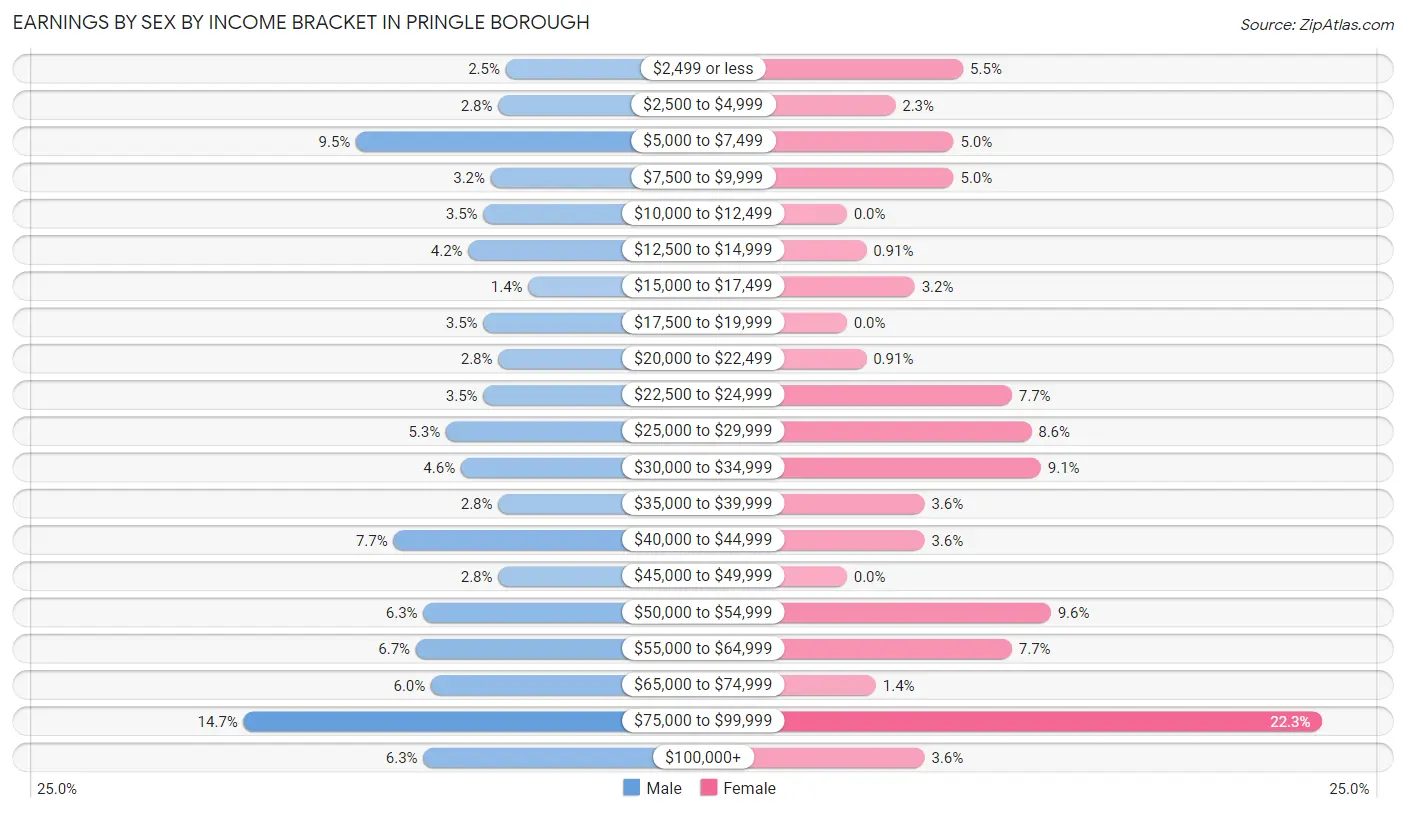
Earnings by Sex by Income Bracket in Pringle borough
The most common earnings brackets in Pringle borough are $75,000 to $99,999 for men (42 | 14.7%) and $75,000 to $99,999 for women (49 | 22.3%).
| Income | Male | Female |
| $2,499 or less | 7 (2.5%) | 12 (5.4%) |
| $2,500 to $4,999 | 8 (2.8%) | 5 (2.3%) |
| $5,000 to $7,499 | 27 (9.5%) | 11 (5.0%) |
| $7,500 to $9,999 | 9 (3.2%) | 11 (5.0%) |
| $10,000 to $12,499 | 10 (3.5%) | 0 (0.0%) |
| $12,500 to $14,999 | 12 (4.2%) | 2 (0.9%) |
| $15,000 to $17,499 | 4 (1.4%) | 7 (3.2%) |
| $17,500 to $19,999 | 10 (3.5%) | 0 (0.0%) |
| $20,000 to $22,499 | 8 (2.8%) | 2 (0.9%) |
| $22,500 to $24,999 | 10 (3.5%) | 17 (7.7%) |
| $25,000 to $29,999 | 15 (5.3%) | 19 (8.6%) |
| $30,000 to $34,999 | 13 (4.6%) | 20 (9.1%) |
| $35,000 to $39,999 | 8 (2.8%) | 8 (3.6%) |
| $40,000 to $44,999 | 22 (7.7%) | 8 (3.6%) |
| $45,000 to $49,999 | 8 (2.8%) | 0 (0.0%) |
| $50,000 to $54,999 | 18 (6.3%) | 21 (9.6%) |
| $55,000 to $64,999 | 19 (6.7%) | 17 (7.7%) |
| $65,000 to $74,999 | 17 (6.0%) | 3 (1.4%) |
| $75,000 to $99,999 | 42 (14.7%) | 49 (22.3%) |
| $100,000+ | 18 (6.3%) | 8 (3.6%) |
| Total | 285 (100.0%) | 220 (100.0%) |
Earnings by Sex by Educational Attainment in Pringle borough
Average earnings in Pringle borough are $45,313 for men and $47,500 for women, a difference of 4.6%. Men with an educational attainment of college or associate's degree enjoy the highest average annual earnings of $60,000, while those with high school diploma education earn the least with $17,875. Women with an educational attainment of bachelor's degree earn the most with the average annual earnings of $91,250, while those with high school diploma education have the smallest earnings of $23,309.
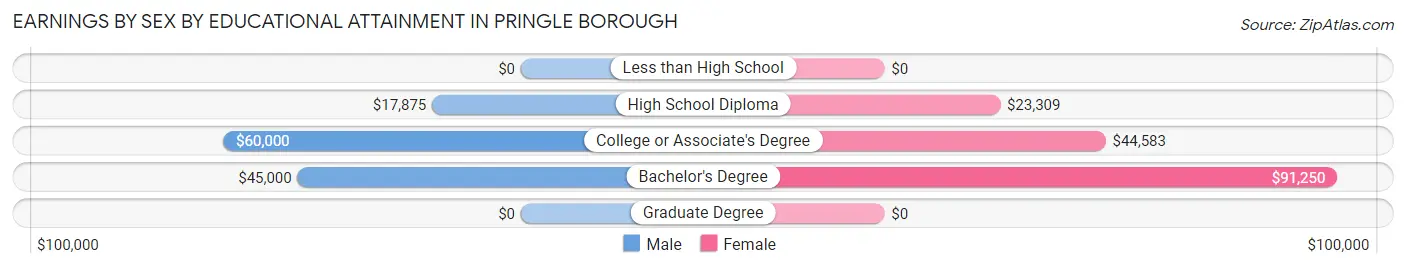
| Educational Attainment | Male Income | Female Income |
| Less than High School | - | - |
| High School Diploma | $17,875 | $23,309 |
| College or Associate's Degree | $60,000 | $44,583 |
| Bachelor's Degree | $45,000 | $91,250 |
| Graduate Degree | - | - |
| Total | $45,313 | $47,500 |
Family Income in Pringle borough
Family Income Brackets in Pringle borough
According to the Pringle borough family income data, there are 42 families falling into the $100,000 to $149,999 income range, which is the most common income bracket and makes up 19.1% of all families. Conversely, the less than $10,000 income bracket is the least frequent group with only 7 families (3.2%) belonging to this category.
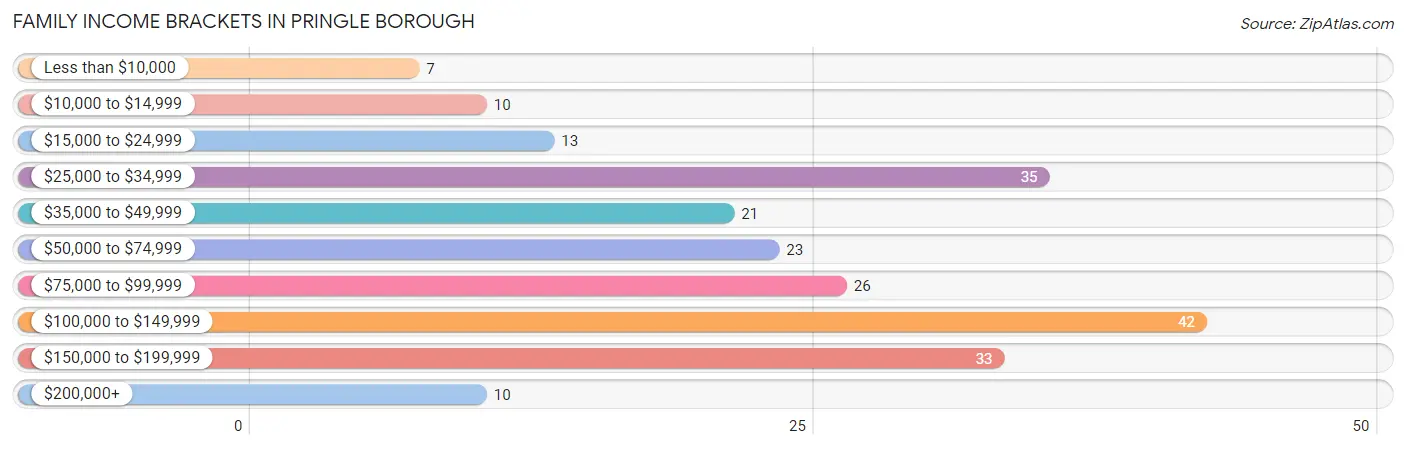
| Income Bracket | # Families | % Families |
| Less than $10,000 | 7 | 3.2% |
| $10,000 to $14,999 | 10 | 4.5% |
| $15,000 to $24,999 | 13 | 5.9% |
| $25,000 to $34,999 | 35 | 15.9% |
| $35,000 to $49,999 | 21 | 9.5% |
| $50,000 to $74,999 | 23 | 10.5% |
| $75,000 to $99,999 | 26 | 11.8% |
| $100,000 to $149,999 | 42 | 19.1% |
| $150,000 to $199,999 | 33 | 15.0% |
| $200,000+ | 10 | 4.5% |
Family Income by Famaliy Size in Pringle borough
3-person families (33 | 15.0%) account for the highest median family income in Pringle borough with $155,288 per family, while 3-person families (33 | 15.0%) have the highest median income of $51,763 per family member.
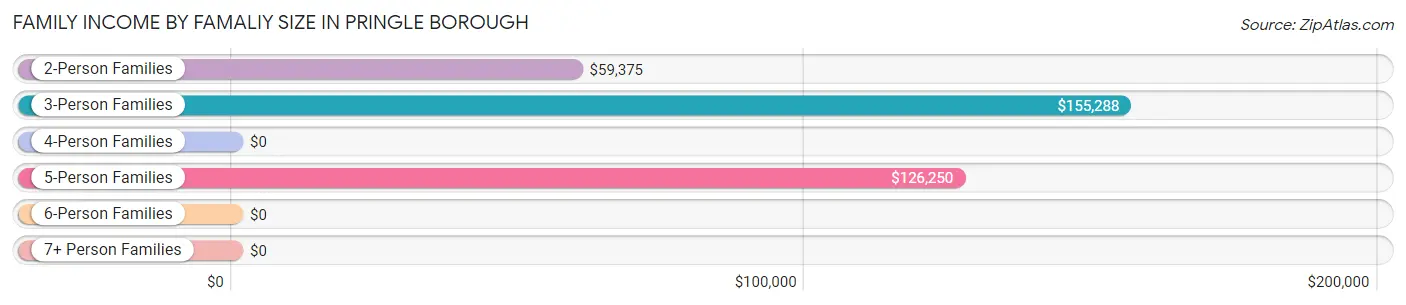
| Income Bracket | # Families | Median Income |
| 2-Person Families | 122 (55.4%) | $59,375 |
| 3-Person Families | 33 (15.0%) | $155,288 |
| 4-Person Families | 39 (17.7%) | $0 |
| 5-Person Families | 16 (7.3%) | $126,250 |
| 6-Person Families | 10 (4.5%) | $0 |
| 7+ Person Families | 0 (0.0%) | $0 |
| Total | 220 (100.0%) | $83,125 |
Family Income by Number of Earners in Pringle borough
The median family income in Pringle borough is $83,125, with families comprising 3+ earners (29) having the highest median family income of $155,156, while families with 1 earner (83) have the lowest median family income of $34,432, accounting for 13.2% and 37.7% of families, respectively.
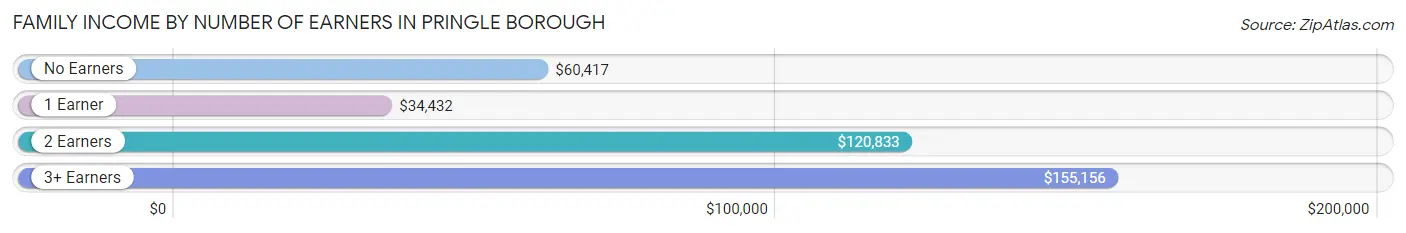
| Number of Earners | # Families | Median Income |
| No Earners | 26 (11.8%) | $60,417 |
| 1 Earner | 83 (37.7%) | $34,432 |
| 2 Earners | 82 (37.3%) | $120,833 |
| 3+ Earners | 29 (13.2%) | $155,156 |
| Total | 220 (100.0%) | $83,125 |
Household Income in Pringle borough
Household Income Brackets in Pringle borough
With 68 households falling in the category, the $75,000 to $99,999 income range is the most frequent in Pringle borough, accounting for 17.1% of all households. In contrast, only 13 households (3.3%) fall into the less than $10,000 income bracket, making it the least populous group.
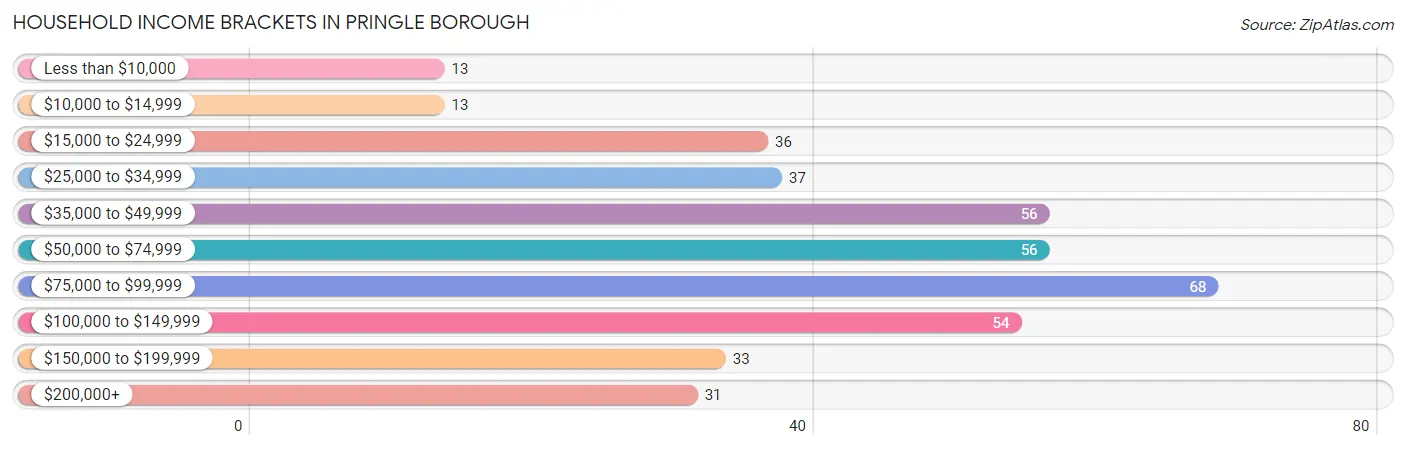
| Income Bracket | # Households | % Households |
| Less than $10,000 | 13 | 3.3% |
| $10,000 to $14,999 | 13 | 3.3% |
| $15,000 to $24,999 | 36 | 9.1% |
| $25,000 to $34,999 | 37 | 9.3% |
| $35,000 to $49,999 | 56 | 14.1% |
| $50,000 to $74,999 | 56 | 14.1% |
| $75,000 to $99,999 | 68 | 17.1% |
| $100,000 to $149,999 | 54 | 13.6% |
| $150,000 to $199,999 | 33 | 8.3% |
| $200,000+ | 31 | 7.8% |
Household Income by Householder Age in Pringle borough
The median household income in Pringle borough is $68,229, with the highest median household income of $85,469 found in the 45 to 64 years age bracket for the primary householder. A total of 125 households (31.5%) fall into this category. Meanwhile, the 15 to 24 years age bracket for the primary householder has the lowest median household income of $0, with 3 households (0.8%) in this group.
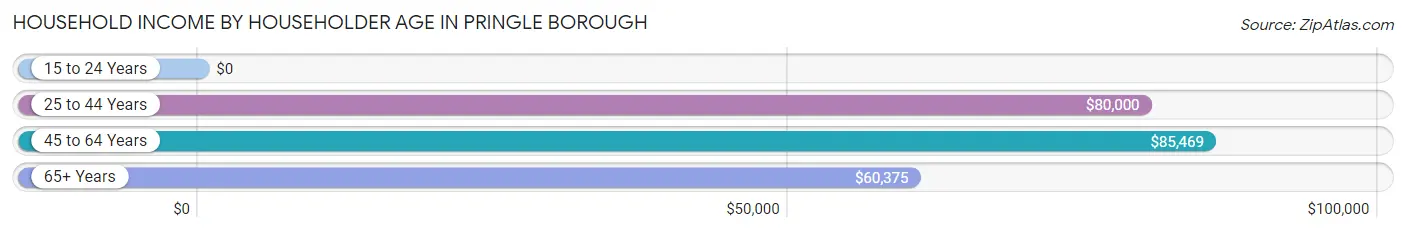
| Income Bracket | # Households | Median Income |
| 15 to 24 Years | 3 (0.8%) | $0 |
| 25 to 44 Years | 144 (36.3%) | $80,000 |
| 45 to 64 Years | 125 (31.5%) | $85,469 |
| 65+ Years | 125 (31.5%) | $60,375 |
| Total | 397 (100.0%) | $68,229 |
Poverty in Pringle borough
Income Below Poverty by Sex and Age in Pringle borough
With 20.2% poverty level for males and 22.8% for females among the residents of Pringle borough, under 5 year old males and under 5 year old females are the most vulnerable to poverty, with 16 males (100.0%) and 16 females (69.6%) in their respective age groups living below the poverty level.
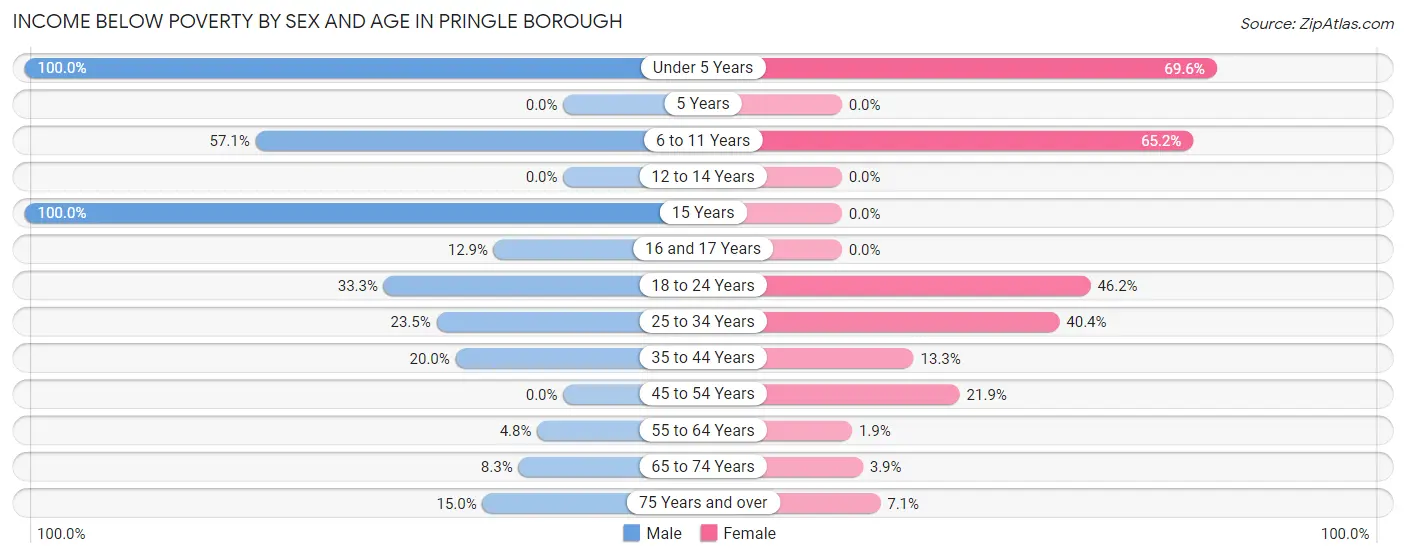
| Age Bracket | Male | Female |
| Under 5 Years | 16 (100.0%) | 16 (69.6%) |
| 5 Years | 0 (0.0%) | 0 (0.0%) |
| 6 to 11 Years | 4 (57.1%) | 30 (65.2%) |
| 12 to 14 Years | 0 (0.0%) | 0 (0.0%) |
| 15 Years | 16 (100.0%) | 0 (0.0%) |
| 16 and 17 Years | 4 (12.9%) | 0 (0.0%) |
| 18 to 24 Years | 13 (33.3%) | 12 (46.2%) |
| 25 to 34 Years | 12 (23.5%) | 21 (40.4%) |
| 35 to 44 Years | 12 (20.0%) | 10 (13.3%) |
| 45 to 54 Years | 0 (0.0%) | 7 (21.9%) |
| 55 to 64 Years | 3 (4.8%) | 1 (1.9%) |
| 65 to 74 Years | 3 (8.3%) | 3 (3.9%) |
| 75 Years and over | 3 (15.0%) | 3 (7.1%) |
| Total | 86 (20.2%) | 103 (22.8%) |
Income Above Poverty by Sex and Age in Pringle borough
According to the poverty statistics in Pringle borough, males aged 12 to 14 years and females aged 12 to 14 years are the age groups that are most secure financially, with 100.0% of males and 100.0% of females in these age groups living above the poverty line.
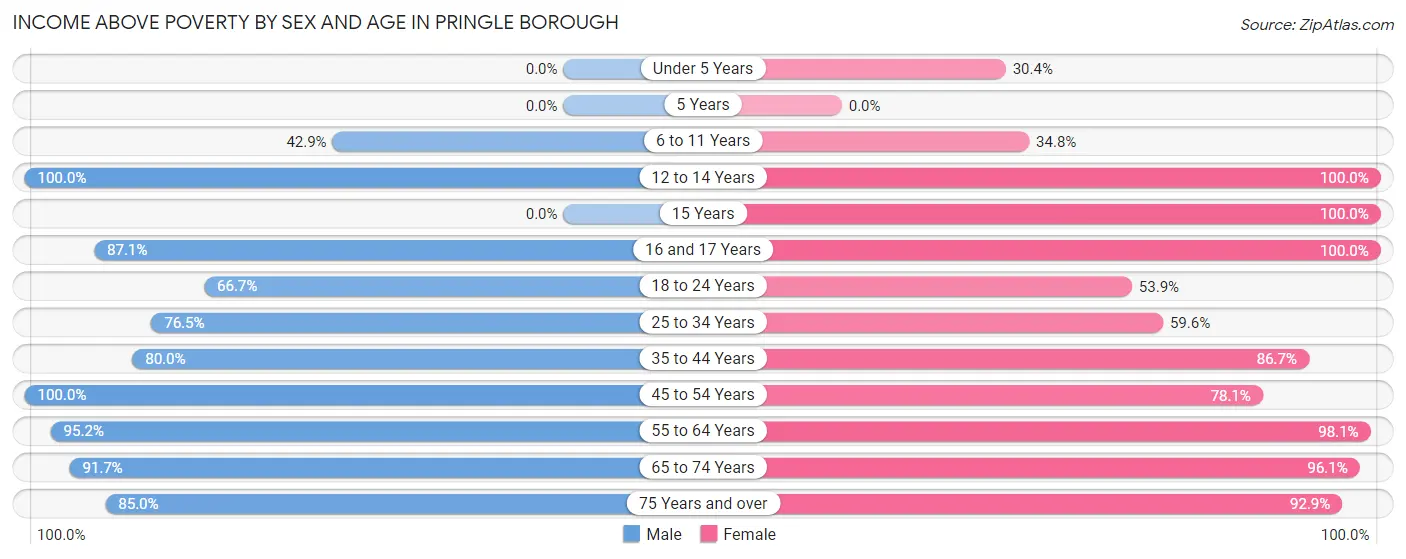
| Age Bracket | Male | Female |
| Under 5 Years | 0 (0.0%) | 7 (30.4%) |
| 5 Years | 0 (0.0%) | 0 (0.0%) |
| 6 to 11 Years | 3 (42.9%) | 16 (34.8%) |
| 12 to 14 Years | 10 (100.0%) | 17 (100.0%) |
| 15 Years | 0 (0.0%) | 8 (100.0%) |
| 16 and 17 Years | 27 (87.1%) | 1 (100.0%) |
| 18 to 24 Years | 26 (66.7%) | 14 (53.8%) |
| 25 to 34 Years | 39 (76.5%) | 31 (59.6%) |
| 35 to 44 Years | 48 (80.0%) | 65 (86.7%) |
| 45 to 54 Years | 77 (100.0%) | 25 (78.1%) |
| 55 to 64 Years | 59 (95.2%) | 52 (98.1%) |
| 65 to 74 Years | 33 (91.7%) | 74 (96.1%) |
| 75 Years and over | 17 (85.0%) | 39 (92.9%) |
| Total | 339 (79.8%) | 349 (77.2%) |
Income Below Poverty Among Married-Couple Families in Pringle borough
The poverty statistics for married-couple families in Pringle borough show that 7.1% or 10 of the total 141 families live below the poverty line. Families with 3 or 4 children have the highest poverty rate of 100.0%, comprising of 10 families. On the other hand, families with no children have the lowest poverty rate of 0.0%, which includes 0 families.
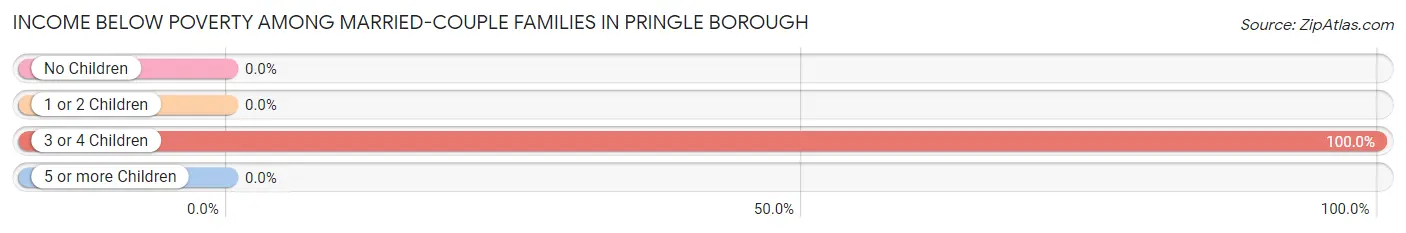
| Children | Above Poverty | Below Poverty |
| No Children | 93 (100.0%) | 0 (0.0%) |
| 1 or 2 Children | 38 (100.0%) | 0 (0.0%) |
| 3 or 4 Children | 0 (0.0%) | 10 (100.0%) |
| 5 or more Children | 0 (0.0%) | 0 (0.0%) |
| Total | 131 (92.9%) | 10 (7.1%) |
Income Below Poverty Among Single-Parent Households in Pringle borough
According to the poverty data in Pringle borough, 26.7% or 4 single-father households and 37.5% or 24 single-mother households are living below the poverty line. Among single-father households, those with 3 or 4 children have the highest poverty rate, with 4 households (100.0%) experiencing poverty. Likewise, among single-mother households, those with 1 or 2 children have the highest poverty rate, with 17 households (54.8%) falling below the poverty line.
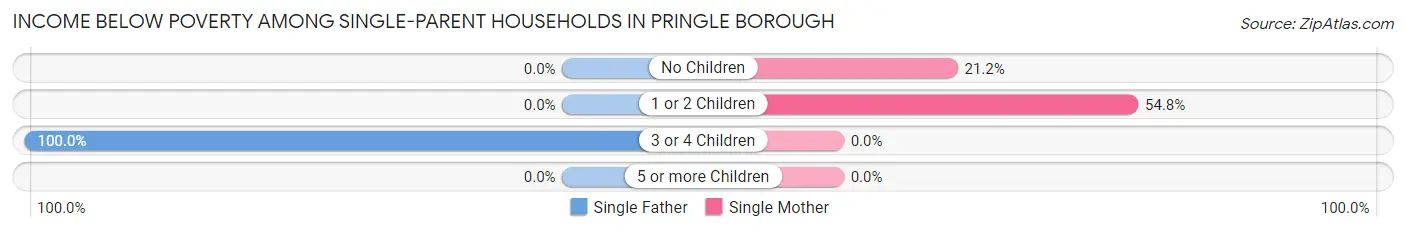
| Children | Single Father | Single Mother |
| No Children | 0 (0.0%) | 7 (21.2%) |
| 1 or 2 Children | 0 (0.0%) | 17 (54.8%) |
| 3 or 4 Children | 4 (100.0%) | 0 (0.0%) |
| 5 or more Children | 0 (0.0%) | 0 (0.0%) |
| Total | 4 (26.7%) | 24 (37.5%) |
Income Below Poverty Among Married-Couple vs Single-Parent Households in Pringle borough
The poverty data for Pringle borough shows that 10 of the married-couple family households (7.1%) and 28 of the single-parent households (35.4%) are living below the poverty level. Within the married-couple family households, those with 3 or 4 children have the highest poverty rate, with 10 households (100.0%) falling below the poverty line. Among the single-parent households, those with 3 or 4 children have the highest poverty rate, with 4 household (100.0%) living below poverty.
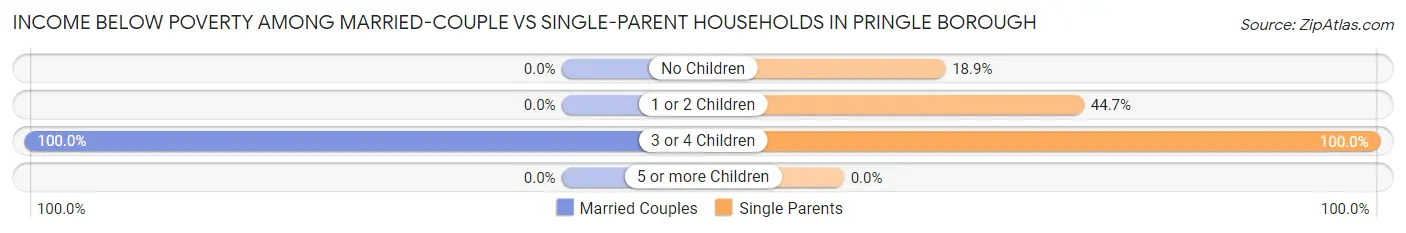
| Children | Married-Couple Families | Single-Parent Households |
| No Children | 0 (0.0%) | 7 (18.9%) |
| 1 or 2 Children | 0 (0.0%) | 17 (44.7%) |
| 3 or 4 Children | 10 (100.0%) | 4 (100.0%) |
| 5 or more Children | 0 (0.0%) | 0 (0.0%) |
| Total | 10 (7.1%) | 28 (35.4%) |
Race in Pringle borough
The most populous races in Pringle borough are White / Caucasian (784 | 89.4%), Black / African American (71 | 8.1%), and Two or more Races (17 | 1.9%).
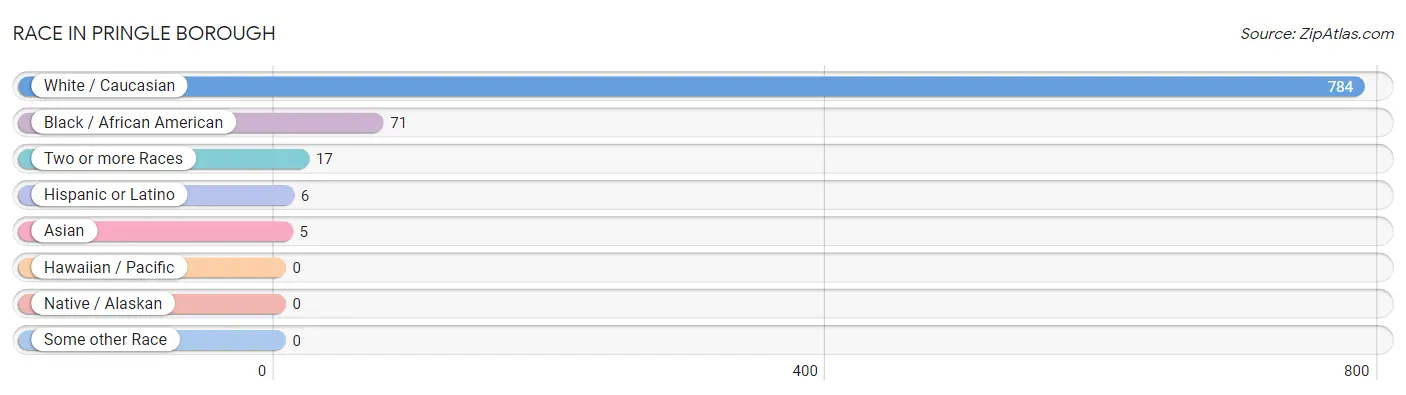
| Race | # Population | % Population |
| Asian | 5 | 0.6% |
| Black / African American | 71 | 8.1% |
| Hawaiian / Pacific | 0 | 0.0% |
| Hispanic or Latino | 6 | 0.7% |
| Native / Alaskan | 0 | 0.0% |
| White / Caucasian | 784 | 89.4% |
| Two or more Races | 17 | 1.9% |
| Some other Race | 0 | 0.0% |
| Total | 877 | 100.0% |
Ancestry in Pringle borough
The most populous ancestries reported in Pringle borough are Irish (214 | 24.4%), Polish (170 | 19.4%), German (162 | 18.5%), Italian (88 | 10.0%), and English (72 | 8.2%), together accounting for 80.5% of all Pringle borough residents.
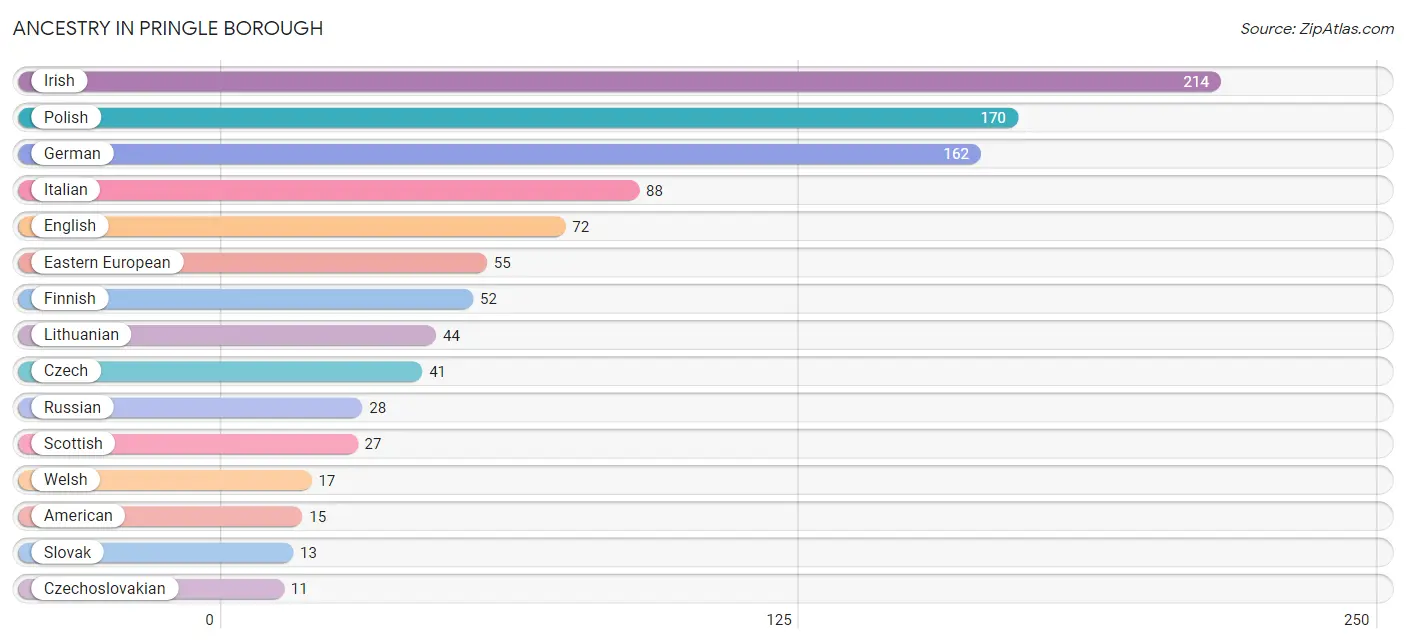
| Ancestry | # Population | % Population |
| American | 15 | 1.7% |
| Austrian | 9 | 1.0% |
| Czech | 41 | 4.7% |
| Czechoslovakian | 11 | 1.3% |
| Eastern European | 55 | 6.3% |
| English | 72 | 8.2% |
| Finnish | 52 | 5.9% |
| French | 10 | 1.1% |
| German | 162 | 18.5% |
| Indian (Asian) | 5 | 0.6% |
| Irish | 214 | 24.4% |
| Italian | 88 | 10.0% |
| Lithuanian | 44 | 5.0% |
| Mexican | 6 | 0.7% |
| Polish | 170 | 19.4% |
| Russian | 28 | 3.2% |
| Scandinavian | 3 | 0.3% |
| Scotch-Irish | 4 | 0.5% |
| Scottish | 27 | 3.1% |
| Slovak | 13 | 1.5% |
| Slovene | 8 | 0.9% |
| Swedish | 3 | 0.3% |
| Ukrainian | 4 | 0.5% |
| Welsh | 17 | 1.9% | View All 24 Rows |
Immigrants in Pringle borough
The most numerous immigrant groups reported in Pringle borough came from Central America (6 | 0.7%), Latin America (6 | 0.7%), Mexico (6 | 0.7%), Asia (5 | 0.6%), and China (5 | 0.6%), together accounting for 3.2% of all Pringle borough residents.
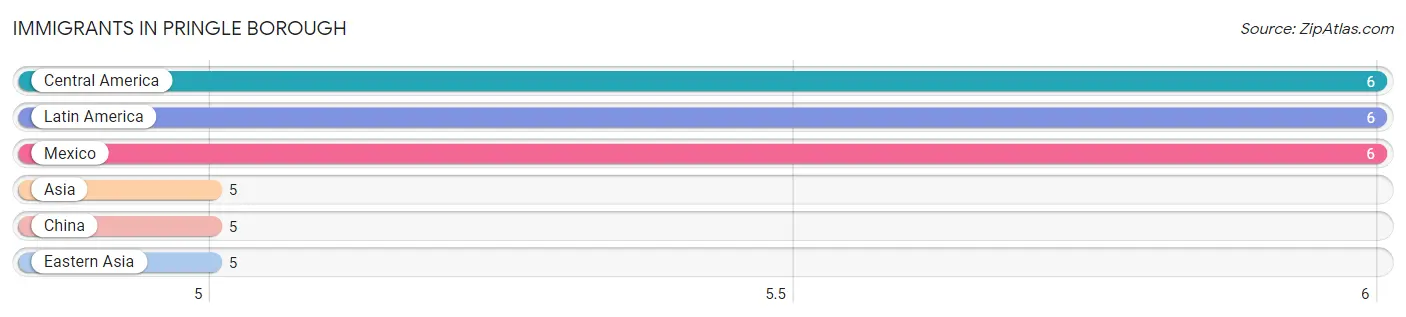
| Immigration Origin | # Population | % Population |
| Asia | 5 | 0.6% |
| Central America | 6 | 0.7% |
| China | 5 | 0.6% |
| Eastern Asia | 5 | 0.6% |
| Latin America | 6 | 0.7% |
| Mexico | 6 | 0.7% | View All 6 Rows |
Sex and Age in Pringle borough
Sex and Age in Pringle borough
The most populous age groups in Pringle borough are 45 to 49 Years (72 | 16.9%) for men and 40 to 44 Years (57 | 12.6%) for women.
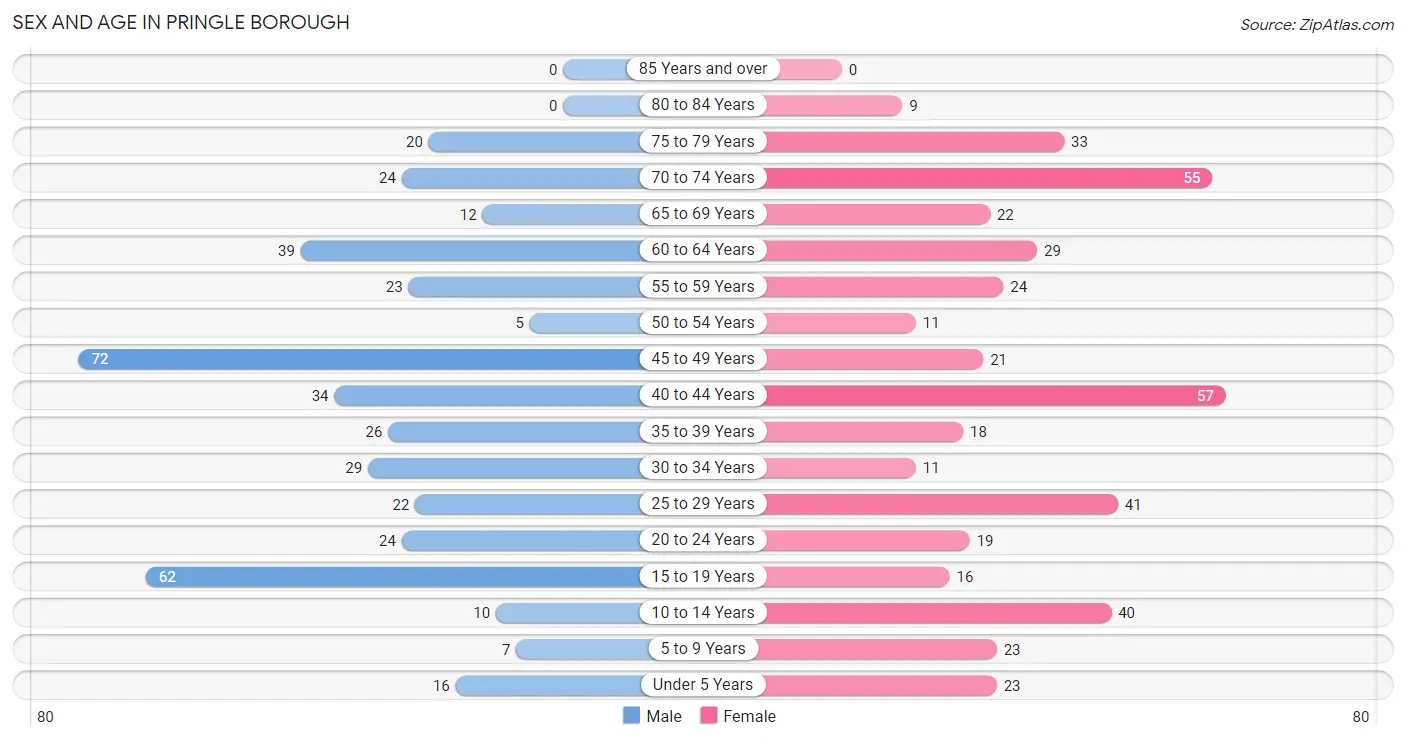
| Age Bracket | Male | Female |
| Under 5 Years | 16 (3.8%) | 23 (5.1%) |
| 5 to 9 Years | 7 (1.7%) | 23 (5.1%) |
| 10 to 14 Years | 10 (2.4%) | 40 (8.8%) |
| 15 to 19 Years | 62 (14.6%) | 16 (3.5%) |
| 20 to 24 Years | 24 (5.7%) | 19 (4.2%) |
| 25 to 29 Years | 22 (5.2%) | 41 (9.1%) |
| 30 to 34 Years | 29 (6.8%) | 11 (2.4%) |
| 35 to 39 Years | 26 (6.1%) | 18 (4.0%) |
| 40 to 44 Years | 34 (8.0%) | 57 (12.6%) |
| 45 to 49 Years | 72 (16.9%) | 21 (4.6%) |
| 50 to 54 Years | 5 (1.2%) | 11 (2.4%) |
| 55 to 59 Years | 23 (5.4%) | 24 (5.3%) |
| 60 to 64 Years | 39 (9.2%) | 29 (6.4%) |
| 65 to 69 Years | 12 (2.8%) | 22 (4.9%) |
| 70 to 74 Years | 24 (5.7%) | 55 (12.2%) |
| 75 to 79 Years | 20 (4.7%) | 33 (7.3%) |
| 80 to 84 Years | 0 (0.0%) | 9 (2.0%) |
| 85 Years and over | 0 (0.0%) | 0 (0.0%) |
| Total | 425 (100.0%) | 452 (100.0%) |
Families and Households in Pringle borough
Median Family Size in Pringle borough
The median family size in Pringle borough is 2.95 persons per family, with married-couple families (141 | 64.1%) accounting for the largest median family size of 3.16 persons per family. On the other hand, single female/mother families (64 | 29.1%) represent the smallest median family size with 2.50 persons per family.
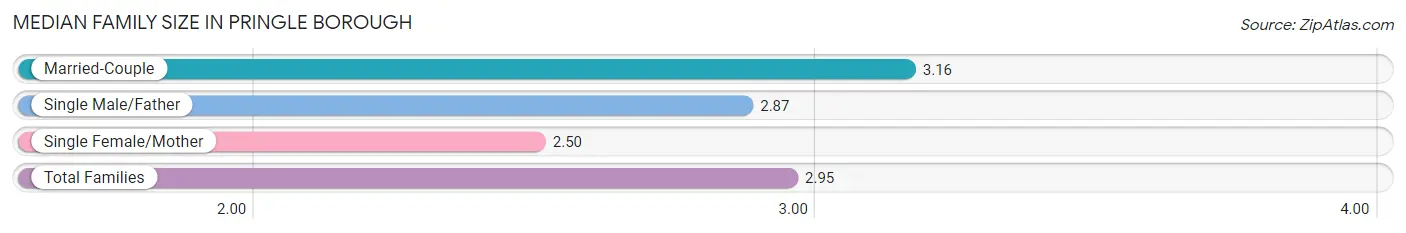
| Family Type | # Families | Family Size |
| Married-Couple | 141 (64.1%) | 3.16 |
| Single Male/Father | 15 (6.8%) | 2.87 |
| Single Female/Mother | 64 (29.1%) | 2.50 |
| Total Families | 220 (100.0%) | 2.95 |
Median Household Size in Pringle borough
The median household size in Pringle borough is 2.21 persons per household, with single male/father households (15 | 3.8%) accounting for the largest median household size of 3.47 persons per household. non-family households (177 | 44.6%) represent the smallest median household size with 1.16 persons per household.
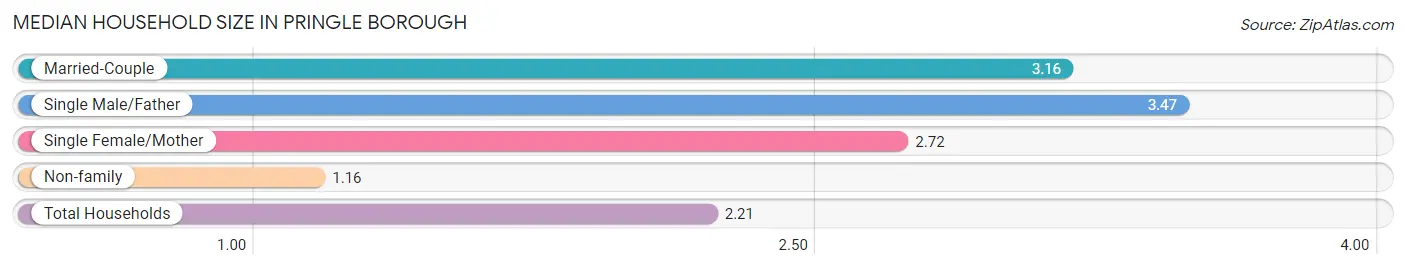
| Household Type | # Households | Household Size |
| Married-Couple | 141 (35.5%) | 3.16 |
| Single Male/Father | 15 (3.8%) | 3.47 |
| Single Female/Mother | 64 (16.1%) | 2.72 |
| Non-family | 177 (44.6%) | 1.16 |
| Total Households | 397 (100.0%) | 2.21 |
Household Size by Marriage Status in Pringle borough
Out of a total of 397 households in Pringle borough, 220 (55.4%) are family households, while 177 (44.6%) are nonfamily households. The most numerous type of family households are 2-person households, comprising 108, and the most common type of nonfamily households are 1-person households, comprising 145.
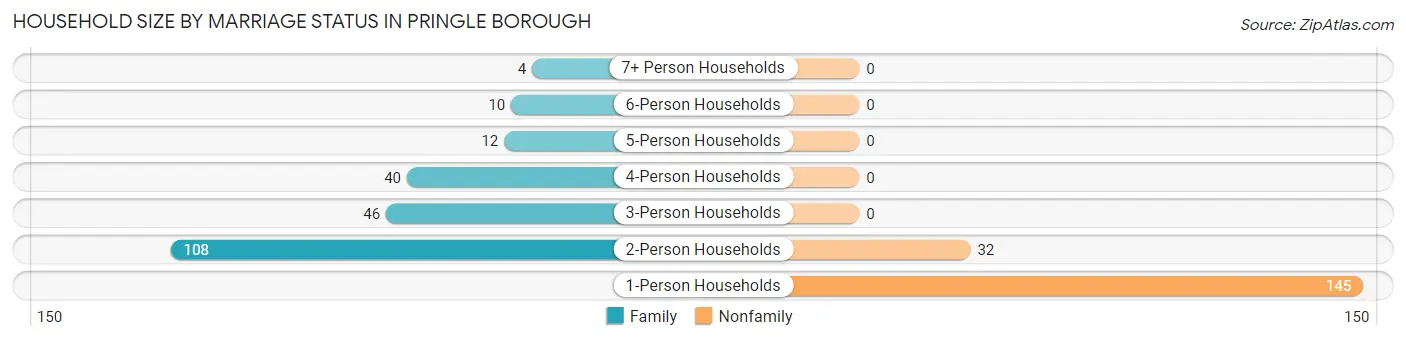
| Household Size | Family Households | Nonfamily Households |
| 1-Person Households | - | 145 (36.5%) |
| 2-Person Households | 108 (27.2%) | 32 (8.1%) |
| 3-Person Households | 46 (11.6%) | 0 (0.0%) |
| 4-Person Households | 40 (10.1%) | 0 (0.0%) |
| 5-Person Households | 12 (3.0%) | 0 (0.0%) |
| 6-Person Households | 10 (2.5%) | 0 (0.0%) |
| 7+ Person Households | 4 (1.0%) | 0 (0.0%) |
| Total | 220 (55.4%) | 177 (44.6%) |
Female Fertility in Pringle borough
Fertility by Age in Pringle borough
| Age Bracket | Women with Births | Births / 1,000 Women |
| 15 to 19 years | 0 (0.0%) | 0.0 |
| 20 to 34 years | 0 (0.0%) | 0.0 |
| 35 to 50 years | 0 (0.0%) | 0.0 |
| Total | 0 (0.0%) | 0.0 |
Fertility by Age by Marriage Status in Pringle borough
| Age Bracket | Married | Unmarried |
| 15 to 19 years | 0 (0.0%) | 0 (0.0%) |
| 20 to 34 years | 0 (0.0%) | 0 (0.0%) |
| 35 to 50 years | 0 (0.0%) | 0 (0.0%) |
| Total | 0 (0.0%) | 0 (0.0%) |
Fertility by Education in Pringle borough
| Educational Attainment | Women with Births | Births / 1,000 Women |
| Less than High School | 0 (0.0%) | 0.0 |
| High School Diploma | 0 (0.0%) | 0.0 |
| College or Associate's Degree | 0 (0.0%) | 0.0 |
| Bachelor's Degree | 0 (0.0%) | 0.0 |
| Graduate Degree | 0 (0.0%) | 0.0 |
| Total | 0 (0.0%) | 0.0 |
Fertility by Education by Marriage Status in Pringle borough
| Educational Attainment | Married | Unmarried |
| Less than High School | 0 (0.0%) | 0 (0.0%) |
| High School Diploma | 0 (0.0%) | 0 (0.0%) |
| College or Associate's Degree | 0 (0.0%) | 0 (0.0%) |
| Bachelor's Degree | 0 (0.0%) | 0 (0.0%) |
| Graduate Degree | 0 (0.0%) | 0 (0.0%) |
| Total | 0 (0.0%) | 0 (0.0%) |
Employment Characteristics in Pringle borough
Employment by Class of Employer in Pringle borough
Among the 480 employed individuals in Pringle borough, private company employees (302 | 62.9%), local government employees (51 | 10.6%), and self-employed (not incorporated) (40 | 8.3%) make up the most common classes of employment.
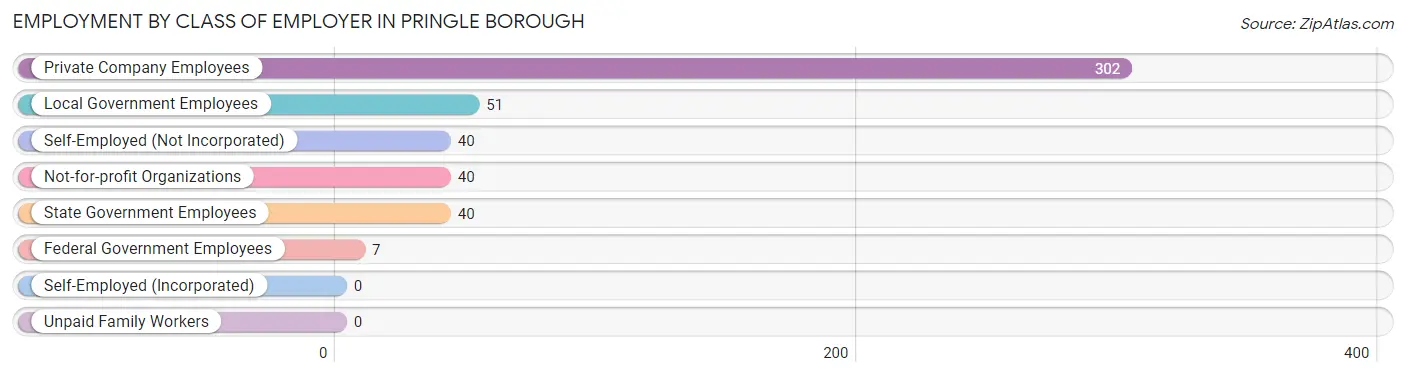
| Employer Class | # Employees | % Employees |
| Private Company Employees | 302 | 62.9% |
| Self-Employed (Incorporated) | 0 | 0.0% |
| Self-Employed (Not Incorporated) | 40 | 8.3% |
| Not-for-profit Organizations | 40 | 8.3% |
| Local Government Employees | 51 | 10.6% |
| State Government Employees | 40 | 8.3% |
| Federal Government Employees | 7 | 1.5% |
| Unpaid Family Workers | 0 | 0.0% |
| Total | 480 | 100.0% |
Employment Status by Age in Pringle borough
According to the labor force statistics for Pringle borough, out of the total population over 16 years of age (734), 68.4% or 502 individuals are in the labor force, with 3.8% or 19 of them unemployed. The age group with the highest labor force participation rate is 20 to 24 years, with 100.0% or 43 individuals in the labor force. Within the labor force, the 45 to 54 years age range has the highest percentage of unemployed individuals, with 10.1% or 10 of them being unemployed.
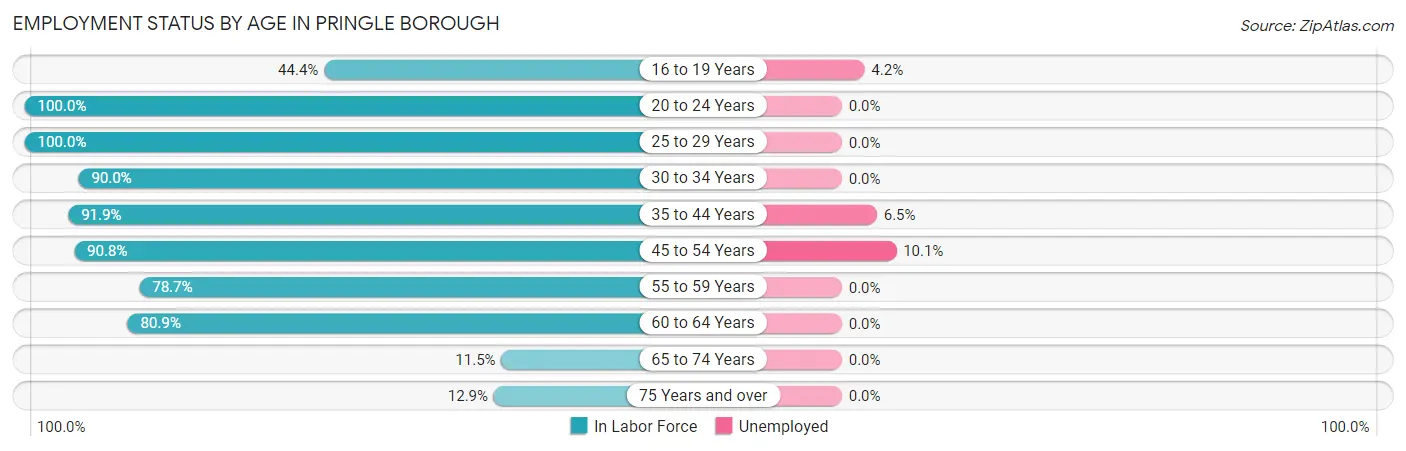
| Age Bracket | In Labor Force | Unemployed |
| 16 to 19 Years | 24 (44.4%) | 1 (4.2%) |
| 20 to 24 Years | 43 (100.0%) | 0 (0.0%) |
| 25 to 29 Years | 63 (100.0%) | 0 (0.0%) |
| 30 to 34 Years | 36 (90.0%) | 0 (0.0%) |
| 35 to 44 Years | 124 (91.9%) | 8 (6.5%) |
| 45 to 54 Years | 99 (90.8%) | 10 (10.1%) |
| 55 to 59 Years | 37 (78.7%) | 0 (0.0%) |
| 60 to 64 Years | 55 (80.9%) | 0 (0.0%) |
| 65 to 74 Years | 13 (11.5%) | 0 (0.0%) |
| 75 Years and over | 8 (12.9%) | 0 (0.0%) |
| Total | 502 (68.4%) | 19 (3.8%) |
Employment Status by Educational Attainment in Pringle borough
According to labor force statistics for Pringle borough, 89.6% of individuals (414) out of the total population between 25 and 64 years of age (462) are in the labor force, with 4.3% or 18 of them being unemployed. The group with the highest labor force participation rate are those with the educational attainment of bachelor's degree or higher, with 96.8% or 120 individuals in the labor force. Within the labor force, individuals with less than high school education have the highest percentage of unemployment, with 25.0% or 2 of them being unemployed.
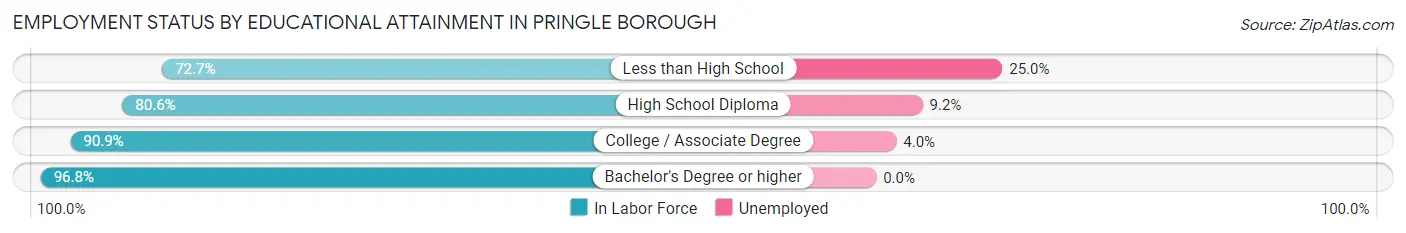
| Educational Attainment | In Labor Force | Unemployed |
| Less than High School | 8 (72.7%) | 3 (25.0%) |
| High School Diploma | 87 (80.6%) | 10 (9.2%) |
| College / Associate Degree | 199 (90.9%) | 9 (4.0%) |
| Bachelor's Degree or higher | 120 (96.8%) | 0 (0.0%) |
| Total | 414 (89.6%) | 20 (4.3%) |
Employment Occupations by Sex in Pringle borough
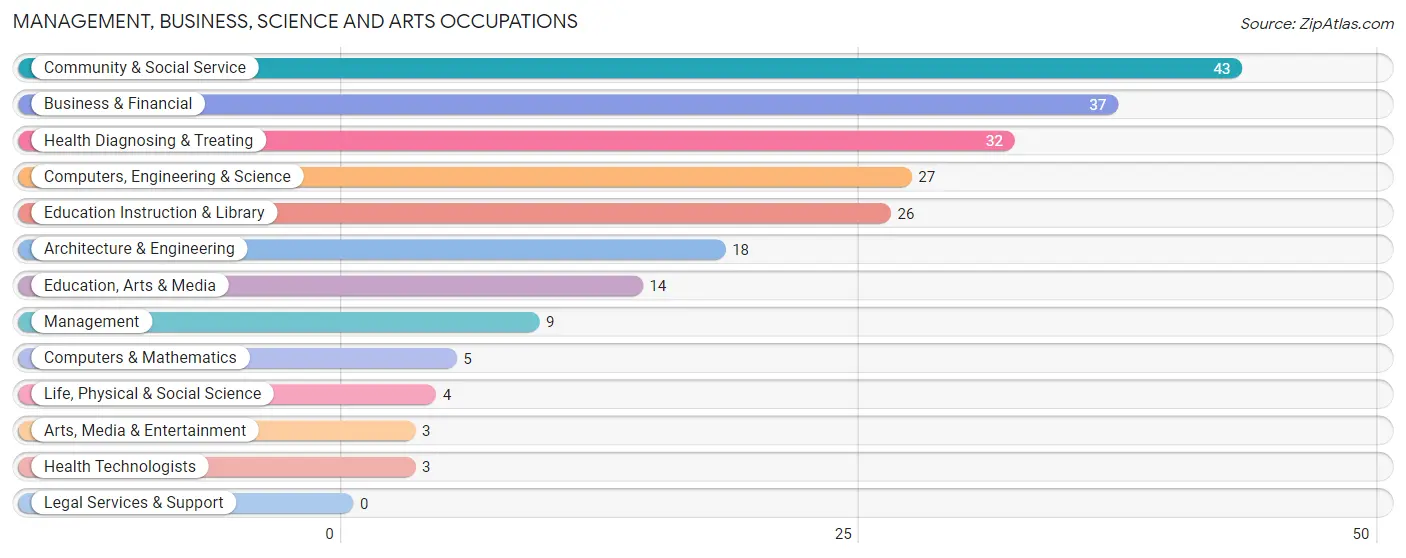
Management, Business, Science and Arts Occupations
The most common Management, Business, Science and Arts occupations in Pringle borough are Community & Social Service (43 | 8.9%), Business & Financial (37 | 7.7%), Health Diagnosing & Treating (32 | 6.6%), Computers, Engineering & Science (27 | 5.6%), and Education Instruction & Library (26 | 5.4%).
Management, Business, Science and Arts Occupations by Sex
Within the Management, Business, Science and Arts occupations in Pringle borough, the most male-oriented occupations are Management (100.0%), Computers & Mathematics (100.0%), and Life, Physical & Social Science (100.0%), while the most female-oriented occupations are Health Technologists (100.0%), Education Instruction & Library (80.8%), and Business & Financial (62.2%).

| Occupation | Male | Female |
| Management | 9 (100.0%) | 0 (0.0%) |
| Business & Financial | 14 (37.8%) | 23 (62.2%) |
| Computers, Engineering & Science | 25 (92.6%) | 2 (7.4%) |
| Computers & Mathematics | 5 (100.0%) | 0 (0.0%) |
| Architecture & Engineering | 16 (88.9%) | 2 (11.1%) |
| Life, Physical & Social Science | 4 (100.0%) | 0 (0.0%) |
| Community & Social Service | 19 (44.2%) | 24 (55.8%) |
| Education, Arts & Media | 11 (78.6%) | 3 (21.4%) |
| Legal Services & Support | 0 (0.0%) | 0 (0.0%) |
| Education Instruction & Library | 5 (19.2%) | 21 (80.8%) |
| Arts, Media & Entertainment | 3 (100.0%) | 0 (0.0%) |
| Health Diagnosing & Treating | 13 (40.6%) | 19 (59.4%) |
| Health Technologists | 0 (0.0%) | 3 (100.0%) |
| Total (Category) | 80 (54.0%) | 68 (46.0%) |
| Total (Overall) | 281 (58.2%) | 202 (41.8%) |
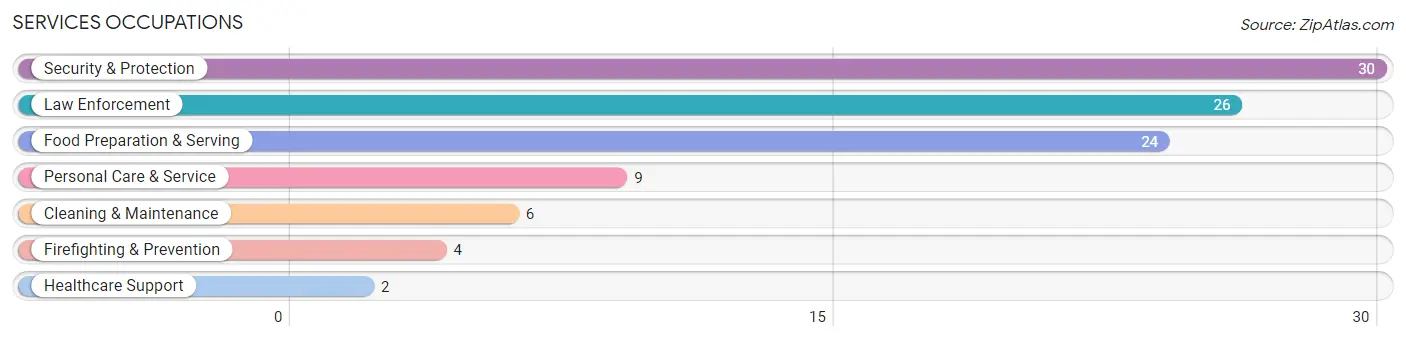
Services Occupations
The most common Services occupations in Pringle borough are Security & Protection (30 | 6.2%), Law Enforcement (26 | 5.4%), Food Preparation & Serving (24 | 5.0%), Personal Care & Service (9 | 1.9%), and Cleaning & Maintenance (6 | 1.2%).
Services Occupations by Sex
Within the Services occupations in Pringle borough, the most male-oriented occupations are Law Enforcement (100.0%), Security & Protection (90.0%), and Cleaning & Maintenance (66.7%), while the most female-oriented occupations are Healthcare Support (100.0%), Personal Care & Service (100.0%), and Firefighting & Prevention (75.0%).
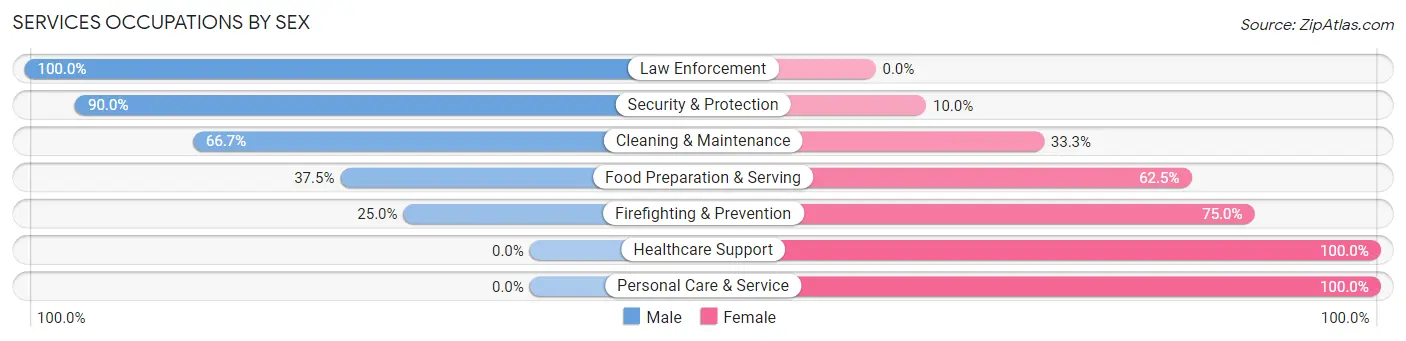
| Occupation | Male | Female |
| Healthcare Support | 0 (0.0%) | 2 (100.0%) |
| Security & Protection | 27 (90.0%) | 3 (10.0%) |
| Firefighting & Prevention | 1 (25.0%) | 3 (75.0%) |
| Law Enforcement | 26 (100.0%) | 0 (0.0%) |
| Food Preparation & Serving | 9 (37.5%) | 15 (62.5%) |
| Cleaning & Maintenance | 4 (66.7%) | 2 (33.3%) |
| Personal Care & Service | 0 (0.0%) | 9 (100.0%) |
| Total (Category) | 40 (56.3%) | 31 (43.7%) |
| Total (Overall) | 281 (58.2%) | 202 (41.8%) |
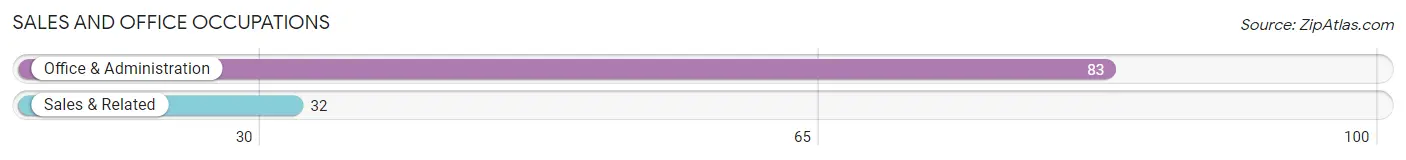
Sales and Office Occupations
The most common Sales and Office occupations in Pringle borough are Office & Administration (83 | 17.2%), and Sales & Related (32 | 6.6%).
Sales and Office Occupations by Sex
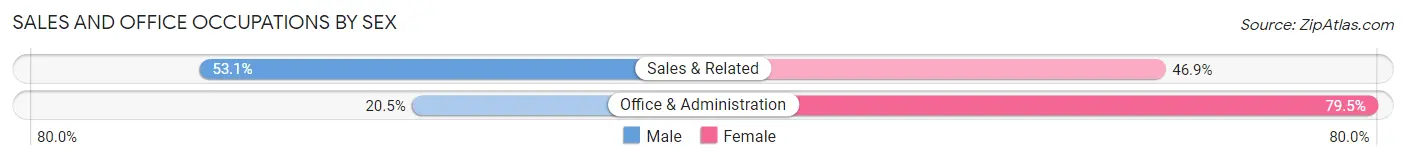
| Occupation | Male | Female |
| Sales & Related | 17 (53.1%) | 15 (46.9%) |
| Office & Administration | 17 (20.5%) | 66 (79.5%) |
| Total (Category) | 34 (29.6%) | 81 (70.4%) |
| Total (Overall) | 281 (58.2%) | 202 (41.8%) |
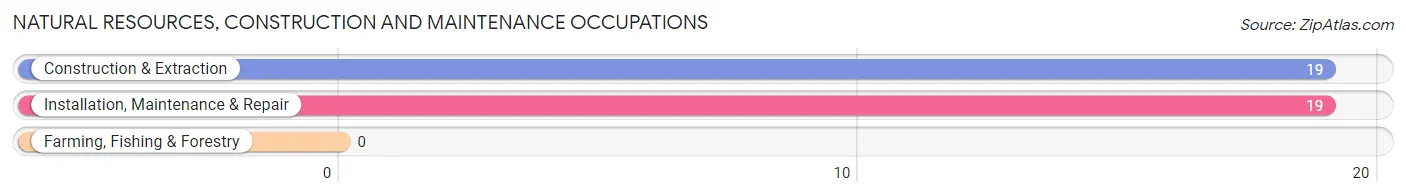
Natural Resources, Construction and Maintenance Occupations
The most common Natural Resources, Construction and Maintenance occupations in Pringle borough are Construction & Extraction (19 | 3.9%), and Installation, Maintenance & Repair (19 | 3.9%).
Natural Resources, Construction and Maintenance Occupations by Sex
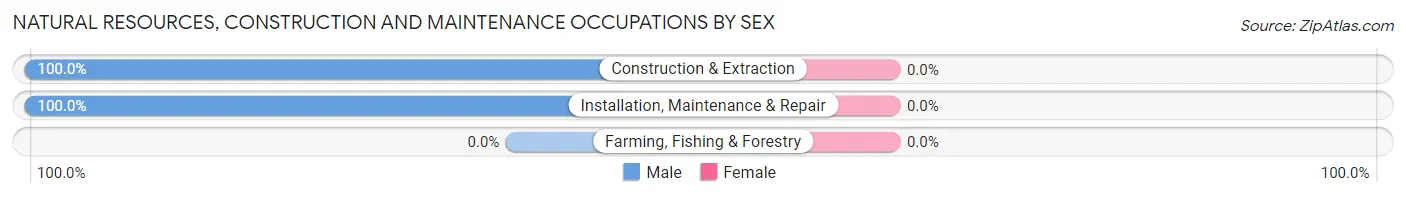
| Occupation | Male | Female |
| Farming, Fishing & Forestry | 0 (0.0%) | 0 (0.0%) |
| Construction & Extraction | 19 (100.0%) | 0 (0.0%) |
| Installation, Maintenance & Repair | 19 (100.0%) | 0 (0.0%) |
| Total (Category) | 38 (100.0%) | 0 (0.0%) |
| Total (Overall) | 281 (58.2%) | 202 (41.8%) |
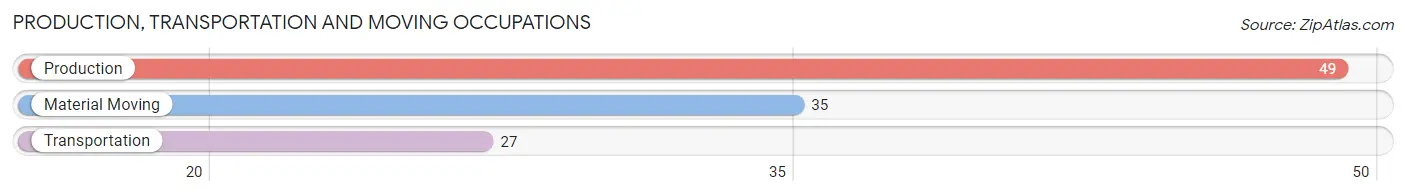
Production, Transportation and Moving Occupations
The most common Production, Transportation and Moving occupations in Pringle borough are Production (49 | 10.1%), Material Moving (35 | 7.2%), and Transportation (27 | 5.6%).
Production, Transportation and Moving Occupations by Sex
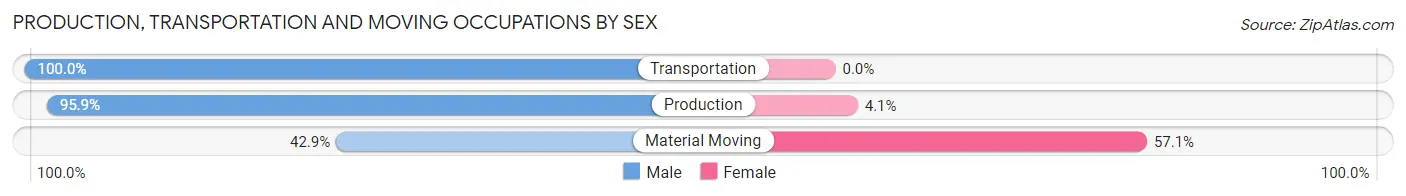
| Occupation | Male | Female |
| Production | 47 (95.9%) | 2 (4.1%) |
| Transportation | 27 (100.0%) | 0 (0.0%) |
| Material Moving | 15 (42.9%) | 20 (57.1%) |
| Total (Category) | 89 (80.2%) | 22 (19.8%) |
| Total (Overall) | 281 (58.2%) | 202 (41.8%) |
Employment Industries by Sex in Pringle borough
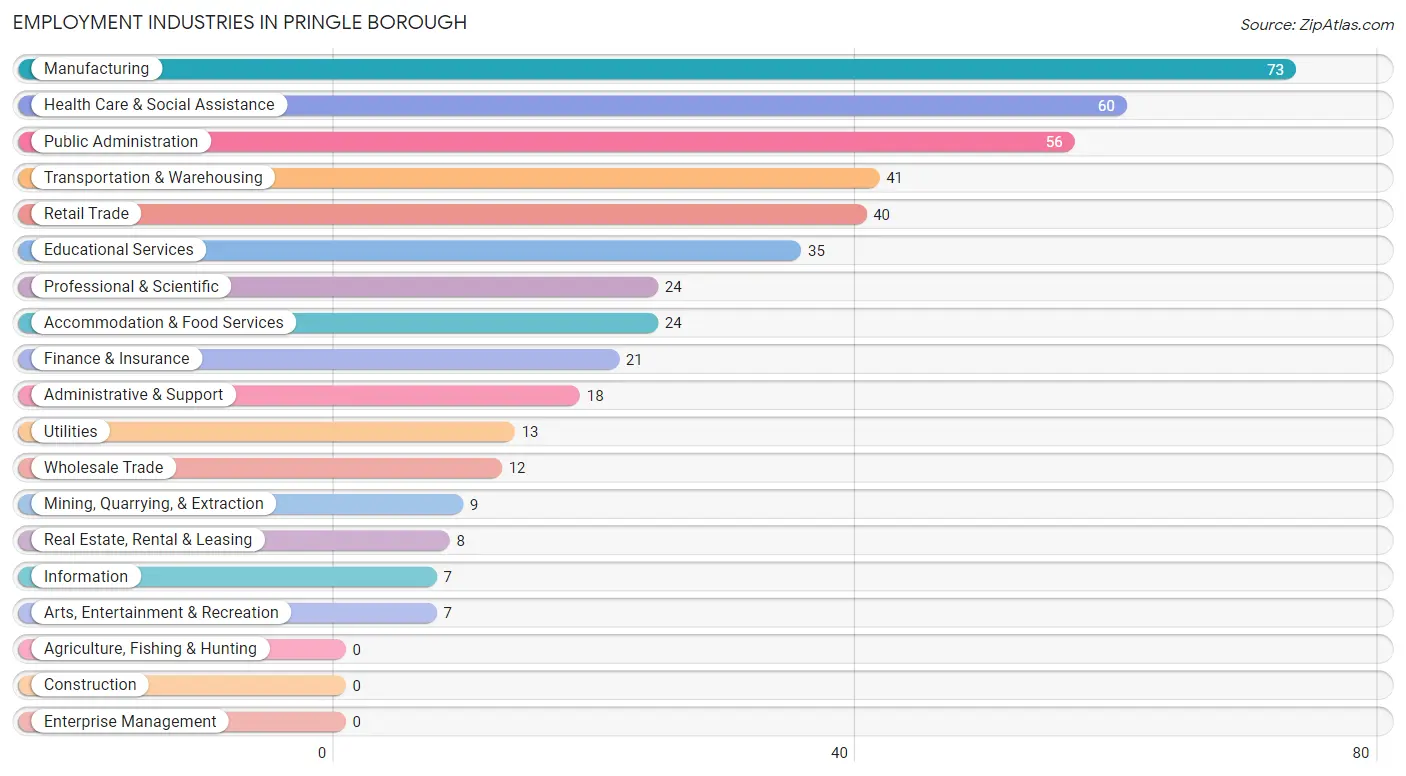
Employment Industries in Pringle borough
The major employment industries in Pringle borough include Manufacturing (73 | 15.1%), Health Care & Social Assistance (60 | 12.4%), Public Administration (56 | 11.6%), Transportation & Warehousing (41 | 8.5%), and Retail Trade (40 | 8.3%).
Employment Industries by Sex in Pringle borough
The Pringle borough industries that see more men than women are Mining, Quarrying, & Extraction (100.0%), Information (100.0%), and Arts, Entertainment & Recreation (100.0%), whereas the industries that tend to have a higher number of women are Administrative & Support (100.0%), Educational Services (85.7%), and Finance & Insurance (71.4%).
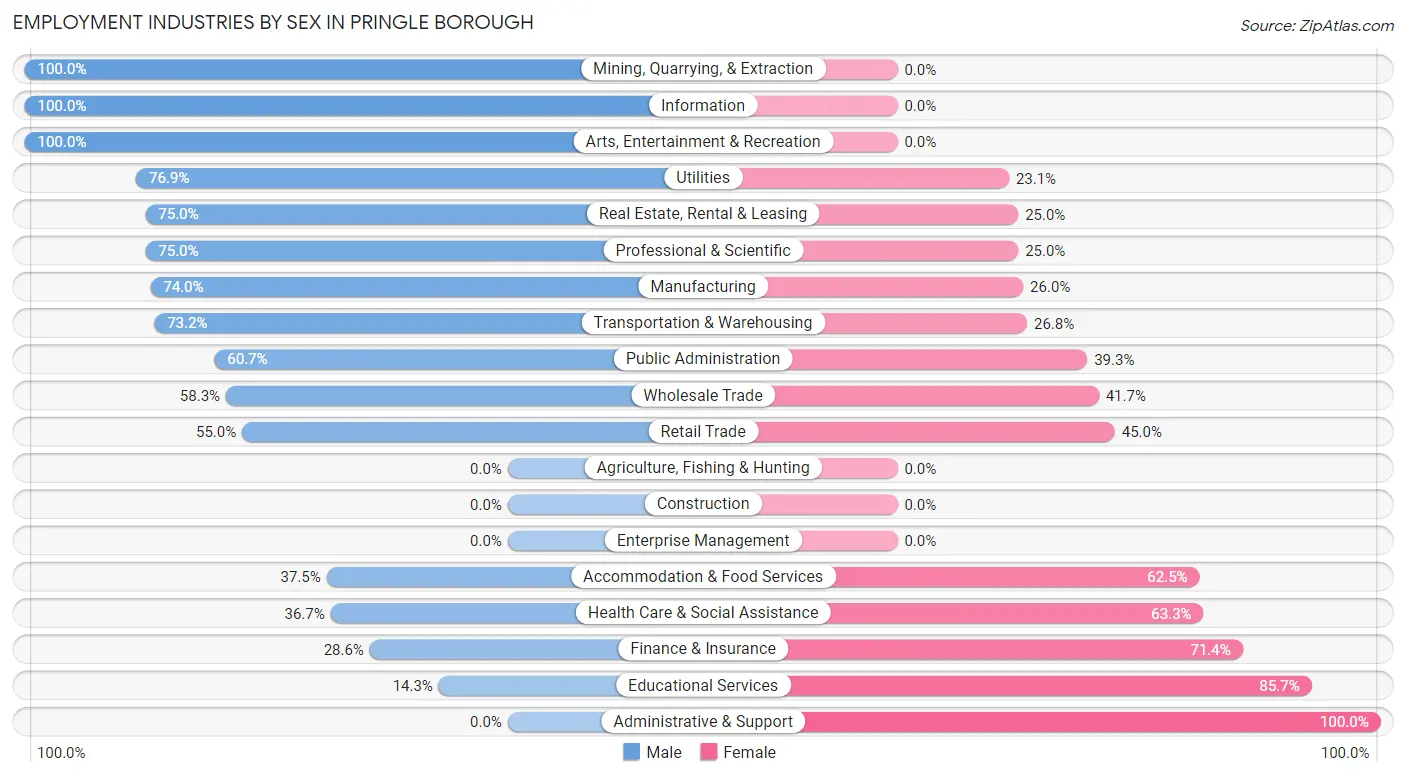
| Industry | Male | Female |
| Agriculture, Fishing & Hunting | 0 (0.0%) | 0 (0.0%) |
| Mining, Quarrying, & Extraction | 9 (100.0%) | 0 (0.0%) |
| Construction | 0 (0.0%) | 0 (0.0%) |
| Manufacturing | 54 (74.0%) | 19 (26.0%) |
| Wholesale Trade | 7 (58.3%) | 5 (41.7%) |
| Retail Trade | 22 (55.0%) | 18 (45.0%) |
| Transportation & Warehousing | 30 (73.2%) | 11 (26.8%) |
| Utilities | 10 (76.9%) | 3 (23.1%) |
| Information | 7 (100.0%) | 0 (0.0%) |
| Finance & Insurance | 6 (28.6%) | 15 (71.4%) |
| Real Estate, Rental & Leasing | 6 (75.0%) | 2 (25.0%) |
| Professional & Scientific | 18 (75.0%) | 6 (25.0%) |
| Enterprise Management | 0 (0.0%) | 0 (0.0%) |
| Administrative & Support | 0 (0.0%) | 18 (100.0%) |
| Educational Services | 5 (14.3%) | 30 (85.7%) |
| Health Care & Social Assistance | 22 (36.7%) | 38 (63.3%) |
| Arts, Entertainment & Recreation | 7 (100.0%) | 0 (0.0%) |
| Accommodation & Food Services | 9 (37.5%) | 15 (62.5%) |
| Public Administration | 34 (60.7%) | 22 (39.3%) |
| Total | 281 (58.2%) | 202 (41.8%) |
Education in Pringle borough
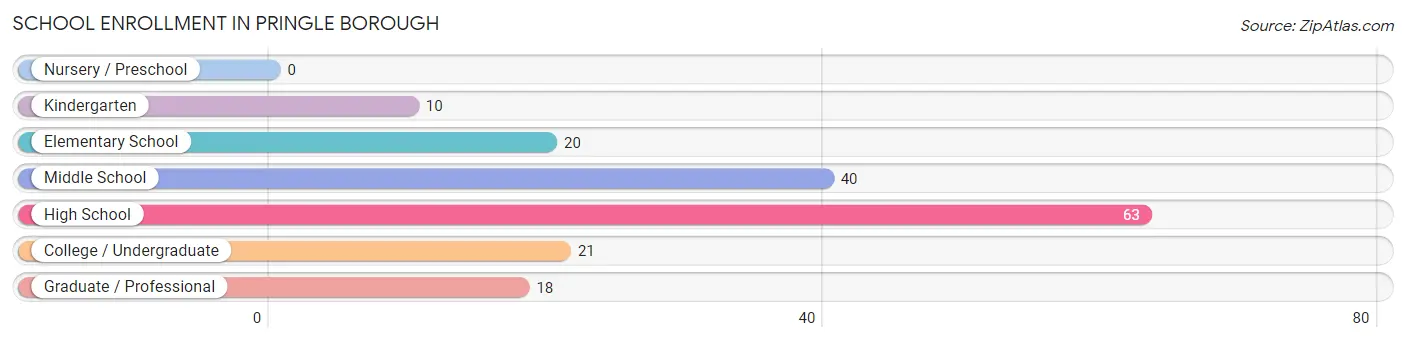
School Enrollment in Pringle borough
The most common levels of schooling among the 172 students in Pringle borough are high school (63 | 36.6%), middle school (40 | 23.3%), and college / undergraduate (21 | 12.2%).
| School Level | # Students | % Students |
| Nursery / Preschool | 0 | 0.0% |
| Kindergarten | 10 | 5.8% |
| Elementary School | 20 | 11.6% |
| Middle School | 40 | 23.3% |
| High School | 63 | 36.6% |
| College / Undergraduate | 21 | 12.2% |
| Graduate / Professional | 18 | 10.5% |
| Total | 172 | 100.0% |
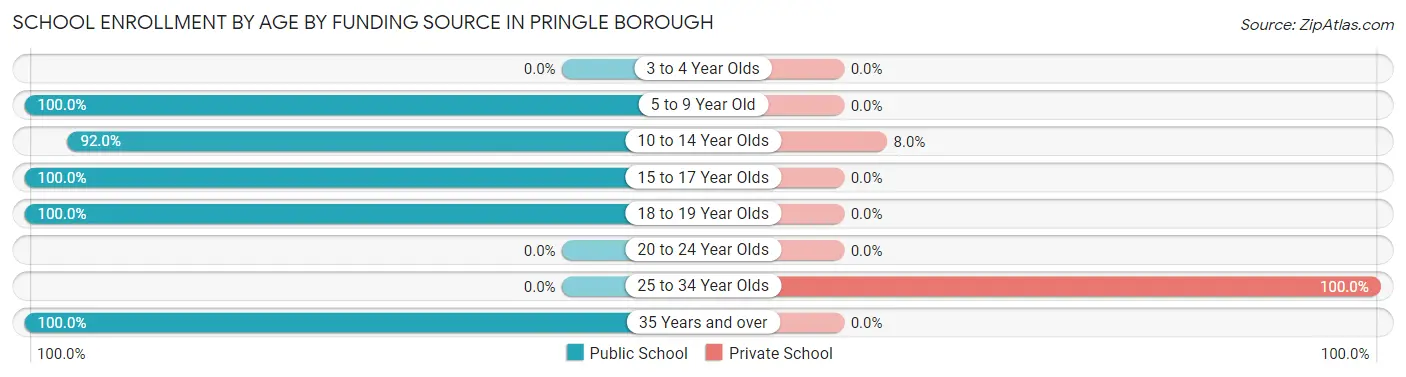
School Enrollment by Age by Funding Source in Pringle borough
Out of a total of 172 students who are enrolled in schools in Pringle borough, 19 (11.0%) attend a private institution, while the remaining 153 (89.0%) are enrolled in public schools. The age group of 25 to 34 year olds has the highest likelihood of being enrolled in private schools, with 15 (100.0% in the age bracket) enrolled. Conversely, the age group of 5 to 9 year old has the lowest likelihood of being enrolled in a private school, with 20 (100.0% in the age bracket) attending a public institution.
| Age Bracket | Public School | Private School |
| 3 to 4 Year Olds | 0 (0.0%) | 0 (0.0%) |
| 5 to 9 Year Old | 20 (100.0%) | 0 (0.0%) |
| 10 to 14 Year Olds | 46 (92.0%) | 4 (8.0%) |
| 15 to 17 Year Olds | 56 (100.0%) | 0 (0.0%) |
| 18 to 19 Year Olds | 16 (100.0%) | 0 (0.0%) |
| 20 to 24 Year Olds | 0 (0.0%) | 0 (0.0%) |
| 25 to 34 Year Olds | 0 (0.0%) | 15 (100.0%) |
| 35 Years and over | 15 (100.0%) | 0 (0.0%) |
| Total | 153 (89.0%) | 19 (11.0%) |
Educational Attainment by Field of Study in Pringle borough
Business (52 | 31.1%), arts & humanities (26 | 15.6%), science & technology (23 | 13.8%), social sciences (14 | 8.4%), and engineering (13 | 7.8%) are the most common fields of study among 167 individuals in Pringle borough who have obtained a bachelor's degree or higher.
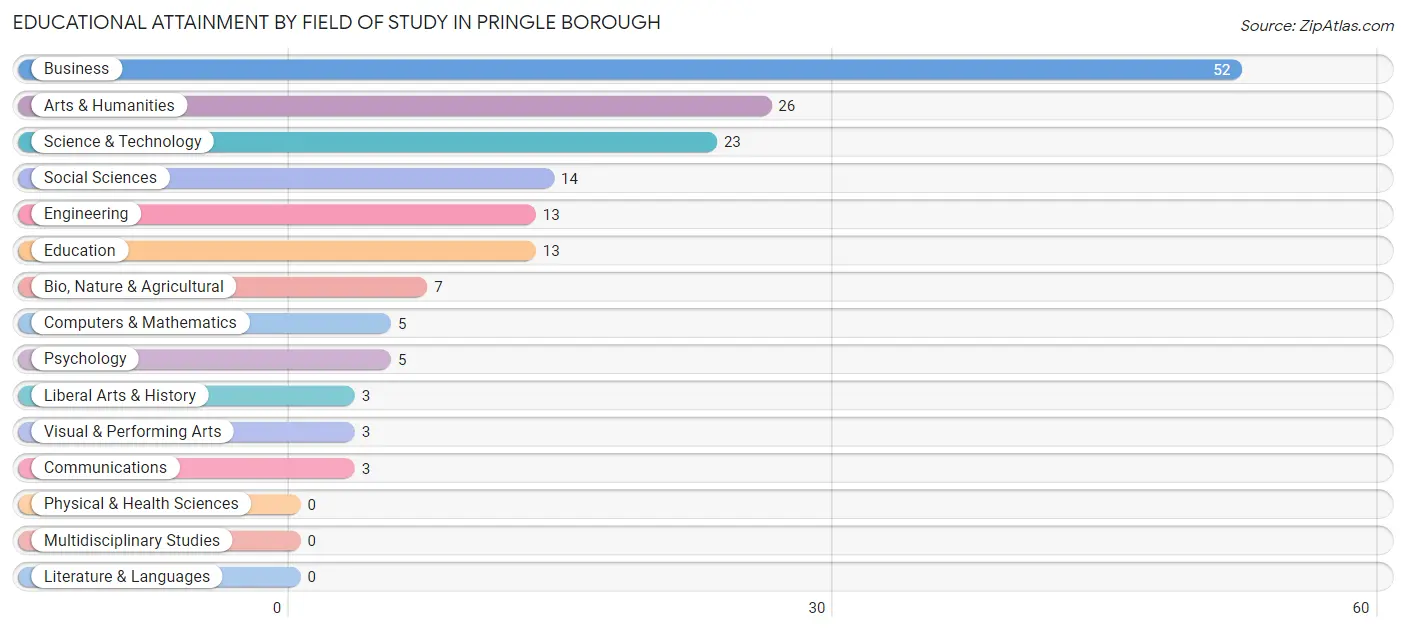
| Field of Study | # Graduates | % Graduates |
| Computers & Mathematics | 5 | 3.0% |
| Bio, Nature & Agricultural | 7 | 4.2% |
| Physical & Health Sciences | 0 | 0.0% |
| Psychology | 5 | 3.0% |
| Social Sciences | 14 | 8.4% |
| Engineering | 13 | 7.8% |
| Multidisciplinary Studies | 0 | 0.0% |
| Science & Technology | 23 | 13.8% |
| Business | 52 | 31.1% |
| Education | 13 | 7.8% |
| Literature & Languages | 0 | 0.0% |
| Liberal Arts & History | 3 | 1.8% |
| Visual & Performing Arts | 3 | 1.8% |
| Communications | 3 | 1.8% |
| Arts & Humanities | 26 | 15.6% |
| Total | 167 | 100.0% |
Transportation & Commute in Pringle borough
Vehicle Availability by Sex in Pringle borough
The most prevalent vehicle ownership categories in Pringle borough are males with 2 vehicles (95, accounting for 34.2%) and females with 2 vehicles (94, making up 47.0%).
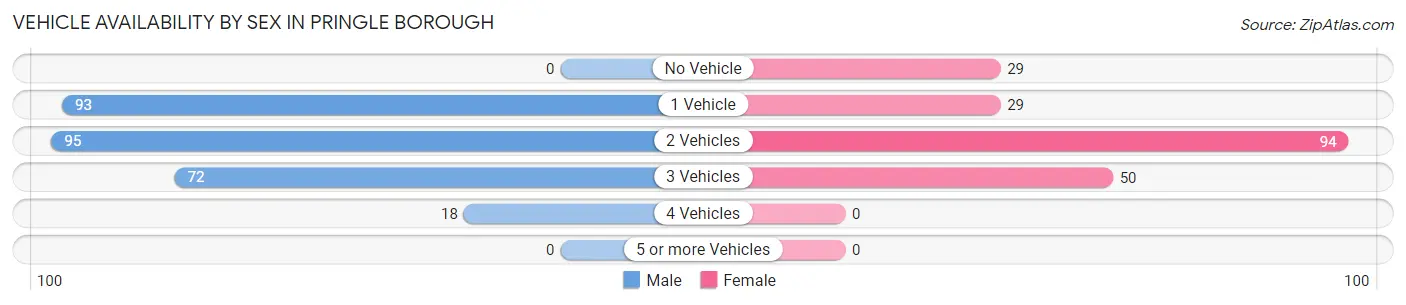
| Vehicles Available | Male | Female |
| No Vehicle | 0 (0.0%) | 29 (14.4%) |
| 1 Vehicle | 93 (33.5%) | 29 (14.4%) |
| 2 Vehicles | 95 (34.2%) | 94 (46.5%) |
| 3 Vehicles | 72 (25.9%) | 50 (24.7%) |
| 4 Vehicles | 18 (6.5%) | 0 (0.0%) |
| 5 or more Vehicles | 0 (0.0%) | 0 (0.0%) |
| Total | 278 (100.0%) | 202 (100.0%) |
Commute Time in Pringle borough
The most frequently occuring commute durations in Pringle borough are 10 to 14 minutes (112 commuters, 24.8%), 15 to 19 minutes (73 commuters, 16.2%), and 20 to 24 minutes (71 commuters, 15.7%).
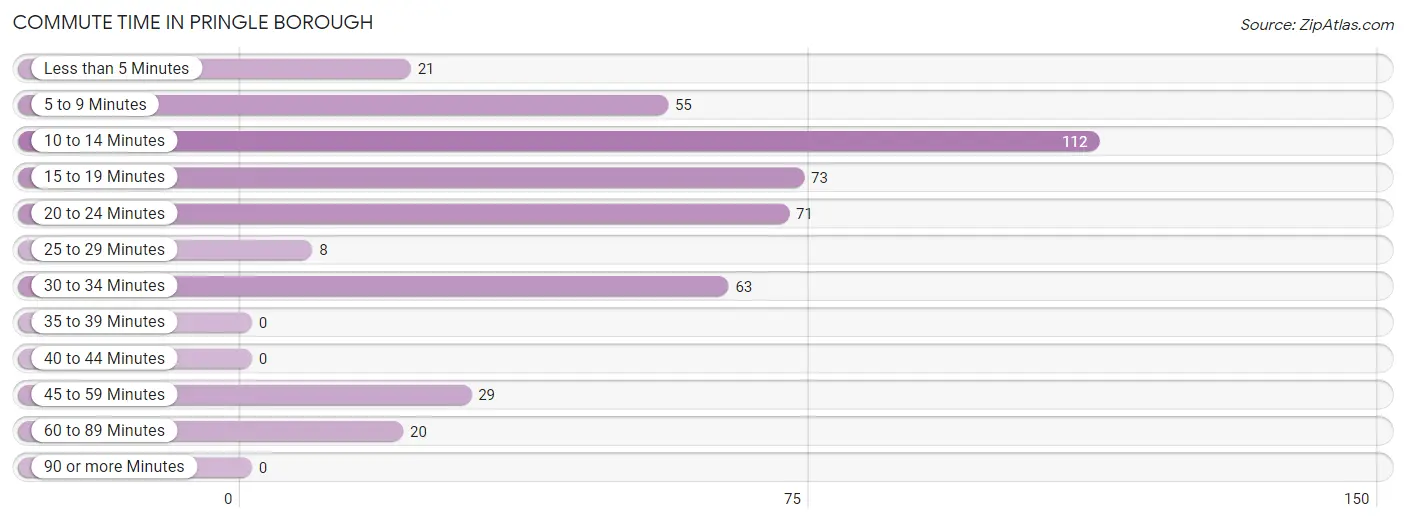
| Commute Time | # Commuters | % Commuters |
| Less than 5 Minutes | 21 | 4.6% |
| 5 to 9 Minutes | 55 | 12.2% |
| 10 to 14 Minutes | 112 | 24.8% |
| 15 to 19 Minutes | 73 | 16.2% |
| 20 to 24 Minutes | 71 | 15.7% |
| 25 to 29 Minutes | 8 | 1.8% |
| 30 to 34 Minutes | 63 | 13.9% |
| 35 to 39 Minutes | 0 | 0.0% |
| 40 to 44 Minutes | 0 | 0.0% |
| 45 to 59 Minutes | 29 | 6.4% |
| 60 to 89 Minutes | 20 | 4.4% |
| 90 or more Minutes | 0 | 0.0% |
Commute Time by Sex in Pringle borough
The most common commute times in Pringle borough are 10 to 14 minutes (66 commuters, 24.5%) for males and 10 to 14 minutes (46 commuters, 25.1%) for females.
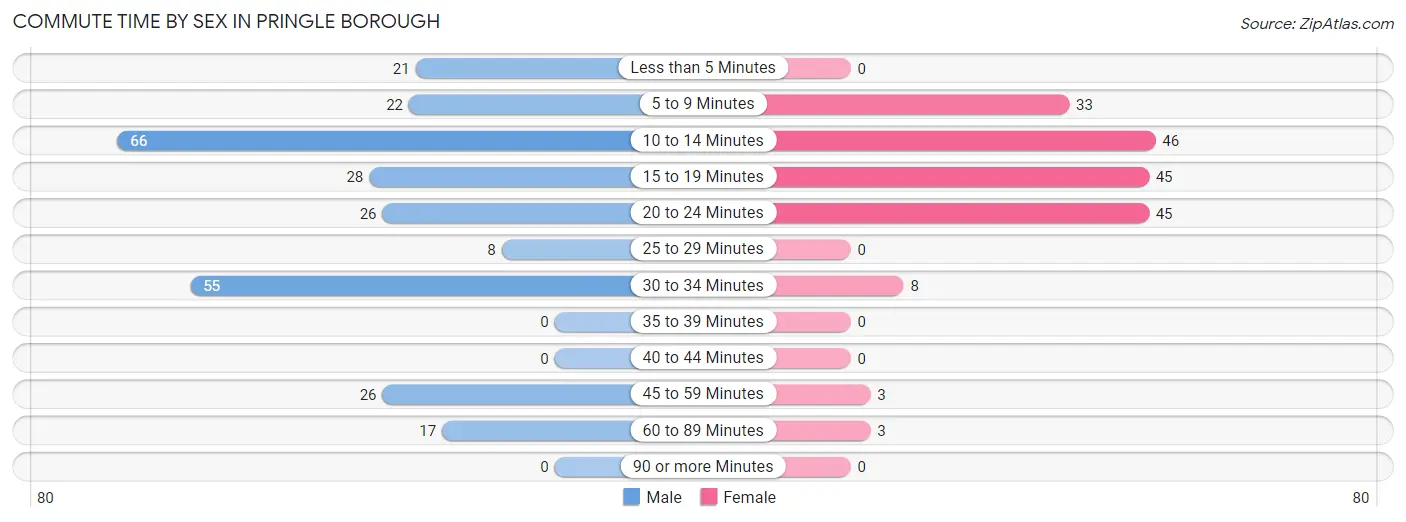
| Commute Time | Male | Female |
| Less than 5 Minutes | 21 (7.8%) | 0 (0.0%) |
| 5 to 9 Minutes | 22 (8.2%) | 33 (18.0%) |
| 10 to 14 Minutes | 66 (24.5%) | 46 (25.1%) |
| 15 to 19 Minutes | 28 (10.4%) | 45 (24.6%) |
| 20 to 24 Minutes | 26 (9.7%) | 45 (24.6%) |
| 25 to 29 Minutes | 8 (3.0%) | 0 (0.0%) |
| 30 to 34 Minutes | 55 (20.4%) | 8 (4.4%) |
| 35 to 39 Minutes | 0 (0.0%) | 0 (0.0%) |
| 40 to 44 Minutes | 0 (0.0%) | 0 (0.0%) |
| 45 to 59 Minutes | 26 (9.7%) | 3 (1.6%) |
| 60 to 89 Minutes | 17 (6.3%) | 3 (1.6%) |
| 90 or more Minutes | 0 (0.0%) | 0 (0.0%) |
Time of Departure to Work by Sex in Pringle borough
The most frequent times of departure to work in Pringle borough are 5:00 AM to 5:29 AM (41, 15.2%) for males and 12:00 PM to 3:59 PM (54, 29.5%) for females.
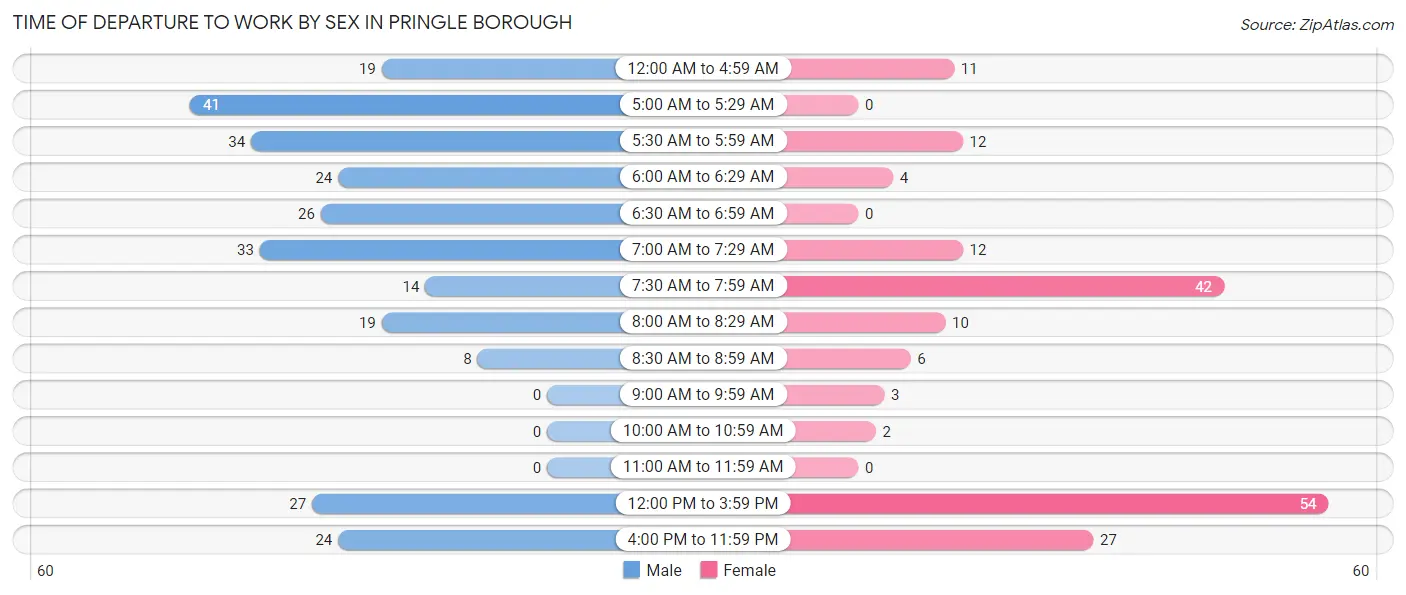
| Time of Departure | Male | Female |
| 12:00 AM to 4:59 AM | 19 (7.1%) | 11 (6.0%) |
| 5:00 AM to 5:29 AM | 41 (15.2%) | 0 (0.0%) |
| 5:30 AM to 5:59 AM | 34 (12.6%) | 12 (6.6%) |
| 6:00 AM to 6:29 AM | 24 (8.9%) | 4 (2.2%) |
| 6:30 AM to 6:59 AM | 26 (9.7%) | 0 (0.0%) |
| 7:00 AM to 7:29 AM | 33 (12.3%) | 12 (6.6%) |
| 7:30 AM to 7:59 AM | 14 (5.2%) | 42 (23.0%) |
| 8:00 AM to 8:29 AM | 19 (7.1%) | 10 (5.5%) |
| 8:30 AM to 8:59 AM | 8 (3.0%) | 6 (3.3%) |
| 9:00 AM to 9:59 AM | 0 (0.0%) | 3 (1.6%) |
| 10:00 AM to 10:59 AM | 0 (0.0%) | 2 (1.1%) |
| 11:00 AM to 11:59 AM | 0 (0.0%) | 0 (0.0%) |
| 12:00 PM to 3:59 PM | 27 (10.0%) | 54 (29.5%) |
| 4:00 PM to 11:59 PM | 24 (8.9%) | 27 (14.7%) |
| Total | 269 (100.0%) | 183 (100.0%) |
Housing Occupancy in Pringle borough
Occupancy by Ownership in Pringle borough
Of the total 397 dwellings in Pringle borough, owner-occupied units account for 301 (75.8%), while renter-occupied units make up 96 (24.2%).
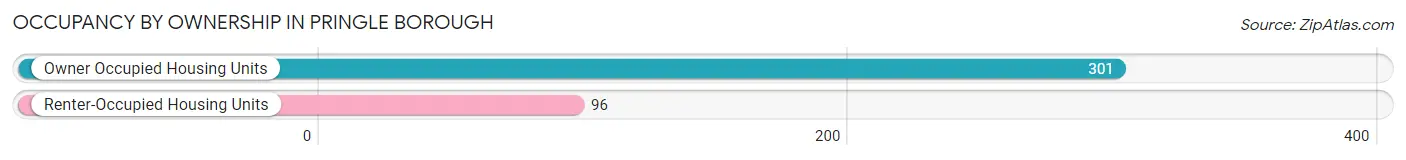
| Occupancy | # Housing Units | % Housing Units |
| Owner Occupied Housing Units | 301 | 75.8% |
| Renter-Occupied Housing Units | 96 | 24.2% |
| Total Occupied Housing Units | 397 | 100.0% |
Occupancy by Household Size in Pringle borough
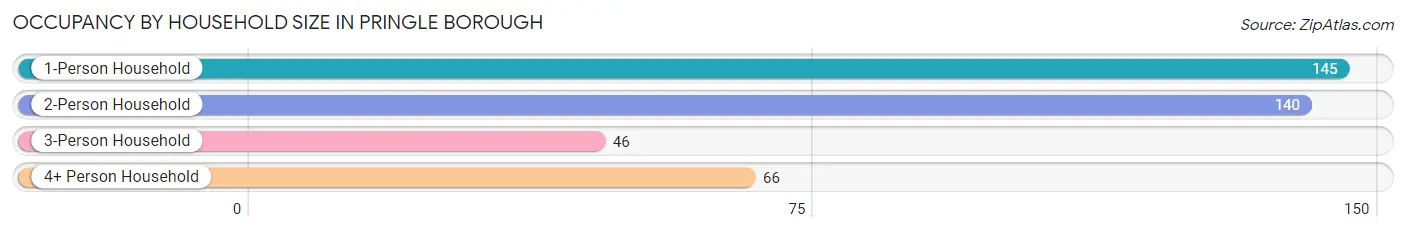
| Household Size | # Housing Units | % Housing Units |
| 1-Person Household | 145 | 36.5% |
| 2-Person Household | 140 | 35.3% |
| 3-Person Household | 46 | 11.6% |
| 4+ Person Household | 66 | 16.6% |
| Total Housing Units | 397 | 100.0% |
Occupancy by Ownership by Household Size in Pringle borough
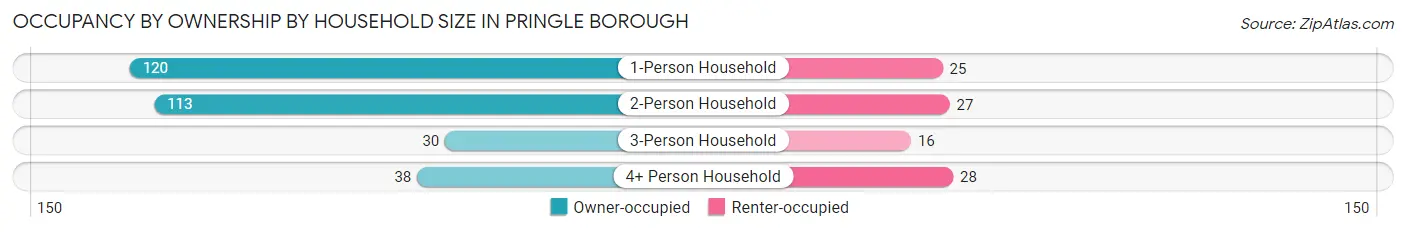
| Household Size | Owner-occupied | Renter-occupied |
| 1-Person Household | 120 (82.8%) | 25 (17.2%) |
| 2-Person Household | 113 (80.7%) | 27 (19.3%) |
| 3-Person Household | 30 (65.2%) | 16 (34.8%) |
| 4+ Person Household | 38 (57.6%) | 28 (42.4%) |
| Total Housing Units | 301 (75.8%) | 96 (24.2%) |
Occupancy by Educational Attainment in Pringle borough
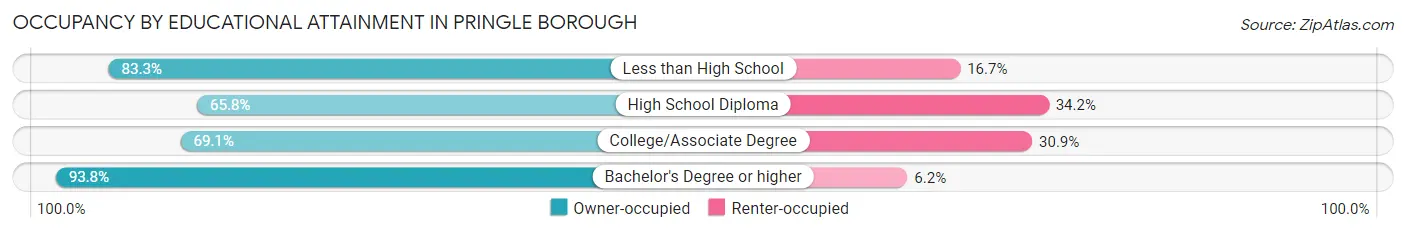
| Household Size | Owner-occupied | Renter-occupied |
| Less than High School | 15 (83.3%) | 3 (16.7%) |
| High School Diploma | 75 (65.8%) | 39 (34.2%) |
| College/Associate Degree | 105 (69.1%) | 47 (30.9%) |
| Bachelor's Degree or higher | 106 (93.8%) | 7 (6.2%) |
Occupancy by Age of Householder in Pringle borough
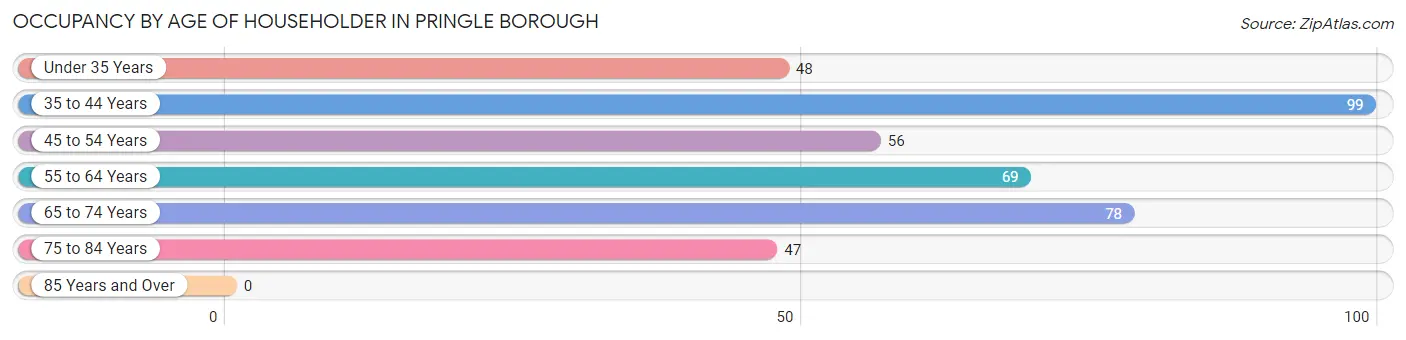
| Age Bracket | # Households | % Households |
| Under 35 Years | 48 | 12.1% |
| 35 to 44 Years | 99 | 24.9% |
| 45 to 54 Years | 56 | 14.1% |
| 55 to 64 Years | 69 | 17.4% |
| 65 to 74 Years | 78 | 19.7% |
| 75 to 84 Years | 47 | 11.8% |
| 85 Years and Over | 0 | 0.0% |
| Total | 397 | 100.0% |
Housing Finances in Pringle borough
Median Income by Occupancy in Pringle borough
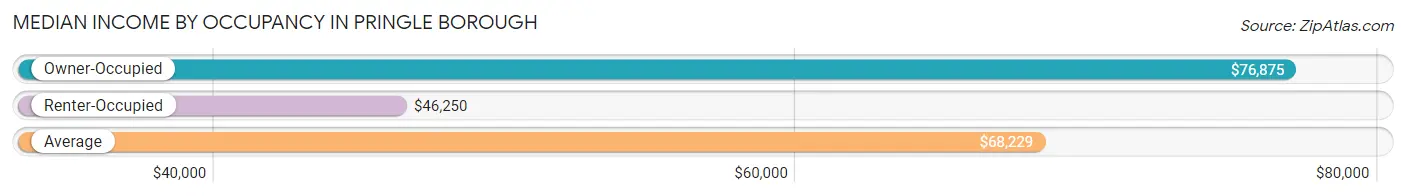
| Occupancy Type | # Households | Median Income |
| Owner-Occupied | 301 (75.8%) | $76,875 |
| Renter-Occupied | 96 (24.2%) | $46,250 |
| Average | 397 (100.0%) | $68,229 |
Occupancy by Householder Income Bracket in Pringle borough
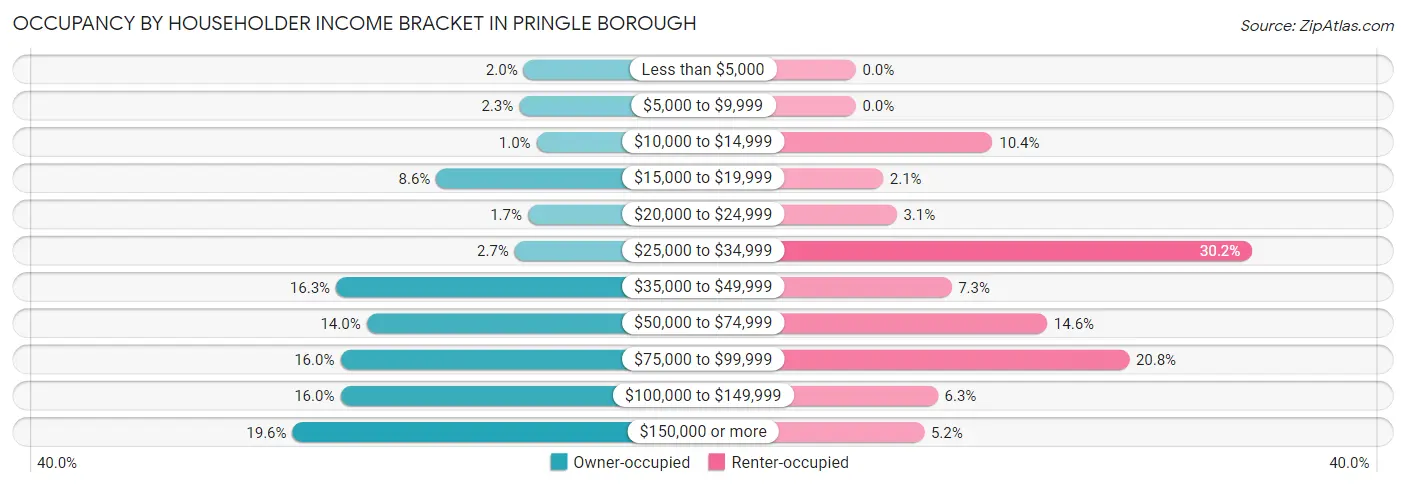
| Income Bracket | Owner-occupied | Renter-occupied |
| Less than $5,000 | 6 (2.0%) | 0 (0.0%) |
| $5,000 to $9,999 | 7 (2.3%) | 0 (0.0%) |
| $10,000 to $14,999 | 3 (1.0%) | 10 (10.4%) |
| $15,000 to $19,999 | 26 (8.6%) | 2 (2.1%) |
| $20,000 to $24,999 | 5 (1.7%) | 3 (3.1%) |
| $25,000 to $34,999 | 8 (2.7%) | 29 (30.2%) |
| $35,000 to $49,999 | 49 (16.3%) | 7 (7.3%) |
| $50,000 to $74,999 | 42 (14.0%) | 14 (14.6%) |
| $75,000 to $99,999 | 48 (16.0%) | 20 (20.8%) |
| $100,000 to $149,999 | 48 (16.0%) | 6 (6.2%) |
| $150,000 or more | 59 (19.6%) | 5 (5.2%) |
| Total | 301 (100.0%) | 96 (100.0%) |
Monthly Housing Cost Tiers in Pringle borough
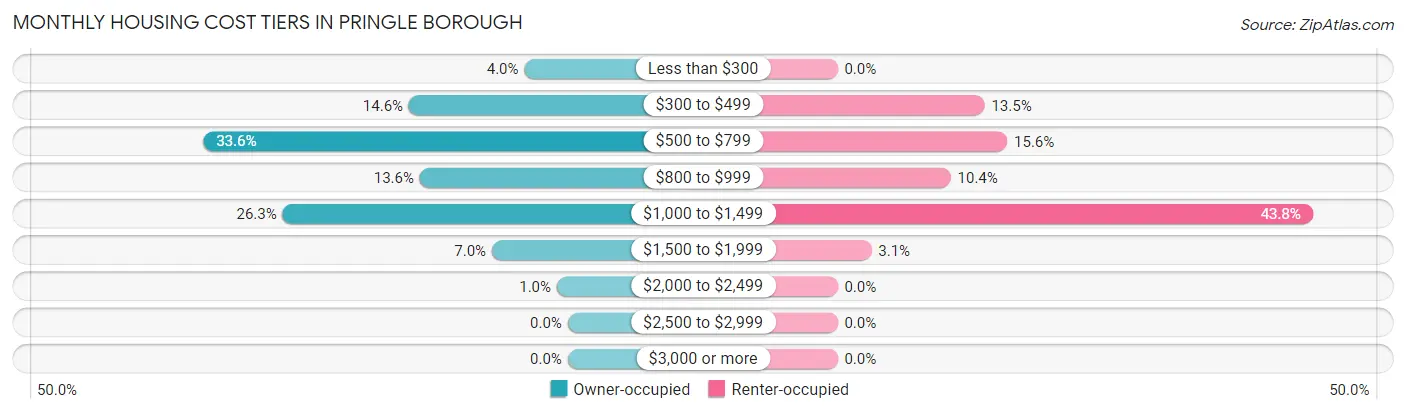
| Monthly Cost | Owner-occupied | Renter-occupied |
| Less than $300 | 12 (4.0%) | 0 (0.0%) |
| $300 to $499 | 44 (14.6%) | 13 (13.5%) |
| $500 to $799 | 101 (33.6%) | 15 (15.6%) |
| $800 to $999 | 41 (13.6%) | 10 (10.4%) |
| $1,000 to $1,499 | 79 (26.3%) | 42 (43.8%) |
| $1,500 to $1,999 | 21 (7.0%) | 3 (3.1%) |
| $2,000 to $2,499 | 3 (1.0%) | 0 (0.0%) |
| $2,500 to $2,999 | 0 (0.0%) | 0 (0.0%) |
| $3,000 or more | 0 (0.0%) | 0 (0.0%) |
| Total | 301 (100.0%) | 96 (100.0%) |
Physical Housing Characteristics in Pringle borough
Housing Structures in Pringle borough
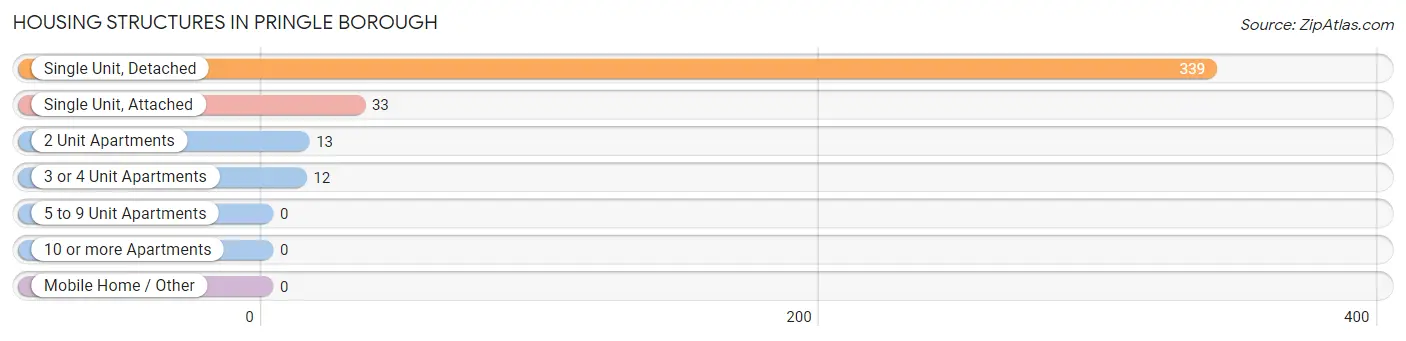
| Structure Type | # Housing Units | % Housing Units |
| Single Unit, Detached | 339 | 85.4% |
| Single Unit, Attached | 33 | 8.3% |
| 2 Unit Apartments | 13 | 3.3% |
| 3 or 4 Unit Apartments | 12 | 3.0% |
| 5 to 9 Unit Apartments | 0 | 0.0% |
| 10 or more Apartments | 0 | 0.0% |
| Mobile Home / Other | 0 | 0.0% |
| Total | 397 | 100.0% |
Housing Structures by Occupancy in Pringle borough
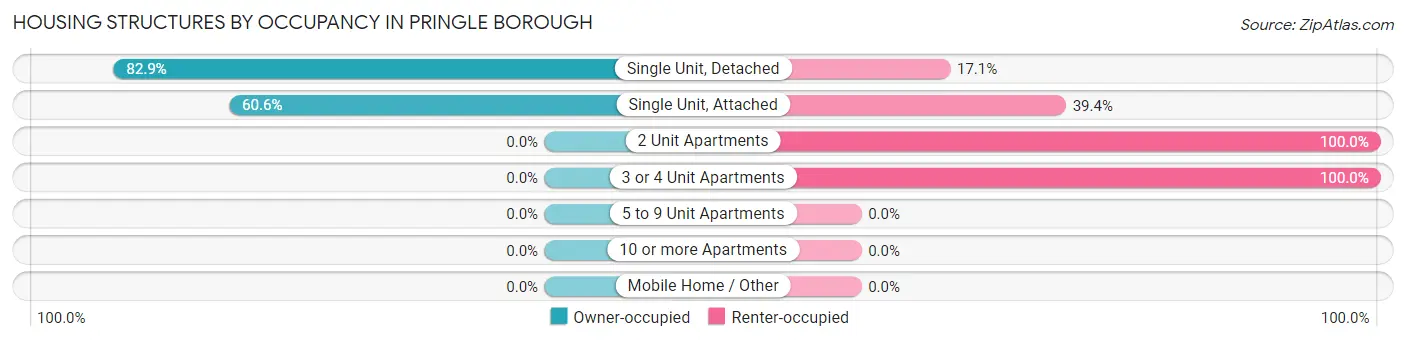
| Structure Type | Owner-occupied | Renter-occupied |
| Single Unit, Detached | 281 (82.9%) | 58 (17.1%) |
| Single Unit, Attached | 20 (60.6%) | 13 (39.4%) |
| 2 Unit Apartments | 0 (0.0%) | 13 (100.0%) |
| 3 or 4 Unit Apartments | 0 (0.0%) | 12 (100.0%) |
| 5 to 9 Unit Apartments | 0 (0.0%) | 0 (0.0%) |
| 10 or more Apartments | 0 (0.0%) | 0 (0.0%) |
| Mobile Home / Other | 0 (0.0%) | 0 (0.0%) |
| Total | 301 (75.8%) | 96 (24.2%) |
Housing Structures by Number of Rooms in Pringle borough
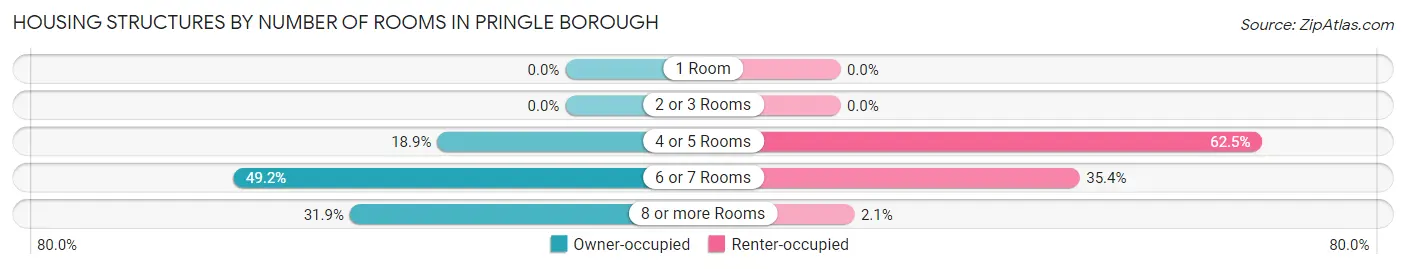
| Number of Rooms | Owner-occupied | Renter-occupied |
| 1 Room | 0 (0.0%) | 0 (0.0%) |
| 2 or 3 Rooms | 0 (0.0%) | 0 (0.0%) |
| 4 or 5 Rooms | 57 (18.9%) | 60 (62.5%) |
| 6 or 7 Rooms | 148 (49.2%) | 34 (35.4%) |
| 8 or more Rooms | 96 (31.9%) | 2 (2.1%) |
| Total | 301 (100.0%) | 96 (100.0%) |
Housing Structure by Heating Type in Pringle borough
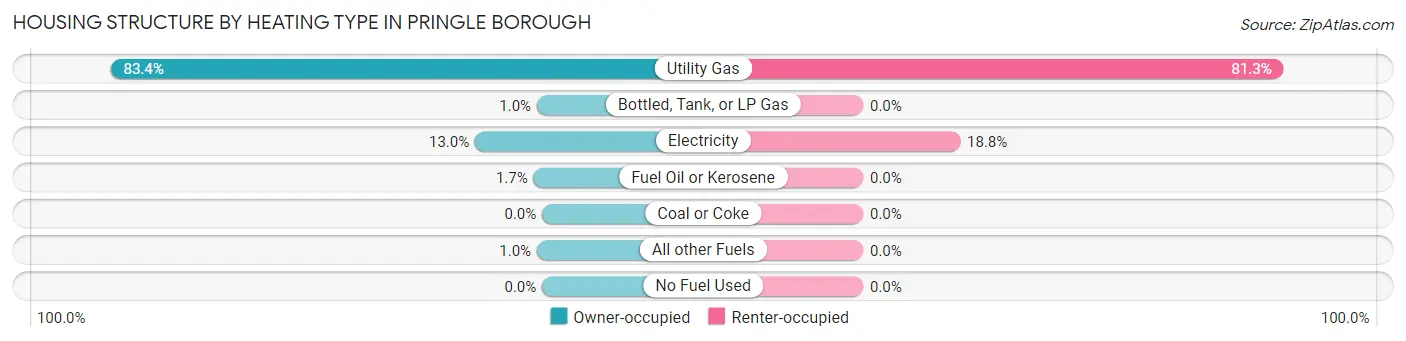
| Heating Type | Owner-occupied | Renter-occupied |
| Utility Gas | 251 (83.4%) | 78 (81.2%) |
| Bottled, Tank, or LP Gas | 3 (1.0%) | 0 (0.0%) |
| Electricity | 39 (13.0%) | 18 (18.8%) |
| Fuel Oil or Kerosene | 5 (1.7%) | 0 (0.0%) |
| Coal or Coke | 0 (0.0%) | 0 (0.0%) |
| All other Fuels | 3 (1.0%) | 0 (0.0%) |
| No Fuel Used | 0 (0.0%) | 0 (0.0%) |
| Total | 301 (100.0%) | 96 (100.0%) |
Household Vehicle Usage in Pringle borough
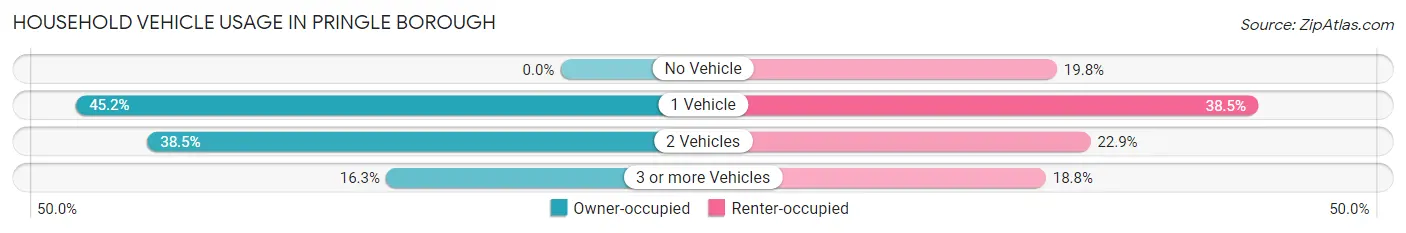
| Vehicles per Household | Owner-occupied | Renter-occupied |
| No Vehicle | 0 (0.0%) | 19 (19.8%) |
| 1 Vehicle | 136 (45.2%) | 37 (38.5%) |
| 2 Vehicles | 116 (38.5%) | 22 (22.9%) |
| 3 or more Vehicles | 49 (16.3%) | 18 (18.8%) |
| Total | 301 (100.0%) | 96 (100.0%) |
Real Estate & Mortgages in Pringle borough
Real Estate and Mortgage Overview in Pringle borough
| Characteristic | Without Mortgage | With Mortgage |
| Housing Units | 183 | 118 |
| Median Property Value | $119,600 | $139,500 |
| Median Household Income | $74,688 | $28 |
| Monthly Housing Costs | $625 | $0 |
| Real Estate Taxes | $2,302 | $0 |
Property Value by Mortgage Status in Pringle borough
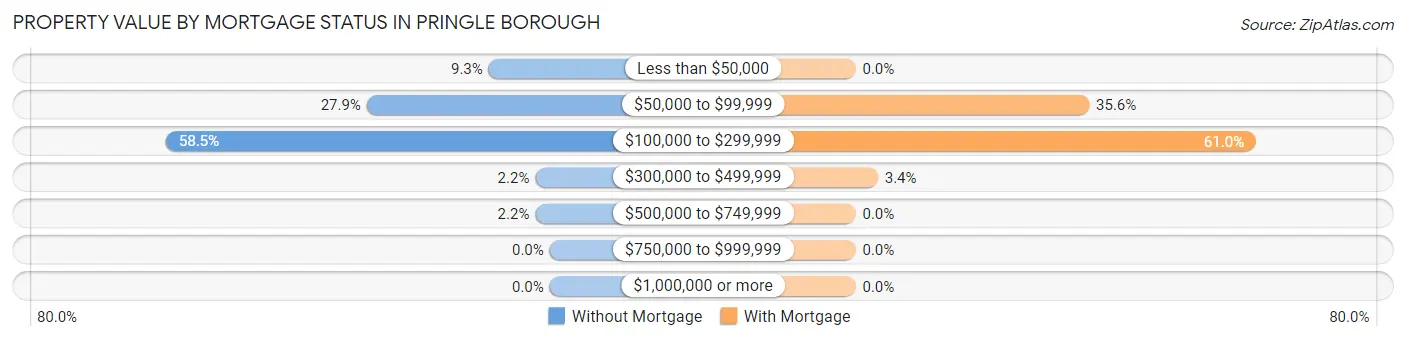
| Property Value | Without Mortgage | With Mortgage |
| Less than $50,000 | 17 (9.3%) | 0 (0.0%) |
| $50,000 to $99,999 | 51 (27.9%) | 42 (35.6%) |
| $100,000 to $299,999 | 107 (58.5%) | 72 (61.0%) |
| $300,000 to $499,999 | 4 (2.2%) | 4 (3.4%) |
| $500,000 to $749,999 | 4 (2.2%) | 0 (0.0%) |
| $750,000 to $999,999 | 0 (0.0%) | 0 (0.0%) |
| $1,000,000 or more | 0 (0.0%) | 0 (0.0%) |
| Total | 183 (100.0%) | 118 (100.0%) |
Household Income by Mortgage Status in Pringle borough
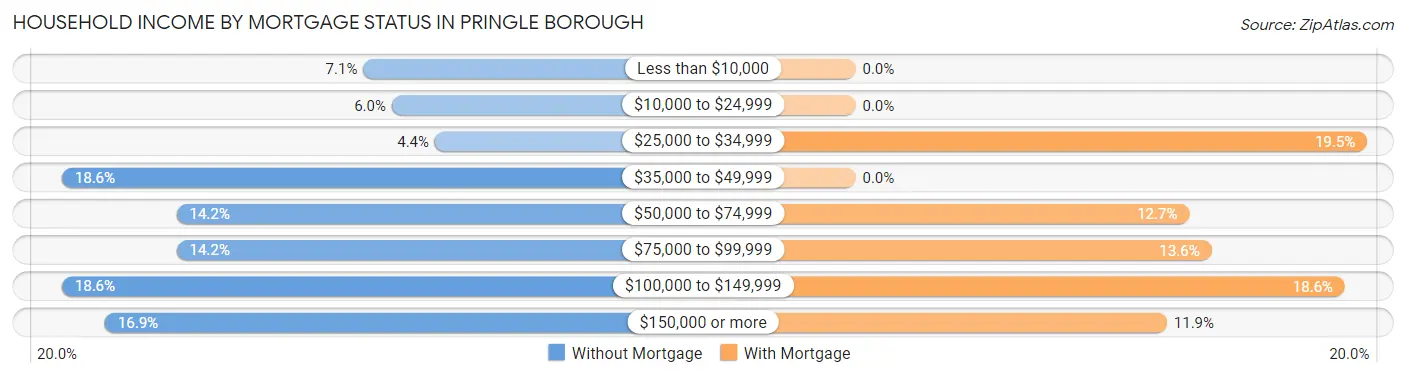
| Household Income | Without Mortgage | With Mortgage |
| Less than $10,000 | 13 (7.1%) | 0 (0.0%) |
| $10,000 to $24,999 | 11 (6.0%) | 0 (0.0%) |
| $25,000 to $34,999 | 8 (4.4%) | 23 (19.5%) |
| $35,000 to $49,999 | 34 (18.6%) | 0 (0.0%) |
| $50,000 to $74,999 | 26 (14.2%) | 15 (12.7%) |
| $75,000 to $99,999 | 26 (14.2%) | 16 (13.6%) |
| $100,000 to $149,999 | 34 (18.6%) | 22 (18.6%) |
| $150,000 or more | 31 (16.9%) | 14 (11.9%) |
| Total | 183 (100.0%) | 118 (100.0%) |
Property Value to Household Income Ratio in Pringle borough
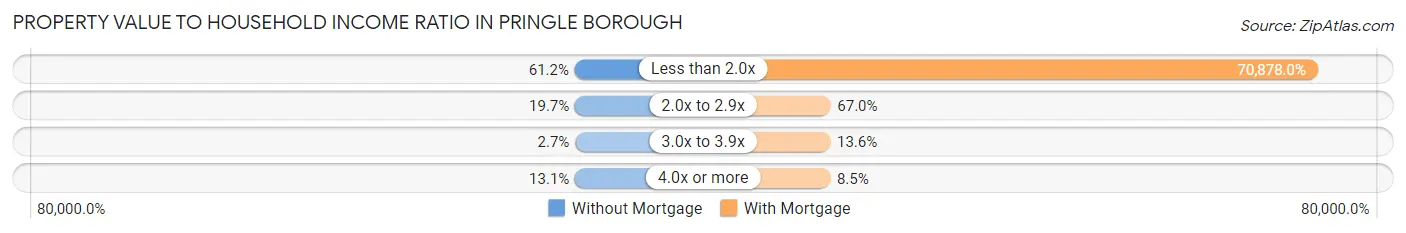
| Value-to-Income Ratio | Without Mortgage | With Mortgage |
| Less than 2.0x | 112 (61.2%) | 83,636 (70,878.0%) |
| 2.0x to 2.9x | 36 (19.7%) | 79 (66.9%) |
| 3.0x to 3.9x | 5 (2.7%) | 16 (13.6%) |
| 4.0x or more | 24 (13.1%) | 10 (8.5%) |
| Total | 183 (100.0%) | 118 (100.0%) |
Real Estate Taxes by Mortgage Status in Pringle borough
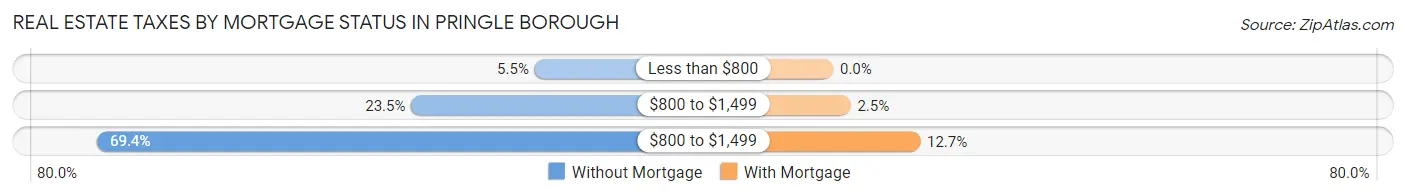
| Property Taxes | Without Mortgage | With Mortgage |
| Less than $800 | 10 (5.5%) | 0 (0.0%) |
| $800 to $1,499 | 43 (23.5%) | 3 (2.5%) |
| $800 to $1,499 | 127 (69.4%) | 15 (12.7%) |
| Total | 183 (100.0%) | 118 (100.0%) |
Health & Disability in Pringle borough
Health Insurance Coverage by Age in Pringle borough
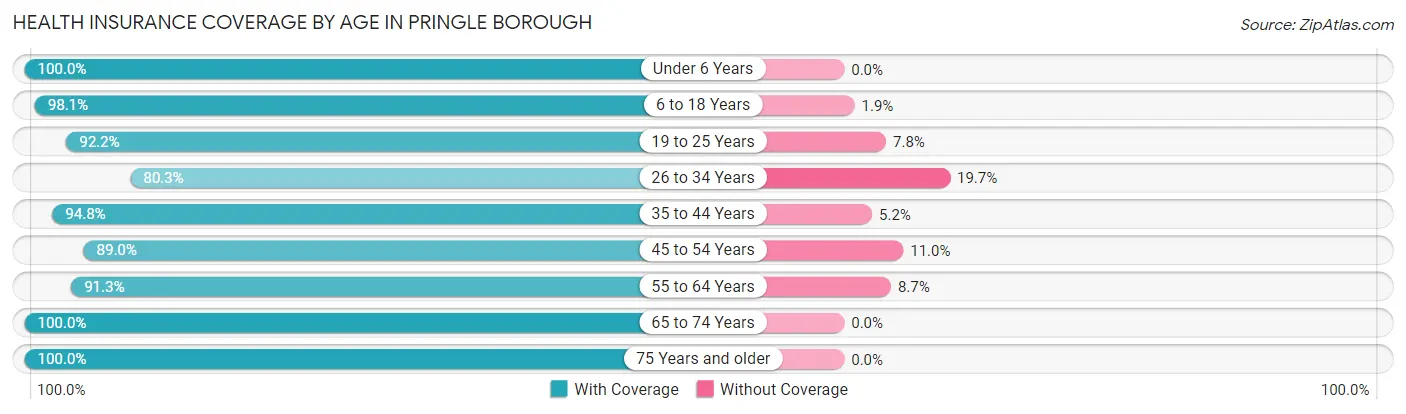
| Age Bracket | With Coverage | Without Coverage |
| Under 6 Years | 39 (100.0%) | 0 (0.0%) |
| 6 to 18 Years | 153 (98.1%) | 3 (1.9%) |
| 19 to 25 Years | 71 (92.2%) | 6 (7.8%) |
| 26 to 34 Years | 57 (80.3%) | 14 (19.7%) |
| 35 to 44 Years | 128 (94.8%) | 7 (5.2%) |
| 45 to 54 Years | 97 (89.0%) | 12 (11.0%) |
| 55 to 64 Years | 105 (91.3%) | 10 (8.7%) |
| 65 to 74 Years | 113 (100.0%) | 0 (0.0%) |
| 75 Years and older | 62 (100.0%) | 0 (0.0%) |
| Total | 825 (94.1%) | 52 (5.9%) |
Health Insurance Coverage by Citizenship Status in Pringle borough
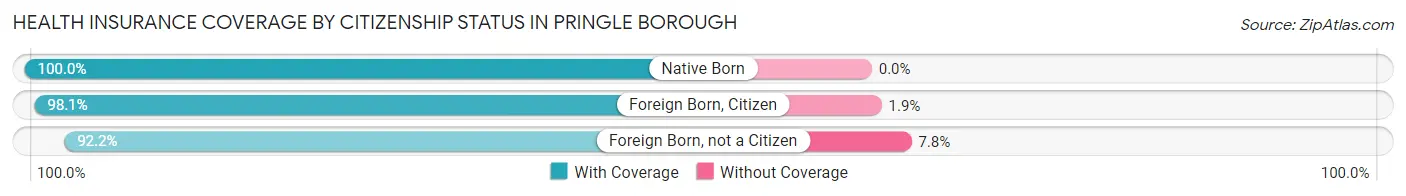
| Citizenship Status | With Coverage | Without Coverage |
| Native Born | 39 (100.0%) | 0 (0.0%) |
| Foreign Born, Citizen | 153 (98.1%) | 3 (1.9%) |
| Foreign Born, not a Citizen | 71 (92.2%) | 6 (7.8%) |
Health Insurance Coverage by Household Income in Pringle borough
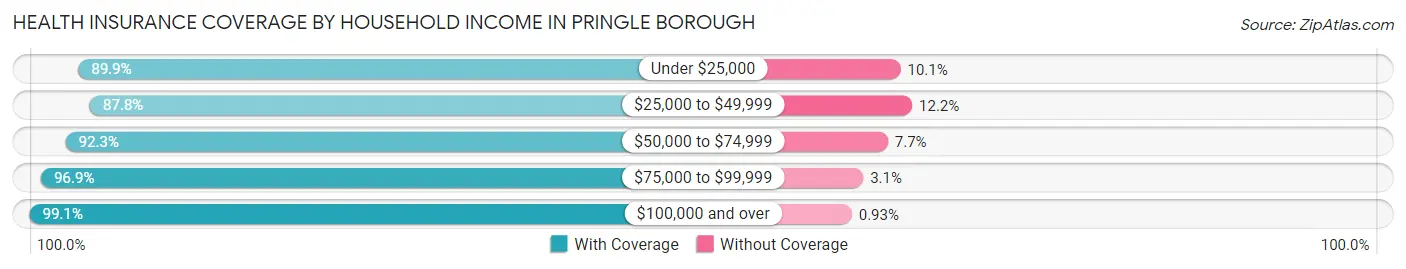
| Household Income | With Coverage | Without Coverage |
| Under $25,000 | 125 (89.9%) | 14 (10.1%) |
| $25,000 to $49,999 | 172 (87.8%) | 24 (12.2%) |
| $50,000 to $74,999 | 84 (92.3%) | 7 (7.7%) |
| $75,000 to $99,999 | 126 (96.9%) | 4 (3.1%) |
| $100,000 and over | 318 (99.1%) | 3 (0.9%) |
Public vs Private Health Insurance Coverage by Age in Pringle borough
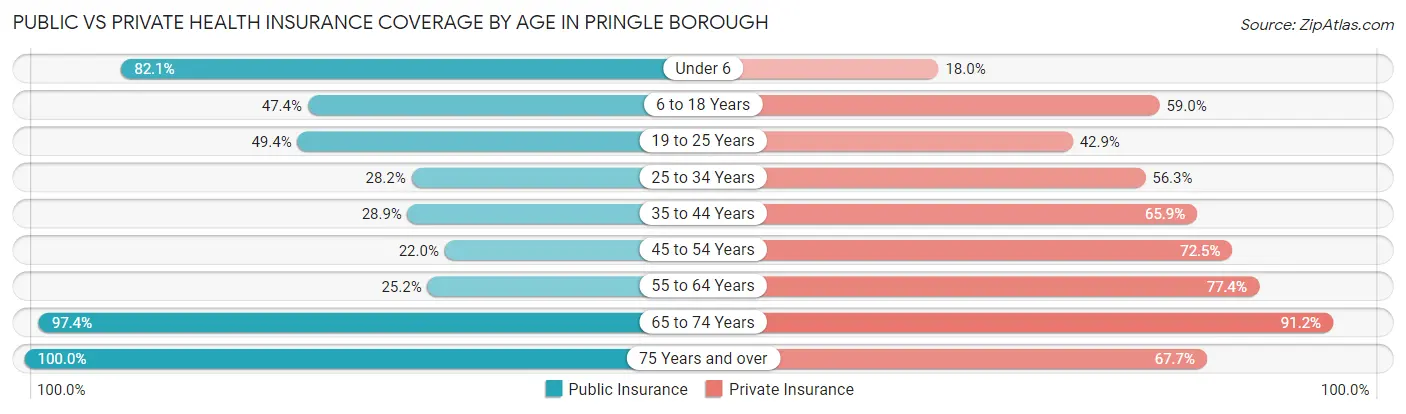
| Age Bracket | Public Insurance | Private Insurance |
| Under 6 | 32 (82.1%) | 7 (17.9%) |
| 6 to 18 Years | 74 (47.4%) | 92 (59.0%) |
| 19 to 25 Years | 38 (49.3%) | 33 (42.9%) |
| 25 to 34 Years | 20 (28.2%) | 40 (56.3%) |
| 35 to 44 Years | 39 (28.9%) | 89 (65.9%) |
| 45 to 54 Years | 24 (22.0%) | 79 (72.5%) |
| 55 to 64 Years | 29 (25.2%) | 89 (77.4%) |
| 65 to 74 Years | 110 (97.4%) | 103 (91.1%) |
| 75 Years and over | 62 (100.0%) | 42 (67.7%) |
| Total | 428 (48.8%) | 574 (65.4%) |
Disability Status by Sex by Age in Pringle borough
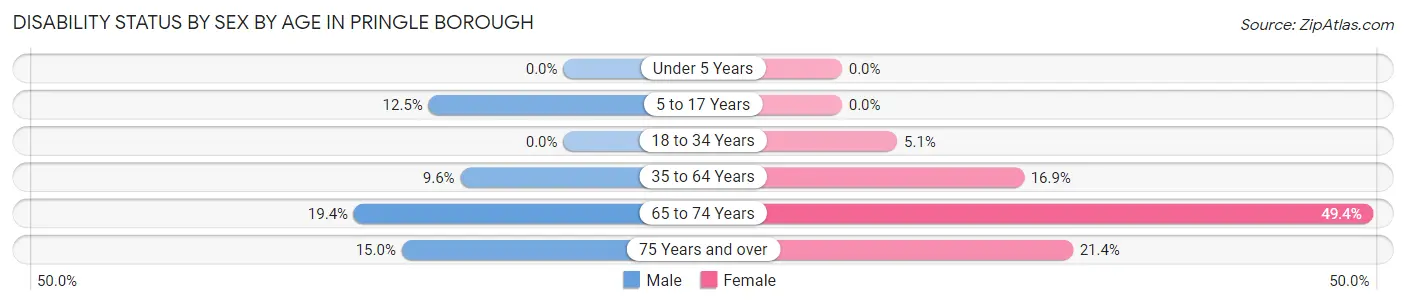
| Age Bracket | Male | Female |
| Under 5 Years | 0 (0.0%) | 0 (0.0%) |
| 5 to 17 Years | 8 (12.5%) | 0 (0.0%) |
| 18 to 34 Years | 0 (0.0%) | 4 (5.1%) |
| 35 to 64 Years | 19 (9.6%) | 27 (16.9%) |
| 65 to 74 Years | 7 (19.4%) | 38 (49.3%) |
| 75 Years and over | 3 (15.0%) | 9 (21.4%) |
Disability Class by Sex by Age in Pringle borough
Disability Class: Hearing Difficulty
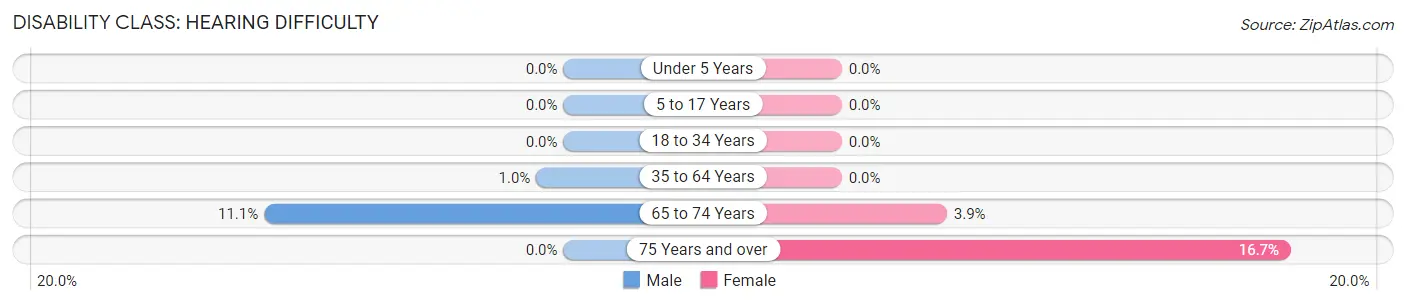
| Age Bracket | Male | Female |
| Under 5 Years | 0 (0.0%) | 0 (0.0%) |
| 5 to 17 Years | 0 (0.0%) | 0 (0.0%) |
| 18 to 34 Years | 0 (0.0%) | 0 (0.0%) |
| 35 to 64 Years | 2 (1.0%) | 0 (0.0%) |
| 65 to 74 Years | 4 (11.1%) | 3 (3.9%) |
| 75 Years and over | 0 (0.0%) | 7 (16.7%) |
Disability Class: Vision Difficulty
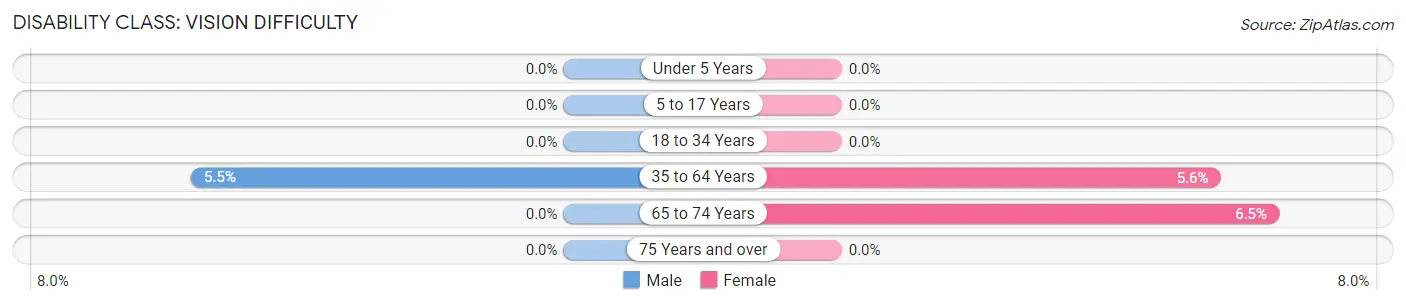
| Age Bracket | Male | Female |
| Under 5 Years | 0 (0.0%) | 0 (0.0%) |
| 5 to 17 Years | 0 (0.0%) | 0 (0.0%) |
| 18 to 34 Years | 0 (0.0%) | 0 (0.0%) |
| 35 to 64 Years | 11 (5.5%) | 9 (5.6%) |
| 65 to 74 Years | 0 (0.0%) | 5 (6.5%) |
| 75 Years and over | 0 (0.0%) | 0 (0.0%) |
Disability Class: Cognitive Difficulty
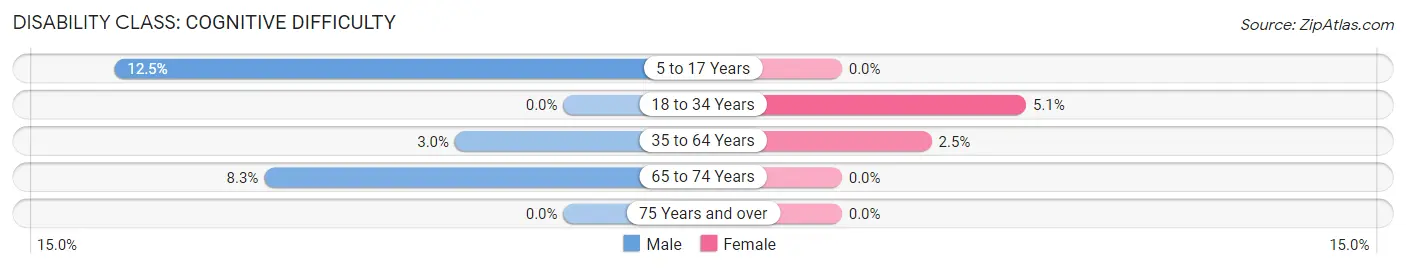
| Age Bracket | Male | Female |
| 5 to 17 Years | 8 (12.5%) | 0 (0.0%) |
| 18 to 34 Years | 0 (0.0%) | 4 (5.1%) |
| 35 to 64 Years | 6 (3.0%) | 4 (2.5%) |
| 65 to 74 Years | 3 (8.3%) | 0 (0.0%) |
| 75 Years and over | 0 (0.0%) | 0 (0.0%) |
Disability Class: Ambulatory Difficulty
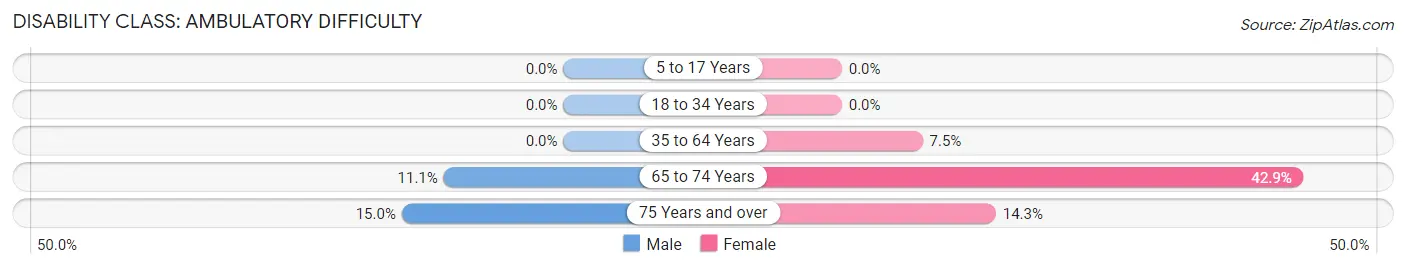
| Age Bracket | Male | Female |
| 5 to 17 Years | 0 (0.0%) | 0 (0.0%) |
| 18 to 34 Years | 0 (0.0%) | 0 (0.0%) |
| 35 to 64 Years | 0 (0.0%) | 12 (7.5%) |
| 65 to 74 Years | 4 (11.1%) | 33 (42.9%) |
| 75 Years and over | 3 (15.0%) | 6 (14.3%) |
Disability Class: Self-Care Difficulty
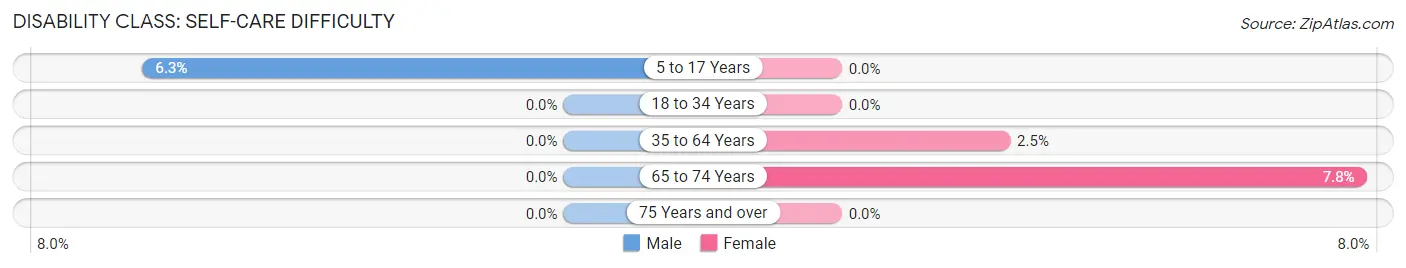
| Age Bracket | Male | Female |
| 5 to 17 Years | 4 (6.2%) | 0 (0.0%) |
| 18 to 34 Years | 0 (0.0%) | 0 (0.0%) |
| 35 to 64 Years | 0 (0.0%) | 4 (2.5%) |
| 65 to 74 Years | 0 (0.0%) | 6 (7.8%) |
| 75 Years and over | 0 (0.0%) | 0 (0.0%) |
Technology Access in Pringle borough
Computing Device Access in Pringle borough
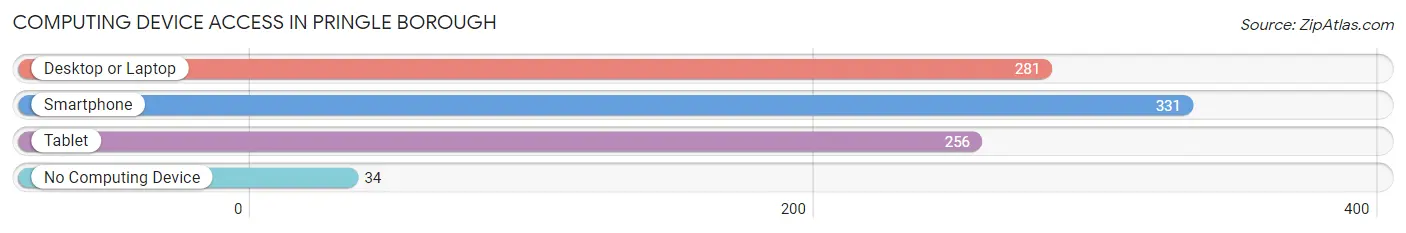
| Device Type | # Households | % Households |
| Desktop or Laptop | 281 | 70.8% |
| Smartphone | 331 | 83.4% |
| Tablet | 256 | 64.5% |
| No Computing Device | 34 | 8.6% |
| Total | 397 | 100.0% |
Internet Access in Pringle borough
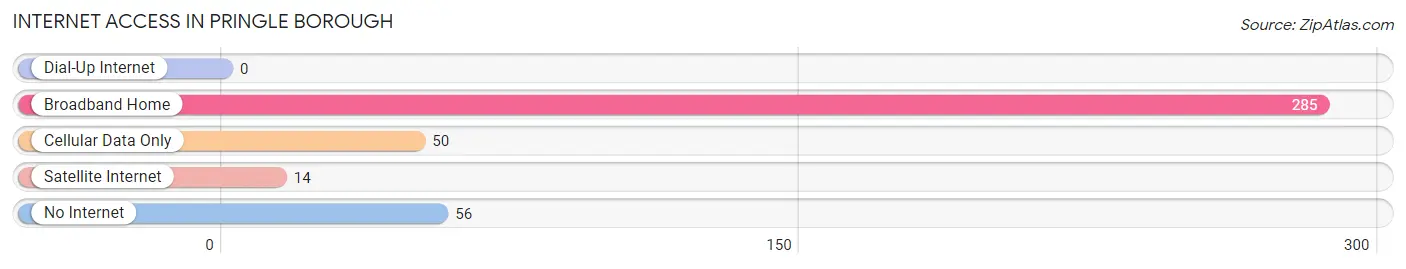
| Internet Type | # Households | % Households |
| Dial-Up Internet | 0 | 0.0% |
| Broadband Home | 285 | 71.8% |
| Cellular Data Only | 50 | 12.6% |
| Satellite Internet | 14 | 3.5% |
| No Internet | 56 | 14.1% |
| Total | 397 | 100.0% |
Pringle borough Summary
Pringle Borough is a small borough located in Luzerne County, Pennsylvania. It is situated in the Wyoming Valley, a region of the Northeastern United States. The borough is bordered by the cities of Wilkes-Barre and Pittston, and the townships of Jenkins and Pittston. Pringle Borough has a population of approximately 1,500 people, and is part of the Greater Wilkes-Barre Metropolitan Area.
History
Pringle Borough was founded in 1871 by a group of settlers from the nearby town of Pittston. The settlers named the borough after their leader, John Pringle. The borough was incorporated in 1872, and the first mayor was elected in 1873.
The borough was originally a farming community, and the main industry was coal mining. The coal industry was the main source of employment for the residents of Pringle Borough until the late 20th century.
Geography
Pringle Borough is located in the Wyoming Valley, a region of the Northeastern United States. The borough is bordered by the cities of Wilkes-Barre and Pittston, and the townships of Jenkins and Pittston. Pringle Borough is situated on the banks of the Susquehanna River, and is approximately 5 miles from the city of Wilkes-Barre.
The borough has a total area of 0.7 square miles, all of which is land. The terrain is mostly flat, with some rolling hills. The climate is humid continental, with cold winters and hot, humid summers.
Economy
The economy of Pringle Borough is largely based on the service industry. The borough is home to several small businesses, including restaurants, retail stores, and professional services. The borough also has a few manufacturing companies, including a plastics factory and a metal fabrication plant.
The borough is also home to a few small farms, which produce a variety of fruits and vegetables. The farms also raise livestock, including cows, pigs, and chickens.
Demographics
As of the 2010 census, Pringle Borough had a population of 1,500 people. The racial makeup of the borough was 97.3% White, 0.7% African American, 0.3% Native American, 0.3% Asian, and 1.3% from two or more races.
The median household income in Pringle Borough was $37,500, and the median family income was $45,000. The per capita income was $18,000. Approximately 10.7% of the population was below the poverty line.
The population of Pringle Borough is largely Catholic, with a small percentage of other Christian denominations. The borough also has a small Jewish population. The majority of the population speaks English, with a small percentage speaking Spanish.
Common Questions
What is Per Capita Income in Pringle borough?
Per Capita income in Pringle borough is $39,220.
What is the Median Family Income in Pringle borough?
Median Family Income in Pringle borough is $83,125.
What is the Median Household income in Pringle borough?
Median Household Income in Pringle borough is $68,229.
What is Income or Wage Gap in Pringle borough?
Income or Wage Gap in Pringle borough is 5.1%.
Women in Pringle borough earn 94.9 cents for every dollar earned by a man.
What is Inequality or Gini Index in Pringle borough?
Inequality or Gini Index in Pringle borough is 0.41.
What is the Total Population of Pringle borough?
Total Population of Pringle borough is 877.
What is the Total Male Population of Pringle borough?
Total Male Population of Pringle borough is 425.
What is the Total Female Population of Pringle borough?
Total Female Population of Pringle borough is 452.
What is the Ratio of Males per 100 Females in Pringle borough?
There are 94.03 Males per 100 Females in Pringle borough.
What is the Ratio of Females per 100 Males in Pringle borough?
There are 106.35 Females per 100 Males in Pringle borough.
What is the Median Population Age in Pringle borough?
Median Population Age in Pringle borough is 43.3 Years.
What is the Average Family Size in Pringle borough
Average Family Size in Pringle borough is 3.0 People.
What is the Average Household Size in Pringle borough
Average Household Size in Pringle borough is 2.2 People.
How Large is the Labor Force in Pringle borough?
There are 502 People in the Labor Forcein in Pringle borough.
What is the Percentage of People in the Labor Force in Pringle borough?
68.4% of People are in the Labor Force in Pringle borough.
What is the Unemployment Rate in Pringle borough?
Unemployment Rate in Pringle borough is 3.8%.