Hallstead borough, PA Map & Demographics
Hallstead borough Overview
$27,314
PER CAPITA INCOME
$62,727
AVG FAMILY INCOME
$47,125
AVG HOUSEHOLD INCOME
16.8%
WAGE / INCOME GAP [ % ]
83.2¢/ $1
WAGE / INCOME GAP [ $ ]
0.43
INEQUALITY / GINI INDEX
1,345
TOTAL POPULATION
622
MALE POPULATION
723
FEMALE POPULATION
86.03
MALES / 100 FEMALES
116.24
FEMALES / 100 MALES
39.0
MEDIAN AGE
3.1
AVG FAMILY SIZE
2.4
AVG HOUSEHOLD SIZE
575
LABOR FORCE [ PEOPLE ]
55.8%
PERCENT IN LABOR FORCE
5.6%
UNEMPLOYMENT RATE
Income in Hallstead borough
Income Overview in Hallstead borough
Per Capita Income in Hallstead borough is $27,314, while median incomes of families and households are $62,727 and $47,125 respectively.
| Characteristic | Number | Measure |
| Per Capita Income | 1,345 | $27,314 |
| Median Family Income | 314 | $62,727 |
| Mean Family Income | 314 | $70,327 |
| Median Household Income | 569 | $47,125 |
| Mean Household Income | 569 | $58,831 |
| Income Deficit | 314 | $0 |
| Wage / Income Gap (%) | 1,345 | 16.75% |
| Wage / Income Gap ($) | 1,345 | 83.25¢ per $1 |
| Gini / Inequality Index | 1,345 | 0.43 |
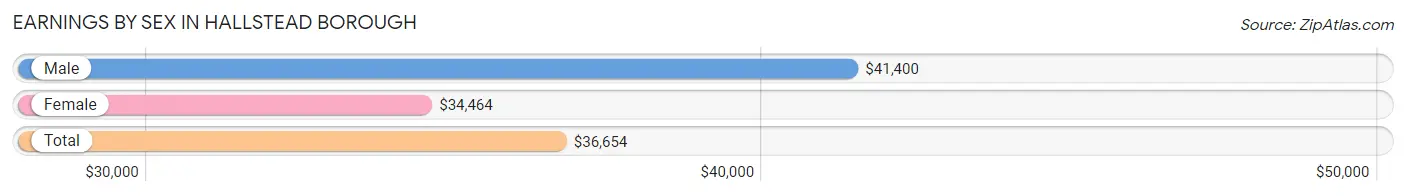
Earnings by Sex in Hallstead borough
Average Earnings in Hallstead borough are $36,654, $41,400 for men and $34,464 for women, a difference of 16.8%.
| Sex | Number | Average Earnings |
| Male | 308 (53.6%) | $41,400 |
| Female | 267 (46.4%) | $34,464 |
| Total | 575 (100.0%) | $36,654 |
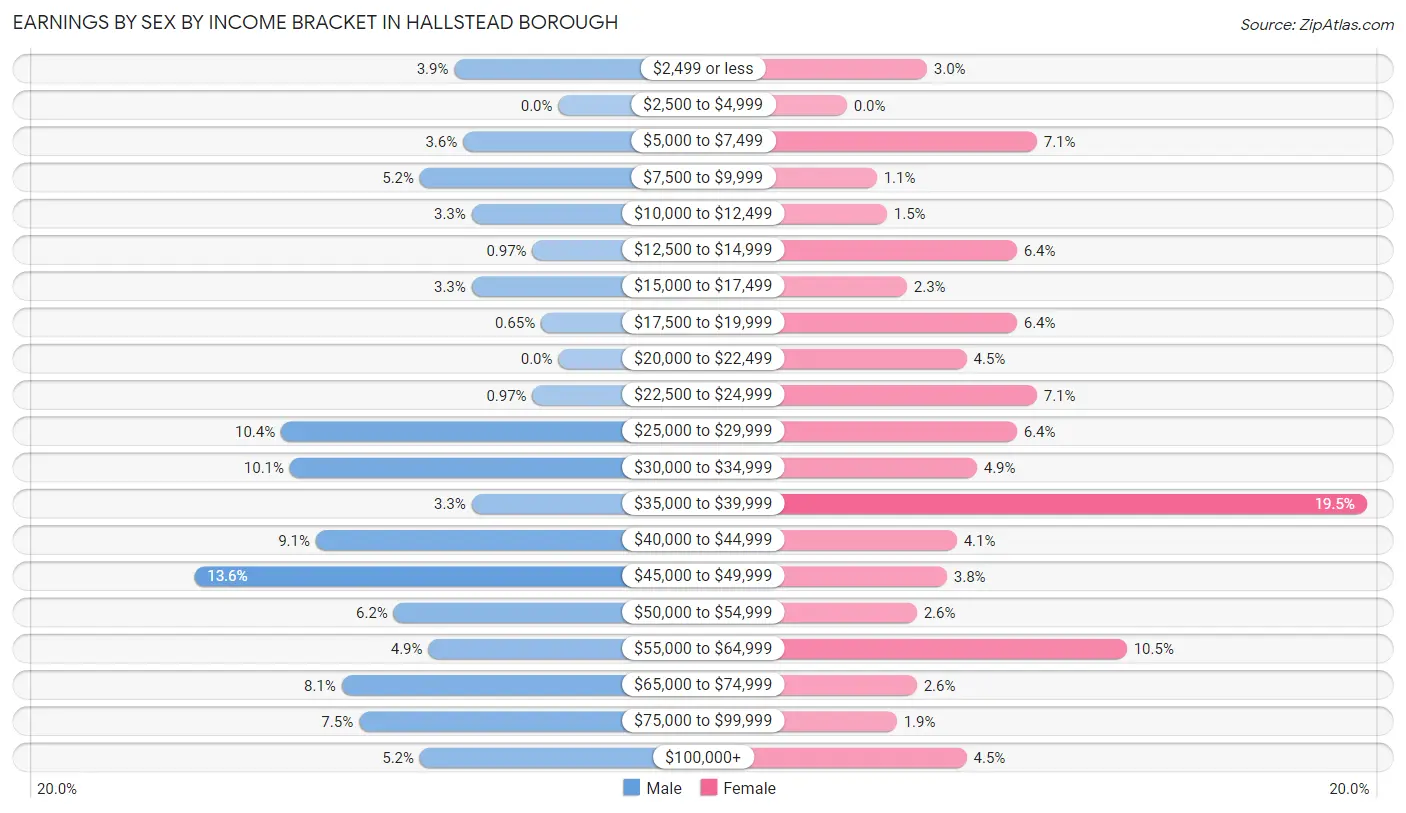
Earnings by Sex by Income Bracket in Hallstead borough
The most common earnings brackets in Hallstead borough are $45,000 to $49,999 for men (42 | 13.6%) and $35,000 to $39,999 for women (52 | 19.5%).
| Income | Male | Female |
| $2,499 or less | 12 (3.9%) | 8 (3.0%) |
| $2,500 to $4,999 | 0 (0.0%) | 0 (0.0%) |
| $5,000 to $7,499 | 11 (3.6%) | 19 (7.1%) |
| $7,500 to $9,999 | 16 (5.2%) | 3 (1.1%) |
| $10,000 to $12,499 | 10 (3.3%) | 4 (1.5%) |
| $12,500 to $14,999 | 3 (1.0%) | 17 (6.4%) |
| $15,000 to $17,499 | 10 (3.3%) | 6 (2.2%) |
| $17,500 to $19,999 | 2 (0.6%) | 17 (6.4%) |
| $20,000 to $22,499 | 0 (0.0%) | 12 (4.5%) |
| $22,500 to $24,999 | 3 (1.0%) | 19 (7.1%) |
| $25,000 to $29,999 | 32 (10.4%) | 17 (6.4%) |
| $30,000 to $34,999 | 31 (10.1%) | 13 (4.9%) |
| $35,000 to $39,999 | 10 (3.3%) | 52 (19.5%) |
| $40,000 to $44,999 | 28 (9.1%) | 11 (4.1%) |
| $45,000 to $49,999 | 42 (13.6%) | 10 (3.7%) |
| $50,000 to $54,999 | 19 (6.2%) | 7 (2.6%) |
| $55,000 to $64,999 | 15 (4.9%) | 28 (10.5%) |
| $65,000 to $74,999 | 25 (8.1%) | 7 (2.6%) |
| $75,000 to $99,999 | 23 (7.5%) | 5 (1.9%) |
| $100,000+ | 16 (5.2%) | 12 (4.5%) |
| Total | 308 (100.0%) | 267 (100.0%) |
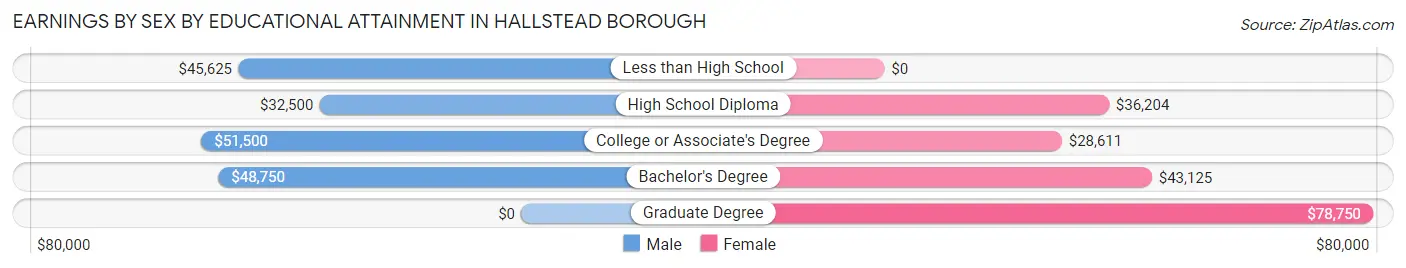
Earnings by Sex by Educational Attainment in Hallstead borough
Average earnings in Hallstead borough are $45,603 for men and $36,016 for women, a difference of 21.0%. Men with an educational attainment of college or associate's degree enjoy the highest average annual earnings of $51,500, while those with high school diploma education earn the least with $32,500. Women with an educational attainment of graduate degree earn the most with the average annual earnings of $78,750, while those with college or associate's degree education have the smallest earnings of $28,611.
| Educational Attainment | Male Income | Female Income |
| Less than High School | $45,625 | $0 |
| High School Diploma | $32,500 | $36,204 |
| College or Associate's Degree | $51,500 | $28,611 |
| Bachelor's Degree | $48,750 | $43,125 |
| Graduate Degree | - | - |
| Total | $45,603 | $36,016 |
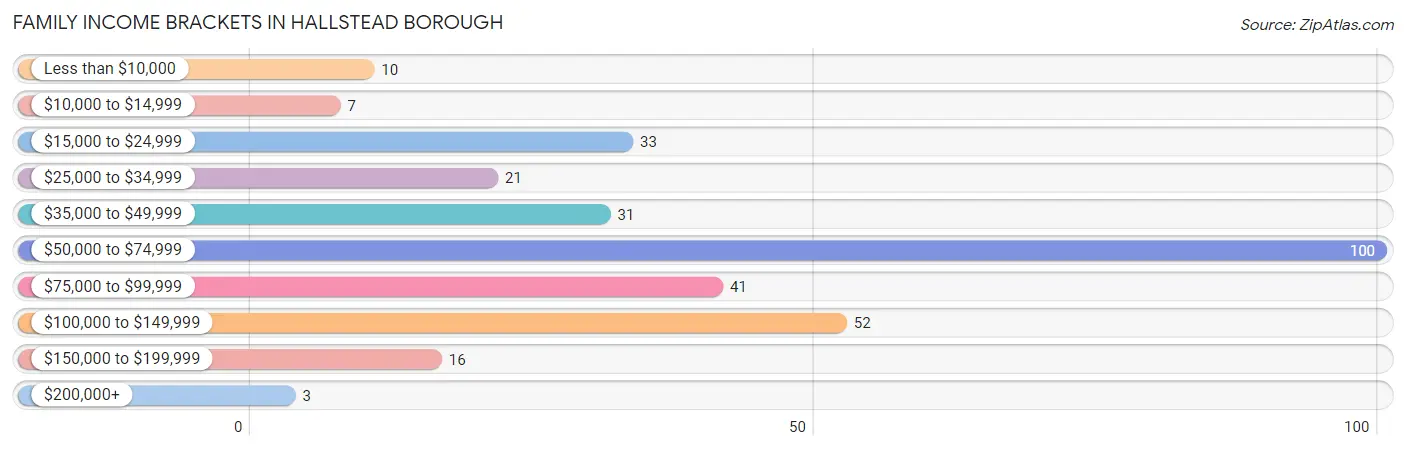
Family Income in Hallstead borough
Family Income Brackets in Hallstead borough
According to the Hallstead borough family income data, there are 100 families falling into the $50,000 to $74,999 income range, which is the most common income bracket and makes up 31.9% of all families. Conversely, the $200,000+ income bracket is the least frequent group with only 3 families (1.0%) belonging to this category.
| Income Bracket | # Families | % Families |
| Less than $10,000 | 10 | 3.2% |
| $10,000 to $14,999 | 7 | 2.2% |
| $15,000 to $24,999 | 33 | 10.5% |
| $25,000 to $34,999 | 21 | 6.7% |
| $35,000 to $49,999 | 31 | 9.9% |
| $50,000 to $74,999 | 100 | 31.8% |
| $75,000 to $99,999 | 41 | 13.1% |
| $100,000 to $149,999 | 52 | 16.6% |
| $150,000 to $199,999 | 16 | 5.1% |
| $200,000+ | 3 | 1.0% |
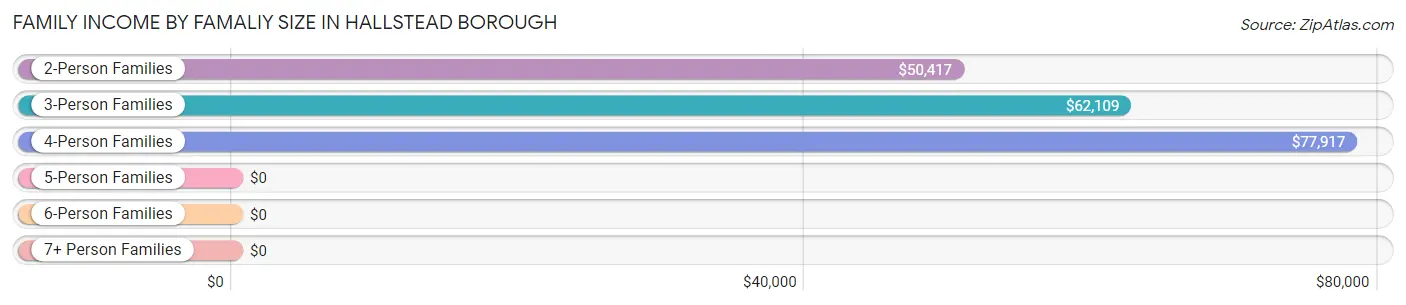
Family Income by Famaliy Size in Hallstead borough
4-person families (87 | 27.7%) account for the highest median family income in Hallstead borough with $77,917 per family, while 2-person families (133 | 42.4%) have the highest median income of $25,208 per family member.
| Income Bracket | # Families | Median Income |
| 2-Person Families | 133 (42.4%) | $50,417 |
| 3-Person Families | 77 (24.5%) | $62,109 |
| 4-Person Families | 87 (27.7%) | $77,917 |
| 5-Person Families | 9 (2.9%) | $0 |
| 6-Person Families | 8 (2.5%) | $0 |
| 7+ Person Families | 0 (0.0%) | $0 |
| Total | 314 (100.0%) | $62,727 |
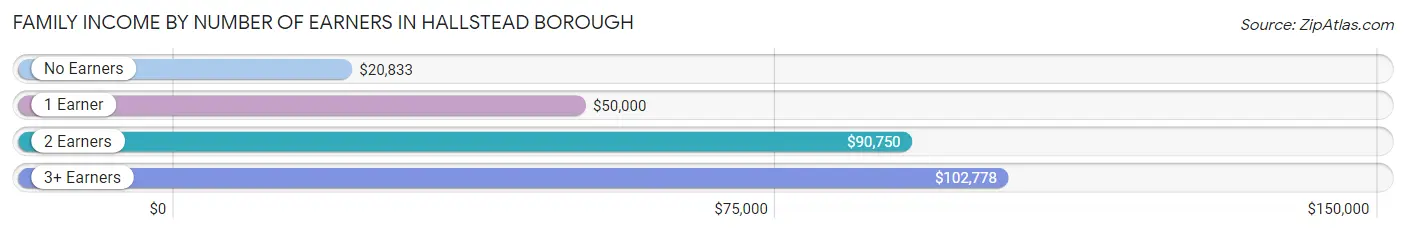
Family Income by Number of Earners in Hallstead borough
The median family income in Hallstead borough is $62,727, with families comprising 3+ earners (30) having the highest median family income of $102,778, while families with no earners (64) have the lowest median family income of $20,833, accounting for 9.6% and 20.4% of families, respectively.
| Number of Earners | # Families | Median Income |
| No Earners | 64 (20.4%) | $20,833 |
| 1 Earner | 108 (34.4%) | $50,000 |
| 2 Earners | 112 (35.7%) | $90,750 |
| 3+ Earners | 30 (9.6%) | $102,778 |
| Total | 314 (100.0%) | $62,727 |
Household Income in Hallstead borough
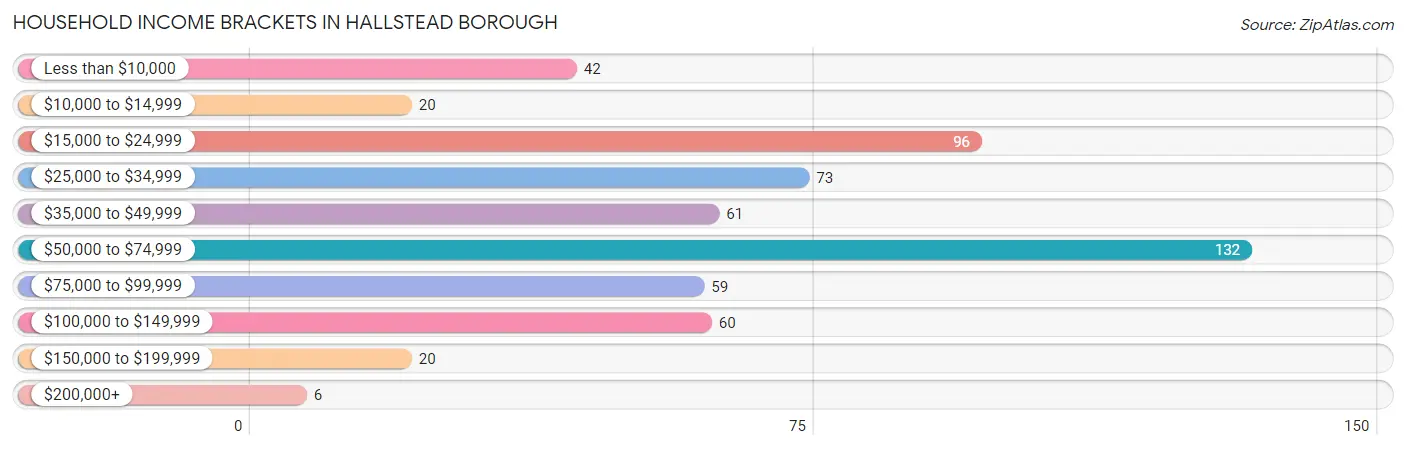
Household Income Brackets in Hallstead borough
With 132 households falling in the category, the $50,000 to $74,999 income range is the most frequent in Hallstead borough, accounting for 23.2% of all households. In contrast, only 6 households (1.1%) fall into the $200,000+ income bracket, making it the least populous group.
| Income Bracket | # Households | % Households |
| Less than $10,000 | 42 | 7.4% |
| $10,000 to $14,999 | 20 | 3.5% |
| $15,000 to $24,999 | 96 | 16.9% |
| $25,000 to $34,999 | 73 | 12.8% |
| $35,000 to $49,999 | 61 | 10.7% |
| $50,000 to $74,999 | 132 | 23.2% |
| $75,000 to $99,999 | 59 | 10.4% |
| $100,000 to $149,999 | 60 | 10.5% |
| $150,000 to $199,999 | 20 | 3.5% |
| $200,000+ | 6 | 1.1% |
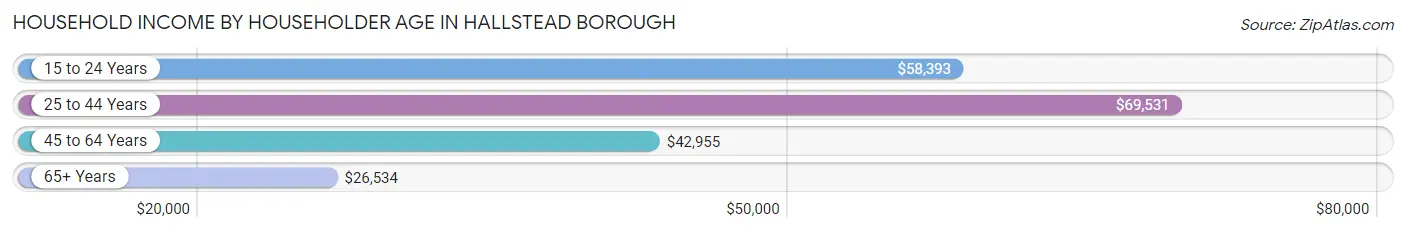
Household Income by Householder Age in Hallstead borough
The median household income in Hallstead borough is $47,125, with the highest median household income of $69,531 found in the 25 to 44 years age bracket for the primary householder. A total of 163 households (28.6%) fall into this category. Meanwhile, the 65+ years age bracket for the primary householder has the lowest median household income of $26,534, with 173 households (30.4%) in this group.
| Income Bracket | # Households | Median Income |
| 15 to 24 Years | 21 (3.7%) | $58,393 |
| 25 to 44 Years | 163 (28.6%) | $69,531 |
| 45 to 64 Years | 212 (37.3%) | $42,955 |
| 65+ Years | 173 (30.4%) | $26,534 |
| Total | 569 (100.0%) | $47,125 |
Poverty in Hallstead borough
Income Below Poverty by Sex and Age in Hallstead borough
With 13.0% poverty level for males and 16.2% for females among the residents of Hallstead borough, 16 and 17 year old males and 65 to 74 year old females are the most vulnerable to poverty, with 6 males (42.9%) and 38 females (44.2%) in their respective age groups living below the poverty level.
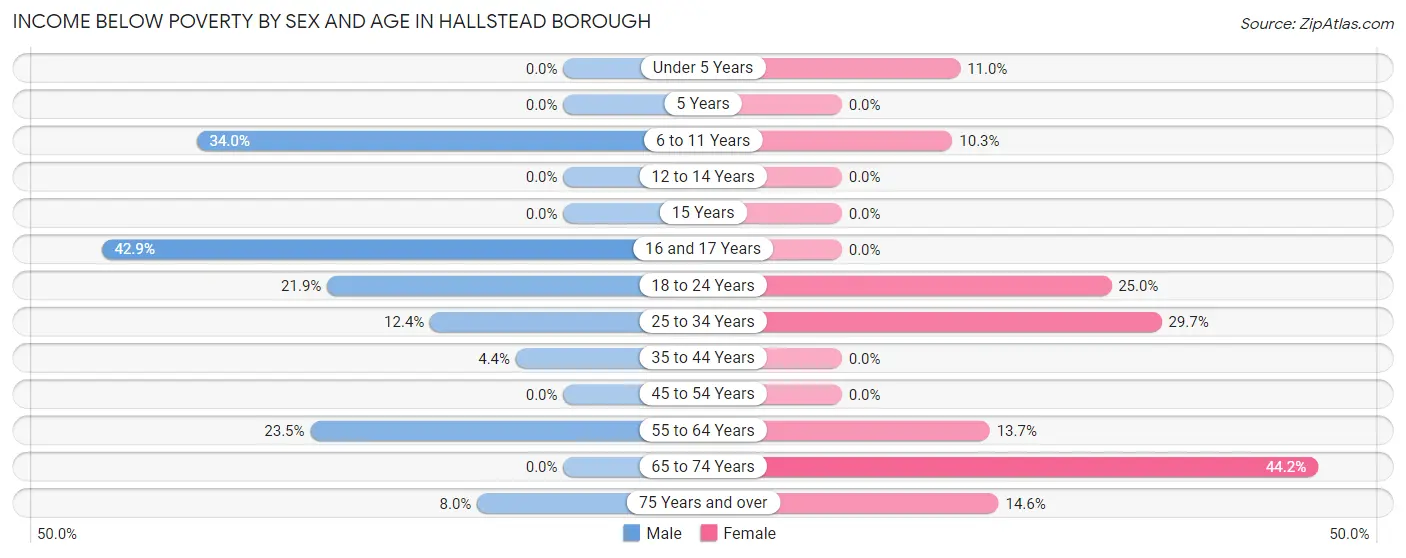
| Age Bracket | Male | Female |
| Under 5 Years | 0 (0.0%) | 10 (11.0%) |
| 5 Years | 0 (0.0%) | 0 (0.0%) |
| 6 to 11 Years | 16 (34.0%) | 8 (10.3%) |
| 12 to 14 Years | 0 (0.0%) | 0 (0.0%) |
| 15 Years | 0 (0.0%) | 0 (0.0%) |
| 16 and 17 Years | 6 (42.9%) | 0 (0.0%) |
| 18 to 24 Years | 16 (21.9%) | 12 (25.0%) |
| 25 to 34 Years | 11 (12.4%) | 27 (29.7%) |
| 35 to 44 Years | 3 (4.4%) | 0 (0.0%) |
| 45 to 54 Years | 0 (0.0%) | 0 (0.0%) |
| 55 to 64 Years | 27 (23.5%) | 14 (13.7%) |
| 65 to 74 Years | 0 (0.0%) | 38 (44.2%) |
| 75 Years and over | 2 (8.0%) | 8 (14.5%) |
| Total | 81 (13.0%) | 117 (16.2%) |
Income Above Poverty by Sex and Age in Hallstead borough
According to the poverty statistics in Hallstead borough, males aged under 5 years and females aged 5 years are the age groups that are most secure financially, with 100.0% of males and 100.0% of females in these age groups living above the poverty line.
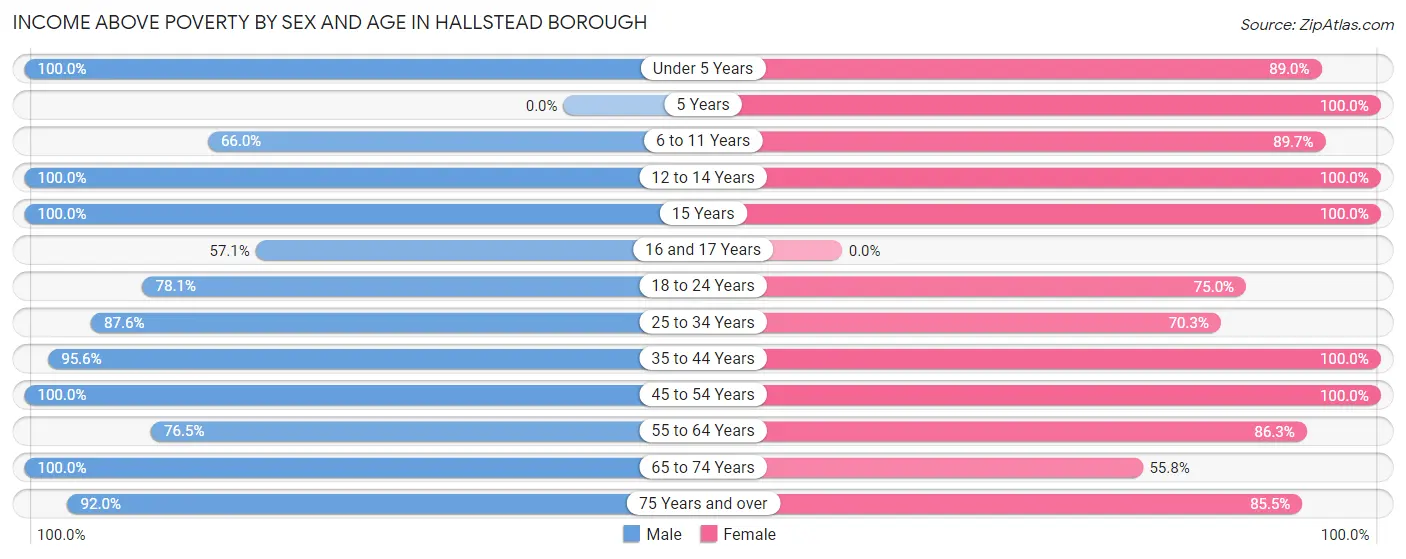
| Age Bracket | Male | Female |
| Under 5 Years | 53 (100.0%) | 81 (89.0%) |
| 5 Years | 0 (0.0%) | 11 (100.0%) |
| 6 to 11 Years | 31 (66.0%) | 70 (89.7%) |
| 12 to 14 Years | 15 (100.0%) | 13 (100.0%) |
| 15 Years | 2 (100.0%) | 5 (100.0%) |
| 16 and 17 Years | 8 (57.1%) | 0 (0.0%) |
| 18 to 24 Years | 57 (78.1%) | 36 (75.0%) |
| 25 to 34 Years | 78 (87.6%) | 64 (70.3%) |
| 35 to 44 Years | 65 (95.6%) | 56 (100.0%) |
| 45 to 54 Years | 71 (100.0%) | 87 (100.0%) |
| 55 to 64 Years | 88 (76.5%) | 88 (86.3%) |
| 65 to 74 Years | 50 (100.0%) | 48 (55.8%) |
| 75 Years and over | 23 (92.0%) | 47 (85.5%) |
| Total | 541 (87.0%) | 606 (83.8%) |
Income Below Poverty Among Married-Couple Families in Hallstead borough
The poverty statistics for married-couple families in Hallstead borough show that 4.9% or 11 of the total 225 families live below the poverty line. Families with no children have the highest poverty rate of 9.7%, comprising of 11 families. On the other hand, families with 1 or 2 children have the lowest poverty rate of 0.0%, which includes 0 families.
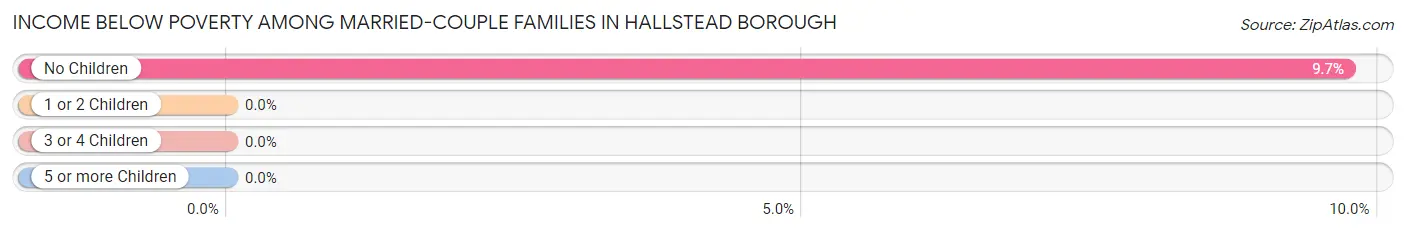
| Children | Above Poverty | Below Poverty |
| No Children | 102 (90.3%) | 11 (9.7%) |
| 1 or 2 Children | 99 (100.0%) | 0 (0.0%) |
| 3 or 4 Children | 13 (100.0%) | 0 (0.0%) |
| 5 or more Children | 0 (0.0%) | 0 (0.0%) |
| Total | 214 (95.1%) | 11 (4.9%) |
Income Below Poverty Among Single-Parent Households in Hallstead borough
According to the poverty data in Hallstead borough, 26.9% or 7 single-father households and 28.6% or 18 single-mother households are living below the poverty line. Among single-father households, those with no children have the highest poverty rate, with 7 households (50.0%) experiencing poverty. Likewise, among single-mother households, those with 1 or 2 children have the highest poverty rate, with 18 households (48.6%) falling below the poverty line.
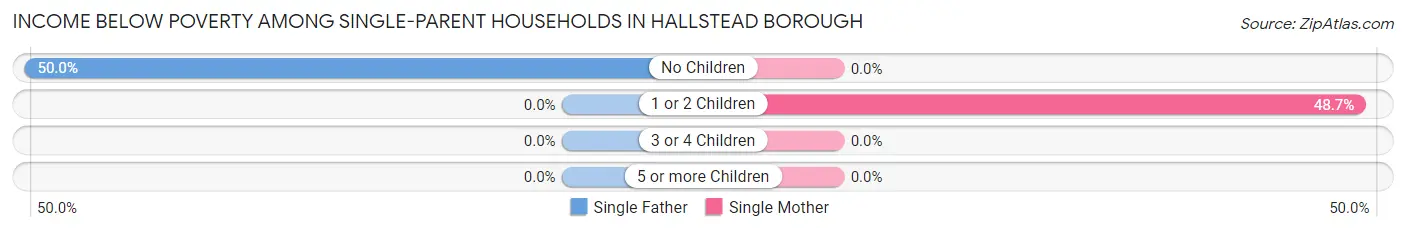
| Children | Single Father | Single Mother |
| No Children | 7 (50.0%) | 0 (0.0%) |
| 1 or 2 Children | 0 (0.0%) | 18 (48.6%) |
| 3 or 4 Children | 0 (0.0%) | 0 (0.0%) |
| 5 or more Children | 0 (0.0%) | 0 (0.0%) |
| Total | 7 (26.9%) | 18 (28.6%) |
Income Below Poverty Among Married-Couple vs Single-Parent Households in Hallstead borough
The poverty data for Hallstead borough shows that 11 of the married-couple family households (4.9%) and 25 of the single-parent households (28.1%) are living below the poverty level. Within the married-couple family households, those with no children have the highest poverty rate, with 11 households (9.7%) falling below the poverty line. Among the single-parent households, those with 1 or 2 children have the highest poverty rate, with 18 household (36.7%) living below poverty.
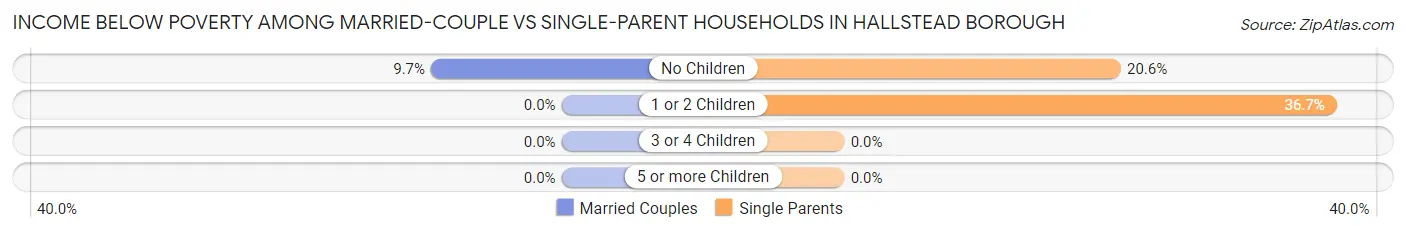
| Children | Married-Couple Families | Single-Parent Households |
| No Children | 11 (9.7%) | 7 (20.6%) |
| 1 or 2 Children | 0 (0.0%) | 18 (36.7%) |
| 3 or 4 Children | 0 (0.0%) | 0 (0.0%) |
| 5 or more Children | 0 (0.0%) | 0 (0.0%) |
| Total | 11 (4.9%) | 25 (28.1%) |
Race in Hallstead borough
The most populous races in Hallstead borough are White / Caucasian (1,297 | 96.4%), Two or more Races (34 | 2.5%), and Hispanic or Latino (33 | 2.5%).
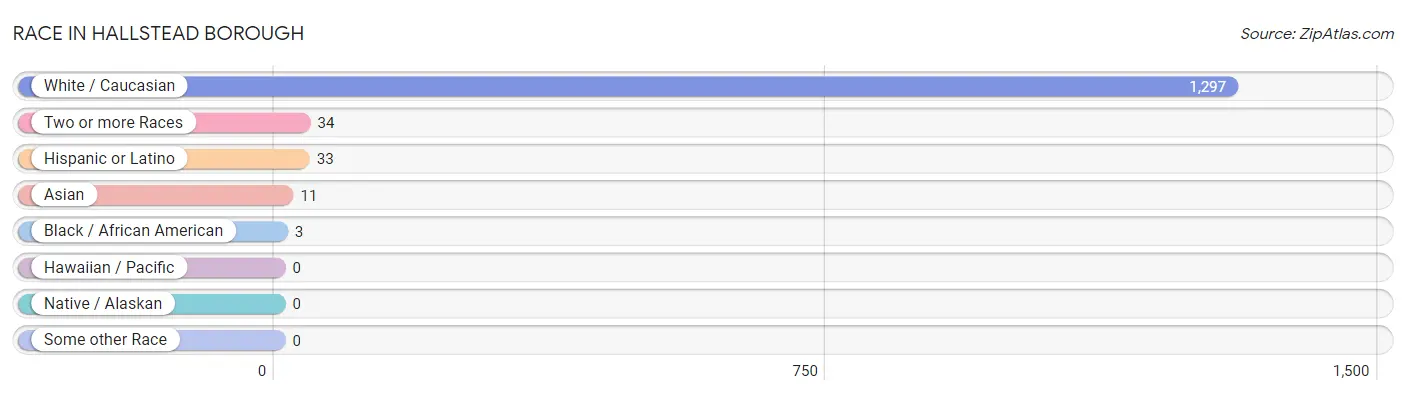
| Race | # Population | % Population |
| Asian | 11 | 0.8% |
| Black / African American | 3 | 0.2% |
| Hawaiian / Pacific | 0 | 0.0% |
| Hispanic or Latino | 33 | 2.5% |
| Native / Alaskan | 0 | 0.0% |
| White / Caucasian | 1,297 | 96.4% |
| Two or more Races | 34 | 2.5% |
| Some other Race | 0 | 0.0% |
| Total | 1,345 | 100.0% |
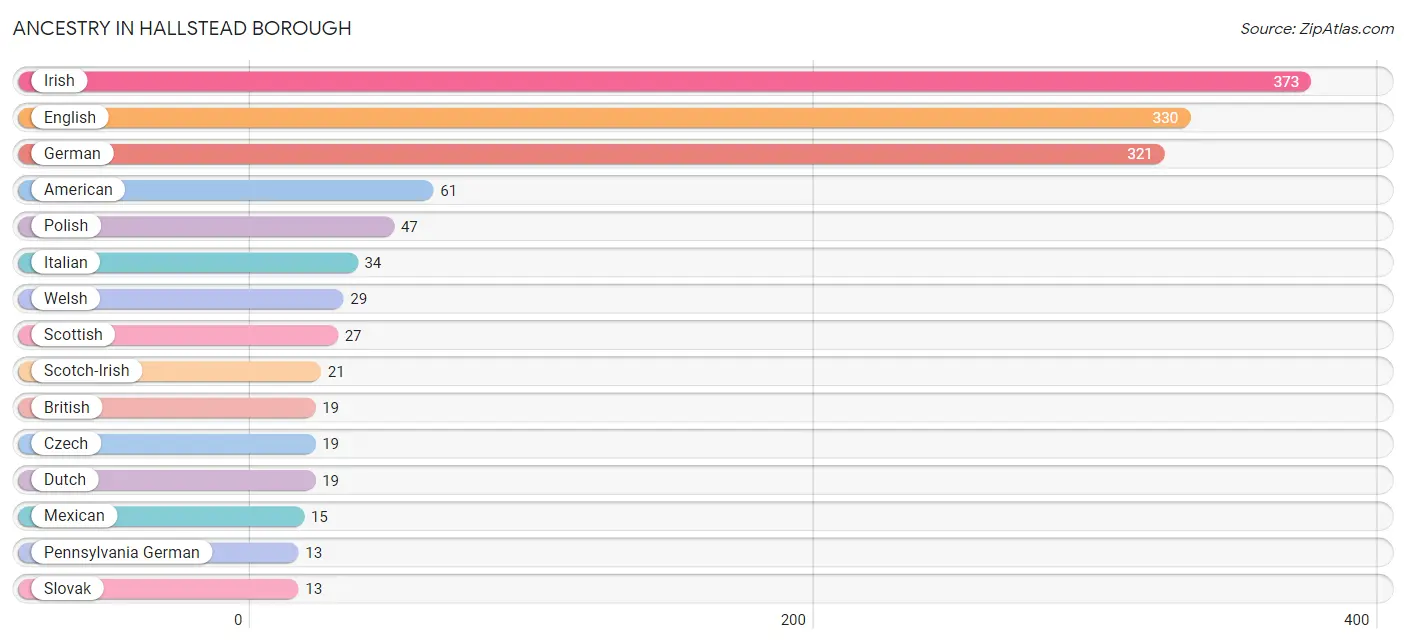
Ancestry in Hallstead borough
The most populous ancestries reported in Hallstead borough are Irish (373 | 27.7%), English (330 | 24.5%), German (321 | 23.9%), American (61 | 4.5%), and Polish (47 | 3.5%), together accounting for 84.2% of all Hallstead borough residents.
| Ancestry | # Population | % Population |
| American | 61 | 4.5% |
| British | 19 | 1.4% |
| Canadian | 11 | 0.8% |
| Cuban | 10 | 0.7% |
| Czech | 19 | 1.4% |
| Czechoslovakian | 3 | 0.2% |
| Dutch | 19 | 1.4% |
| English | 330 | 24.5% |
| French | 9 | 0.7% |
| German | 321 | 23.9% |
| Irish | 373 | 27.7% |
| Iroquois | 1 | 0.1% |
| Italian | 34 | 2.5% |
| Korean | 11 | 0.8% |
| Mexican | 15 | 1.1% |
| Pennsylvania German | 13 | 1.0% |
| Polish | 47 | 3.5% |
| Puerto Rican | 2 | 0.2% |
| Russian | 2 | 0.2% |
| Scandinavian | 3 | 0.2% |
| Scotch-Irish | 21 | 1.6% |
| Scottish | 27 | 2.0% |
| Slovak | 13 | 1.0% |
| Spanish | 6 | 0.4% |
| Subsaharan African | 9 | 0.7% |
| Swedish | 7 | 0.5% |
| Welsh | 29 | 2.2% | View All 27 Rows |
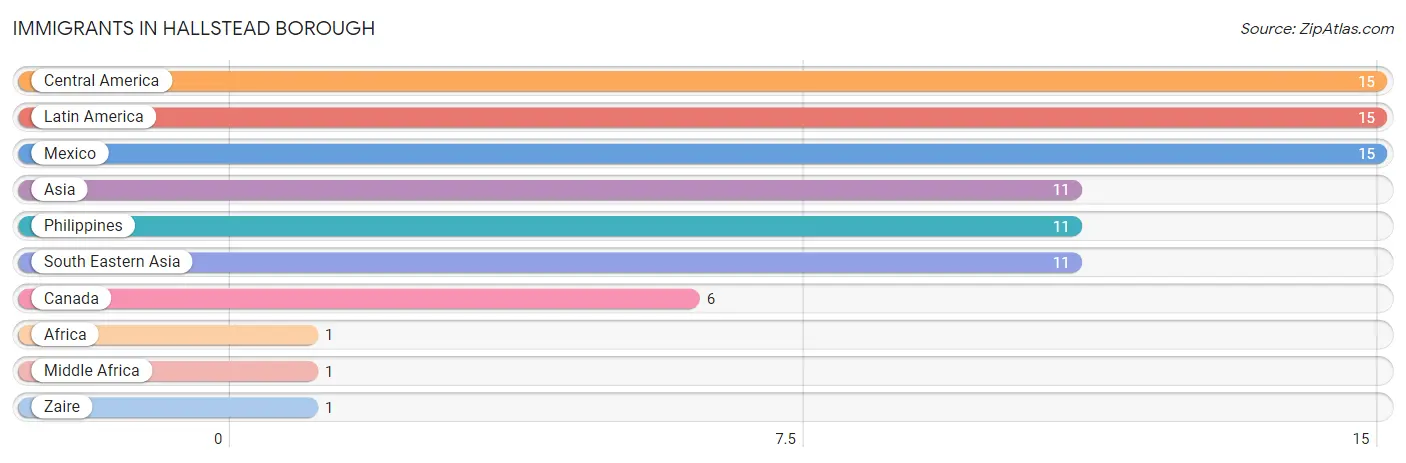
Immigrants in Hallstead borough
The most numerous immigrant groups reported in Hallstead borough came from Central America (15 | 1.1%), Latin America (15 | 1.1%), Mexico (15 | 1.1%), Asia (11 | 0.8%), and Philippines (11 | 0.8%), together accounting for 5.0% of all Hallstead borough residents.
| Immigration Origin | # Population | % Population |
| Africa | 1 | 0.1% |
| Asia | 11 | 0.8% |
| Canada | 6 | 0.4% |
| Central America | 15 | 1.1% |
| Latin America | 15 | 1.1% |
| Mexico | 15 | 1.1% |
| Middle Africa | 1 | 0.1% |
| Philippines | 11 | 0.8% |
| South Eastern Asia | 11 | 0.8% |
| Zaire | 1 | 0.1% | View All 10 Rows |
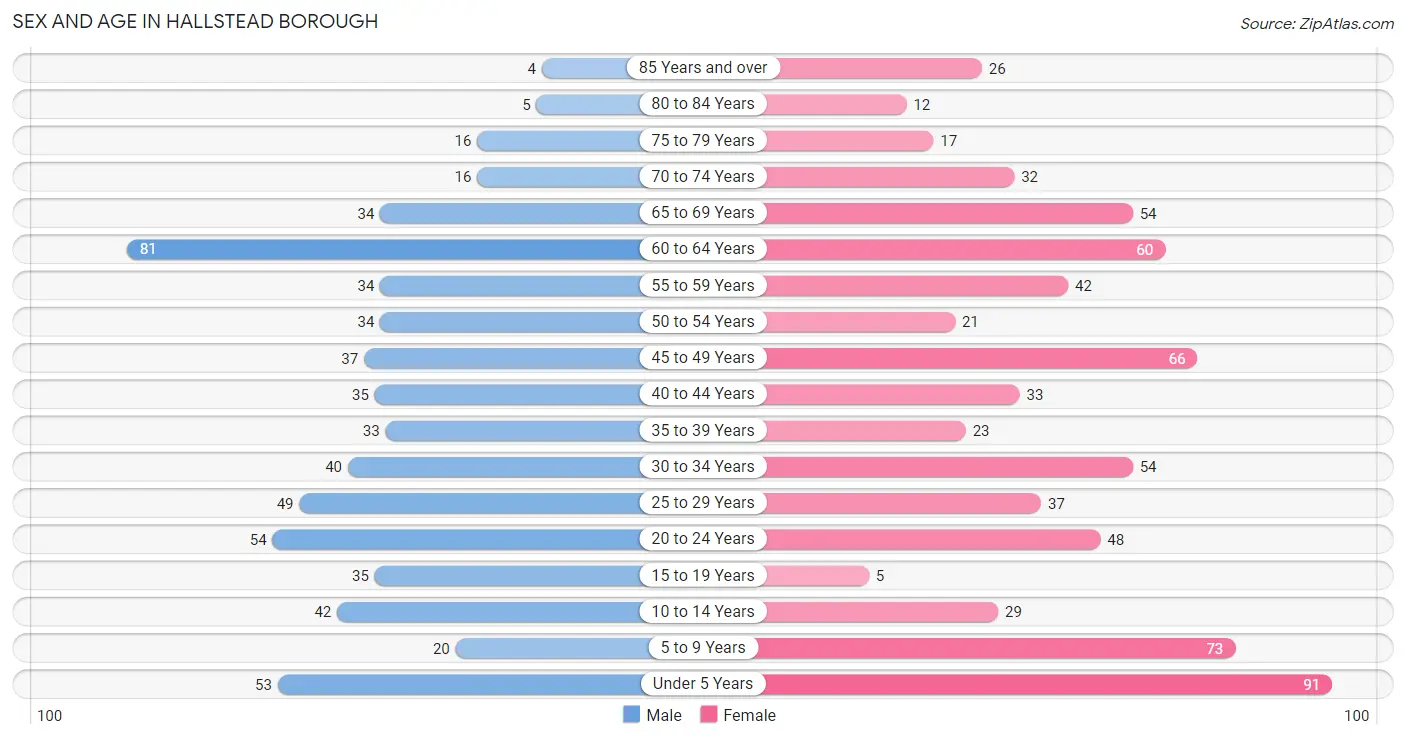
Sex and Age in Hallstead borough
Sex and Age in Hallstead borough
The most populous age groups in Hallstead borough are 60 to 64 Years (81 | 13.0%) for men and Under 5 Years (91 | 12.6%) for women.
| Age Bracket | Male | Female |
| Under 5 Years | 53 (8.5%) | 91 (12.6%) |
| 5 to 9 Years | 20 (3.2%) | 73 (10.1%) |
| 10 to 14 Years | 42 (6.8%) | 29 (4.0%) |
| 15 to 19 Years | 35 (5.6%) | 5 (0.7%) |
| 20 to 24 Years | 54 (8.7%) | 48 (6.6%) |
| 25 to 29 Years | 49 (7.9%) | 37 (5.1%) |
| 30 to 34 Years | 40 (6.4%) | 54 (7.5%) |
| 35 to 39 Years | 33 (5.3%) | 23 (3.2%) |
| 40 to 44 Years | 35 (5.6%) | 33 (4.6%) |
| 45 to 49 Years | 37 (5.9%) | 66 (9.1%) |
| 50 to 54 Years | 34 (5.5%) | 21 (2.9%) |
| 55 to 59 Years | 34 (5.5%) | 42 (5.8%) |
| 60 to 64 Years | 81 (13.0%) | 60 (8.3%) |
| 65 to 69 Years | 34 (5.5%) | 54 (7.5%) |
| 70 to 74 Years | 16 (2.6%) | 32 (4.4%) |
| 75 to 79 Years | 16 (2.6%) | 17 (2.4%) |
| 80 to 84 Years | 5 (0.8%) | 12 (1.7%) |
| 85 Years and over | 4 (0.6%) | 26 (3.6%) |
| Total | 622 (100.0%) | 723 (100.0%) |
Families and Households in Hallstead borough
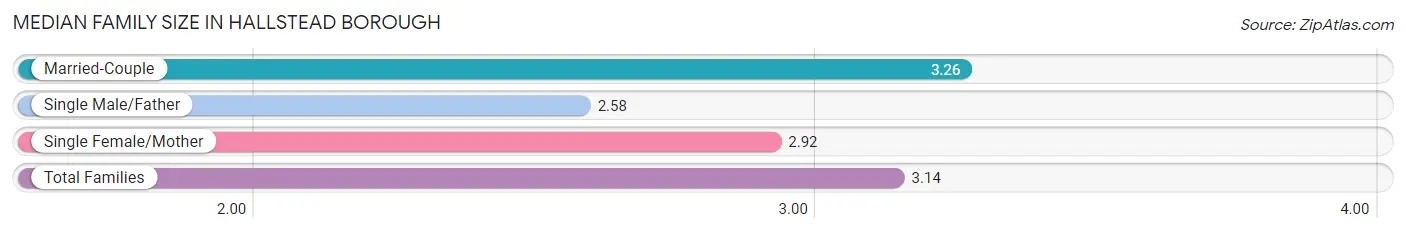
Median Family Size in Hallstead borough
The median family size in Hallstead borough is 3.14 persons per family, with married-couple families (225 | 71.7%) accounting for the largest median family size of 3.26 persons per family. On the other hand, single male/father families (26 | 8.3%) represent the smallest median family size with 2.58 persons per family.
| Family Type | # Families | Family Size |
| Married-Couple | 225 (71.7%) | 3.26 |
| Single Male/Father | 26 (8.3%) | 2.58 |
| Single Female/Mother | 63 (20.1%) | 2.92 |
| Total Families | 314 (100.0%) | 3.14 |
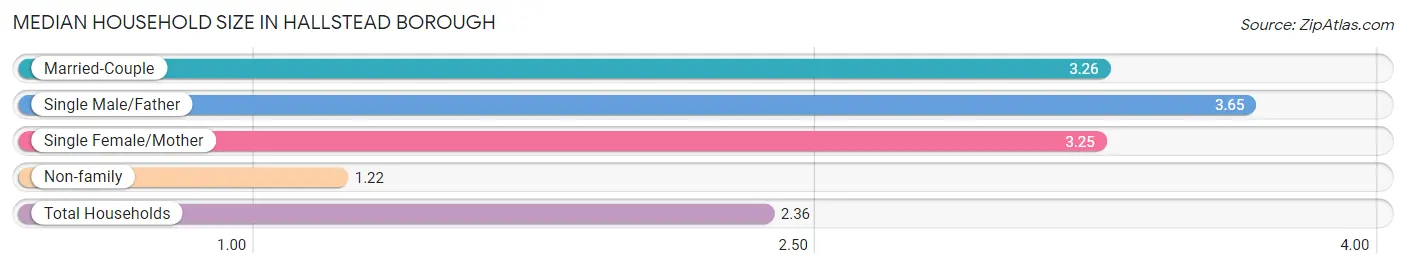
Median Household Size in Hallstead borough
The median household size in Hallstead borough is 2.36 persons per household, with single male/father households (26 | 4.6%) accounting for the largest median household size of 3.65 persons per household. non-family households (255 | 44.8%) represent the smallest median household size with 1.22 persons per household.
| Household Type | # Households | Household Size |
| Married-Couple | 225 (39.5%) | 3.26 |
| Single Male/Father | 26 (4.6%) | 3.65 |
| Single Female/Mother | 63 (11.1%) | 3.25 |
| Non-family | 255 (44.8%) | 1.22 |
| Total Households | 569 (100.0%) | 2.36 |
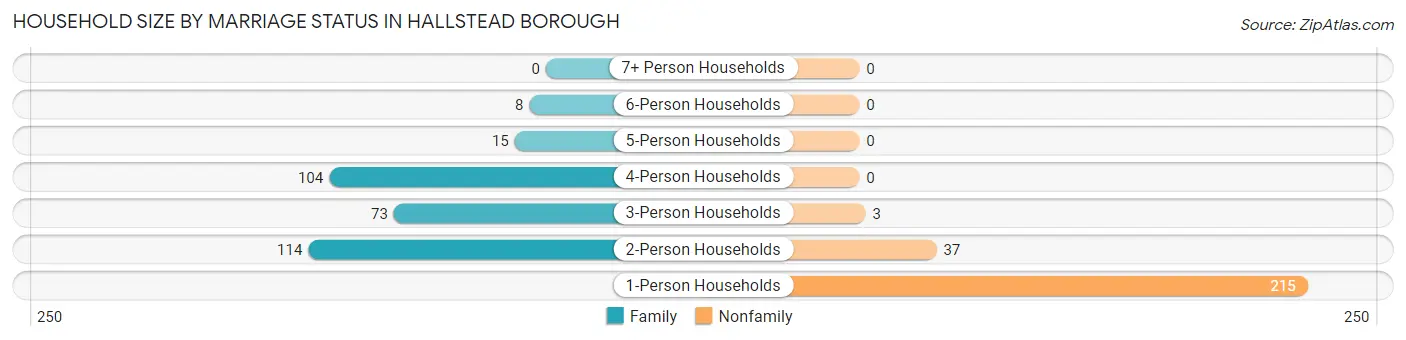
Household Size by Marriage Status in Hallstead borough
Out of a total of 569 households in Hallstead borough, 314 (55.2%) are family households, while 255 (44.8%) are nonfamily households. The most numerous type of family households are 2-person households, comprising 114, and the most common type of nonfamily households are 1-person households, comprising 215.
| Household Size | Family Households | Nonfamily Households |
| 1-Person Households | - | 215 (37.8%) |
| 2-Person Households | 114 (20.0%) | 37 (6.5%) |
| 3-Person Households | 73 (12.8%) | 3 (0.5%) |
| 4-Person Households | 104 (18.3%) | 0 (0.0%) |
| 5-Person Households | 15 (2.6%) | 0 (0.0%) |
| 6-Person Households | 8 (1.4%) | 0 (0.0%) |
| 7+ Person Households | 0 (0.0%) | 0 (0.0%) |
| Total | 314 (55.2%) | 255 (44.8%) |
Female Fertility in Hallstead borough
Fertility by Age in Hallstead borough
Average fertility rate in Hallstead borough is 116.0 births per 1,000 women. Women in the age bracket of 20 to 34 years have the highest fertility rate with 230.0 births per 1,000 women. Women in the age bracket of 20 to 34 years acount for 100.0% of all women with births.
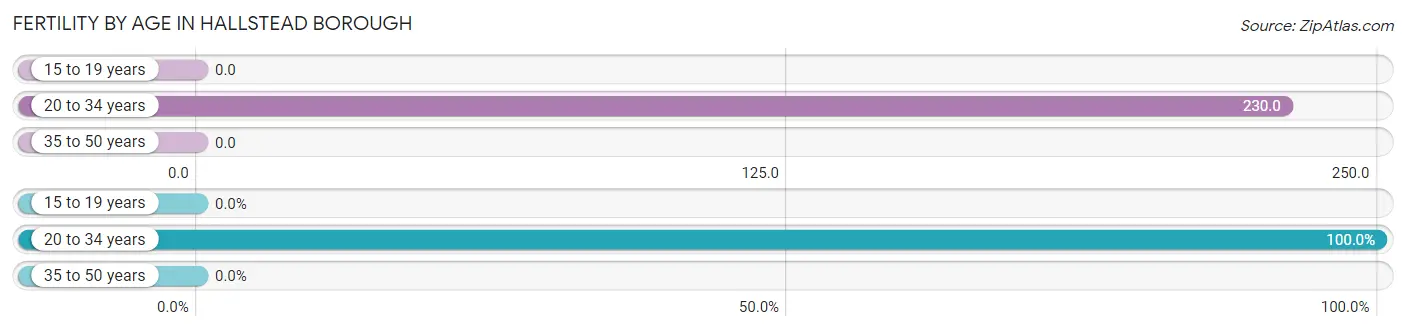
| Age Bracket | Women with Births | Births / 1,000 Women |
| 15 to 19 years | 0 (0.0%) | 0.0 |
| 20 to 34 years | 32 (100.0%) | 230.0 |
| 35 to 50 years | 0 (0.0%) | 0.0 |
| Total | 32 (100.0%) | 116.0 |
Fertility by Age by Marriage Status in Hallstead borough
93.8% of women with births (32) in Hallstead borough are married. The highest percentage of unmarried women with births falls into 20 to 34 years age bracket with 6.2% of them unmarried at the time of birth, while the lowest percentage of unmarried women with births belong to 20 to 34 years age bracket with 6.2% of them unmarried.
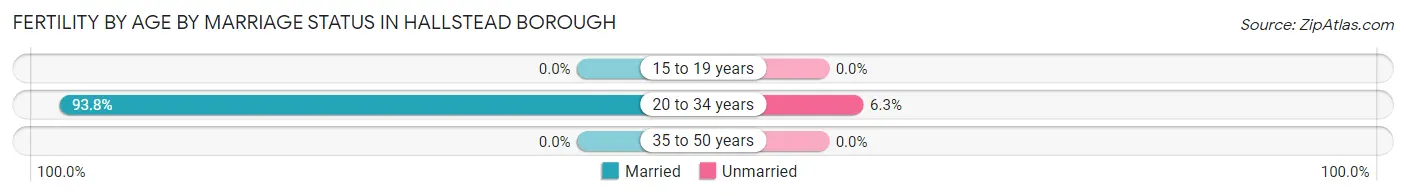
| Age Bracket | Married | Unmarried |
| 15 to 19 years | 0 (0.0%) | 0 (0.0%) |
| 20 to 34 years | 30 (93.8%) | 2 (6.2%) |
| 35 to 50 years | 0 (0.0%) | 0 (0.0%) |
| Total | 30 (93.8%) | 2 (6.2%) |
Fertility by Education in Hallstead borough
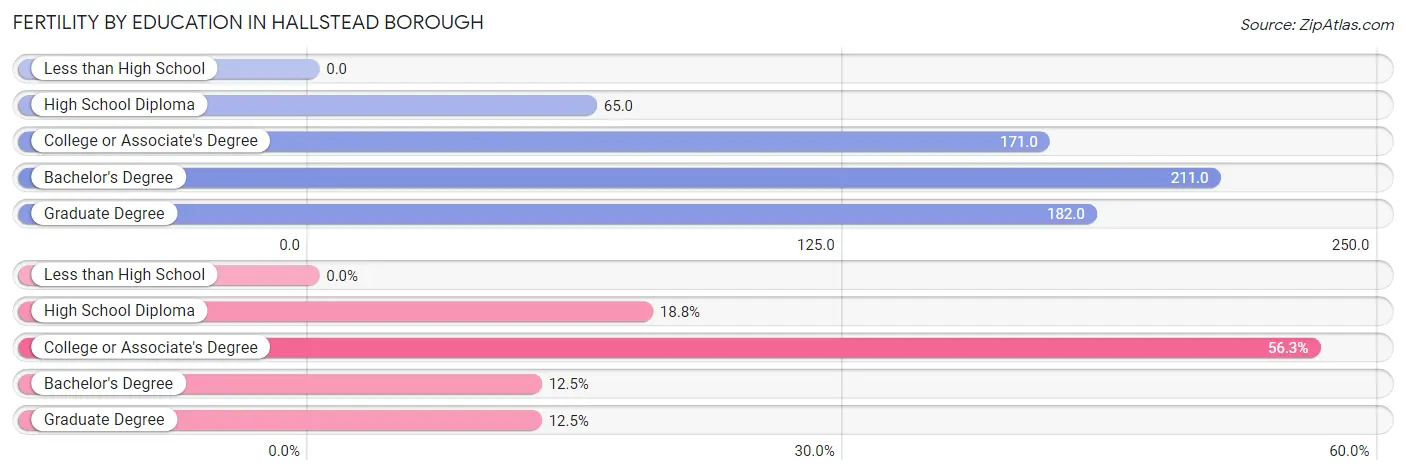
| Educational Attainment | Women with Births | Births / 1,000 Women |
| Less than High School | 0 (0.0%) | 0.0 |
| High School Diploma | 6 (18.8%) | 65.0 |
| College or Associate's Degree | 18 (56.2%) | 171.0 |
| Bachelor's Degree | 4 (12.5%) | 211.0 |
| Graduate Degree | 4 (12.5%) | 182.0 |
| Total | 32 (100.0%) | 116.0 |
Fertility by Education by Marriage Status in Hallstead borough
6.2% of women with births in Hallstead borough are unmarried. Women with the educational attainment of college or associate's degree are most likely to be married with 100.0% of them married at childbirth, while women with the educational attainment of high school diploma are least likely to be married with 33.3% of them unmarried at childbirth.
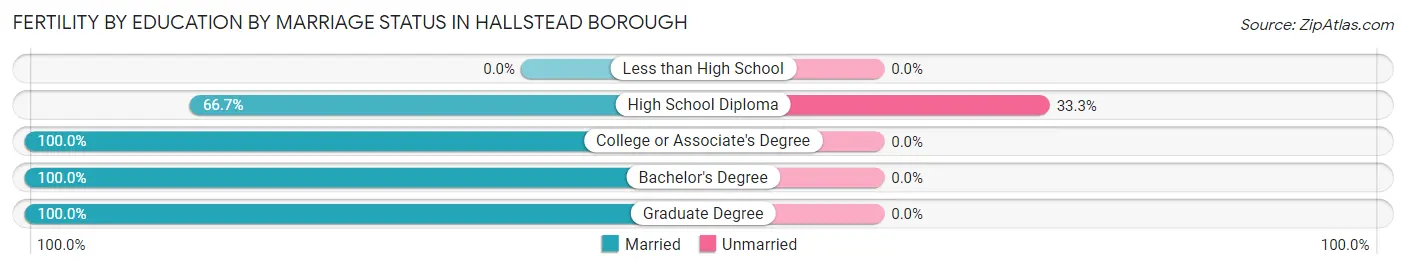
| Educational Attainment | Married | Unmarried |
| Less than High School | 0 (0.0%) | 0 (0.0%) |
| High School Diploma | 4 (66.7%) | 2 (33.3%) |
| College or Associate's Degree | 18 (100.0%) | 0 (0.0%) |
| Bachelor's Degree | 4 (100.0%) | 0 (0.0%) |
| Graduate Degree | 4 (100.0%) | 0 (0.0%) |
| Total | 30 (93.8%) | 2 (6.2%) |
Employment Characteristics in Hallstead borough
Employment by Class of Employer in Hallstead borough
Among the 543 employed individuals in Hallstead borough, private company employees (402 | 74.0%), not-for-profit organizations (69 | 12.7%), and local government employees (37 | 6.8%) make up the most common classes of employment.
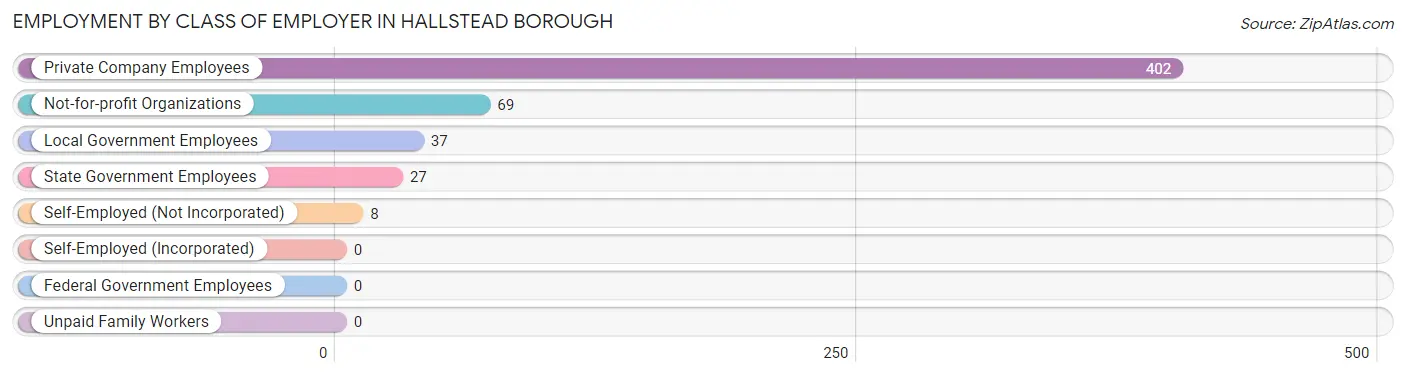
| Employer Class | # Employees | % Employees |
| Private Company Employees | 402 | 74.0% |
| Self-Employed (Incorporated) | 0 | 0.0% |
| Self-Employed (Not Incorporated) | 8 | 1.5% |
| Not-for-profit Organizations | 69 | 12.7% |
| Local Government Employees | 37 | 6.8% |
| State Government Employees | 27 | 5.0% |
| Federal Government Employees | 0 | 0.0% |
| Unpaid Family Workers | 0 | 0.0% |
| Total | 543 | 100.0% |
Employment Status by Age in Hallstead borough
According to the labor force statistics for Hallstead borough, out of the total population over 16 years of age (1,030), 55.8% or 575 individuals are in the labor force, with 5.6% or 32 of them unemployed. The age group with the highest labor force participation rate is 25 to 29 years, with 84.9% or 73 individuals in the labor force. Within the labor force, the 75 years and over age range has the highest percentage of unemployed individuals, with 100.0% or 3 of them being unemployed.
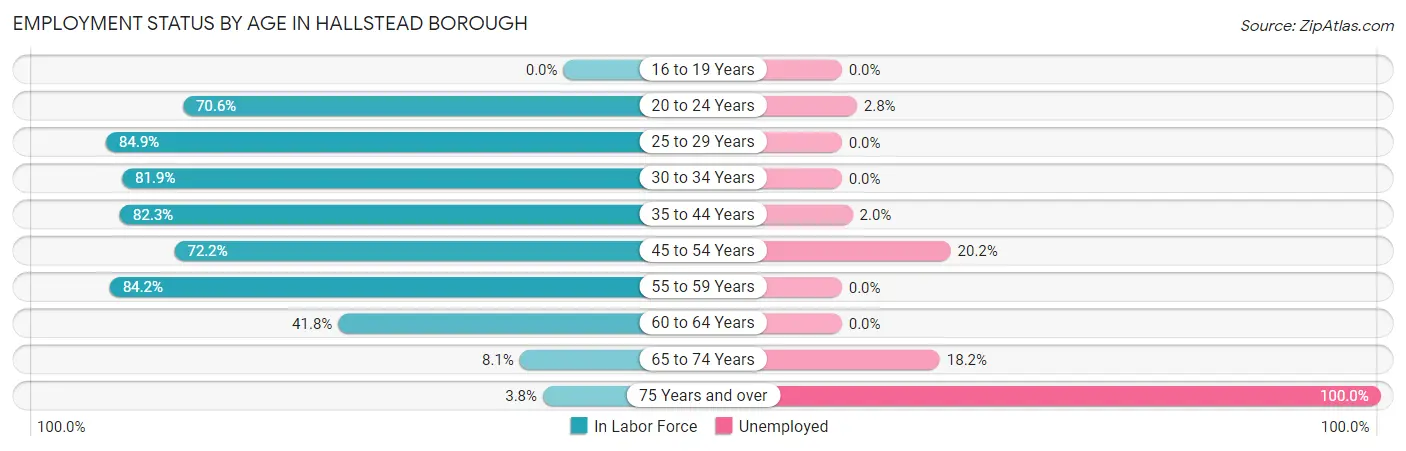
| Age Bracket | In Labor Force | Unemployed |
| 16 to 19 Years | 0 (0.0%) | 0 (0.0%) |
| 20 to 24 Years | 72 (70.6%) | 2 (2.8%) |
| 25 to 29 Years | 73 (84.9%) | 0 (0.0%) |
| 30 to 34 Years | 77 (81.9%) | 0 (0.0%) |
| 35 to 44 Years | 102 (82.3%) | 2 (2.0%) |
| 45 to 54 Years | 114 (72.2%) | 23 (20.2%) |
| 55 to 59 Years | 64 (84.2%) | 0 (0.0%) |
| 60 to 64 Years | 59 (41.8%) | 0 (0.0%) |
| 65 to 74 Years | 11 (8.1%) | 2 (18.2%) |
| 75 Years and over | 3 (3.8%) | 3 (100.0%) |
| Total | 575 (55.8%) | 32 (5.6%) |
Employment Status by Educational Attainment in Hallstead borough
According to labor force statistics for Hallstead borough, 72.0% of individuals (489) out of the total population between 25 and 64 years of age (679) are in the labor force, with 5.1% or 25 of them being unemployed. The group with the highest labor force participation rate are those with the educational attainment of bachelor's degree or higher, with 85.3% or 87 individuals in the labor force. Within the labor force, individuals with less than high school education have the highest percentage of unemployment, with 29.2% or 7 of them being unemployed.
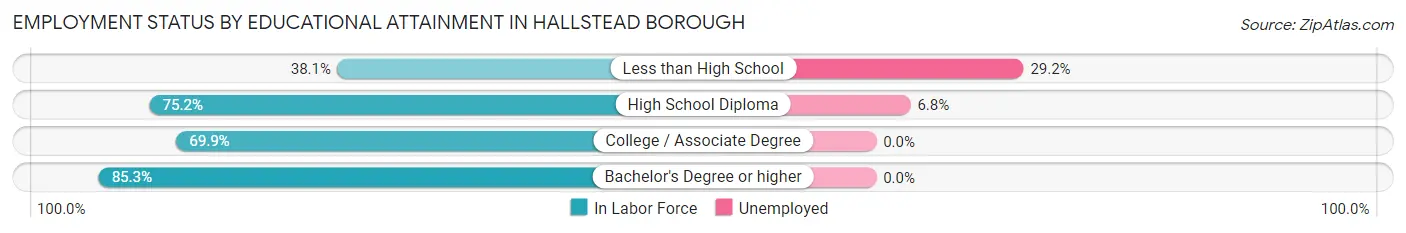
| Educational Attainment | In Labor Force | Unemployed |
| Less than High School | 24 (38.1%) | 18 (29.2%) |
| High School Diploma | 264 (75.2%) | 24 (6.8%) |
| College / Associate Degree | 114 (69.9%) | 0 (0.0%) |
| Bachelor's Degree or higher | 87 (85.3%) | 0 (0.0%) |
| Total | 489 (72.0%) | 35 (5.1%) |
Employment Occupations by Sex in Hallstead borough
Management, Business, Science and Arts Occupations
The most common Management, Business, Science and Arts occupations in Hallstead borough are Community & Social Service (61 | 11.2%), Management (51 | 9.4%), Education Instruction & Library (38 | 7.0%), Computers, Engineering & Science (21 | 3.9%), and Health Diagnosing & Treating (20 | 3.7%).
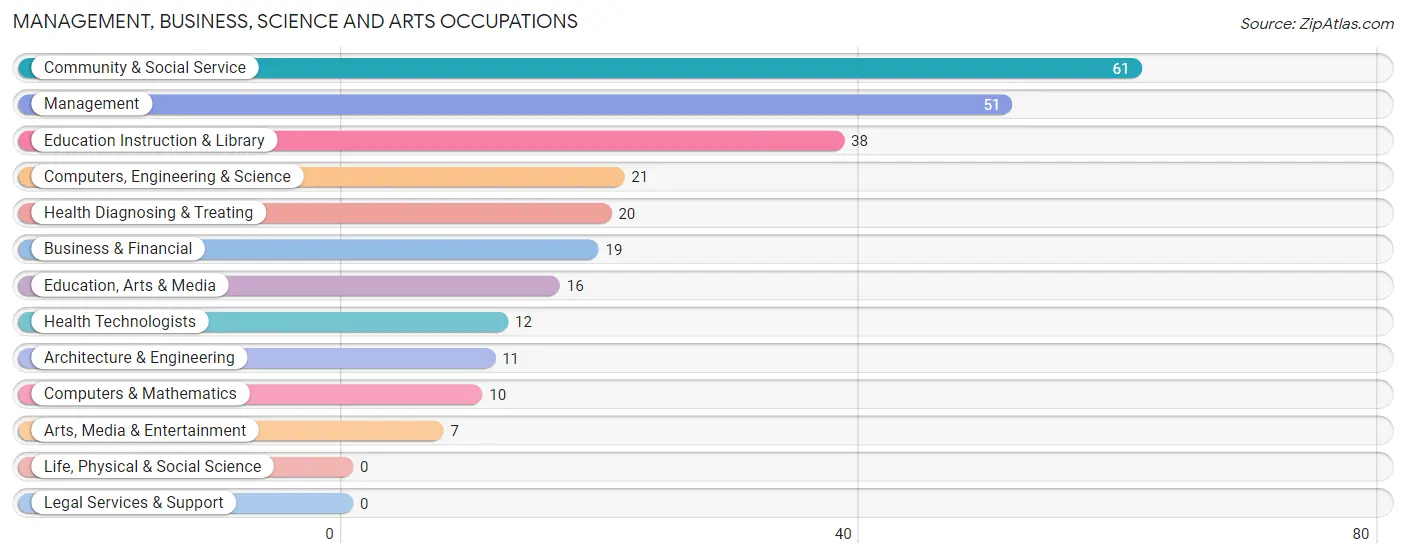
Management, Business, Science and Arts Occupations by Sex
Within the Management, Business, Science and Arts occupations in Hallstead borough, the most male-oriented occupations are Architecture & Engineering (100.0%), Computers, Engineering & Science (76.2%), and Education, Arts & Media (62.5%), while the most female-oriented occupations are Arts, Media & Entertainment (100.0%), Education Instruction & Library (92.1%), and Management (80.4%).
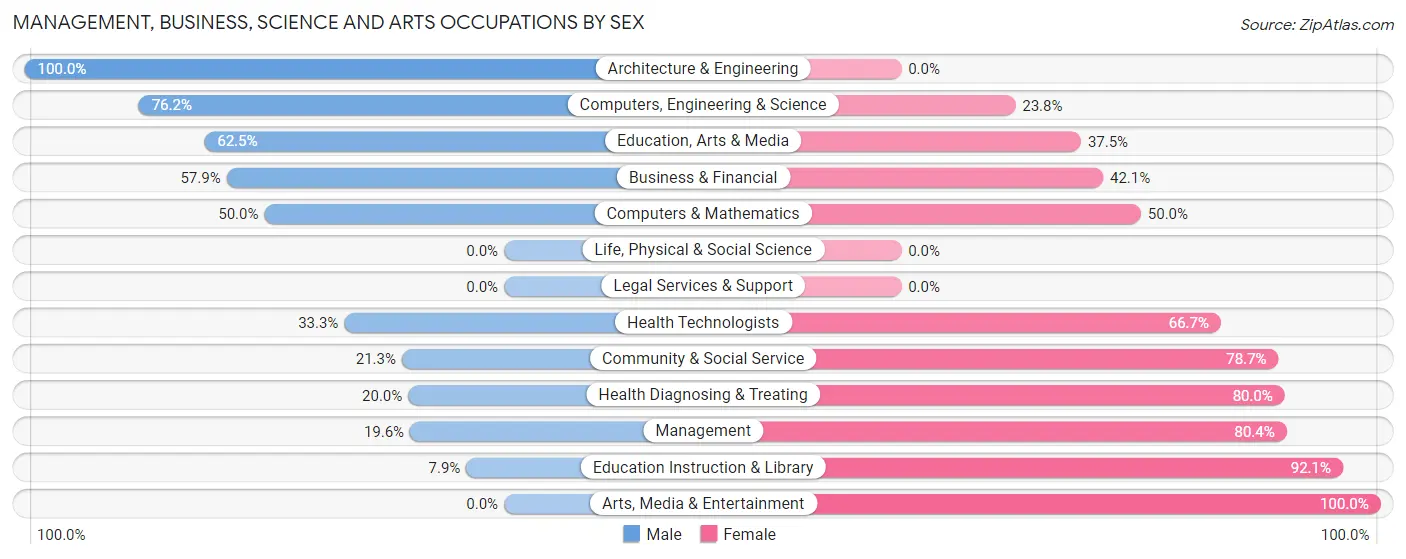
| Occupation | Male | Female |
| Management | 10 (19.6%) | 41 (80.4%) |
| Business & Financial | 11 (57.9%) | 8 (42.1%) |
| Computers, Engineering & Science | 16 (76.2%) | 5 (23.8%) |
| Computers & Mathematics | 5 (50.0%) | 5 (50.0%) |
| Architecture & Engineering | 11 (100.0%) | 0 (0.0%) |
| Life, Physical & Social Science | 0 (0.0%) | 0 (0.0%) |
| Community & Social Service | 13 (21.3%) | 48 (78.7%) |
| Education, Arts & Media | 10 (62.5%) | 6 (37.5%) |
| Legal Services & Support | 0 (0.0%) | 0 (0.0%) |
| Education Instruction & Library | 3 (7.9%) | 35 (92.1%) |
| Arts, Media & Entertainment | 0 (0.0%) | 7 (100.0%) |
| Health Diagnosing & Treating | 4 (20.0%) | 16 (80.0%) |
| Health Technologists | 4 (33.3%) | 8 (66.7%) |
| Total (Category) | 54 (31.4%) | 118 (68.6%) |
| Total (Overall) | 289 (53.2%) | 254 (46.8%) |
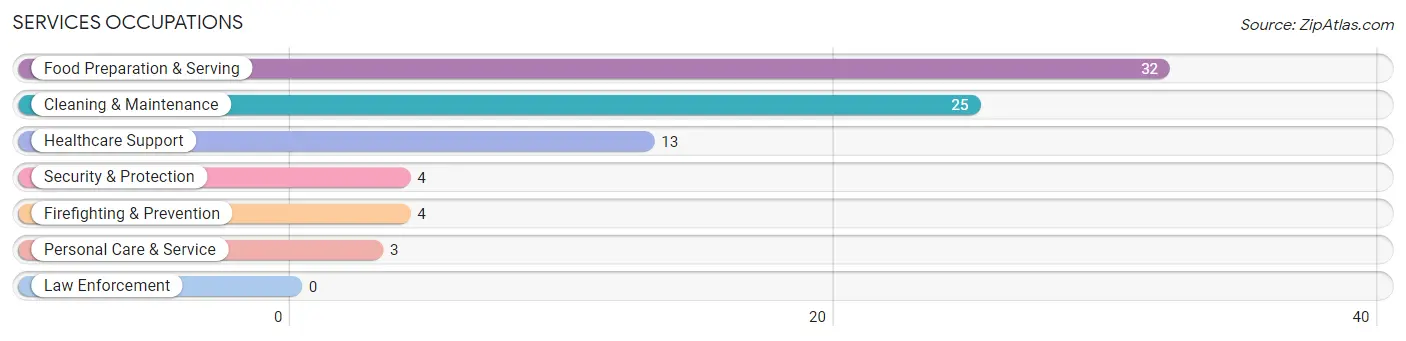
Services Occupations
The most common Services occupations in Hallstead borough are Food Preparation & Serving (32 | 5.9%), Cleaning & Maintenance (25 | 4.6%), Healthcare Support (13 | 2.4%), Security & Protection (4 | 0.7%), and Firefighting & Prevention (4 | 0.7%).
Services Occupations by Sex
Within the Services occupations in Hallstead borough, the most male-oriented occupations are Security & Protection (100.0%), Firefighting & Prevention (100.0%), and Cleaning & Maintenance (52.0%), while the most female-oriented occupations are Healthcare Support (100.0%), Personal Care & Service (100.0%), and Food Preparation & Serving (75.0%).
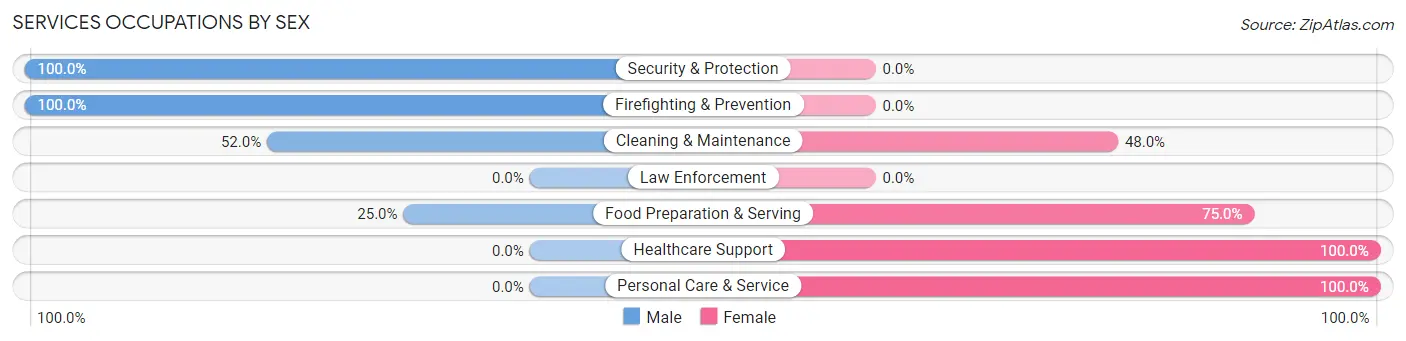
| Occupation | Male | Female |
| Healthcare Support | 0 (0.0%) | 13 (100.0%) |
| Security & Protection | 4 (100.0%) | 0 (0.0%) |
| Firefighting & Prevention | 4 (100.0%) | 0 (0.0%) |
| Law Enforcement | 0 (0.0%) | 0 (0.0%) |
| Food Preparation & Serving | 8 (25.0%) | 24 (75.0%) |
| Cleaning & Maintenance | 13 (52.0%) | 12 (48.0%) |
| Personal Care & Service | 0 (0.0%) | 3 (100.0%) |
| Total (Category) | 25 (32.5%) | 52 (67.5%) |
| Total (Overall) | 289 (53.2%) | 254 (46.8%) |
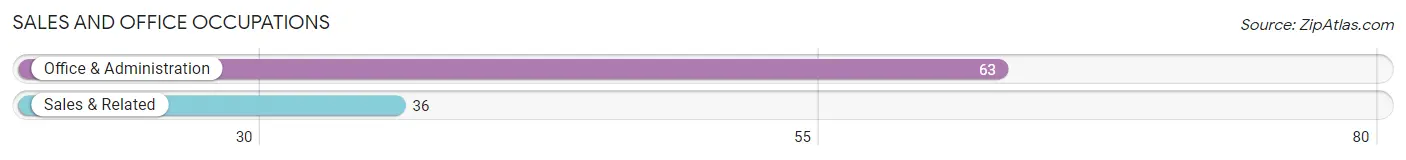
Sales and Office Occupations
The most common Sales and Office occupations in Hallstead borough are Office & Administration (63 | 11.6%), and Sales & Related (36 | 6.6%).
Sales and Office Occupations by Sex
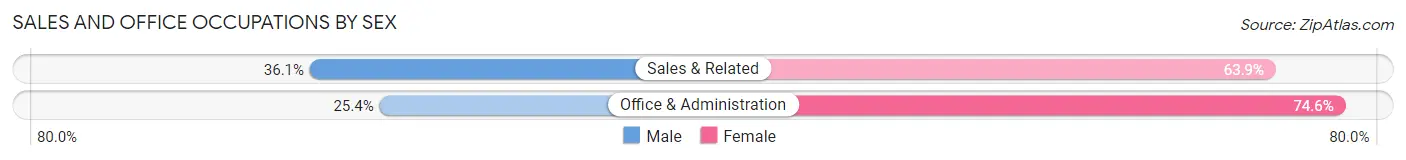
| Occupation | Male | Female |
| Sales & Related | 13 (36.1%) | 23 (63.9%) |
| Office & Administration | 16 (25.4%) | 47 (74.6%) |
| Total (Category) | 29 (29.3%) | 70 (70.7%) |
| Total (Overall) | 289 (53.2%) | 254 (46.8%) |
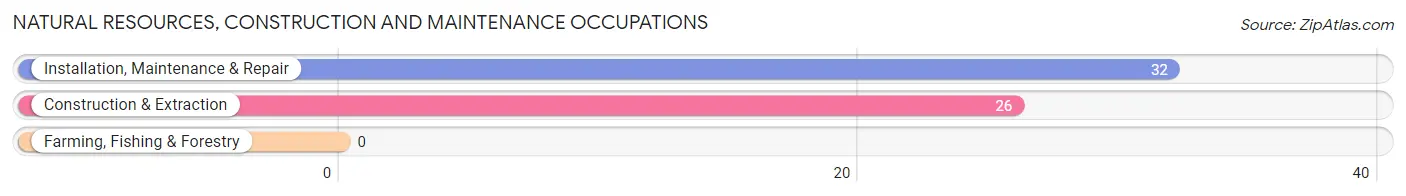
Natural Resources, Construction and Maintenance Occupations
The most common Natural Resources, Construction and Maintenance occupations in Hallstead borough are Installation, Maintenance & Repair (32 | 5.9%), and Construction & Extraction (26 | 4.8%).
Natural Resources, Construction and Maintenance Occupations by Sex
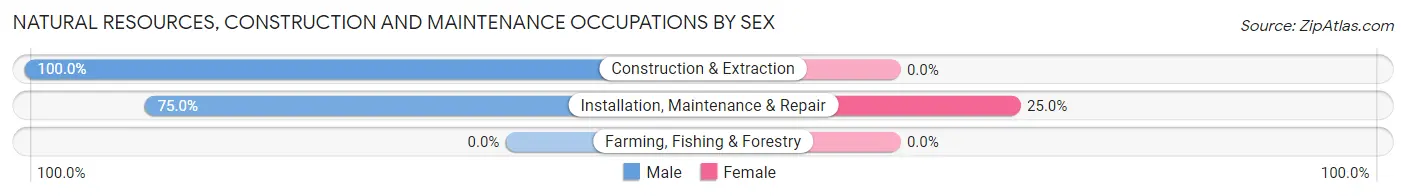
| Occupation | Male | Female |
| Farming, Fishing & Forestry | 0 (0.0%) | 0 (0.0%) |
| Construction & Extraction | 26 (100.0%) | 0 (0.0%) |
| Installation, Maintenance & Repair | 24 (75.0%) | 8 (25.0%) |
| Total (Category) | 50 (86.2%) | 8 (13.8%) |
| Total (Overall) | 289 (53.2%) | 254 (46.8%) |
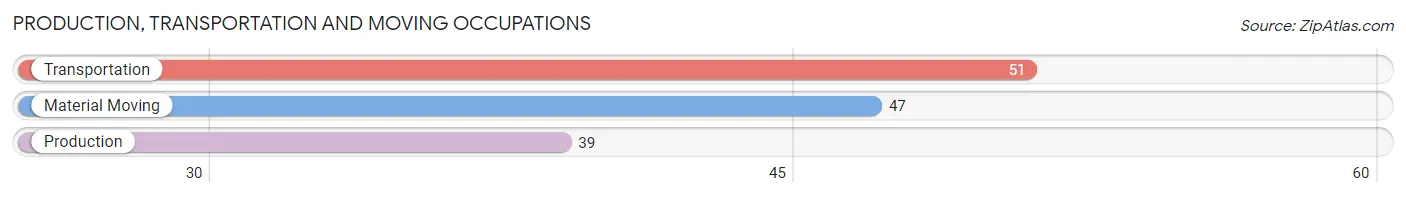
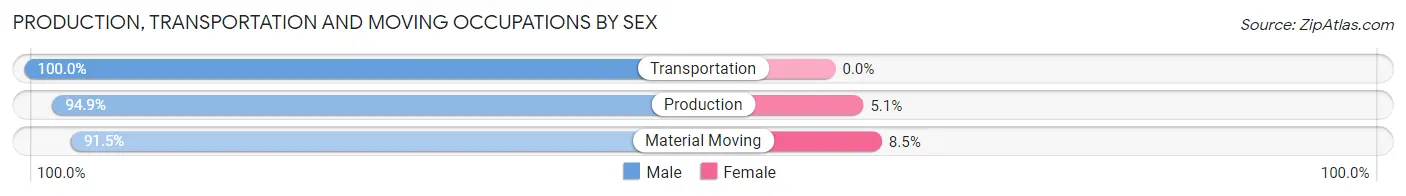
Production, Transportation and Moving Occupations
The most common Production, Transportation and Moving occupations in Hallstead borough are Transportation (51 | 9.4%), Material Moving (47 | 8.7%), and Production (39 | 7.2%).
Production, Transportation and Moving Occupations by Sex
| Occupation | Male | Female |
| Production | 37 (94.9%) | 2 (5.1%) |
| Transportation | 51 (100.0%) | 0 (0.0%) |
| Material Moving | 43 (91.5%) | 4 (8.5%) |
| Total (Category) | 131 (95.6%) | 6 (4.4%) |
| Total (Overall) | 289 (53.2%) | 254 (46.8%) |
Employment Industries by Sex in Hallstead borough
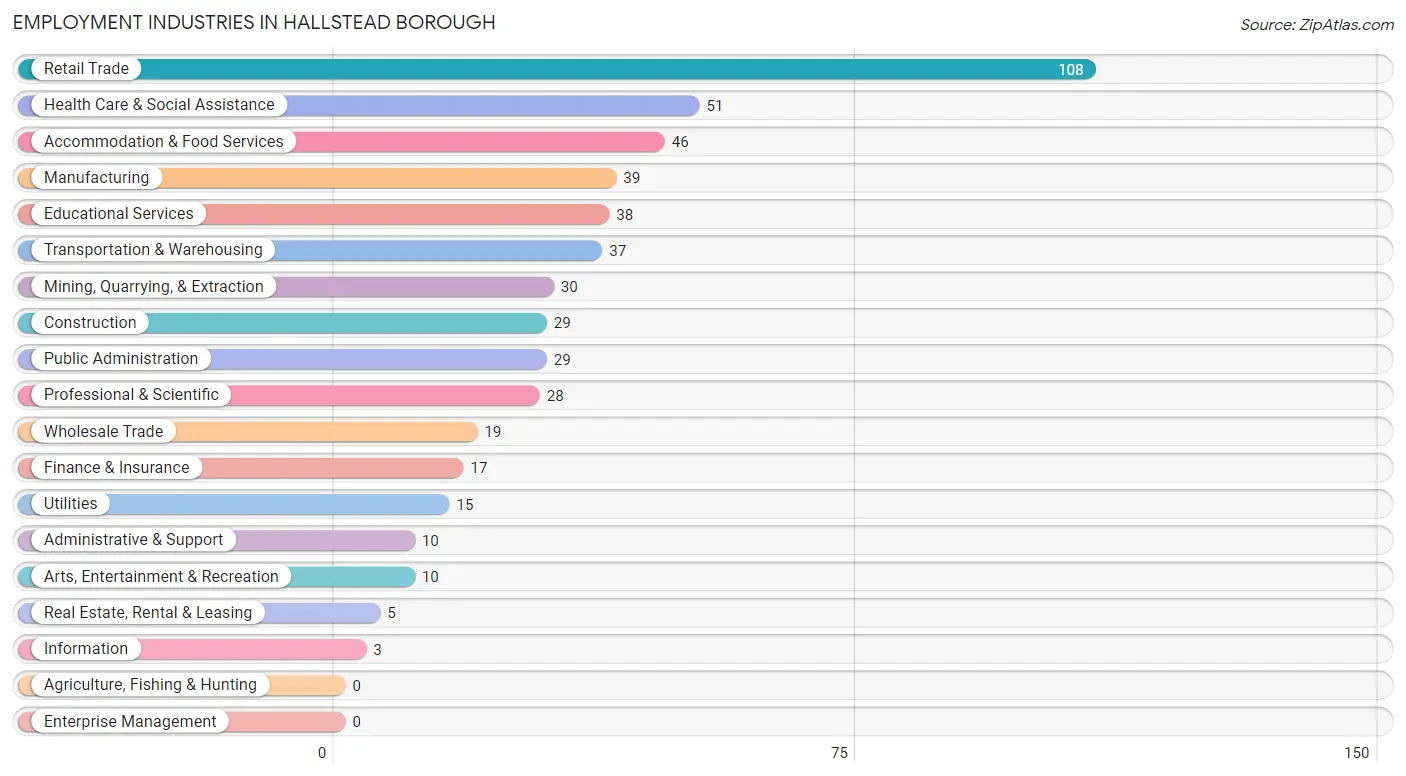
Employment Industries in Hallstead borough
The major employment industries in Hallstead borough include Retail Trade (108 | 19.9%), Health Care & Social Assistance (51 | 9.4%), Accommodation & Food Services (46 | 8.5%), Manufacturing (39 | 7.2%), and Educational Services (38 | 7.0%).
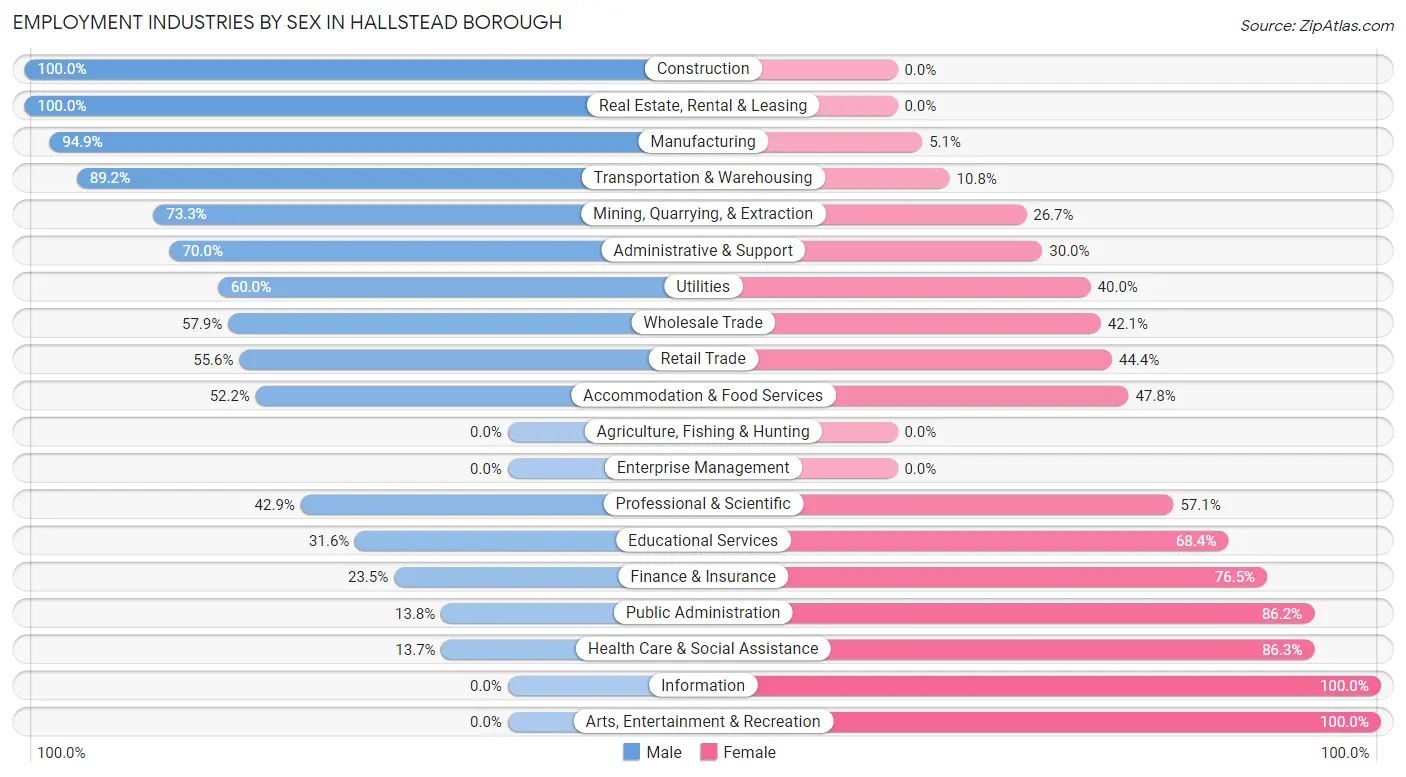
Employment Industries by Sex in Hallstead borough
The Hallstead borough industries that see more men than women are Construction (100.0%), Real Estate, Rental & Leasing (100.0%), and Manufacturing (94.9%), whereas the industries that tend to have a higher number of women are Information (100.0%), Arts, Entertainment & Recreation (100.0%), and Health Care & Social Assistance (86.3%).
| Industry | Male | Female |
| Agriculture, Fishing & Hunting | 0 (0.0%) | 0 (0.0%) |
| Mining, Quarrying, & Extraction | 22 (73.3%) | 8 (26.7%) |
| Construction | 29 (100.0%) | 0 (0.0%) |
| Manufacturing | 37 (94.9%) | 2 (5.1%) |
| Wholesale Trade | 11 (57.9%) | 8 (42.1%) |
| Retail Trade | 60 (55.6%) | 48 (44.4%) |
| Transportation & Warehousing | 33 (89.2%) | 4 (10.8%) |
| Utilities | 9 (60.0%) | 6 (40.0%) |
| Information | 0 (0.0%) | 3 (100.0%) |
| Finance & Insurance | 4 (23.5%) | 13 (76.5%) |
| Real Estate, Rental & Leasing | 5 (100.0%) | 0 (0.0%) |
| Professional & Scientific | 12 (42.9%) | 16 (57.1%) |
| Enterprise Management | 0 (0.0%) | 0 (0.0%) |
| Administrative & Support | 7 (70.0%) | 3 (30.0%) |
| Educational Services | 12 (31.6%) | 26 (68.4%) |
| Health Care & Social Assistance | 7 (13.7%) | 44 (86.3%) |
| Arts, Entertainment & Recreation | 0 (0.0%) | 10 (100.0%) |
| Accommodation & Food Services | 24 (52.2%) | 22 (47.8%) |
| Public Administration | 4 (13.8%) | 25 (86.2%) |
| Total | 289 (53.2%) | 254 (46.8%) |
Education in Hallstead borough
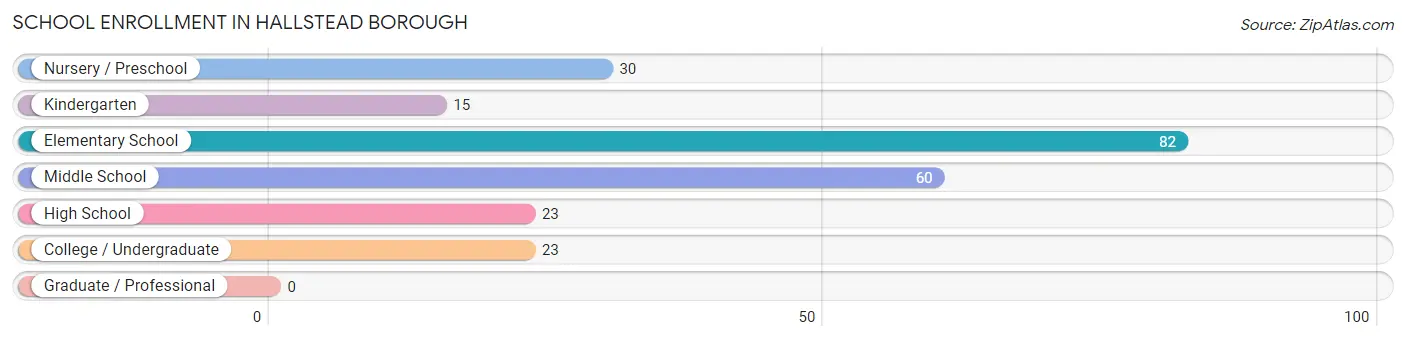
School Enrollment in Hallstead borough
The most common levels of schooling among the 233 students in Hallstead borough are elementary school (82 | 35.2%), middle school (60 | 25.8%), and nursery / preschool (30 | 12.9%).
| School Level | # Students | % Students |
| Nursery / Preschool | 30 | 12.9% |
| Kindergarten | 15 | 6.4% |
| Elementary School | 82 | 35.2% |
| Middle School | 60 | 25.8% |
| High School | 23 | 9.9% |
| College / Undergraduate | 23 | 9.9% |
| Graduate / Professional | 0 | 0.0% |
| Total | 233 | 100.0% |
School Enrollment by Age by Funding Source in Hallstead borough
Out of a total of 233 students who are enrolled in schools in Hallstead borough, 17 (7.3%) attend a private institution, while the remaining 216 (92.7%) are enrolled in public schools. The age group of 20 to 24 year olds has the highest likelihood of being enrolled in private schools, with 11 (100.0% in the age bracket) enrolled. Conversely, the age group of 3 to 4 year olds has the lowest likelihood of being enrolled in a private school, with 25 (100.0% in the age bracket) attending a public institution.
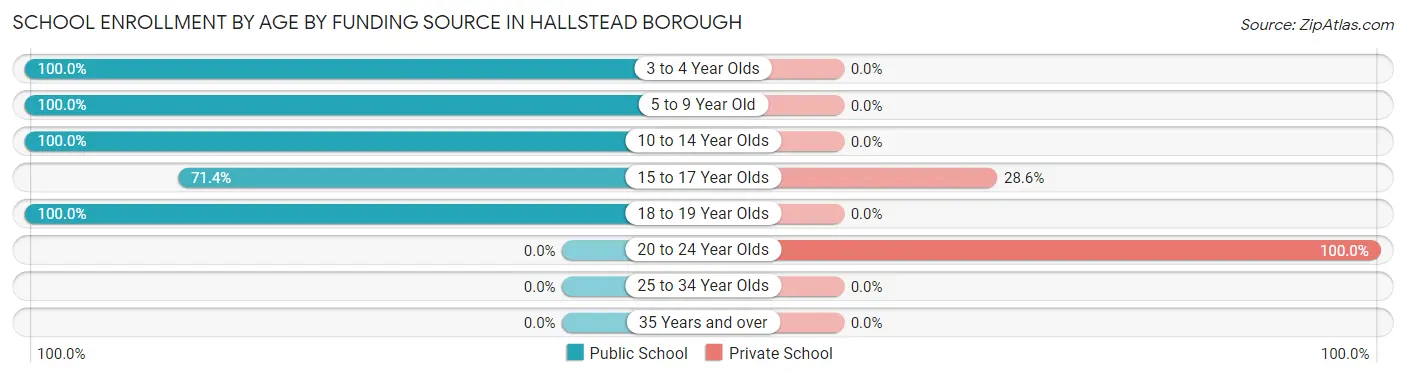
| Age Bracket | Public School | Private School |
| 3 to 4 Year Olds | 25 (100.0%) | 0 (0.0%) |
| 5 to 9 Year Old | 93 (100.0%) | 0 (0.0%) |
| 10 to 14 Year Olds | 71 (100.0%) | 0 (0.0%) |
| 15 to 17 Year Olds | 15 (71.4%) | 6 (28.6%) |
| 18 to 19 Year Olds | 12 (100.0%) | 0 (0.0%) |
| 20 to 24 Year Olds | 0 (0.0%) | 11 (100.0%) |
| 25 to 34 Year Olds | 0 (0.0%) | 0 (0.0%) |
| 35 Years and over | 0 (0.0%) | 0 (0.0%) |
| Total | 216 (92.7%) | 17 (7.3%) |
Educational Attainment by Field of Study in Hallstead borough
Education (48 | 37.8%), science & technology (20 | 15.8%), liberal arts & history (17 | 13.4%), psychology (15 | 11.8%), and business (12 | 9.5%) are the most common fields of study among 127 individuals in Hallstead borough who have obtained a bachelor's degree or higher.
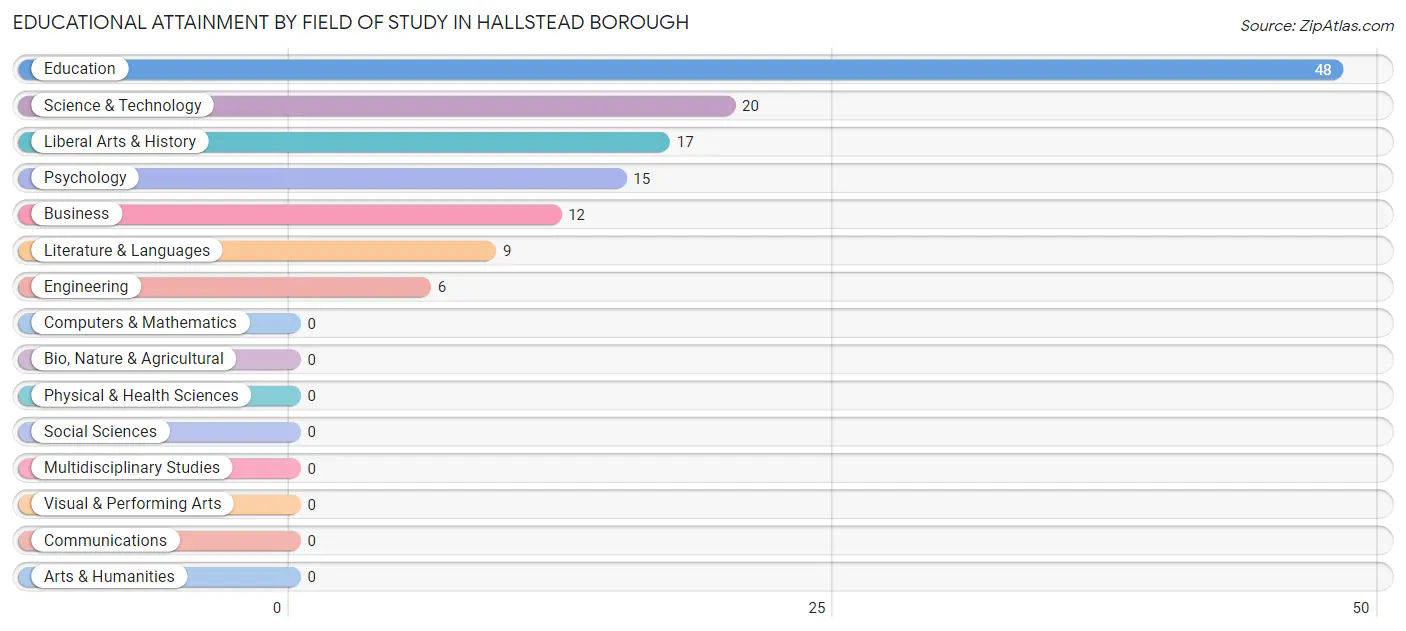
| Field of Study | # Graduates | % Graduates |
| Computers & Mathematics | 0 | 0.0% |
| Bio, Nature & Agricultural | 0 | 0.0% |
| Physical & Health Sciences | 0 | 0.0% |
| Psychology | 15 | 11.8% |
| Social Sciences | 0 | 0.0% |
| Engineering | 6 | 4.7% |
| Multidisciplinary Studies | 0 | 0.0% |
| Science & Technology | 20 | 15.8% |
| Business | 12 | 9.5% |
| Education | 48 | 37.8% |
| Literature & Languages | 9 | 7.1% |
| Liberal Arts & History | 17 | 13.4% |
| Visual & Performing Arts | 0 | 0.0% |
| Communications | 0 | 0.0% |
| Arts & Humanities | 0 | 0.0% |
| Total | 127 | 100.0% |
Transportation & Commute in Hallstead borough
Vehicle Availability by Sex in Hallstead borough
The most prevalent vehicle ownership categories in Hallstead borough are males with 2 vehicles (148, accounting for 51.2%) and females with 2 vehicles (143, making up 58.3%).
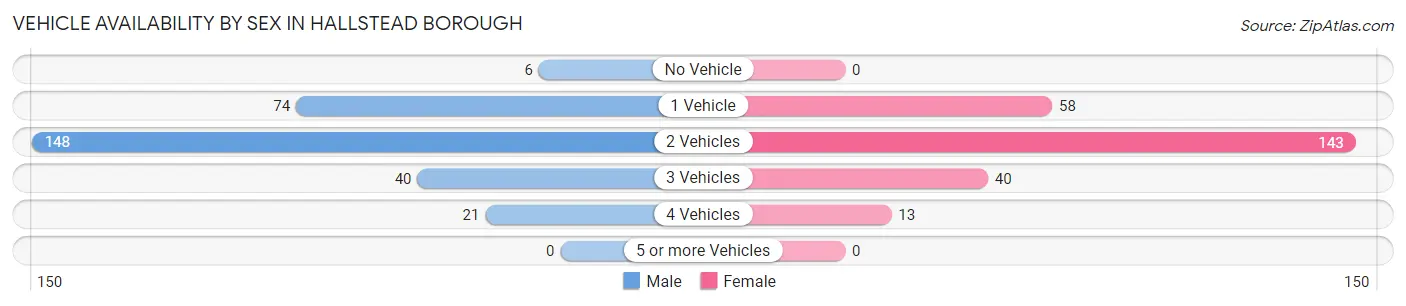
| Vehicles Available | Male | Female |
| No Vehicle | 6 (2.1%) | 0 (0.0%) |
| 1 Vehicle | 74 (25.6%) | 58 (22.8%) |
| 2 Vehicles | 148 (51.2%) | 143 (56.3%) |
| 3 Vehicles | 40 (13.8%) | 40 (15.8%) |
| 4 Vehicles | 21 (7.3%) | 13 (5.1%) |
| 5 or more Vehicles | 0 (0.0%) | 0 (0.0%) |
| Total | 289 (100.0%) | 254 (100.0%) |
Commute Time in Hallstead borough
The most frequently occuring commute durations in Hallstead borough are 30 to 34 minutes (95 commuters, 19.4%), 15 to 19 minutes (86 commuters, 17.5%), and 20 to 24 minutes (86 commuters, 17.5%).
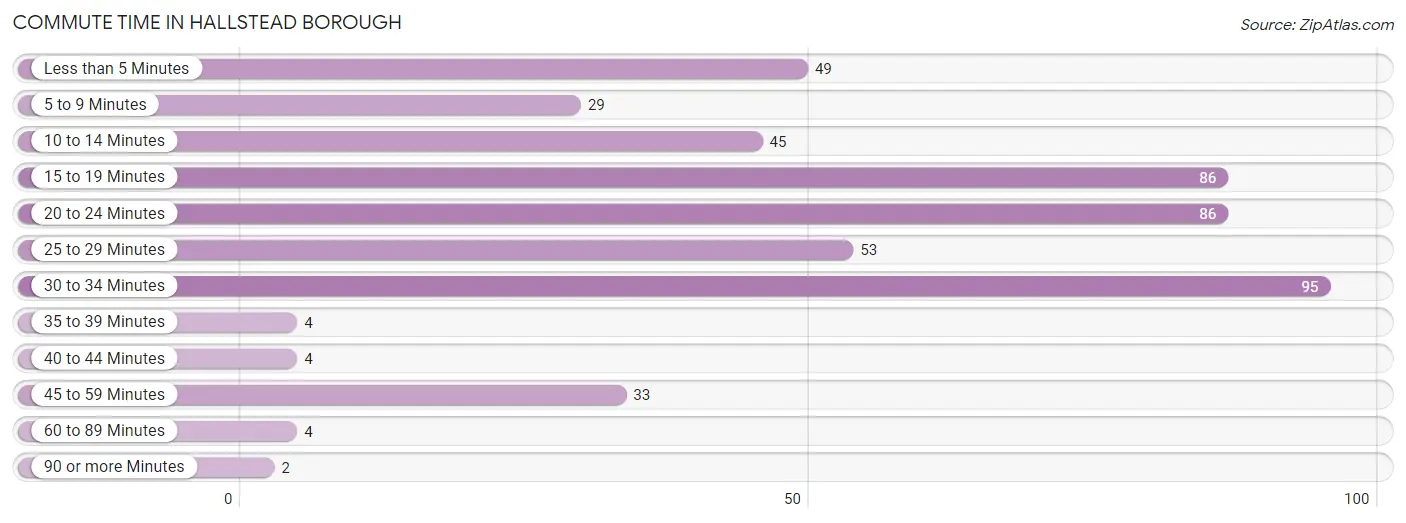
| Commute Time | # Commuters | % Commuters |
| Less than 5 Minutes | 49 | 10.0% |
| 5 to 9 Minutes | 29 | 5.9% |
| 10 to 14 Minutes | 45 | 9.2% |
| 15 to 19 Minutes | 86 | 17.5% |
| 20 to 24 Minutes | 86 | 17.5% |
| 25 to 29 Minutes | 53 | 10.8% |
| 30 to 34 Minutes | 95 | 19.4% |
| 35 to 39 Minutes | 4 | 0.8% |
| 40 to 44 Minutes | 4 | 0.8% |
| 45 to 59 Minutes | 33 | 6.7% |
| 60 to 89 Minutes | 4 | 0.8% |
| 90 or more Minutes | 2 | 0.4% |
Commute Time by Sex in Hallstead borough
The most common commute times in Hallstead borough are 15 to 19 minutes (65 commuters, 24.0%) for males and 20 to 24 minutes (53 commuters, 24.2%) for females.
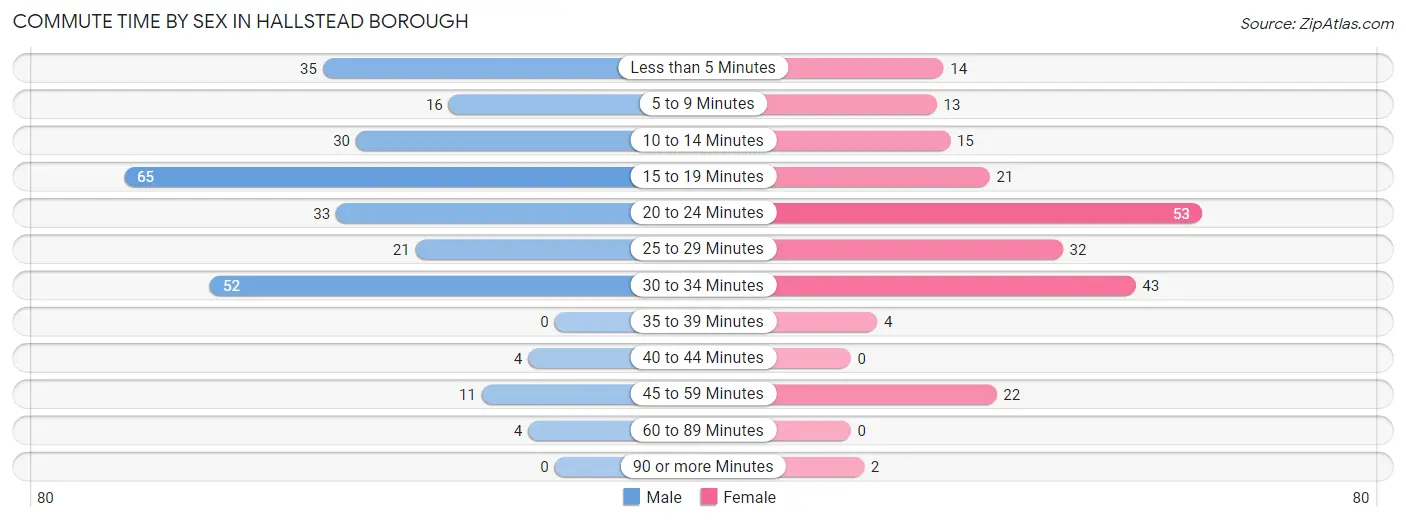
| Commute Time | Male | Female |
| Less than 5 Minutes | 35 (12.9%) | 14 (6.4%) |
| 5 to 9 Minutes | 16 (5.9%) | 13 (5.9%) |
| 10 to 14 Minutes | 30 (11.1%) | 15 (6.9%) |
| 15 to 19 Minutes | 65 (24.0%) | 21 (9.6%) |
| 20 to 24 Minutes | 33 (12.2%) | 53 (24.2%) |
| 25 to 29 Minutes | 21 (7.7%) | 32 (14.6%) |
| 30 to 34 Minutes | 52 (19.2%) | 43 (19.6%) |
| 35 to 39 Minutes | 0 (0.0%) | 4 (1.8%) |
| 40 to 44 Minutes | 4 (1.5%) | 0 (0.0%) |
| 45 to 59 Minutes | 11 (4.1%) | 22 (10.1%) |
| 60 to 89 Minutes | 4 (1.5%) | 0 (0.0%) |
| 90 or more Minutes | 0 (0.0%) | 2 (0.9%) |
Time of Departure to Work by Sex in Hallstead borough
The most frequent times of departure to work in Hallstead borough are 7:00 AM to 7:29 AM (64, 23.6%) for males and 7:00 AM to 7:29 AM (68, 31.0%) for females.
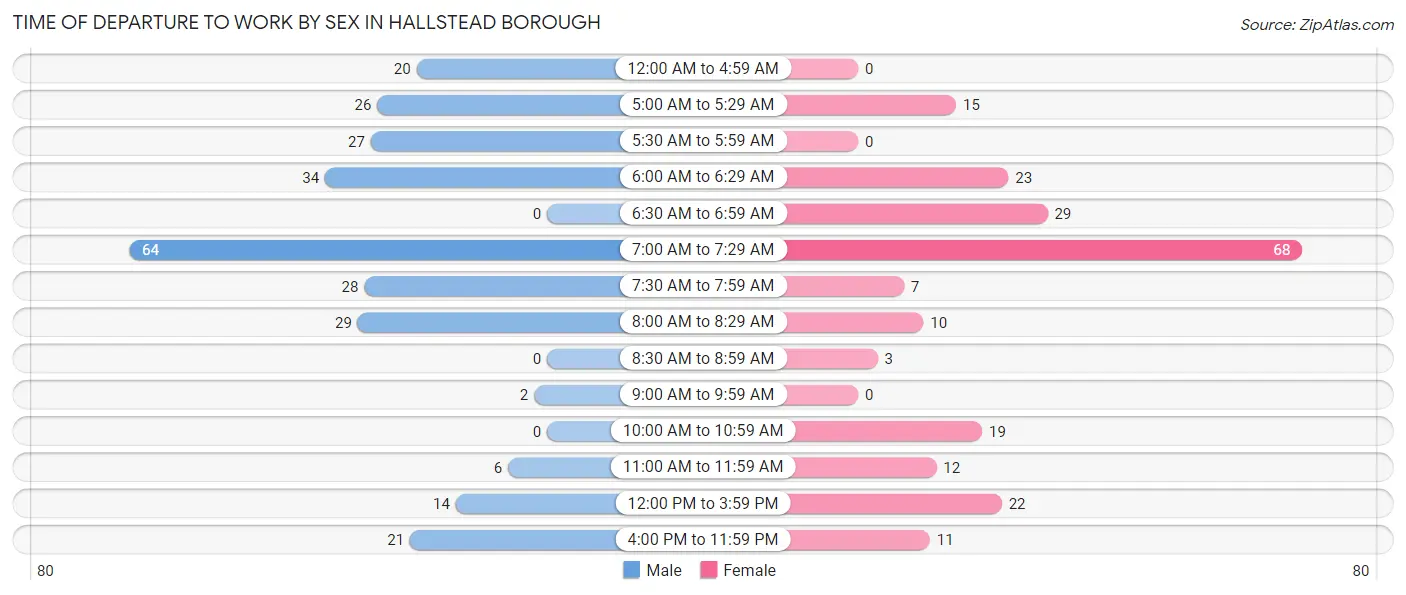
| Time of Departure | Male | Female |
| 12:00 AM to 4:59 AM | 20 (7.4%) | 0 (0.0%) |
| 5:00 AM to 5:29 AM | 26 (9.6%) | 15 (6.9%) |
| 5:30 AM to 5:59 AM | 27 (10.0%) | 0 (0.0%) |
| 6:00 AM to 6:29 AM | 34 (12.6%) | 23 (10.5%) |
| 6:30 AM to 6:59 AM | 0 (0.0%) | 29 (13.2%) |
| 7:00 AM to 7:29 AM | 64 (23.6%) | 68 (31.0%) |
| 7:30 AM to 7:59 AM | 28 (10.3%) | 7 (3.2%) |
| 8:00 AM to 8:29 AM | 29 (10.7%) | 10 (4.6%) |
| 8:30 AM to 8:59 AM | 0 (0.0%) | 3 (1.4%) |
| 9:00 AM to 9:59 AM | 2 (0.7%) | 0 (0.0%) |
| 10:00 AM to 10:59 AM | 0 (0.0%) | 19 (8.7%) |
| 11:00 AM to 11:59 AM | 6 (2.2%) | 12 (5.5%) |
| 12:00 PM to 3:59 PM | 14 (5.2%) | 22 (10.1%) |
| 4:00 PM to 11:59 PM | 21 (7.7%) | 11 (5.0%) |
| Total | 271 (100.0%) | 219 (100.0%) |
Housing Occupancy in Hallstead borough
Occupancy by Ownership in Hallstead borough
Of the total 569 dwellings in Hallstead borough, owner-occupied units account for 363 (63.8%), while renter-occupied units make up 206 (36.2%).
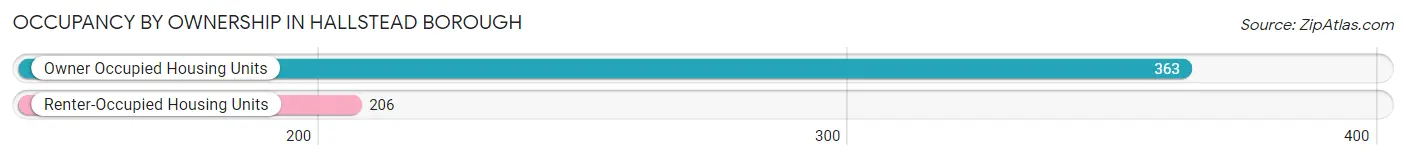
| Occupancy | # Housing Units | % Housing Units |
| Owner Occupied Housing Units | 363 | 63.8% |
| Renter-Occupied Housing Units | 206 | 36.2% |
| Total Occupied Housing Units | 569 | 100.0% |
Occupancy by Household Size in Hallstead borough
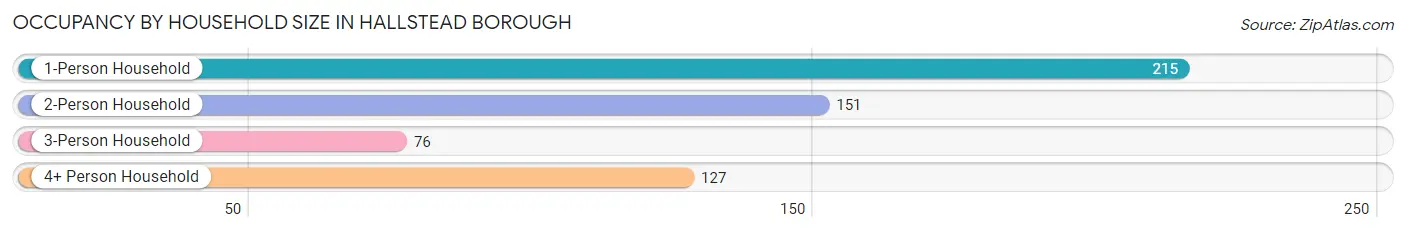
| Household Size | # Housing Units | % Housing Units |
| 1-Person Household | 215 | 37.8% |
| 2-Person Household | 151 | 26.5% |
| 3-Person Household | 76 | 13.4% |
| 4+ Person Household | 127 | 22.3% |
| Total Housing Units | 569 | 100.0% |
Occupancy by Ownership by Household Size in Hallstead borough
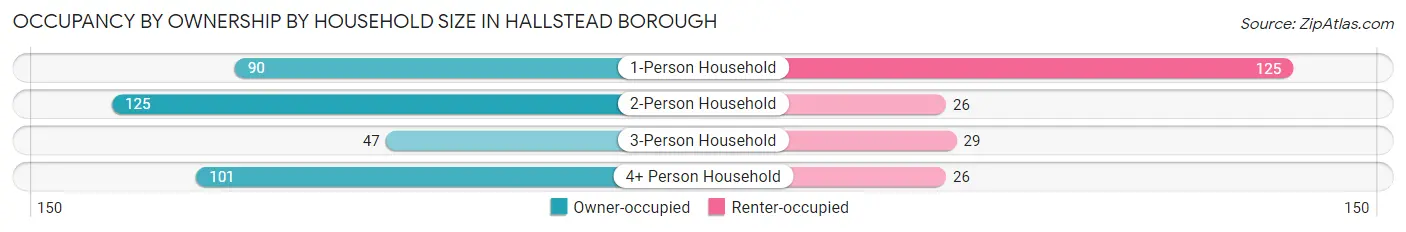
| Household Size | Owner-occupied | Renter-occupied |
| 1-Person Household | 90 (41.9%) | 125 (58.1%) |
| 2-Person Household | 125 (82.8%) | 26 (17.2%) |
| 3-Person Household | 47 (61.8%) | 29 (38.2%) |
| 4+ Person Household | 101 (79.5%) | 26 (20.5%) |
| Total Housing Units | 363 (63.8%) | 206 (36.2%) |
Occupancy by Educational Attainment in Hallstead borough
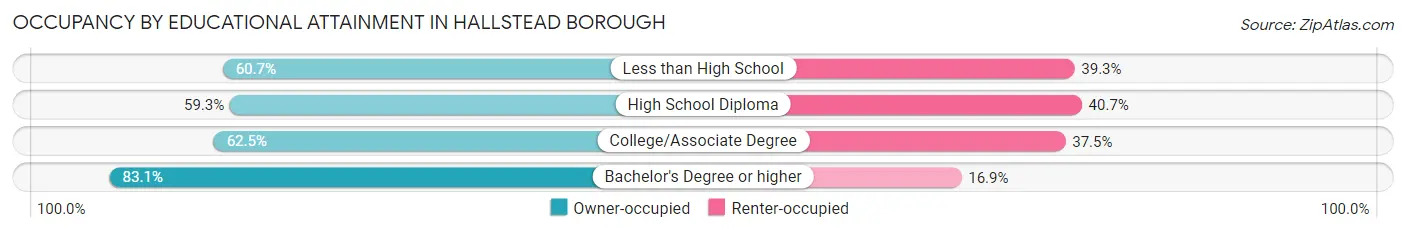
| Household Size | Owner-occupied | Renter-occupied |
| Less than High School | 34 (60.7%) | 22 (39.3%) |
| High School Diploma | 160 (59.3%) | 110 (40.7%) |
| College/Associate Degree | 100 (62.5%) | 60 (37.5%) |
| Bachelor's Degree or higher | 69 (83.1%) | 14 (16.9%) |
Occupancy by Age of Householder in Hallstead borough
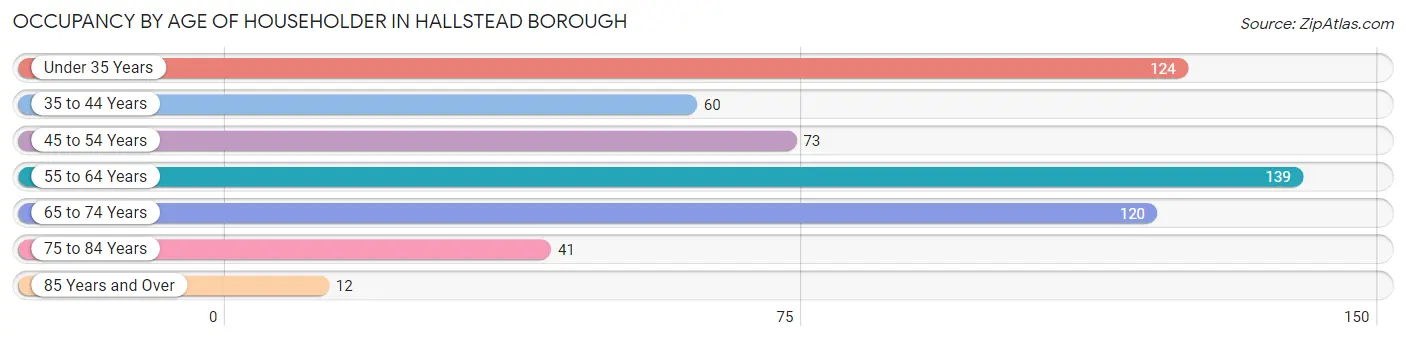
| Age Bracket | # Households | % Households |
| Under 35 Years | 124 | 21.8% |
| 35 to 44 Years | 60 | 10.5% |
| 45 to 54 Years | 73 | 12.8% |
| 55 to 64 Years | 139 | 24.4% |
| 65 to 74 Years | 120 | 21.1% |
| 75 to 84 Years | 41 | 7.2% |
| 85 Years and Over | 12 | 2.1% |
| Total | 569 | 100.0% |
Housing Finances in Hallstead borough
Median Income by Occupancy in Hallstead borough
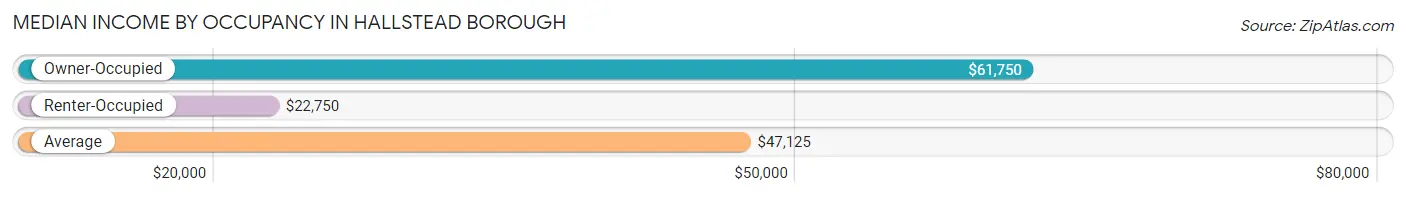
| Occupancy Type | # Households | Median Income |
| Owner-Occupied | 363 (63.8%) | $61,750 |
| Renter-Occupied | 206 (36.2%) | $22,750 |
| Average | 569 (100.0%) | $47,125 |
Occupancy by Householder Income Bracket in Hallstead borough
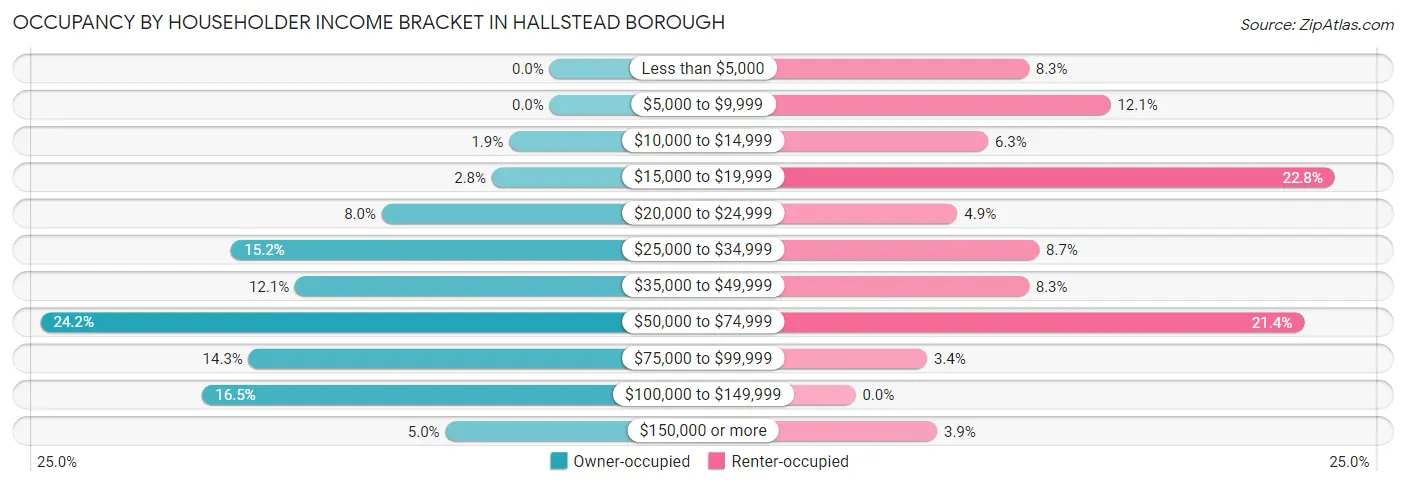
| Income Bracket | Owner-occupied | Renter-occupied |
| Less than $5,000 | 0 (0.0%) | 17 (8.3%) |
| $5,000 to $9,999 | 0 (0.0%) | 25 (12.1%) |
| $10,000 to $14,999 | 7 (1.9%) | 13 (6.3%) |
| $15,000 to $19,999 | 10 (2.8%) | 47 (22.8%) |
| $20,000 to $24,999 | 29 (8.0%) | 10 (4.9%) |
| $25,000 to $34,999 | 55 (15.1%) | 18 (8.7%) |
| $35,000 to $49,999 | 44 (12.1%) | 17 (8.3%) |
| $50,000 to $74,999 | 88 (24.2%) | 44 (21.4%) |
| $75,000 to $99,999 | 52 (14.3%) | 7 (3.4%) |
| $100,000 to $149,999 | 60 (16.5%) | 0 (0.0%) |
| $150,000 or more | 18 (5.0%) | 8 (3.9%) |
| Total | 363 (100.0%) | 206 (100.0%) |
Monthly Housing Cost Tiers in Hallstead borough
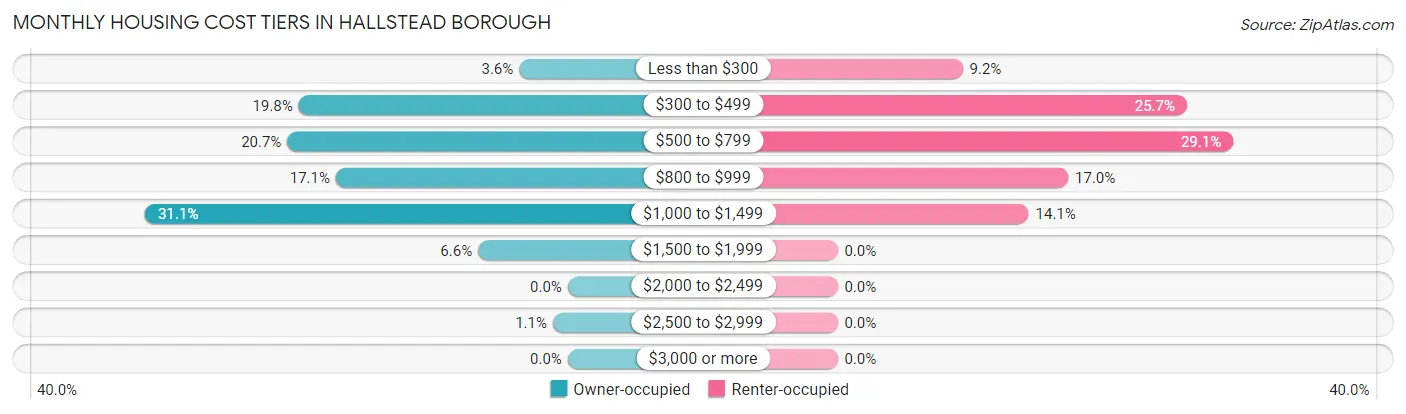
| Monthly Cost | Owner-occupied | Renter-occupied |
| Less than $300 | 13 (3.6%) | 19 (9.2%) |
| $300 to $499 | 72 (19.8%) | 53 (25.7%) |
| $500 to $799 | 75 (20.7%) | 60 (29.1%) |
| $800 to $999 | 62 (17.1%) | 35 (17.0%) |
| $1,000 to $1,499 | 113 (31.1%) | 29 (14.1%) |
| $1,500 to $1,999 | 24 (6.6%) | 0 (0.0%) |
| $2,000 to $2,499 | 0 (0.0%) | 0 (0.0%) |
| $2,500 to $2,999 | 4 (1.1%) | 0 (0.0%) |
| $3,000 or more | 0 (0.0%) | 0 (0.0%) |
| Total | 363 (100.0%) | 206 (100.0%) |
Physical Housing Characteristics in Hallstead borough
Housing Structures in Hallstead borough
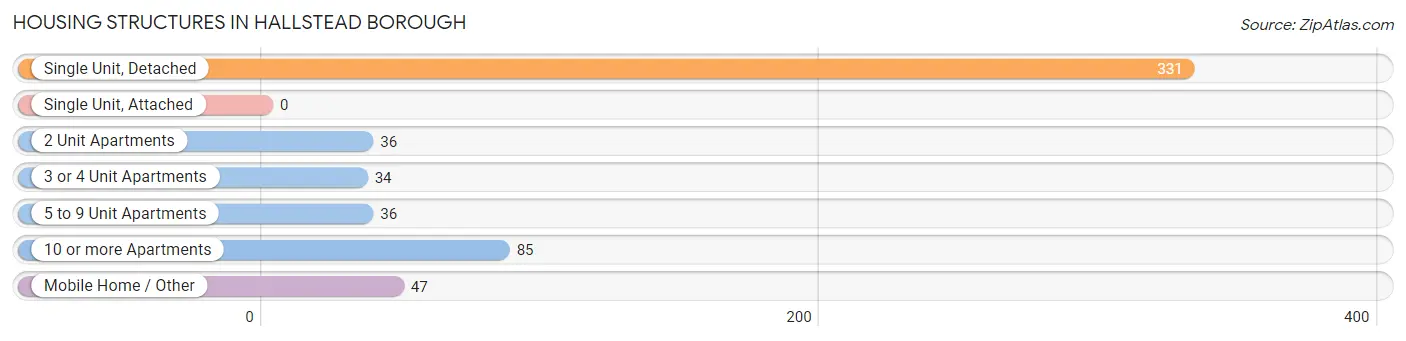
| Structure Type | # Housing Units | % Housing Units |
| Single Unit, Detached | 331 | 58.2% |
| Single Unit, Attached | 0 | 0.0% |
| 2 Unit Apartments | 36 | 6.3% |
| 3 or 4 Unit Apartments | 34 | 6.0% |
| 5 to 9 Unit Apartments | 36 | 6.3% |
| 10 or more Apartments | 85 | 14.9% |
| Mobile Home / Other | 47 | 8.3% |
| Total | 569 | 100.0% |
Housing Structures by Occupancy in Hallstead borough
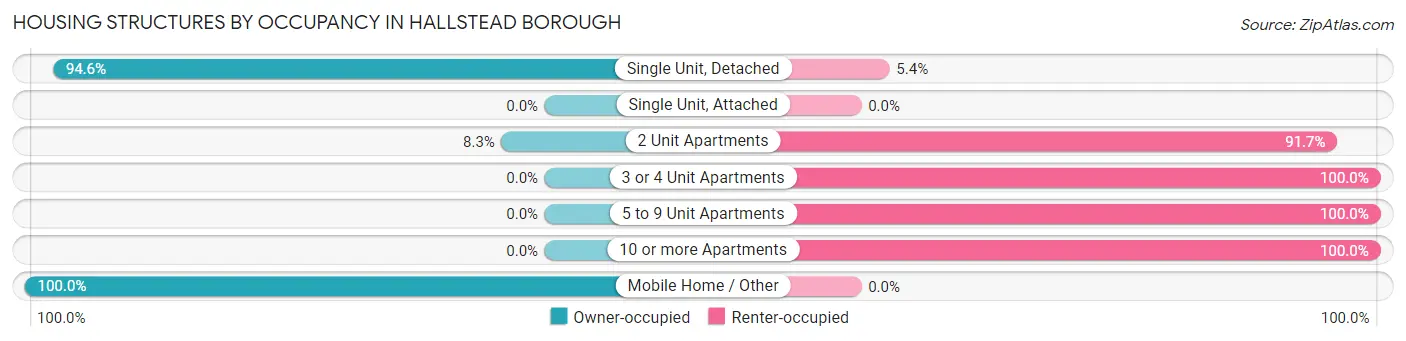
| Structure Type | Owner-occupied | Renter-occupied |
| Single Unit, Detached | 313 (94.6%) | 18 (5.4%) |
| Single Unit, Attached | 0 (0.0%) | 0 (0.0%) |
| 2 Unit Apartments | 3 (8.3%) | 33 (91.7%) |
| 3 or 4 Unit Apartments | 0 (0.0%) | 34 (100.0%) |
| 5 to 9 Unit Apartments | 0 (0.0%) | 36 (100.0%) |
| 10 or more Apartments | 0 (0.0%) | 85 (100.0%) |
| Mobile Home / Other | 47 (100.0%) | 0 (0.0%) |
| Total | 363 (63.8%) | 206 (36.2%) |
Housing Structures by Number of Rooms in Hallstead borough
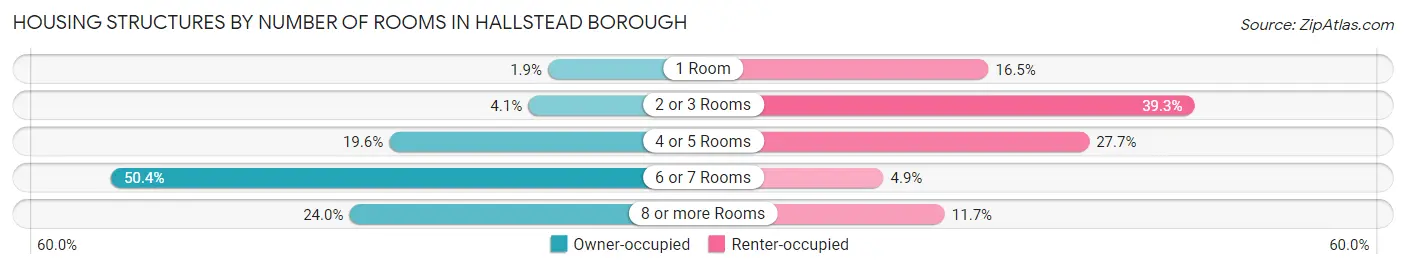
| Number of Rooms | Owner-occupied | Renter-occupied |
| 1 Room | 7 (1.9%) | 34 (16.5%) |
| 2 or 3 Rooms | 15 (4.1%) | 81 (39.3%) |
| 4 or 5 Rooms | 71 (19.6%) | 57 (27.7%) |
| 6 or 7 Rooms | 183 (50.4%) | 10 (4.9%) |
| 8 or more Rooms | 87 (24.0%) | 24 (11.7%) |
| Total | 363 (100.0%) | 206 (100.0%) |
Housing Structure by Heating Type in Hallstead borough
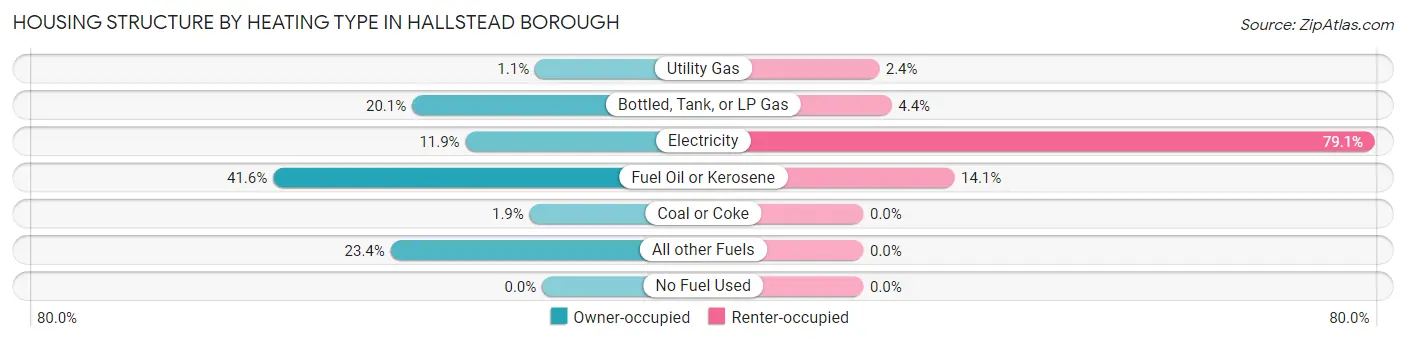
| Heating Type | Owner-occupied | Renter-occupied |
| Utility Gas | 4 (1.1%) | 5 (2.4%) |
| Bottled, Tank, or LP Gas | 73 (20.1%) | 9 (4.4%) |
| Electricity | 43 (11.8%) | 163 (79.1%) |
| Fuel Oil or Kerosene | 151 (41.6%) | 29 (14.1%) |
| Coal or Coke | 7 (1.9%) | 0 (0.0%) |
| All other Fuels | 85 (23.4%) | 0 (0.0%) |
| No Fuel Used | 0 (0.0%) | 0 (0.0%) |
| Total | 363 (100.0%) | 206 (100.0%) |
Household Vehicle Usage in Hallstead borough
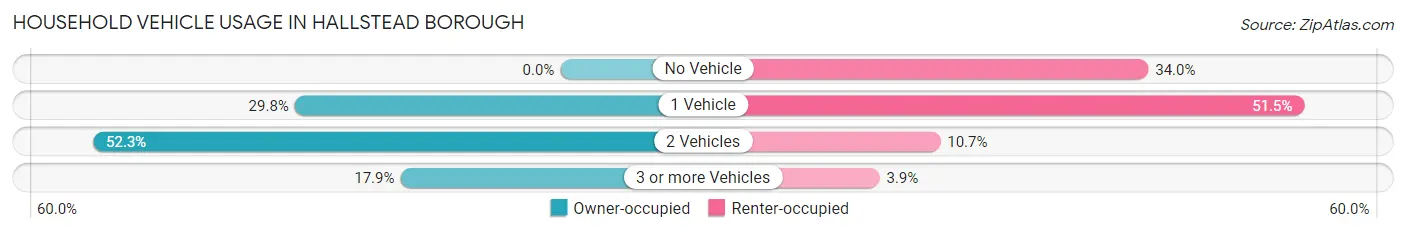
| Vehicles per Household | Owner-occupied | Renter-occupied |
| No Vehicle | 0 (0.0%) | 70 (34.0%) |
| 1 Vehicle | 108 (29.7%) | 106 (51.5%) |
| 2 Vehicles | 190 (52.3%) | 22 (10.7%) |
| 3 or more Vehicles | 65 (17.9%) | 8 (3.9%) |
| Total | 363 (100.0%) | 206 (100.0%) |
Real Estate & Mortgages in Hallstead borough
Real Estate and Mortgage Overview in Hallstead borough
| Characteristic | Without Mortgage | With Mortgage |
| Housing Units | 153 | 210 |
| Median Property Value | $99,600 | $114,800 |
| Median Household Income | $43,750 | $12 |
| Monthly Housing Costs | $485 | $0 |
| Real Estate Taxes | $1,299 | $8 |
Property Value by Mortgage Status in Hallstead borough
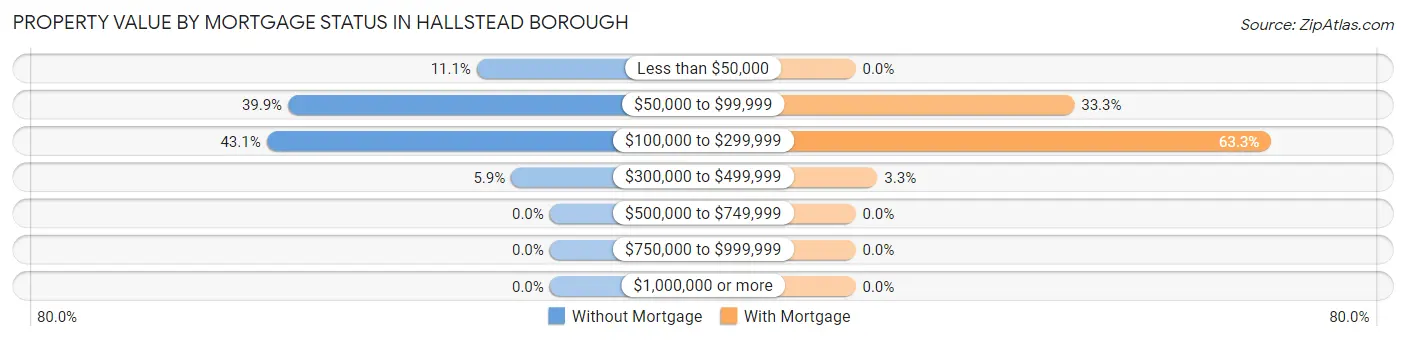
| Property Value | Without Mortgage | With Mortgage |
| Less than $50,000 | 17 (11.1%) | 0 (0.0%) |
| $50,000 to $99,999 | 61 (39.9%) | 70 (33.3%) |
| $100,000 to $299,999 | 66 (43.1%) | 133 (63.3%) |
| $300,000 to $499,999 | 9 (5.9%) | 7 (3.3%) |
| $500,000 to $749,999 | 0 (0.0%) | 0 (0.0%) |
| $750,000 to $999,999 | 0 (0.0%) | 0 (0.0%) |
| $1,000,000 or more | 0 (0.0%) | 0 (0.0%) |
| Total | 153 (100.0%) | 210 (100.0%) |
Household Income by Mortgage Status in Hallstead borough
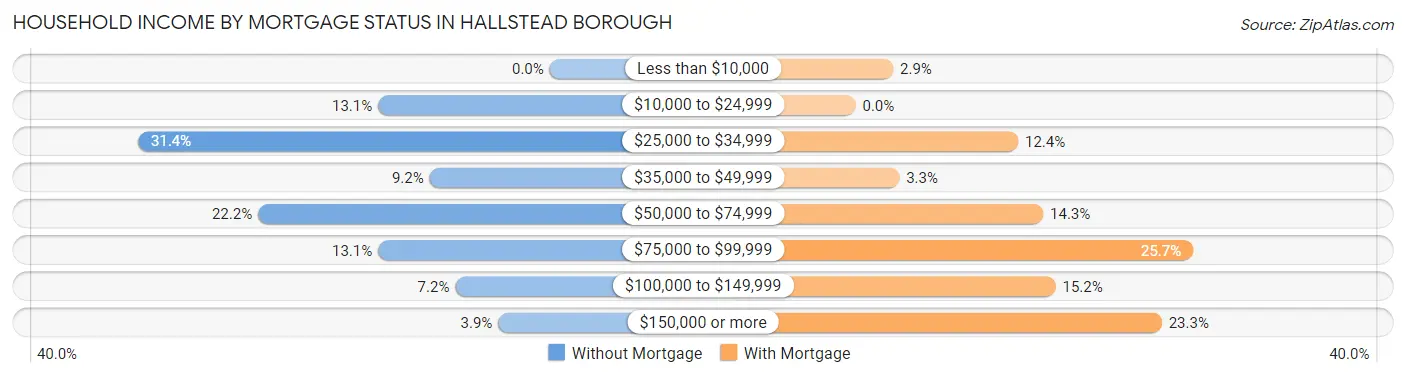
| Household Income | Without Mortgage | With Mortgage |
| Less than $10,000 | 0 (0.0%) | 6 (2.9%) |
| $10,000 to $24,999 | 20 (13.1%) | 0 (0.0%) |
| $25,000 to $34,999 | 48 (31.4%) | 26 (12.4%) |
| $35,000 to $49,999 | 14 (9.1%) | 7 (3.3%) |
| $50,000 to $74,999 | 34 (22.2%) | 30 (14.3%) |
| $75,000 to $99,999 | 20 (13.1%) | 54 (25.7%) |
| $100,000 to $149,999 | 11 (7.2%) | 32 (15.2%) |
| $150,000 or more | 6 (3.9%) | 49 (23.3%) |
| Total | 153 (100.0%) | 210 (100.0%) |
Property Value to Household Income Ratio in Hallstead borough
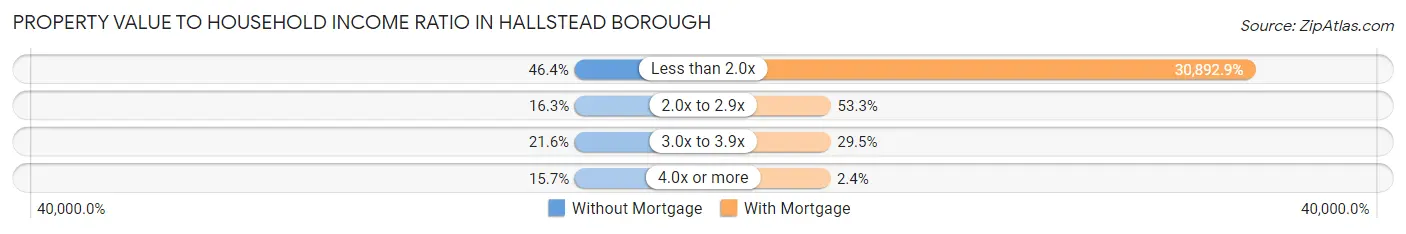
| Value-to-Income Ratio | Without Mortgage | With Mortgage |
| Less than 2.0x | 71 (46.4%) | 64,875 (30,892.9%) |
| 2.0x to 2.9x | 25 (16.3%) | 112 (53.3%) |
| 3.0x to 3.9x | 33 (21.6%) | 62 (29.5%) |
| 4.0x or more | 24 (15.7%) | 5 (2.4%) |
| Total | 153 (100.0%) | 210 (100.0%) |
Real Estate Taxes by Mortgage Status in Hallstead borough
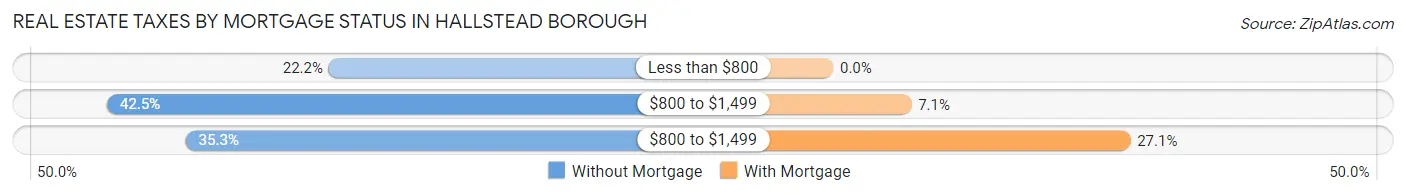
| Property Taxes | Without Mortgage | With Mortgage |
| Less than $800 | 34 (22.2%) | 0 (0.0%) |
| $800 to $1,499 | 65 (42.5%) | 15 (7.1%) |
| $800 to $1,499 | 54 (35.3%) | 57 (27.1%) |
| Total | 153 (100.0%) | 210 (100.0%) |
Health & Disability in Hallstead borough
Health Insurance Coverage by Age in Hallstead borough
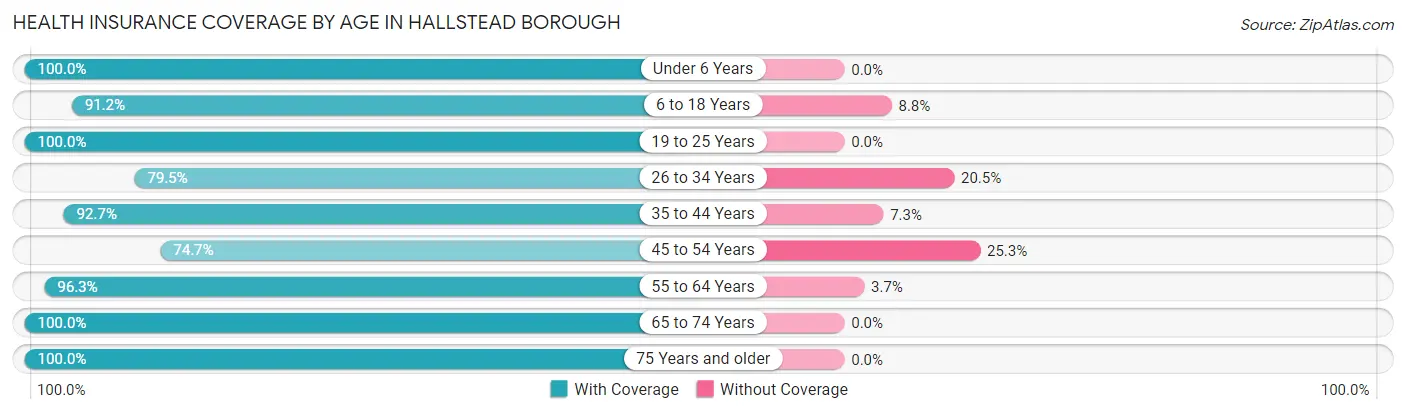
| Age Bracket | With Coverage | Without Coverage |
| Under 6 Years | 155 (100.0%) | 0 (0.0%) |
| 6 to 18 Years | 176 (91.2%) | 17 (8.8%) |
| 19 to 25 Years | 111 (100.0%) | 0 (0.0%) |
| 26 to 34 Years | 136 (79.5%) | 35 (20.5%) |
| 35 to 44 Years | 115 (92.7%) | 9 (7.3%) |
| 45 to 54 Years | 118 (74.7%) | 40 (25.3%) |
| 55 to 64 Years | 209 (96.3%) | 8 (3.7%) |
| 65 to 74 Years | 136 (100.0%) | 0 (0.0%) |
| 75 Years and older | 80 (100.0%) | 0 (0.0%) |
| Total | 1,236 (91.9%) | 109 (8.1%) |
Health Insurance Coverage by Citizenship Status in Hallstead borough
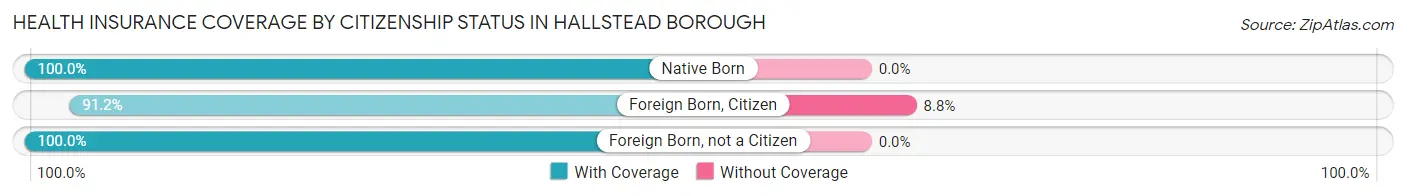
| Citizenship Status | With Coverage | Without Coverage |
| Native Born | 155 (100.0%) | 0 (0.0%) |
| Foreign Born, Citizen | 176 (91.2%) | 17 (8.8%) |
| Foreign Born, not a Citizen | 111 (100.0%) | 0 (0.0%) |
Health Insurance Coverage by Household Income in Hallstead borough
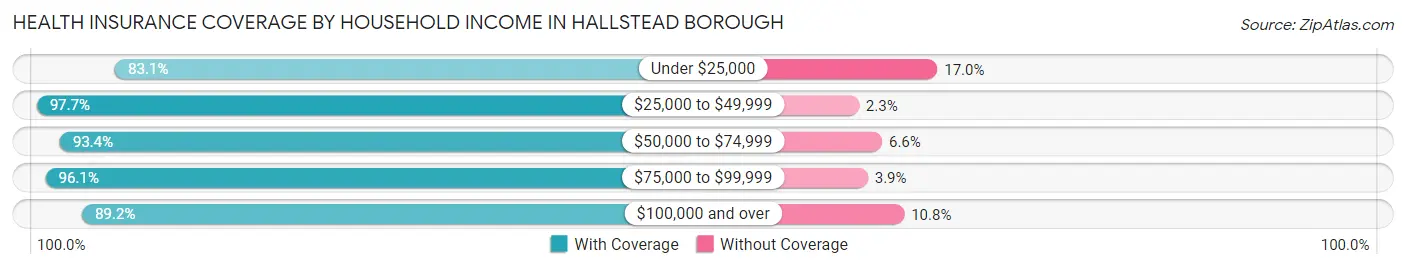
| Household Income | With Coverage | Without Coverage |
| Under $25,000 | 196 (83.1%) | 40 (17.0%) |
| $25,000 to $49,999 | 258 (97.7%) | 6 (2.3%) |
| $50,000 to $74,999 | 354 (93.4%) | 25 (6.6%) |
| $75,000 to $99,999 | 171 (96.1%) | 7 (3.9%) |
| $100,000 and over | 257 (89.2%) | 31 (10.8%) |
Public vs Private Health Insurance Coverage by Age in Hallstead borough
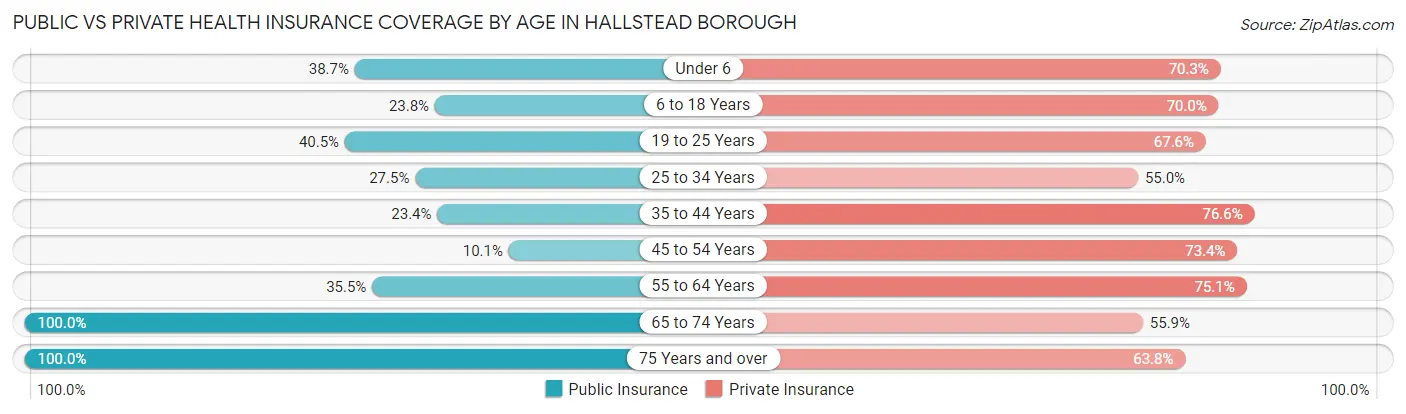
| Age Bracket | Public Insurance | Private Insurance |
| Under 6 | 60 (38.7%) | 109 (70.3%) |
| 6 to 18 Years | 46 (23.8%) | 135 (70.0%) |
| 19 to 25 Years | 45 (40.5%) | 75 (67.6%) |
| 25 to 34 Years | 47 (27.5%) | 94 (55.0%) |
| 35 to 44 Years | 29 (23.4%) | 95 (76.6%) |
| 45 to 54 Years | 16 (10.1%) | 116 (73.4%) |
| 55 to 64 Years | 77 (35.5%) | 163 (75.1%) |
| 65 to 74 Years | 136 (100.0%) | 76 (55.9%) |
| 75 Years and over | 80 (100.0%) | 51 (63.7%) |
| Total | 536 (39.9%) | 914 (68.0%) |
Disability Status by Sex by Age in Hallstead borough
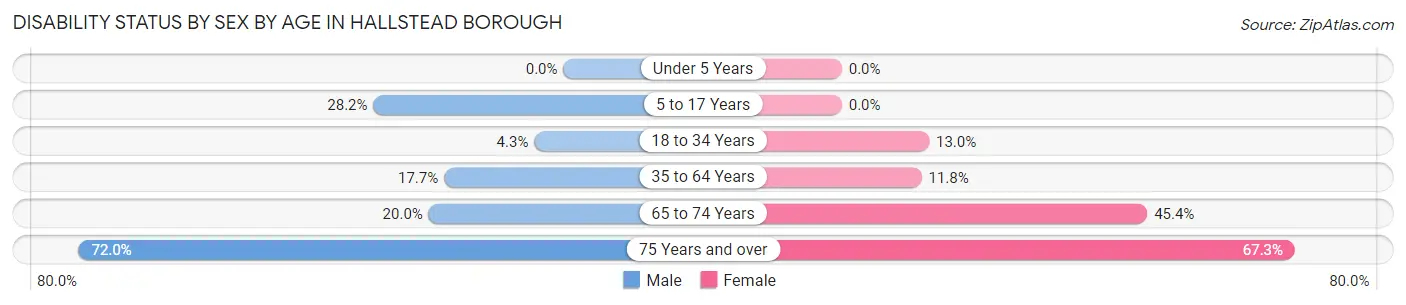
| Age Bracket | Male | Female |
| Under 5 Years | 0 (0.0%) | 0 (0.0%) |
| 5 to 17 Years | 22 (28.2%) | 0 (0.0%) |
| 18 to 34 Years | 7 (4.3%) | 18 (13.0%) |
| 35 to 64 Years | 45 (17.7%) | 29 (11.8%) |
| 65 to 74 Years | 10 (20.0%) | 39 (45.4%) |
| 75 Years and over | 18 (72.0%) | 37 (67.3%) |
Disability Class by Sex by Age in Hallstead borough
Disability Class: Hearing Difficulty
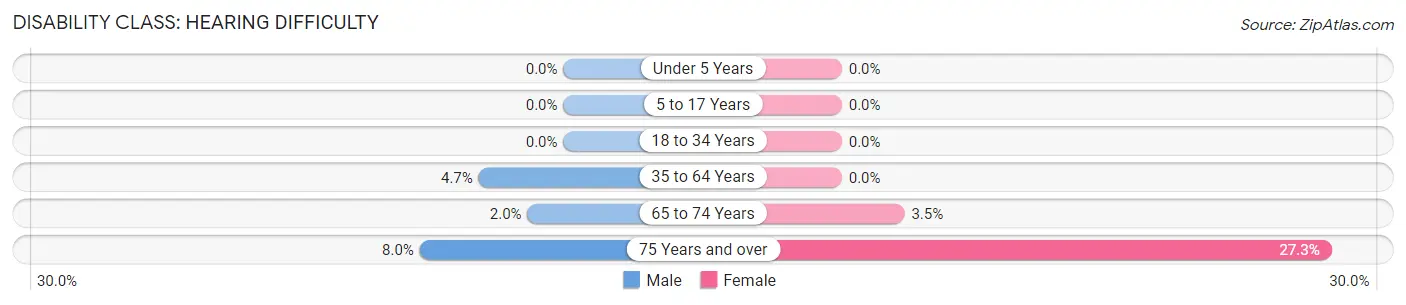
| Age Bracket | Male | Female |
| Under 5 Years | 0 (0.0%) | 0 (0.0%) |
| 5 to 17 Years | 0 (0.0%) | 0 (0.0%) |
| 18 to 34 Years | 0 (0.0%) | 0 (0.0%) |
| 35 to 64 Years | 12 (4.7%) | 0 (0.0%) |
| 65 to 74 Years | 1 (2.0%) | 3 (3.5%) |
| 75 Years and over | 2 (8.0%) | 15 (27.3%) |
Disability Class: Vision Difficulty
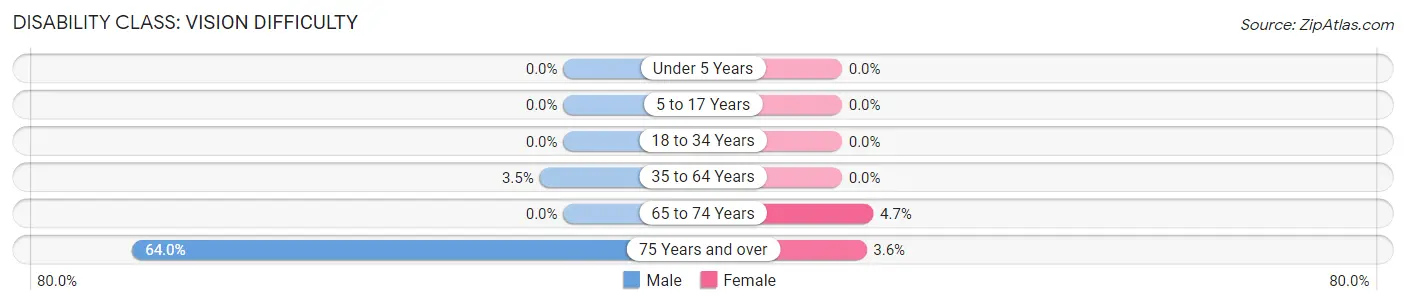
| Age Bracket | Male | Female |
| Under 5 Years | 0 (0.0%) | 0 (0.0%) |
| 5 to 17 Years | 0 (0.0%) | 0 (0.0%) |
| 18 to 34 Years | 0 (0.0%) | 0 (0.0%) |
| 35 to 64 Years | 9 (3.5%) | 0 (0.0%) |
| 65 to 74 Years | 0 (0.0%) | 4 (4.6%) |
| 75 Years and over | 16 (64.0%) | 2 (3.6%) |
Disability Class: Cognitive Difficulty
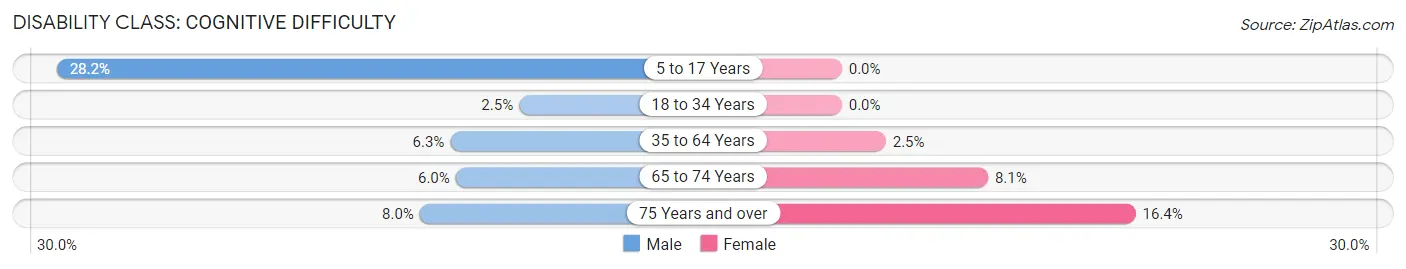
| Age Bracket | Male | Female |
| 5 to 17 Years | 22 (28.2%) | 0 (0.0%) |
| 18 to 34 Years | 4 (2.5%) | 0 (0.0%) |
| 35 to 64 Years | 16 (6.3%) | 6 (2.5%) |
| 65 to 74 Years | 3 (6.0%) | 7 (8.1%) |
| 75 Years and over | 2 (8.0%) | 9 (16.4%) |
Disability Class: Ambulatory Difficulty
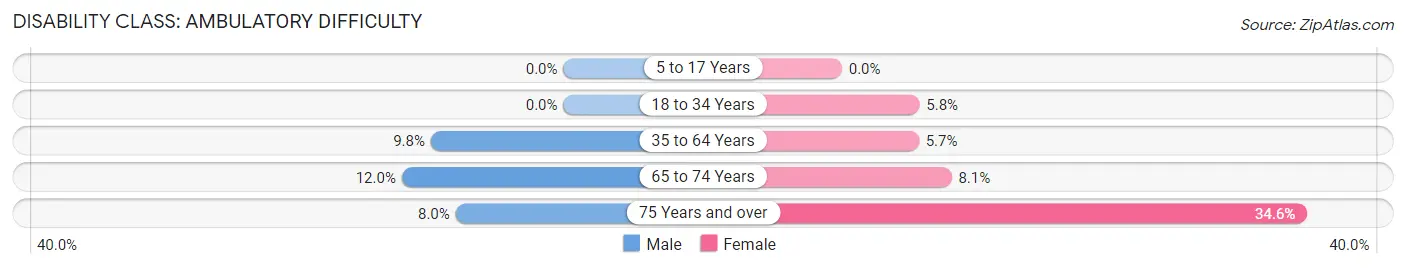
| Age Bracket | Male | Female |
| 5 to 17 Years | 0 (0.0%) | 0 (0.0%) |
| 18 to 34 Years | 0 (0.0%) | 8 (5.8%) |
| 35 to 64 Years | 25 (9.8%) | 14 (5.7%) |
| 65 to 74 Years | 6 (12.0%) | 7 (8.1%) |
| 75 Years and over | 2 (8.0%) | 19 (34.5%) |
Disability Class: Self-Care Difficulty
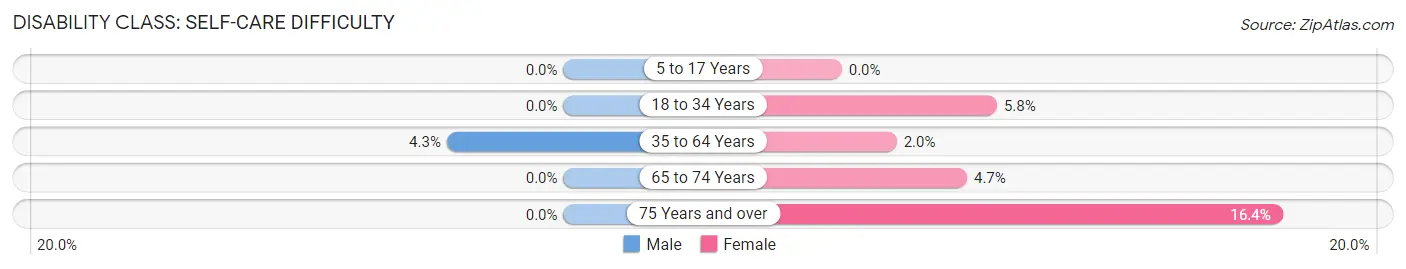
| Age Bracket | Male | Female |
| 5 to 17 Years | 0 (0.0%) | 0 (0.0%) |
| 18 to 34 Years | 0 (0.0%) | 8 (5.8%) |
| 35 to 64 Years | 11 (4.3%) | 5 (2.0%) |
| 65 to 74 Years | 0 (0.0%) | 4 (4.6%) |
| 75 Years and over | 0 (0.0%) | 9 (16.4%) |
Technology Access in Hallstead borough
Computing Device Access in Hallstead borough
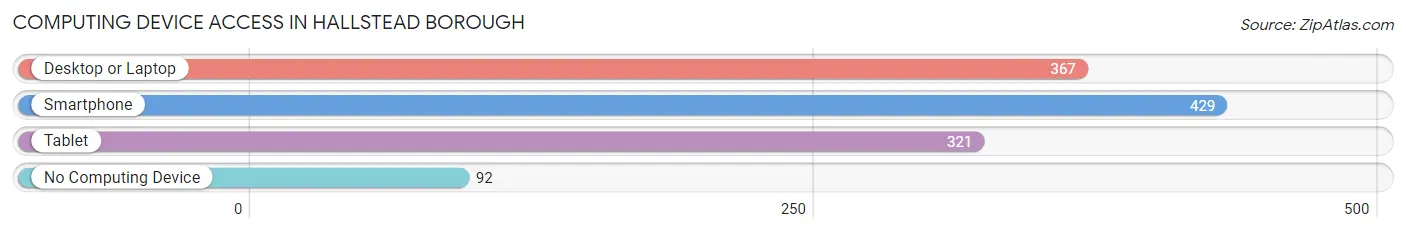
| Device Type | # Households | % Households |
| Desktop or Laptop | 367 | 64.5% |
| Smartphone | 429 | 75.4% |
| Tablet | 321 | 56.4% |
| No Computing Device | 92 | 16.2% |
| Total | 569 | 100.0% |
Internet Access in Hallstead borough
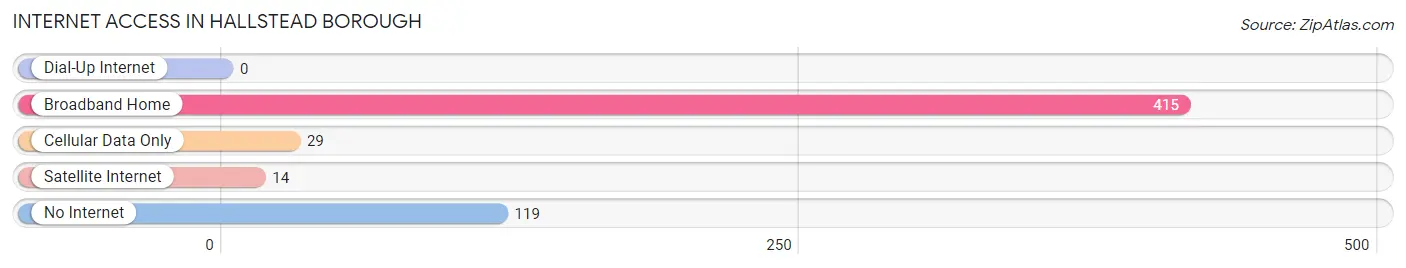
| Internet Type | # Households | % Households |
| Dial-Up Internet | 0 | 0.0% |
| Broadband Home | 415 | 72.9% |
| Cellular Data Only | 29 | 5.1% |
| Satellite Internet | 14 | 2.5% |
| No Internet | 119 | 20.9% |
| Total | 569 | 100.0% |
Hallstead borough Summary
Hallstead Borough is a small borough located in Susquehanna County, Pennsylvania. It is situated in the Endless Mountains region of the state, and is part of the Scranton–Wilkes-Barre–Hazleton Metropolitan Statistical Area. The population of Hallstead Borough was 1,541 at the 2010 census.
History
Hallstead Borough was founded in 1851 by a group of settlers from Connecticut. The town was named after the Hallstead family, who were among the first settlers. The town was incorporated in 1871.
Hallstead was a major stop on the Erie Railroad, which ran through the town from 1851 to 1972. The railroad was a major source of employment for the town, and it also brought many visitors to the area.
Geography
Hallstead Borough is located at 41°51'N 75°51'W (41.851, -75.851). It is situated in the Endless Mountains region of Pennsylvania, and is part of the Scranton–Wilkes-Barre–Hazleton Metropolitan Statistical Area.
The borough is located in the Susquehanna River Valley, and is bordered by the towns of Great Bend, New Milford, and Susquehanna. The borough covers an area of 0.8 square miles, and has a total area of 0.8 square miles, all of which is land.
Economy
Hallstead Borough is a small, rural community with a population of 1,541 at the 2010 census. The town is primarily a bedroom community, with most of its residents commuting to nearby towns and cities for work.
The town is home to several small businesses, including a grocery store, a hardware store, a pharmacy, and a few restaurants. The town also has a post office, a bank, and a library.
Demographics
As of the 2010 census, Hallstead Borough had a population of 1,541. The racial makeup of the borough was 97.3% White, 0.7% African American, 0.2% Native American, 0.2% Asian, 0.2% from other races, and 1.4% from two or more races. Hispanic or Latino of any race were 1.2% of the population.
The median income for a household in the borough was $41,250, and the median income for a family was $48,750. The per capita income for the borough was $20,945. About 8.2% of families and 10.2% of the population were below the poverty line, including 14.2% of those under age 18 and 8.3% of those age 65 or over.
Conclusion
Hallstead Borough is a small borough located in Susquehanna County, Pennsylvania. It is situated in the Endless Mountains region of the state, and is part of the Scranton–Wilkes-Barre–Hazleton Metropolitan Statistical Area. The population of Hallstead Borough was 1,541 at the 2010 census. The town is primarily a bedroom community, with most of its residents commuting to nearby towns and cities for work. The town is home to several small businesses, including a grocery store, a hardware store, a pharmacy, and a few restaurants. The racial makeup of the borough was 97.3% White, 0.7% African American, 0.2% Native American, 0.2% Asian, 0.2% from other races, and 1.4% from two or more races. The median income for a household in the borough was $41,250, and the median income for a family was $48,750. Hallstead Borough is a small, rural community with a rich history and a bright future.
Common Questions
What is Per Capita Income in Hallstead borough?
Per Capita income in Hallstead borough is $27,314.
What is the Median Family Income in Hallstead borough?
Median Family Income in Hallstead borough is $62,727.
What is the Median Household income in Hallstead borough?
Median Household Income in Hallstead borough is $47,125.
What is Income or Wage Gap in Hallstead borough?
Income or Wage Gap in Hallstead borough is 16.8%.
Women in Hallstead borough earn 83.2 cents for every dollar earned by a man.
What is Inequality or Gini Index in Hallstead borough?
Inequality or Gini Index in Hallstead borough is 0.43.
What is the Total Population of Hallstead borough?
Total Population of Hallstead borough is 1,345.
What is the Total Male Population of Hallstead borough?
Total Male Population of Hallstead borough is 622.
What is the Total Female Population of Hallstead borough?
Total Female Population of Hallstead borough is 723.
What is the Ratio of Males per 100 Females in Hallstead borough?
There are 86.03 Males per 100 Females in Hallstead borough.
What is the Ratio of Females per 100 Males in Hallstead borough?
There are 116.24 Females per 100 Males in Hallstead borough.
What is the Median Population Age in Hallstead borough?
Median Population Age in Hallstead borough is 39.0 Years.
What is the Average Family Size in Hallstead borough
Average Family Size in Hallstead borough is 3.1 People.
What is the Average Household Size in Hallstead borough
Average Household Size in Hallstead borough is 2.4 People.
How Large is the Labor Force in Hallstead borough?
There are 575 People in the Labor Forcein in Hallstead borough.
What is the Percentage of People in the Labor Force in Hallstead borough?
55.8% of People are in the Labor Force in Hallstead borough.
What is the Unemployment Rate in Hallstead borough?
Unemployment Rate in Hallstead borough is 5.6%.