Stockertown borough, PA Map & Demographics
Stockertown borough Overview
$42,680
PER CAPITA INCOME
$119,167
AVG FAMILY INCOME
$112,692
AVG HOUSEHOLD INCOME
0.33
INEQUALITY / GINI INDEX
911
TOTAL POPULATION
420
MALE POPULATION
491
FEMALE POPULATION
85.54
MALES / 100 FEMALES
116.90
FEMALES / 100 MALES
44.6
MEDIAN AGE
3.2
AVG FAMILY SIZE
2.7
AVG HOUSEHOLD SIZE
510
LABOR FORCE [ PEOPLE ]
64.7%
PERCENT IN LABOR FORCE
2.5%
UNEMPLOYMENT RATE
Income in Stockertown borough
Income Overview in Stockertown borough
Per Capita Income in Stockertown borough is $42,680, while median incomes of families and households are $119,167 and $112,692 respectively.
| Characteristic | Number | Measure |
| Per Capita Income | 911 | $42,680 |
| Median Family Income | 244 | $119,167 |
| Mean Family Income | 244 | $121,135 |
| Median Household Income | 336 | $112,692 |
| Mean Household Income | 336 | $112,986 |
| Income Deficit | 244 | $0 |
| Wage / Income Gap (%) | 911 | 0.00% |
| Wage / Income Gap ($) | 911 | 100.00¢ per $1 |
| Gini / Inequality Index | 911 | 0.33 |
Earnings by Sex in Stockertown borough
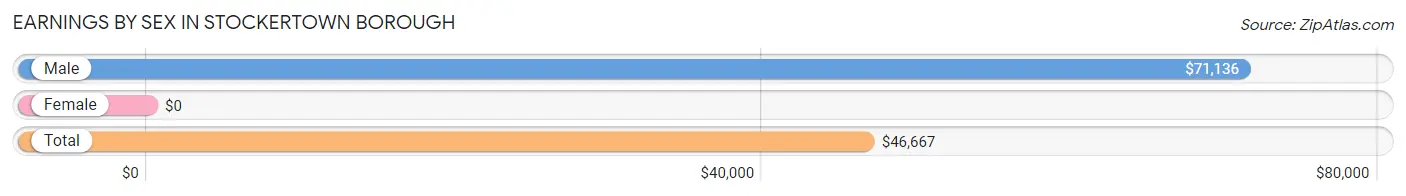
| Sex | Number | Average Earnings |
| Male | 270 (49.8%) | $71,136 |
| Female | 272 (50.2%) | $0 |
| Total | 542 (100.0%) | $46,667 |
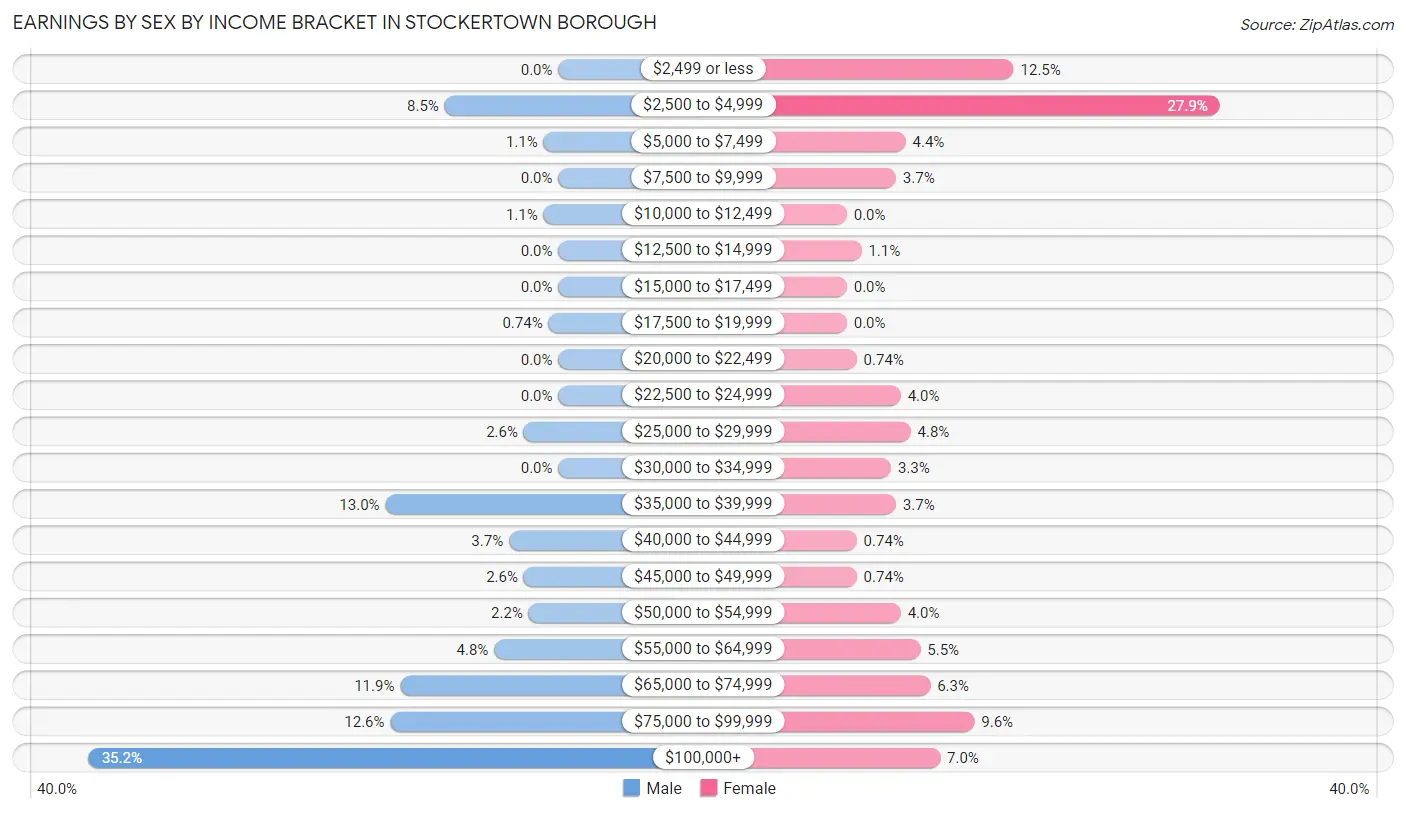
Earnings by Sex by Income Bracket in Stockertown borough
The most common earnings brackets in Stockertown borough are $100,000+ for men (95 | 35.2%) and $2,500 to $4,999 for women (76 | 27.9%).
| Income | Male | Female |
| $2,499 or less | 0 (0.0%) | 34 (12.5%) |
| $2,500 to $4,999 | 23 (8.5%) | 76 (27.9%) |
| $5,000 to $7,499 | 3 (1.1%) | 12 (4.4%) |
| $7,500 to $9,999 | 0 (0.0%) | 10 (3.7%) |
| $10,000 to $12,499 | 3 (1.1%) | 0 (0.0%) |
| $12,500 to $14,999 | 0 (0.0%) | 3 (1.1%) |
| $15,000 to $17,499 | 0 (0.0%) | 0 (0.0%) |
| $17,500 to $19,999 | 2 (0.7%) | 0 (0.0%) |
| $20,000 to $22,499 | 0 (0.0%) | 2 (0.7%) |
| $22,500 to $24,999 | 0 (0.0%) | 11 (4.0%) |
| $25,000 to $29,999 | 7 (2.6%) | 13 (4.8%) |
| $30,000 to $34,999 | 0 (0.0%) | 9 (3.3%) |
| $35,000 to $39,999 | 35 (13.0%) | 10 (3.7%) |
| $40,000 to $44,999 | 10 (3.7%) | 2 (0.7%) |
| $45,000 to $49,999 | 7 (2.6%) | 2 (0.7%) |
| $50,000 to $54,999 | 6 (2.2%) | 11 (4.0%) |
| $55,000 to $64,999 | 13 (4.8%) | 15 (5.5%) |
| $65,000 to $74,999 | 32 (11.8%) | 17 (6.2%) |
| $75,000 to $99,999 | 34 (12.6%) | 26 (9.6%) |
| $100,000+ | 95 (35.2%) | 19 (7.0%) |
| Total | 270 (100.0%) | 272 (100.0%) |
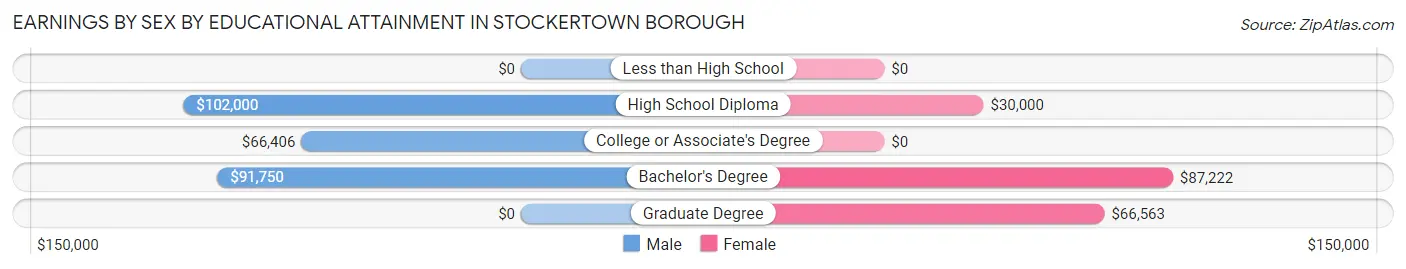
Earnings by Sex by Educational Attainment in Stockertown borough
Average earnings in Stockertown borough are $79,500 for men and $35,781 for women, a difference of 55.0%. Men with an educational attainment of high school diploma enjoy the highest average annual earnings of $102,000, while those with college or associate's degree education earn the least with $66,406. Women with an educational attainment of bachelor's degree earn the most with the average annual earnings of $87,222, while those with high school diploma education have the smallest earnings of $30,000.
| Educational Attainment | Male Income | Female Income |
| Less than High School | - | - |
| High School Diploma | $102,000 | $30,000 |
| College or Associate's Degree | $66,406 | $0 |
| Bachelor's Degree | $91,750 | $87,222 |
| Graduate Degree | - | - |
| Total | $79,500 | $35,781 |
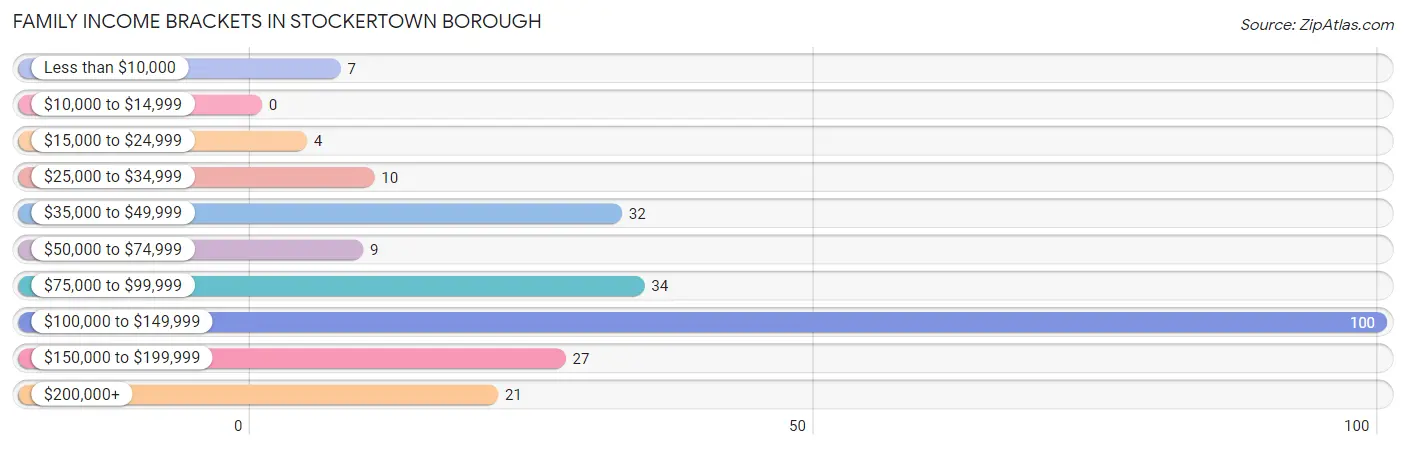
Family Income in Stockertown borough
Family Income Brackets in Stockertown borough
According to the Stockertown borough family income data, there are 100 families falling into the $100,000 to $149,999 income range, which is the most common income bracket and makes up 41.0% of all families.
| Income Bracket | # Families | % Families |
| Less than $10,000 | 7 | 2.9% |
| $10,000 to $14,999 | 0 | 0.0% |
| $15,000 to $24,999 | 4 | 1.6% |
| $25,000 to $34,999 | 10 | 4.1% |
| $35,000 to $49,999 | 32 | 13.1% |
| $50,000 to $74,999 | 9 | 3.7% |
| $75,000 to $99,999 | 34 | 13.9% |
| $100,000 to $149,999 | 100 | 41.0% |
| $150,000 to $199,999 | 27 | 11.1% |
| $200,000+ | 21 | 8.6% |
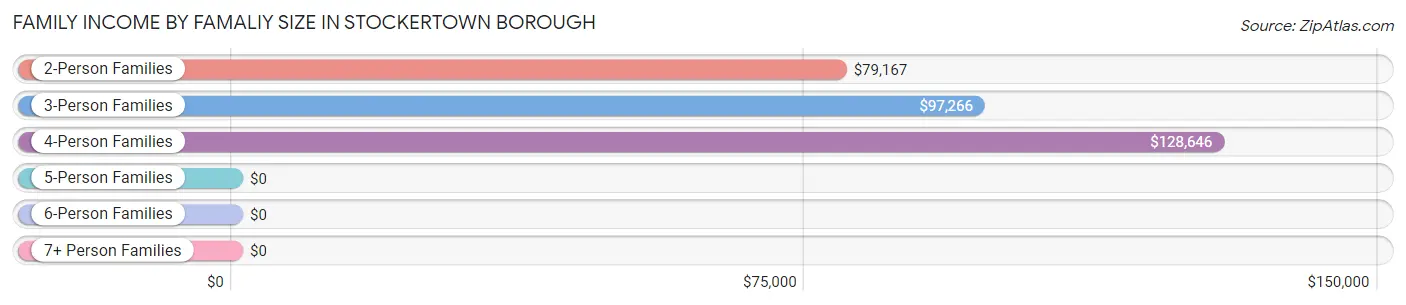
Family Income by Famaliy Size in Stockertown borough
4-person families (67 | 27.5%) account for the highest median family income in Stockertown borough with $128,646 per family, while 2-person families (100 | 41.0%) have the highest median income of $39,584 per family member.
| Income Bracket | # Families | Median Income |
| 2-Person Families | 100 (41.0%) | $79,167 |
| 3-Person Families | 55 (22.5%) | $97,266 |
| 4-Person Families | 67 (27.5%) | $128,646 |
| 5-Person Families | 15 (6.1%) | $0 |
| 6-Person Families | 4 (1.6%) | $0 |
| 7+ Person Families | 3 (1.2%) | $0 |
| Total | 244 (100.0%) | $119,167 |
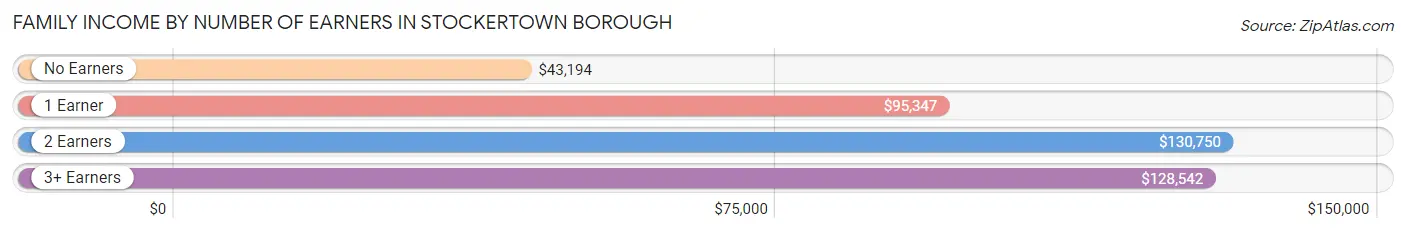
Family Income by Number of Earners in Stockertown borough
The median family income in Stockertown borough is $119,167, with families comprising 2 earners (87) having the highest median family income of $130,750, while families with no earners (38) have the lowest median family income of $43,194, accounting for 35.7% and 15.6% of families, respectively.
| Number of Earners | # Families | Median Income |
| No Earners | 38 (15.6%) | $43,194 |
| 1 Earner | 65 (26.6%) | $95,347 |
| 2 Earners | 87 (35.7%) | $130,750 |
| 3+ Earners | 54 (22.1%) | $128,542 |
| Total | 244 (100.0%) | $119,167 |
Household Income in Stockertown borough
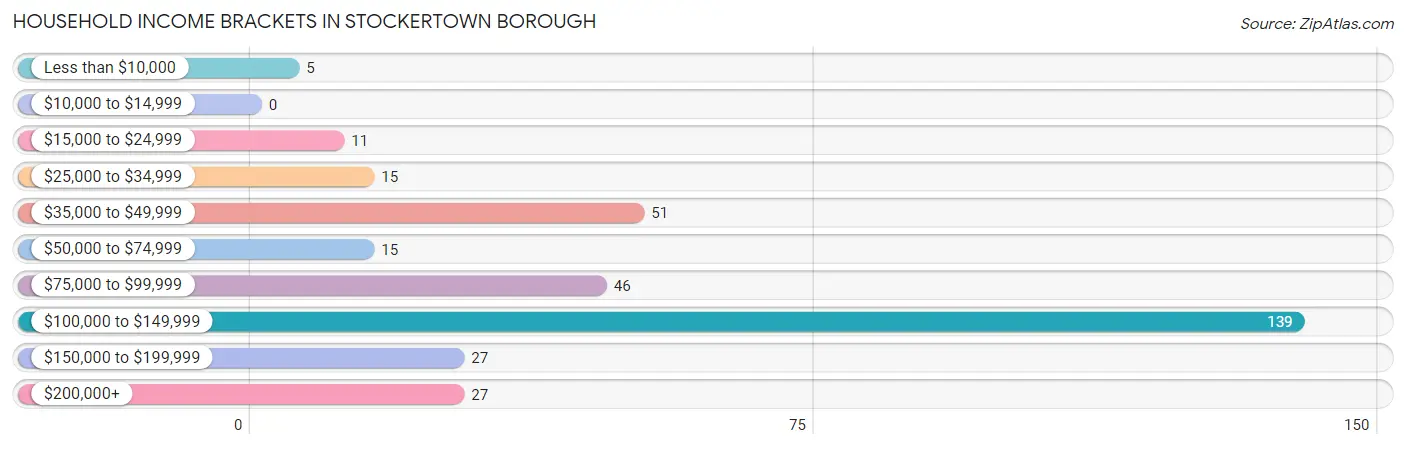
Household Income Brackets in Stockertown borough
With 139 households falling in the category, the $100,000 to $149,999 income range is the most frequent in Stockertown borough, accounting for 41.4% of all households.
| Income Bracket | # Households | % Households |
| Less than $10,000 | 5 | 1.5% |
| $10,000 to $14,999 | 0 | 0.0% |
| $15,000 to $24,999 | 11 | 3.3% |
| $25,000 to $34,999 | 15 | 4.5% |
| $35,000 to $49,999 | 51 | 15.2% |
| $50,000 to $74,999 | 15 | 4.5% |
| $75,000 to $99,999 | 46 | 13.7% |
| $100,000 to $149,999 | 139 | 41.4% |
| $150,000 to $199,999 | 27 | 8.0% |
| $200,000+ | 27 | 8.0% |
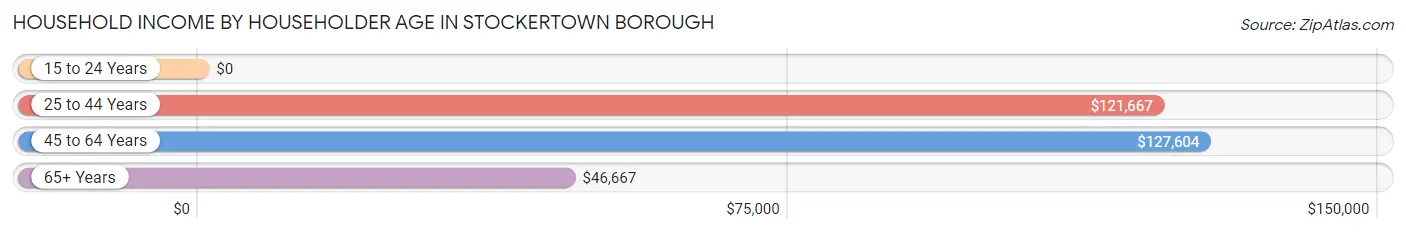
Household Income by Householder Age in Stockertown borough
The median household income in Stockertown borough is $112,692, with the highest median household income of $127,604 found in the 45 to 64 years age bracket for the primary householder. A total of 137 households (40.8%) fall into this category. Meanwhile, the 15 to 24 years age bracket for the primary householder has the lowest median household income of $0, with 11 households (3.3%) in this group.
| Income Bracket | # Households | Median Income |
| 15 to 24 Years | 11 (3.3%) | $0 |
| 25 to 44 Years | 88 (26.2%) | $121,667 |
| 45 to 64 Years | 137 (40.8%) | $127,604 |
| 65+ Years | 100 (29.8%) | $46,667 |
| Total | 336 (100.0%) | $112,692 |
Poverty in Stockertown borough
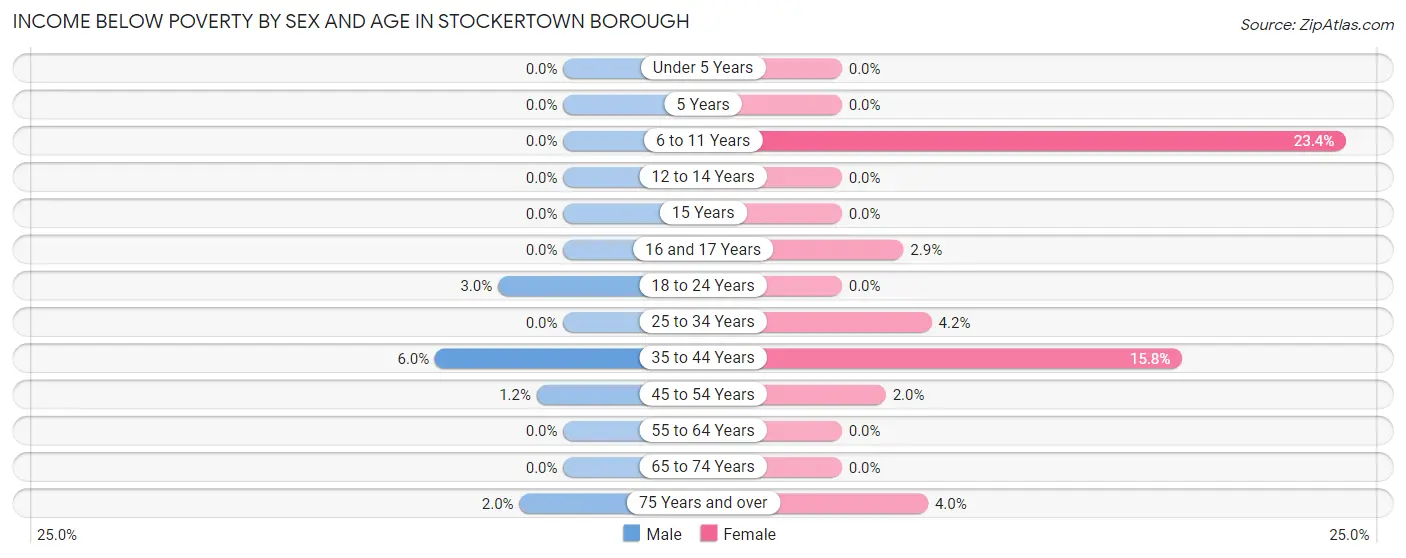
Income Below Poverty by Sex and Age in Stockertown borough
With 1.9% poverty level for males and 4.9% for females among the residents of Stockertown borough, 35 to 44 year old males and 6 to 11 year old females are the most vulnerable to poverty, with 5 males (5.9%) and 11 females (23.4%) in their respective age groups living below the poverty level.
| Age Bracket | Male | Female |
| Under 5 Years | 0 (0.0%) | 0 (0.0%) |
| 5 Years | 0 (0.0%) | 0 (0.0%) |
| 6 to 11 Years | 0 (0.0%) | 11 (23.4%) |
| 12 to 14 Years | 0 (0.0%) | 0 (0.0%) |
| 15 Years | 0 (0.0%) | 0 (0.0%) |
| 16 and 17 Years | 0 (0.0%) | 1 (2.9%) |
| 18 to 24 Years | 1 (3.0%) | 0 (0.0%) |
| 25 to 34 Years | 0 (0.0%) | 2 (4.2%) |
| 35 to 44 Years | 5 (5.9%) | 6 (15.8%) |
| 45 to 54 Years | 1 (1.2%) | 2 (2.0%) |
| 55 to 64 Years | 0 (0.0%) | 0 (0.0%) |
| 65 to 74 Years | 0 (0.0%) | 0 (0.0%) |
| 75 Years and over | 1 (2.0%) | 2 (4.0%) |
| Total | 8 (1.9%) | 24 (4.9%) |
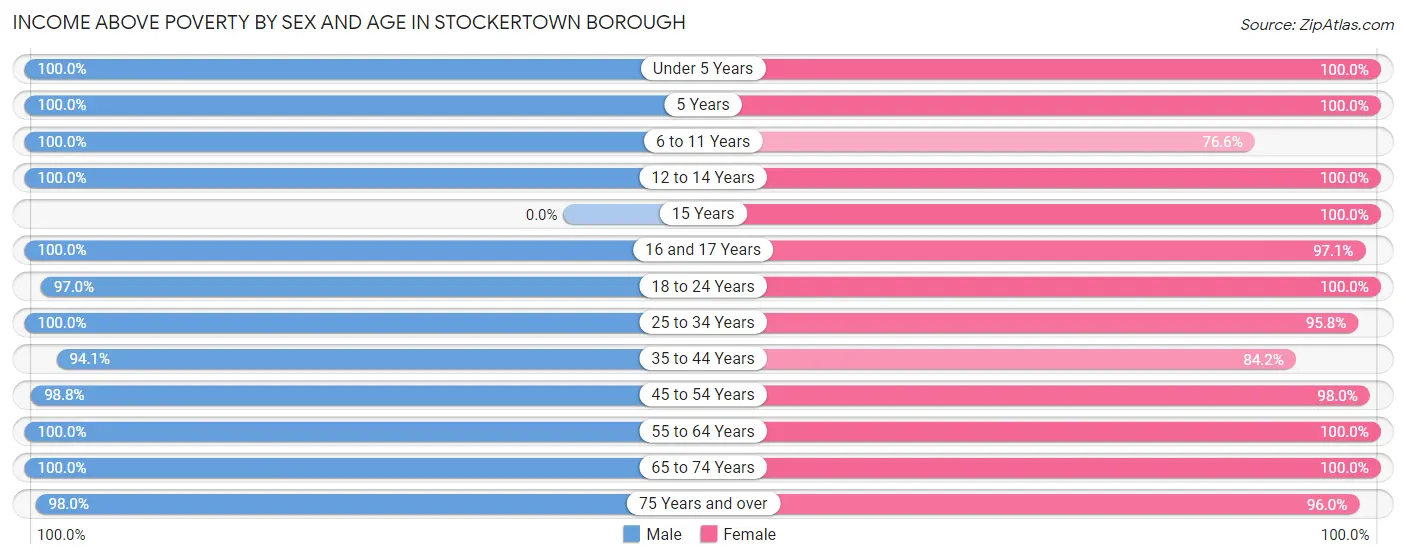
Income Above Poverty by Sex and Age in Stockertown borough
According to the poverty statistics in Stockertown borough, males aged under 5 years and females aged under 5 years are the age groups that are most secure financially, with 100.0% of males and 100.0% of females in these age groups living above the poverty line.
| Age Bracket | Male | Female |
| Under 5 Years | 14 (100.0%) | 22 (100.0%) |
| 5 Years | 4 (100.0%) | 4 (100.0%) |
| 6 to 11 Years | 17 (100.0%) | 36 (76.6%) |
| 12 to 14 Years | 4 (100.0%) | 9 (100.0%) |
| 15 Years | 0 (0.0%) | 2 (100.0%) |
| 16 and 17 Years | 3 (100.0%) | 34 (97.1%) |
| 18 to 24 Years | 32 (97.0%) | 66 (100.0%) |
| 25 to 34 Years | 39 (100.0%) | 46 (95.8%) |
| 35 to 44 Years | 79 (94.1%) | 32 (84.2%) |
| 45 to 54 Years | 80 (98.8%) | 96 (98.0%) |
| 55 to 64 Years | 56 (100.0%) | 28 (100.0%) |
| 65 to 74 Years | 36 (100.0%) | 44 (100.0%) |
| 75 Years and over | 48 (98.0%) | 48 (96.0%) |
| Total | 412 (98.1%) | 467 (95.1%) |
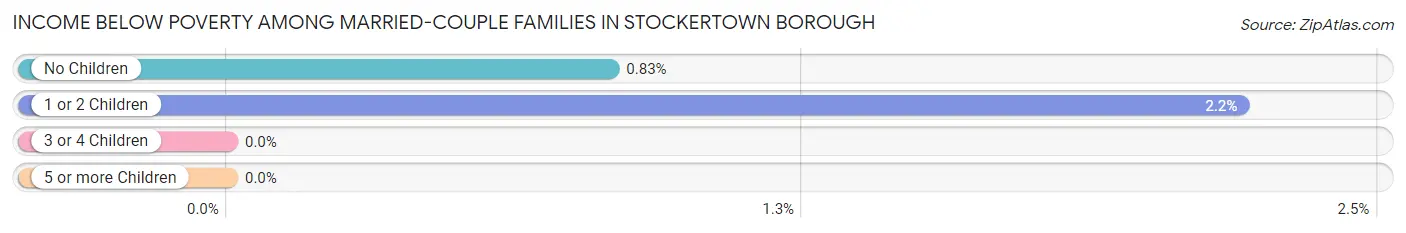
Income Below Poverty Among Married-Couple Families in Stockertown borough
The poverty statistics for married-couple families in Stockertown borough show that 1.4% or 3 of the total 221 families live below the poverty line. Families with 1 or 2 children have the highest poverty rate of 2.2%, comprising of 2 families. On the other hand, families with 3 or 4 children have the lowest poverty rate of 0.0%, which includes 0 families.
| Children | Above Poverty | Below Poverty |
| No Children | 119 (99.2%) | 1 (0.8%) |
| 1 or 2 Children | 89 (97.8%) | 2 (2.2%) |
| 3 or 4 Children | 10 (100.0%) | 0 (0.0%) |
| 5 or more Children | 0 (0.0%) | 0 (0.0%) |
| Total | 218 (98.6%) | 3 (1.4%) |
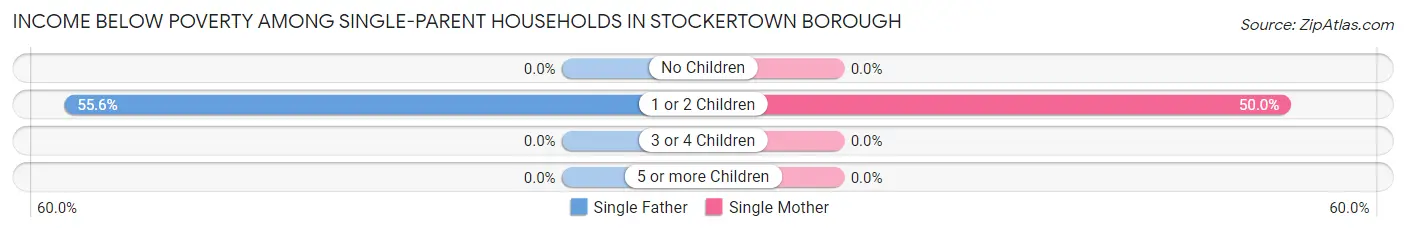
Income Below Poverty Among Single-Parent Households in Stockertown borough
According to the poverty data in Stockertown borough, 38.5% or 5 single-father households and 20.0% or 2 single-mother households are living below the poverty line. Among single-father households, those with 1 or 2 children have the highest poverty rate, with 5 households (55.6%) experiencing poverty. Likewise, among single-mother households, those with 1 or 2 children have the highest poverty rate, with 2 households (50.0%) falling below the poverty line.
| Children | Single Father | Single Mother |
| No Children | 0 (0.0%) | 0 (0.0%) |
| 1 or 2 Children | 5 (55.6%) | 2 (50.0%) |
| 3 or 4 Children | 0 (0.0%) | 0 (0.0%) |
| 5 or more Children | 0 (0.0%) | 0 (0.0%) |
| Total | 5 (38.5%) | 2 (20.0%) |
Income Below Poverty Among Married-Couple vs Single-Parent Households in Stockertown borough
The poverty data for Stockertown borough shows that 3 of the married-couple family households (1.4%) and 7 of the single-parent households (30.4%) are living below the poverty level. Within the married-couple family households, those with 1 or 2 children have the highest poverty rate, with 2 households (2.2%) falling below the poverty line. Among the single-parent households, those with 1 or 2 children have the highest poverty rate, with 7 household (53.8%) living below poverty.
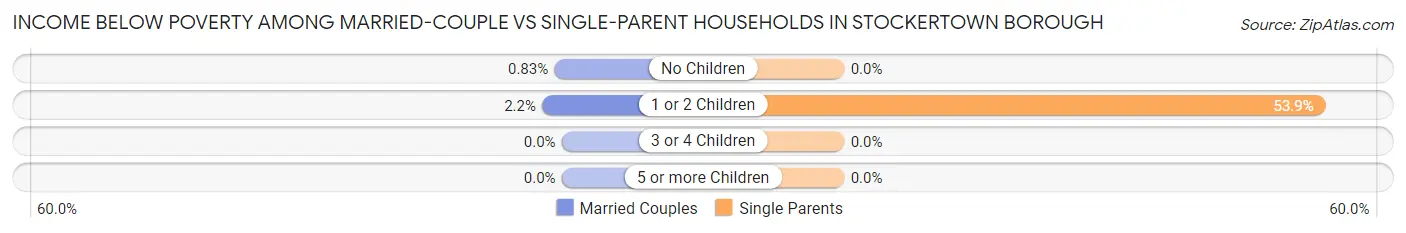
| Children | Married-Couple Families | Single-Parent Households |
| No Children | 1 (0.8%) | 0 (0.0%) |
| 1 or 2 Children | 2 (2.2%) | 7 (53.8%) |
| 3 or 4 Children | 0 (0.0%) | 0 (0.0%) |
| 5 or more Children | 0 (0.0%) | 0 (0.0%) |
| Total | 3 (1.4%) | 7 (30.4%) |
Race in Stockertown borough
The most populous races in Stockertown borough are White / Caucasian (881 | 96.7%), Two or more Races (23 | 2.5%), and Hispanic or Latino (13 | 1.4%).
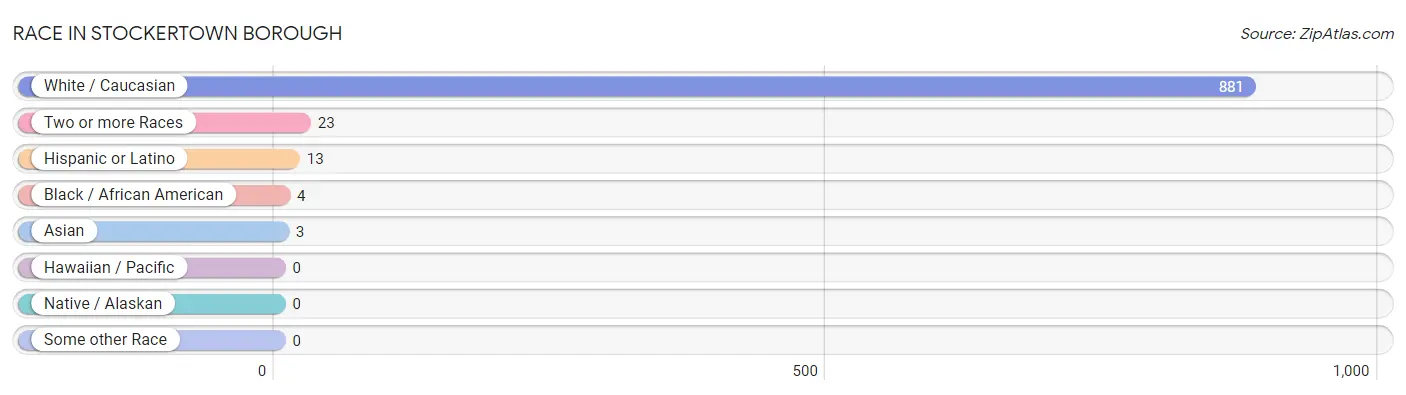
| Race | # Population | % Population |
| Asian | 3 | 0.3% |
| Black / African American | 4 | 0.4% |
| Hawaiian / Pacific | 0 | 0.0% |
| Hispanic or Latino | 13 | 1.4% |
| Native / Alaskan | 0 | 0.0% |
| White / Caucasian | 881 | 96.7% |
| Two or more Races | 23 | 2.5% |
| Some other Race | 0 | 0.0% |
| Total | 911 | 100.0% |
Ancestry in Stockertown borough
The most populous ancestries reported in Stockertown borough are German (349 | 38.3%), Irish (168 | 18.4%), English (104 | 11.4%), Italian (91 | 10.0%), and American (77 | 8.5%), together accounting for 86.6% of all Stockertown borough residents.
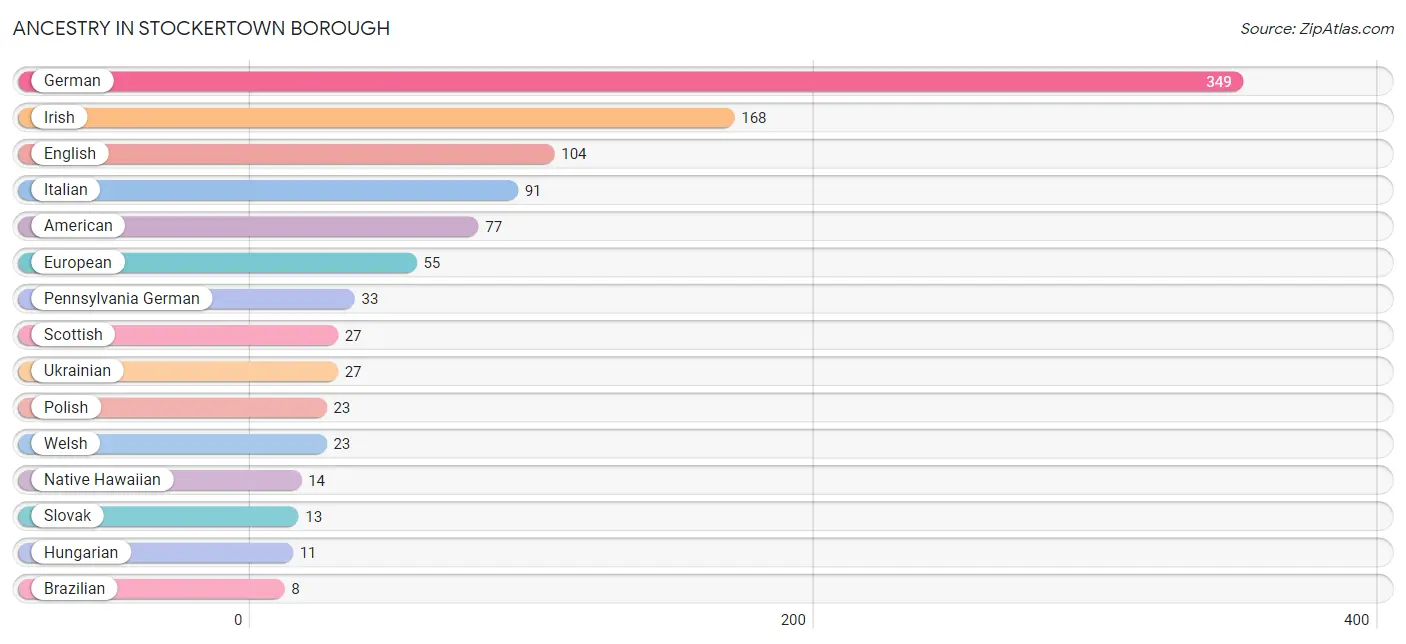
| Ancestry | # Population | % Population |
| American | 77 | 8.5% |
| Austrian | 3 | 0.3% |
| Brazilian | 8 | 0.9% |
| British | 2 | 0.2% |
| Burmese | 3 | 0.3% |
| Colombian | 1 | 0.1% |
| Croatian | 1 | 0.1% |
| Czech | 6 | 0.7% |
| Danish | 2 | 0.2% |
| Dutch | 5 | 0.5% |
| Eastern European | 2 | 0.2% |
| English | 104 | 11.4% |
| European | 55 | 6.0% |
| French | 4 | 0.4% |
| German | 349 | 38.3% |
| Hungarian | 11 | 1.2% |
| Irish | 168 | 18.4% |
| Italian | 91 | 10.0% |
| Mexican | 1 | 0.1% |
| Native Hawaiian | 14 | 1.5% |
| Pennsylvania German | 33 | 3.6% |
| Polish | 23 | 2.5% |
| Portuguese | 4 | 0.4% |
| Puerto Rican | 8 | 0.9% |
| Russian | 7 | 0.8% |
| Scandinavian | 5 | 0.5% |
| Scottish | 27 | 3.0% |
| Slovak | 13 | 1.4% |
| South American | 1 | 0.1% |
| Spanish | 3 | 0.3% |
| Swedish | 2 | 0.2% |
| Ukrainian | 27 | 3.0% |
| Welsh | 23 | 2.5% | View All 33 Rows |
Immigrants in Stockertown borough
The most numerous immigrant groups reported in Stockertown borough came from Europe (11 | 1.2%), Asia (5 | 0.5%), Eastern Europe (5 | 0.5%), Northern Europe (4 | 0.4%), and Poland (4 | 0.4%), together accounting for 3.2% of all Stockertown borough residents.
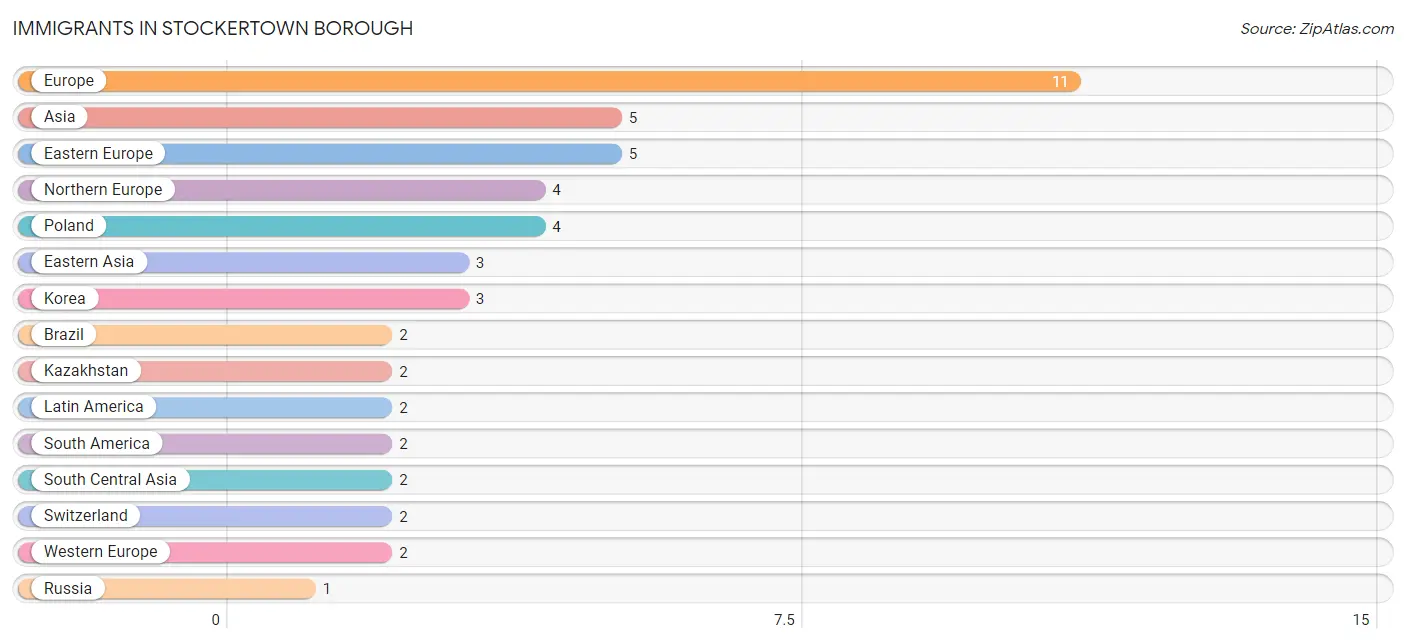
| Immigration Origin | # Population | % Population |
| Asia | 5 | 0.5% |
| Brazil | 2 | 0.2% |
| Eastern Asia | 3 | 0.3% |
| Eastern Europe | 5 | 0.5% |
| Europe | 11 | 1.2% |
| Kazakhstan | 2 | 0.2% |
| Korea | 3 | 0.3% |
| Latin America | 2 | 0.2% |
| Northern Europe | 4 | 0.4% |
| Poland | 4 | 0.4% |
| Russia | 1 | 0.1% |
| South America | 2 | 0.2% |
| South Central Asia | 2 | 0.2% |
| Switzerland | 2 | 0.2% |
| Western Europe | 2 | 0.2% | View All 15 Rows |
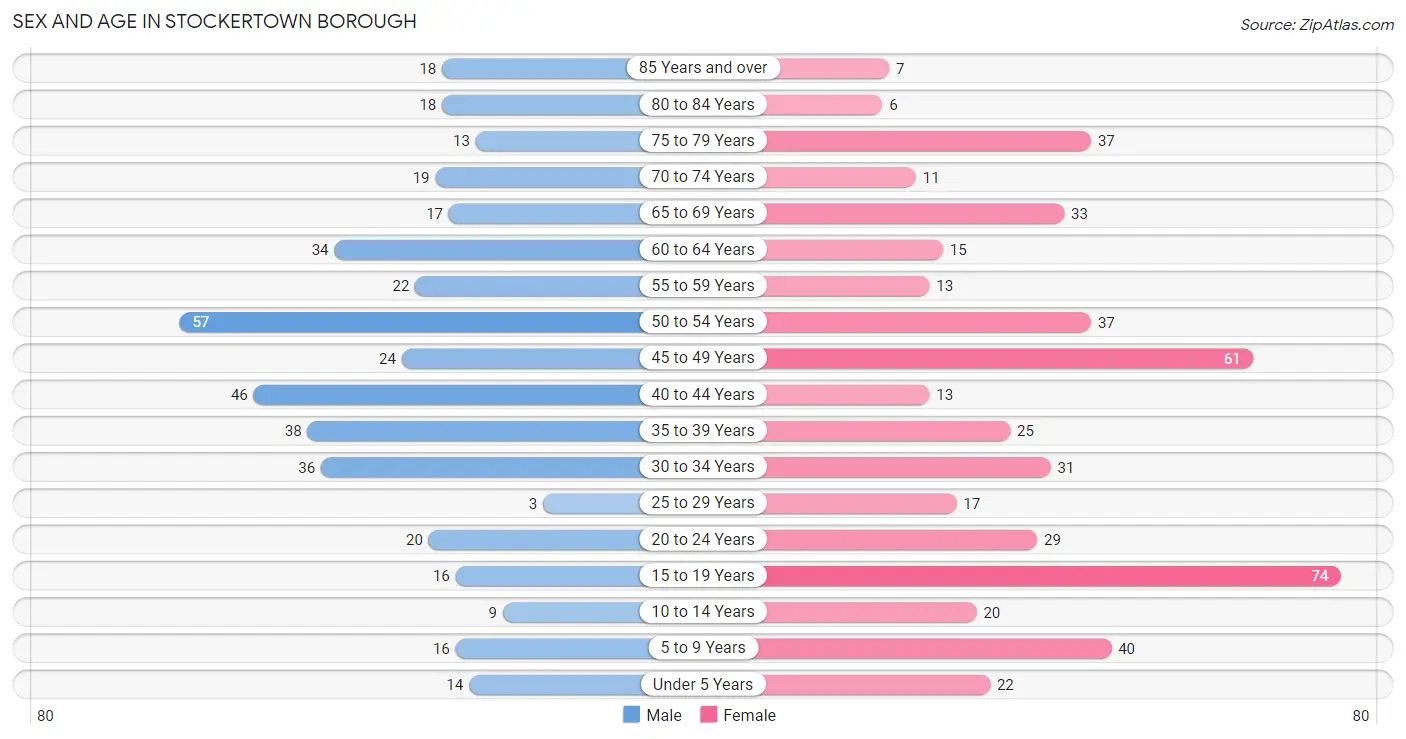
Sex and Age in Stockertown borough
Sex and Age in Stockertown borough
The most populous age groups in Stockertown borough are 50 to 54 Years (57 | 13.6%) for men and 15 to 19 Years (74 | 15.1%) for women.
| Age Bracket | Male | Female |
| Under 5 Years | 14 (3.3%) | 22 (4.5%) |
| 5 to 9 Years | 16 (3.8%) | 40 (8.2%) |
| 10 to 14 Years | 9 (2.1%) | 20 (4.1%) |
| 15 to 19 Years | 16 (3.8%) | 74 (15.1%) |
| 20 to 24 Years | 20 (4.8%) | 29 (5.9%) |
| 25 to 29 Years | 3 (0.7%) | 17 (3.5%) |
| 30 to 34 Years | 36 (8.6%) | 31 (6.3%) |
| 35 to 39 Years | 38 (9.0%) | 25 (5.1%) |
| 40 to 44 Years | 46 (11.0%) | 13 (2.6%) |
| 45 to 49 Years | 24 (5.7%) | 61 (12.4%) |
| 50 to 54 Years | 57 (13.6%) | 37 (7.5%) |
| 55 to 59 Years | 22 (5.2%) | 13 (2.6%) |
| 60 to 64 Years | 34 (8.1%) | 15 (3.0%) |
| 65 to 69 Years | 17 (4.1%) | 33 (6.7%) |
| 70 to 74 Years | 19 (4.5%) | 11 (2.2%) |
| 75 to 79 Years | 13 (3.1%) | 37 (7.5%) |
| 80 to 84 Years | 18 (4.3%) | 6 (1.2%) |
| 85 Years and over | 18 (4.3%) | 7 (1.4%) |
| Total | 420 (100.0%) | 491 (100.0%) |
Families and Households in Stockertown borough
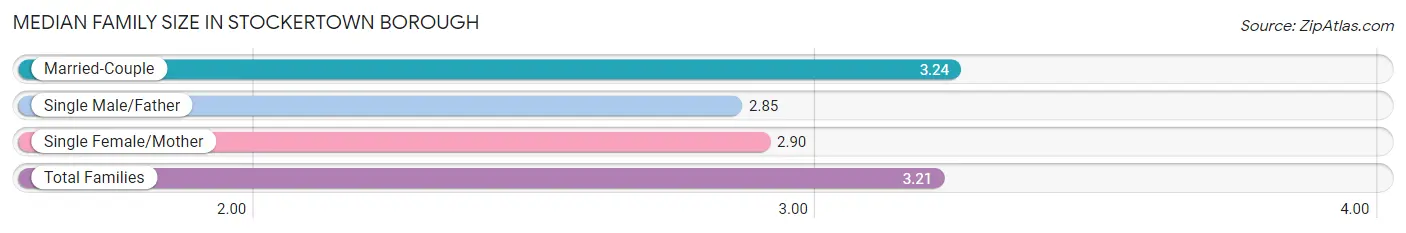
Median Family Size in Stockertown borough
The median family size in Stockertown borough is 3.21 persons per family, with married-couple families (221 | 90.6%) accounting for the largest median family size of 3.24 persons per family. On the other hand, single male/father families (13 | 5.3%) represent the smallest median family size with 2.85 persons per family.
| Family Type | # Families | Family Size |
| Married-Couple | 221 (90.6%) | 3.24 |
| Single Male/Father | 13 (5.3%) | 2.85 |
| Single Female/Mother | 10 (4.1%) | 2.90 |
| Total Families | 244 (100.0%) | 3.21 |
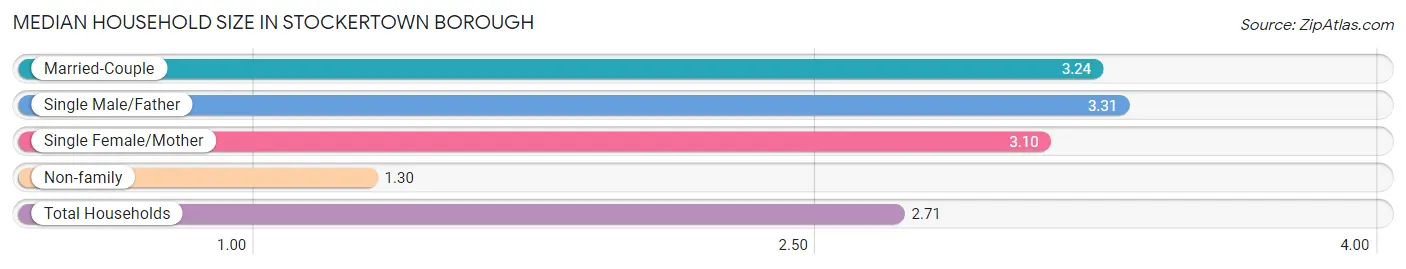
Median Household Size in Stockertown borough
The median household size in Stockertown borough is 2.71 persons per household, with single male/father households (13 | 3.9%) accounting for the largest median household size of 3.31 persons per household. non-family households (92 | 27.4%) represent the smallest median household size with 1.30 persons per household.
| Household Type | # Households | Household Size |
| Married-Couple | 221 (65.8%) | 3.24 |
| Single Male/Father | 13 (3.9%) | 3.31 |
| Single Female/Mother | 10 (3.0%) | 3.10 |
| Non-family | 92 (27.4%) | 1.30 |
| Total Households | 336 (100.0%) | 2.71 |
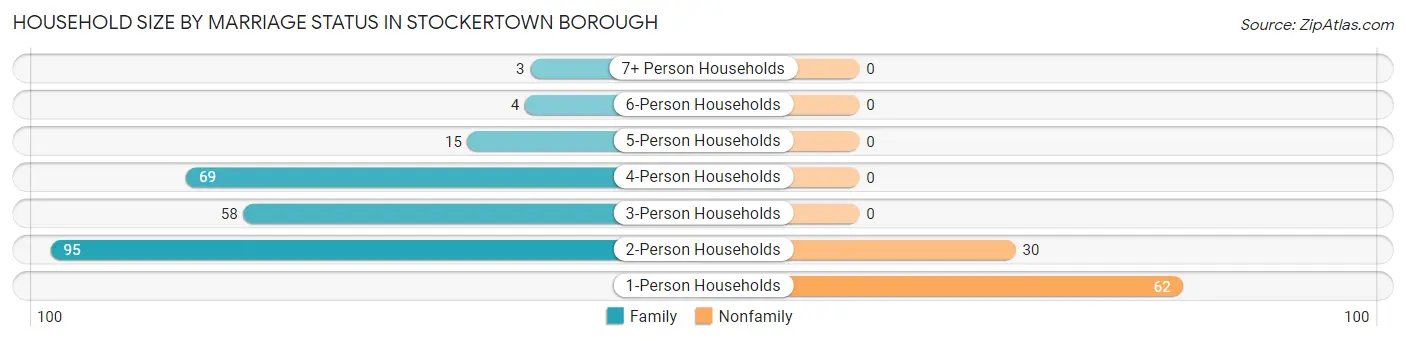
Household Size by Marriage Status in Stockertown borough
Out of a total of 336 households in Stockertown borough, 244 (72.6%) are family households, while 92 (27.4%) are nonfamily households. The most numerous type of family households are 2-person households, comprising 95, and the most common type of nonfamily households are 1-person households, comprising 62.
| Household Size | Family Households | Nonfamily Households |
| 1-Person Households | - | 62 (18.4%) |
| 2-Person Households | 95 (28.3%) | 30 (8.9%) |
| 3-Person Households | 58 (17.3%) | 0 (0.0%) |
| 4-Person Households | 69 (20.5%) | 0 (0.0%) |
| 5-Person Households | 15 (4.5%) | 0 (0.0%) |
| 6-Person Households | 4 (1.2%) | 0 (0.0%) |
| 7+ Person Households | 3 (0.9%) | 0 (0.0%) |
| Total | 244 (72.6%) | 92 (27.4%) |
Female Fertility in Stockertown borough
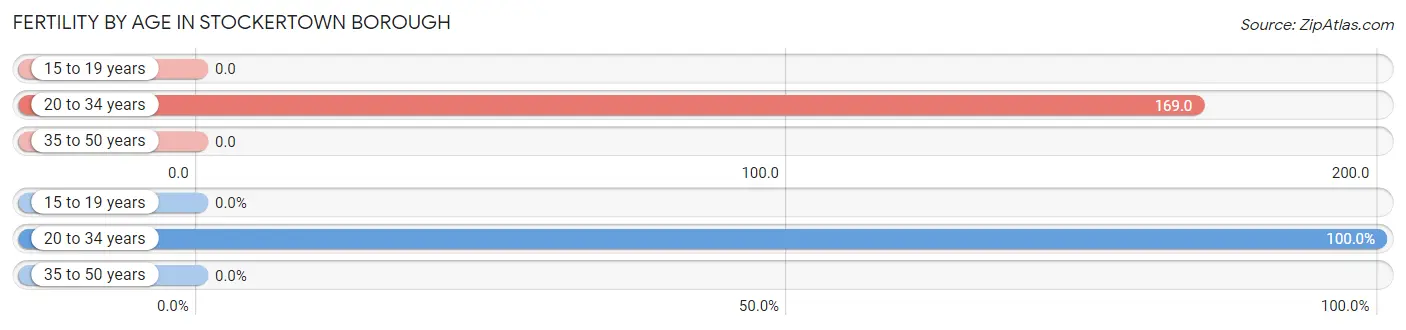
Fertility by Age in Stockertown borough
Average fertility rate in Stockertown borough is 50.0 births per 1,000 women. Women in the age bracket of 20 to 34 years have the highest fertility rate with 169.0 births per 1,000 women. Women in the age bracket of 20 to 34 years acount for 100.0% of all women with births.
| Age Bracket | Women with Births | Births / 1,000 Women |
| 15 to 19 years | 0 (0.0%) | 0.0 |
| 20 to 34 years | 13 (100.0%) | 169.0 |
| 35 to 50 years | 0 (0.0%) | 0.0 |
| Total | 13 (100.0%) | 50.0 |
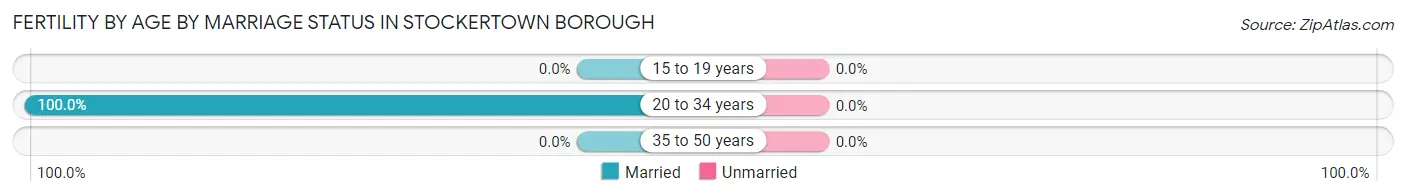
Fertility by Age by Marriage Status in Stockertown borough
| Age Bracket | Married | Unmarried |
| 15 to 19 years | 0 (0.0%) | 0 (0.0%) |
| 20 to 34 years | 13 (100.0%) | 0 (0.0%) |
| 35 to 50 years | 0 (0.0%) | 0 (0.0%) |
| Total | 13 (100.0%) | 0 (0.0%) |
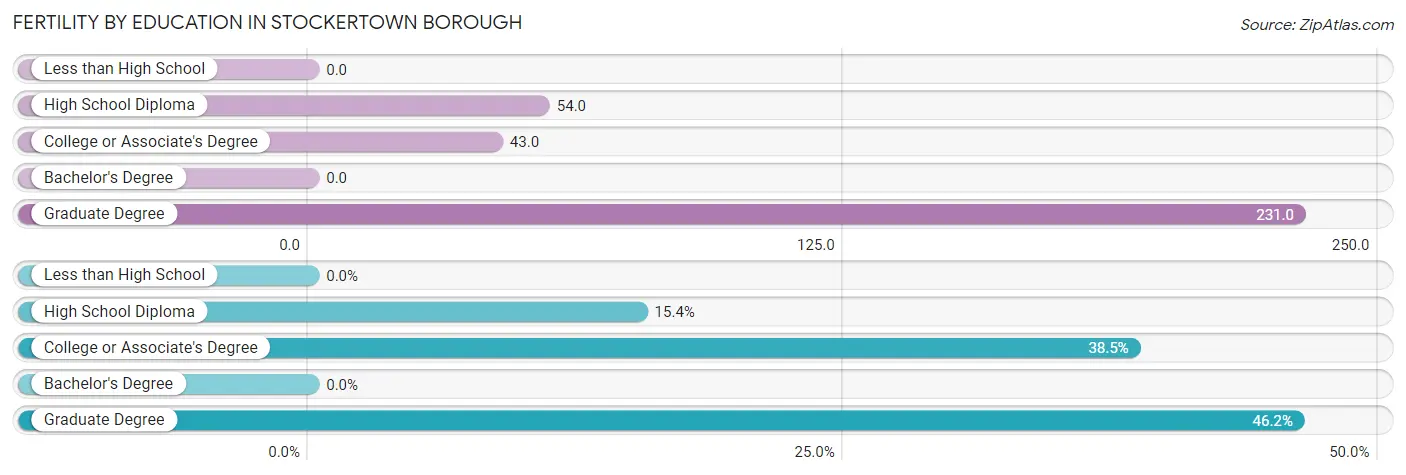
Fertility by Education in Stockertown borough
| Educational Attainment | Women with Births | Births / 1,000 Women |
| Less than High School | 0 (0.0%) | 0.0 |
| High School Diploma | 2 (15.4%) | 54.0 |
| College or Associate's Degree | 5 (38.5%) | 43.0 |
| Bachelor's Degree | 0 (0.0%) | 0.0 |
| Graduate Degree | 6 (46.2%) | 231.0 |
| Total | 13 (100.0%) | 50.0 |
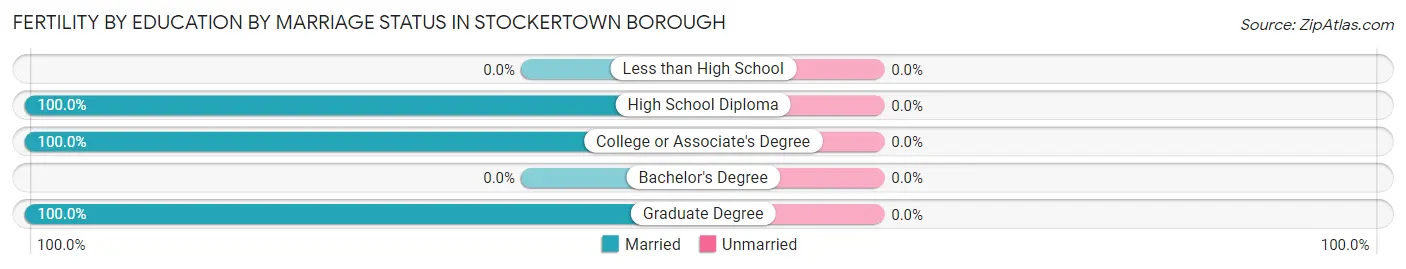
Fertility by Education by Marriage Status in Stockertown borough
| Educational Attainment | Married | Unmarried |
| Less than High School | 0 (0.0%) | 0 (0.0%) |
| High School Diploma | 2 (100.0%) | 0 (0.0%) |
| College or Associate's Degree | 5 (100.0%) | 0 (0.0%) |
| Bachelor's Degree | 0 (0.0%) | 0 (0.0%) |
| Graduate Degree | 6 (100.0%) | 0 (0.0%) |
| Total | 13 (100.0%) | 0 (0.0%) |
Employment Characteristics in Stockertown borough
Employment by Class of Employer in Stockertown borough
Among the 490 employed individuals in Stockertown borough, private company employees (330 | 67.3%), self-employed (not incorporated) (61 | 12.4%), and not-for-profit organizations (44 | 9.0%) make up the most common classes of employment.
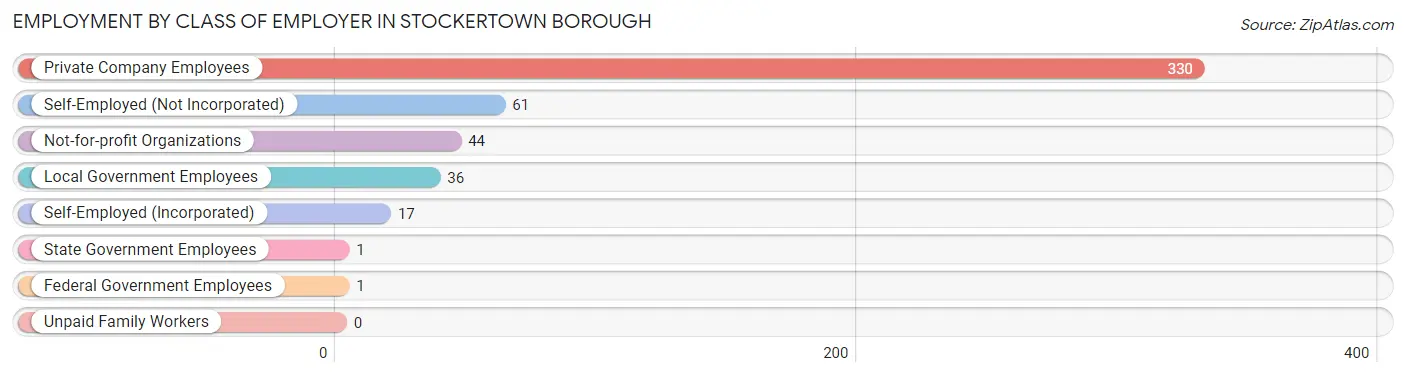
| Employer Class | # Employees | % Employees |
| Private Company Employees | 330 | 67.3% |
| Self-Employed (Incorporated) | 17 | 3.5% |
| Self-Employed (Not Incorporated) | 61 | 12.4% |
| Not-for-profit Organizations | 44 | 9.0% |
| Local Government Employees | 36 | 7.3% |
| State Government Employees | 1 | 0.2% |
| Federal Government Employees | 1 | 0.2% |
| Unpaid Family Workers | 0 | 0.0% |
| Total | 490 | 100.0% |
Employment Status by Age in Stockertown borough
According to the labor force statistics for Stockertown borough, out of the total population over 16 years of age (788), 64.7% or 510 individuals are in the labor force, with 2.5% or 13 of them unemployed. The age group with the highest labor force participation rate is 45 to 54 years, with 98.9% or 177 individuals in the labor force. Within the labor force, the 35 to 44 years age range has the highest percentage of unemployed individuals, with 6.5% or 6 of them being unemployed.
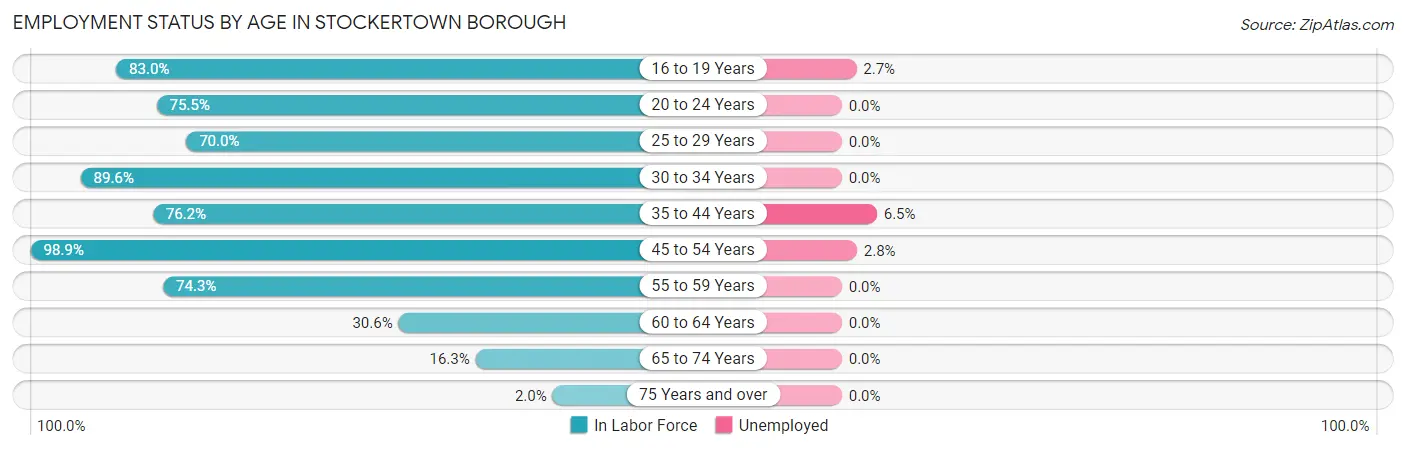
| Age Bracket | In Labor Force | Unemployed |
| 16 to 19 Years | 73 (83.0%) | 2 (2.7%) |
| 20 to 24 Years | 37 (75.5%) | 0 (0.0%) |
| 25 to 29 Years | 14 (70.0%) | 0 (0.0%) |
| 30 to 34 Years | 60 (89.6%) | 0 (0.0%) |
| 35 to 44 Years | 93 (76.2%) | 6 (6.5%) |
| 45 to 54 Years | 177 (98.9%) | 5 (2.8%) |
| 55 to 59 Years | 26 (74.3%) | 0 (0.0%) |
| 60 to 64 Years | 15 (30.6%) | 0 (0.0%) |
| 65 to 74 Years | 13 (16.3%) | 0 (0.0%) |
| 75 Years and over | 2 (2.0%) | 0 (0.0%) |
| Total | 510 (64.7%) | 13 (2.5%) |
Employment Status by Educational Attainment in Stockertown borough
According to labor force statistics for Stockertown borough, 81.6% of individuals (385) out of the total population between 25 and 64 years of age (472) are in the labor force, with 2.9% or 11 of them being unemployed. The group with the highest labor force participation rate are those with the educational attainment of college / associate degree, with 86.4% or 127 individuals in the labor force. Within the labor force, individuals with high school diploma education have the highest percentage of unemployment, with 4.8% or 6 of them being unemployed.
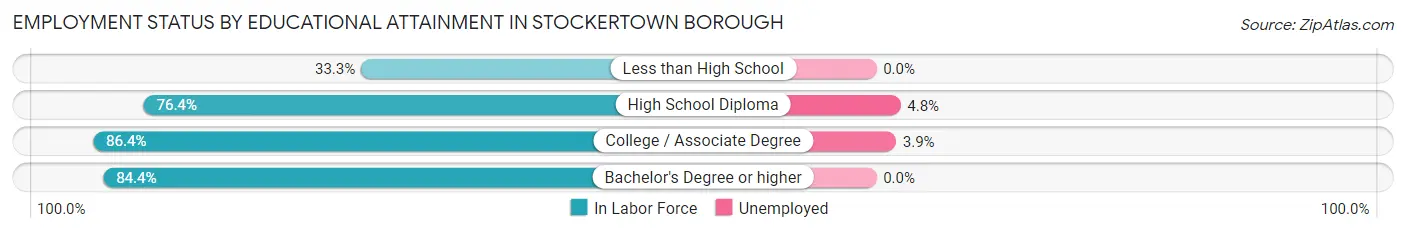
| Educational Attainment | In Labor Force | Unemployed |
| Less than High School | 2 (33.3%) | 0 (0.0%) |
| High School Diploma | 126 (76.4%) | 8 (4.8%) |
| College / Associate Degree | 127 (86.4%) | 6 (3.9%) |
| Bachelor's Degree or higher | 130 (84.4%) | 0 (0.0%) |
| Total | 385 (81.6%) | 14 (2.9%) |
Employment Occupations by Sex in Stockertown borough
Management, Business, Science and Arts Occupations
The most common Management, Business, Science and Arts occupations in Stockertown borough are Management (47 | 9.5%), Community & Social Service (38 | 7.6%), Health Diagnosing & Treating (34 | 6.8%), Business & Financial (33 | 6.6%), and Computers, Engineering & Science (23 | 4.6%).
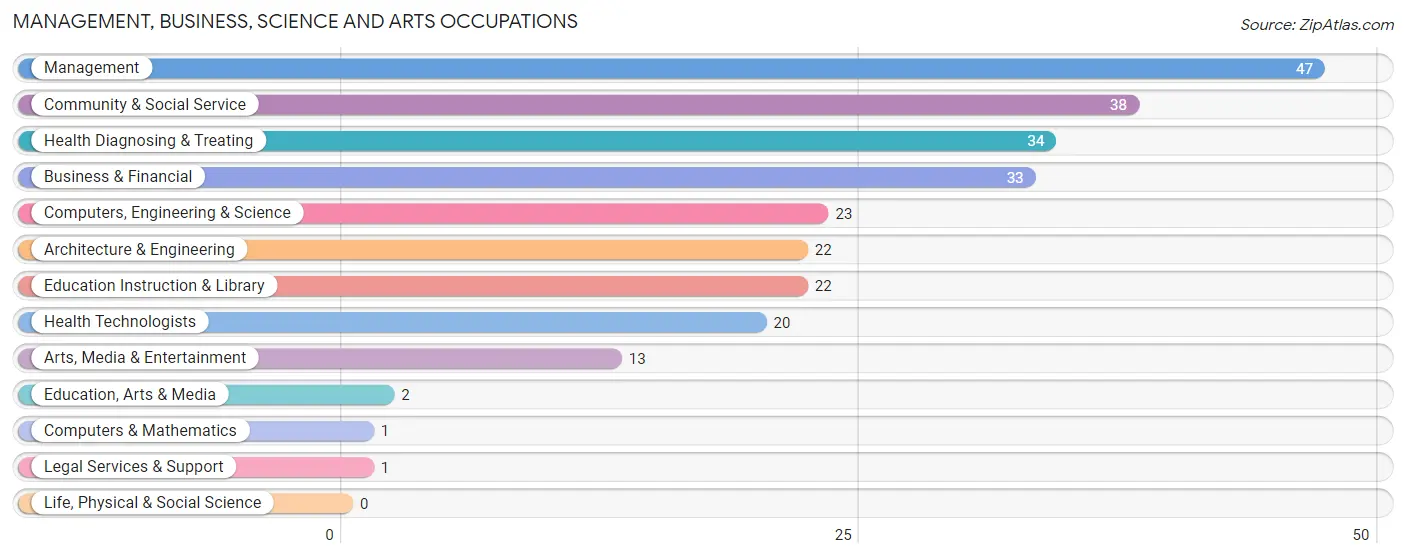
Management, Business, Science and Arts Occupations by Sex
Within the Management, Business, Science and Arts occupations in Stockertown borough, the most male-oriented occupations are Computers, Engineering & Science (100.0%), Computers & Mathematics (100.0%), and Architecture & Engineering (100.0%), while the most female-oriented occupations are Education, Arts & Media (100.0%), Business & Financial (81.8%), and Health Diagnosing & Treating (73.5%).
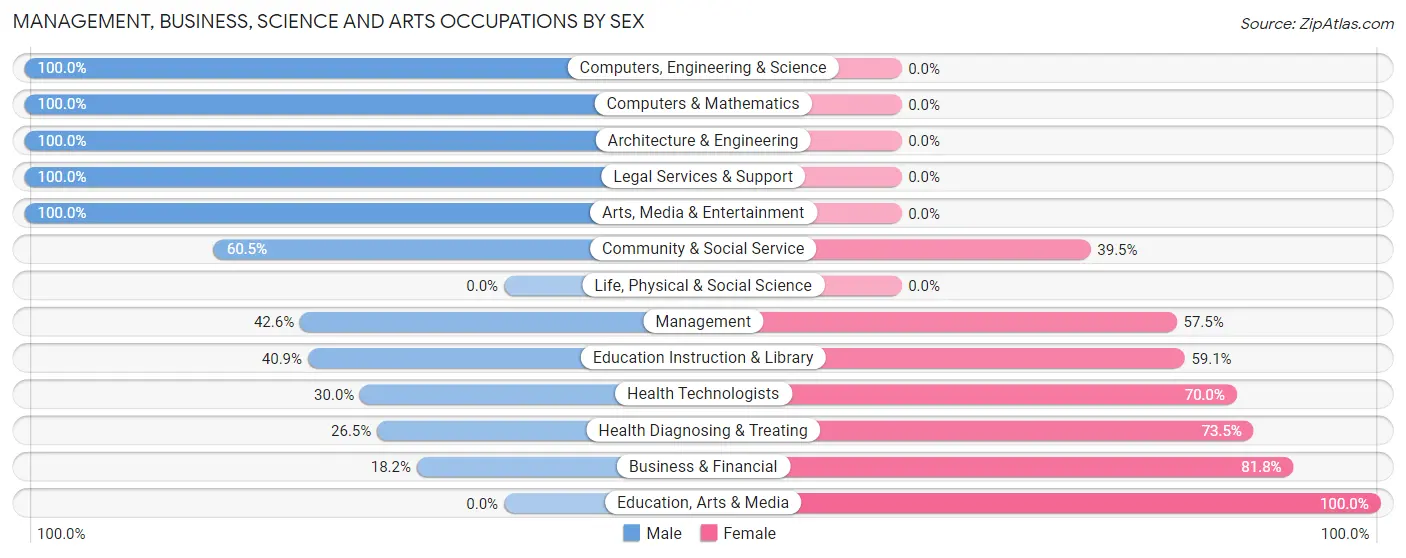
| Occupation | Male | Female |
| Management | 20 (42.5%) | 27 (57.5%) |
| Business & Financial | 6 (18.2%) | 27 (81.8%) |
| Computers, Engineering & Science | 23 (100.0%) | 0 (0.0%) |
| Computers & Mathematics | 1 (100.0%) | 0 (0.0%) |
| Architecture & Engineering | 22 (100.0%) | 0 (0.0%) |
| Life, Physical & Social Science | 0 (0.0%) | 0 (0.0%) |
| Community & Social Service | 23 (60.5%) | 15 (39.5%) |
| Education, Arts & Media | 0 (0.0%) | 2 (100.0%) |
| Legal Services & Support | 1 (100.0%) | 0 (0.0%) |
| Education Instruction & Library | 9 (40.9%) | 13 (59.1%) |
| Arts, Media & Entertainment | 13 (100.0%) | 0 (0.0%) |
| Health Diagnosing & Treating | 9 (26.5%) | 25 (73.5%) |
| Health Technologists | 6 (30.0%) | 14 (70.0%) |
| Total (Category) | 81 (46.3%) | 94 (53.7%) |
| Total (Overall) | 236 (47.5%) | 261 (52.5%) |
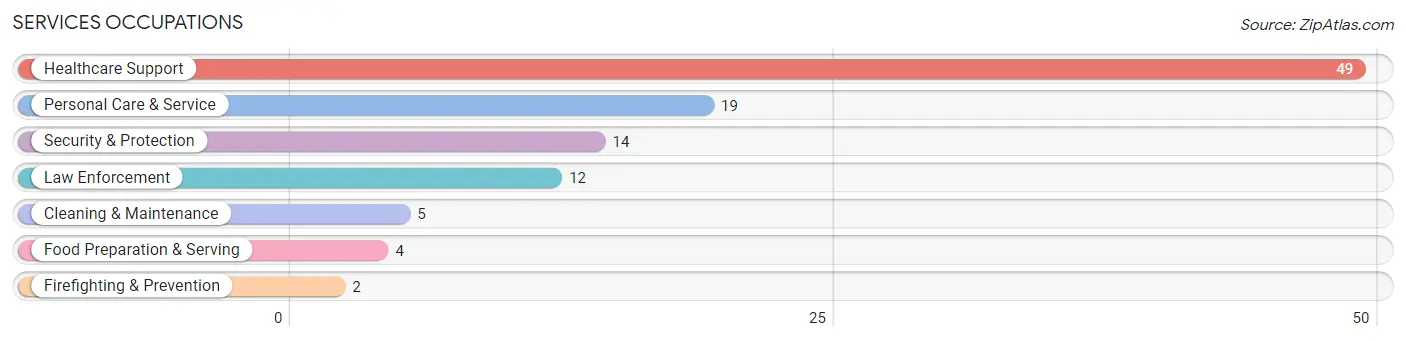
Services Occupations
The most common Services occupations in Stockertown borough are Healthcare Support (49 | 9.9%), Personal Care & Service (19 | 3.8%), Security & Protection (14 | 2.8%), Law Enforcement (12 | 2.4%), and Cleaning & Maintenance (5 | 1.0%).
Services Occupations by Sex
Within the Services occupations in Stockertown borough, the most male-oriented occupations are Security & Protection (100.0%), Firefighting & Prevention (100.0%), and Law Enforcement (100.0%), while the most female-oriented occupations are Healthcare Support (100.0%), Food Preparation & Serving (100.0%), and Personal Care & Service (47.4%).
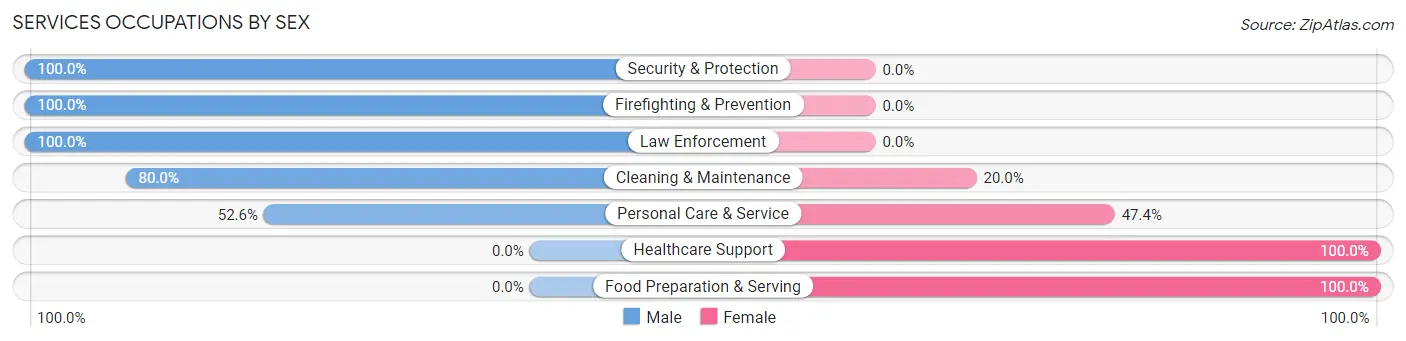
| Occupation | Male | Female |
| Healthcare Support | 0 (0.0%) | 49 (100.0%) |
| Security & Protection | 14 (100.0%) | 0 (0.0%) |
| Firefighting & Prevention | 2 (100.0%) | 0 (0.0%) |
| Law Enforcement | 12 (100.0%) | 0 (0.0%) |
| Food Preparation & Serving | 0 (0.0%) | 4 (100.0%) |
| Cleaning & Maintenance | 4 (80.0%) | 1 (20.0%) |
| Personal Care & Service | 10 (52.6%) | 9 (47.4%) |
| Total (Category) | 28 (30.8%) | 63 (69.2%) |
| Total (Overall) | 236 (47.5%) | 261 (52.5%) |
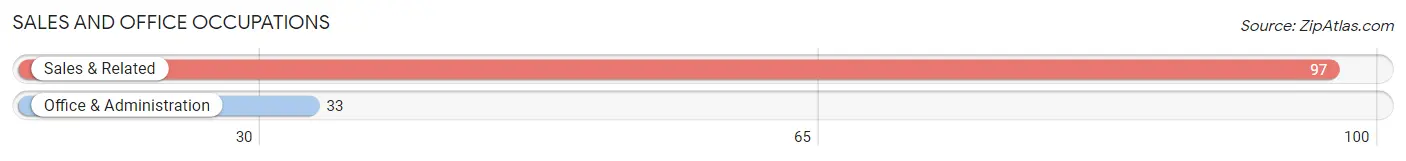
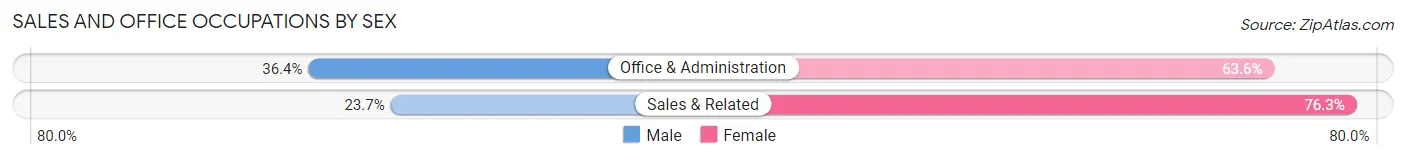
Sales and Office Occupations
The most common Sales and Office occupations in Stockertown borough are Sales & Related (97 | 19.5%), and Office & Administration (33 | 6.6%).
Sales and Office Occupations by Sex
| Occupation | Male | Female |
| Sales & Related | 23 (23.7%) | 74 (76.3%) |
| Office & Administration | 12 (36.4%) | 21 (63.6%) |
| Total (Category) | 35 (26.9%) | 95 (73.1%) |
| Total (Overall) | 236 (47.5%) | 261 (52.5%) |
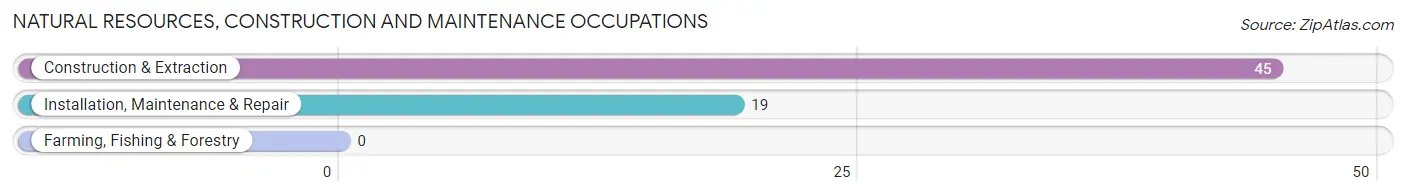
Natural Resources, Construction and Maintenance Occupations
The most common Natural Resources, Construction and Maintenance occupations in Stockertown borough are Construction & Extraction (45 | 9.0%), and Installation, Maintenance & Repair (19 | 3.8%).
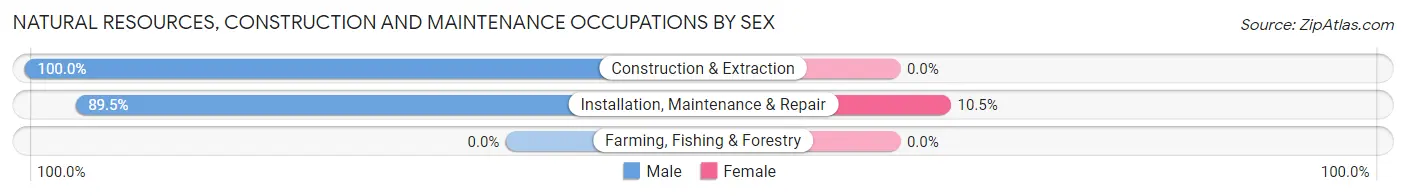
Natural Resources, Construction and Maintenance Occupations by Sex
| Occupation | Male | Female |
| Farming, Fishing & Forestry | 0 (0.0%) | 0 (0.0%) |
| Construction & Extraction | 45 (100.0%) | 0 (0.0%) |
| Installation, Maintenance & Repair | 17 (89.5%) | 2 (10.5%) |
| Total (Category) | 62 (96.9%) | 2 (3.1%) |
| Total (Overall) | 236 (47.5%) | 261 (52.5%) |
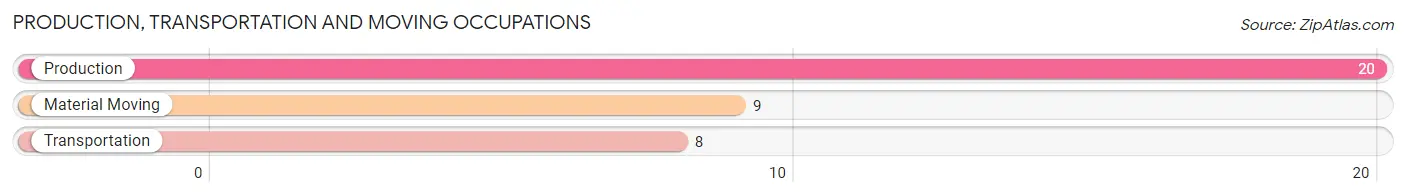
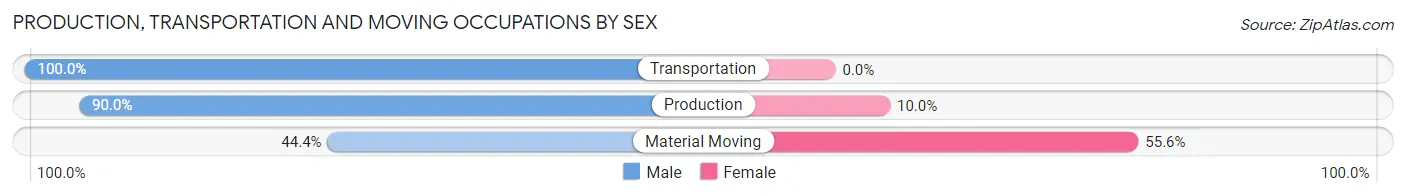
Production, Transportation and Moving Occupations
The most common Production, Transportation and Moving occupations in Stockertown borough are Production (20 | 4.0%), Material Moving (9 | 1.8%), and Transportation (8 | 1.6%).
Production, Transportation and Moving Occupations by Sex
| Occupation | Male | Female |
| Production | 18 (90.0%) | 2 (10.0%) |
| Transportation | 8 (100.0%) | 0 (0.0%) |
| Material Moving | 4 (44.4%) | 5 (55.6%) |
| Total (Category) | 30 (81.1%) | 7 (18.9%) |
| Total (Overall) | 236 (47.5%) | 261 (52.5%) |
Employment Industries by Sex in Stockertown borough
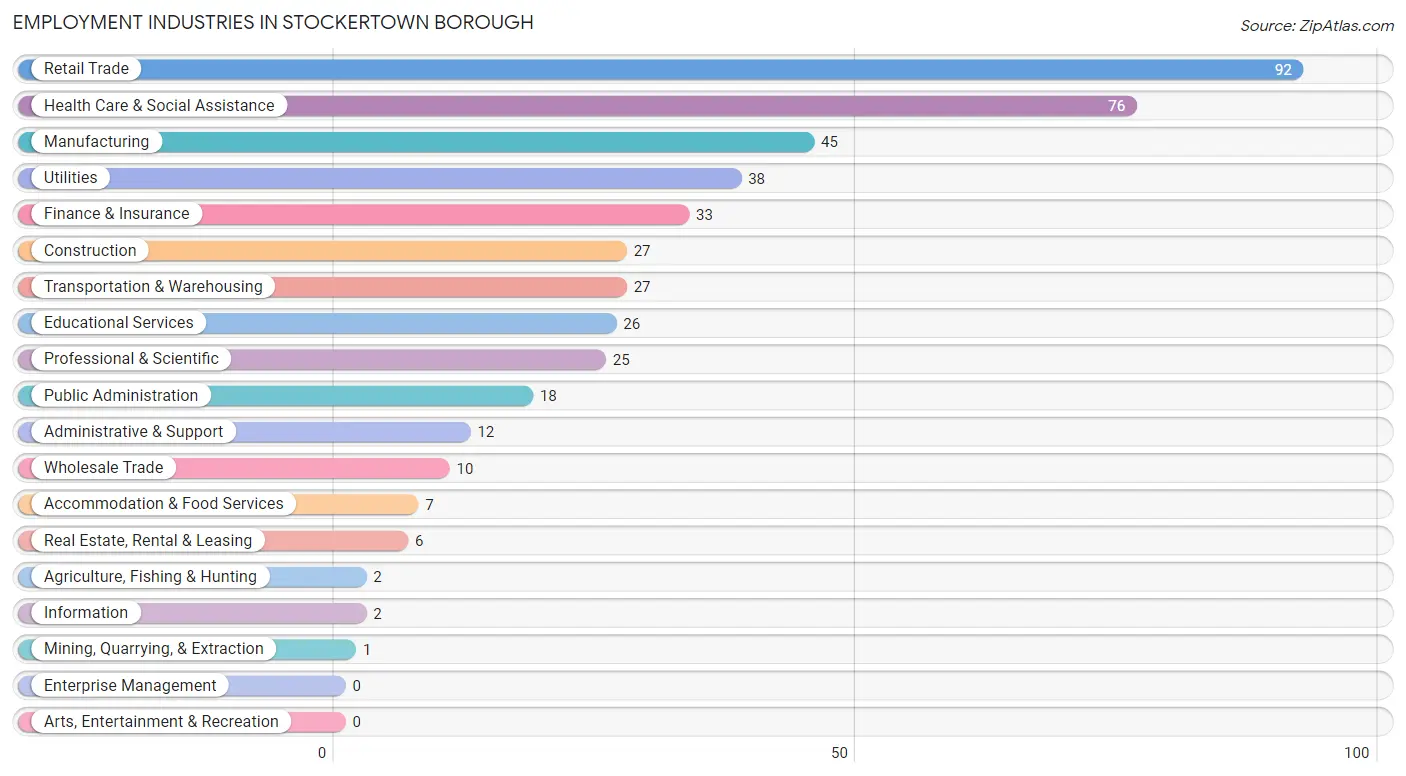
Employment Industries in Stockertown borough
The major employment industries in Stockertown borough include Retail Trade (92 | 18.5%), Health Care & Social Assistance (76 | 15.3%), Manufacturing (45 | 9.0%), Utilities (38 | 7.6%), and Finance & Insurance (33 | 6.6%).
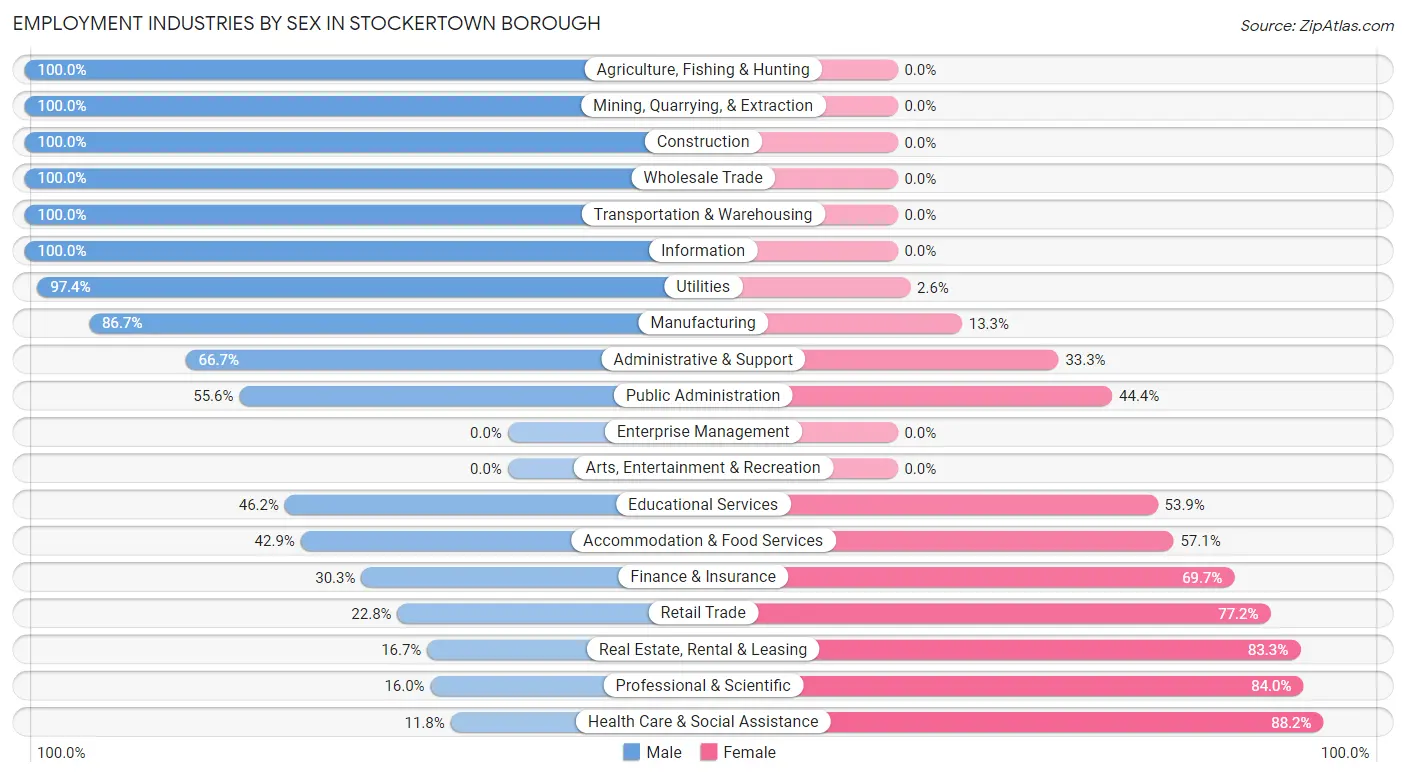
Employment Industries by Sex in Stockertown borough
The Stockertown borough industries that see more men than women are Agriculture, Fishing & Hunting (100.0%), Mining, Quarrying, & Extraction (100.0%), and Construction (100.0%), whereas the industries that tend to have a higher number of women are Health Care & Social Assistance (88.2%), Professional & Scientific (84.0%), and Real Estate, Rental & Leasing (83.3%).
| Industry | Male | Female |
| Agriculture, Fishing & Hunting | 2 (100.0%) | 0 (0.0%) |
| Mining, Quarrying, & Extraction | 1 (100.0%) | 0 (0.0%) |
| Construction | 27 (100.0%) | 0 (0.0%) |
| Manufacturing | 39 (86.7%) | 6 (13.3%) |
| Wholesale Trade | 10 (100.0%) | 0 (0.0%) |
| Retail Trade | 21 (22.8%) | 71 (77.2%) |
| Transportation & Warehousing | 27 (100.0%) | 0 (0.0%) |
| Utilities | 37 (97.4%) | 1 (2.6%) |
| Information | 2 (100.0%) | 0 (0.0%) |
| Finance & Insurance | 10 (30.3%) | 23 (69.7%) |
| Real Estate, Rental & Leasing | 1 (16.7%) | 5 (83.3%) |
| Professional & Scientific | 4 (16.0%) | 21 (84.0%) |
| Enterprise Management | 0 (0.0%) | 0 (0.0%) |
| Administrative & Support | 8 (66.7%) | 4 (33.3%) |
| Educational Services | 12 (46.2%) | 14 (53.8%) |
| Health Care & Social Assistance | 9 (11.8%) | 67 (88.2%) |
| Arts, Entertainment & Recreation | 0 (0.0%) | 0 (0.0%) |
| Accommodation & Food Services | 3 (42.9%) | 4 (57.1%) |
| Public Administration | 10 (55.6%) | 8 (44.4%) |
| Total | 236 (47.5%) | 261 (52.5%) |
Education in Stockertown borough
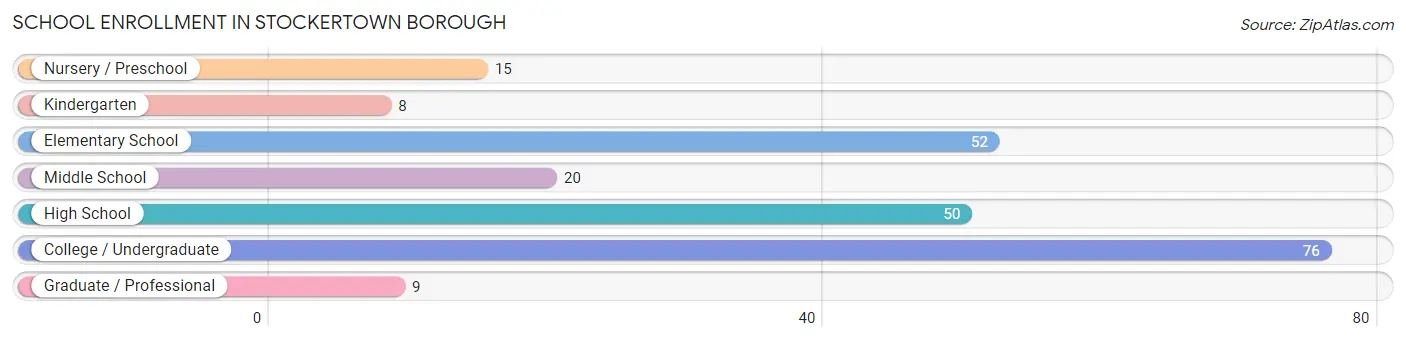
School Enrollment in Stockertown borough
The most common levels of schooling among the 230 students in Stockertown borough are college / undergraduate (76 | 33.0%), elementary school (52 | 22.6%), and high school (50 | 21.7%).
| School Level | # Students | % Students |
| Nursery / Preschool | 15 | 6.5% |
| Kindergarten | 8 | 3.5% |
| Elementary School | 52 | 22.6% |
| Middle School | 20 | 8.7% |
| High School | 50 | 21.7% |
| College / Undergraduate | 76 | 33.0% |
| Graduate / Professional | 9 | 3.9% |
| Total | 230 | 100.0% |
School Enrollment by Age by Funding Source in Stockertown borough
Out of a total of 230 students who are enrolled in schools in Stockertown borough, 27 (11.7%) attend a private institution, while the remaining 203 (88.3%) are enrolled in public schools. The age group of 3 to 4 year olds has the highest likelihood of being enrolled in private schools, with 4 (36.4% in the age bracket) enrolled. Conversely, the age group of 15 to 17 year olds has the lowest likelihood of being enrolled in a private school, with 40 (100.0% in the age bracket) attending a public institution.
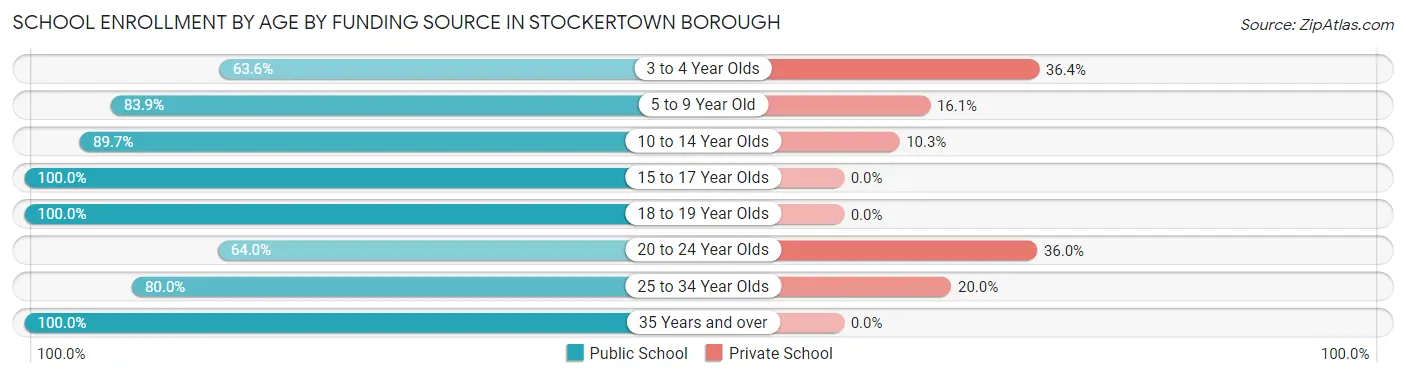
| Age Bracket | Public School | Private School |
| 3 to 4 Year Olds | 7 (63.6%) | 4 (36.4%) |
| 5 to 9 Year Old | 47 (83.9%) | 9 (16.1%) |
| 10 to 14 Year Olds | 26 (89.7%) | 3 (10.3%) |
| 15 to 17 Year Olds | 40 (100.0%) | 0 (0.0%) |
| 18 to 19 Year Olds | 46 (100.0%) | 0 (0.0%) |
| 20 to 24 Year Olds | 16 (64.0%) | 9 (36.0%) |
| 25 to 34 Year Olds | 8 (80.0%) | 2 (20.0%) |
| 35 Years and over | 13 (100.0%) | 0 (0.0%) |
| Total | 203 (88.3%) | 27 (11.7%) |
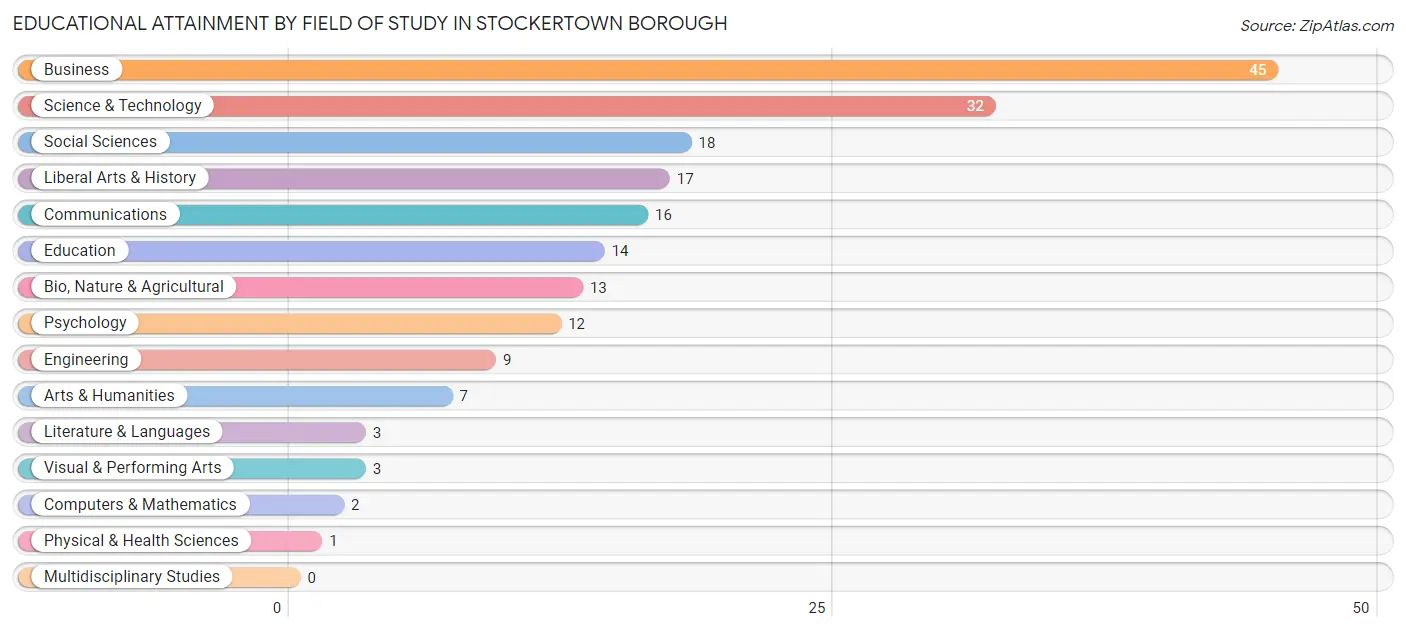
Educational Attainment by Field of Study in Stockertown borough
Business (45 | 23.4%), science & technology (32 | 16.7%), social sciences (18 | 9.4%), liberal arts & history (17 | 8.8%), and communications (16 | 8.3%) are the most common fields of study among 192 individuals in Stockertown borough who have obtained a bachelor's degree or higher.
| Field of Study | # Graduates | % Graduates |
| Computers & Mathematics | 2 | 1.0% |
| Bio, Nature & Agricultural | 13 | 6.8% |
| Physical & Health Sciences | 1 | 0.5% |
| Psychology | 12 | 6.2% |
| Social Sciences | 18 | 9.4% |
| Engineering | 9 | 4.7% |
| Multidisciplinary Studies | 0 | 0.0% |
| Science & Technology | 32 | 16.7% |
| Business | 45 | 23.4% |
| Education | 14 | 7.3% |
| Literature & Languages | 3 | 1.6% |
| Liberal Arts & History | 17 | 8.8% |
| Visual & Performing Arts | 3 | 1.6% |
| Communications | 16 | 8.3% |
| Arts & Humanities | 7 | 3.6% |
| Total | 192 | 100.0% |
Transportation & Commute in Stockertown borough
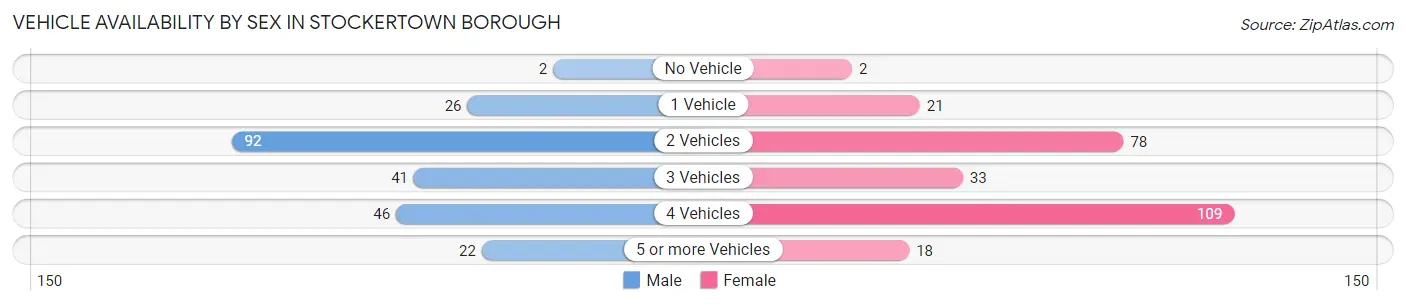
Vehicle Availability by Sex in Stockertown borough
The most prevalent vehicle ownership categories in Stockertown borough are males with 2 vehicles (92, accounting for 40.2%) and females with 2 vehicles (78, making up 35.2%).
| Vehicles Available | Male | Female |
| No Vehicle | 2 (0.9%) | 2 (0.8%) |
| 1 Vehicle | 26 (11.4%) | 21 (8.1%) |
| 2 Vehicles | 92 (40.2%) | 78 (29.9%) |
| 3 Vehicles | 41 (17.9%) | 33 (12.6%) |
| 4 Vehicles | 46 (20.1%) | 109 (41.8%) |
| 5 or more Vehicles | 22 (9.6%) | 18 (6.9%) |
| Total | 229 (100.0%) | 261 (100.0%) |
Commute Time in Stockertown borough
The most frequently occuring commute durations in Stockertown borough are 20 to 24 minutes (105 commuters, 25.3%), 30 to 34 minutes (95 commuters, 22.9%), and 5 to 9 minutes (65 commuters, 15.7%).

| Commute Time | # Commuters | % Commuters |
| Less than 5 Minutes | 2 | 0.5% |
| 5 to 9 Minutes | 65 | 15.7% |
| 10 to 14 Minutes | 42 | 10.1% |
| 15 to 19 Minutes | 34 | 8.2% |
| 20 to 24 Minutes | 105 | 25.3% |
| 25 to 29 Minutes | 12 | 2.9% |
| 30 to 34 Minutes | 95 | 22.9% |
| 35 to 39 Minutes | 10 | 2.4% |
| 40 to 44 Minutes | 4 | 1.0% |
| 45 to 59 Minutes | 8 | 1.9% |
| 60 to 89 Minutes | 38 | 9.2% |
| 90 or more Minutes | 0 | 0.0% |
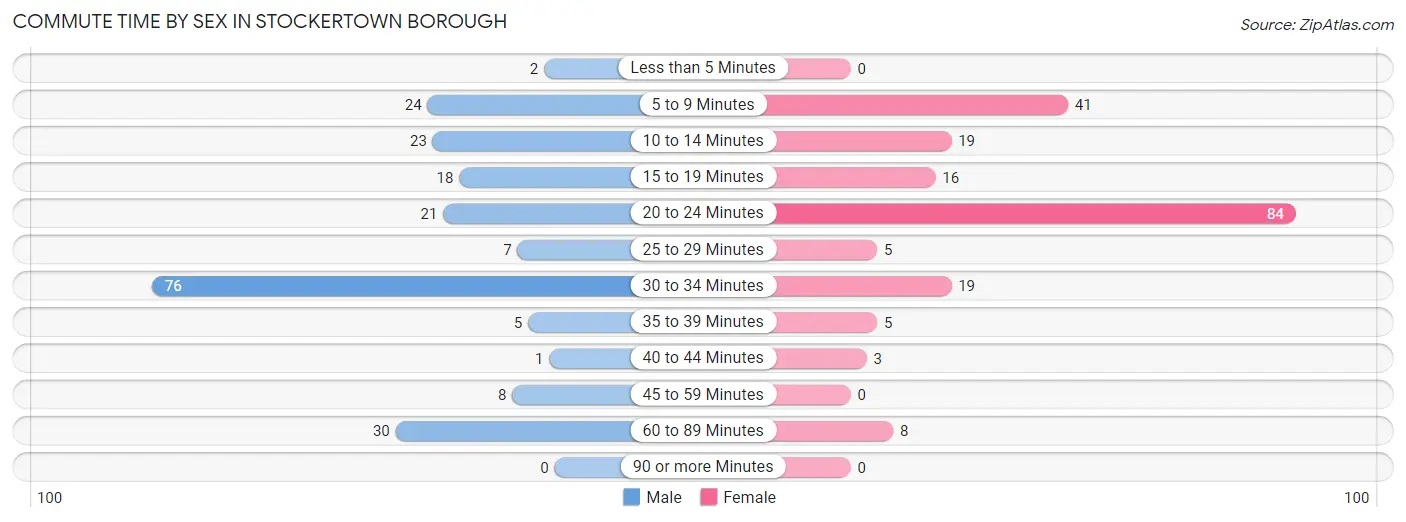
Commute Time by Sex in Stockertown borough
The most common commute times in Stockertown borough are 30 to 34 minutes (76 commuters, 35.3%) for males and 20 to 24 minutes (84 commuters, 42.0%) for females.
| Commute Time | Male | Female |
| Less than 5 Minutes | 2 (0.9%) | 0 (0.0%) |
| 5 to 9 Minutes | 24 (11.2%) | 41 (20.5%) |
| 10 to 14 Minutes | 23 (10.7%) | 19 (9.5%) |
| 15 to 19 Minutes | 18 (8.4%) | 16 (8.0%) |
| 20 to 24 Minutes | 21 (9.8%) | 84 (42.0%) |
| 25 to 29 Minutes | 7 (3.3%) | 5 (2.5%) |
| 30 to 34 Minutes | 76 (35.3%) | 19 (9.5%) |
| 35 to 39 Minutes | 5 (2.3%) | 5 (2.5%) |
| 40 to 44 Minutes | 1 (0.5%) | 3 (1.5%) |
| 45 to 59 Minutes | 8 (3.7%) | 0 (0.0%) |
| 60 to 89 Minutes | 30 (14.0%) | 8 (4.0%) |
| 90 or more Minutes | 0 (0.0%) | 0 (0.0%) |
Time of Departure to Work by Sex in Stockertown borough
The most frequent times of departure to work in Stockertown borough are 5:00 AM to 5:29 AM (39, 18.1%) for males and 7:00 AM to 7:29 AM (60, 30.0%) for females.
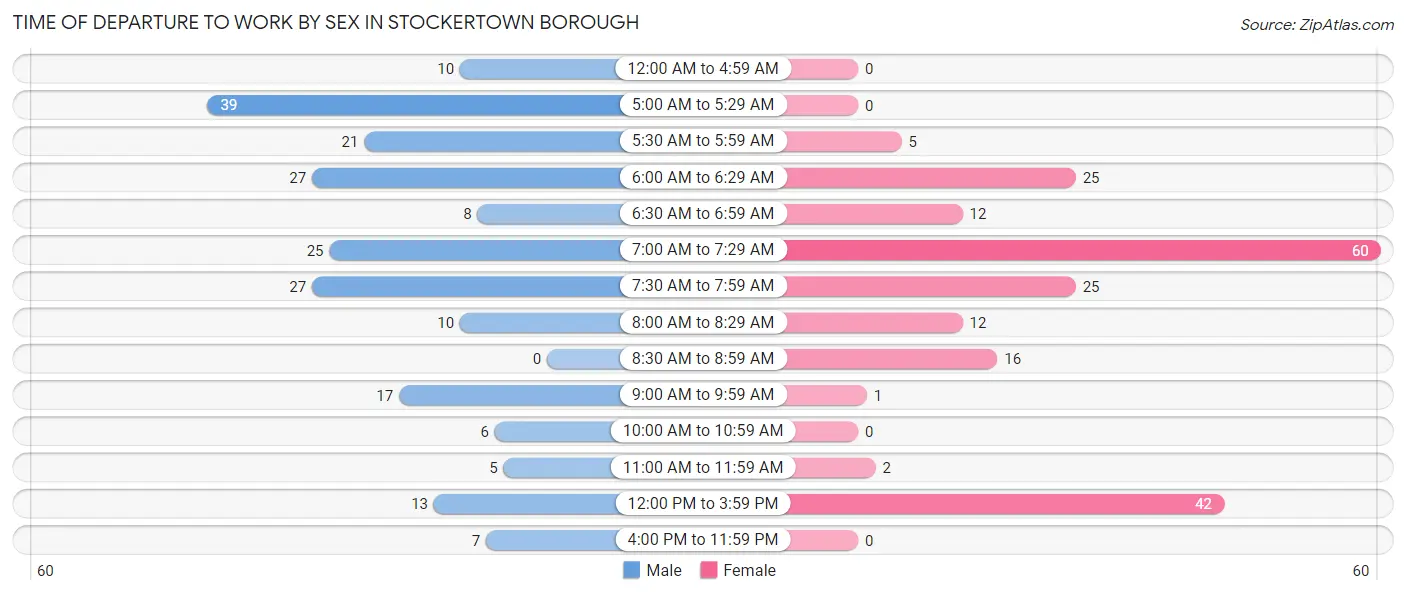
| Time of Departure | Male | Female |
| 12:00 AM to 4:59 AM | 10 (4.6%) | 0 (0.0%) |
| 5:00 AM to 5:29 AM | 39 (18.1%) | 0 (0.0%) |
| 5:30 AM to 5:59 AM | 21 (9.8%) | 5 (2.5%) |
| 6:00 AM to 6:29 AM | 27 (12.6%) | 25 (12.5%) |
| 6:30 AM to 6:59 AM | 8 (3.7%) | 12 (6.0%) |
| 7:00 AM to 7:29 AM | 25 (11.6%) | 60 (30.0%) |
| 7:30 AM to 7:59 AM | 27 (12.6%) | 25 (12.5%) |
| 8:00 AM to 8:29 AM | 10 (4.6%) | 12 (6.0%) |
| 8:30 AM to 8:59 AM | 0 (0.0%) | 16 (8.0%) |
| 9:00 AM to 9:59 AM | 17 (7.9%) | 1 (0.5%) |
| 10:00 AM to 10:59 AM | 6 (2.8%) | 0 (0.0%) |
| 11:00 AM to 11:59 AM | 5 (2.3%) | 2 (1.0%) |
| 12:00 PM to 3:59 PM | 13 (6.0%) | 42 (21.0%) |
| 4:00 PM to 11:59 PM | 7 (3.3%) | 0 (0.0%) |
| Total | 215 (100.0%) | 200 (100.0%) |
Housing Occupancy in Stockertown borough
Occupancy by Ownership in Stockertown borough
Of the total 336 dwellings in Stockertown borough, owner-occupied units account for 295 (87.8%), while renter-occupied units make up 41 (12.2%).
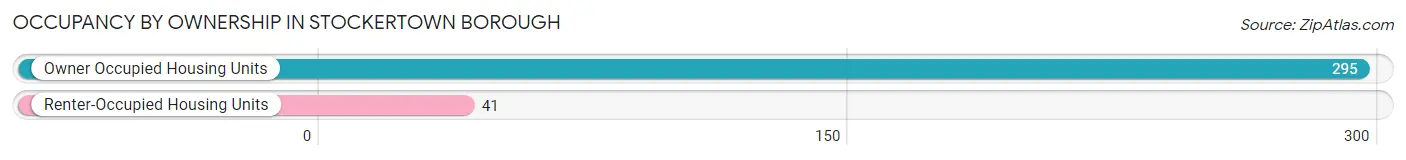
| Occupancy | # Housing Units | % Housing Units |
| Owner Occupied Housing Units | 295 | 87.8% |
| Renter-Occupied Housing Units | 41 | 12.2% |
| Total Occupied Housing Units | 336 | 100.0% |
Occupancy by Household Size in Stockertown borough
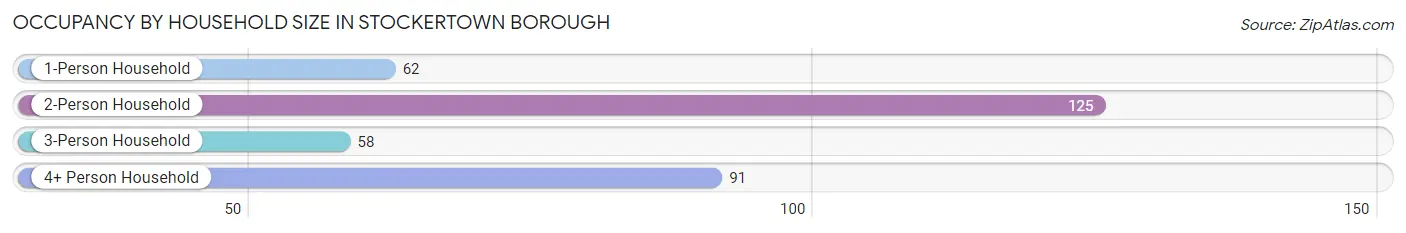
| Household Size | # Housing Units | % Housing Units |
| 1-Person Household | 62 | 18.4% |
| 2-Person Household | 125 | 37.2% |
| 3-Person Household | 58 | 17.3% |
| 4+ Person Household | 91 | 27.1% |
| Total Housing Units | 336 | 100.0% |
Occupancy by Ownership by Household Size in Stockertown borough
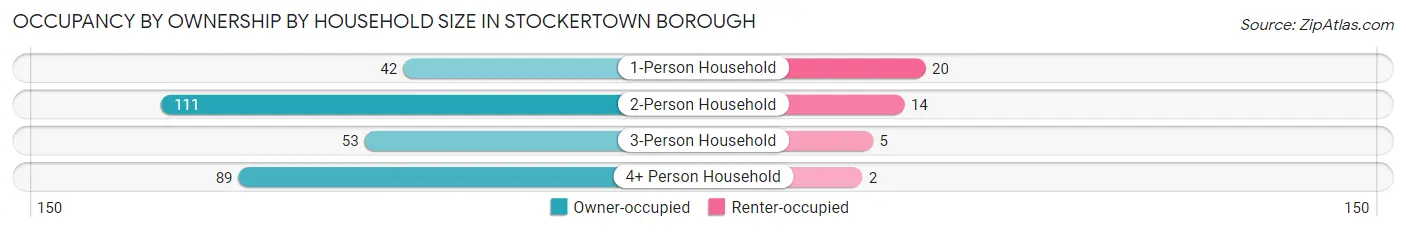
| Household Size | Owner-occupied | Renter-occupied |
| 1-Person Household | 42 (67.7%) | 20 (32.3%) |
| 2-Person Household | 111 (88.8%) | 14 (11.2%) |
| 3-Person Household | 53 (91.4%) | 5 (8.6%) |
| 4+ Person Household | 89 (97.8%) | 2 (2.2%) |
| Total Housing Units | 295 (87.8%) | 41 (12.2%) |
Occupancy by Educational Attainment in Stockertown borough
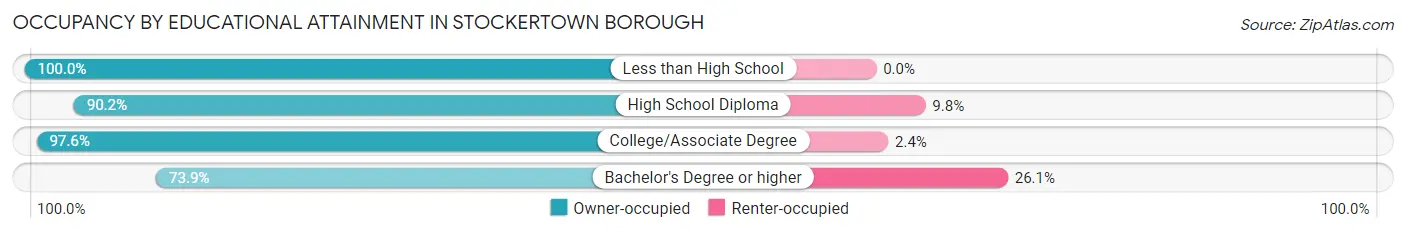
| Household Size | Owner-occupied | Renter-occupied |
| Less than High School | 12 (100.0%) | 0 (0.0%) |
| High School Diploma | 74 (90.2%) | 8 (9.8%) |
| College/Associate Degree | 124 (97.6%) | 3 (2.4%) |
| Bachelor's Degree or higher | 85 (73.9%) | 30 (26.1%) |
Occupancy by Age of Householder in Stockertown borough
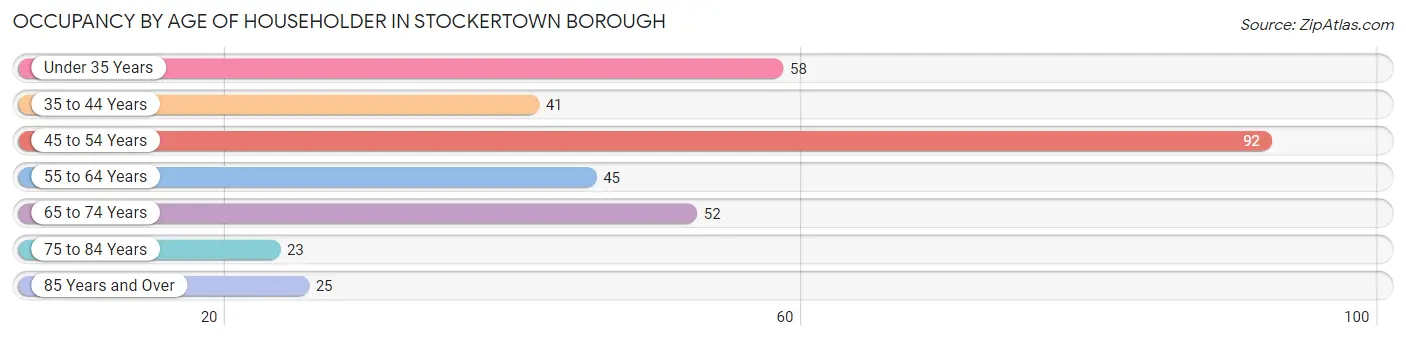
| Age Bracket | # Households | % Households |
| Under 35 Years | 58 | 17.3% |
| 35 to 44 Years | 41 | 12.2% |
| 45 to 54 Years | 92 | 27.4% |
| 55 to 64 Years | 45 | 13.4% |
| 65 to 74 Years | 52 | 15.5% |
| 75 to 84 Years | 23 | 6.9% |
| 85 Years and Over | 25 | 7.4% |
| Total | 336 | 100.0% |
Housing Finances in Stockertown borough
Median Income by Occupancy in Stockertown borough
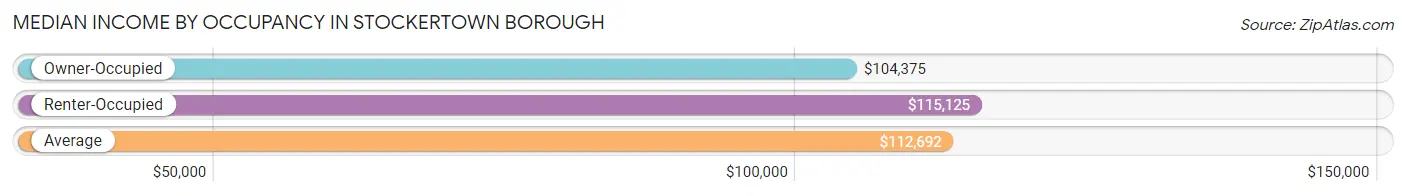
| Occupancy Type | # Households | Median Income |
| Owner-Occupied | 295 (87.8%) | $104,375 |
| Renter-Occupied | 41 (12.2%) | $115,125 |
| Average | 336 (100.0%) | $112,692 |
Occupancy by Householder Income Bracket in Stockertown borough
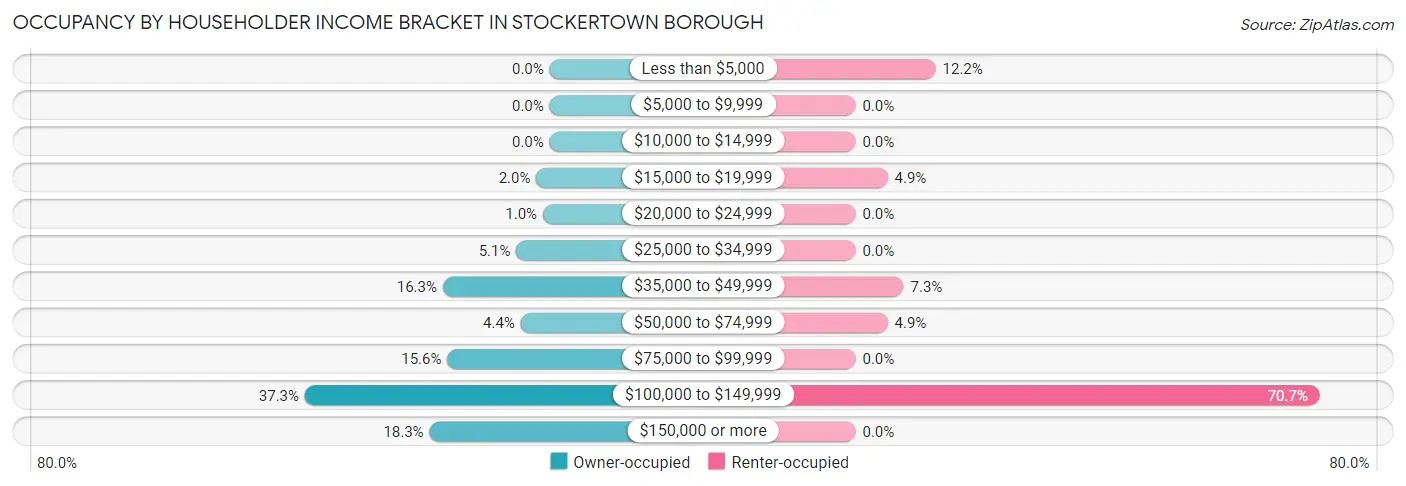
| Income Bracket | Owner-occupied | Renter-occupied |
| Less than $5,000 | 0 (0.0%) | 5 (12.2%) |
| $5,000 to $9,999 | 0 (0.0%) | 0 (0.0%) |
| $10,000 to $14,999 | 0 (0.0%) | 0 (0.0%) |
| $15,000 to $19,999 | 6 (2.0%) | 2 (4.9%) |
| $20,000 to $24,999 | 3 (1.0%) | 0 (0.0%) |
| $25,000 to $34,999 | 15 (5.1%) | 0 (0.0%) |
| $35,000 to $49,999 | 48 (16.3%) | 3 (7.3%) |
| $50,000 to $74,999 | 13 (4.4%) | 2 (4.9%) |
| $75,000 to $99,999 | 46 (15.6%) | 0 (0.0%) |
| $100,000 to $149,999 | 110 (37.3%) | 29 (70.7%) |
| $150,000 or more | 54 (18.3%) | 0 (0.0%) |
| Total | 295 (100.0%) | 41 (100.0%) |
Monthly Housing Cost Tiers in Stockertown borough
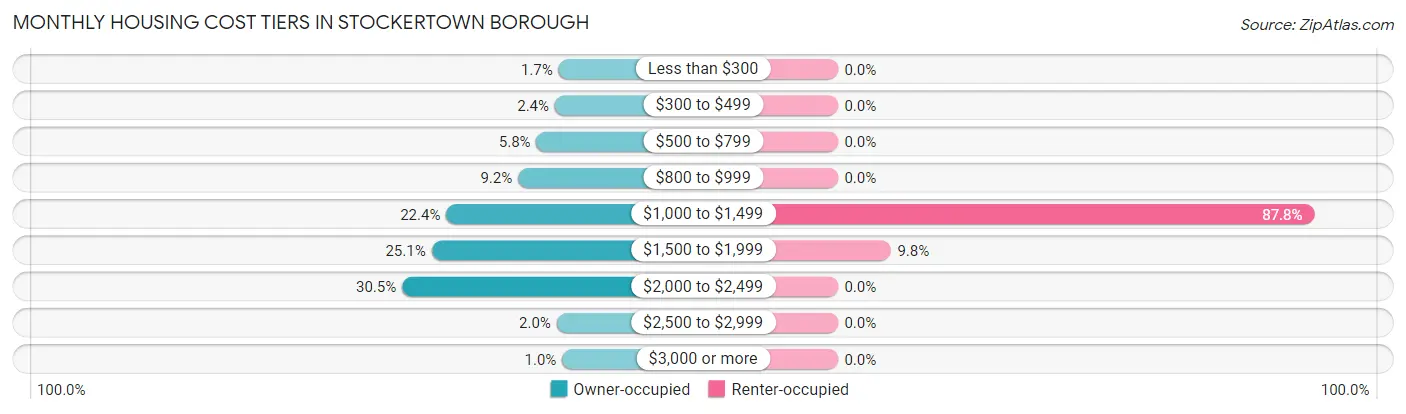
| Monthly Cost | Owner-occupied | Renter-occupied |
| Less than $300 | 5 (1.7%) | 0 (0.0%) |
| $300 to $499 | 7 (2.4%) | 0 (0.0%) |
| $500 to $799 | 17 (5.8%) | 0 (0.0%) |
| $800 to $999 | 27 (9.1%) | 0 (0.0%) |
| $1,000 to $1,499 | 66 (22.4%) | 36 (87.8%) |
| $1,500 to $1,999 | 74 (25.1%) | 4 (9.8%) |
| $2,000 to $2,499 | 90 (30.5%) | 0 (0.0%) |
| $2,500 to $2,999 | 6 (2.0%) | 0 (0.0%) |
| $3,000 or more | 3 (1.0%) | 0 (0.0%) |
| Total | 295 (100.0%) | 41 (100.0%) |
Physical Housing Characteristics in Stockertown borough
Housing Structures in Stockertown borough
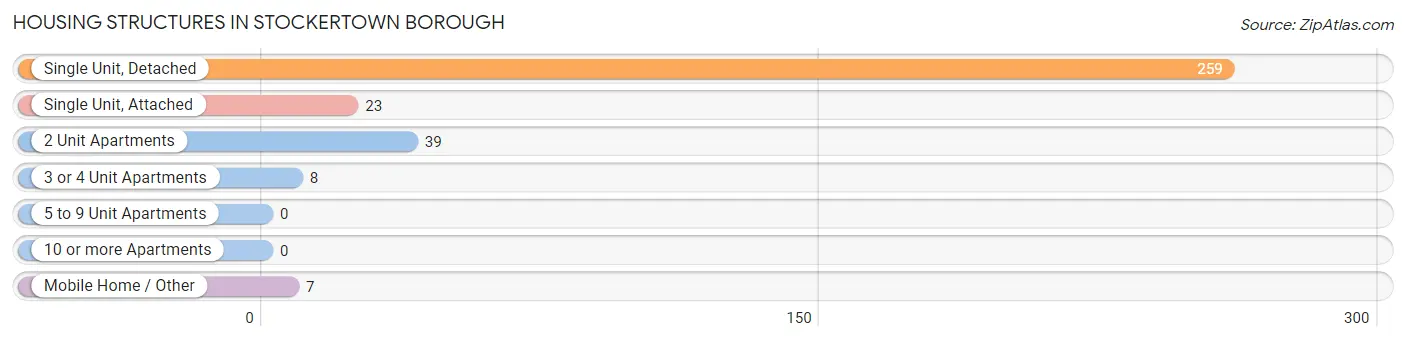
| Structure Type | # Housing Units | % Housing Units |
| Single Unit, Detached | 259 | 77.1% |
| Single Unit, Attached | 23 | 6.9% |
| 2 Unit Apartments | 39 | 11.6% |
| 3 or 4 Unit Apartments | 8 | 2.4% |
| 5 to 9 Unit Apartments | 0 | 0.0% |
| 10 or more Apartments | 0 | 0.0% |
| Mobile Home / Other | 7 | 2.1% |
| Total | 336 | 100.0% |
Housing Structures by Occupancy in Stockertown borough
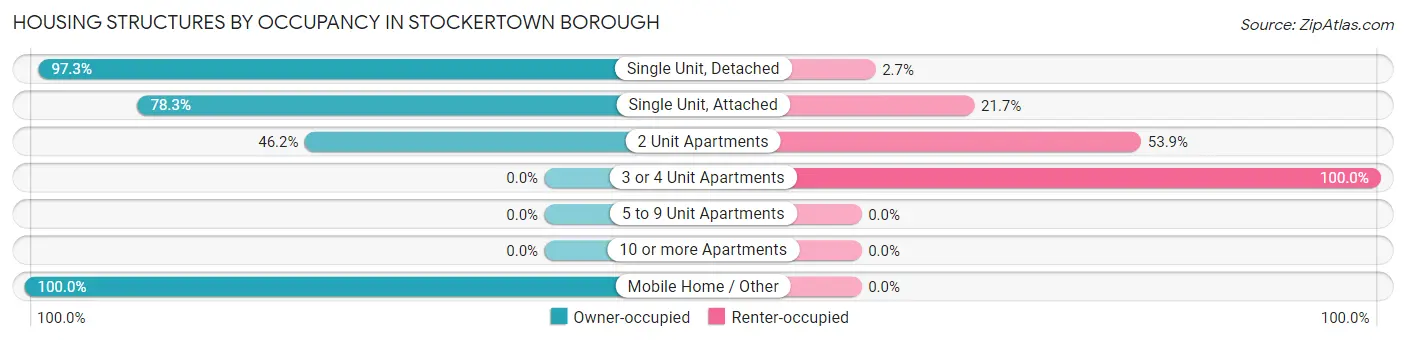
| Structure Type | Owner-occupied | Renter-occupied |
| Single Unit, Detached | 252 (97.3%) | 7 (2.7%) |
| Single Unit, Attached | 18 (78.3%) | 5 (21.7%) |
| 2 Unit Apartments | 18 (46.2%) | 21 (53.8%) |
| 3 or 4 Unit Apartments | 0 (0.0%) | 8 (100.0%) |
| 5 to 9 Unit Apartments | 0 (0.0%) | 0 (0.0%) |
| 10 or more Apartments | 0 (0.0%) | 0 (0.0%) |
| Mobile Home / Other | 7 (100.0%) | 0 (0.0%) |
| Total | 295 (87.8%) | 41 (12.2%) |
Housing Structures by Number of Rooms in Stockertown borough
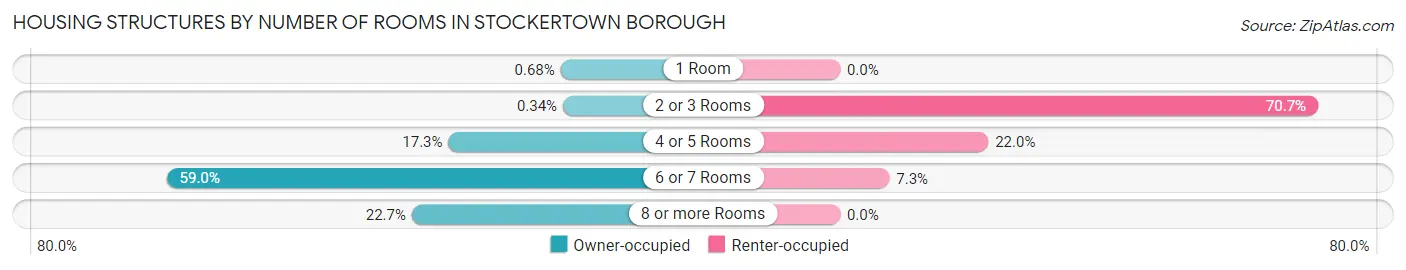
| Number of Rooms | Owner-occupied | Renter-occupied |
| 1 Room | 2 (0.7%) | 0 (0.0%) |
| 2 or 3 Rooms | 1 (0.3%) | 29 (70.7%) |
| 4 or 5 Rooms | 51 (17.3%) | 9 (22.0%) |
| 6 or 7 Rooms | 174 (59.0%) | 3 (7.3%) |
| 8 or more Rooms | 67 (22.7%) | 0 (0.0%) |
| Total | 295 (100.0%) | 41 (100.0%) |
Housing Structure by Heating Type in Stockertown borough
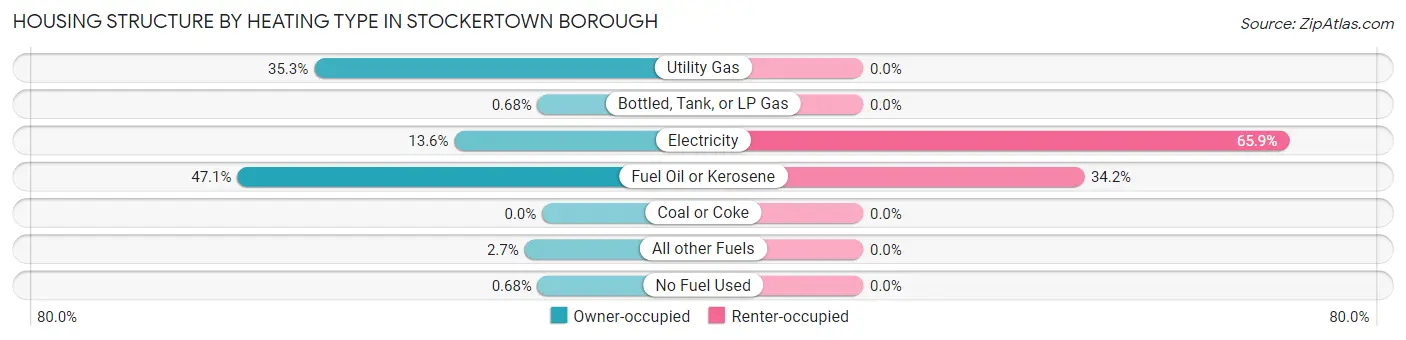
| Heating Type | Owner-occupied | Renter-occupied |
| Utility Gas | 104 (35.2%) | 0 (0.0%) |
| Bottled, Tank, or LP Gas | 2 (0.7%) | 0 (0.0%) |
| Electricity | 40 (13.6%) | 27 (65.8%) |
| Fuel Oil or Kerosene | 139 (47.1%) | 14 (34.2%) |
| Coal or Coke | 0 (0.0%) | 0 (0.0%) |
| All other Fuels | 8 (2.7%) | 0 (0.0%) |
| No Fuel Used | 2 (0.7%) | 0 (0.0%) |
| Total | 295 (100.0%) | 41 (100.0%) |
Household Vehicle Usage in Stockertown borough
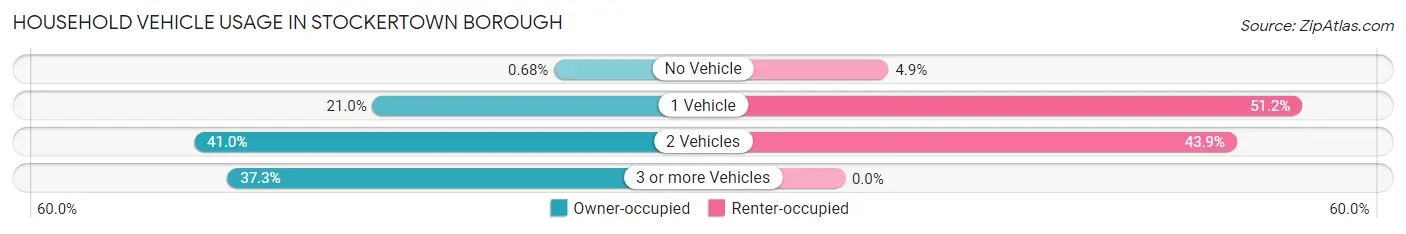
| Vehicles per Household | Owner-occupied | Renter-occupied |
| No Vehicle | 2 (0.7%) | 2 (4.9%) |
| 1 Vehicle | 62 (21.0%) | 21 (51.2%) |
| 2 Vehicles | 121 (41.0%) | 18 (43.9%) |
| 3 or more Vehicles | 110 (37.3%) | 0 (0.0%) |
| Total | 295 (100.0%) | 41 (100.0%) |
Real Estate & Mortgages in Stockertown borough
Real Estate and Mortgage Overview in Stockertown borough
| Characteristic | Without Mortgage | With Mortgage |
| Housing Units | 89 | 206 |
| Median Property Value | $284,100 | $286,700 |
| Median Household Income | $44,931 | $44 |
| Monthly Housing Costs | $897 | $3 |
| Real Estate Taxes | $4,885 | $5 |
Property Value by Mortgage Status in Stockertown borough
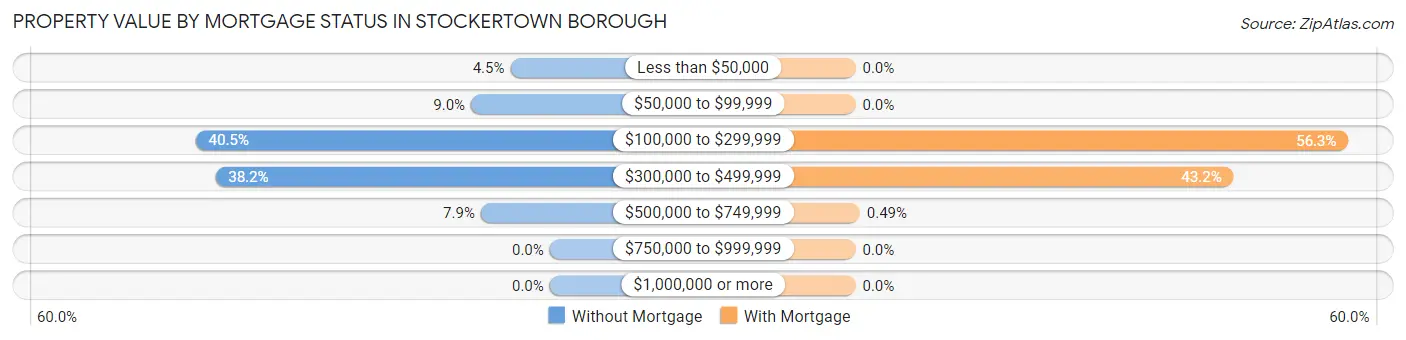
| Property Value | Without Mortgage | With Mortgage |
| Less than $50,000 | 4 (4.5%) | 0 (0.0%) |
| $50,000 to $99,999 | 8 (9.0%) | 0 (0.0%) |
| $100,000 to $299,999 | 36 (40.5%) | 116 (56.3%) |
| $300,000 to $499,999 | 34 (38.2%) | 89 (43.2%) |
| $500,000 to $749,999 | 7 (7.9%) | 1 (0.5%) |
| $750,000 to $999,999 | 0 (0.0%) | 0 (0.0%) |
| $1,000,000 or more | 0 (0.0%) | 0 (0.0%) |
| Total | 89 (100.0%) | 206 (100.0%) |
Household Income by Mortgage Status in Stockertown borough
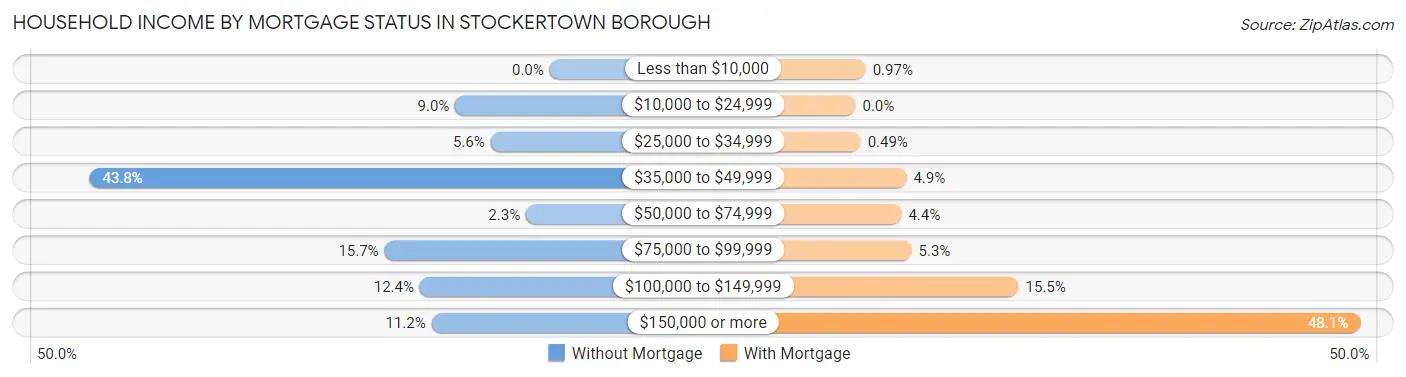
| Household Income | Without Mortgage | With Mortgage |
| Less than $10,000 | 0 (0.0%) | 2 (1.0%) |
| $10,000 to $24,999 | 8 (9.0%) | 0 (0.0%) |
| $25,000 to $34,999 | 5 (5.6%) | 1 (0.5%) |
| $35,000 to $49,999 | 39 (43.8%) | 10 (4.9%) |
| $50,000 to $74,999 | 2 (2.2%) | 9 (4.4%) |
| $75,000 to $99,999 | 14 (15.7%) | 11 (5.3%) |
| $100,000 to $149,999 | 11 (12.4%) | 32 (15.5%) |
| $150,000 or more | 10 (11.2%) | 99 (48.1%) |
| Total | 89 (100.0%) | 206 (100.0%) |
Property Value to Household Income Ratio in Stockertown borough
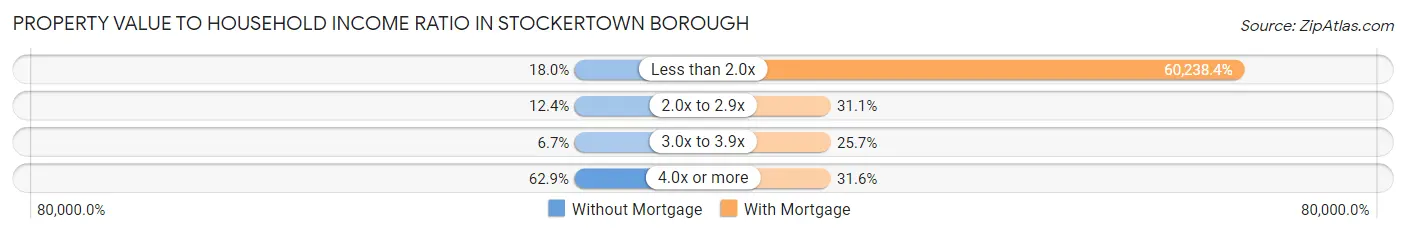
| Value-to-Income Ratio | Without Mortgage | With Mortgage |
| Less than 2.0x | 16 (18.0%) | 124,091 (60,238.4%) |
| 2.0x to 2.9x | 11 (12.4%) | 64 (31.1%) |
| 3.0x to 3.9x | 6 (6.7%) | 53 (25.7%) |
| 4.0x or more | 56 (62.9%) | 65 (31.6%) |
| Total | 89 (100.0%) | 206 (100.0%) |
Real Estate Taxes by Mortgage Status in Stockertown borough
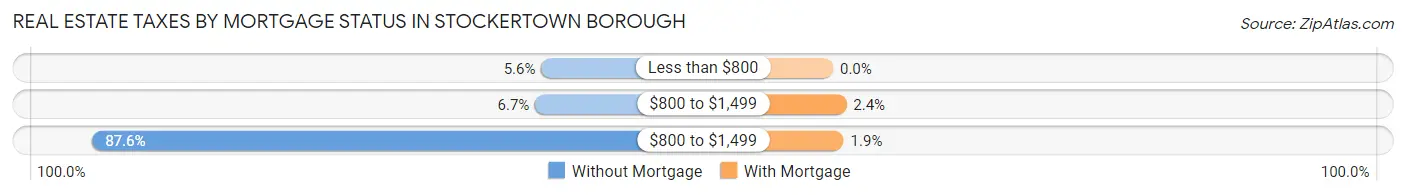
| Property Taxes | Without Mortgage | With Mortgage |
| Less than $800 | 5 (5.6%) | 0 (0.0%) |
| $800 to $1,499 | 6 (6.7%) | 5 (2.4%) |
| $800 to $1,499 | 78 (87.6%) | 4 (1.9%) |
| Total | 89 (100.0%) | 206 (100.0%) |
Health & Disability in Stockertown borough
Health Insurance Coverage by Age in Stockertown borough
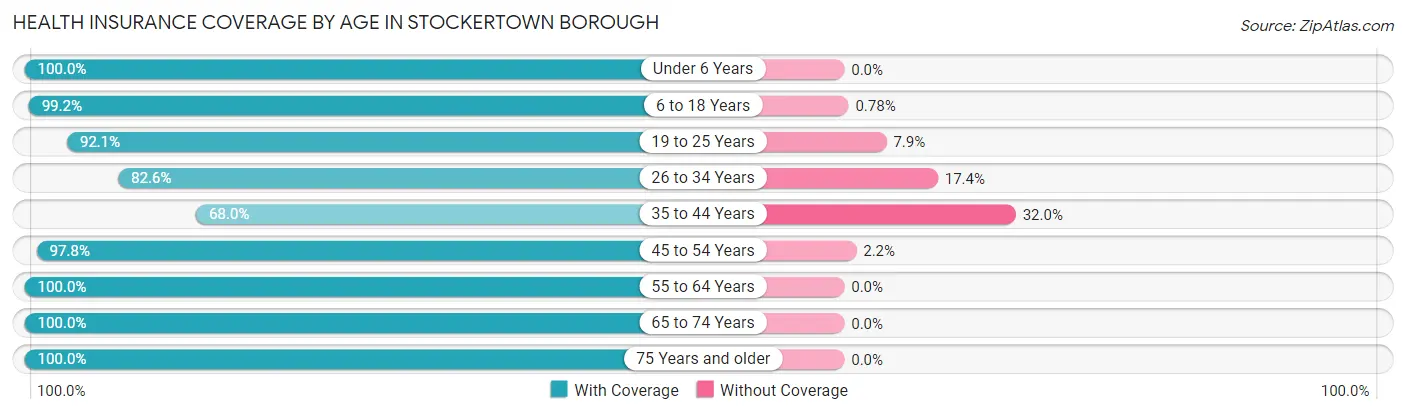
| Age Bracket | With Coverage | Without Coverage |
| Under 6 Years | 44 (100.0%) | 0 (0.0%) |
| 6 to 18 Years | 127 (99.2%) | 1 (0.8%) |
| 19 to 25 Years | 82 (92.1%) | 7 (7.9%) |
| 26 to 34 Years | 71 (82.6%) | 15 (17.4%) |
| 35 to 44 Years | 83 (68.0%) | 39 (32.0%) |
| 45 to 54 Years | 175 (97.8%) | 4 (2.2%) |
| 55 to 64 Years | 84 (100.0%) | 0 (0.0%) |
| 65 to 74 Years | 80 (100.0%) | 0 (0.0%) |
| 75 Years and older | 99 (100.0%) | 0 (0.0%) |
| Total | 845 (92.8%) | 66 (7.2%) |
Health Insurance Coverage by Citizenship Status in Stockertown borough
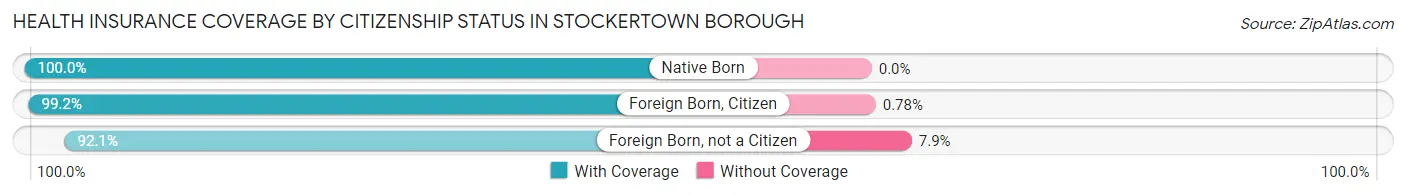
| Citizenship Status | With Coverage | Without Coverage |
| Native Born | 44 (100.0%) | 0 (0.0%) |
| Foreign Born, Citizen | 127 (99.2%) | 1 (0.8%) |
| Foreign Born, not a Citizen | 82 (92.1%) | 7 (7.9%) |
Health Insurance Coverage by Household Income in Stockertown borough
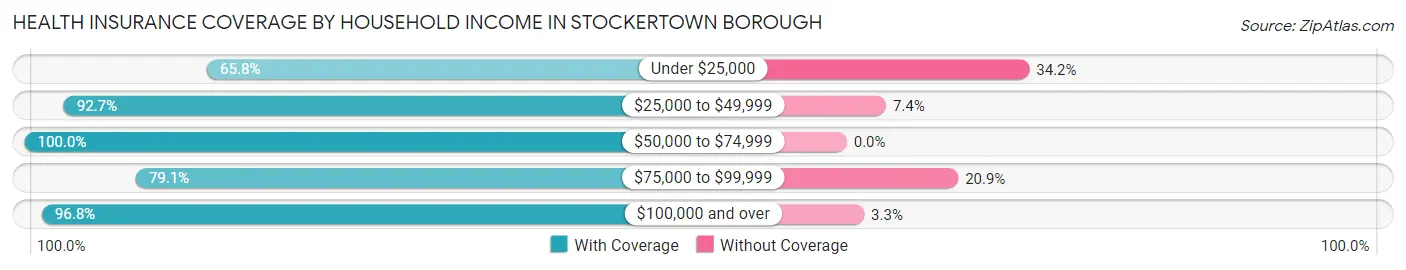
| Household Income | With Coverage | Without Coverage |
| Under $25,000 | 25 (65.8%) | 13 (34.2%) |
| $25,000 to $49,999 | 126 (92.6%) | 10 (7.3%) |
| $50,000 to $74,999 | 38 (100.0%) | 0 (0.0%) |
| $75,000 to $99,999 | 91 (79.1%) | 24 (20.9%) |
| $100,000 and over | 565 (96.8%) | 19 (3.3%) |
Public vs Private Health Insurance Coverage by Age in Stockertown borough
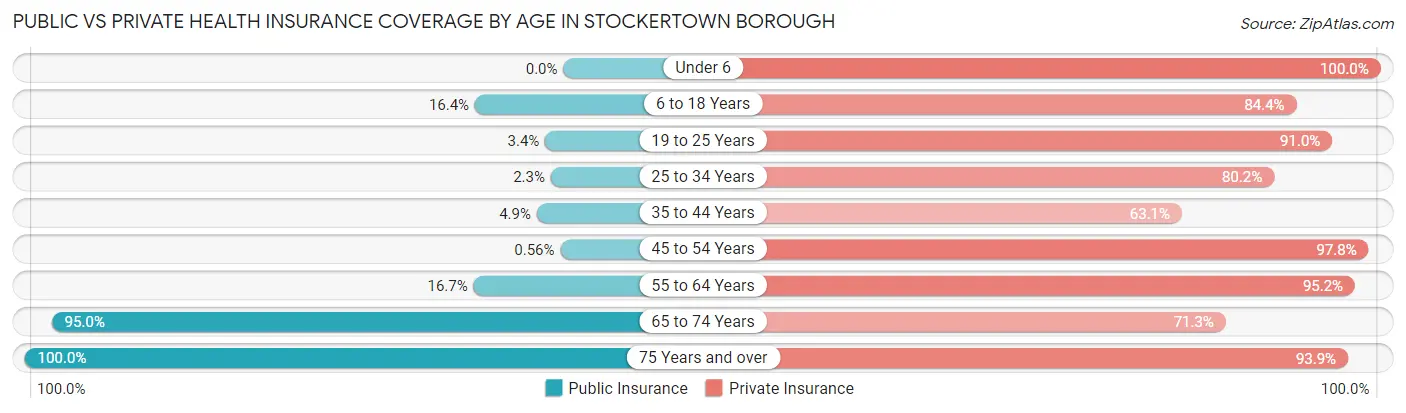
| Age Bracket | Public Insurance | Private Insurance |
| Under 6 | 0 (0.0%) | 44 (100.0%) |
| 6 to 18 Years | 21 (16.4%) | 108 (84.4%) |
| 19 to 25 Years | 3 (3.4%) | 81 (91.0%) |
| 25 to 34 Years | 2 (2.3%) | 69 (80.2%) |
| 35 to 44 Years | 6 (4.9%) | 77 (63.1%) |
| 45 to 54 Years | 1 (0.6%) | 175 (97.8%) |
| 55 to 64 Years | 14 (16.7%) | 80 (95.2%) |
| 65 to 74 Years | 76 (95.0%) | 57 (71.3%) |
| 75 Years and over | 99 (100.0%) | 93 (93.9%) |
| Total | 222 (24.4%) | 784 (86.1%) |
Disability Status by Sex by Age in Stockertown borough
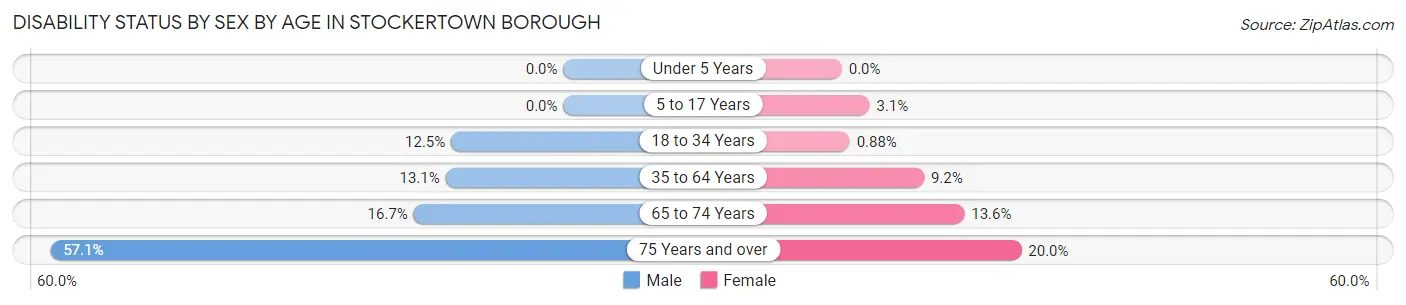
| Age Bracket | Male | Female |
| Under 5 Years | 0 (0.0%) | 0 (0.0%) |
| 5 to 17 Years | 0 (0.0%) | 3 (3.1%) |
| 18 to 34 Years | 9 (12.5%) | 1 (0.9%) |
| 35 to 64 Years | 29 (13.1%) | 15 (9.1%) |
| 65 to 74 Years | 6 (16.7%) | 6 (13.6%) |
| 75 Years and over | 28 (57.1%) | 10 (20.0%) |
Disability Class by Sex by Age in Stockertown borough
Disability Class: Hearing Difficulty
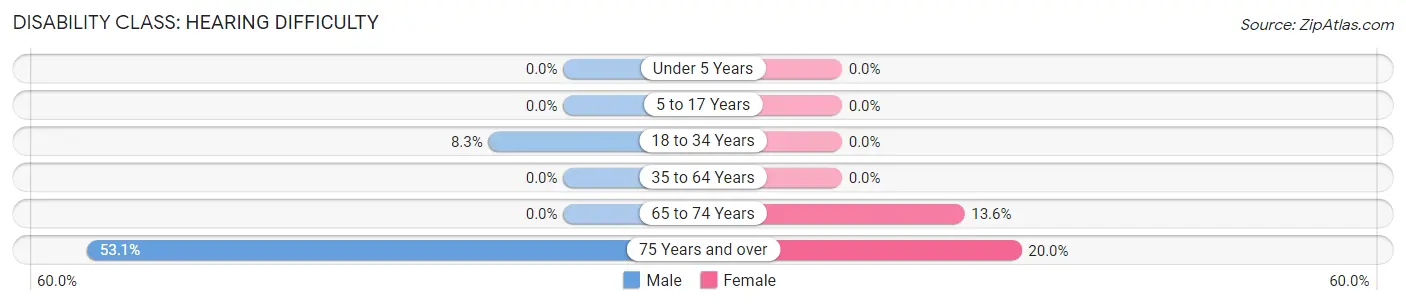
| Age Bracket | Male | Female |
| Under 5 Years | 0 (0.0%) | 0 (0.0%) |
| 5 to 17 Years | 0 (0.0%) | 0 (0.0%) |
| 18 to 34 Years | 6 (8.3%) | 0 (0.0%) |
| 35 to 64 Years | 0 (0.0%) | 0 (0.0%) |
| 65 to 74 Years | 0 (0.0%) | 6 (13.6%) |
| 75 Years and over | 26 (53.1%) | 10 (20.0%) |
Disability Class: Vision Difficulty
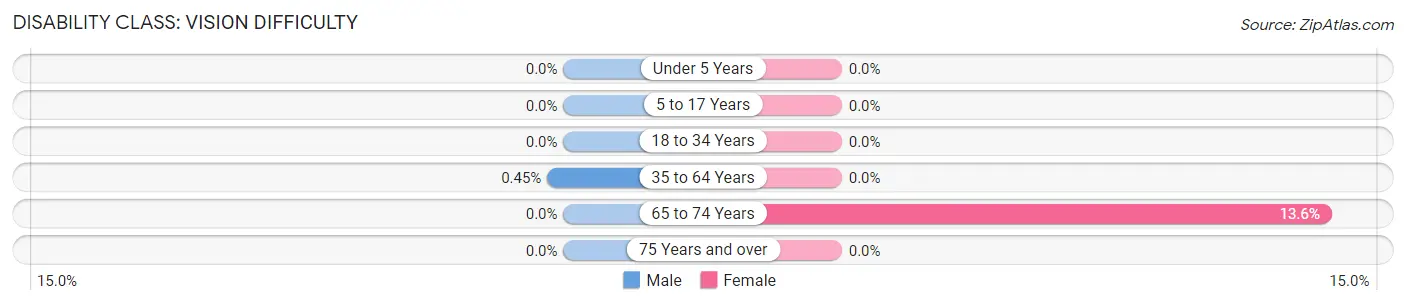
| Age Bracket | Male | Female |
| Under 5 Years | 0 (0.0%) | 0 (0.0%) |
| 5 to 17 Years | 0 (0.0%) | 0 (0.0%) |
| 18 to 34 Years | 0 (0.0%) | 0 (0.0%) |
| 35 to 64 Years | 1 (0.4%) | 0 (0.0%) |
| 65 to 74 Years | 0 (0.0%) | 6 (13.6%) |
| 75 Years and over | 0 (0.0%) | 0 (0.0%) |
Disability Class: Cognitive Difficulty
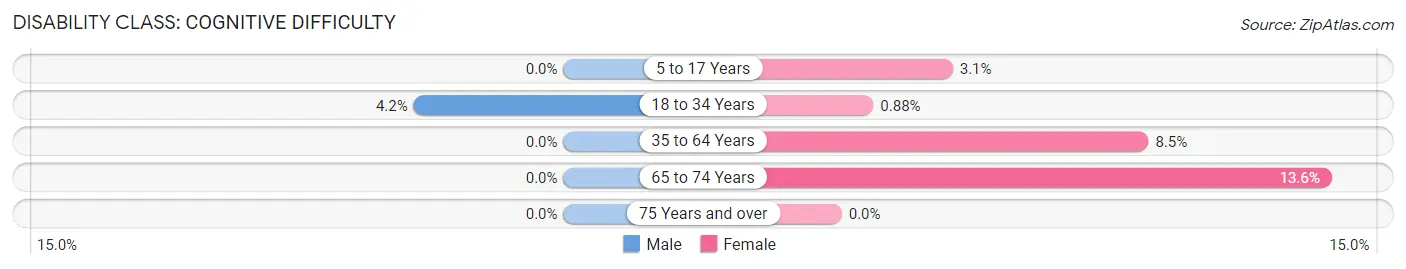
| Age Bracket | Male | Female |
| 5 to 17 Years | 0 (0.0%) | 3 (3.1%) |
| 18 to 34 Years | 3 (4.2%) | 1 (0.9%) |
| 35 to 64 Years | 0 (0.0%) | 14 (8.5%) |
| 65 to 74 Years | 0 (0.0%) | 6 (13.6%) |
| 75 Years and over | 0 (0.0%) | 0 (0.0%) |
Disability Class: Ambulatory Difficulty
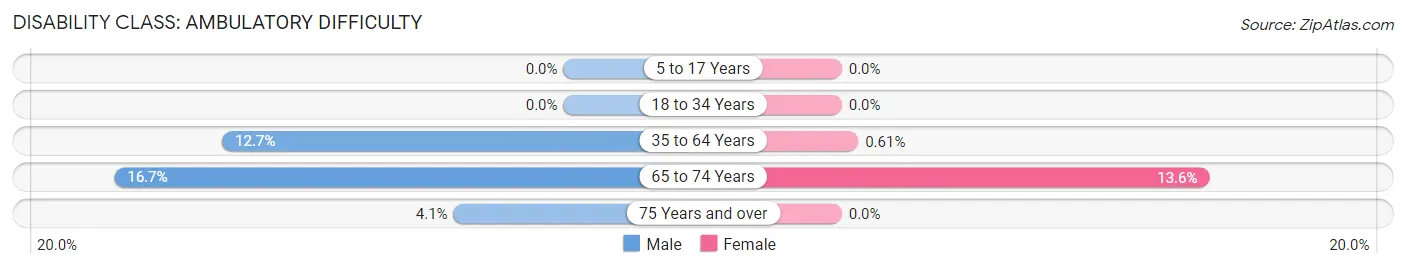
| Age Bracket | Male | Female |
| 5 to 17 Years | 0 (0.0%) | 0 (0.0%) |
| 18 to 34 Years | 0 (0.0%) | 0 (0.0%) |
| 35 to 64 Years | 28 (12.7%) | 1 (0.6%) |
| 65 to 74 Years | 6 (16.7%) | 6 (13.6%) |
| 75 Years and over | 2 (4.1%) | 0 (0.0%) |
Disability Class: Self-Care Difficulty
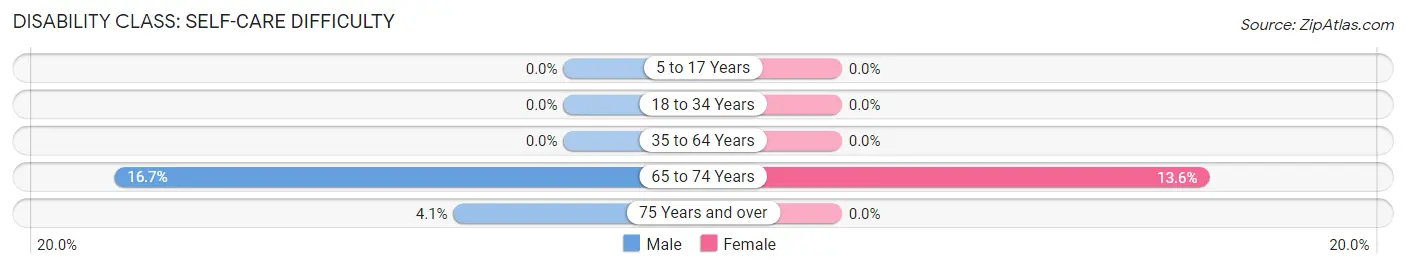
| Age Bracket | Male | Female |
| 5 to 17 Years | 0 (0.0%) | 0 (0.0%) |
| 18 to 34 Years | 0 (0.0%) | 0 (0.0%) |
| 35 to 64 Years | 0 (0.0%) | 0 (0.0%) |
| 65 to 74 Years | 6 (16.7%) | 6 (13.6%) |
| 75 Years and over | 2 (4.1%) | 0 (0.0%) |
Technology Access in Stockertown borough
Computing Device Access in Stockertown borough
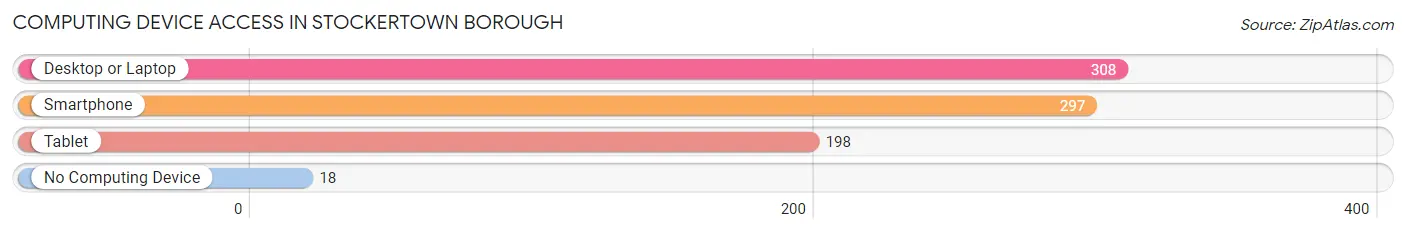
| Device Type | # Households | % Households |
| Desktop or Laptop | 308 | 91.7% |
| Smartphone | 297 | 88.4% |
| Tablet | 198 | 58.9% |
| No Computing Device | 18 | 5.4% |
| Total | 336 | 100.0% |
Internet Access in Stockertown borough
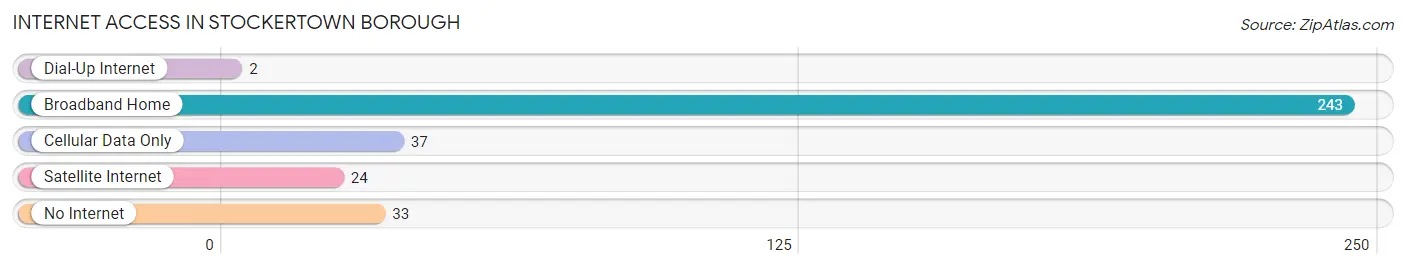
| Internet Type | # Households | % Households |
| Dial-Up Internet | 2 | 0.6% |
| Broadband Home | 243 | 72.3% |
| Cellular Data Only | 37 | 11.0% |
| Satellite Internet | 24 | 7.1% |
| No Internet | 33 | 9.8% |
| Total | 336 | 100.0% |
Stockertown borough Summary
Stockertown Borough is a small borough located in Northampton County, Pennsylvania. It is situated in the Lehigh Valley region of the state, and is part of the Easton Metropolitan Statistical Area. The borough has a population of 1,845 as of the 2010 census, and covers an area of 0.6 square miles.
History
Stockertown Borough was founded in 1845 by a group of German immigrants who had settled in the area. The borough was named after the Stocker family, who were among the first settlers. The Stockers had come to the area from Germany in the early 1800s, and had established a farm and a mill.
The borough was incorporated in 1867, and the first mayor was elected in 1868. The borough was originally a farming community, but in the late 19th century, it began to develop into an industrial center. The Stocker family's mill was converted into a paper mill, and other industries, such as a brickyard and a tannery, were established.
In the early 20th century, Stockertown Borough began to experience a period of growth and development. The borough was connected to the Lehigh Valley Railroad in 1906, and the Stockertown Hotel was built in 1910. The borough also had a number of stores and businesses, including a bank, a post office, and a movie theater.
Geography
Stockertown Borough is located in Northampton County, Pennsylvania. It is situated in the Lehigh Valley region of the state, and is part of the Easton Metropolitan Statistical Area. The borough has a total area of 0.6 square miles, all of which is land.
The borough is located in the Lehigh Valley, and is bordered by the townships of Lower Nazareth, Upper Nazareth, and Bushkill. The borough is situated along the Lehigh River, and is located approximately 10 miles north of Easton, Pennsylvania.
Economy
Stockertown Borough has a diverse economy, with a mix of industrial, commercial, and residential businesses. The borough is home to a number of manufacturing companies, including a paper mill, a brickyard, and a tannery. The borough also has a number of retail stores, restaurants, and other businesses.
The borough is also home to a number of educational institutions, including Stockertown Elementary School, Stockertown Middle School, and Stockertown High School. The borough is also home to a number of churches, including St. John's Lutheran Church, St. Paul's United Church of Christ, and Stockertown United Methodist Church.
Demographics
As of the 2010 census, Stockertown Borough had a population of 1,845. The racial makeup of the borough was 94.3% White, 2.2% African American, 0.3% Native American, 0.7% Asian, 0.1% Pacific Islander, 0.9% from other races, and 1.5% from two or more races. Hispanic or Latino of any race were 2.7% of the population.
The median household income in Stockertown Borough was $50,938, and the median family income was $60,938. The per capita income for the borough was $25,938. About 6.3% of families and 8.2% of the population were below the poverty line, including 10.2% of those under age 18 and 5.2% of those age 65 or over.
Common Questions
What is Per Capita Income in Stockertown borough?
Per Capita income in Stockertown borough is $42,680.
What is the Median Family Income in Stockertown borough?
Median Family Income in Stockertown borough is $119,167.
What is the Median Household income in Stockertown borough?
Median Household Income in Stockertown borough is $112,692.
What is Inequality or Gini Index in Stockertown borough?
Inequality or Gini Index in Stockertown borough is 0.33.
What is the Total Population of Stockertown borough?
Total Population of Stockertown borough is 911.
What is the Total Male Population of Stockertown borough?
Total Male Population of Stockertown borough is 420.
What is the Total Female Population of Stockertown borough?
Total Female Population of Stockertown borough is 491.
What is the Ratio of Males per 100 Females in Stockertown borough?
There are 85.54 Males per 100 Females in Stockertown borough.
What is the Ratio of Females per 100 Males in Stockertown borough?
There are 116.90 Females per 100 Males in Stockertown borough.
What is the Median Population Age in Stockertown borough?
Median Population Age in Stockertown borough is 44.6 Years.
What is the Average Family Size in Stockertown borough
Average Family Size in Stockertown borough is 3.2 People.
What is the Average Household Size in Stockertown borough
Average Household Size in Stockertown borough is 2.7 People.
How Large is the Labor Force in Stockertown borough?
There are 510 People in the Labor Forcein in Stockertown borough.
What is the Percentage of People in the Labor Force in Stockertown borough?
64.7% of People are in the Labor Force in Stockertown borough.
What is the Unemployment Rate in Stockertown borough?
Unemployment Rate in Stockertown borough is 2.5%.