Elverson borough, PA Map & Demographics
Elverson borough Overview
$45,955
PER CAPITA INCOME
$84,375
AVG FAMILY INCOME
$73,864
AVG HOUSEHOLD INCOME
15.7%
WAGE / INCOME GAP [ % ]
84.3¢/ $1
WAGE / INCOME GAP [ $ ]
0.47
INEQUALITY / GINI INDEX
1,365
TOTAL POPULATION
654
MALE POPULATION
711
FEMALE POPULATION
91.98
MALES / 100 FEMALES
108.72
FEMALES / 100 MALES
58.6
MEDIAN AGE
2.8
AVG FAMILY SIZE
2.2
AVG HOUSEHOLD SIZE
548
LABOR FORCE [ PEOPLE ]
47.2%
PERCENT IN LABOR FORCE
1.1%
UNEMPLOYMENT RATE
Income in Elverson borough
Income Overview in Elverson borough
Per Capita Income in Elverson borough is $45,955, while median incomes of families and households are $84,375 and $73,864 respectively.
| Characteristic | Number | Measure |
| Per Capita Income | 1,365 | $45,955 |
| Median Family Income | 397 | $84,375 |
| Mean Family Income | 397 | $116,735 |
| Median Household Income | 626 | $73,864 |
| Mean Household Income | 626 | $98,975 |
| Income Deficit | 397 | $0 |
| Wage / Income Gap (%) | 1,365 | 15.73% |
| Wage / Income Gap ($) | 1,365 | 84.27¢ per $1 |
| Gini / Inequality Index | 1,365 | 0.47 |
Earnings by Sex in Elverson borough
Average Earnings in Elverson borough are $49,750, $52,083 for men and $43,889 for women, a difference of 15.7%.
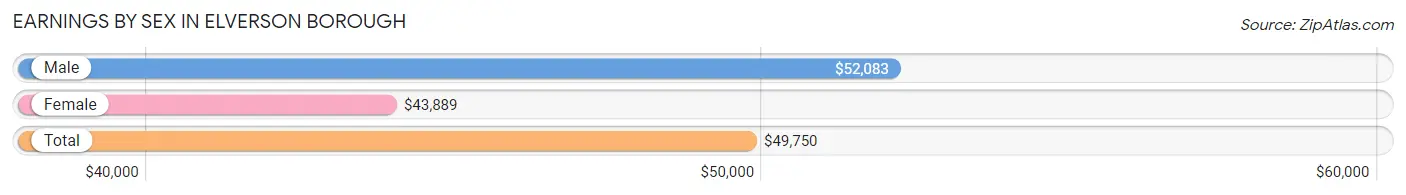
| Sex | Number | Average Earnings |
| Male | 316 (52.1%) | $52,083 |
| Female | 290 (47.8%) | $43,889 |
| Total | 606 (100.0%) | $49,750 |
Earnings by Sex by Income Bracket in Elverson borough
The most common earnings brackets in Elverson borough are $100,000+ for men (61 | 19.3%) and $75,000 to $99,999 for women (42 | 14.5%).
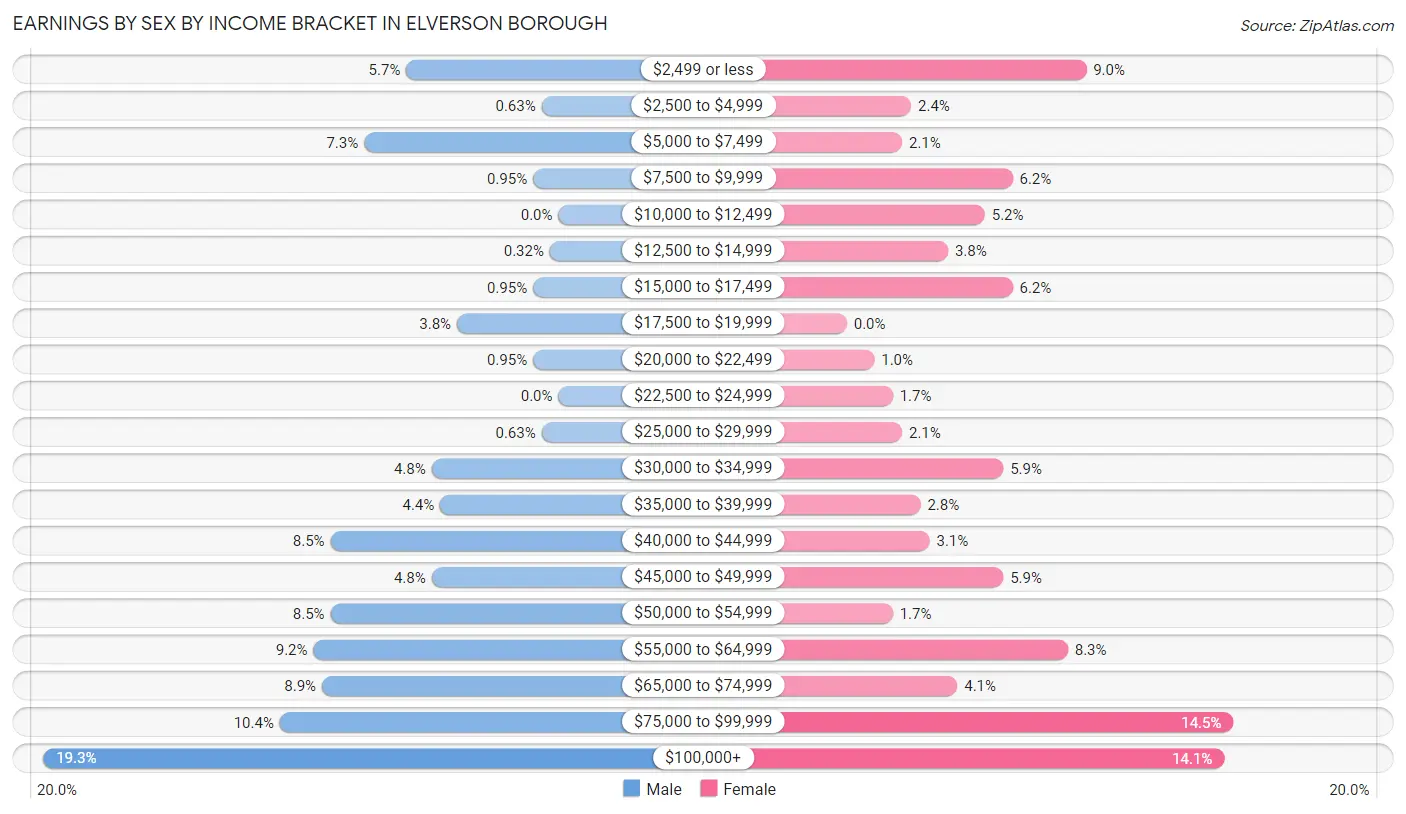
| Income | Male | Female |
| $2,499 or less | 18 (5.7%) | 26 (9.0%) |
| $2,500 to $4,999 | 2 (0.6%) | 7 (2.4%) |
| $5,000 to $7,499 | 23 (7.3%) | 6 (2.1%) |
| $7,500 to $9,999 | 3 (0.9%) | 18 (6.2%) |
| $10,000 to $12,499 | 0 (0.0%) | 15 (5.2%) |
| $12,500 to $14,999 | 1 (0.3%) | 11 (3.8%) |
| $15,000 to $17,499 | 3 (0.9%) | 18 (6.2%) |
| $17,500 to $19,999 | 12 (3.8%) | 0 (0.0%) |
| $20,000 to $22,499 | 3 (0.9%) | 3 (1.0%) |
| $22,500 to $24,999 | 0 (0.0%) | 5 (1.7%) |
| $25,000 to $29,999 | 2 (0.6%) | 6 (2.1%) |
| $30,000 to $34,999 | 15 (4.8%) | 17 (5.9%) |
| $35,000 to $39,999 | 14 (4.4%) | 8 (2.8%) |
| $40,000 to $44,999 | 27 (8.5%) | 9 (3.1%) |
| $45,000 to $49,999 | 15 (4.8%) | 17 (5.9%) |
| $50,000 to $54,999 | 27 (8.5%) | 5 (1.7%) |
| $55,000 to $64,999 | 29 (9.2%) | 24 (8.3%) |
| $65,000 to $74,999 | 28 (8.9%) | 12 (4.1%) |
| $75,000 to $99,999 | 33 (10.4%) | 42 (14.5%) |
| $100,000+ | 61 (19.3%) | 41 (14.1%) |
| Total | 316 (100.0%) | 290 (100.0%) |
Earnings by Sex by Educational Attainment in Elverson borough
Average earnings in Elverson borough are $58,380 for men and $49,000 for women, a difference of 16.1%. Men with an educational attainment of bachelor's degree enjoy the highest average annual earnings of $114,167, while those with college or associate's degree education earn the least with $51,302. Women with an educational attainment of graduate degree earn the most with the average annual earnings of $94,375, while those with college or associate's degree education have the smallest earnings of $35,417.
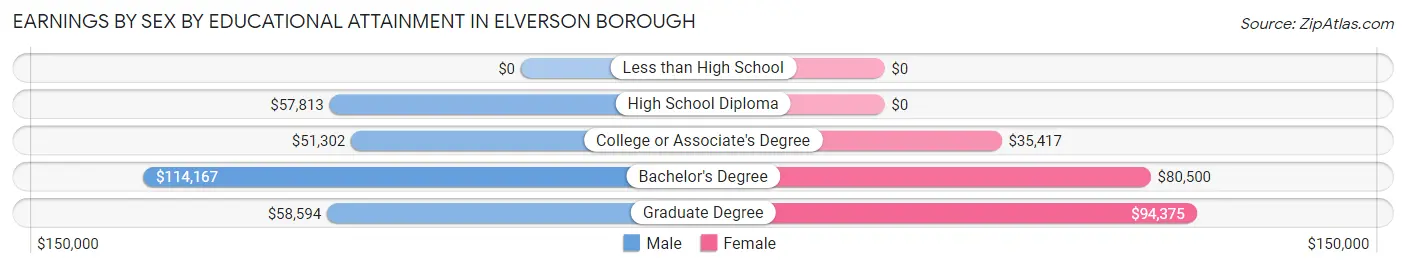
| Educational Attainment | Male Income | Female Income |
| Less than High School | - | - |
| High School Diploma | $57,813 | $0 |
| College or Associate's Degree | $51,302 | $35,417 |
| Bachelor's Degree | $114,167 | $80,500 |
| Graduate Degree | $58,594 | $94,375 |
| Total | $58,380 | $49,000 |
Family Income in Elverson borough
Family Income Brackets in Elverson borough
According to the Elverson borough family income data, there are 104 families falling into the $50,000 to $74,999 income range, which is the most common income bracket and makes up 26.2% of all families.
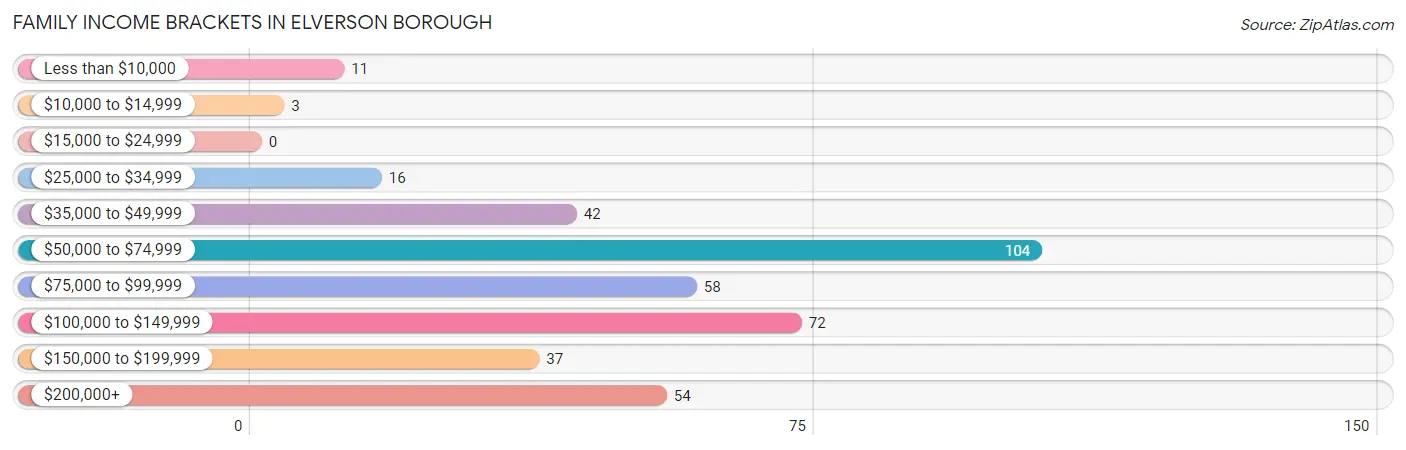
| Income Bracket | # Families | % Families |
| Less than $10,000 | 11 | 2.8% |
| $10,000 to $14,999 | 3 | 0.8% |
| $15,000 to $24,999 | 0 | 0.0% |
| $25,000 to $34,999 | 16 | 4.0% |
| $35,000 to $49,999 | 42 | 10.6% |
| $50,000 to $74,999 | 104 | 26.2% |
| $75,000 to $99,999 | 58 | 14.6% |
| $100,000 to $149,999 | 72 | 18.1% |
| $150,000 to $199,999 | 37 | 9.3% |
| $200,000+ | 54 | 13.6% |
Family Income by Famaliy Size in Elverson borough
5-person families (31 | 7.8%) account for the highest median family income in Elverson borough with $211,250 per family, while 2-person families (276 | 69.5%) have the highest median income of $42,292 per family member.
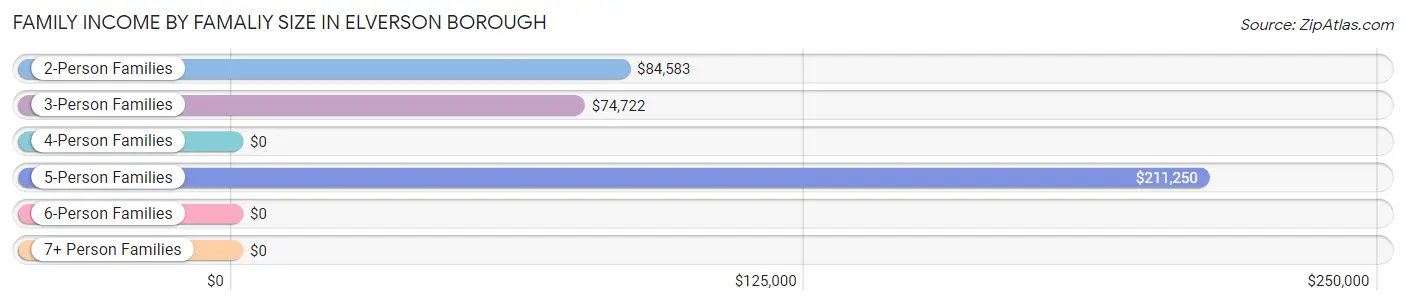
| Income Bracket | # Families | Median Income |
| 2-Person Families | 276 (69.5%) | $84,583 |
| 3-Person Families | 36 (9.1%) | $74,722 |
| 4-Person Families | 46 (11.6%) | $0 |
| 5-Person Families | 31 (7.8%) | $211,250 |
| 6-Person Families | 2 (0.5%) | $0 |
| 7+ Person Families | 6 (1.5%) | $0 |
| Total | 397 (100.0%) | $84,375 |
Family Income by Number of Earners in Elverson borough
The median family income in Elverson borough is $84,375, with families comprising 3+ earners (36) having the highest median family income of $206,250, while families with 1 earner (140) have the lowest median family income of $71,250, accounting for 9.1% and 35.3% of families, respectively.
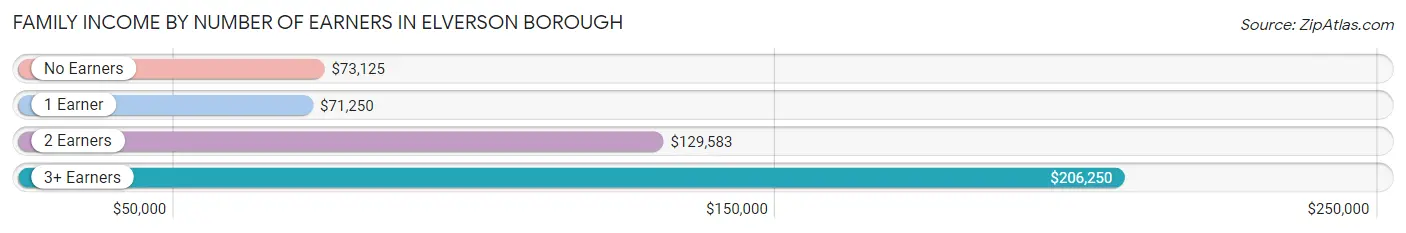
| Number of Earners | # Families | Median Income |
| No Earners | 110 (27.7%) | $73,125 |
| 1 Earner | 140 (35.3%) | $71,250 |
| 2 Earners | 111 (28.0%) | $129,583 |
| 3+ Earners | 36 (9.1%) | $206,250 |
| Total | 397 (100.0%) | $84,375 |
Household Income in Elverson borough
Household Income Brackets in Elverson borough
With 121 households falling in the category, the $50,000 to $74,999 income range is the most frequent in Elverson borough, accounting for 19.3% of all households. In contrast, only 9 households (1.4%) fall into the $10,000 to $14,999 income bracket, making it the least populous group.
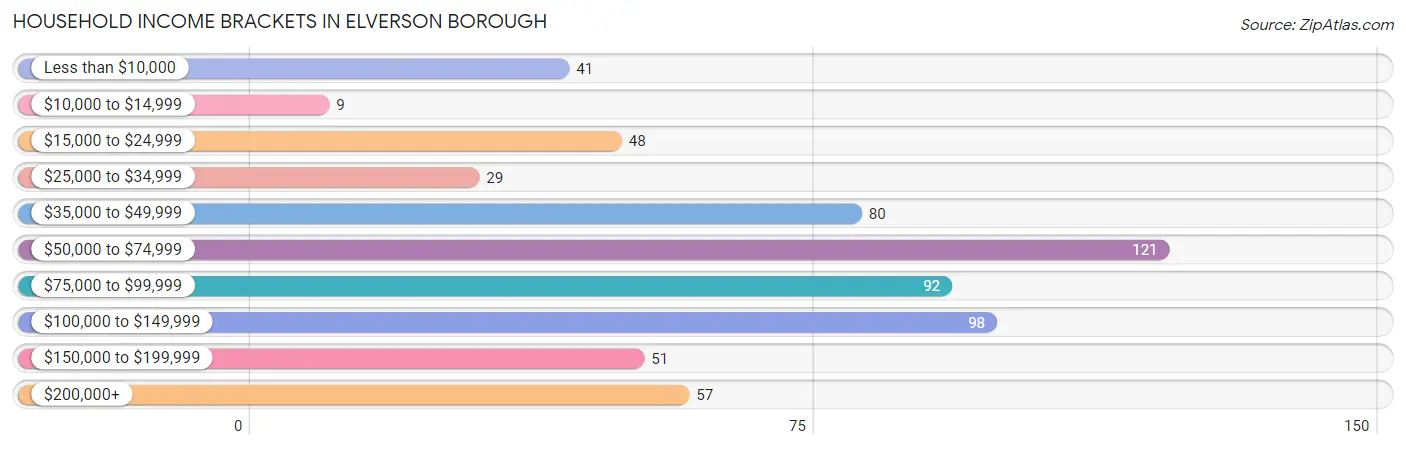
| Income Bracket | # Households | % Households |
| Less than $10,000 | 41 | 6.5% |
| $10,000 to $14,999 | 9 | 1.4% |
| $15,000 to $24,999 | 48 | 7.7% |
| $25,000 to $34,999 | 29 | 4.6% |
| $35,000 to $49,999 | 80 | 12.8% |
| $50,000 to $74,999 | 121 | 19.3% |
| $75,000 to $99,999 | 92 | 14.7% |
| $100,000 to $149,999 | 98 | 15.7% |
| $150,000 to $199,999 | 51 | 8.1% |
| $200,000+ | 57 | 9.1% |
Household Income by Householder Age in Elverson borough
The median household income in Elverson borough is $73,864, with the highest median household income of $97,778 found in the 45 to 64 years age bracket for the primary householder. A total of 146 households (23.3%) fall into this category. Meanwhile, the 15 to 24 years age bracket for the primary householder has the lowest median household income of $0, with 8 households (1.3%) in this group.
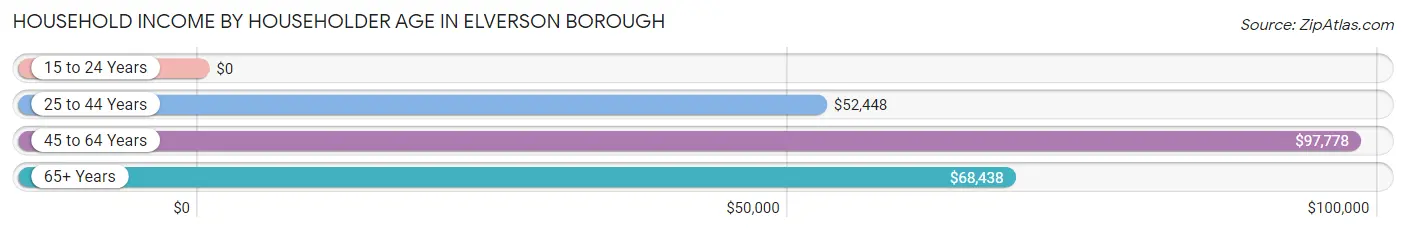
| Income Bracket | # Households | Median Income |
| 15 to 24 Years | 8 (1.3%) | $0 |
| 25 to 44 Years | 123 (19.7%) | $52,448 |
| 45 to 64 Years | 146 (23.3%) | $97,778 |
| 65+ Years | 349 (55.7%) | $68,438 |
| Total | 626 (100.0%) | $73,864 |
Poverty in Elverson borough
Income Below Poverty by Sex and Age in Elverson borough
With 4.9% poverty level for males and 5.5% for females among the residents of Elverson borough, 25 to 34 year old males and 75 year old and over females are the most vulnerable to poverty, with 9 males (13.0%) and 20 females (12.0%) in their respective age groups living below the poverty level.
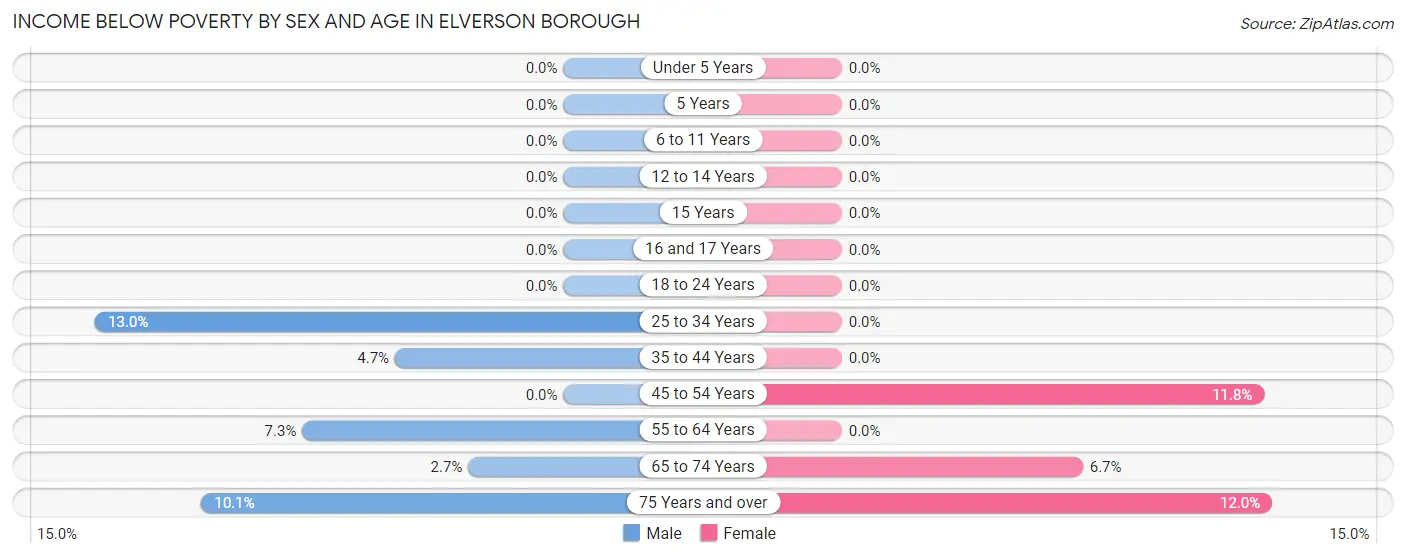
| Age Bracket | Male | Female |
| Under 5 Years | 0 (0.0%) | 0 (0.0%) |
| 5 Years | 0 (0.0%) | 0 (0.0%) |
| 6 to 11 Years | 0 (0.0%) | 0 (0.0%) |
| 12 to 14 Years | 0 (0.0%) | 0 (0.0%) |
| 15 Years | 0 (0.0%) | 0 (0.0%) |
| 16 and 17 Years | 0 (0.0%) | 0 (0.0%) |
| 18 to 24 Years | 0 (0.0%) | 0 (0.0%) |
| 25 to 34 Years | 9 (13.0%) | 0 (0.0%) |
| 35 to 44 Years | 3 (4.7%) | 0 (0.0%) |
| 45 to 54 Years | 0 (0.0%) | 8 (11.8%) |
| 55 to 64 Years | 4 (7.3%) | 0 (0.0%) |
| 65 to 74 Years | 3 (2.6%) | 11 (6.7%) |
| 75 Years and over | 13 (10.1%) | 20 (12.0%) |
| Total | 32 (4.9%) | 39 (5.5%) |
Income Above Poverty by Sex and Age in Elverson borough
According to the poverty statistics in Elverson borough, males aged under 5 years and females aged under 5 years are the age groups that are most secure financially, with 100.0% of males and 100.0% of females in these age groups living above the poverty line.
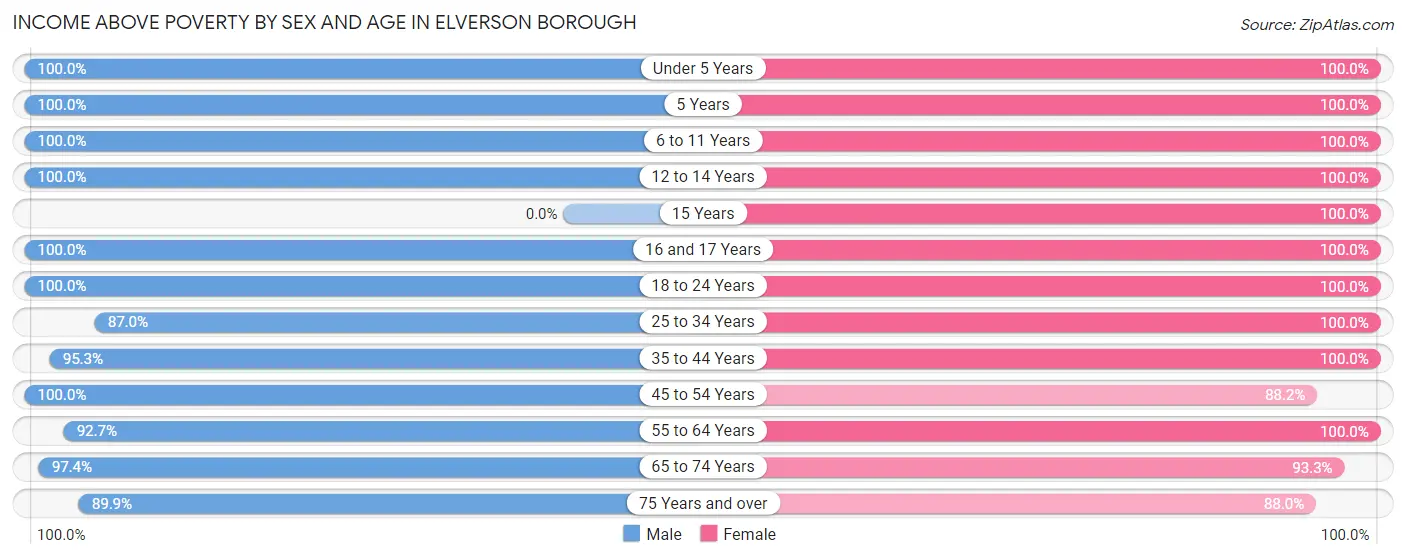
| Age Bracket | Male | Female |
| Under 5 Years | 95 (100.0%) | 44 (100.0%) |
| 5 Years | 3 (100.0%) | 2 (100.0%) |
| 6 to 11 Years | 18 (100.0%) | 11 (100.0%) |
| 12 to 14 Years | 7 (100.0%) | 16 (100.0%) |
| 15 Years | 0 (0.0%) | 3 (100.0%) |
| 16 and 17 Years | 13 (100.0%) | 14 (100.0%) |
| 18 to 24 Years | 45 (100.0%) | 42 (100.0%) |
| 25 to 34 Years | 60 (87.0%) | 82 (100.0%) |
| 35 to 44 Years | 61 (95.3%) | 26 (100.0%) |
| 45 to 54 Years | 37 (100.0%) | 60 (88.2%) |
| 55 to 64 Years | 51 (92.7%) | 72 (100.0%) |
| 65 to 74 Years | 110 (97.4%) | 153 (93.3%) |
| 75 Years and over | 116 (89.9%) | 147 (88.0%) |
| Total | 616 (95.1%) | 672 (94.5%) |
Income Below Poverty Among Married-Couple Families in Elverson borough
The poverty statistics for married-couple families in Elverson borough show that 1.8% or 6 of the total 331 families live below the poverty line. Families with no children have the highest poverty rate of 2.4%, comprising of 6 families. On the other hand, families with 1 or 2 children have the lowest poverty rate of 0.0%, which includes 0 families.
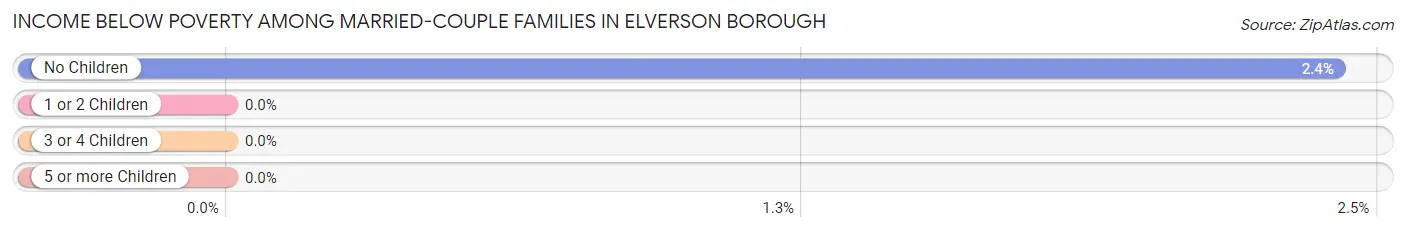
| Children | Above Poverty | Below Poverty |
| No Children | 243 (97.6%) | 6 (2.4%) |
| 1 or 2 Children | 62 (100.0%) | 0 (0.0%) |
| 3 or 4 Children | 20 (100.0%) | 0 (0.0%) |
| 5 or more Children | 0 (0.0%) | 0 (0.0%) |
| Total | 325 (98.2%) | 6 (1.8%) |
Income Below Poverty Among Single-Parent Households in Elverson borough
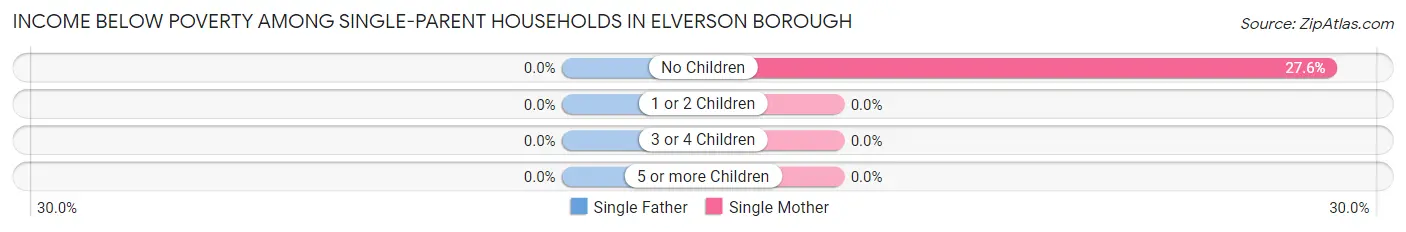
| Children | Single Father | Single Mother |
| No Children | 0 (0.0%) | 8 (27.6%) |
| 1 or 2 Children | 0 (0.0%) | 0 (0.0%) |
| 3 or 4 Children | 0 (0.0%) | 0 (0.0%) |
| 5 or more Children | 0 (0.0%) | 0 (0.0%) |
| Total | 0 (0.0%) | 8 (13.8%) |
Income Below Poverty Among Married-Couple vs Single-Parent Households in Elverson borough
The poverty data for Elverson borough shows that 6 of the married-couple family households (1.8%) and 8 of the single-parent households (12.1%) are living below the poverty level. Within the married-couple family households, those with no children have the highest poverty rate, with 6 households (2.4%) falling below the poverty line. Among the single-parent households, those with no children have the highest poverty rate, with 8 household (27.6%) living below poverty.
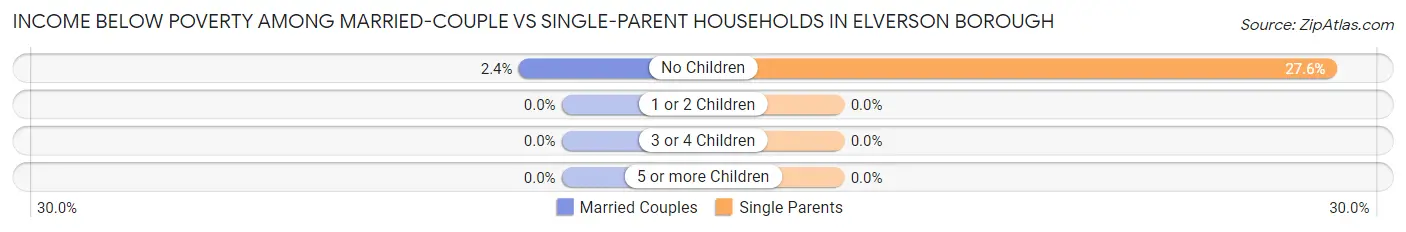
| Children | Married-Couple Families | Single-Parent Households |
| No Children | 6 (2.4%) | 8 (27.6%) |
| 1 or 2 Children | 0 (0.0%) | 0 (0.0%) |
| 3 or 4 Children | 0 (0.0%) | 0 (0.0%) |
| 5 or more Children | 0 (0.0%) | 0 (0.0%) |
| Total | 6 (1.8%) | 8 (12.1%) |
Race in Elverson borough
The most populous races in Elverson borough are White / Caucasian (1,304 | 95.5%), Hispanic or Latino (65 | 4.8%), and Two or more Races (36 | 2.6%).
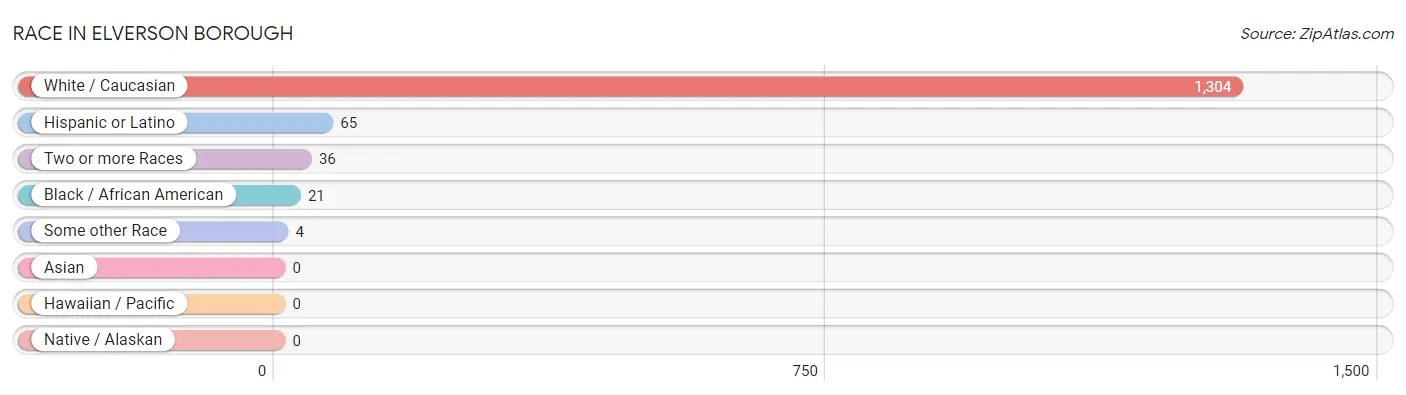
| Race | # Population | % Population |
| Asian | 0 | 0.0% |
| Black / African American | 21 | 1.5% |
| Hawaiian / Pacific | 0 | 0.0% |
| Hispanic or Latino | 65 | 4.8% |
| Native / Alaskan | 0 | 0.0% |
| White / Caucasian | 1,304 | 95.5% |
| Two or more Races | 36 | 2.6% |
| Some other Race | 4 | 0.3% |
| Total | 1,365 | 100.0% |
Ancestry in Elverson borough
The most populous ancestries reported in Elverson borough are German (345 | 25.3%), Irish (259 | 19.0%), English (213 | 15.6%), Italian (171 | 12.5%), and American (82 | 6.0%), together accounting for 78.4% of all Elverson borough residents.
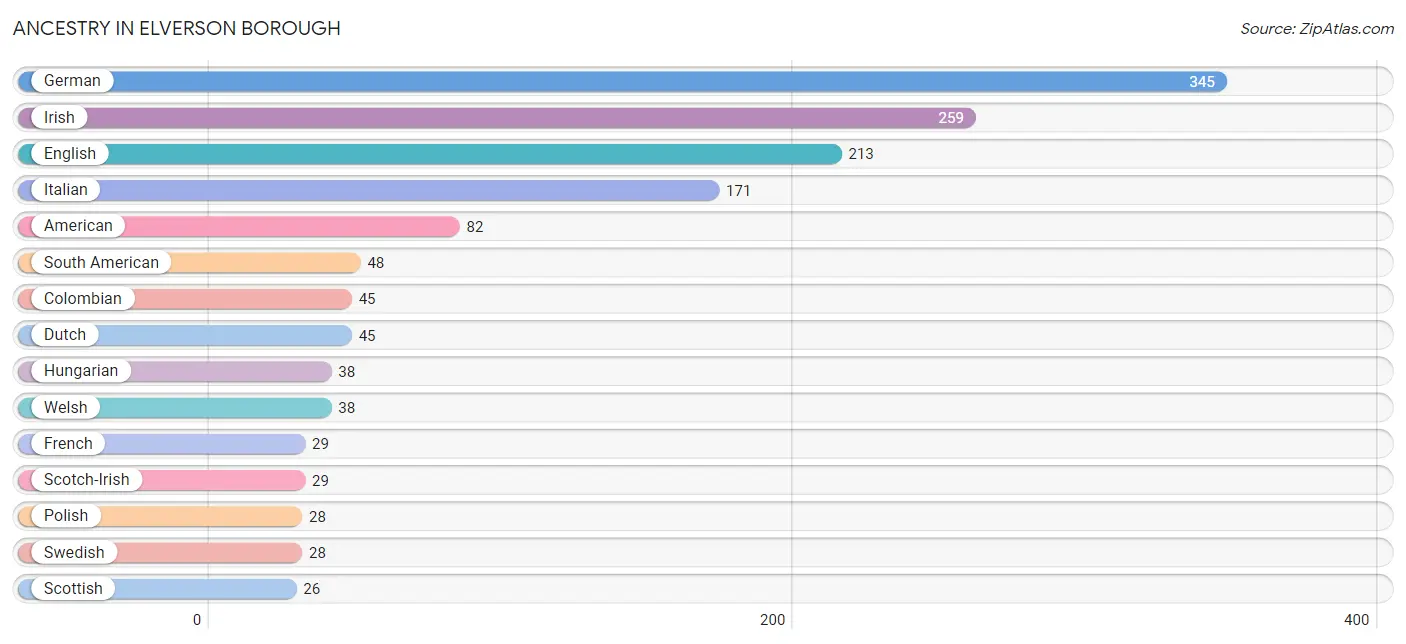
| Ancestry | # Population | % Population |
| Albanian | 2 | 0.2% |
| American | 82 | 6.0% |
| Armenian | 2 | 0.2% |
| Austrian | 1 | 0.1% |
| Belgian | 2 | 0.2% |
| British | 10 | 0.7% |
| Canadian | 3 | 0.2% |
| Colombian | 45 | 3.3% |
| Croatian | 4 | 0.3% |
| Czechoslovakian | 5 | 0.4% |
| Delaware | 2 | 0.2% |
| Dutch | 45 | 3.3% |
| Eastern European | 2 | 0.2% |
| English | 213 | 15.6% |
| European | 8 | 0.6% |
| French | 29 | 2.1% |
| French Canadian | 11 | 0.8% |
| German | 345 | 25.3% |
| Greek | 5 | 0.4% |
| Hungarian | 38 | 2.8% |
| Irish | 259 | 19.0% |
| Italian | 171 | 12.5% |
| Latvian | 2 | 0.2% |
| Lithuanian | 2 | 0.2% |
| Luxembourger | 3 | 0.2% |
| Northern European | 6 | 0.4% |
| Norwegian | 5 | 0.4% |
| Pennsylvania German | 7 | 0.5% |
| Polish | 28 | 2.1% |
| Portuguese | 3 | 0.2% |
| Puerto Rican | 17 | 1.3% |
| Russian | 4 | 0.3% |
| Scandinavian | 3 | 0.2% |
| Scotch-Irish | 29 | 2.1% |
| Scottish | 26 | 1.9% |
| Slavic | 3 | 0.2% |
| Slovak | 11 | 0.8% |
| South American | 48 | 3.5% |
| Sri Lankan | 3 | 0.2% |
| Swedish | 28 | 2.1% |
| Swiss | 11 | 0.8% |
| Ukrainian | 3 | 0.2% |
| Venezuelan | 3 | 0.2% |
| Welsh | 38 | 2.8% | View All 44 Rows |
Immigrants in Elverson borough
The most numerous immigrant groups reported in Elverson borough came from Europe (30 | 2.2%), Eastern Europe (14 | 1.0%), Russia (14 | 1.0%), Northern Europe (9 | 0.7%), and Guyana (8 | 0.6%), together accounting for 5.5% of all Elverson borough residents.
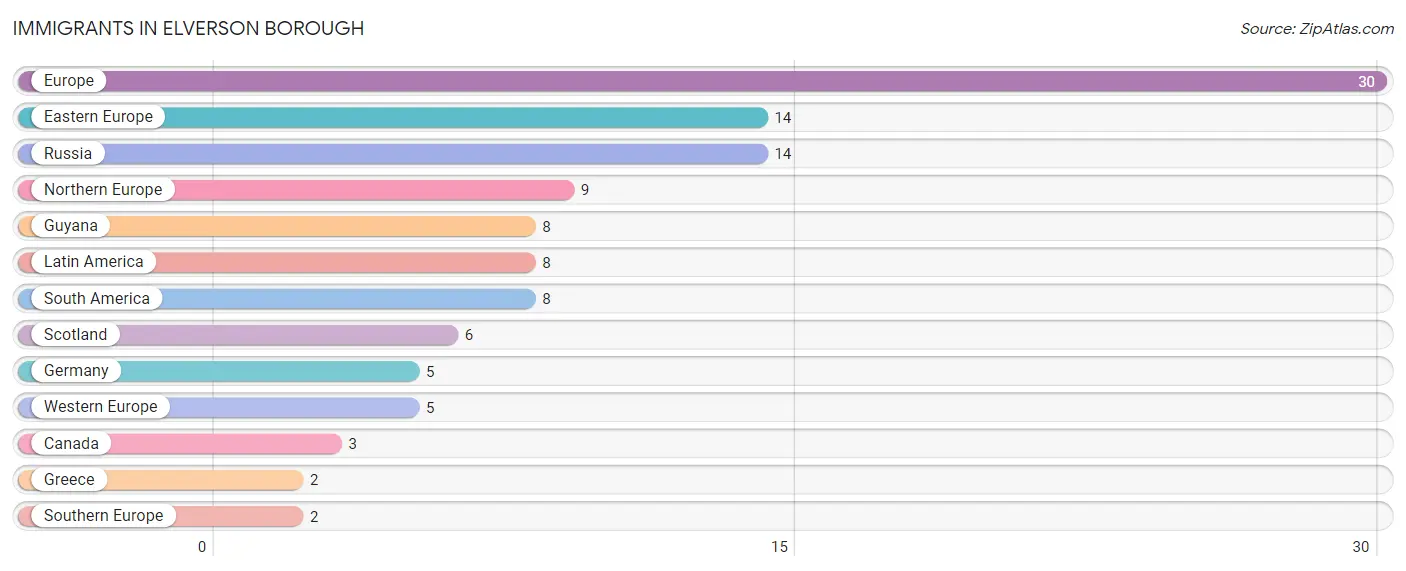
| Immigration Origin | # Population | % Population |
| Canada | 3 | 0.2% |
| Eastern Europe | 14 | 1.0% |
| Europe | 30 | 2.2% |
| Germany | 5 | 0.4% |
| Greece | 2 | 0.2% |
| Guyana | 8 | 0.6% |
| Latin America | 8 | 0.6% |
| Northern Europe | 9 | 0.7% |
| Russia | 14 | 1.0% |
| Scotland | 6 | 0.4% |
| South America | 8 | 0.6% |
| Southern Europe | 2 | 0.2% |
| Western Europe | 5 | 0.4% | View All 13 Rows |
Sex and Age in Elverson borough
Sex and Age in Elverson borough
The most populous age groups in Elverson borough are Under 5 Years (95 | 14.5%) for men and 70 to 74 Years (101 | 14.2%) for women.
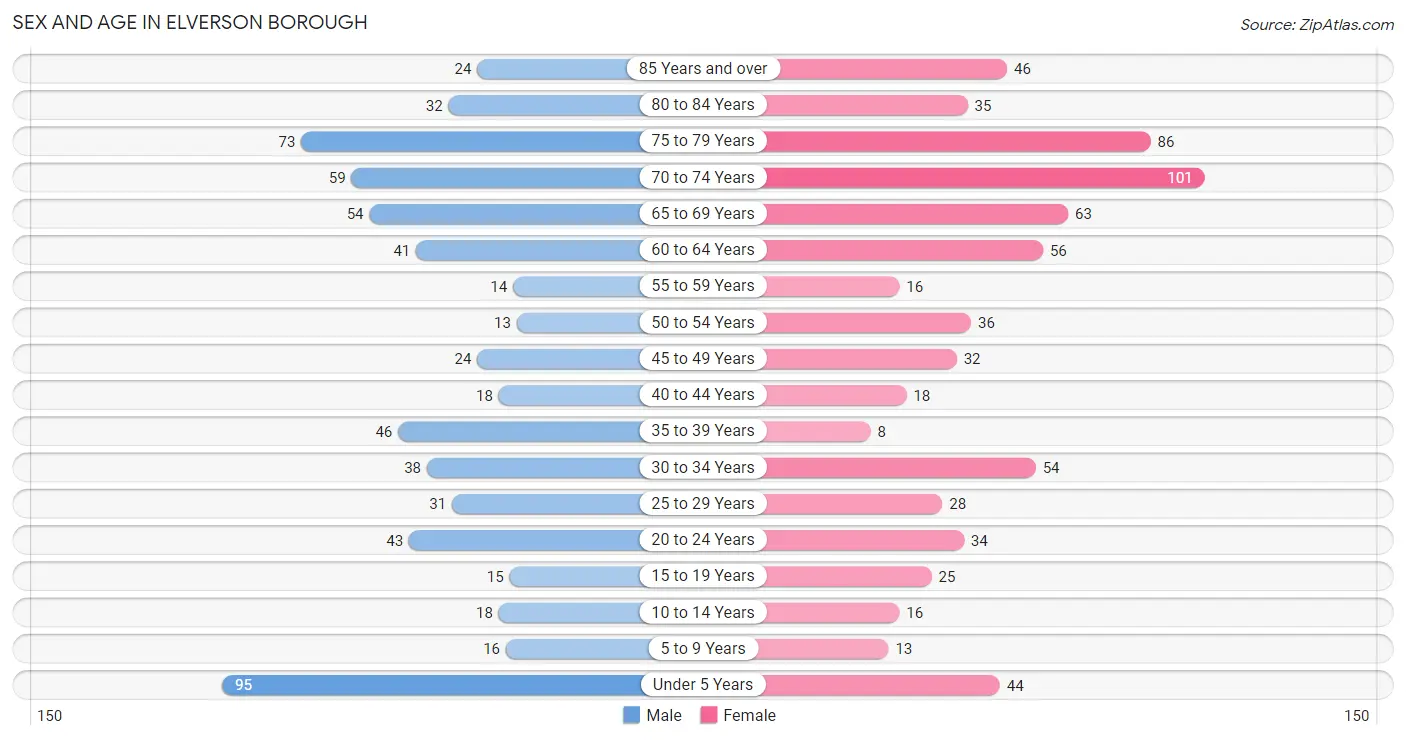
| Age Bracket | Male | Female |
| Under 5 Years | 95 (14.5%) | 44 (6.2%) |
| 5 to 9 Years | 16 (2.5%) | 13 (1.8%) |
| 10 to 14 Years | 18 (2.8%) | 16 (2.2%) |
| 15 to 19 Years | 15 (2.3%) | 25 (3.5%) |
| 20 to 24 Years | 43 (6.6%) | 34 (4.8%) |
| 25 to 29 Years | 31 (4.7%) | 28 (3.9%) |
| 30 to 34 Years | 38 (5.8%) | 54 (7.6%) |
| 35 to 39 Years | 46 (7.0%) | 8 (1.1%) |
| 40 to 44 Years | 18 (2.8%) | 18 (2.5%) |
| 45 to 49 Years | 24 (3.7%) | 32 (4.5%) |
| 50 to 54 Years | 13 (2.0%) | 36 (5.1%) |
| 55 to 59 Years | 14 (2.1%) | 16 (2.2%) |
| 60 to 64 Years | 41 (6.3%) | 56 (7.9%) |
| 65 to 69 Years | 54 (8.3%) | 63 (8.9%) |
| 70 to 74 Years | 59 (9.0%) | 101 (14.2%) |
| 75 to 79 Years | 73 (11.2%) | 86 (12.1%) |
| 80 to 84 Years | 32 (4.9%) | 35 (4.9%) |
| 85 Years and over | 24 (3.7%) | 46 (6.5%) |
| Total | 654 (100.0%) | 711 (100.0%) |
Families and Households in Elverson borough
Median Family Size in Elverson borough
The median family size in Elverson borough is 2.76 persons per family, with married-couple families (331 | 83.4%) accounting for the largest median family size of 2.83 persons per family. On the other hand, single male/father families (8 | 2.0%) represent the smallest median family size with 2.13 persons per family.
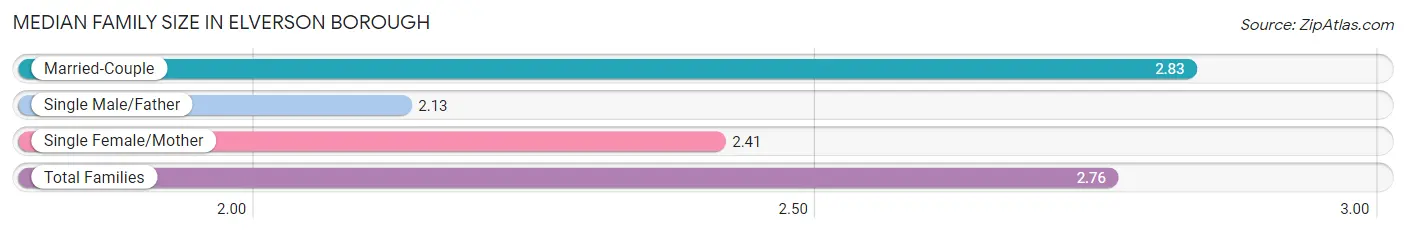
| Family Type | # Families | Family Size |
| Married-Couple | 331 (83.4%) | 2.83 |
| Single Male/Father | 8 (2.0%) | 2.13 |
| Single Female/Mother | 58 (14.6%) | 2.41 |
| Total Families | 397 (100.0%) | 2.76 |
Median Household Size in Elverson borough
The median household size in Elverson borough is 2.18 persons per household, with single male/father households (8 | 1.3%) accounting for the largest median household size of 3.88 persons per household. non-family households (229 | 36.6%) represent the smallest median household size with 1.09 persons per household.
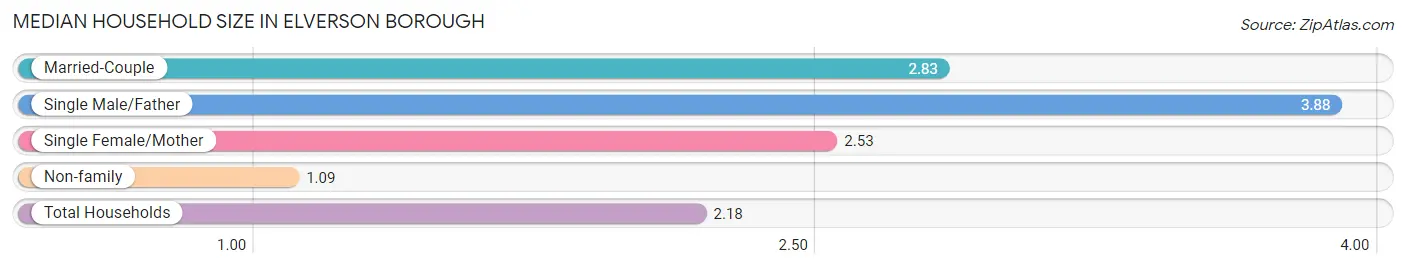
| Household Type | # Households | Household Size |
| Married-Couple | 331 (52.9%) | 2.83 |
| Single Male/Father | 8 (1.3%) | 3.88 |
| Single Female/Mother | 58 (9.3%) | 2.53 |
| Non-family | 229 (36.6%) | 1.09 |
| Total Households | 626 (100.0%) | 2.18 |
Household Size by Marriage Status in Elverson borough
Out of a total of 626 households in Elverson borough, 397 (63.4%) are family households, while 229 (36.6%) are nonfamily households. The most numerous type of family households are 2-person households, comprising 262, and the most common type of nonfamily households are 1-person households, comprising 208.
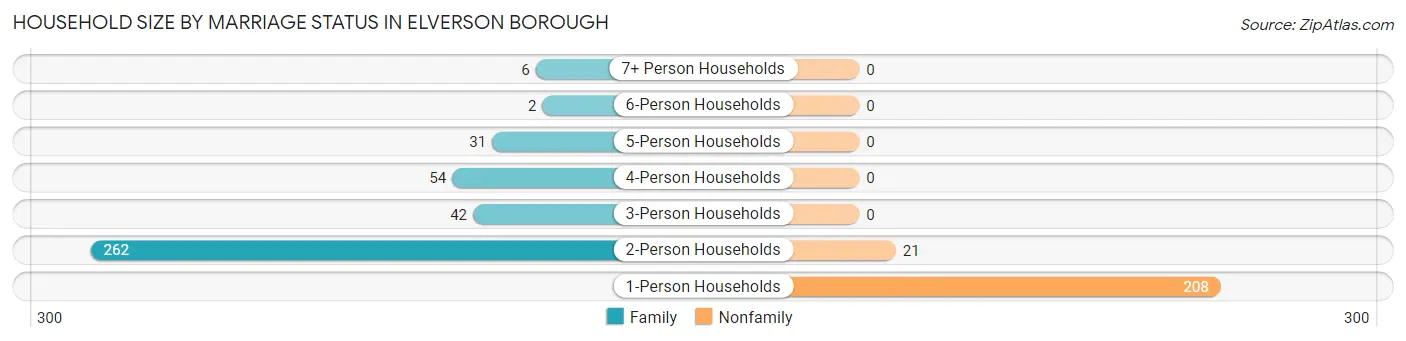
| Household Size | Family Households | Nonfamily Households |
| 1-Person Households | - | 208 (33.2%) |
| 2-Person Households | 262 (41.8%) | 21 (3.4%) |
| 3-Person Households | 42 (6.7%) | 0 (0.0%) |
| 4-Person Households | 54 (8.6%) | 0 (0.0%) |
| 5-Person Households | 31 (5.0%) | 0 (0.0%) |
| 6-Person Households | 2 (0.3%) | 0 (0.0%) |
| 7+ Person Households | 6 (1.0%) | 0 (0.0%) |
| Total | 397 (63.4%) | 229 (36.6%) |
Female Fertility in Elverson borough
Fertility by Age in Elverson borough
Average fertility rate in Elverson borough is 151.0 births per 1,000 women. Women in the age bracket of 20 to 34 years have the highest fertility rate with 259.0 births per 1,000 women. Women in the age bracket of 20 to 34 years acount for 100.0% of all women with births.
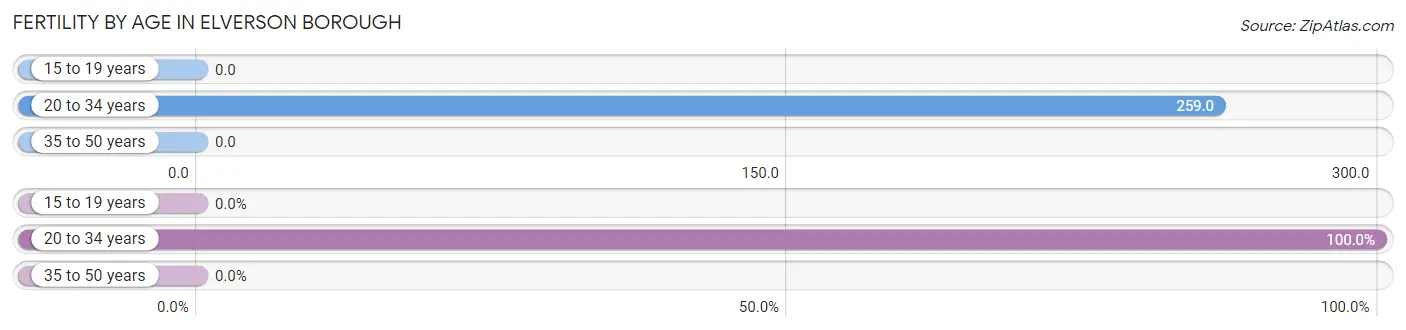
| Age Bracket | Women with Births | Births / 1,000 Women |
| 15 to 19 years | 0 (0.0%) | 0.0 |
| 20 to 34 years | 30 (100.0%) | 259.0 |
| 35 to 50 years | 0 (0.0%) | 0.0 |
| Total | 30 (100.0%) | 151.0 |
Fertility by Age by Marriage Status in Elverson borough
36.7% of women with births (30) in Elverson borough are married. The highest percentage of unmarried women with births falls into 20 to 34 years age bracket with 63.3% of them unmarried at the time of birth, while the lowest percentage of unmarried women with births belong to 20 to 34 years age bracket with 63.3% of them unmarried.
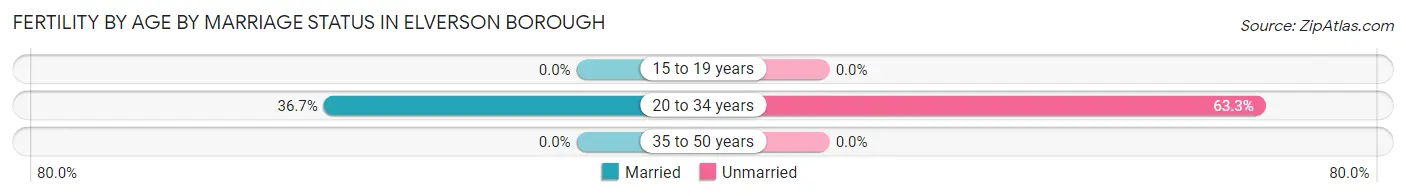
| Age Bracket | Married | Unmarried |
| 15 to 19 years | 0 (0.0%) | 0 (0.0%) |
| 20 to 34 years | 11 (36.7%) | 19 (63.3%) |
| 35 to 50 years | 0 (0.0%) | 0 (0.0%) |
| Total | 11 (36.7%) | 19 (63.3%) |
Fertility by Education in Elverson borough
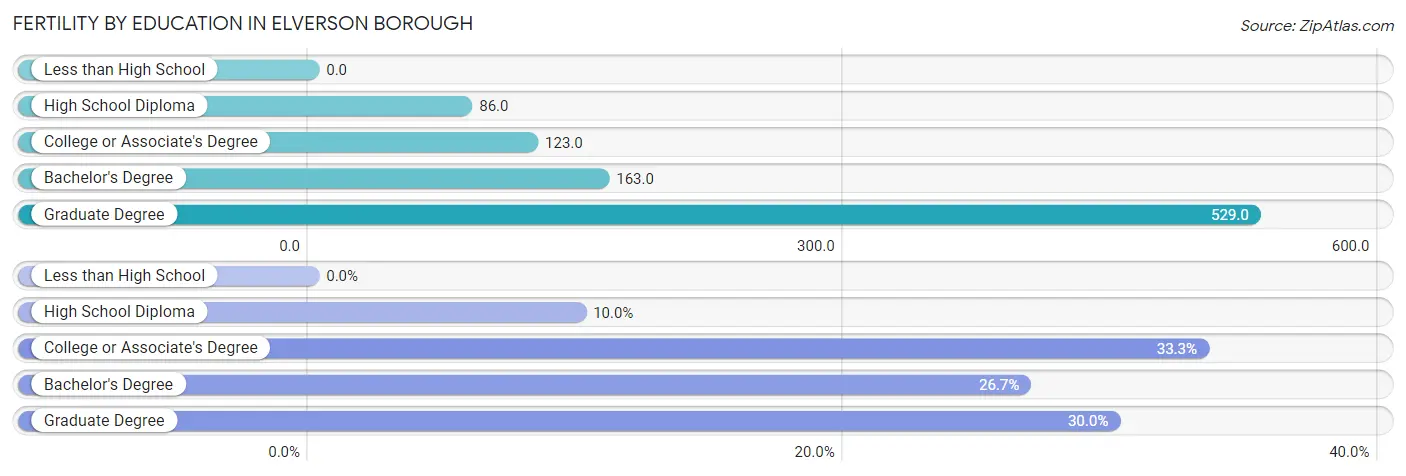
| Educational Attainment | Women with Births | Births / 1,000 Women |
| Less than High School | 0 (0.0%) | 0.0 |
| High School Diploma | 3 (10.0%) | 86.0 |
| College or Associate's Degree | 10 (33.3%) | 123.0 |
| Bachelor's Degree | 8 (26.7%) | 163.0 |
| Graduate Degree | 9 (30.0%) | 529.0 |
| Total | 30 (100.0%) | 151.0 |
Fertility by Education by Marriage Status in Elverson borough
63.3% of women with births in Elverson borough are unmarried. Women with the educational attainment of high school diploma are most likely to be married with 100.0% of them married at childbirth, while women with the educational attainment of college or associate's degree are least likely to be married with 100.0% of them unmarried at childbirth.
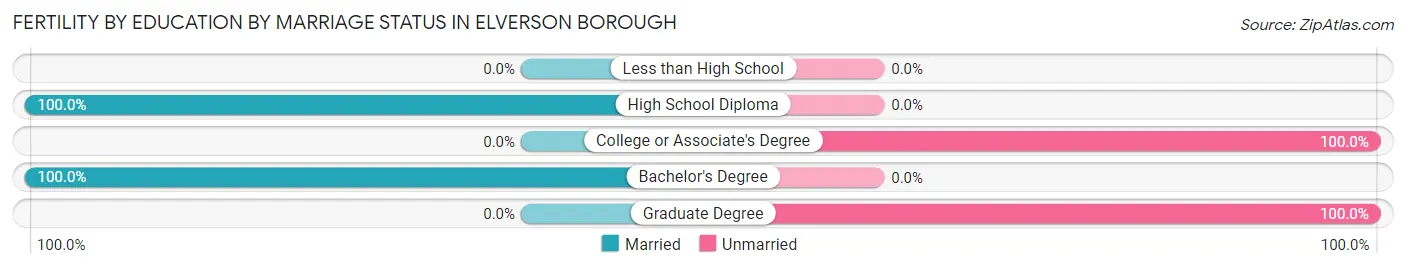
| Educational Attainment | Married | Unmarried |
| Less than High School | 0 (0.0%) | 0 (0.0%) |
| High School Diploma | 3 (100.0%) | 0 (0.0%) |
| College or Associate's Degree | 0 (0.0%) | 10 (100.0%) |
| Bachelor's Degree | 8 (100.0%) | 0 (0.0%) |
| Graduate Degree | 0 (0.0%) | 9 (100.0%) |
| Total | 11 (36.7%) | 19 (63.3%) |
Employment Characteristics in Elverson borough
Employment by Class of Employer in Elverson borough
Among the 542 employed individuals in Elverson borough, private company employees (382 | 70.5%), not-for-profit organizations (65 | 12.0%), and local government employees (35 | 6.5%) make up the most common classes of employment.
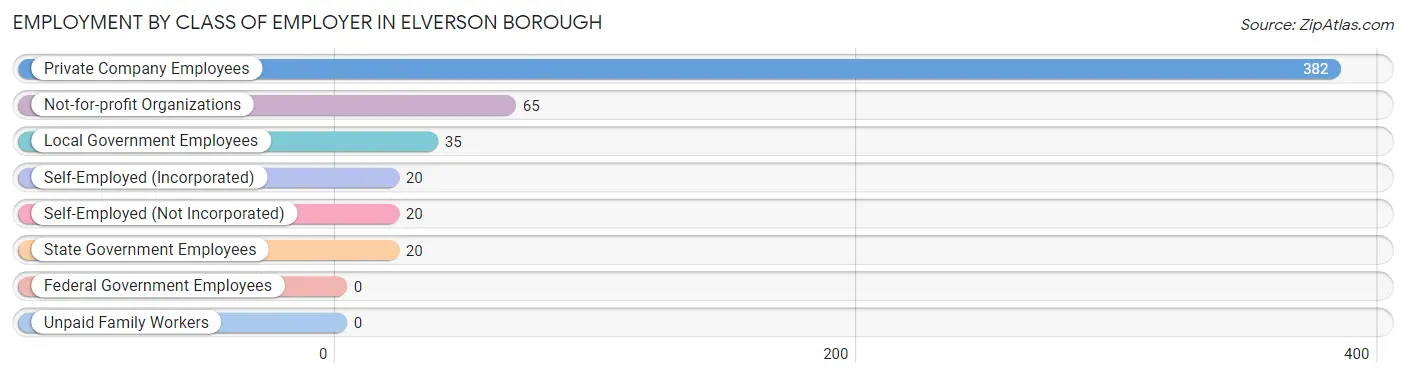
| Employer Class | # Employees | % Employees |
| Private Company Employees | 382 | 70.5% |
| Self-Employed (Incorporated) | 20 | 3.7% |
| Self-Employed (Not Incorporated) | 20 | 3.7% |
| Not-for-profit Organizations | 65 | 12.0% |
| Local Government Employees | 35 | 6.5% |
| State Government Employees | 20 | 3.7% |
| Federal Government Employees | 0 | 0.0% |
| Unpaid Family Workers | 0 | 0.0% |
| Total | 542 | 100.0% |
Employment Status by Age in Elverson borough
According to the labor force statistics for Elverson borough, out of the total population over 16 years of age (1,160), 47.2% or 548 individuals are in the labor force, with 1.1% or 6 of them unemployed. The age group with the highest labor force participation rate is 55 to 59 years, with 86.7% or 26 individuals in the labor force. Within the labor force, the 16 to 19 years age range has the highest percentage of unemployed individuals, with 100.0% or 1 of them being unemployed.
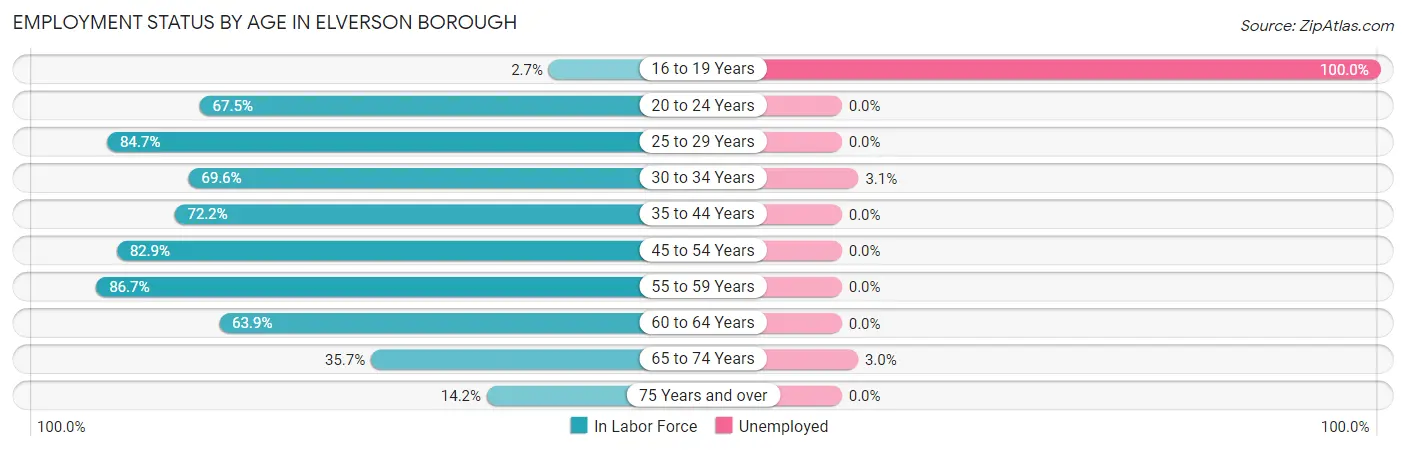
| Age Bracket | In Labor Force | Unemployed |
| 16 to 19 Years | 1 (2.7%) | 1 (100.0%) |
| 20 to 24 Years | 52 (67.5%) | 0 (0.0%) |
| 25 to 29 Years | 50 (84.7%) | 0 (0.0%) |
| 30 to 34 Years | 64 (69.6%) | 2 (3.1%) |
| 35 to 44 Years | 65 (72.2%) | 0 (0.0%) |
| 45 to 54 Years | 87 (82.9%) | 0 (0.0%) |
| 55 to 59 Years | 26 (86.7%) | 0 (0.0%) |
| 60 to 64 Years | 62 (63.9%) | 0 (0.0%) |
| 65 to 74 Years | 99 (35.7%) | 3 (3.0%) |
| 75 Years and over | 42 (14.2%) | 0 (0.0%) |
| Total | 548 (47.2%) | 6 (1.1%) |
Employment Status by Educational Attainment in Elverson borough
According to labor force statistics for Elverson borough, 74.8% of individuals (354) out of the total population between 25 and 64 years of age (473) are in the labor force, with 0.6% or 2 of them being unemployed. The group with the highest labor force participation rate are those with the educational attainment of less than high school, with 100.0% or 4 individuals in the labor force. Within the labor force, individuals with high school diploma education have the highest percentage of unemployment, with 2.1% or 2 of them being unemployed.
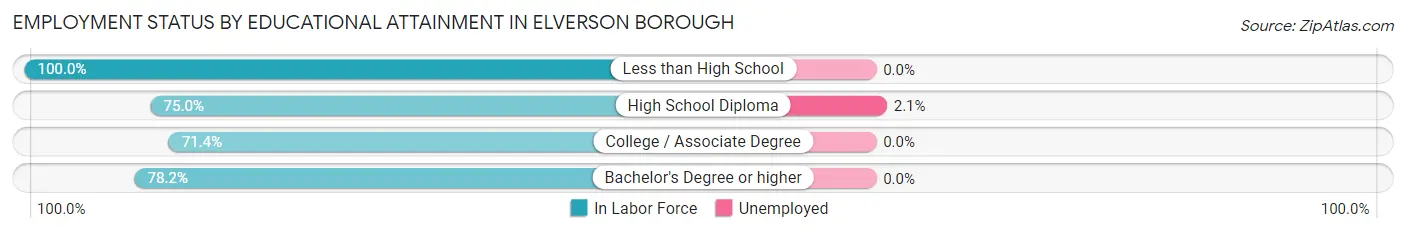
| Educational Attainment | In Labor Force | Unemployed |
| Less than High School | 4 (100.0%) | 0 (0.0%) |
| High School Diploma | 96 (75.0%) | 3 (2.1%) |
| College / Associate Degree | 132 (71.4%) | 0 (0.0%) |
| Bachelor's Degree or higher | 122 (78.2%) | 0 (0.0%) |
| Total | 354 (74.8%) | 3 (0.6%) |
Employment Occupations by Sex in Elverson borough
Management, Business, Science and Arts Occupations
The most common Management, Business, Science and Arts occupations in Elverson borough are Community & Social Service (73 | 13.5%), Management (66 | 12.2%), Education Instruction & Library (55 | 10.2%), Computers, Engineering & Science (32 | 5.9%), and Health Diagnosing & Treating (21 | 3.9%).
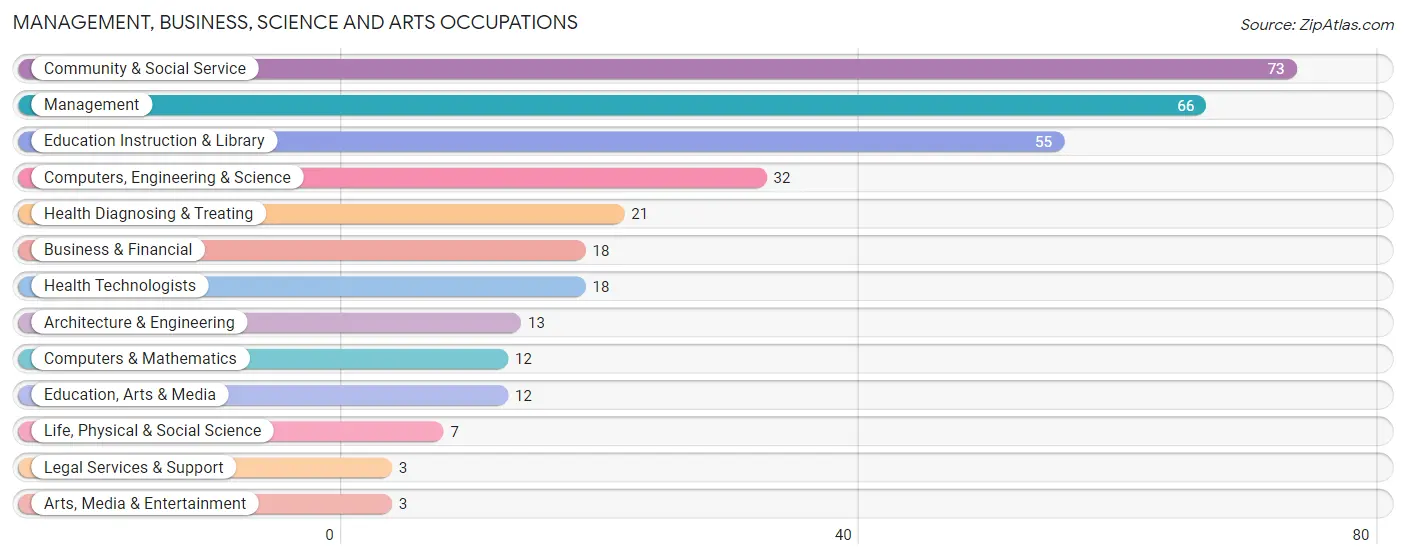
Management, Business, Science and Arts Occupations by Sex
Within the Management, Business, Science and Arts occupations in Elverson borough, the most male-oriented occupations are Arts, Media & Entertainment (100.0%), Architecture & Engineering (76.9%), and Education, Arts & Media (75.0%), while the most female-oriented occupations are Legal Services & Support (100.0%), Health Diagnosing & Treating (100.0%), and Health Technologists (100.0%).
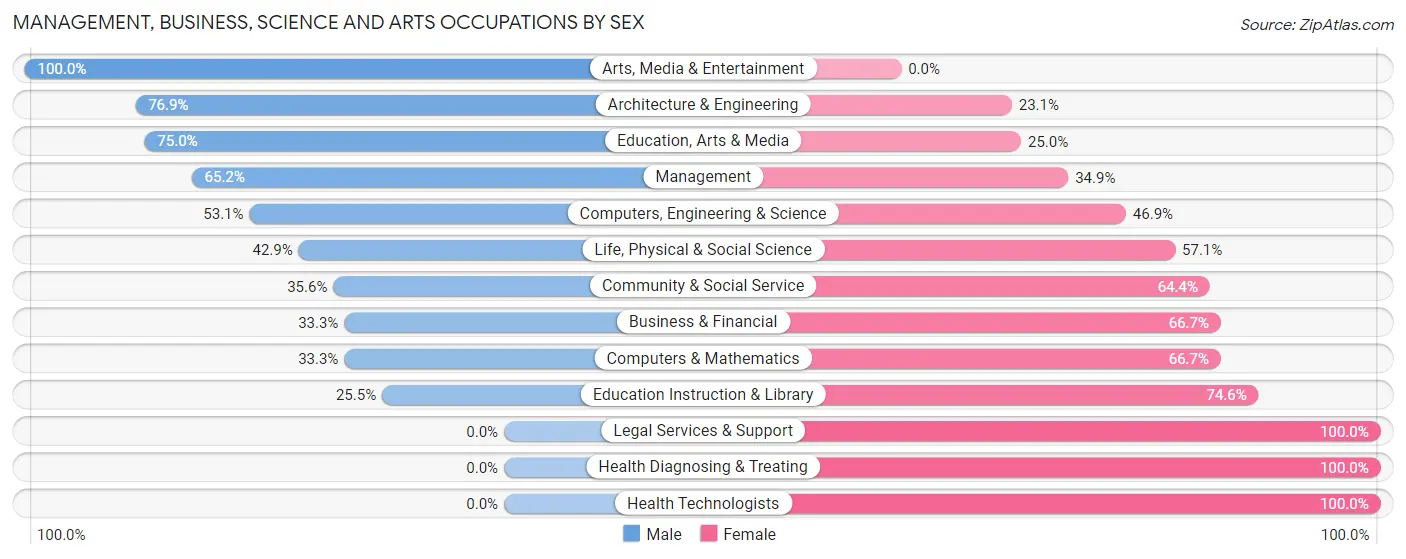
| Occupation | Male | Female |
| Management | 43 (65.1%) | 23 (34.8%) |
| Business & Financial | 6 (33.3%) | 12 (66.7%) |
| Computers, Engineering & Science | 17 (53.1%) | 15 (46.9%) |
| Computers & Mathematics | 4 (33.3%) | 8 (66.7%) |
| Architecture & Engineering | 10 (76.9%) | 3 (23.1%) |
| Life, Physical & Social Science | 3 (42.9%) | 4 (57.1%) |
| Community & Social Service | 26 (35.6%) | 47 (64.4%) |
| Education, Arts & Media | 9 (75.0%) | 3 (25.0%) |
| Legal Services & Support | 0 (0.0%) | 3 (100.0%) |
| Education Instruction & Library | 14 (25.5%) | 41 (74.6%) |
| Arts, Media & Entertainment | 3 (100.0%) | 0 (0.0%) |
| Health Diagnosing & Treating | 0 (0.0%) | 21 (100.0%) |
| Health Technologists | 0 (0.0%) | 18 (100.0%) |
| Total (Category) | 92 (43.8%) | 118 (56.2%) |
| Total (Overall) | 285 (52.6%) | 257 (47.4%) |
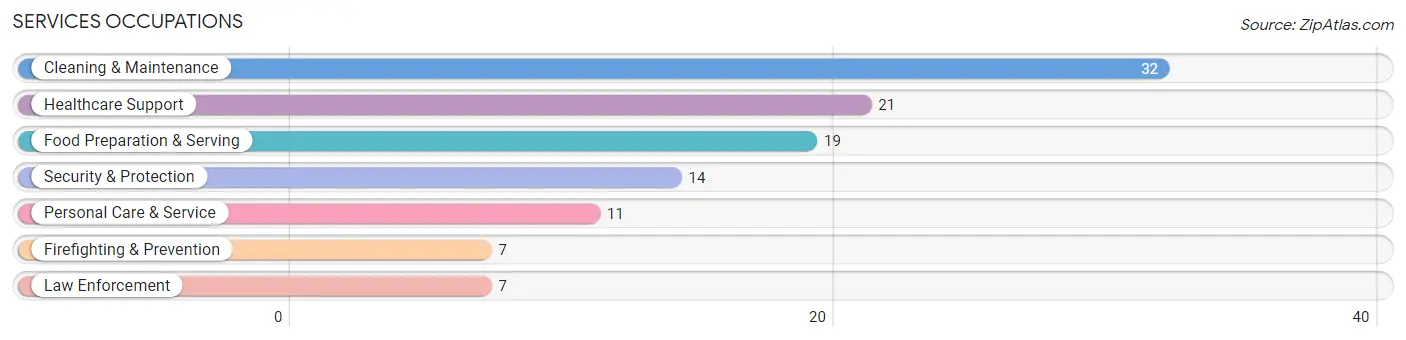
Services Occupations
The most common Services occupations in Elverson borough are Cleaning & Maintenance (32 | 5.9%), Healthcare Support (21 | 3.9%), Food Preparation & Serving (19 | 3.5%), Security & Protection (14 | 2.6%), and Personal Care & Service (11 | 2.0%).
Services Occupations by Sex
Within the Services occupations in Elverson borough, the most male-oriented occupations are Law Enforcement (100.0%), Security & Protection (71.4%), and Healthcare Support (47.6%), while the most female-oriented occupations are Personal Care & Service (100.0%), Cleaning & Maintenance (81.2%), and Firefighting & Prevention (57.1%).
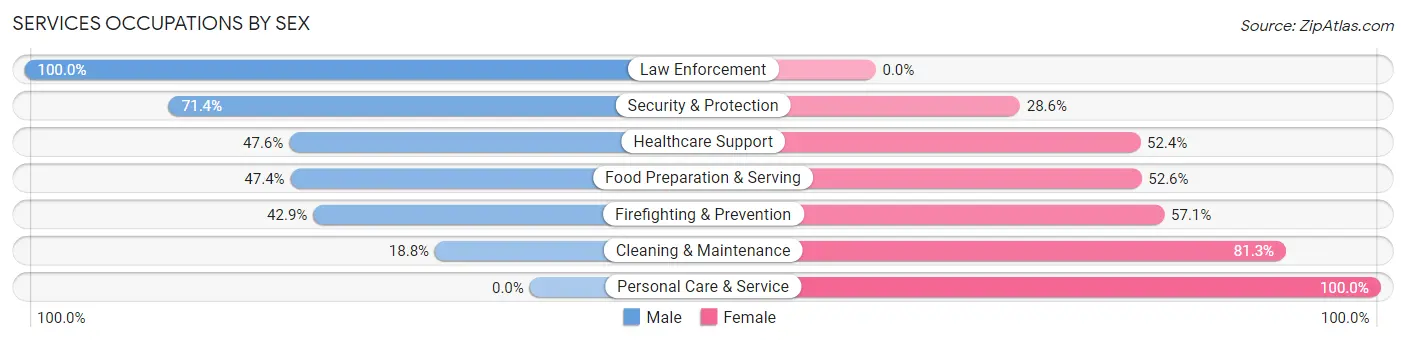
| Occupation | Male | Female |
| Healthcare Support | 10 (47.6%) | 11 (52.4%) |
| Security & Protection | 10 (71.4%) | 4 (28.6%) |
| Firefighting & Prevention | 3 (42.9%) | 4 (57.1%) |
| Law Enforcement | 7 (100.0%) | 0 (0.0%) |
| Food Preparation & Serving | 9 (47.4%) | 10 (52.6%) |
| Cleaning & Maintenance | 6 (18.8%) | 26 (81.2%) |
| Personal Care & Service | 0 (0.0%) | 11 (100.0%) |
| Total (Category) | 35 (36.1%) | 62 (63.9%) |
| Total (Overall) | 285 (52.6%) | 257 (47.4%) |
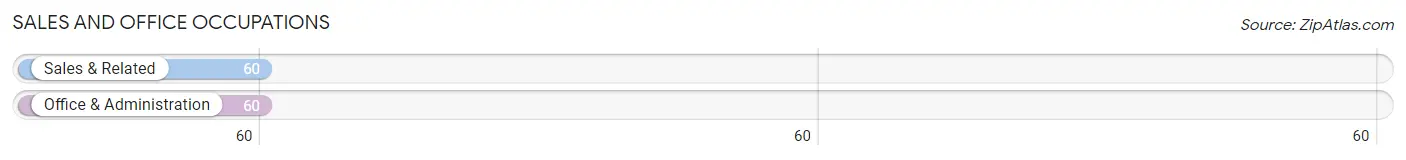
Sales and Office Occupations
The most common Sales and Office occupations in Elverson borough are Sales & Related (60 | 11.1%), and Office & Administration (60 | 11.1%).
Sales and Office Occupations by Sex
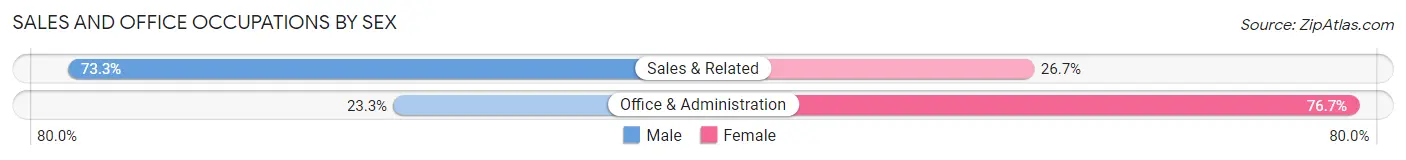
| Occupation | Male | Female |
| Sales & Related | 44 (73.3%) | 16 (26.7%) |
| Office & Administration | 14 (23.3%) | 46 (76.7%) |
| Total (Category) | 58 (48.3%) | 62 (51.7%) |
| Total (Overall) | 285 (52.6%) | 257 (47.4%) |
Natural Resources, Construction and Maintenance Occupations
The most common Natural Resources, Construction and Maintenance occupations in Elverson borough are Construction & Extraction (33 | 6.1%), and Installation, Maintenance & Repair (9 | 1.7%).
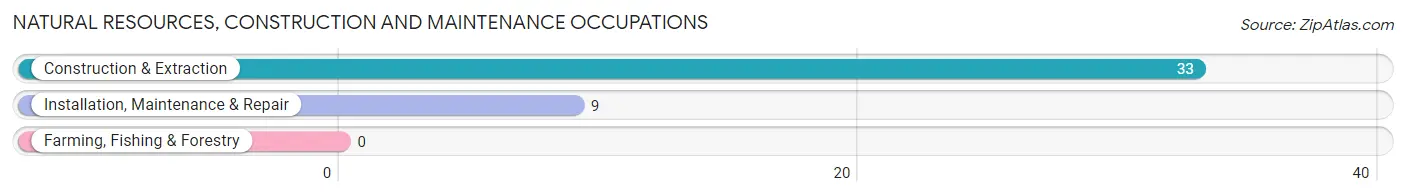
Natural Resources, Construction and Maintenance Occupations by Sex
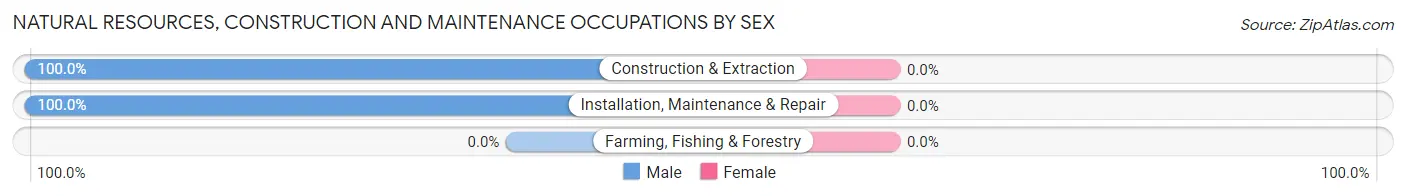
| Occupation | Male | Female |
| Farming, Fishing & Forestry | 0 (0.0%) | 0 (0.0%) |
| Construction & Extraction | 33 (100.0%) | 0 (0.0%) |
| Installation, Maintenance & Repair | 9 (100.0%) | 0 (0.0%) |
| Total (Category) | 42 (100.0%) | 0 (0.0%) |
| Total (Overall) | 285 (52.6%) | 257 (47.4%) |
Production, Transportation and Moving Occupations
The most common Production, Transportation and Moving occupations in Elverson borough are Production (36 | 6.6%), Transportation (32 | 5.9%), and Material Moving (5 | 0.9%).
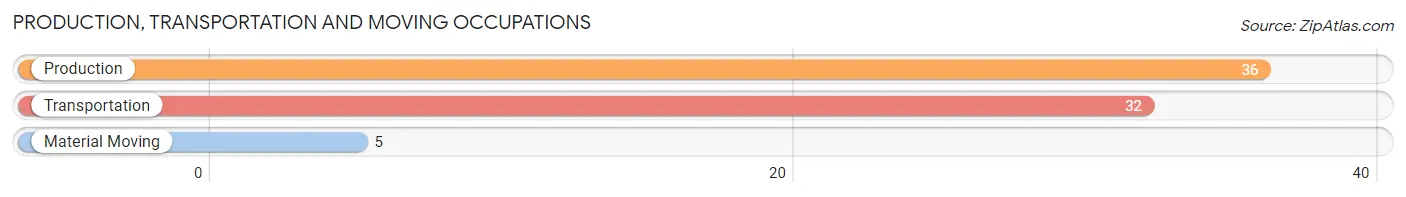
Production, Transportation and Moving Occupations by Sex
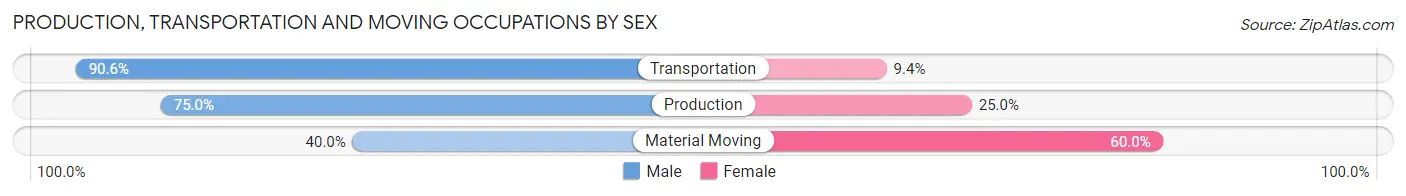
| Occupation | Male | Female |
| Production | 27 (75.0%) | 9 (25.0%) |
| Transportation | 29 (90.6%) | 3 (9.4%) |
| Material Moving | 2 (40.0%) | 3 (60.0%) |
| Total (Category) | 58 (79.4%) | 15 (20.5%) |
| Total (Overall) | 285 (52.6%) | 257 (47.4%) |
Employment Industries by Sex in Elverson borough
Employment Industries in Elverson borough
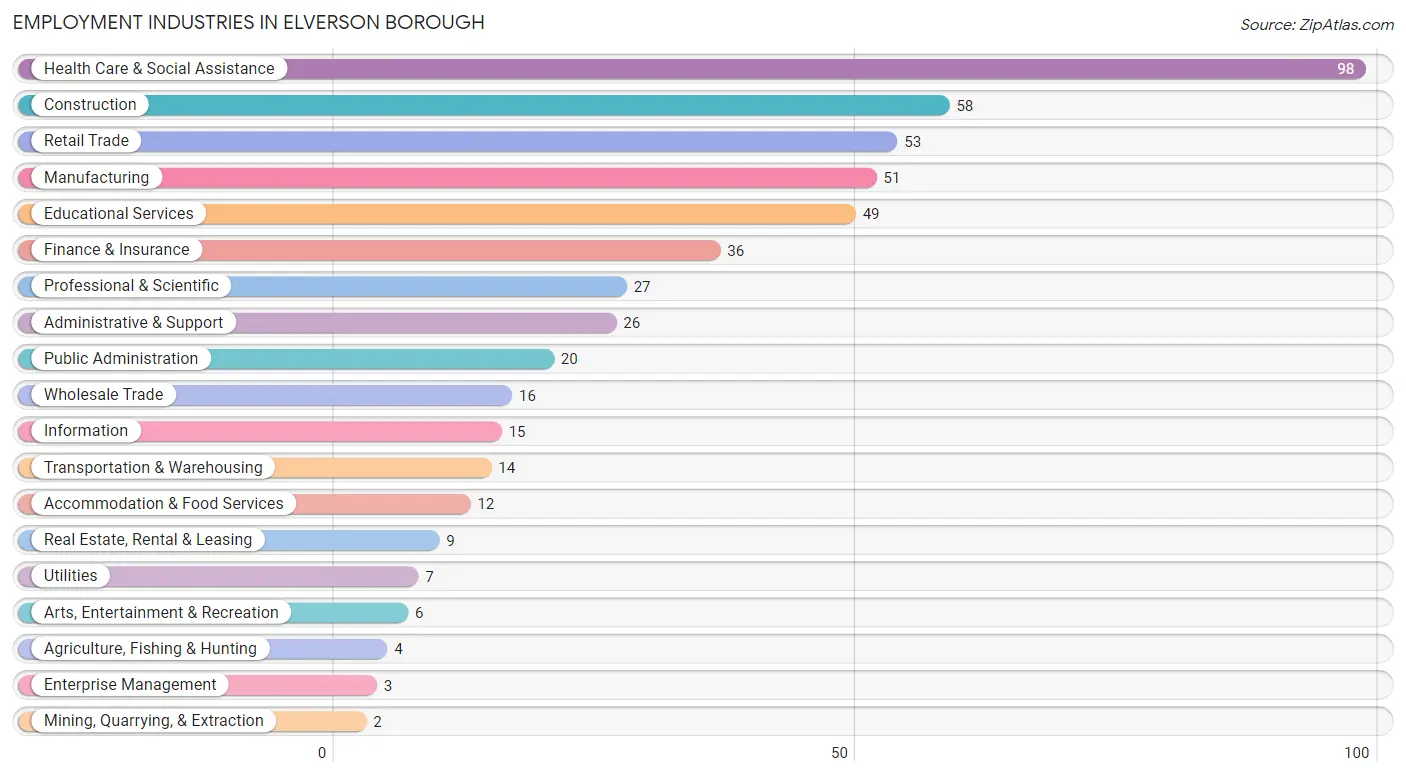
The major employment industries in Elverson borough include Health Care & Social Assistance (98 | 18.1%), Construction (58 | 10.7%), Retail Trade (53 | 9.8%), Manufacturing (51 | 9.4%), and Educational Services (49 | 9.0%).
Employment Industries by Sex in Elverson borough
The Elverson borough industries that see more men than women are Agriculture, Fishing & Hunting (100.0%), Mining, Quarrying, & Extraction (100.0%), and Transportation & Warehousing (100.0%), whereas the industries that tend to have a higher number of women are Arts, Entertainment & Recreation (100.0%), Educational Services (85.7%), and Accommodation & Food Services (83.3%).
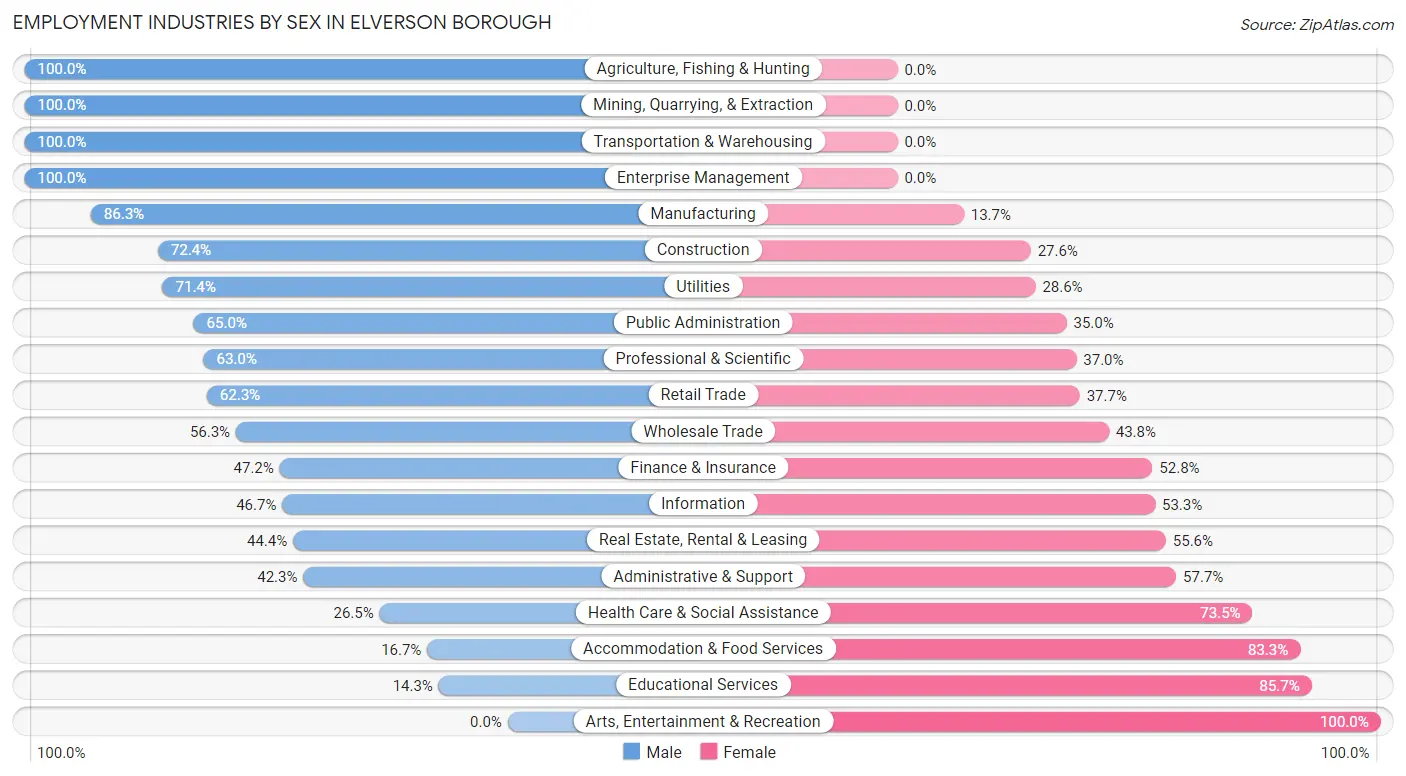
| Industry | Male | Female |
| Agriculture, Fishing & Hunting | 4 (100.0%) | 0 (0.0%) |
| Mining, Quarrying, & Extraction | 2 (100.0%) | 0 (0.0%) |
| Construction | 42 (72.4%) | 16 (27.6%) |
| Manufacturing | 44 (86.3%) | 7 (13.7%) |
| Wholesale Trade | 9 (56.2%) | 7 (43.8%) |
| Retail Trade | 33 (62.3%) | 20 (37.7%) |
| Transportation & Warehousing | 14 (100.0%) | 0 (0.0%) |
| Utilities | 5 (71.4%) | 2 (28.6%) |
| Information | 7 (46.7%) | 8 (53.3%) |
| Finance & Insurance | 17 (47.2%) | 19 (52.8%) |
| Real Estate, Rental & Leasing | 4 (44.4%) | 5 (55.6%) |
| Professional & Scientific | 17 (63.0%) | 10 (37.0%) |
| Enterprise Management | 3 (100.0%) | 0 (0.0%) |
| Administrative & Support | 11 (42.3%) | 15 (57.7%) |
| Educational Services | 7 (14.3%) | 42 (85.7%) |
| Health Care & Social Assistance | 26 (26.5%) | 72 (73.5%) |
| Arts, Entertainment & Recreation | 0 (0.0%) | 6 (100.0%) |
| Accommodation & Food Services | 2 (16.7%) | 10 (83.3%) |
| Public Administration | 13 (65.0%) | 7 (35.0%) |
| Total | 285 (52.6%) | 257 (47.4%) |
Education in Elverson borough
School Enrollment in Elverson borough
The most common levels of schooling among the 171 students in Elverson borough are college / undergraduate (44 | 25.7%), high school (37 | 21.6%), and elementary school (34 | 19.9%).
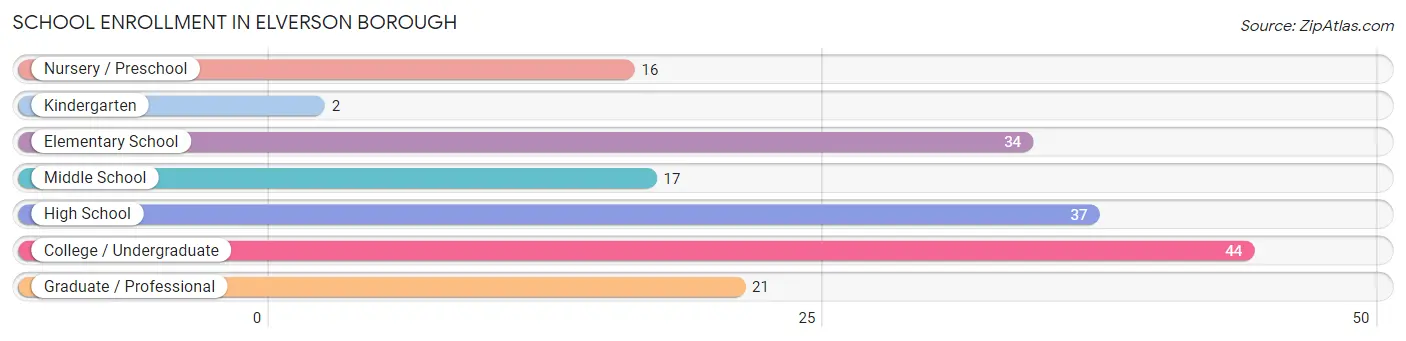
| School Level | # Students | % Students |
| Nursery / Preschool | 16 | 9.4% |
| Kindergarten | 2 | 1.2% |
| Elementary School | 34 | 19.9% |
| Middle School | 17 | 9.9% |
| High School | 37 | 21.6% |
| College / Undergraduate | 44 | 25.7% |
| Graduate / Professional | 21 | 12.3% |
| Total | 171 | 100.0% |
School Enrollment by Age by Funding Source in Elverson borough
Out of a total of 171 students who are enrolled in schools in Elverson borough, 26 (15.2%) attend a private institution, while the remaining 145 (84.8%) are enrolled in public schools. The age group of 25 to 34 year olds has the highest likelihood of being enrolled in private schools, with 9 (64.3% in the age bracket) enrolled. Conversely, the age group of 15 to 17 year olds has the lowest likelihood of being enrolled in a private school, with 30 (100.0% in the age bracket) attending a public institution.
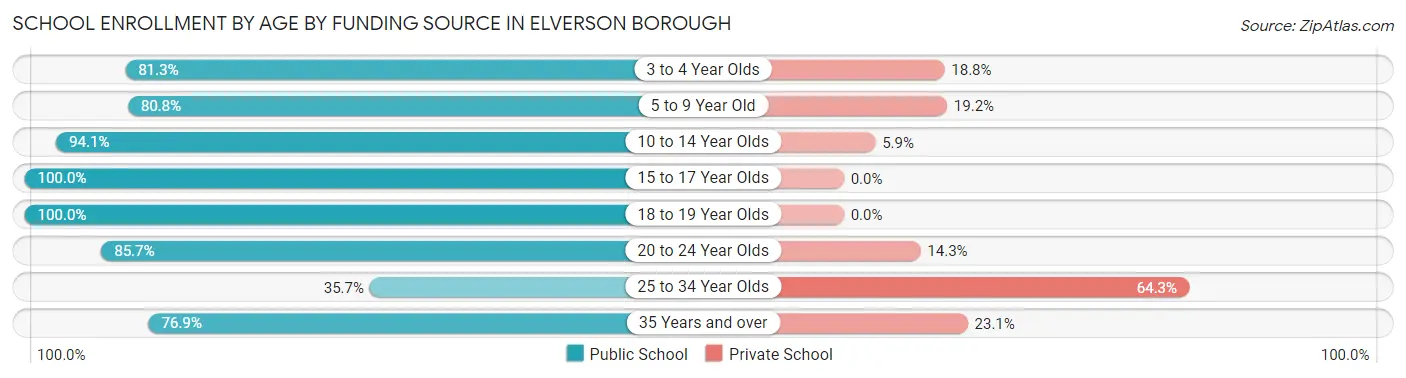
| Age Bracket | Public School | Private School |
| 3 to 4 Year Olds | 13 (81.2%) | 3 (18.8%) |
| 5 to 9 Year Old | 21 (80.8%) | 5 (19.2%) |
| 10 to 14 Year Olds | 32 (94.1%) | 2 (5.9%) |
| 15 to 17 Year Olds | 30 (100.0%) | 0 (0.0%) |
| 18 to 19 Year Olds | 10 (100.0%) | 0 (0.0%) |
| 20 to 24 Year Olds | 24 (85.7%) | 4 (14.3%) |
| 25 to 34 Year Olds | 5 (35.7%) | 9 (64.3%) |
| 35 Years and over | 10 (76.9%) | 3 (23.1%) |
| Total | 145 (84.8%) | 26 (15.2%) |
Educational Attainment by Field of Study in Elverson borough
Education (86 | 21.1%), business (56 | 13.8%), science & technology (54 | 13.3%), bio, nature & agricultural (40 | 9.8%), and social sciences (36 | 8.8%) are the most common fields of study among 407 individuals in Elverson borough who have obtained a bachelor's degree or higher.
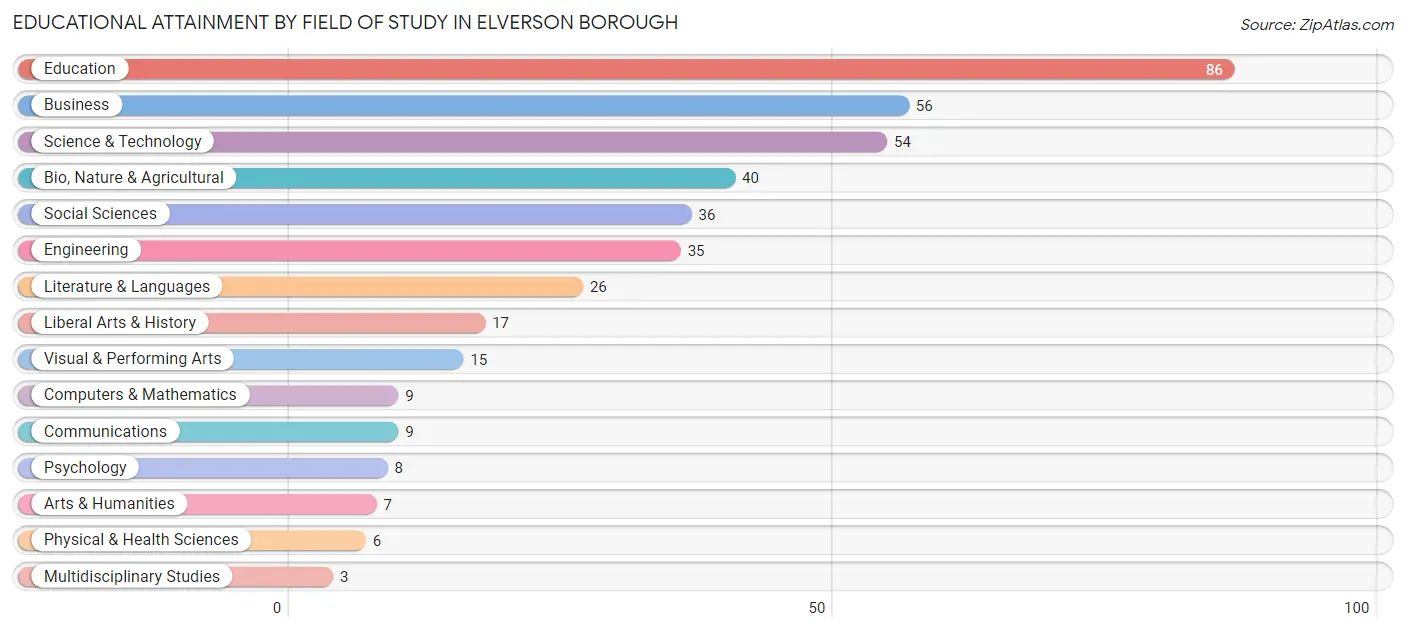
| Field of Study | # Graduates | % Graduates |
| Computers & Mathematics | 9 | 2.2% |
| Bio, Nature & Agricultural | 40 | 9.8% |
| Physical & Health Sciences | 6 | 1.5% |
| Psychology | 8 | 2.0% |
| Social Sciences | 36 | 8.8% |
| Engineering | 35 | 8.6% |
| Multidisciplinary Studies | 3 | 0.7% |
| Science & Technology | 54 | 13.3% |
| Business | 56 | 13.8% |
| Education | 86 | 21.1% |
| Literature & Languages | 26 | 6.4% |
| Liberal Arts & History | 17 | 4.2% |
| Visual & Performing Arts | 15 | 3.7% |
| Communications | 9 | 2.2% |
| Arts & Humanities | 7 | 1.7% |
| Total | 407 | 100.0% |
Transportation & Commute in Elverson borough
Vehicle Availability by Sex in Elverson borough
The most prevalent vehicle ownership categories in Elverson borough are males with 2 vehicles (127, accounting for 44.6%) and females with 2 vehicles (133, making up 49.4%).
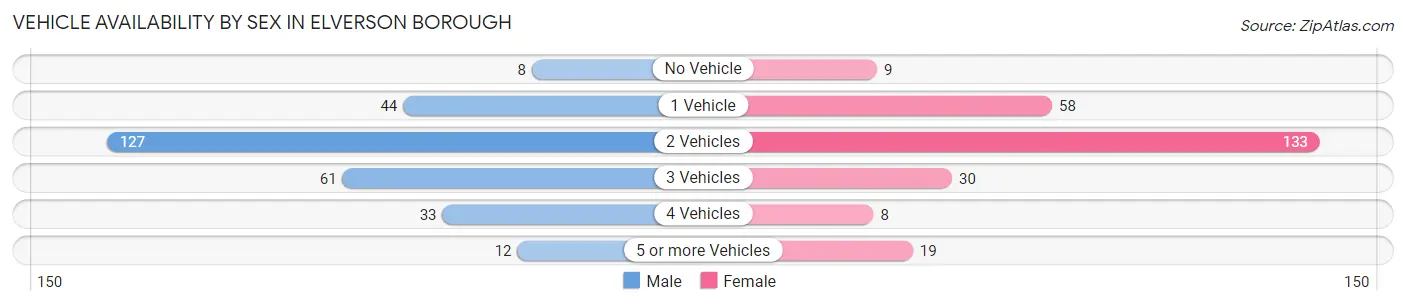
| Vehicles Available | Male | Female |
| No Vehicle | 8 (2.8%) | 9 (3.5%) |
| 1 Vehicle | 44 (15.4%) | 58 (22.6%) |
| 2 Vehicles | 127 (44.6%) | 133 (51.7%) |
| 3 Vehicles | 61 (21.4%) | 30 (11.7%) |
| 4 Vehicles | 33 (11.6%) | 8 (3.1%) |
| 5 or more Vehicles | 12 (4.2%) | 19 (7.4%) |
| Total | 285 (100.0%) | 257 (100.0%) |
Commute Time in Elverson borough
The most frequently occuring commute durations in Elverson borough are 45 to 59 minutes (81 commuters, 16.6%), 25 to 29 minutes (68 commuters, 13.9%), and 30 to 34 minutes (65 commuters, 13.3%).
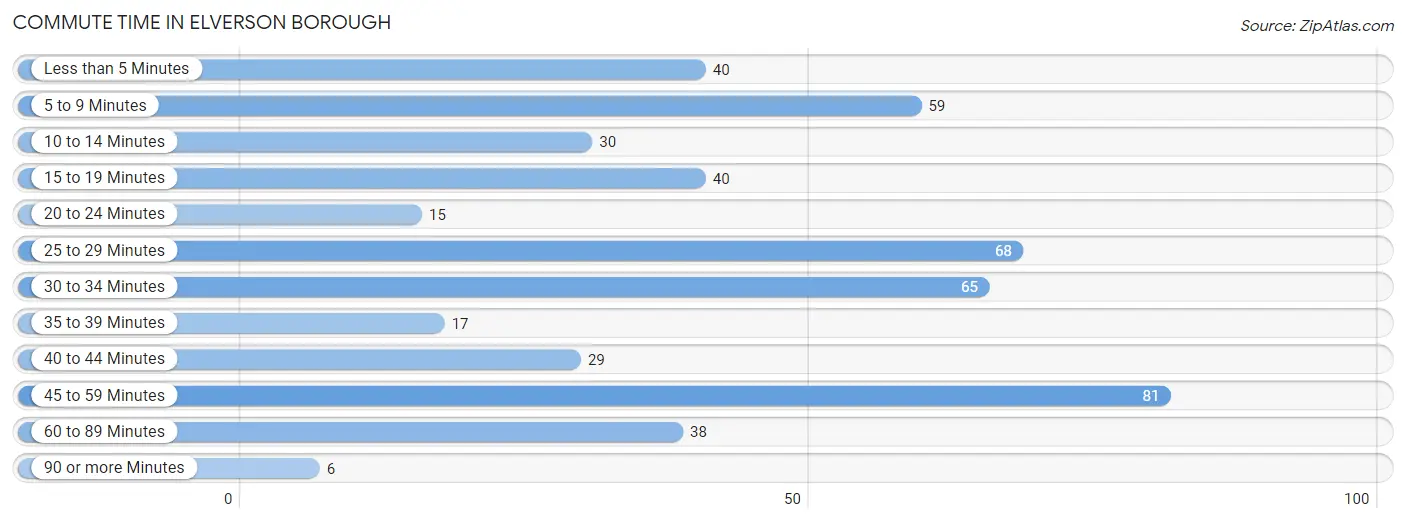
| Commute Time | # Commuters | % Commuters |
| Less than 5 Minutes | 40 | 8.2% |
| 5 to 9 Minutes | 59 | 12.1% |
| 10 to 14 Minutes | 30 | 6.1% |
| 15 to 19 Minutes | 40 | 8.2% |
| 20 to 24 Minutes | 15 | 3.1% |
| 25 to 29 Minutes | 68 | 13.9% |
| 30 to 34 Minutes | 65 | 13.3% |
| 35 to 39 Minutes | 17 | 3.5% |
| 40 to 44 Minutes | 29 | 5.9% |
| 45 to 59 Minutes | 81 | 16.6% |
| 60 to 89 Minutes | 38 | 7.8% |
| 90 or more Minutes | 6 | 1.2% |
Commute Time by Sex in Elverson borough
The most common commute times in Elverson borough are 45 to 59 minutes (53 commuters, 20.7%) for males and 25 to 29 minutes (63 commuters, 27.2%) for females.
| Commute Time | Male | Female |
| Less than 5 Minutes | 33 (12.9%) | 7 (3.0%) |
| 5 to 9 Minutes | 34 (13.3%) | 25 (10.8%) |
| 10 to 14 Minutes | 12 (4.7%) | 18 (7.8%) |
| 15 to 19 Minutes | 13 (5.1%) | 27 (11.6%) |
| 20 to 24 Minutes | 6 (2.3%) | 9 (3.9%) |
| 25 to 29 Minutes | 5 (1.9%) | 63 (27.2%) |
| 30 to 34 Minutes | 36 (14.1%) | 29 (12.5%) |
| 35 to 39 Minutes | 14 (5.5%) | 3 (1.3%) |
| 40 to 44 Minutes | 14 (5.5%) | 15 (6.5%) |
| 45 to 59 Minutes | 53 (20.7%) | 28 (12.1%) |
| 60 to 89 Minutes | 30 (11.7%) | 8 (3.5%) |
| 90 or more Minutes | 6 (2.3%) | 0 (0.0%) |
Time of Departure to Work by Sex in Elverson borough
The most frequent times of departure to work in Elverson borough are 6:00 AM to 6:29 AM (62, 24.2%) for males and 8:00 AM to 8:29 AM (54, 23.3%) for females.
| Time of Departure | Male | Female |
| 12:00 AM to 4:59 AM | 5 (1.9%) | 0 (0.0%) |
| 5:00 AM to 5:29 AM | 18 (7.0%) | 3 (1.3%) |
| 5:30 AM to 5:59 AM | 24 (9.4%) | 10 (4.3%) |
| 6:00 AM to 6:29 AM | 62 (24.2%) | 21 (9.0%) |
| 6:30 AM to 6:59 AM | 27 (10.5%) | 10 (4.3%) |
| 7:00 AM to 7:29 AM | 25 (9.8%) | 41 (17.7%) |
| 7:30 AM to 7:59 AM | 19 (7.4%) | 17 (7.3%) |
| 8:00 AM to 8:29 AM | 39 (15.2%) | 54 (23.3%) |
| 8:30 AM to 8:59 AM | 9 (3.5%) | 29 (12.5%) |
| 9:00 AM to 9:59 AM | 13 (5.1%) | 19 (8.2%) |
| 10:00 AM to 10:59 AM | 0 (0.0%) | 2 (0.9%) |
| 11:00 AM to 11:59 AM | 6 (2.3%) | 2 (0.9%) |
| 12:00 PM to 3:59 PM | 6 (2.3%) | 4 (1.7%) |
| 4:00 PM to 11:59 PM | 3 (1.2%) | 20 (8.6%) |
| Total | 256 (100.0%) | 232 (100.0%) |
Housing Occupancy in Elverson borough
Occupancy by Ownership in Elverson borough
Of the total 626 dwellings in Elverson borough, owner-occupied units account for 488 (78.0%), while renter-occupied units make up 138 (22.0%).
| Occupancy | # Housing Units | % Housing Units |
| Owner Occupied Housing Units | 488 | 78.0% |
| Renter-Occupied Housing Units | 138 | 22.0% |
| Total Occupied Housing Units | 626 | 100.0% |
Occupancy by Household Size in Elverson borough
| Household Size | # Housing Units | % Housing Units |
| 1-Person Household | 208 | 33.2% |
| 2-Person Household | 283 | 45.2% |
| 3-Person Household | 42 | 6.7% |
| 4+ Person Household | 93 | 14.9% |
| Total Housing Units | 626 | 100.0% |
Occupancy by Ownership by Household Size in Elverson borough
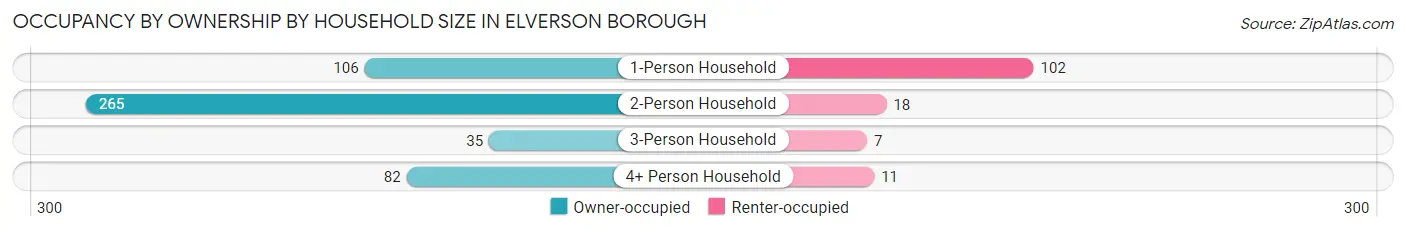
| Household Size | Owner-occupied | Renter-occupied |
| 1-Person Household | 106 (51.0%) | 102 (49.0%) |
| 2-Person Household | 265 (93.6%) | 18 (6.4%) |
| 3-Person Household | 35 (83.3%) | 7 (16.7%) |
| 4+ Person Household | 82 (88.2%) | 11 (11.8%) |
| Total Housing Units | 488 (78.0%) | 138 (22.0%) |
Occupancy by Educational Attainment in Elverson borough
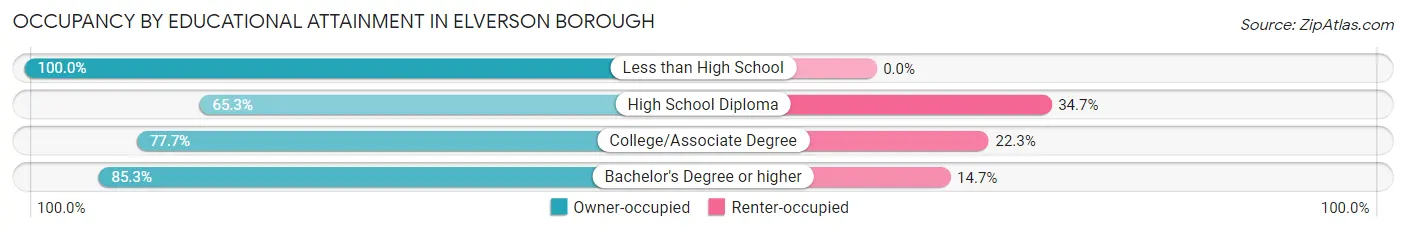
| Household Size | Owner-occupied | Renter-occupied |
| Less than High School | 13 (100.0%) | 0 (0.0%) |
| High School Diploma | 111 (65.3%) | 59 (34.7%) |
| College/Associate Degree | 143 (77.7%) | 41 (22.3%) |
| Bachelor's Degree or higher | 221 (85.3%) | 38 (14.7%) |
Occupancy by Age of Householder in Elverson borough
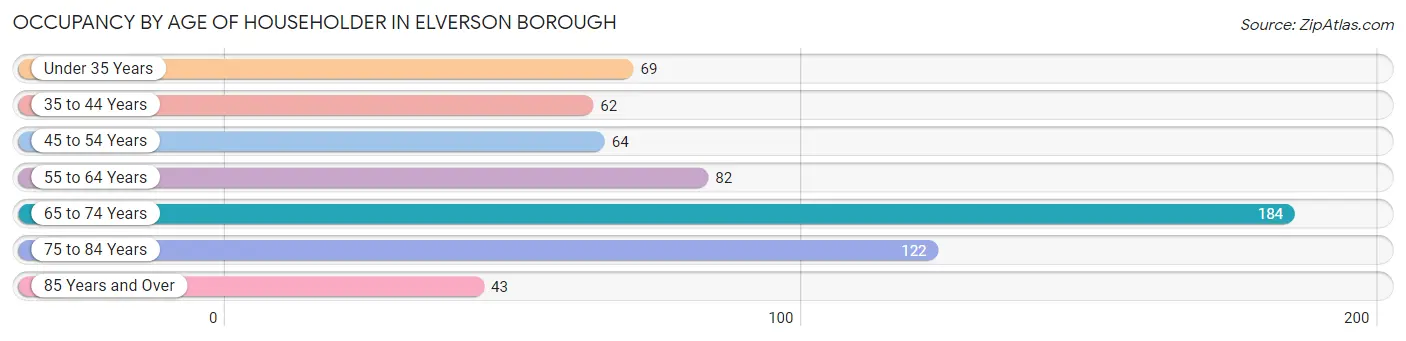
| Age Bracket | # Households | % Households |
| Under 35 Years | 69 | 11.0% |
| 35 to 44 Years | 62 | 9.9% |
| 45 to 54 Years | 64 | 10.2% |
| 55 to 64 Years | 82 | 13.1% |
| 65 to 74 Years | 184 | 29.4% |
| 75 to 84 Years | 122 | 19.5% |
| 85 Years and Over | 43 | 6.9% |
| Total | 626 | 100.0% |
Housing Finances in Elverson borough
Median Income by Occupancy in Elverson borough
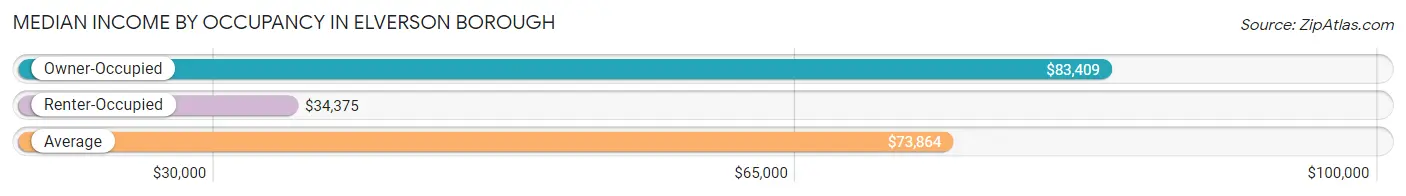
| Occupancy Type | # Households | Median Income |
| Owner-Occupied | 488 (78.0%) | $83,409 |
| Renter-Occupied | 138 (22.0%) | $34,375 |
| Average | 626 (100.0%) | $73,864 |
Occupancy by Householder Income Bracket in Elverson borough
| Income Bracket | Owner-occupied | Renter-occupied |
| Less than $5,000 | 21 (4.3%) | 9 (6.5%) |
| $5,000 to $9,999 | 6 (1.2%) | 5 (3.6%) |
| $10,000 to $14,999 | 3 (0.6%) | 6 (4.3%) |
| $15,000 to $19,999 | 0 (0.0%) | 42 (30.4%) |
| $20,000 to $24,999 | 6 (1.2%) | 0 (0.0%) |
| $25,000 to $34,999 | 21 (4.3%) | 8 (5.8%) |
| $35,000 to $49,999 | 45 (9.2%) | 35 (25.4%) |
| $50,000 to $74,999 | 119 (24.4%) | 2 (1.5%) |
| $75,000 to $99,999 | 82 (16.8%) | 10 (7.2%) |
| $100,000 to $149,999 | 80 (16.4%) | 18 (13.0%) |
| $150,000 or more | 105 (21.5%) | 3 (2.2%) |
| Total | 488 (100.0%) | 138 (100.0%) |
Monthly Housing Cost Tiers in Elverson borough
| Monthly Cost | Owner-occupied | Renter-occupied |
| Less than $300 | 0 (0.0%) | 0 (0.0%) |
| $300 to $499 | 7 (1.4%) | 13 (9.4%) |
| $500 to $799 | 85 (17.4%) | 47 (34.1%) |
| $800 to $999 | 73 (15.0%) | 28 (20.3%) |
| $1,000 to $1,499 | 95 (19.5%) | 31 (22.5%) |
| $1,500 to $1,999 | 128 (26.2%) | 10 (7.2%) |
| $2,000 to $2,499 | 74 (15.2%) | 2 (1.5%) |
| $2,500 to $2,999 | 8 (1.6%) | 0 (0.0%) |
| $3,000 or more | 18 (3.7%) | 3 (2.2%) |
| Total | 488 (100.0%) | 138 (100.0%) |
Physical Housing Characteristics in Elverson borough
Housing Structures in Elverson borough
| Structure Type | # Housing Units | % Housing Units |
| Single Unit, Detached | 238 | 38.0% |
| Single Unit, Attached | 271 | 43.3% |
| 2 Unit Apartments | 8 | 1.3% |
| 3 or 4 Unit Apartments | 27 | 4.3% |
| 5 to 9 Unit Apartments | 8 | 1.3% |
| 10 or more Apartments | 74 | 11.8% |
| Mobile Home / Other | 0 | 0.0% |
| Total | 626 | 100.0% |
Housing Structures by Occupancy in Elverson borough
| Structure Type | Owner-occupied | Renter-occupied |
| Single Unit, Detached | 219 (92.0%) | 19 (8.0%) |
| Single Unit, Attached | 255 (94.1%) | 16 (5.9%) |
| 2 Unit Apartments | 0 (0.0%) | 8 (100.0%) |
| 3 or 4 Unit Apartments | 11 (40.7%) | 16 (59.3%) |
| 5 to 9 Unit Apartments | 0 (0.0%) | 8 (100.0%) |
| 10 or more Apartments | 3 (4.1%) | 71 (96.0%) |
| Mobile Home / Other | 0 (0.0%) | 0 (0.0%) |
| Total | 488 (78.0%) | 138 (22.0%) |
Housing Structures by Number of Rooms in Elverson borough
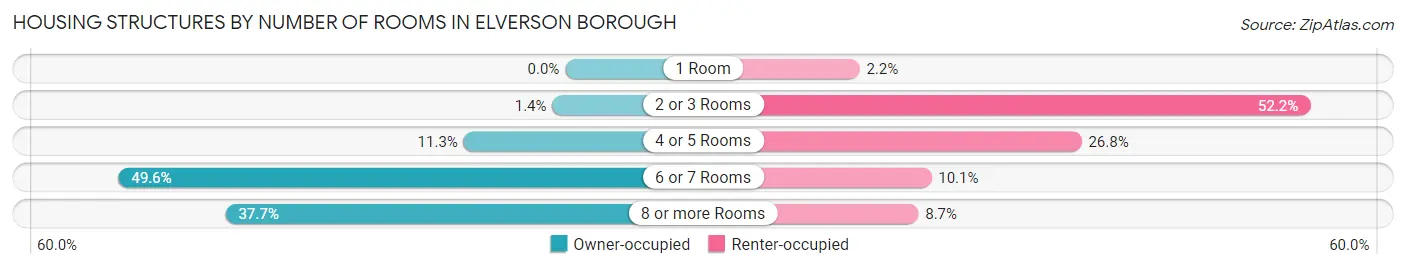
| Number of Rooms | Owner-occupied | Renter-occupied |
| 1 Room | 0 (0.0%) | 3 (2.2%) |
| 2 or 3 Rooms | 7 (1.4%) | 72 (52.2%) |
| 4 or 5 Rooms | 55 (11.3%) | 37 (26.8%) |
| 6 or 7 Rooms | 242 (49.6%) | 14 (10.1%) |
| 8 or more Rooms | 184 (37.7%) | 12 (8.7%) |
| Total | 488 (100.0%) | 138 (100.0%) |
Housing Structure by Heating Type in Elverson borough
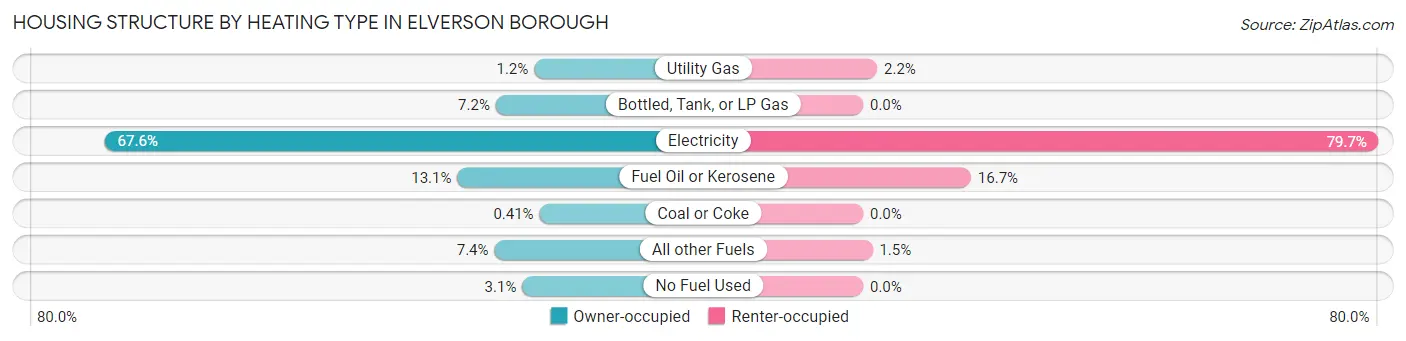
| Heating Type | Owner-occupied | Renter-occupied |
| Utility Gas | 6 (1.2%) | 3 (2.2%) |
| Bottled, Tank, or LP Gas | 35 (7.2%) | 0 (0.0%) |
| Electricity | 330 (67.6%) | 110 (79.7%) |
| Fuel Oil or Kerosene | 64 (13.1%) | 23 (16.7%) |
| Coal or Coke | 2 (0.4%) | 0 (0.0%) |
| All other Fuels | 36 (7.4%) | 2 (1.5%) |
| No Fuel Used | 15 (3.1%) | 0 (0.0%) |
| Total | 488 (100.0%) | 138 (100.0%) |
Household Vehicle Usage in Elverson borough
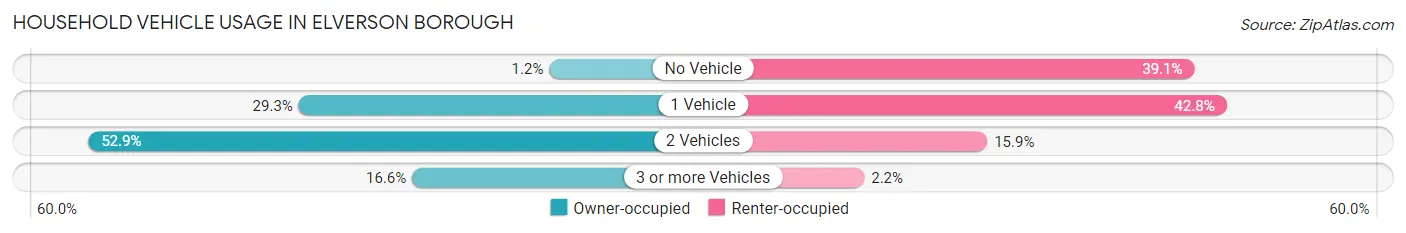
| Vehicles per Household | Owner-occupied | Renter-occupied |
| No Vehicle | 6 (1.2%) | 54 (39.1%) |
| 1 Vehicle | 143 (29.3%) | 59 (42.7%) |
| 2 Vehicles | 258 (52.9%) | 22 (15.9%) |
| 3 or more Vehicles | 81 (16.6%) | 3 (2.2%) |
| Total | 488 (100.0%) | 138 (100.0%) |
Real Estate & Mortgages in Elverson borough
Real Estate and Mortgage Overview in Elverson borough
| Characteristic | Without Mortgage | With Mortgage |
| Housing Units | 216 | 272 |
| Median Property Value | $348,100 | $337,500 |
| Median Household Income | $75,000 | $70 |
| Monthly Housing Costs | $849 | $18 |
| Real Estate Taxes | $5,457 | $2 |
Property Value by Mortgage Status in Elverson borough
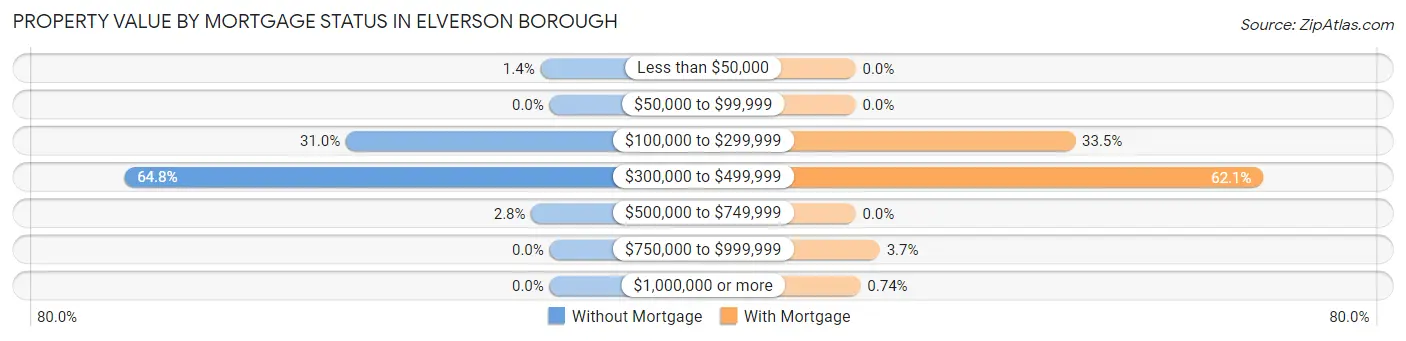
| Property Value | Without Mortgage | With Mortgage |
| Less than $50,000 | 3 (1.4%) | 0 (0.0%) |
| $50,000 to $99,999 | 0 (0.0%) | 0 (0.0%) |
| $100,000 to $299,999 | 67 (31.0%) | 91 (33.5%) |
| $300,000 to $499,999 | 140 (64.8%) | 169 (62.1%) |
| $500,000 to $749,999 | 6 (2.8%) | 0 (0.0%) |
| $750,000 to $999,999 | 0 (0.0%) | 10 (3.7%) |
| $1,000,000 or more | 0 (0.0%) | 2 (0.7%) |
| Total | 216 (100.0%) | 272 (100.0%) |
Household Income by Mortgage Status in Elverson borough
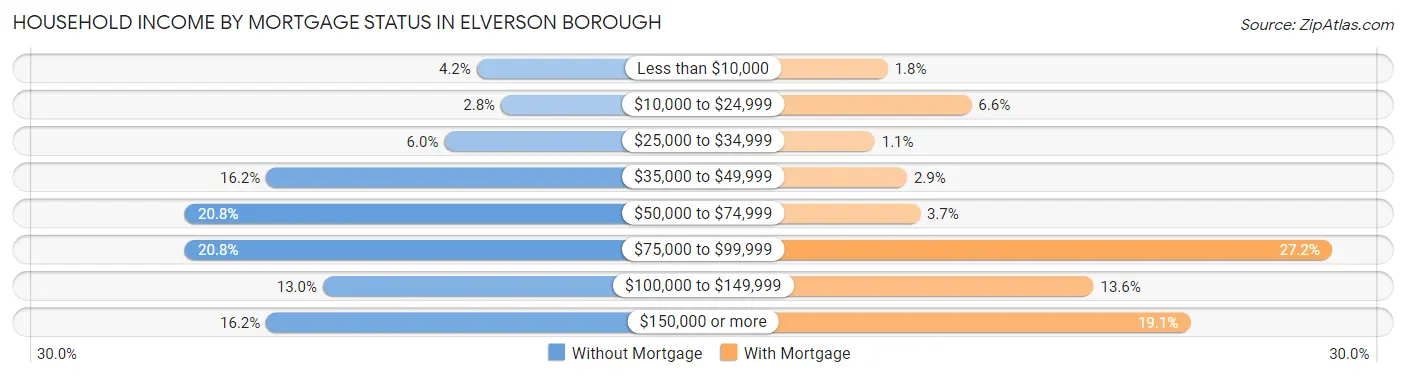
| Household Income | Without Mortgage | With Mortgage |
| Less than $10,000 | 9 (4.2%) | 5 (1.8%) |
| $10,000 to $24,999 | 6 (2.8%) | 18 (6.6%) |
| $25,000 to $34,999 | 13 (6.0%) | 3 (1.1%) |
| $35,000 to $49,999 | 35 (16.2%) | 8 (2.9%) |
| $50,000 to $74,999 | 45 (20.8%) | 10 (3.7%) |
| $75,000 to $99,999 | 45 (20.8%) | 74 (27.2%) |
| $100,000 to $149,999 | 28 (13.0%) | 37 (13.6%) |
| $150,000 or more | 35 (16.2%) | 52 (19.1%) |
| Total | 216 (100.0%) | 272 (100.0%) |
Property Value to Household Income Ratio in Elverson borough
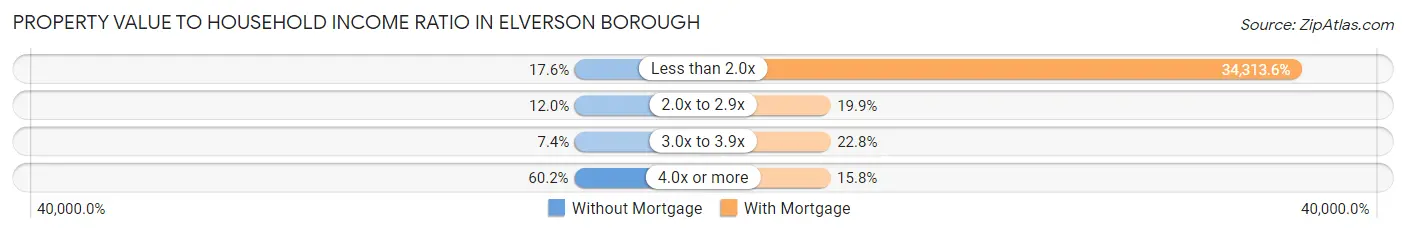
| Value-to-Income Ratio | Without Mortgage | With Mortgage |
| Less than 2.0x | 38 (17.6%) | 93,333 (34,313.6%) |
| 2.0x to 2.9x | 26 (12.0%) | 54 (19.9%) |
| 3.0x to 3.9x | 16 (7.4%) | 62 (22.8%) |
| 4.0x or more | 130 (60.2%) | 43 (15.8%) |
| Total | 216 (100.0%) | 272 (100.0%) |
Real Estate Taxes by Mortgage Status in Elverson borough
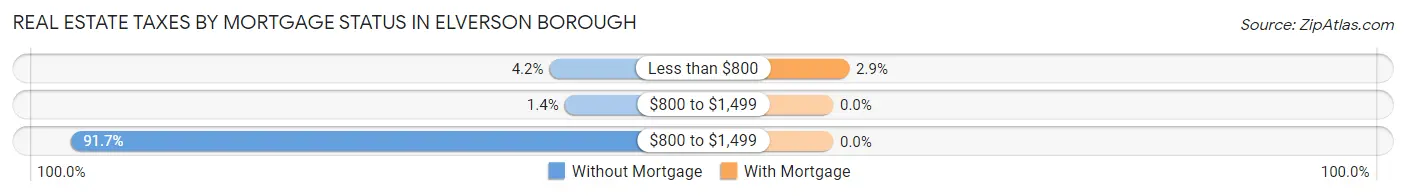
| Property Taxes | Without Mortgage | With Mortgage |
| Less than $800 | 9 (4.2%) | 8 (2.9%) |
| $800 to $1,499 | 3 (1.4%) | 0 (0.0%) |
| $800 to $1,499 | 198 (91.7%) | 0 (0.0%) |
| Total | 216 (100.0%) | 272 (100.0%) |
Health & Disability in Elverson borough
Health Insurance Coverage by Age in Elverson borough
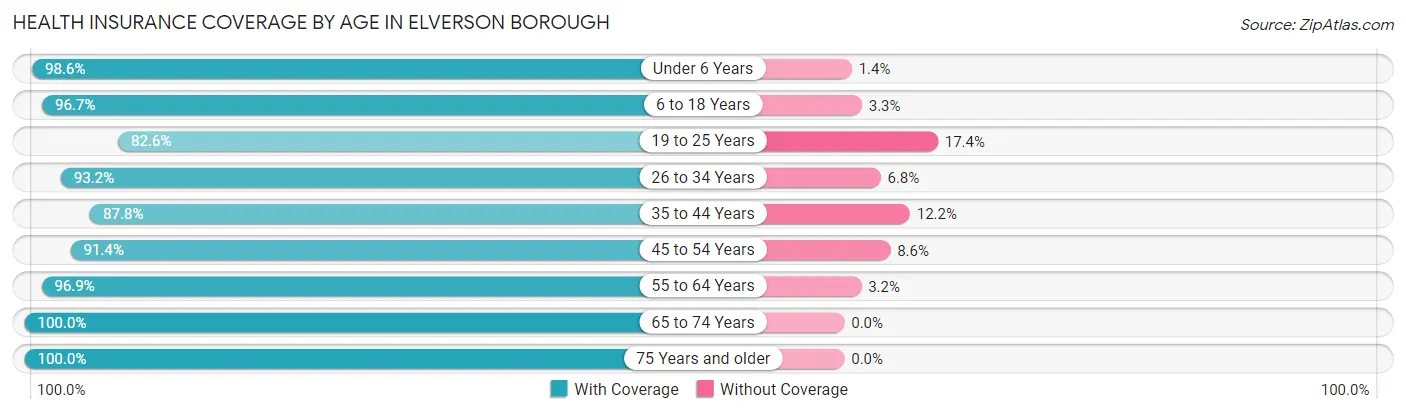
| Age Bracket | With Coverage | Without Coverage |
| Under 6 Years | 142 (98.6%) | 2 (1.4%) |
| 6 to 18 Years | 89 (96.7%) | 3 (3.3%) |
| 19 to 25 Years | 71 (82.6%) | 15 (17.4%) |
| 26 to 34 Years | 138 (93.2%) | 10 (6.8%) |
| 35 to 44 Years | 79 (87.8%) | 11 (12.2%) |
| 45 to 54 Years | 96 (91.4%) | 9 (8.6%) |
| 55 to 64 Years | 123 (96.9%) | 4 (3.2%) |
| 65 to 74 Years | 277 (100.0%) | 0 (0.0%) |
| 75 Years and older | 296 (100.0%) | 0 (0.0%) |
| Total | 1,311 (96.0%) | 54 (4.0%) |
Health Insurance Coverage by Citizenship Status in Elverson borough
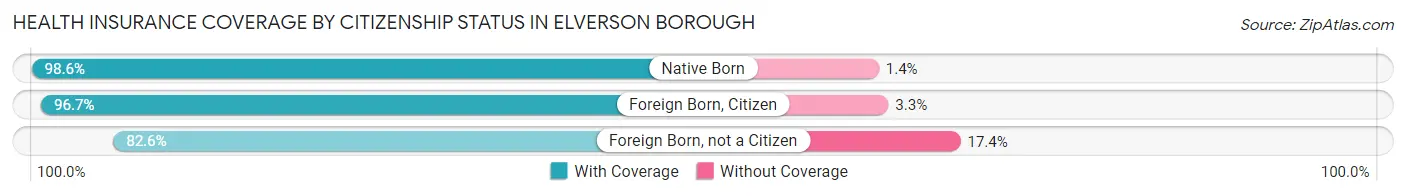
| Citizenship Status | With Coverage | Without Coverage |
| Native Born | 142 (98.6%) | 2 (1.4%) |
| Foreign Born, Citizen | 89 (96.7%) | 3 (3.3%) |
| Foreign Born, not a Citizen | 71 (82.6%) | 15 (17.4%) |
Health Insurance Coverage by Household Income in Elverson borough
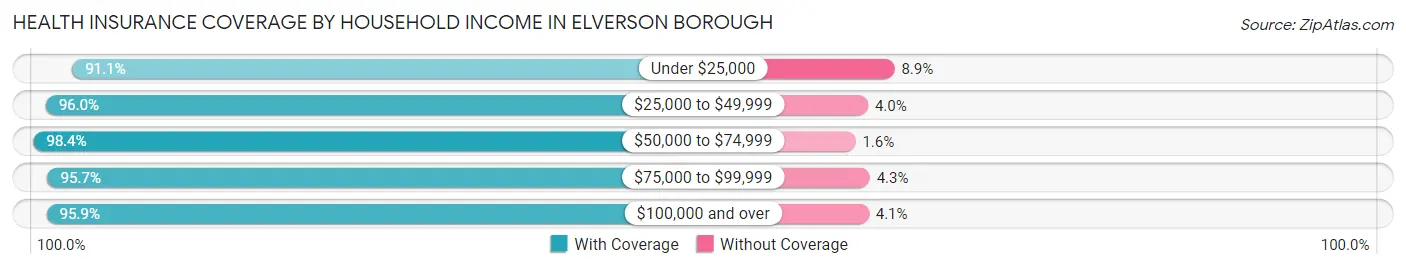
| Household Income | With Coverage | Without Coverage |
| Under $25,000 | 102 (91.1%) | 10 (8.9%) |
| $25,000 to $49,999 | 194 (96.0%) | 8 (4.0%) |
| $50,000 to $74,999 | 302 (98.4%) | 5 (1.6%) |
| $75,000 to $99,999 | 178 (95.7%) | 8 (4.3%) |
| $100,000 and over | 535 (95.9%) | 23 (4.1%) |
Public vs Private Health Insurance Coverage by Age in Elverson borough
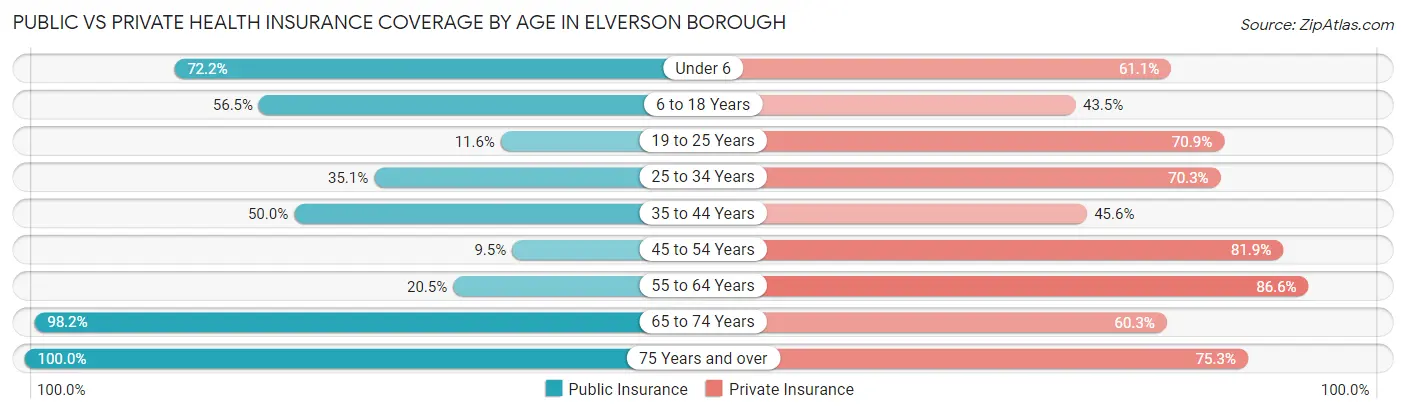
| Age Bracket | Public Insurance | Private Insurance |
| Under 6 | 104 (72.2%) | 88 (61.1%) |
| 6 to 18 Years | 52 (56.5%) | 40 (43.5%) |
| 19 to 25 Years | 10 (11.6%) | 61 (70.9%) |
| 25 to 34 Years | 52 (35.1%) | 104 (70.3%) |
| 35 to 44 Years | 45 (50.0%) | 41 (45.6%) |
| 45 to 54 Years | 10 (9.5%) | 86 (81.9%) |
| 55 to 64 Years | 26 (20.5%) | 110 (86.6%) |
| 65 to 74 Years | 272 (98.2%) | 167 (60.3%) |
| 75 Years and over | 296 (100.0%) | 223 (75.3%) |
| Total | 867 (63.5%) | 920 (67.4%) |
Disability Status by Sex by Age in Elverson borough
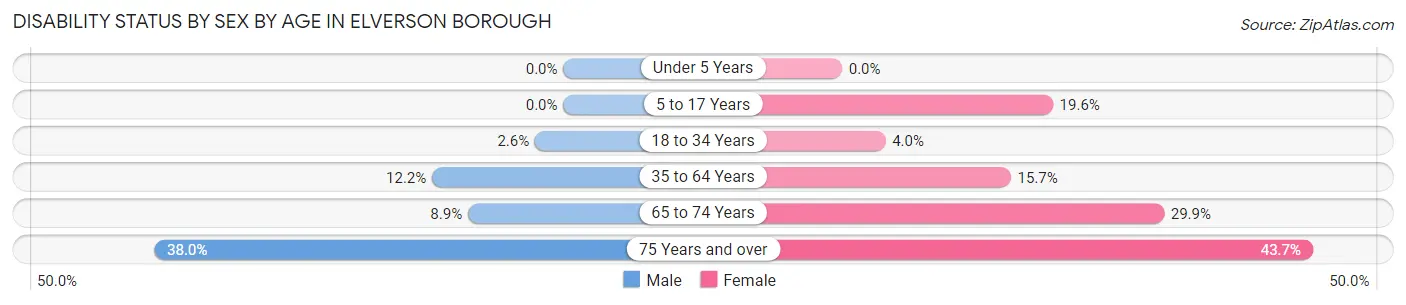
| Age Bracket | Male | Female |
| Under 5 Years | 0 (0.0%) | 0 (0.0%) |
| 5 to 17 Years | 0 (0.0%) | 9 (19.6%) |
| 18 to 34 Years | 3 (2.6%) | 5 (4.0%) |
| 35 to 64 Years | 19 (12.2%) | 26 (15.7%) |
| 65 to 74 Years | 10 (8.8%) | 49 (29.9%) |
| 75 Years and over | 49 (38.0%) | 73 (43.7%) |
Disability Class by Sex by Age in Elverson borough
Disability Class: Hearing Difficulty
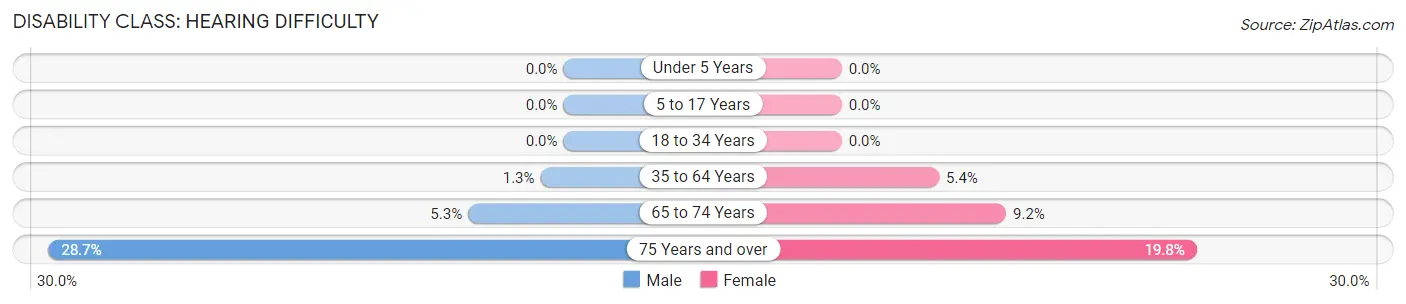
| Age Bracket | Male | Female |
| Under 5 Years | 0 (0.0%) | 0 (0.0%) |
| 5 to 17 Years | 0 (0.0%) | 0 (0.0%) |
| 18 to 34 Years | 0 (0.0%) | 0 (0.0%) |
| 35 to 64 Years | 2 (1.3%) | 9 (5.4%) |
| 65 to 74 Years | 6 (5.3%) | 15 (9.1%) |
| 75 Years and over | 37 (28.7%) | 33 (19.8%) |
Disability Class: Vision Difficulty
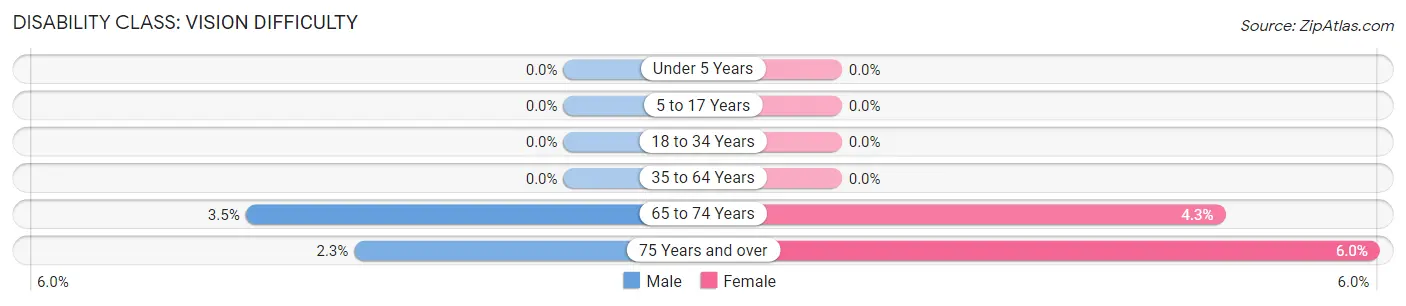
| Age Bracket | Male | Female |
| Under 5 Years | 0 (0.0%) | 0 (0.0%) |
| 5 to 17 Years | 0 (0.0%) | 0 (0.0%) |
| 18 to 34 Years | 0 (0.0%) | 0 (0.0%) |
| 35 to 64 Years | 0 (0.0%) | 0 (0.0%) |
| 65 to 74 Years | 4 (3.5%) | 7 (4.3%) |
| 75 Years and over | 3 (2.3%) | 10 (6.0%) |
Disability Class: Cognitive Difficulty
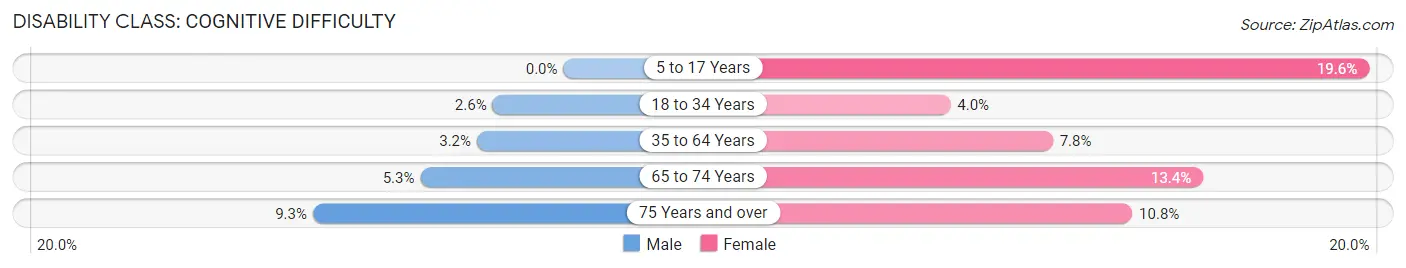
| Age Bracket | Male | Female |
| 5 to 17 Years | 0 (0.0%) | 9 (19.6%) |
| 18 to 34 Years | 3 (2.6%) | 5 (4.0%) |
| 35 to 64 Years | 5 (3.2%) | 13 (7.8%) |
| 65 to 74 Years | 6 (5.3%) | 22 (13.4%) |
| 75 Years and over | 12 (9.3%) | 18 (10.8%) |
Disability Class: Ambulatory Difficulty
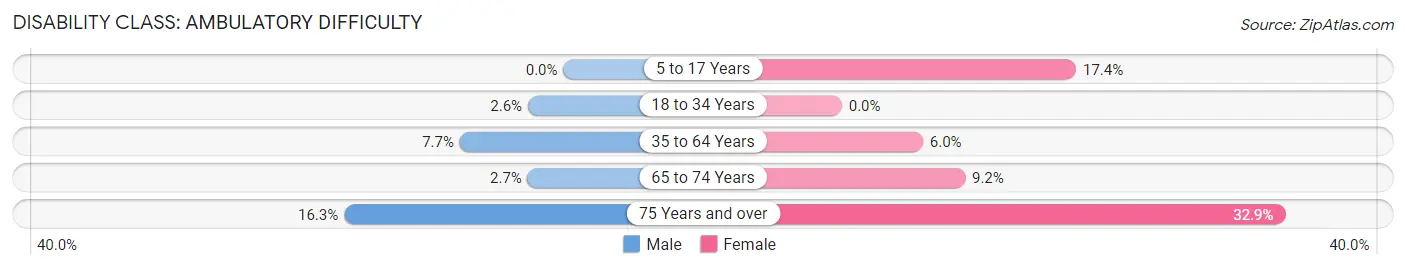
| Age Bracket | Male | Female |
| 5 to 17 Years | 0 (0.0%) | 8 (17.4%) |
| 18 to 34 Years | 3 (2.6%) | 0 (0.0%) |
| 35 to 64 Years | 12 (7.7%) | 10 (6.0%) |
| 65 to 74 Years | 3 (2.6%) | 15 (9.1%) |
| 75 Years and over | 21 (16.3%) | 55 (32.9%) |
Disability Class: Self-Care Difficulty
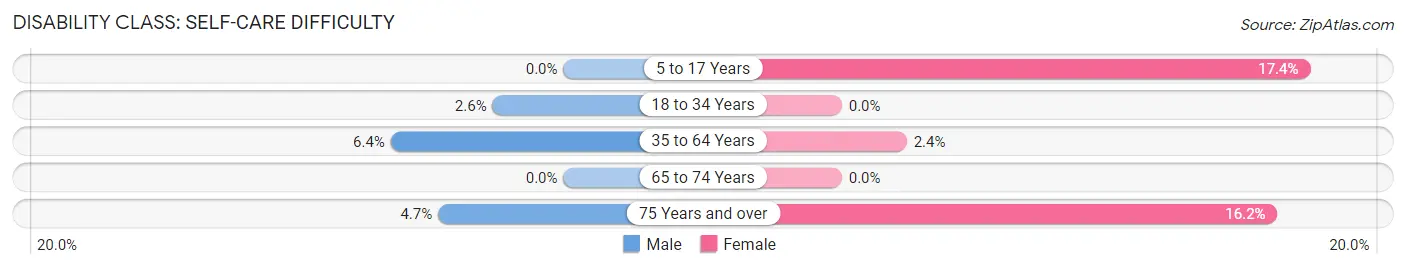
| Age Bracket | Male | Female |
| 5 to 17 Years | 0 (0.0%) | 8 (17.4%) |
| 18 to 34 Years | 3 (2.6%) | 0 (0.0%) |
| 35 to 64 Years | 10 (6.4%) | 4 (2.4%) |
| 65 to 74 Years | 0 (0.0%) | 0 (0.0%) |
| 75 Years and over | 6 (4.6%) | 27 (16.2%) |
Technology Access in Elverson borough
Computing Device Access in Elverson borough
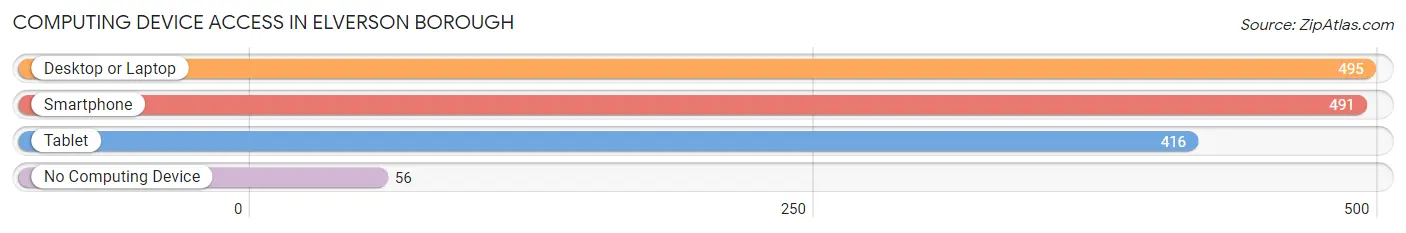
| Device Type | # Households | % Households |
| Desktop or Laptop | 495 | 79.1% |
| Smartphone | 491 | 78.4% |
| Tablet | 416 | 66.4% |
| No Computing Device | 56 | 8.9% |
| Total | 626 | 100.0% |
Internet Access in Elverson borough
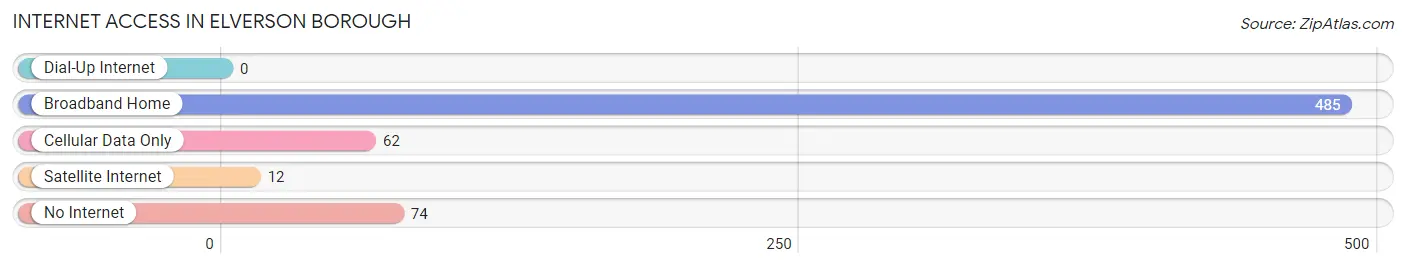
| Internet Type | # Households | % Households |
| Dial-Up Internet | 0 | 0.0% |
| Broadband Home | 485 | 77.5% |
| Cellular Data Only | 62 | 9.9% |
| Satellite Internet | 12 | 1.9% |
| No Internet | 74 | 11.8% |
| Total | 626 | 100.0% |
Elverson borough Summary
Elverson Borough is a small borough located in Chester County, Pennsylvania. It is situated in the southeastern corner of the county, approximately 25 miles west of Philadelphia. The borough is bordered by Honey Brook Township to the north, East Nantmeal Township to the east, Warwick Township to the south, and West Nantmeal Township to the west. As of the 2010 census, the population of Elverson Borough was 1,072.
History
Elverson Borough was founded in 1876 and was originally known as “Elversonville.” The name was changed to Elverson Borough in 1883. The borough was named after the Elverson family, who were early settlers in the area. The Elversons were Quakers who had emigrated from England in the late 1600s.
The borough was originally a farming community, but in the late 19th century, the area began to industrialize. The first industry to come to Elverson was a paper mill, which was established in 1883. This was followed by a brickyard in 1887 and a sawmill in 1889. These industries provided employment for many of the borough’s residents.
In the early 20th century, Elverson Borough experienced a period of growth and development. The borough was incorporated in 1906 and the first mayor was elected in 1907. The borough’s population grew steadily throughout the 20th century, reaching 1,072 by the 2010 census.
Geography
Elverson Borough is located in southeastern Chester County, approximately 25 miles west of Philadelphia. The borough is bordered by Honey Brook Township to the north, East Nantmeal Township to the east, Warwick Township to the south, and West Nantmeal Township to the west.
The borough is situated in the rolling hills of the Piedmont region of Pennsylvania. The terrain is mostly flat, with some hills and valleys. The borough is located in the watershed of the Schuylkill River.
Economy
The economy of Elverson Borough is largely based on agriculture and light industry. The borough is home to several small businesses, including a paper mill, a brickyard, and a sawmill. The borough also has a few retail stores and restaurants.
The borough’s largest employer is the Elverson Area School District, which employs over 200 people. Other major employers include the Elverson Borough Police Department, the Elverson Borough Fire Department, and the Elverson Borough Public Works Department.
Demographics
As of the 2010 census, the population of Elverson Borough was 1,072. The racial makeup of the borough was 94.3% White, 2.7% African American, 0.7% Asian, 0.3% Native American, and 1.9% from other races. Hispanic or Latino of any race were 2.2% of the population.
The median household income in Elverson Borough was $50,938, and the median family income was $60,938. The per capita income was $25,938. About 8.3% of families and 10.3% of the population were below the poverty line.
Elverson Borough is served by the Elverson Area School District, which consists of two elementary schools, one middle school, and one high school. The borough is also home to several churches, including the Elverson United Methodist Church, the Elverson Presbyterian Church, and the Elverson Baptist Church.
Common Questions
What is Per Capita Income in Elverson borough?
Per Capita income in Elverson borough is $45,955.
What is the Median Family Income in Elverson borough?
Median Family Income in Elverson borough is $84,375.
What is the Median Household income in Elverson borough?
Median Household Income in Elverson borough is $73,864.
What is Income or Wage Gap in Elverson borough?
Income or Wage Gap in Elverson borough is 15.7%.
Women in Elverson borough earn 84.3 cents for every dollar earned by a man.
What is Inequality or Gini Index in Elverson borough?
Inequality or Gini Index in Elverson borough is 0.47.
What is the Total Population of Elverson borough?
Total Population of Elverson borough is 1,365.
What is the Total Male Population of Elverson borough?
Total Male Population of Elverson borough is 654.
What is the Total Female Population of Elverson borough?
Total Female Population of Elverson borough is 711.
What is the Ratio of Males per 100 Females in Elverson borough?
There are 91.98 Males per 100 Females in Elverson borough.
What is the Ratio of Females per 100 Males in Elverson borough?
There are 108.72 Females per 100 Males in Elverson borough.
What is the Median Population Age in Elverson borough?
Median Population Age in Elverson borough is 58.6 Years.
What is the Average Family Size in Elverson borough
Average Family Size in Elverson borough is 2.8 People.
What is the Average Household Size in Elverson borough
Average Household Size in Elverson borough is 2.2 People.
How Large is the Labor Force in Elverson borough?
There are 548 People in the Labor Forcein in Elverson borough.
What is the Percentage of People in the Labor Force in Elverson borough?
47.2% of People are in the Labor Force in Elverson borough.
What is the Unemployment Rate in Elverson borough?
Unemployment Rate in Elverson borough is 1.1%.