Ferndale borough, PA Map & Demographics
Ferndale borough Overview
$28,797
PER CAPITA INCOME
$55,000
AVG FAMILY INCOME
$50,952
AVG HOUSEHOLD INCOME
11.3%
WAGE / INCOME GAP [ % ]
88.7¢/ $1
WAGE / INCOME GAP [ $ ]
0.37
INEQUALITY / GINI INDEX
1,566
TOTAL POPULATION
796
MALE POPULATION
770
FEMALE POPULATION
103.38
MALES / 100 FEMALES
96.73
FEMALES / 100 MALES
43.0
MEDIAN AGE
2.7
AVG FAMILY SIZE
2.3
AVG HOUSEHOLD SIZE
864
LABOR FORCE [ PEOPLE ]
66.6%
PERCENT IN LABOR FORCE
4.9%
UNEMPLOYMENT RATE
Income in Ferndale borough
Income Overview in Ferndale borough
Per Capita Income in Ferndale borough is $28,797, while median incomes of families and households are $55,000 and $50,952 respectively.
| Characteristic | Number | Measure |
| Per Capita Income | 1,566 | $28,797 |
| Median Family Income | 468 | $55,000 |
| Mean Family Income | 468 | $72,003 |
| Median Household Income | 694 | $50,952 |
| Mean Household Income | 694 | $62,858 |
| Income Deficit | 468 | $0 |
| Wage / Income Gap (%) | 1,566 | 11.34% |
| Wage / Income Gap ($) | 1,566 | 88.66¢ per $1 |
| Gini / Inequality Index | 1,566 | 0.37 |
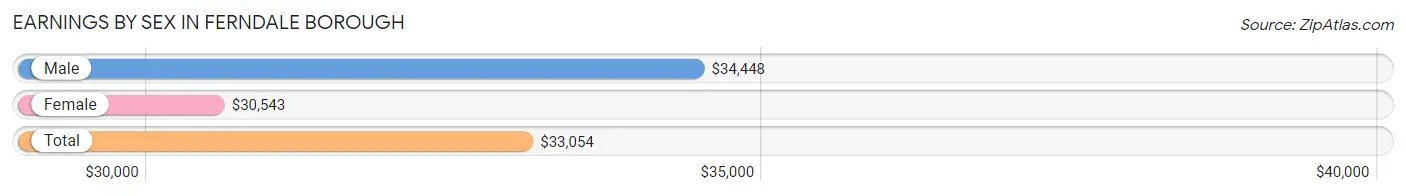
Earnings by Sex in Ferndale borough
Average Earnings in Ferndale borough are $33,054, $34,448 for men and $30,543 for women, a difference of 11.3%.
| Sex | Number | Average Earnings |
| Male | 533 (60.1%) | $34,448 |
| Female | 354 (39.9%) | $30,543 |
| Total | 887 (100.0%) | $33,054 |
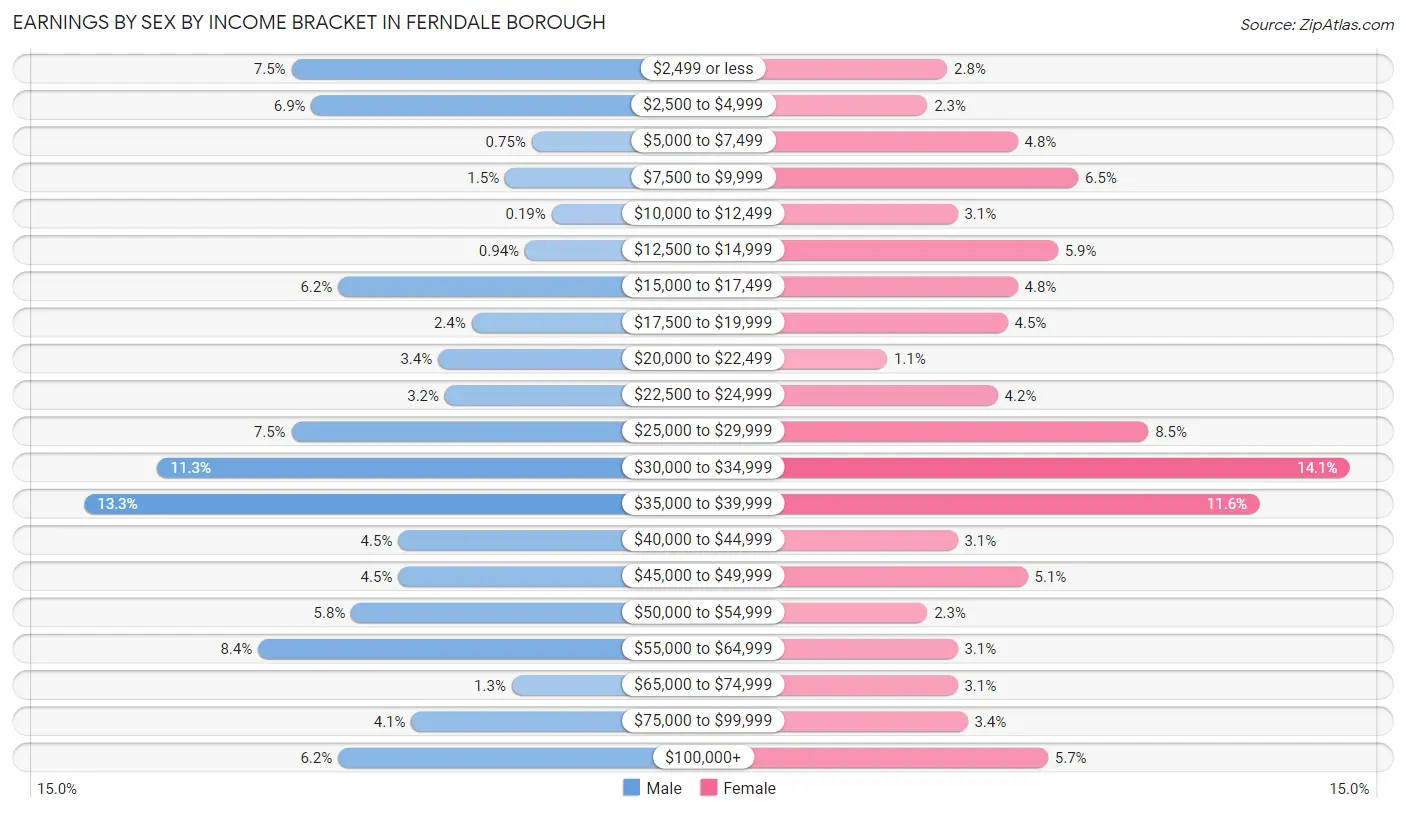
Earnings by Sex by Income Bracket in Ferndale borough
The most common earnings brackets in Ferndale borough are $35,000 to $39,999 for men (71 | 13.3%) and $30,000 to $34,999 for women (50 | 14.1%).
| Income | Male | Female |
| $2,499 or less | 40 (7.5%) | 10 (2.8%) |
| $2,500 to $4,999 | 37 (6.9%) | 8 (2.3%) |
| $5,000 to $7,499 | 4 (0.7%) | 17 (4.8%) |
| $7,500 to $9,999 | 8 (1.5%) | 23 (6.5%) |
| $10,000 to $12,499 | 1 (0.2%) | 11 (3.1%) |
| $12,500 to $14,999 | 5 (0.9%) | 21 (5.9%) |
| $15,000 to $17,499 | 33 (6.2%) | 17 (4.8%) |
| $17,500 to $19,999 | 13 (2.4%) | 16 (4.5%) |
| $20,000 to $22,499 | 18 (3.4%) | 4 (1.1%) |
| $22,500 to $24,999 | 17 (3.2%) | 15 (4.2%) |
| $25,000 to $29,999 | 40 (7.5%) | 30 (8.5%) |
| $30,000 to $34,999 | 60 (11.3%) | 50 (14.1%) |
| $35,000 to $39,999 | 71 (13.3%) | 41 (11.6%) |
| $40,000 to $44,999 | 24 (4.5%) | 11 (3.1%) |
| $45,000 to $49,999 | 24 (4.5%) | 18 (5.1%) |
| $50,000 to $54,999 | 31 (5.8%) | 8 (2.3%) |
| $55,000 to $64,999 | 45 (8.4%) | 11 (3.1%) |
| $65,000 to $74,999 | 7 (1.3%) | 11 (3.1%) |
| $75,000 to $99,999 | 22 (4.1%) | 12 (3.4%) |
| $100,000+ | 33 (6.2%) | 20 (5.7%) |
| Total | 533 (100.0%) | 354 (100.0%) |
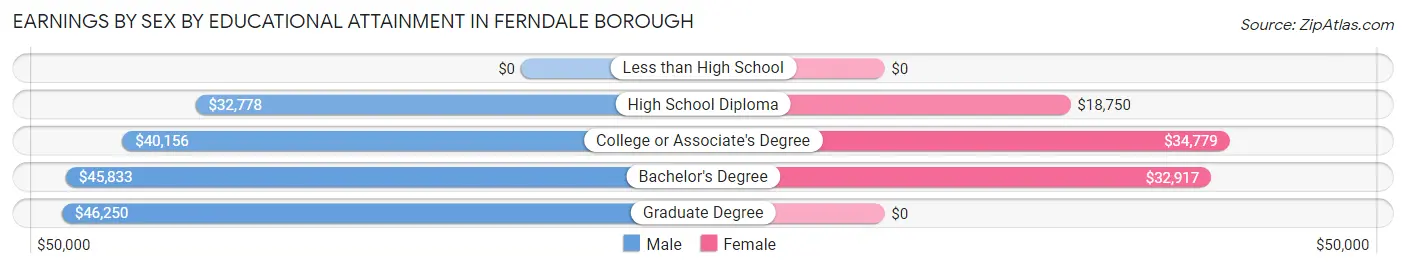
Earnings by Sex by Educational Attainment in Ferndale borough
Average earnings in Ferndale borough are $37,647 for men and $32,011 for women, a difference of 15.0%. Men with an educational attainment of graduate degree enjoy the highest average annual earnings of $46,250, while those with high school diploma education earn the least with $32,778. Women with an educational attainment of college or associate's degree earn the most with the average annual earnings of $34,779, while those with high school diploma education have the smallest earnings of $18,750.
| Educational Attainment | Male Income | Female Income |
| Less than High School | - | - |
| High School Diploma | $32,778 | $18,750 |
| College or Associate's Degree | $40,156 | $34,779 |
| Bachelor's Degree | $45,833 | $32,917 |
| Graduate Degree | $46,250 | $0 |
| Total | $37,647 | $32,011 |
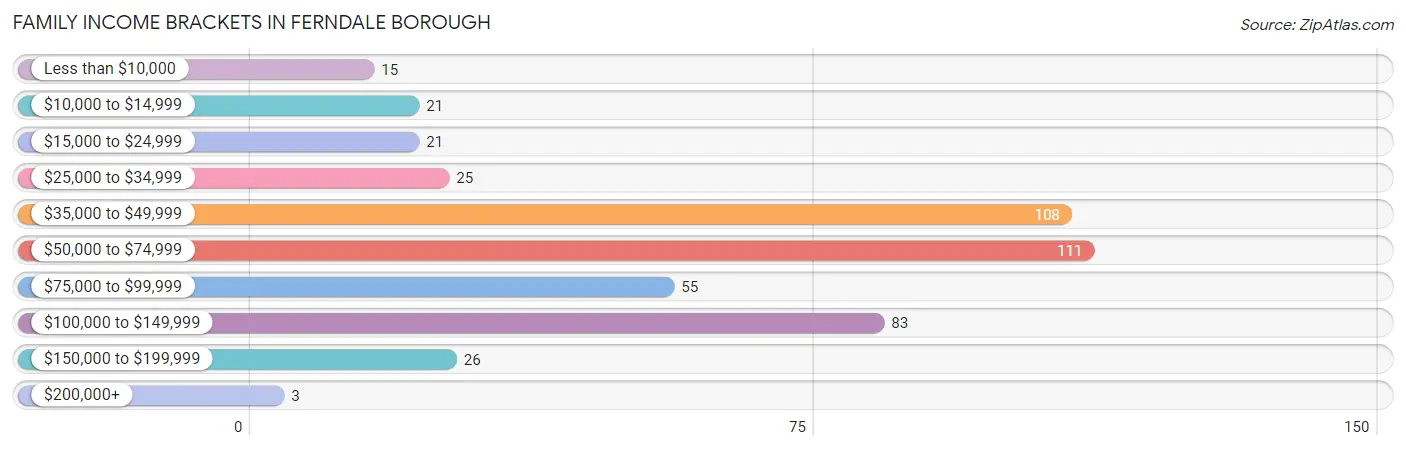
Family Income in Ferndale borough
Family Income Brackets in Ferndale borough
According to the Ferndale borough family income data, there are 111 families falling into the $50,000 to $74,999 income range, which is the most common income bracket and makes up 23.7% of all families. Conversely, the $200,000+ income bracket is the least frequent group with only 3 families (0.6%) belonging to this category.
| Income Bracket | # Families | % Families |
| Less than $10,000 | 15 | 3.2% |
| $10,000 to $14,999 | 21 | 4.5% |
| $15,000 to $24,999 | 21 | 4.5% |
| $25,000 to $34,999 | 25 | 5.3% |
| $35,000 to $49,999 | 108 | 23.1% |
| $50,000 to $74,999 | 111 | 23.7% |
| $75,000 to $99,999 | 55 | 11.8% |
| $100,000 to $149,999 | 83 | 17.7% |
| $150,000 to $199,999 | 26 | 5.6% |
| $200,000+ | 3 | 0.6% |
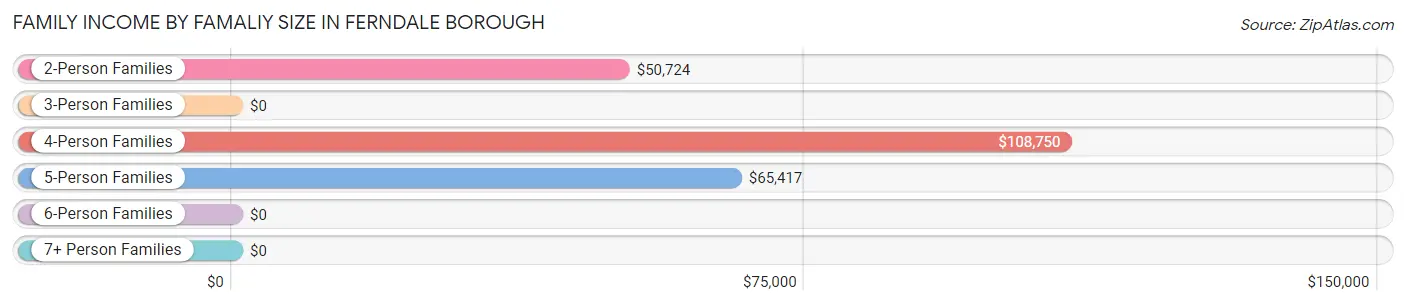
Family Income by Famaliy Size in Ferndale borough
4-person families (51 | 10.9%) account for the highest median family income in Ferndale borough with $108,750 per family, while 4-person families (51 | 10.9%) have the highest median income of $27,188 per family member.
| Income Bracket | # Families | Median Income |
| 2-Person Families | 309 (66.0%) | $50,724 |
| 3-Person Families | 87 (18.6%) | $0 |
| 4-Person Families | 51 (10.9%) | $108,750 |
| 5-Person Families | 16 (3.4%) | $65,417 |
| 6-Person Families | 5 (1.1%) | $0 |
| 7+ Person Families | 0 (0.0%) | $0 |
| Total | 468 (100.0%) | $55,000 |
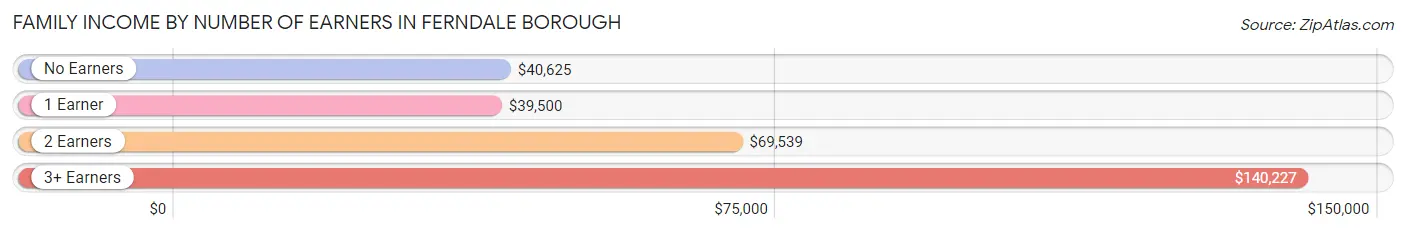
Family Income by Number of Earners in Ferndale borough
The median family income in Ferndale borough is $55,000, with families comprising 3+ earners (50) having the highest median family income of $140,227, while families with 1 earner (154) have the lowest median family income of $39,500, accounting for 10.7% and 32.9% of families, respectively.
| Number of Earners | # Families | Median Income |
| No Earners | 87 (18.6%) | $40,625 |
| 1 Earner | 154 (32.9%) | $39,500 |
| 2 Earners | 177 (37.8%) | $69,539 |
| 3+ Earners | 50 (10.7%) | $140,227 |
| Total | 468 (100.0%) | $55,000 |
Household Income in Ferndale borough
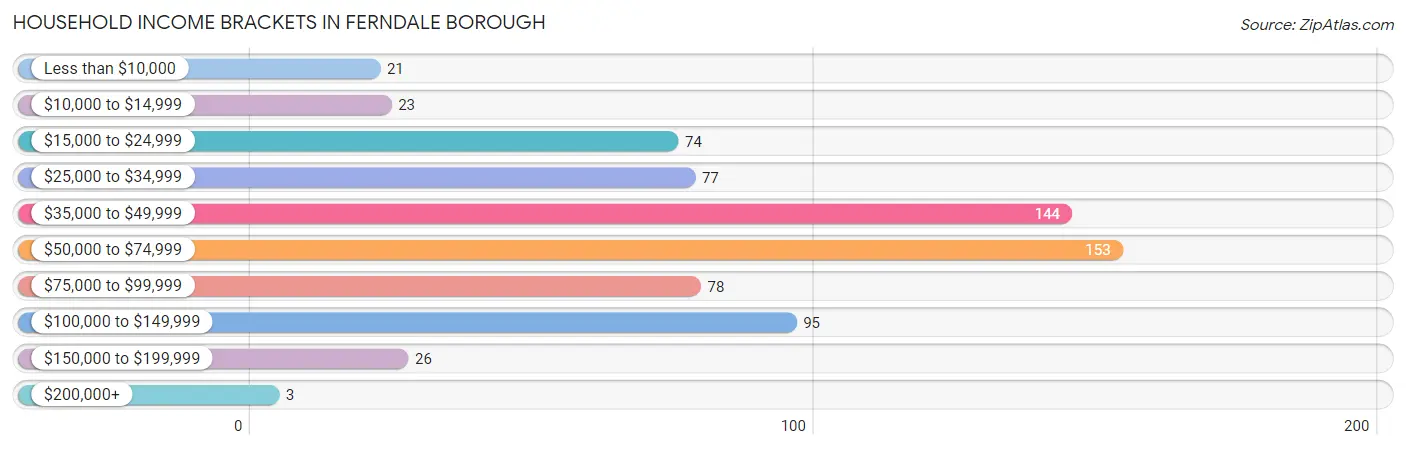
Household Income Brackets in Ferndale borough
With 153 households falling in the category, the $50,000 to $74,999 income range is the most frequent in Ferndale borough, accounting for 22.1% of all households. In contrast, only 3 households (0.4%) fall into the $200,000+ income bracket, making it the least populous group.
| Income Bracket | # Households | % Households |
| Less than $10,000 | 21 | 3.0% |
| $10,000 to $14,999 | 23 | 3.3% |
| $15,000 to $24,999 | 74 | 10.7% |
| $25,000 to $34,999 | 77 | 11.1% |
| $35,000 to $49,999 | 144 | 20.7% |
| $50,000 to $74,999 | 153 | 22.0% |
| $75,000 to $99,999 | 78 | 11.2% |
| $100,000 to $149,999 | 95 | 13.7% |
| $150,000 to $199,999 | 26 | 3.7% |
| $200,000+ | 3 | 0.4% |
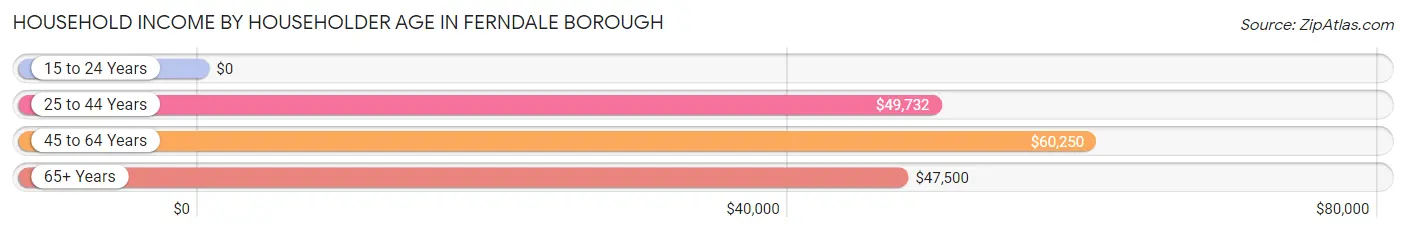
Household Income by Householder Age in Ferndale borough
The median household income in Ferndale borough is $50,952, with the highest median household income of $60,250 found in the 45 to 64 years age bracket for the primary householder. A total of 229 households (33.0%) fall into this category. Meanwhile, the 15 to 24 years age bracket for the primary householder has the lowest median household income of $0, with 13 households (1.9%) in this group.
| Income Bracket | # Households | Median Income |
| 15 to 24 Years | 13 (1.9%) | $0 |
| 25 to 44 Years | 222 (32.0%) | $49,732 |
| 45 to 64 Years | 229 (33.0%) | $60,250 |
| 65+ Years | 230 (33.1%) | $47,500 |
| Total | 694 (100.0%) | $50,952 |
Poverty in Ferndale borough
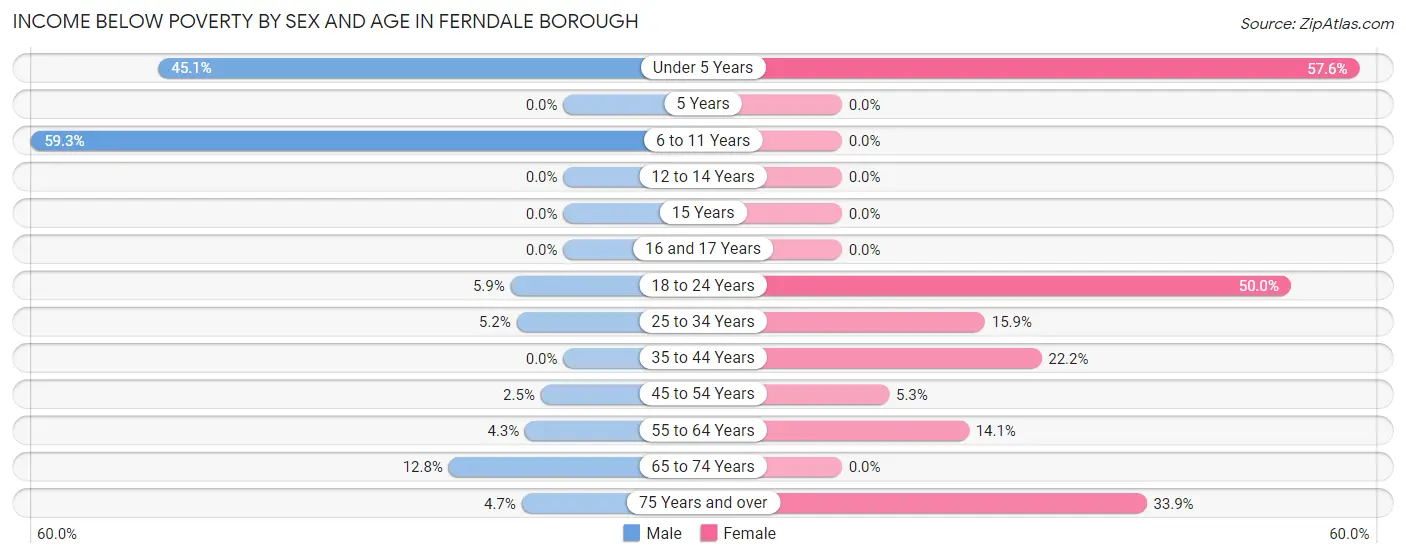
Income Below Poverty by Sex and Age in Ferndale borough
With 9.2% poverty level for males and 16.1% for females among the residents of Ferndale borough, 6 to 11 year old males and under 5 year old females are the most vulnerable to poverty, with 16 males (59.3%) and 34 females (57.6%) in their respective age groups living below the poverty level.
| Age Bracket | Male | Female |
| Under 5 Years | 23 (45.1%) | 34 (57.6%) |
| 5 Years | 0 (0.0%) | 0 (0.0%) |
| 6 to 11 Years | 16 (59.3%) | 0 (0.0%) |
| 12 to 14 Years | 0 (0.0%) | 0 (0.0%) |
| 15 Years | 0 (0.0%) | 0 (0.0%) |
| 16 and 17 Years | 0 (0.0%) | 0 (0.0%) |
| 18 to 24 Years | 6 (5.9%) | 12 (50.0%) |
| 25 to 34 Years | 6 (5.2%) | 18 (15.9%) |
| 35 to 44 Years | 0 (0.0%) | 24 (22.2%) |
| 45 to 54 Years | 4 (2.5%) | 4 (5.3%) |
| 55 to 64 Years | 4 (4.3%) | 13 (14.1%) |
| 65 to 74 Years | 12 (12.8%) | 0 (0.0%) |
| 75 Years and over | 2 (4.6%) | 19 (33.9%) |
| Total | 73 (9.2%) | 124 (16.1%) |
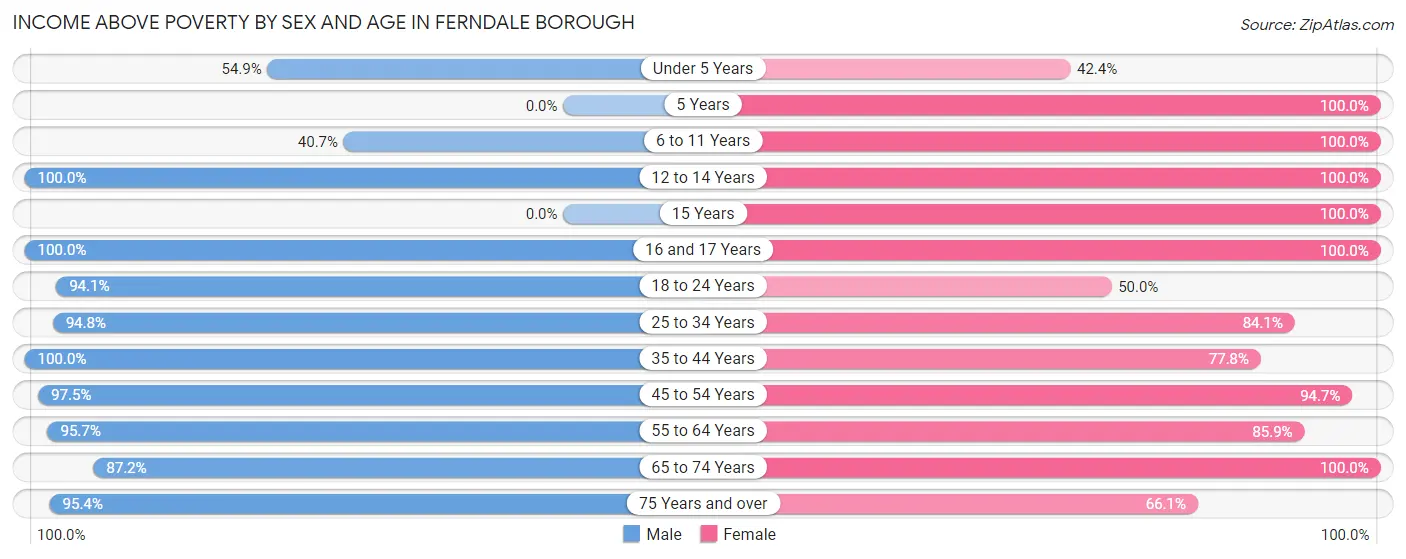
Income Above Poverty by Sex and Age in Ferndale borough
According to the poverty statistics in Ferndale borough, males aged 12 to 14 years and females aged 5 years are the age groups that are most secure financially, with 100.0% of males and 100.0% of females in these age groups living above the poverty line.
| Age Bracket | Male | Female |
| Under 5 Years | 28 (54.9%) | 25 (42.4%) |
| 5 Years | 0 (0.0%) | 12 (100.0%) |
| 6 to 11 Years | 11 (40.7%) | 57 (100.0%) |
| 12 to 14 Years | 16 (100.0%) | 27 (100.0%) |
| 15 Years | 0 (0.0%) | 13 (100.0%) |
| 16 and 17 Years | 25 (100.0%) | 10 (100.0%) |
| 18 to 24 Years | 96 (94.1%) | 12 (50.0%) |
| 25 to 34 Years | 109 (94.8%) | 95 (84.1%) |
| 35 to 44 Years | 64 (100.0%) | 84 (77.8%) |
| 45 to 54 Years | 155 (97.5%) | 72 (94.7%) |
| 55 to 64 Years | 90 (95.7%) | 79 (85.9%) |
| 65 to 74 Years | 82 (87.2%) | 123 (100.0%) |
| 75 Years and over | 41 (95.4%) | 37 (66.1%) |
| Total | 717 (90.8%) | 646 (83.9%) |
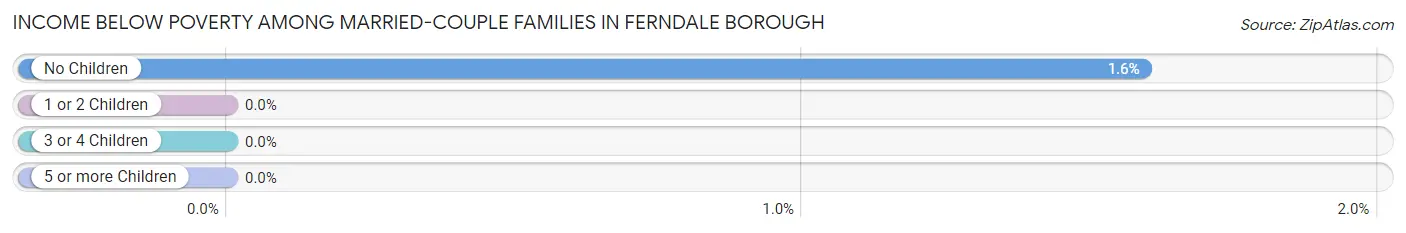
Income Below Poverty Among Married-Couple Families in Ferndale borough
The poverty statistics for married-couple families in Ferndale borough show that 1.1% or 3 of the total 276 families live below the poverty line. Families with no children have the highest poverty rate of 1.6%, comprising of 3 families. On the other hand, families with 1 or 2 children have the lowest poverty rate of 0.0%, which includes 0 families.
| Children | Above Poverty | Below Poverty |
| No Children | 186 (98.4%) | 3 (1.6%) |
| 1 or 2 Children | 70 (100.0%) | 0 (0.0%) |
| 3 or 4 Children | 17 (100.0%) | 0 (0.0%) |
| 5 or more Children | 0 (0.0%) | 0 (0.0%) |
| Total | 273 (98.9%) | 3 (1.1%) |
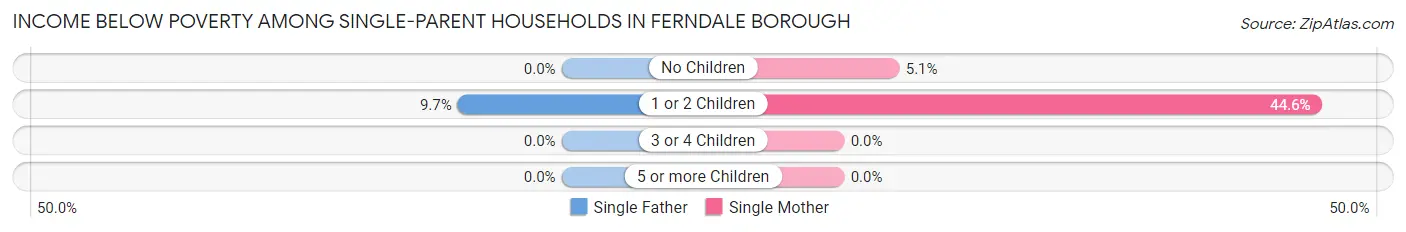
Income Below Poverty Among Single-Parent Households in Ferndale borough
According to the poverty data in Ferndale borough, 4.3% or 3 single-father households and 32.0% or 39 single-mother households are living below the poverty line. Among single-father households, those with 1 or 2 children have the highest poverty rate, with 3 households (9.7%) experiencing poverty. Likewise, among single-mother households, those with 1 or 2 children have the highest poverty rate, with 37 households (44.6%) falling below the poverty line.
| Children | Single Father | Single Mother |
| No Children | 0 (0.0%) | 2 (5.1%) |
| 1 or 2 Children | 3 (9.7%) | 37 (44.6%) |
| 3 or 4 Children | 0 (0.0%) | 0 (0.0%) |
| 5 or more Children | 0 (0.0%) | 0 (0.0%) |
| Total | 3 (4.3%) | 39 (32.0%) |
Income Below Poverty Among Married-Couple vs Single-Parent Households in Ferndale borough
The poverty data for Ferndale borough shows that 3 of the married-couple family households (1.1%) and 42 of the single-parent households (21.9%) are living below the poverty level. Within the married-couple family households, those with no children have the highest poverty rate, with 3 households (1.6%) falling below the poverty line. Among the single-parent households, those with 1 or 2 children have the highest poverty rate, with 40 household (35.1%) living below poverty.
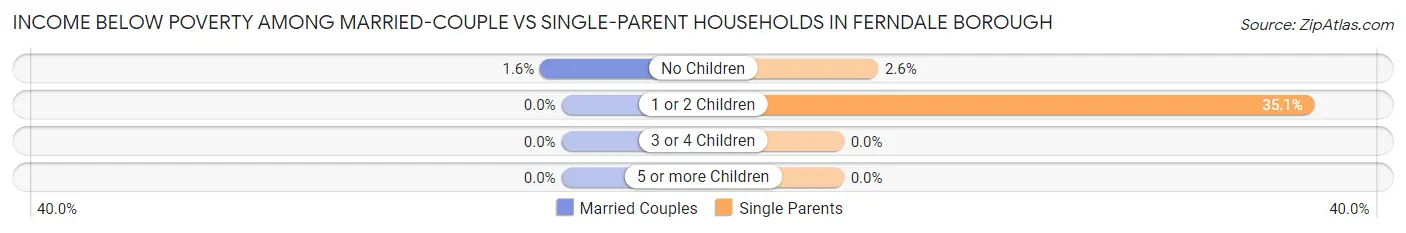
| Children | Married-Couple Families | Single-Parent Households |
| No Children | 3 (1.6%) | 2 (2.6%) |
| 1 or 2 Children | 0 (0.0%) | 40 (35.1%) |
| 3 or 4 Children | 0 (0.0%) | 0 (0.0%) |
| 5 or more Children | 0 (0.0%) | 0 (0.0%) |
| Total | 3 (1.1%) | 42 (21.9%) |
Race in Ferndale borough
The most populous races in Ferndale borough are White / Caucasian (1,349 | 86.1%), Black / African American (117 | 7.5%), and Two or more Races (89 | 5.7%).
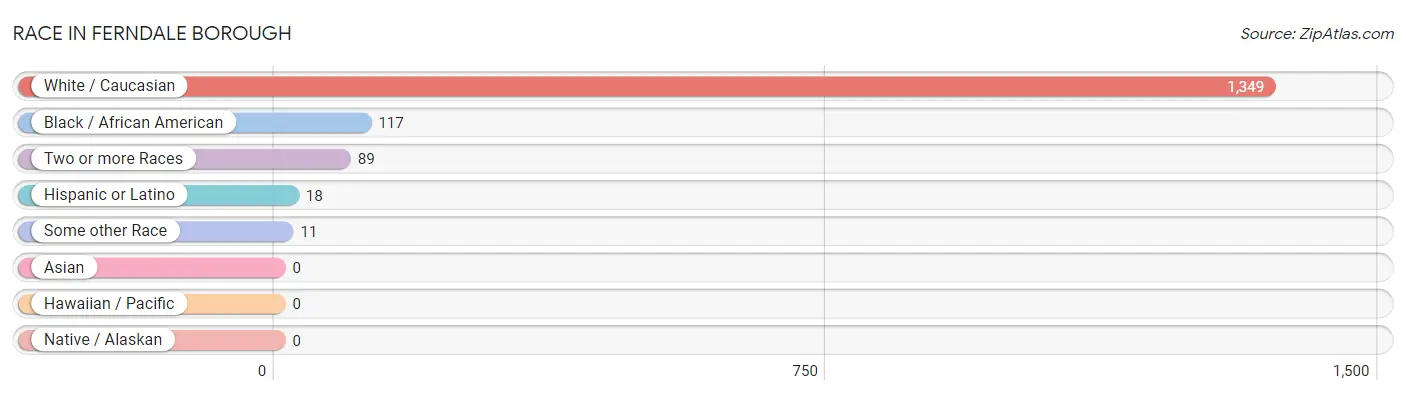
| Race | # Population | % Population |
| Asian | 0 | 0.0% |
| Black / African American | 117 | 7.5% |
| Hawaiian / Pacific | 0 | 0.0% |
| Hispanic or Latino | 18 | 1.1% |
| Native / Alaskan | 0 | 0.0% |
| White / Caucasian | 1,349 | 86.1% |
| Two or more Races | 89 | 5.7% |
| Some other Race | 11 | 0.7% |
| Total | 1,566 | 100.0% |
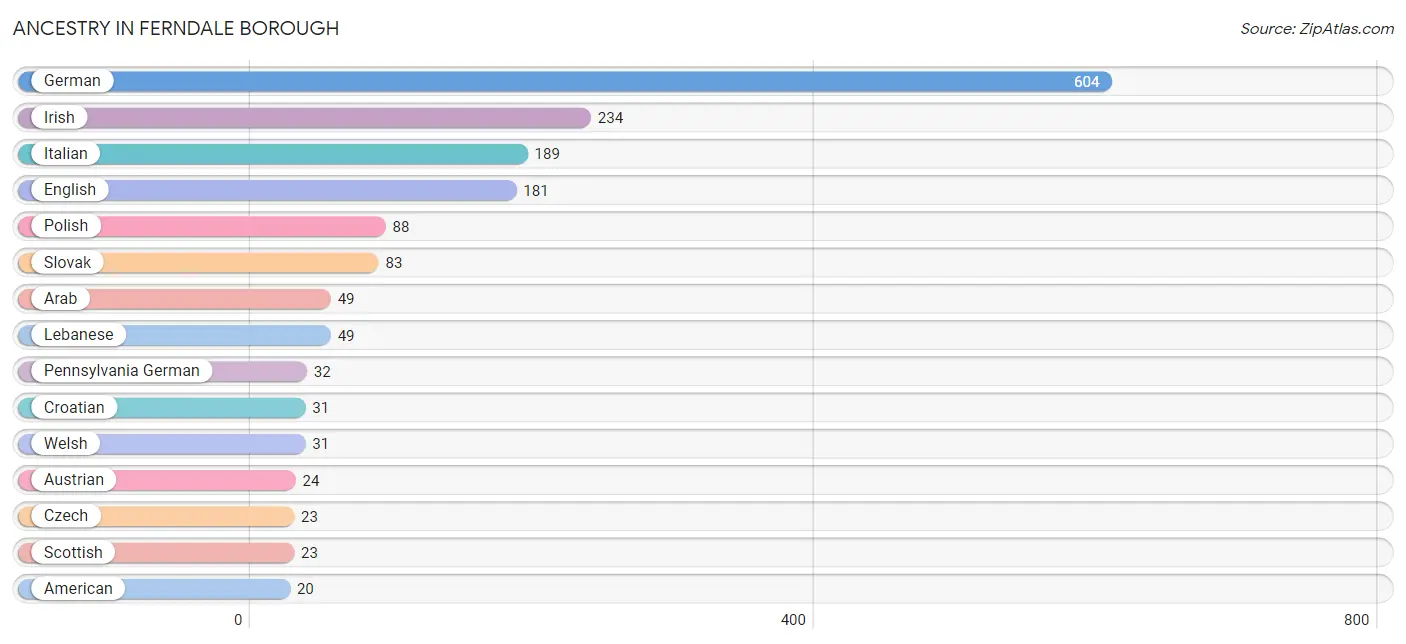
Ancestry in Ferndale borough
The most populous ancestries reported in Ferndale borough are German (604 | 38.6%), Irish (234 | 14.9%), Italian (189 | 12.1%), English (181 | 11.6%), and Polish (88 | 5.6%), together accounting for 82.8% of all Ferndale borough residents.
| Ancestry | # Population | % Population |
| American | 20 | 1.3% |
| Arab | 49 | 3.1% |
| Austrian | 24 | 1.5% |
| Central American | 3 | 0.2% |
| Croatian | 31 | 2.0% |
| Czech | 23 | 1.5% |
| Czechoslovakian | 10 | 0.6% |
| Dutch | 10 | 0.6% |
| Eastern European | 4 | 0.3% |
| English | 181 | 11.6% |
| French | 6 | 0.4% |
| German | 604 | 38.6% |
| Greek | 11 | 0.7% |
| Hungarian | 7 | 0.4% |
| Irish | 234 | 14.9% |
| Italian | 189 | 12.1% |
| Lebanese | 49 | 3.1% |
| Lithuanian | 10 | 0.6% |
| Mexican | 15 | 1.0% |
| Northern European | 16 | 1.0% |
| Panamanian | 3 | 0.2% |
| Pennsylvania German | 32 | 2.0% |
| Polish | 88 | 5.6% |
| Portuguese | 4 | 0.3% |
| Russian | 5 | 0.3% |
| Scotch-Irish | 12 | 0.8% |
| Scottish | 23 | 1.5% |
| Sioux | 1 | 0.1% |
| Slavic | 4 | 0.3% |
| Slovak | 83 | 5.3% |
| Slovene | 5 | 0.3% |
| Swedish | 2 | 0.1% |
| Welsh | 31 | 2.0% | View All 33 Rows |
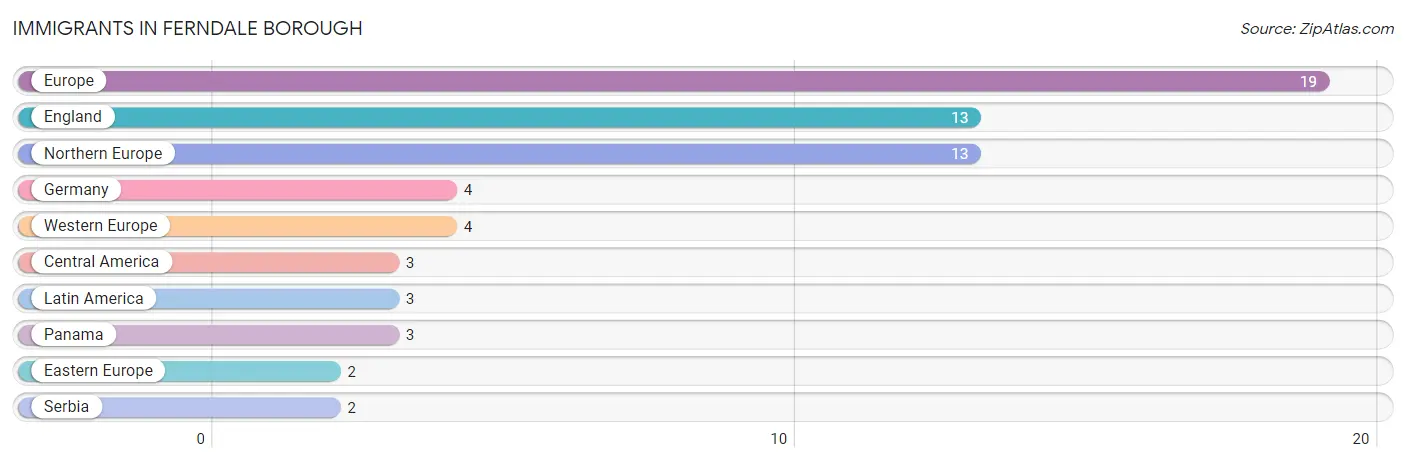
Immigrants in Ferndale borough
The most numerous immigrant groups reported in Ferndale borough came from Europe (19 | 1.2%), England (13 | 0.8%), Northern Europe (13 | 0.8%), Germany (4 | 0.3%), and Western Europe (4 | 0.3%), together accounting for 3.4% of all Ferndale borough residents.
| Immigration Origin | # Population | % Population |
| Central America | 3 | 0.2% |
| Eastern Europe | 2 | 0.1% |
| England | 13 | 0.8% |
| Europe | 19 | 1.2% |
| Germany | 4 | 0.3% |
| Latin America | 3 | 0.2% |
| Northern Europe | 13 | 0.8% |
| Panama | 3 | 0.2% |
| Serbia | 2 | 0.1% |
| Western Europe | 4 | 0.3% | View All 10 Rows |
Sex and Age in Ferndale borough
Sex and Age in Ferndale borough
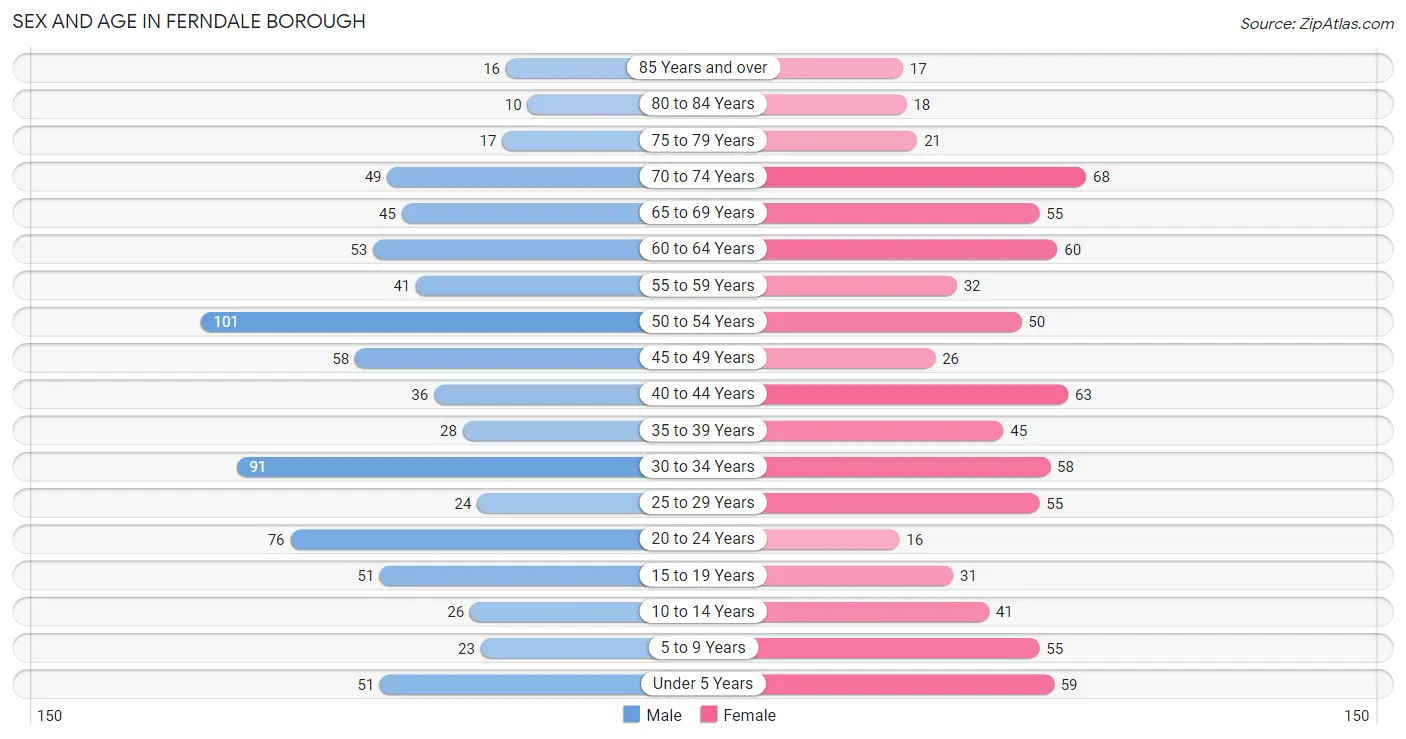
The most populous age groups in Ferndale borough are 50 to 54 Years (101 | 12.7%) for men and 70 to 74 Years (68 | 8.8%) for women.
| Age Bracket | Male | Female |
| Under 5 Years | 51 (6.4%) | 59 (7.7%) |
| 5 to 9 Years | 23 (2.9%) | 55 (7.1%) |
| 10 to 14 Years | 26 (3.3%) | 41 (5.3%) |
| 15 to 19 Years | 51 (6.4%) | 31 (4.0%) |
| 20 to 24 Years | 76 (9.6%) | 16 (2.1%) |
| 25 to 29 Years | 24 (3.0%) | 55 (7.1%) |
| 30 to 34 Years | 91 (11.4%) | 58 (7.5%) |
| 35 to 39 Years | 28 (3.5%) | 45 (5.8%) |
| 40 to 44 Years | 36 (4.5%) | 63 (8.2%) |
| 45 to 49 Years | 58 (7.3%) | 26 (3.4%) |
| 50 to 54 Years | 101 (12.7%) | 50 (6.5%) |
| 55 to 59 Years | 41 (5.1%) | 32 (4.2%) |
| 60 to 64 Years | 53 (6.7%) | 60 (7.8%) |
| 65 to 69 Years | 45 (5.7%) | 55 (7.1%) |
| 70 to 74 Years | 49 (6.2%) | 68 (8.8%) |
| 75 to 79 Years | 17 (2.1%) | 21 (2.7%) |
| 80 to 84 Years | 10 (1.3%) | 18 (2.3%) |
| 85 Years and over | 16 (2.0%) | 17 (2.2%) |
| Total | 796 (100.0%) | 770 (100.0%) |
Families and Households in Ferndale borough
Median Family Size in Ferndale borough
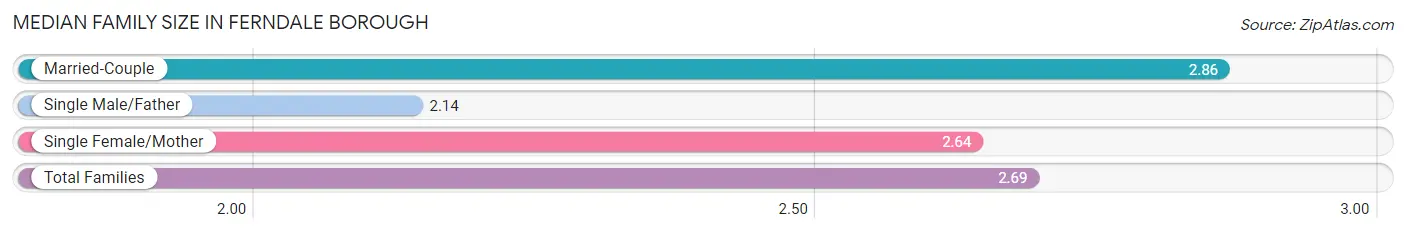
The median family size in Ferndale borough is 2.69 persons per family, with married-couple families (276 | 59.0%) accounting for the largest median family size of 2.86 persons per family. On the other hand, single male/father families (70 | 15.0%) represent the smallest median family size with 2.14 persons per family.
| Family Type | # Families | Family Size |
| Married-Couple | 276 (59.0%) | 2.86 |
| Single Male/Father | 70 (15.0%) | 2.14 |
| Single Female/Mother | 122 (26.1%) | 2.64 |
| Total Families | 468 (100.0%) | 2.69 |
Median Household Size in Ferndale borough
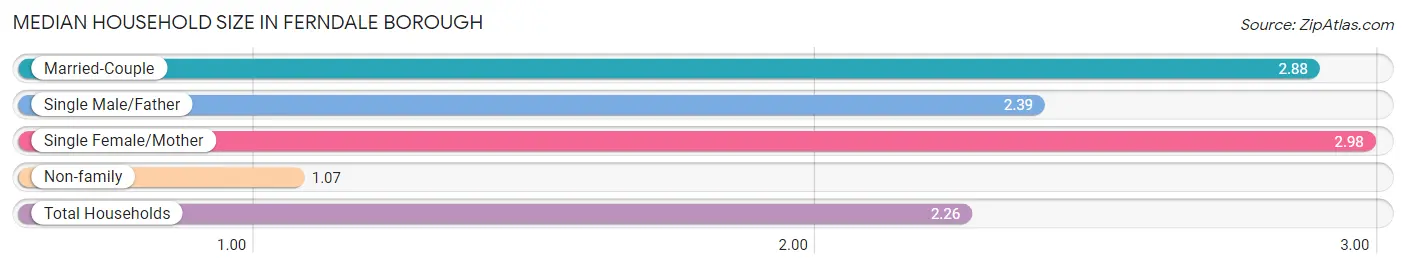
The median household size in Ferndale borough is 2.26 persons per household, with single female/mother households (122 | 17.6%) accounting for the largest median household size of 2.98 persons per household. non-family households (226 | 32.6%) represent the smallest median household size with 1.07 persons per household.
| Household Type | # Households | Household Size |
| Married-Couple | 276 (39.8%) | 2.88 |
| Single Male/Father | 70 (10.1%) | 2.39 |
| Single Female/Mother | 122 (17.6%) | 2.98 |
| Non-family | 226 (32.6%) | 1.07 |
| Total Households | 694 (100.0%) | 2.26 |
Household Size by Marriage Status in Ferndale borough
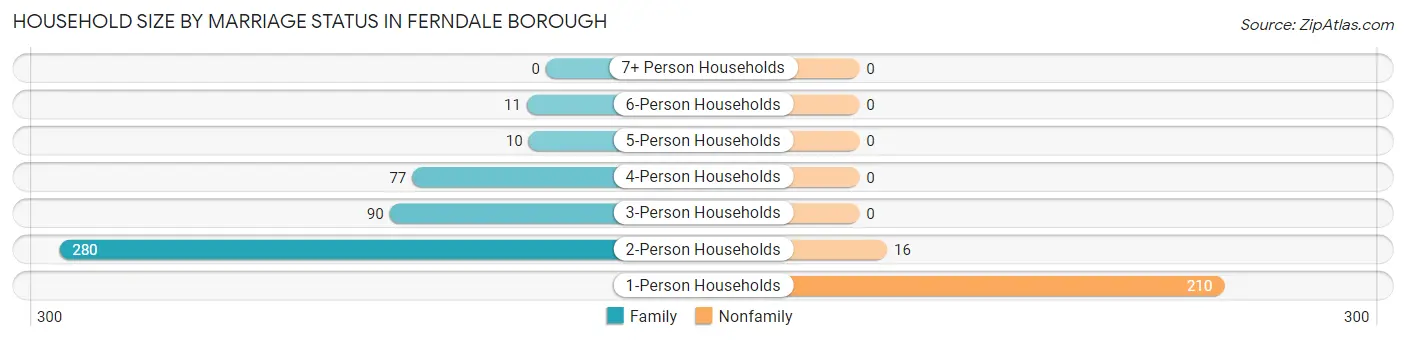
Out of a total of 694 households in Ferndale borough, 468 (67.4%) are family households, while 226 (32.6%) are nonfamily households. The most numerous type of family households are 2-person households, comprising 280, and the most common type of nonfamily households are 1-person households, comprising 210.
| Household Size | Family Households | Nonfamily Households |
| 1-Person Households | - | 210 (30.3%) |
| 2-Person Households | 280 (40.4%) | 16 (2.3%) |
| 3-Person Households | 90 (13.0%) | 0 (0.0%) |
| 4-Person Households | 77 (11.1%) | 0 (0.0%) |
| 5-Person Households | 10 (1.4%) | 0 (0.0%) |
| 6-Person Households | 11 (1.6%) | 0 (0.0%) |
| 7+ Person Households | 0 (0.0%) | 0 (0.0%) |
| Total | 468 (67.4%) | 226 (32.6%) |
Female Fertility in Ferndale borough
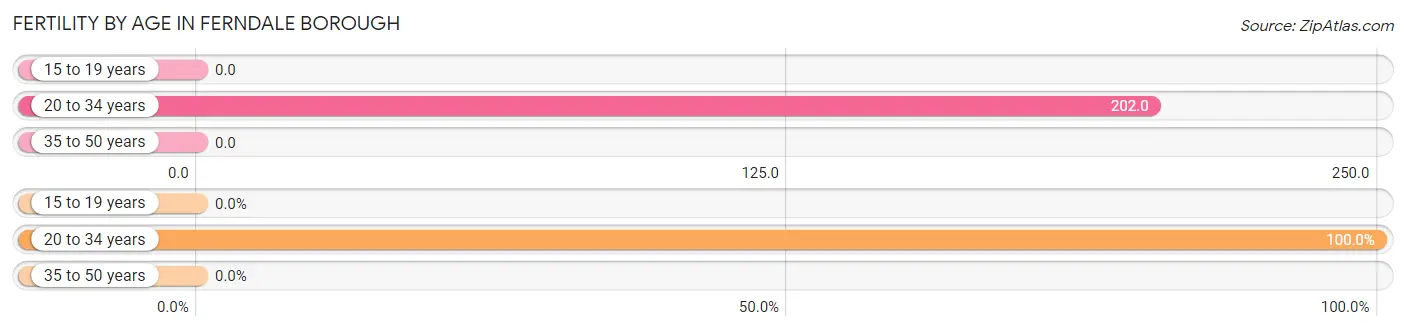
Fertility by Age in Ferndale borough
Average fertility rate in Ferndale borough is 87.0 births per 1,000 women. Women in the age bracket of 20 to 34 years have the highest fertility rate with 202.0 births per 1,000 women. Women in the age bracket of 20 to 34 years acount for 100.0% of all women with births.
| Age Bracket | Women with Births | Births / 1,000 Women |
| 15 to 19 years | 0 (0.0%) | 0.0 |
| 20 to 34 years | 26 (100.0%) | 202.0 |
| 35 to 50 years | 0 (0.0%) | 0.0 |
| Total | 26 (100.0%) | 87.0 |
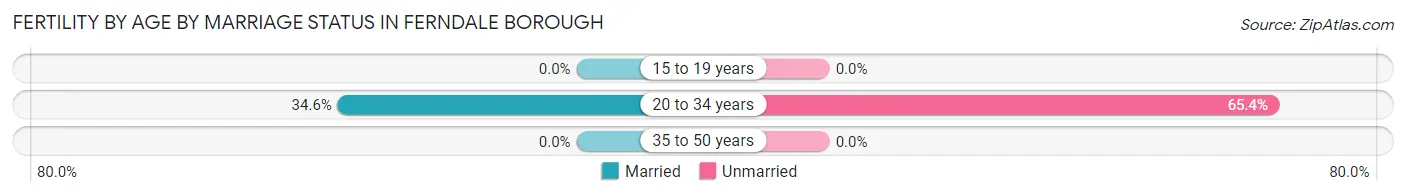
Fertility by Age by Marriage Status in Ferndale borough
34.6% of women with births (26) in Ferndale borough are married. The highest percentage of unmarried women with births falls into 20 to 34 years age bracket with 65.4% of them unmarried at the time of birth, while the lowest percentage of unmarried women with births belong to 20 to 34 years age bracket with 65.4% of them unmarried.
| Age Bracket | Married | Unmarried |
| 15 to 19 years | 0 (0.0%) | 0 (0.0%) |
| 20 to 34 years | 9 (34.6%) | 17 (65.4%) |
| 35 to 50 years | 0 (0.0%) | 0 (0.0%) |
| Total | 9 (34.6%) | 17 (65.4%) |
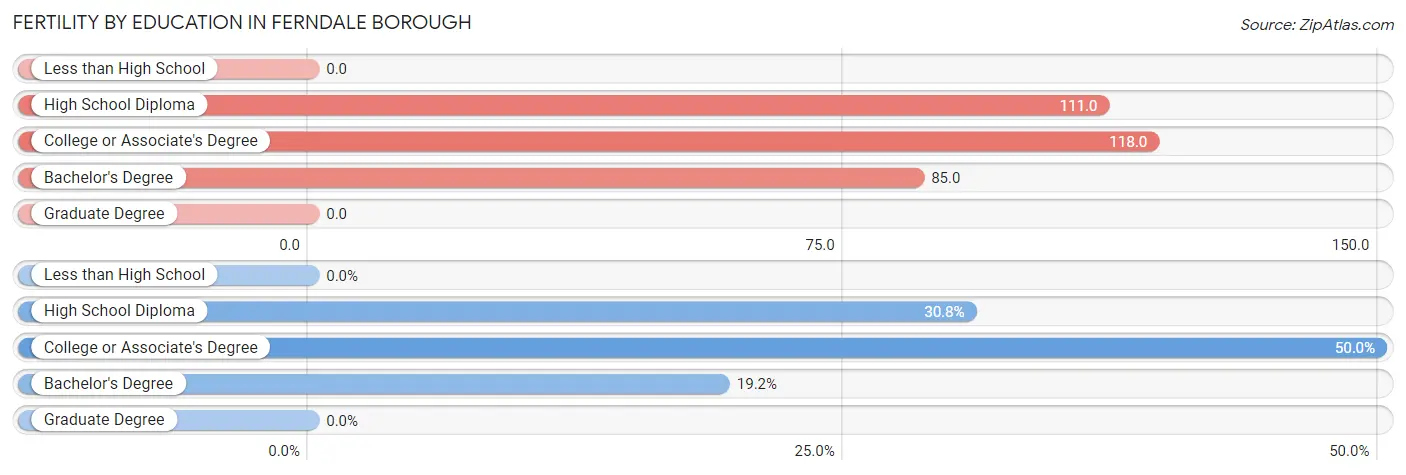
Fertility by Education in Ferndale borough
| Educational Attainment | Women with Births | Births / 1,000 Women |
| Less than High School | 0 (0.0%) | 0.0 |
| High School Diploma | 8 (30.8%) | 111.0 |
| College or Associate's Degree | 13 (50.0%) | 118.0 |
| Bachelor's Degree | 5 (19.2%) | 85.0 |
| Graduate Degree | 0 (0.0%) | 0.0 |
| Total | 26 (100.0%) | 87.0 |
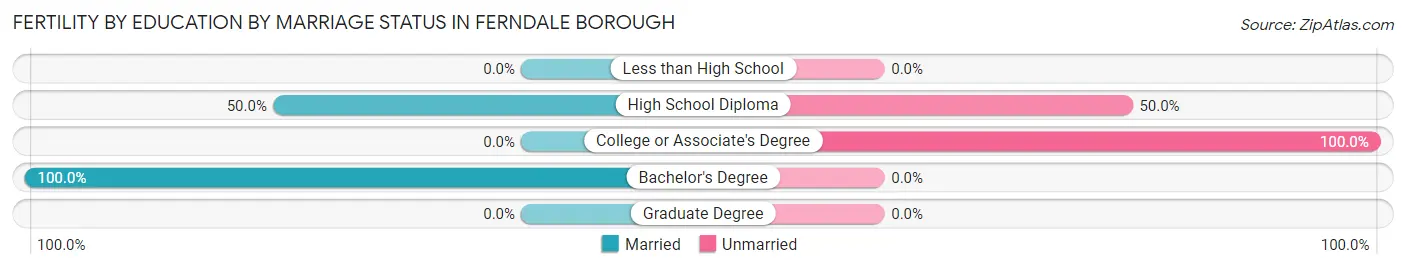
Fertility by Education by Marriage Status in Ferndale borough
65.4% of women with births in Ferndale borough are unmarried. Women with the educational attainment of bachelor's degree are most likely to be married with 100.0% of them married at childbirth, while women with the educational attainment of college or associate's degree are least likely to be married with 100.0% of them unmarried at childbirth.
| Educational Attainment | Married | Unmarried |
| Less than High School | 0 (0.0%) | 0 (0.0%) |
| High School Diploma | 4 (50.0%) | 4 (50.0%) |
| College or Associate's Degree | 0 (0.0%) | 13 (100.0%) |
| Bachelor's Degree | 5 (100.0%) | 0 (0.0%) |
| Graduate Degree | 0 (0.0%) | 0 (0.0%) |
| Total | 9 (34.6%) | 17 (65.4%) |
Employment Characteristics in Ferndale borough
Employment by Class of Employer in Ferndale borough
Among the 806 employed individuals in Ferndale borough, private company employees (612 | 75.9%), not-for-profit organizations (97 | 12.0%), and self-employed (not incorporated) (41 | 5.1%) make up the most common classes of employment.
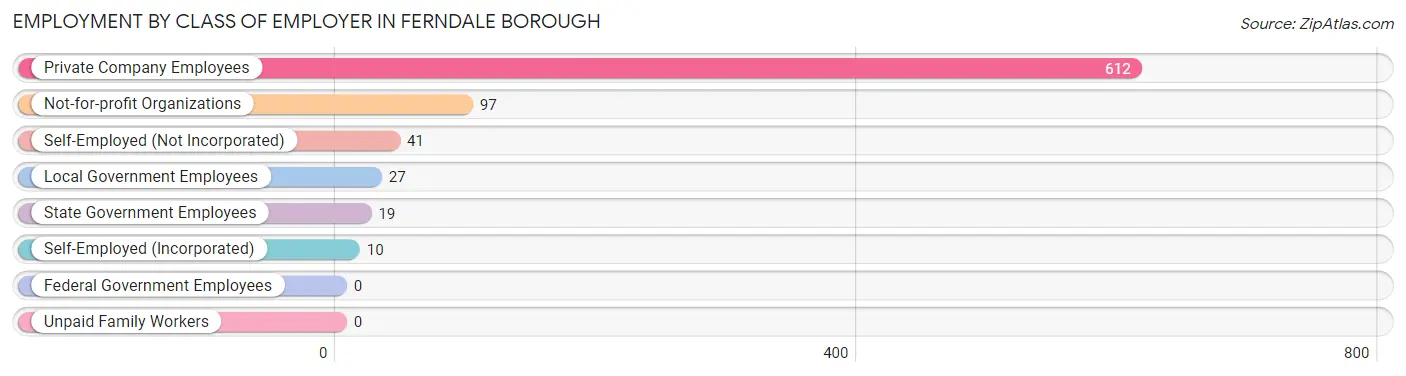
| Employer Class | # Employees | % Employees |
| Private Company Employees | 612 | 75.9% |
| Self-Employed (Incorporated) | 10 | 1.2% |
| Self-Employed (Not Incorporated) | 41 | 5.1% |
| Not-for-profit Organizations | 97 | 12.0% |
| Local Government Employees | 27 | 3.4% |
| State Government Employees | 19 | 2.4% |
| Federal Government Employees | 0 | 0.0% |
| Unpaid Family Workers | 0 | 0.0% |
| Total | 806 | 100.0% |
Employment Status by Age in Ferndale borough
According to the labor force statistics for Ferndale borough, out of the total population over 16 years of age (1,298), 66.6% or 864 individuals are in the labor force, with 4.9% or 42 of them unemployed. The age group with the highest labor force participation rate is 25 to 29 years, with 100.0% or 79 individuals in the labor force. Within the labor force, the 65 to 74 years age range has the highest percentage of unemployed individuals, with 18.9% or 7 of them being unemployed.
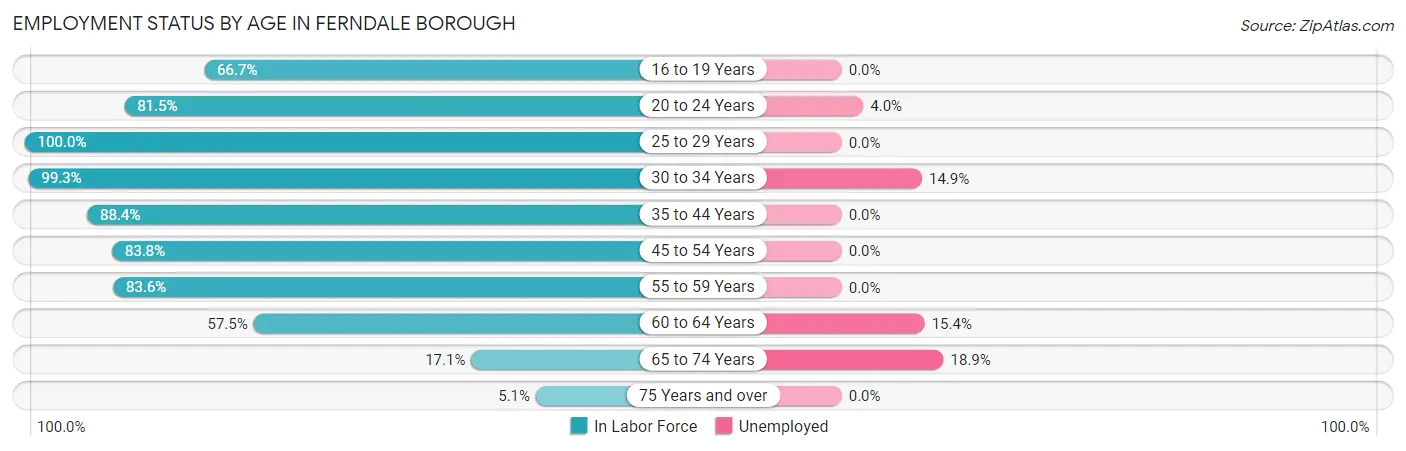
| Age Bracket | In Labor Force | Unemployed |
| 16 to 19 Years | 46 (66.7%) | 0 (0.0%) |
| 20 to 24 Years | 75 (81.5%) | 3 (4.0%) |
| 25 to 29 Years | 79 (100.0%) | 0 (0.0%) |
| 30 to 34 Years | 148 (99.3%) | 22 (14.9%) |
| 35 to 44 Years | 152 (88.4%) | 0 (0.0%) |
| 45 to 54 Years | 197 (83.8%) | 0 (0.0%) |
| 55 to 59 Years | 61 (83.6%) | 0 (0.0%) |
| 60 to 64 Years | 65 (57.5%) | 10 (15.4%) |
| 65 to 74 Years | 37 (17.1%) | 7 (18.9%) |
| 75 Years and over | 5 (5.1%) | 0 (0.0%) |
| Total | 864 (66.6%) | 42 (4.9%) |
Employment Status by Educational Attainment in Ferndale borough
According to labor force statistics for Ferndale borough, 85.5% of individuals (702) out of the total population between 25 and 64 years of age (821) are in the labor force, with 4.6% or 32 of them being unemployed. The group with the highest labor force participation rate are those with the educational attainment of bachelor's degree or higher, with 92.4% or 195 individuals in the labor force. Within the labor force, individuals with less than high school education have the highest percentage of unemployment, with 33.3% or 6 of them being unemployed.
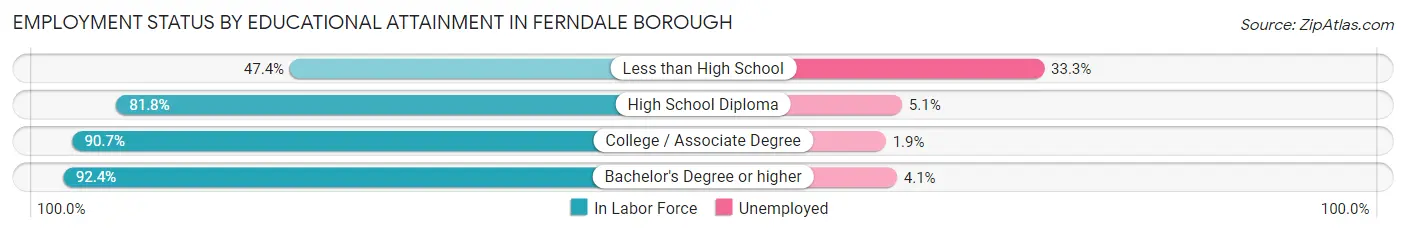
| Educational Attainment | In Labor Force | Unemployed |
| Less than High School | 18 (47.4%) | 13 (33.3%) |
| High School Diploma | 274 (81.8%) | 17 (5.1%) |
| College / Associate Degree | 215 (90.7%) | 5 (1.9%) |
| Bachelor's Degree or higher | 195 (92.4%) | 9 (4.1%) |
| Total | 702 (85.5%) | 38 (4.6%) |
Employment Occupations by Sex in Ferndale borough
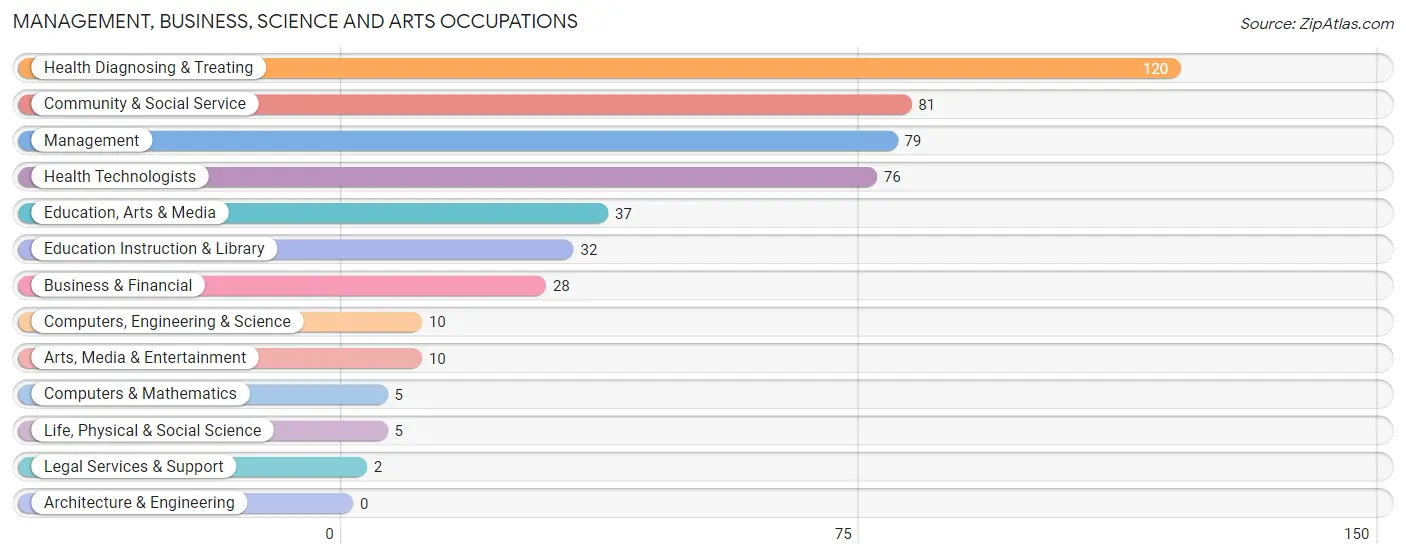
Management, Business, Science and Arts Occupations
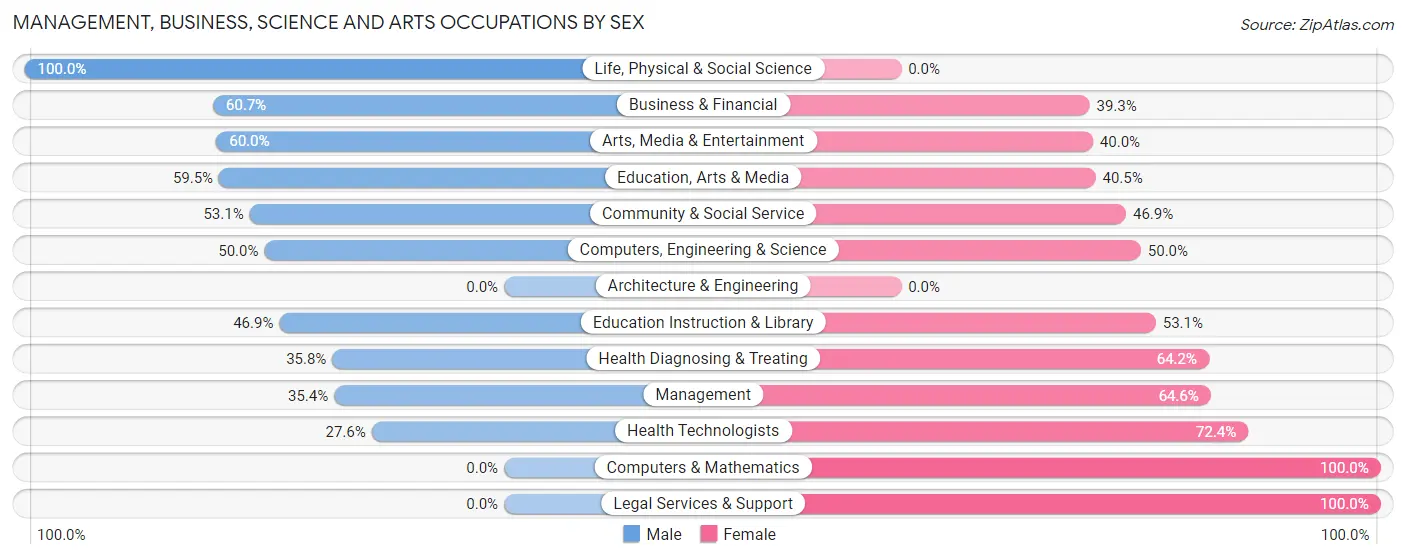
The most common Management, Business, Science and Arts occupations in Ferndale borough are Health Diagnosing & Treating (120 | 14.6%), Community & Social Service (81 | 9.8%), Management (79 | 9.6%), Health Technologists (76 | 9.2%), and Education, Arts & Media (37 | 4.5%).
Management, Business, Science and Arts Occupations by Sex
Within the Management, Business, Science and Arts occupations in Ferndale borough, the most male-oriented occupations are Life, Physical & Social Science (100.0%), Business & Financial (60.7%), and Arts, Media & Entertainment (60.0%), while the most female-oriented occupations are Computers & Mathematics (100.0%), Legal Services & Support (100.0%), and Health Technologists (72.4%).
| Occupation | Male | Female |
| Management | 28 (35.4%) | 51 (64.6%) |
| Business & Financial | 17 (60.7%) | 11 (39.3%) |
| Computers, Engineering & Science | 5 (50.0%) | 5 (50.0%) |
| Computers & Mathematics | 0 (0.0%) | 5 (100.0%) |
| Architecture & Engineering | 0 (0.0%) | 0 (0.0%) |
| Life, Physical & Social Science | 5 (100.0%) | 0 (0.0%) |
| Community & Social Service | 43 (53.1%) | 38 (46.9%) |
| Education, Arts & Media | 22 (59.5%) | 15 (40.5%) |
| Legal Services & Support | 0 (0.0%) | 2 (100.0%) |
| Education Instruction & Library | 15 (46.9%) | 17 (53.1%) |
| Arts, Media & Entertainment | 6 (60.0%) | 4 (40.0%) |
| Health Diagnosing & Treating | 43 (35.8%) | 77 (64.2%) |
| Health Technologists | 21 (27.6%) | 55 (72.4%) |
| Total (Category) | 136 (42.8%) | 182 (57.2%) |
| Total (Overall) | 491 (59.7%) | 332 (40.3%) |
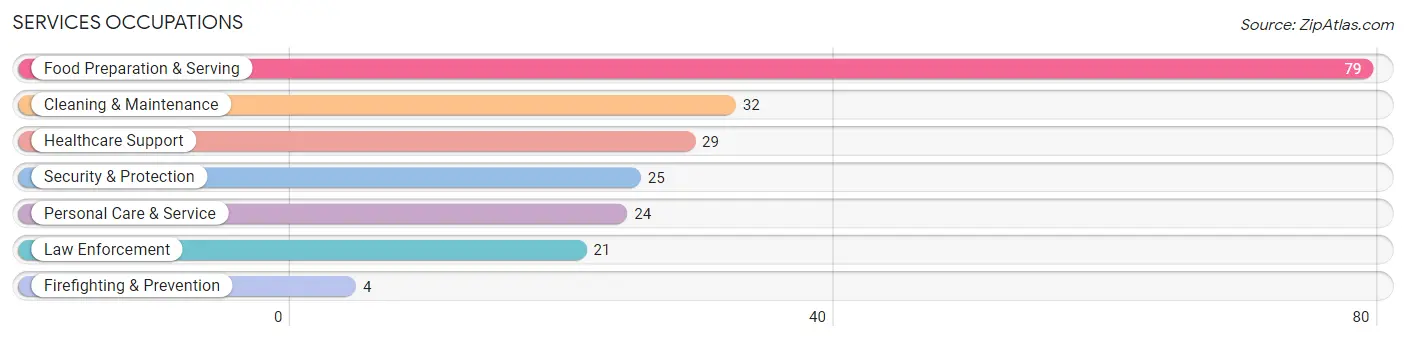
Services Occupations
The most common Services occupations in Ferndale borough are Food Preparation & Serving (79 | 9.6%), Cleaning & Maintenance (32 | 3.9%), Healthcare Support (29 | 3.5%), Security & Protection (25 | 3.0%), and Personal Care & Service (24 | 2.9%).
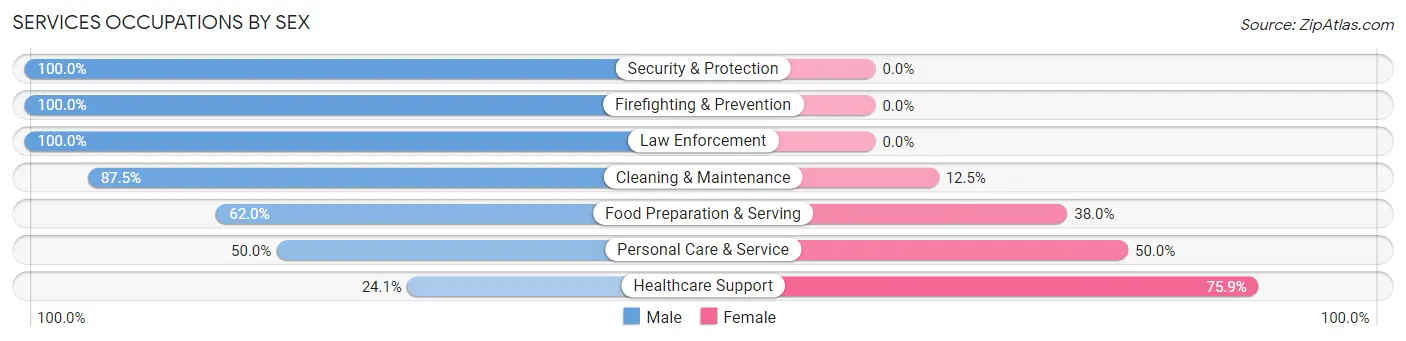
Services Occupations by Sex
Within the Services occupations in Ferndale borough, the most male-oriented occupations are Security & Protection (100.0%), Firefighting & Prevention (100.0%), and Law Enforcement (100.0%), while the most female-oriented occupations are Healthcare Support (75.9%), Personal Care & Service (50.0%), and Food Preparation & Serving (38.0%).
| Occupation | Male | Female |
| Healthcare Support | 7 (24.1%) | 22 (75.9%) |
| Security & Protection | 25 (100.0%) | 0 (0.0%) |
| Firefighting & Prevention | 4 (100.0%) | 0 (0.0%) |
| Law Enforcement | 21 (100.0%) | 0 (0.0%) |
| Food Preparation & Serving | 49 (62.0%) | 30 (38.0%) |
| Cleaning & Maintenance | 28 (87.5%) | 4 (12.5%) |
| Personal Care & Service | 12 (50.0%) | 12 (50.0%) |
| Total (Category) | 121 (64.0%) | 68 (36.0%) |
| Total (Overall) | 491 (59.7%) | 332 (40.3%) |
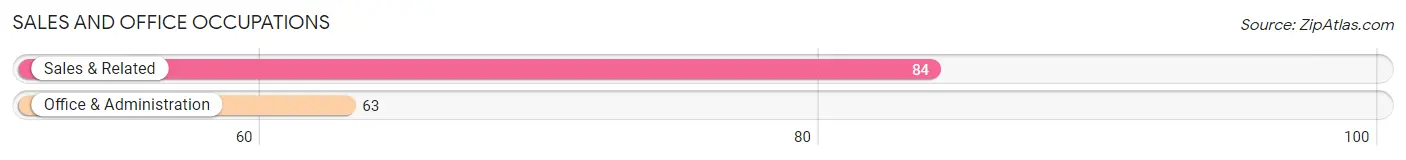
Sales and Office Occupations
The most common Sales and Office occupations in Ferndale borough are Sales & Related (84 | 10.2%), and Office & Administration (63 | 7.6%).
Sales and Office Occupations by Sex
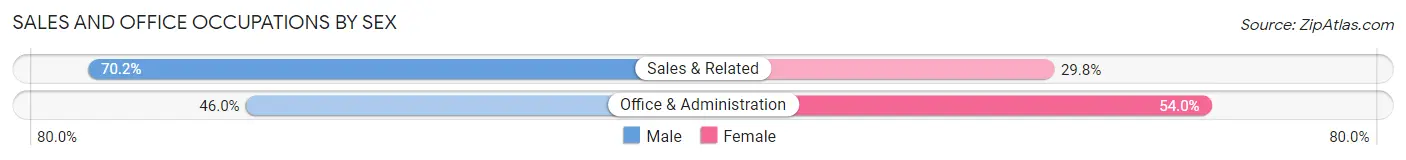
| Occupation | Male | Female |
| Sales & Related | 59 (70.2%) | 25 (29.8%) |
| Office & Administration | 29 (46.0%) | 34 (54.0%) |
| Total (Category) | 88 (59.9%) | 59 (40.1%) |
| Total (Overall) | 491 (59.7%) | 332 (40.3%) |
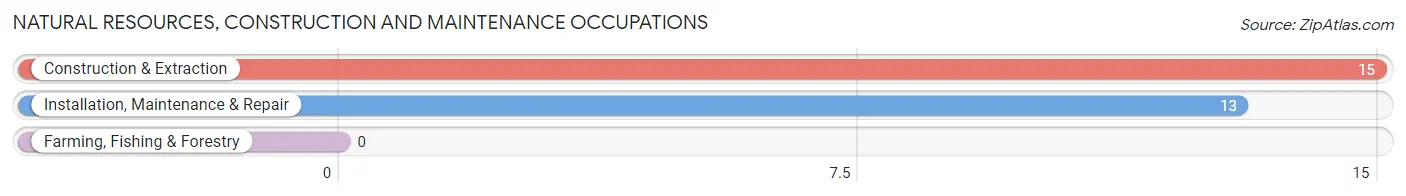
Natural Resources, Construction and Maintenance Occupations
The most common Natural Resources, Construction and Maintenance occupations in Ferndale borough are Construction & Extraction (15 | 1.8%), and Installation, Maintenance & Repair (13 | 1.6%).
Natural Resources, Construction and Maintenance Occupations by Sex
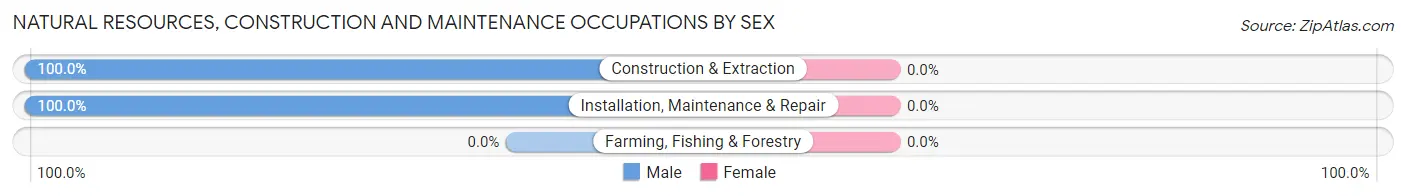
| Occupation | Male | Female |
| Farming, Fishing & Forestry | 0 (0.0%) | 0 (0.0%) |
| Construction & Extraction | 15 (100.0%) | 0 (0.0%) |
| Installation, Maintenance & Repair | 13 (100.0%) | 0 (0.0%) |
| Total (Category) | 28 (100.0%) | 0 (0.0%) |
| Total (Overall) | 491 (59.7%) | 332 (40.3%) |
Production, Transportation and Moving Occupations
The most common Production, Transportation and Moving occupations in Ferndale borough are Material Moving (59 | 7.2%), Transportation (45 | 5.5%), and Production (37 | 4.5%).
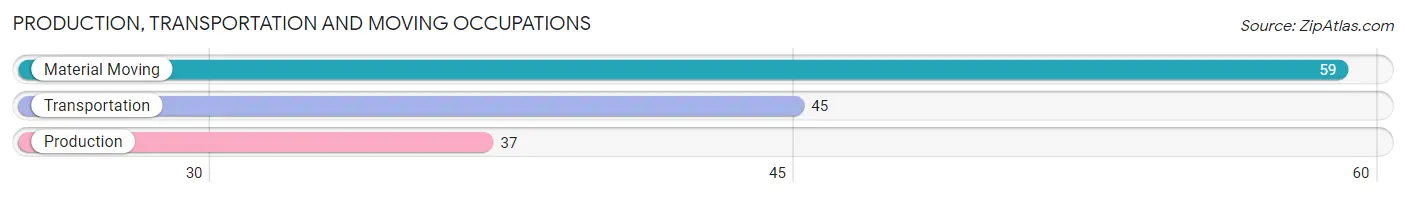
Production, Transportation and Moving Occupations by Sex
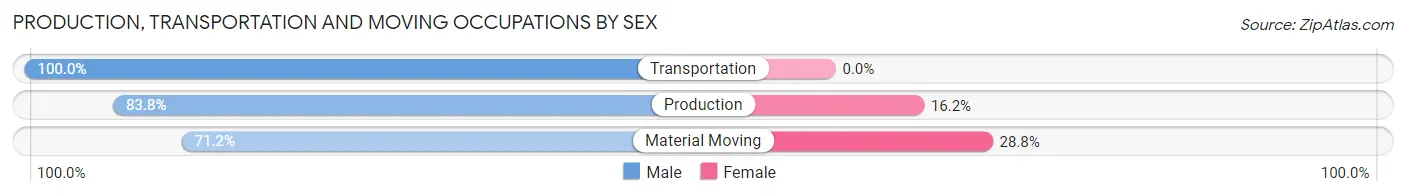
| Occupation | Male | Female |
| Production | 31 (83.8%) | 6 (16.2%) |
| Transportation | 45 (100.0%) | 0 (0.0%) |
| Material Moving | 42 (71.2%) | 17 (28.8%) |
| Total (Category) | 118 (83.7%) | 23 (16.3%) |
| Total (Overall) | 491 (59.7%) | 332 (40.3%) |
Employment Industries by Sex in Ferndale borough
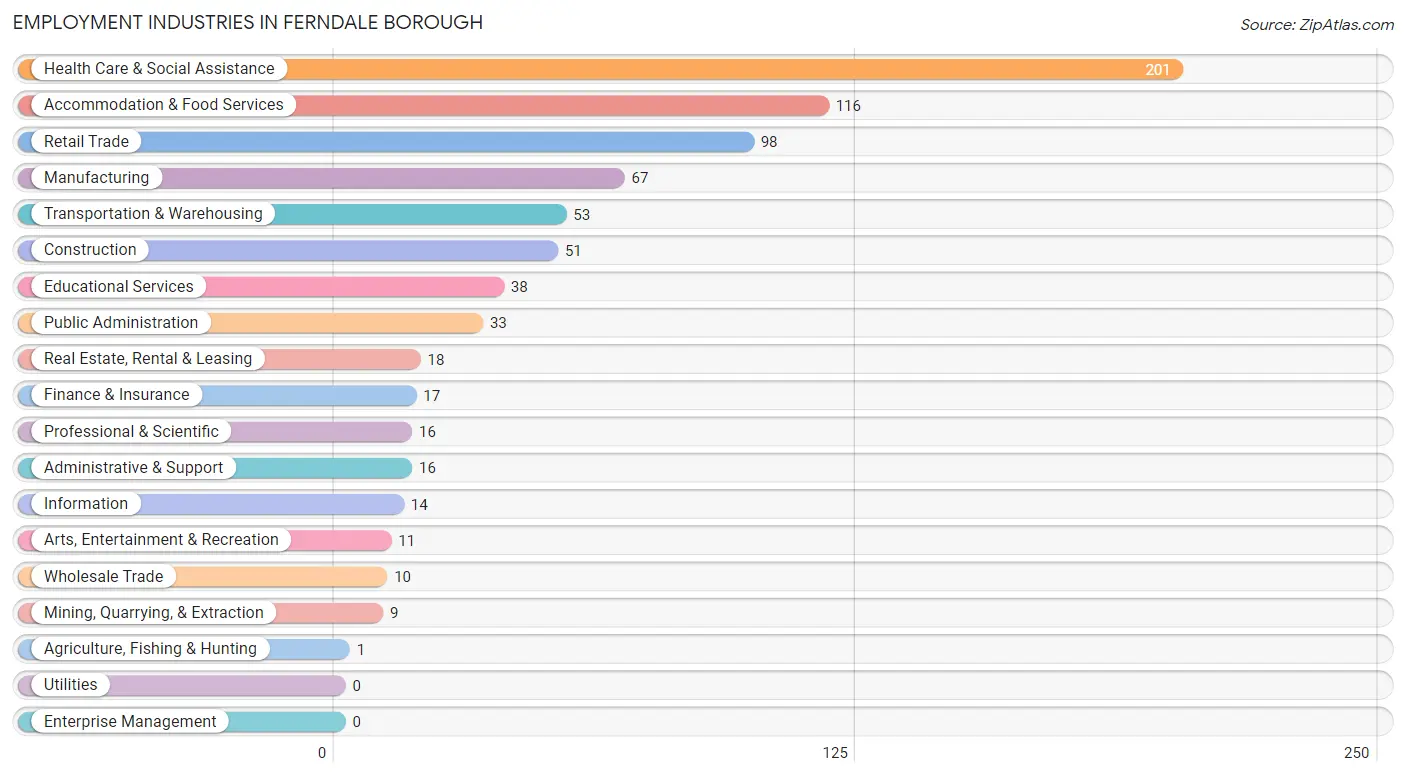
Employment Industries in Ferndale borough
The major employment industries in Ferndale borough include Health Care & Social Assistance (201 | 24.4%), Accommodation & Food Services (116 | 14.1%), Retail Trade (98 | 11.9%), Manufacturing (67 | 8.1%), and Transportation & Warehousing (53 | 6.4%).
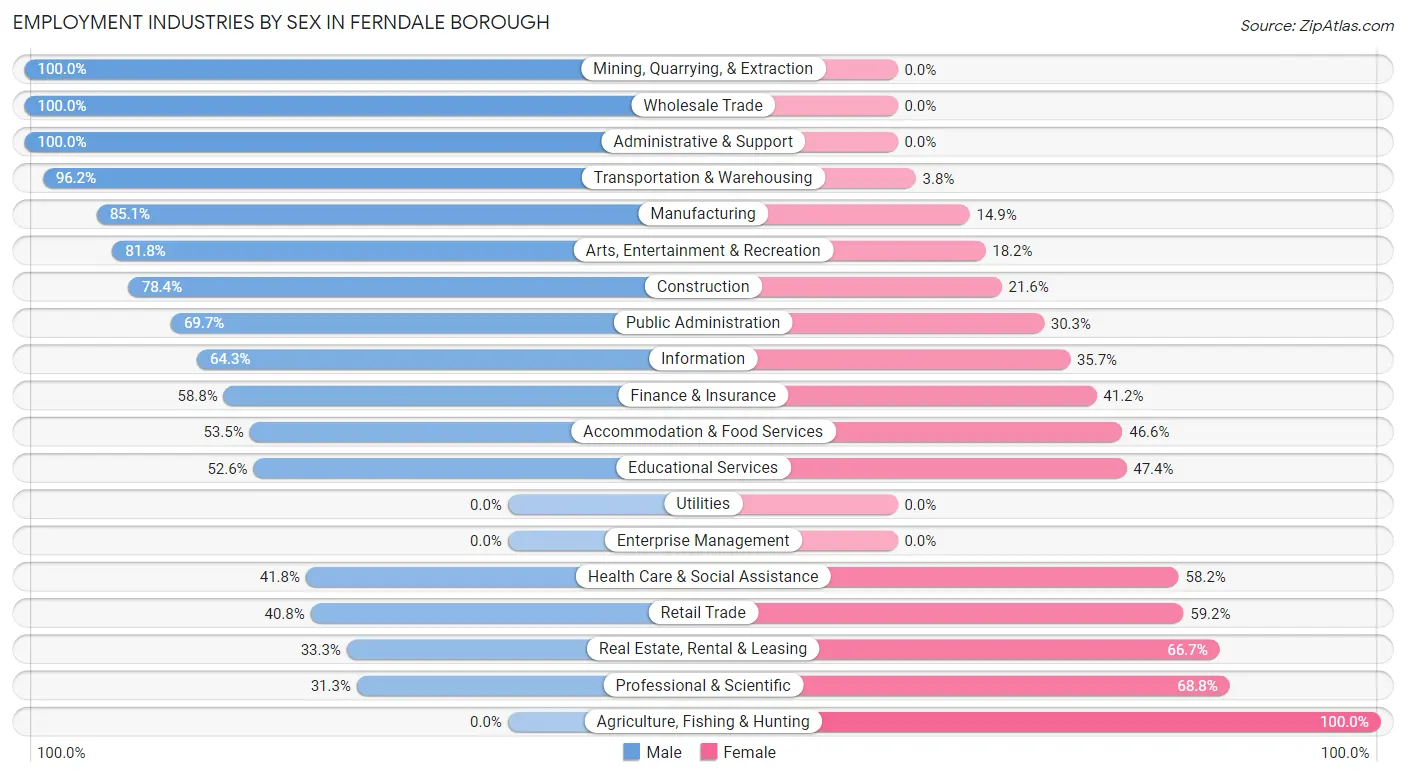
Employment Industries by Sex in Ferndale borough
The Ferndale borough industries that see more men than women are Mining, Quarrying, & Extraction (100.0%), Wholesale Trade (100.0%), and Administrative & Support (100.0%), whereas the industries that tend to have a higher number of women are Agriculture, Fishing & Hunting (100.0%), Professional & Scientific (68.8%), and Real Estate, Rental & Leasing (66.7%).
| Industry | Male | Female |
| Agriculture, Fishing & Hunting | 0 (0.0%) | 1 (100.0%) |
| Mining, Quarrying, & Extraction | 9 (100.0%) | 0 (0.0%) |
| Construction | 40 (78.4%) | 11 (21.6%) |
| Manufacturing | 57 (85.1%) | 10 (14.9%) |
| Wholesale Trade | 10 (100.0%) | 0 (0.0%) |
| Retail Trade | 40 (40.8%) | 58 (59.2%) |
| Transportation & Warehousing | 51 (96.2%) | 2 (3.8%) |
| Utilities | 0 (0.0%) | 0 (0.0%) |
| Information | 9 (64.3%) | 5 (35.7%) |
| Finance & Insurance | 10 (58.8%) | 7 (41.2%) |
| Real Estate, Rental & Leasing | 6 (33.3%) | 12 (66.7%) |
| Professional & Scientific | 5 (31.2%) | 11 (68.8%) |
| Enterprise Management | 0 (0.0%) | 0 (0.0%) |
| Administrative & Support | 16 (100.0%) | 0 (0.0%) |
| Educational Services | 20 (52.6%) | 18 (47.4%) |
| Health Care & Social Assistance | 84 (41.8%) | 117 (58.2%) |
| Arts, Entertainment & Recreation | 9 (81.8%) | 2 (18.2%) |
| Accommodation & Food Services | 62 (53.4%) | 54 (46.6%) |
| Public Administration | 23 (69.7%) | 10 (30.3%) |
| Total | 491 (59.7%) | 332 (40.3%) |
Education in Ferndale borough
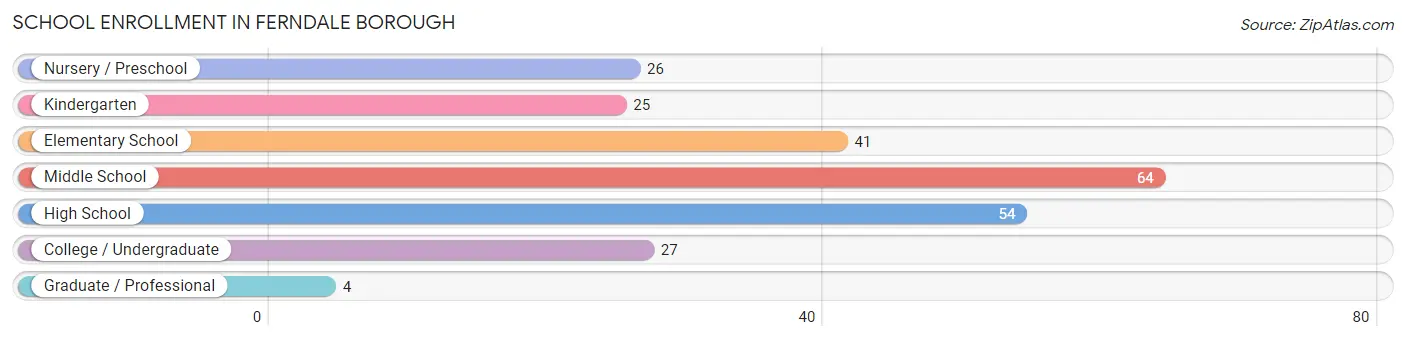
School Enrollment in Ferndale borough
The most common levels of schooling among the 241 students in Ferndale borough are middle school (64 | 26.6%), high school (54 | 22.4%), and elementary school (41 | 17.0%).
| School Level | # Students | % Students |
| Nursery / Preschool | 26 | 10.8% |
| Kindergarten | 25 | 10.4% |
| Elementary School | 41 | 17.0% |
| Middle School | 64 | 26.6% |
| High School | 54 | 22.4% |
| College / Undergraduate | 27 | 11.2% |
| Graduate / Professional | 4 | 1.7% |
| Total | 241 | 100.0% |
School Enrollment by Age by Funding Source in Ferndale borough
Out of a total of 241 students who are enrolled in schools in Ferndale borough, 34 (14.1%) attend a private institution, while the remaining 207 (85.9%) are enrolled in public schools. The age group of 35 years and over has the highest likelihood of being enrolled in private schools, with 12 (100.0% in the age bracket) enrolled. Conversely, the age group of 3 to 4 year olds has the lowest likelihood of being enrolled in a private school, with 14 (100.0% in the age bracket) attending a public institution.
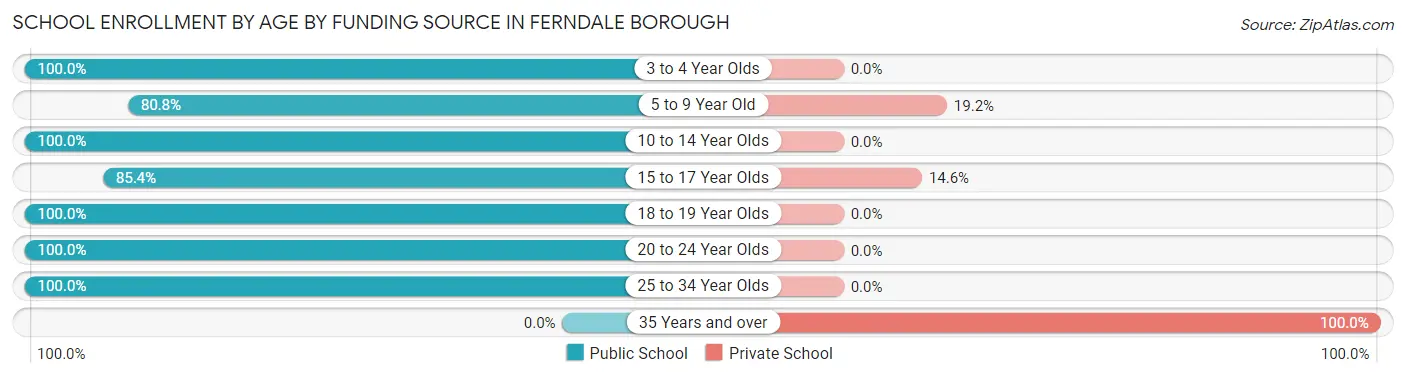
| Age Bracket | Public School | Private School |
| 3 to 4 Year Olds | 14 (100.0%) | 0 (0.0%) |
| 5 to 9 Year Old | 63 (80.8%) | 15 (19.2%) |
| 10 to 14 Year Olds | 67 (100.0%) | 0 (0.0%) |
| 15 to 17 Year Olds | 41 (85.4%) | 7 (14.6%) |
| 18 to 19 Year Olds | 7 (100.0%) | 0 (0.0%) |
| 20 to 24 Year Olds | 11 (100.0%) | 0 (0.0%) |
| 25 to 34 Year Olds | 4 (100.0%) | 0 (0.0%) |
| 35 Years and over | 0 (0.0%) | 12 (100.0%) |
| Total | 207 (85.9%) | 34 (14.1%) |
Educational Attainment by Field of Study in Ferndale borough
Science & technology (55 | 19.2%), business (53 | 18.5%), education (41 | 14.3%), engineering (22 | 7.7%), and psychology (21 | 7.3%) are the most common fields of study among 287 individuals in Ferndale borough who have obtained a bachelor's degree or higher.
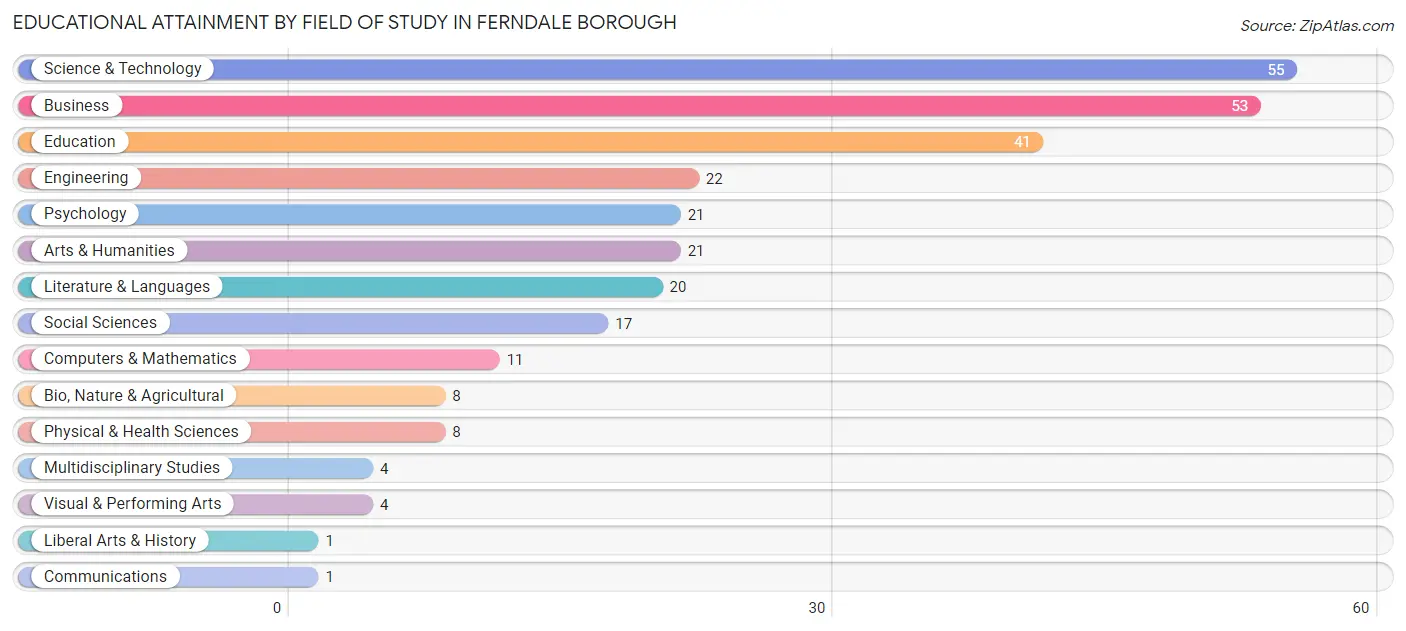
| Field of Study | # Graduates | % Graduates |
| Computers & Mathematics | 11 | 3.8% |
| Bio, Nature & Agricultural | 8 | 2.8% |
| Physical & Health Sciences | 8 | 2.8% |
| Psychology | 21 | 7.3% |
| Social Sciences | 17 | 5.9% |
| Engineering | 22 | 7.7% |
| Multidisciplinary Studies | 4 | 1.4% |
| Science & Technology | 55 | 19.2% |
| Business | 53 | 18.5% |
| Education | 41 | 14.3% |
| Literature & Languages | 20 | 7.0% |
| Liberal Arts & History | 1 | 0.4% |
| Visual & Performing Arts | 4 | 1.4% |
| Communications | 1 | 0.4% |
| Arts & Humanities | 21 | 7.3% |
| Total | 287 | 100.0% |
Transportation & Commute in Ferndale borough
Vehicle Availability by Sex in Ferndale borough
The most prevalent vehicle ownership categories in Ferndale borough are males with 2 vehicles (184, accounting for 37.8%) and females with 2 vehicles (123, making up 57.7%).
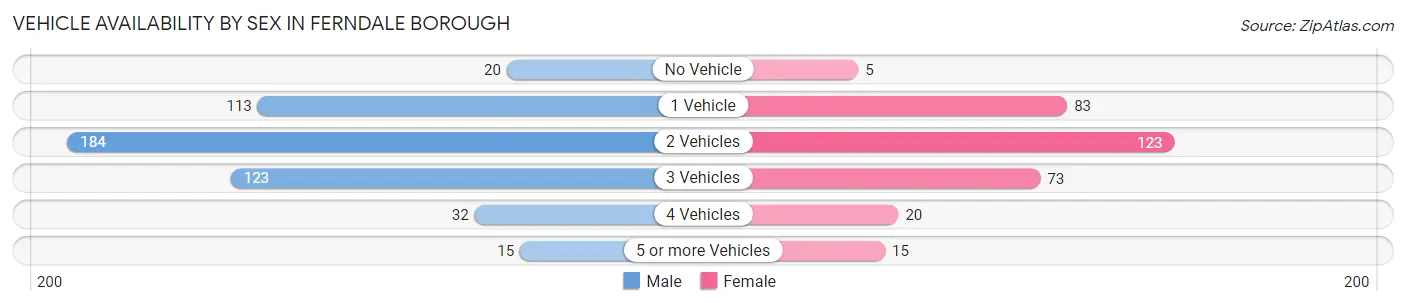
| Vehicles Available | Male | Female |
| No Vehicle | 20 (4.1%) | 5 (1.6%) |
| 1 Vehicle | 113 (23.2%) | 83 (26.0%) |
| 2 Vehicles | 184 (37.8%) | 123 (38.6%) |
| 3 Vehicles | 123 (25.3%) | 73 (22.9%) |
| 4 Vehicles | 32 (6.6%) | 20 (6.3%) |
| 5 or more Vehicles | 15 (3.1%) | 15 (4.7%) |
| Total | 487 (100.0%) | 319 (100.0%) |
Commute Time in Ferndale borough
The most frequently occuring commute durations in Ferndale borough are 10 to 14 minutes (176 commuters, 23.4%), 15 to 19 minutes (156 commuters, 20.8%), and 5 to 9 minutes (103 commuters, 13.7%).
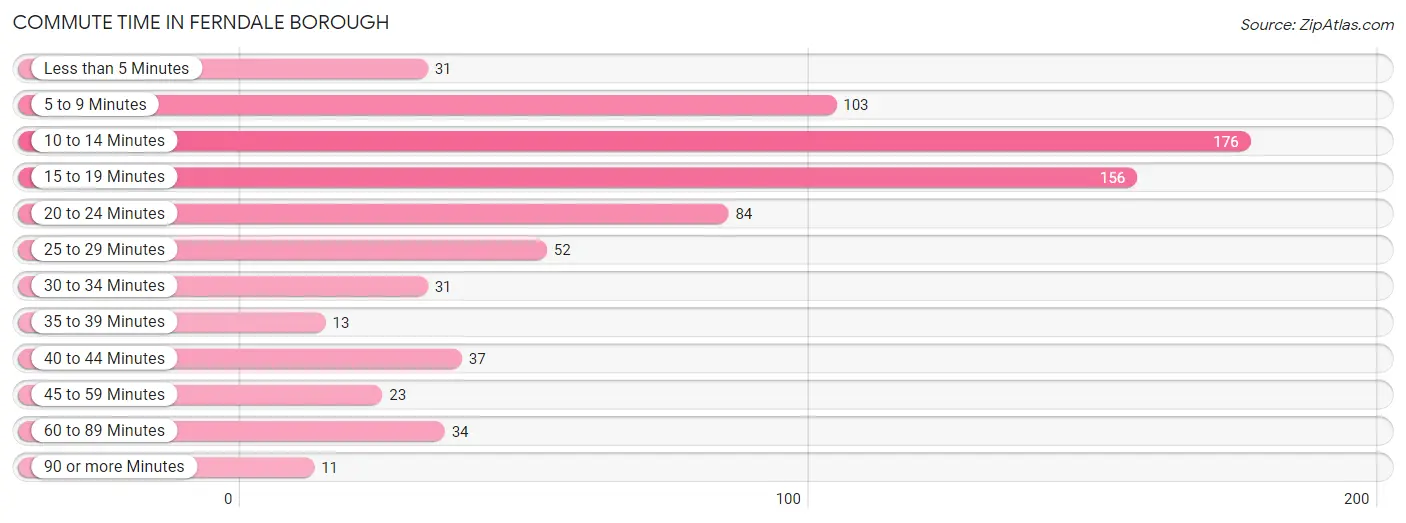
| Commute Time | # Commuters | % Commuters |
| Less than 5 Minutes | 31 | 4.1% |
| 5 to 9 Minutes | 103 | 13.7% |
| 10 to 14 Minutes | 176 | 23.4% |
| 15 to 19 Minutes | 156 | 20.8% |
| 20 to 24 Minutes | 84 | 11.2% |
| 25 to 29 Minutes | 52 | 6.9% |
| 30 to 34 Minutes | 31 | 4.1% |
| 35 to 39 Minutes | 13 | 1.7% |
| 40 to 44 Minutes | 37 | 4.9% |
| 45 to 59 Minutes | 23 | 3.1% |
| 60 to 89 Minutes | 34 | 4.5% |
| 90 or more Minutes | 11 | 1.5% |
Commute Time by Sex in Ferndale borough
The most common commute times in Ferndale borough are 15 to 19 minutes (87 commuters, 19.3%) for males and 10 to 14 minutes (90 commuters, 30.1%) for females.
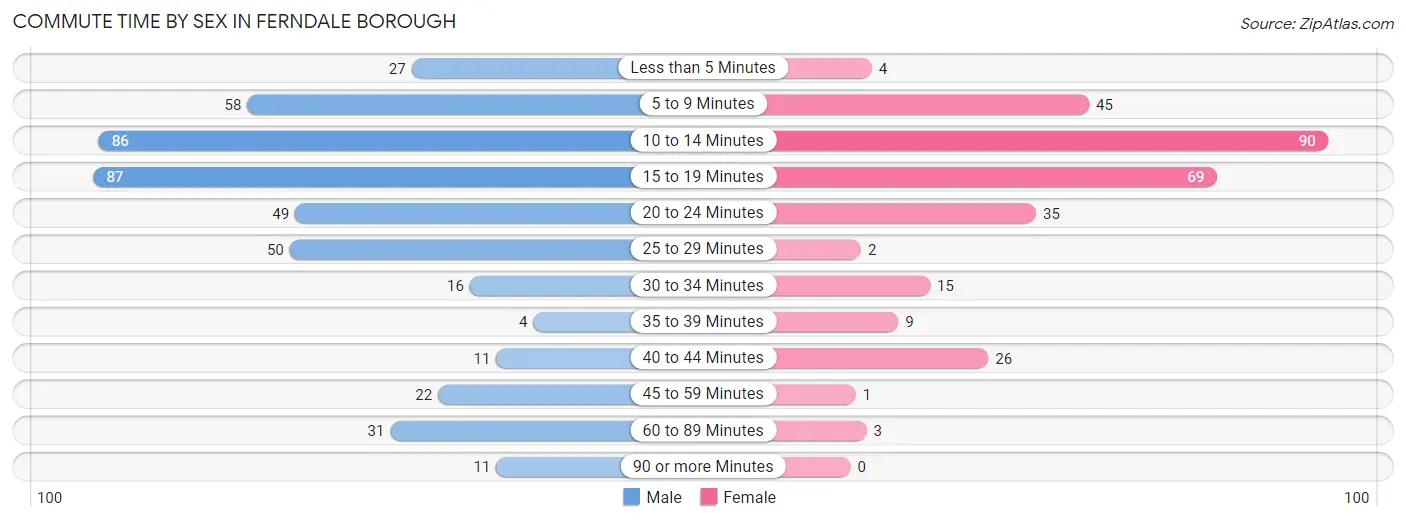
| Commute Time | Male | Female |
| Less than 5 Minutes | 27 (6.0%) | 4 (1.3%) |
| 5 to 9 Minutes | 58 (12.8%) | 45 (15.0%) |
| 10 to 14 Minutes | 86 (19.0%) | 90 (30.1%) |
| 15 to 19 Minutes | 87 (19.3%) | 69 (23.1%) |
| 20 to 24 Minutes | 49 (10.8%) | 35 (11.7%) |
| 25 to 29 Minutes | 50 (11.1%) | 2 (0.7%) |
| 30 to 34 Minutes | 16 (3.5%) | 15 (5.0%) |
| 35 to 39 Minutes | 4 (0.9%) | 9 (3.0%) |
| 40 to 44 Minutes | 11 (2.4%) | 26 (8.7%) |
| 45 to 59 Minutes | 22 (4.9%) | 1 (0.3%) |
| 60 to 89 Minutes | 31 (6.9%) | 3 (1.0%) |
| 90 or more Minutes | 11 (2.4%) | 0 (0.0%) |
Time of Departure to Work by Sex in Ferndale borough
The most frequent times of departure to work in Ferndale borough are 9:00 AM to 9:59 AM (96, 21.2%) for males and 7:00 AM to 7:29 AM (79, 26.4%) for females.
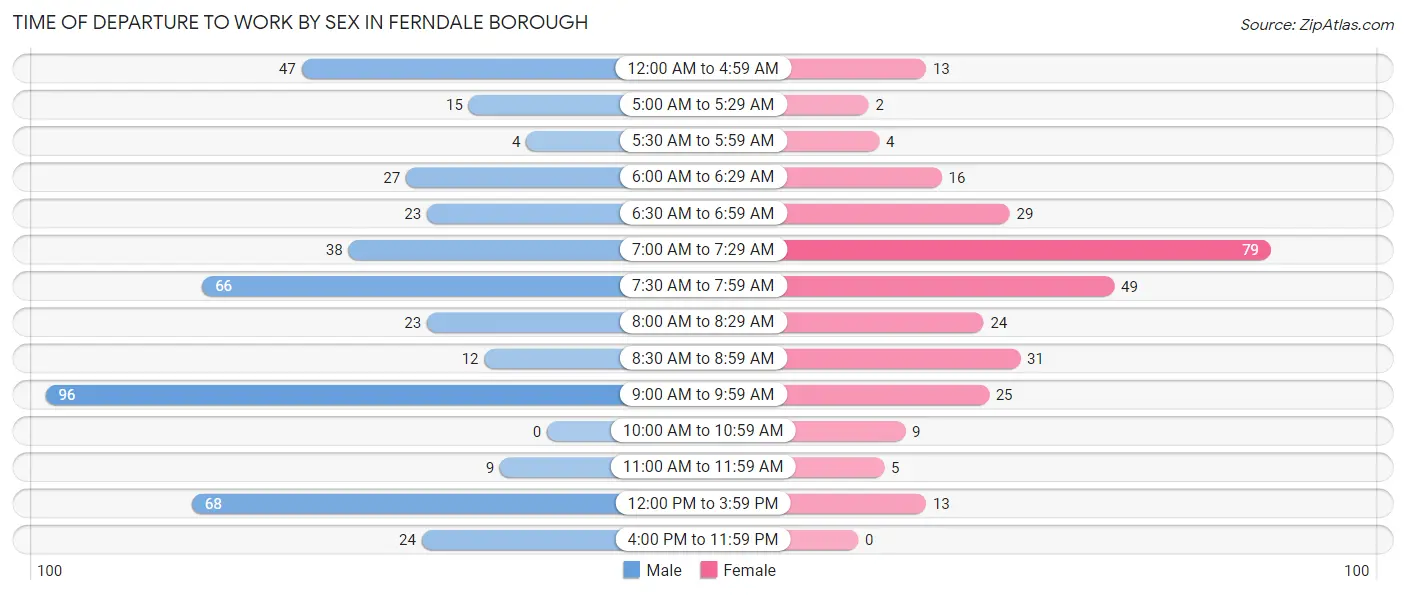
| Time of Departure | Male | Female |
| 12:00 AM to 4:59 AM | 47 (10.4%) | 13 (4.3%) |
| 5:00 AM to 5:29 AM | 15 (3.3%) | 2 (0.7%) |
| 5:30 AM to 5:59 AM | 4 (0.9%) | 4 (1.3%) |
| 6:00 AM to 6:29 AM | 27 (6.0%) | 16 (5.3%) |
| 6:30 AM to 6:59 AM | 23 (5.1%) | 29 (9.7%) |
| 7:00 AM to 7:29 AM | 38 (8.4%) | 79 (26.4%) |
| 7:30 AM to 7:59 AM | 66 (14.6%) | 49 (16.4%) |
| 8:00 AM to 8:29 AM | 23 (5.1%) | 24 (8.0%) |
| 8:30 AM to 8:59 AM | 12 (2.6%) | 31 (10.4%) |
| 9:00 AM to 9:59 AM | 96 (21.2%) | 25 (8.4%) |
| 10:00 AM to 10:59 AM | 0 (0.0%) | 9 (3.0%) |
| 11:00 AM to 11:59 AM | 9 (2.0%) | 5 (1.7%) |
| 12:00 PM to 3:59 PM | 68 (15.0%) | 13 (4.3%) |
| 4:00 PM to 11:59 PM | 24 (5.3%) | 0 (0.0%) |
| Total | 452 (100.0%) | 299 (100.0%) |
Housing Occupancy in Ferndale borough
Occupancy by Ownership in Ferndale borough
Of the total 694 dwellings in Ferndale borough, owner-occupied units account for 447 (64.4%), while renter-occupied units make up 247 (35.6%).
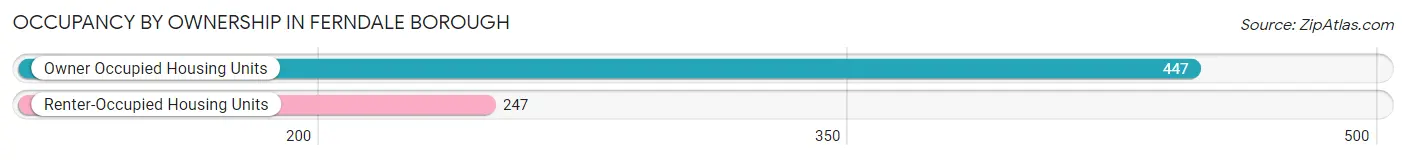
| Occupancy | # Housing Units | % Housing Units |
| Owner Occupied Housing Units | 447 | 64.4% |
| Renter-Occupied Housing Units | 247 | 35.6% |
| Total Occupied Housing Units | 694 | 100.0% |
Occupancy by Household Size in Ferndale borough
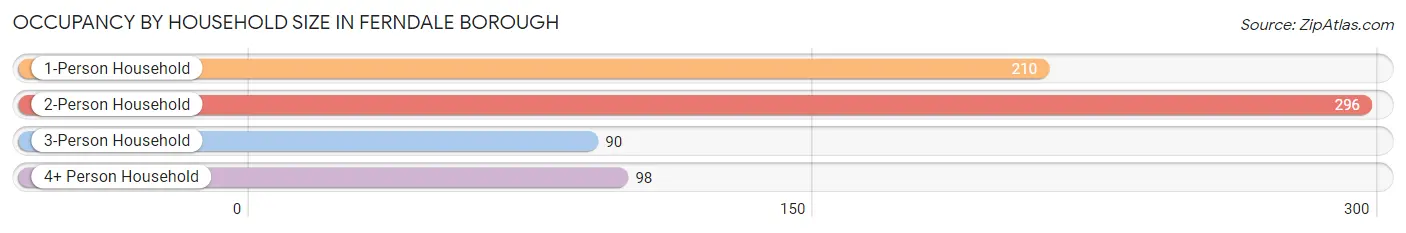
| Household Size | # Housing Units | % Housing Units |
| 1-Person Household | 210 | 30.3% |
| 2-Person Household | 296 | 42.6% |
| 3-Person Household | 90 | 13.0% |
| 4+ Person Household | 98 | 14.1% |
| Total Housing Units | 694 | 100.0% |
Occupancy by Ownership by Household Size in Ferndale borough
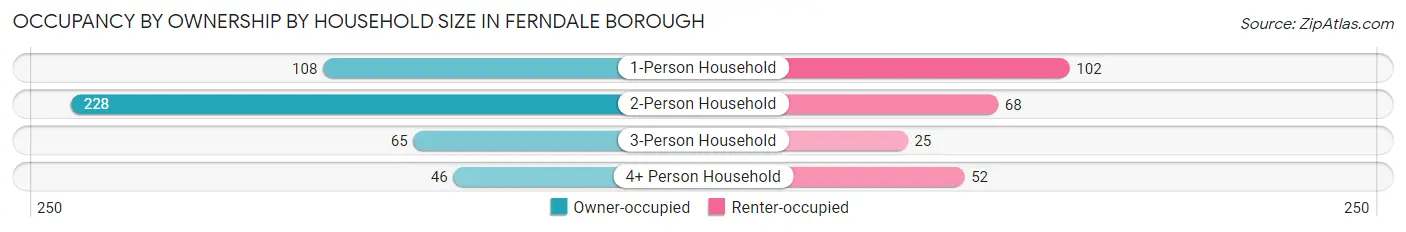
| Household Size | Owner-occupied | Renter-occupied |
| 1-Person Household | 108 (51.4%) | 102 (48.6%) |
| 2-Person Household | 228 (77.0%) | 68 (23.0%) |
| 3-Person Household | 65 (72.2%) | 25 (27.8%) |
| 4+ Person Household | 46 (46.9%) | 52 (53.1%) |
| Total Housing Units | 447 (64.4%) | 247 (35.6%) |
Occupancy by Educational Attainment in Ferndale borough
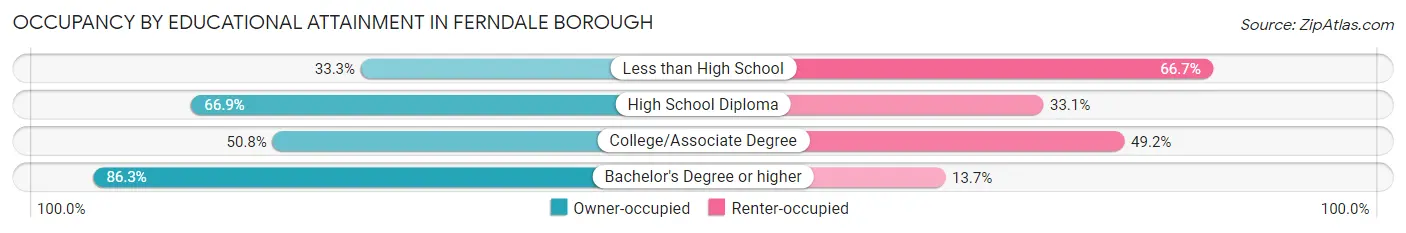
| Household Size | Owner-occupied | Renter-occupied |
| Less than High School | 10 (33.3%) | 20 (66.7%) |
| High School Diploma | 176 (66.9%) | 87 (33.1%) |
| College/Associate Degree | 122 (50.8%) | 118 (49.2%) |
| Bachelor's Degree or higher | 139 (86.3%) | 22 (13.7%) |
Occupancy by Age of Householder in Ferndale borough
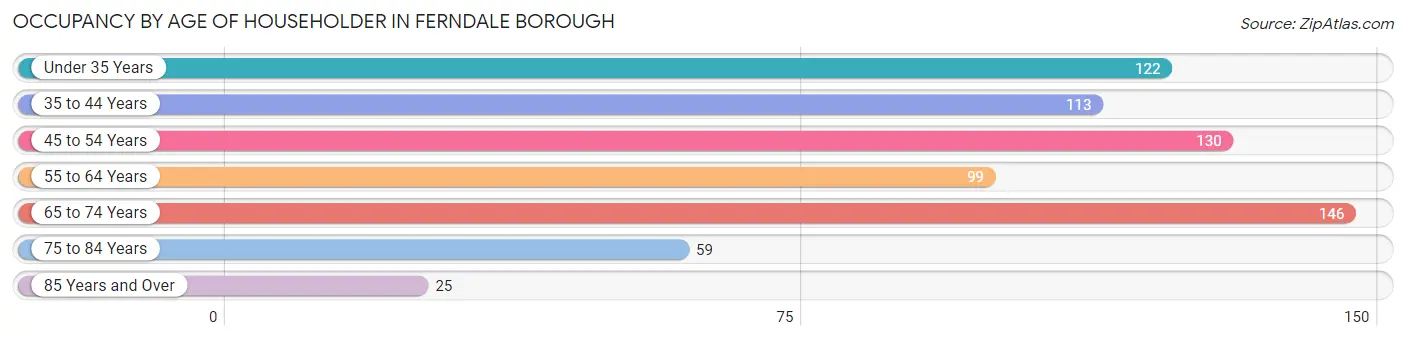
| Age Bracket | # Households | % Households |
| Under 35 Years | 122 | 17.6% |
| 35 to 44 Years | 113 | 16.3% |
| 45 to 54 Years | 130 | 18.7% |
| 55 to 64 Years | 99 | 14.3% |
| 65 to 74 Years | 146 | 21.0% |
| 75 to 84 Years | 59 | 8.5% |
| 85 Years and Over | 25 | 3.6% |
| Total | 694 | 100.0% |
Housing Finances in Ferndale borough
Median Income by Occupancy in Ferndale borough
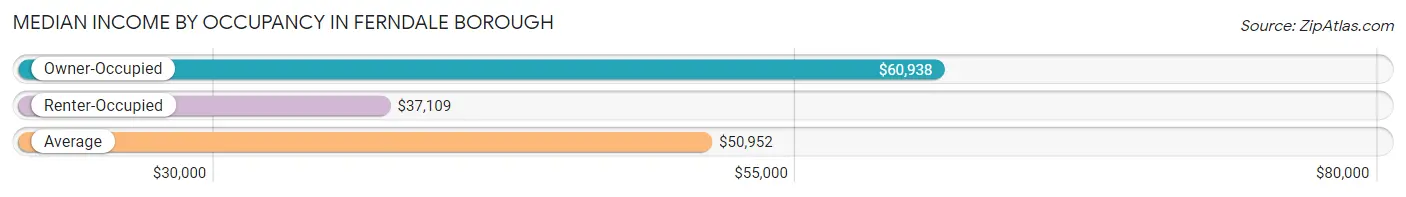
| Occupancy Type | # Households | Median Income |
| Owner-Occupied | 447 (64.4%) | $60,938 |
| Renter-Occupied | 247 (35.6%) | $37,109 |
| Average | 694 (100.0%) | $50,952 |
Occupancy by Householder Income Bracket in Ferndale borough
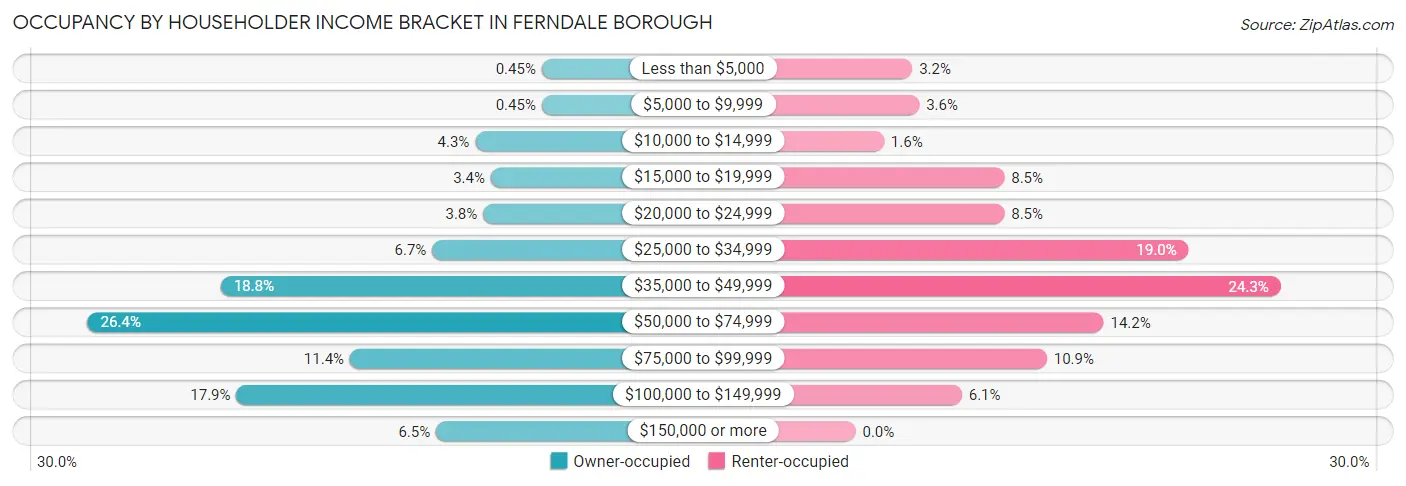
| Income Bracket | Owner-occupied | Renter-occupied |
| Less than $5,000 | 2 (0.4%) | 8 (3.2%) |
| $5,000 to $9,999 | 2 (0.4%) | 9 (3.6%) |
| $10,000 to $14,999 | 19 (4.3%) | 4 (1.6%) |
| $15,000 to $19,999 | 15 (3.4%) | 21 (8.5%) |
| $20,000 to $24,999 | 17 (3.8%) | 21 (8.5%) |
| $25,000 to $34,999 | 30 (6.7%) | 47 (19.0%) |
| $35,000 to $49,999 | 84 (18.8%) | 60 (24.3%) |
| $50,000 to $74,999 | 118 (26.4%) | 35 (14.2%) |
| $75,000 to $99,999 | 51 (11.4%) | 27 (10.9%) |
| $100,000 to $149,999 | 80 (17.9%) | 15 (6.1%) |
| $150,000 or more | 29 (6.5%) | 0 (0.0%) |
| Total | 447 (100.0%) | 247 (100.0%) |
Monthly Housing Cost Tiers in Ferndale borough
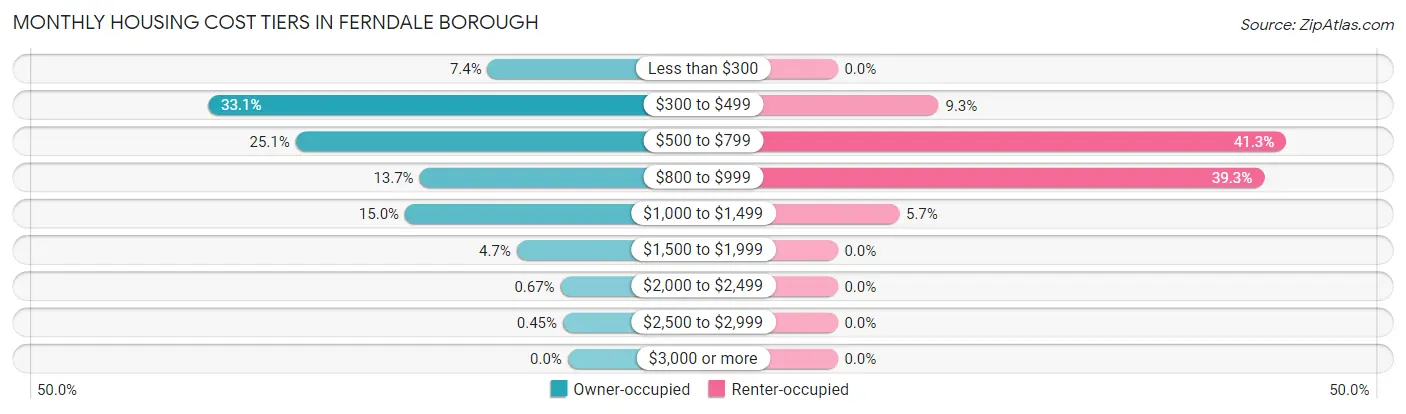
| Monthly Cost | Owner-occupied | Renter-occupied |
| Less than $300 | 33 (7.4%) | 0 (0.0%) |
| $300 to $499 | 148 (33.1%) | 23 (9.3%) |
| $500 to $799 | 112 (25.1%) | 102 (41.3%) |
| $800 to $999 | 61 (13.7%) | 97 (39.3%) |
| $1,000 to $1,499 | 67 (15.0%) | 14 (5.7%) |
| $1,500 to $1,999 | 21 (4.7%) | 0 (0.0%) |
| $2,000 to $2,499 | 3 (0.7%) | 0 (0.0%) |
| $2,500 to $2,999 | 2 (0.4%) | 0 (0.0%) |
| $3,000 or more | 0 (0.0%) | 0 (0.0%) |
| Total | 447 (100.0%) | 247 (100.0%) |
Physical Housing Characteristics in Ferndale borough
Housing Structures in Ferndale borough
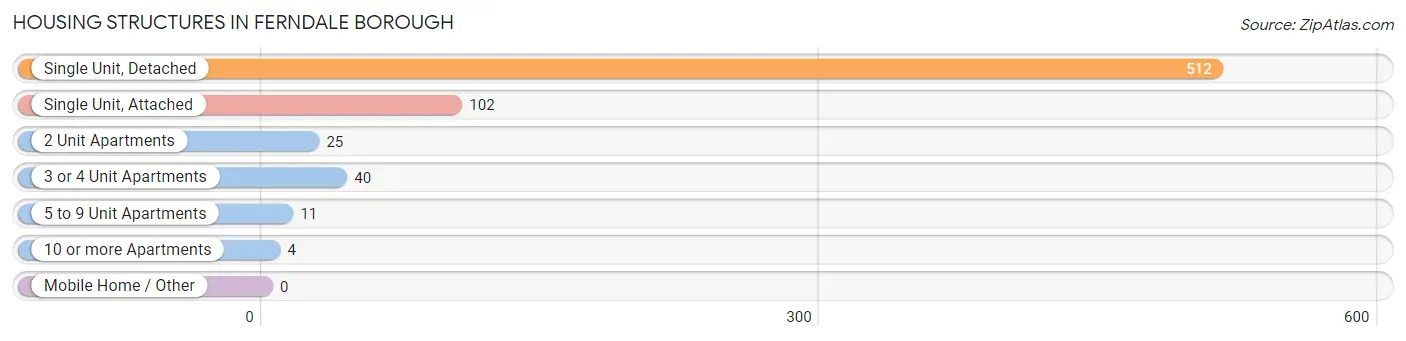
| Structure Type | # Housing Units | % Housing Units |
| Single Unit, Detached | 512 | 73.8% |
| Single Unit, Attached | 102 | 14.7% |
| 2 Unit Apartments | 25 | 3.6% |
| 3 or 4 Unit Apartments | 40 | 5.8% |
| 5 to 9 Unit Apartments | 11 | 1.6% |
| 10 or more Apartments | 4 | 0.6% |
| Mobile Home / Other | 0 | 0.0% |
| Total | 694 | 100.0% |
Housing Structures by Occupancy in Ferndale borough
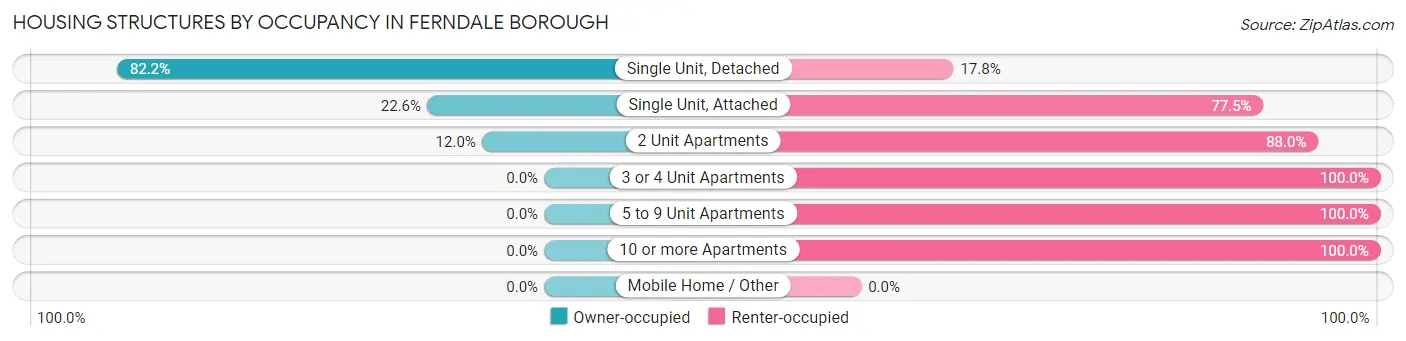
| Structure Type | Owner-occupied | Renter-occupied |
| Single Unit, Detached | 421 (82.2%) | 91 (17.8%) |
| Single Unit, Attached | 23 (22.6%) | 79 (77.4%) |
| 2 Unit Apartments | 3 (12.0%) | 22 (88.0%) |
| 3 or 4 Unit Apartments | 0 (0.0%) | 40 (100.0%) |
| 5 to 9 Unit Apartments | 0 (0.0%) | 11 (100.0%) |
| 10 or more Apartments | 0 (0.0%) | 4 (100.0%) |
| Mobile Home / Other | 0 (0.0%) | 0 (0.0%) |
| Total | 447 (64.4%) | 247 (35.6%) |
Housing Structures by Number of Rooms in Ferndale borough
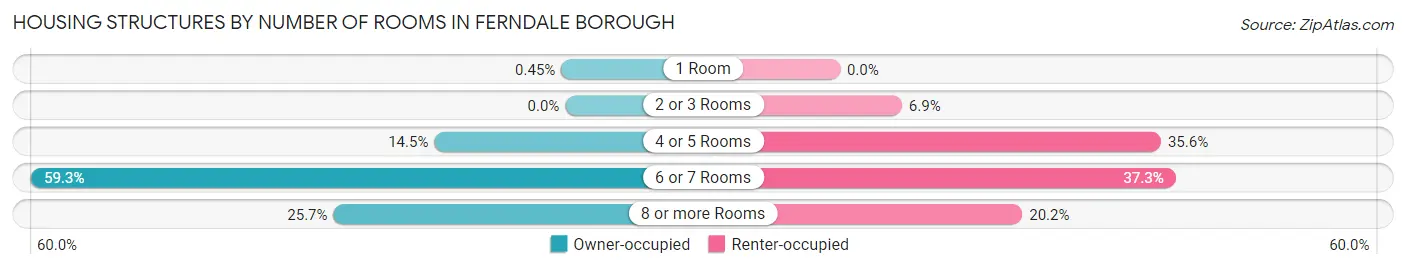
| Number of Rooms | Owner-occupied | Renter-occupied |
| 1 Room | 2 (0.4%) | 0 (0.0%) |
| 2 or 3 Rooms | 0 (0.0%) | 17 (6.9%) |
| 4 or 5 Rooms | 65 (14.5%) | 88 (35.6%) |
| 6 or 7 Rooms | 265 (59.3%) | 92 (37.2%) |
| 8 or more Rooms | 115 (25.7%) | 50 (20.2%) |
| Total | 447 (100.0%) | 247 (100.0%) |
Housing Structure by Heating Type in Ferndale borough
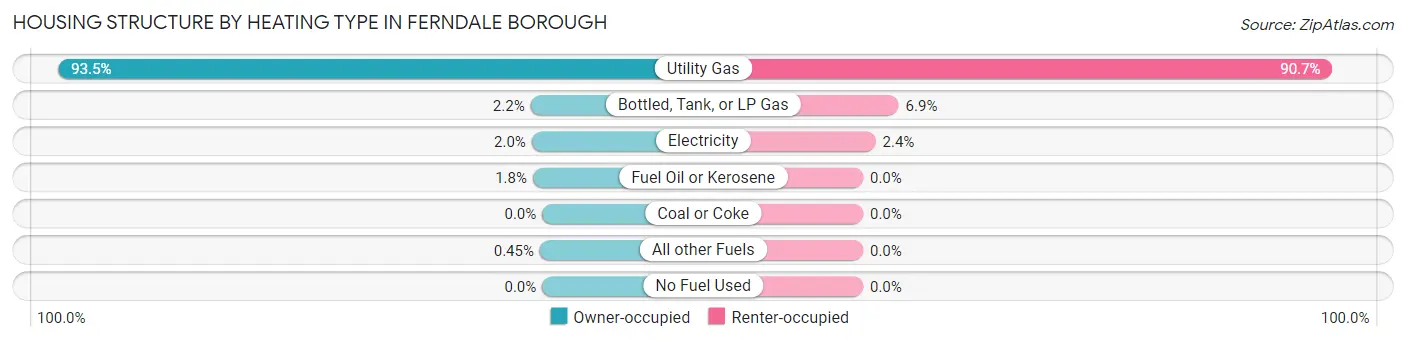
| Heating Type | Owner-occupied | Renter-occupied |
| Utility Gas | 418 (93.5%) | 224 (90.7%) |
| Bottled, Tank, or LP Gas | 10 (2.2%) | 17 (6.9%) |
| Electricity | 9 (2.0%) | 6 (2.4%) |
| Fuel Oil or Kerosene | 8 (1.8%) | 0 (0.0%) |
| Coal or Coke | 0 (0.0%) | 0 (0.0%) |
| All other Fuels | 2 (0.4%) | 0 (0.0%) |
| No Fuel Used | 0 (0.0%) | 0 (0.0%) |
| Total | 447 (100.0%) | 247 (100.0%) |
Household Vehicle Usage in Ferndale borough
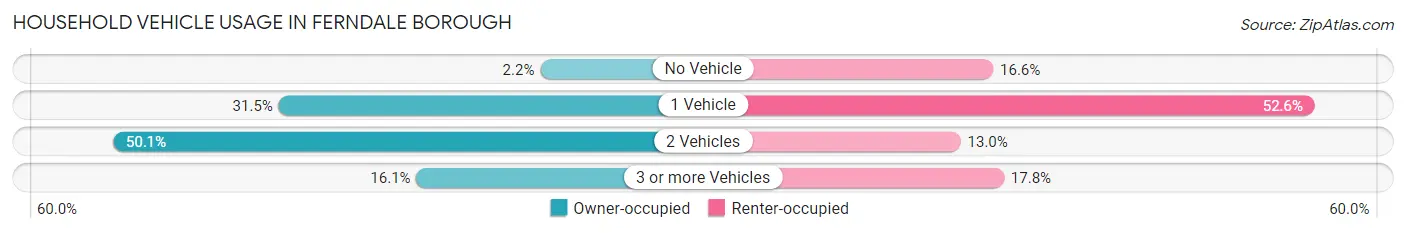
| Vehicles per Household | Owner-occupied | Renter-occupied |
| No Vehicle | 10 (2.2%) | 41 (16.6%) |
| 1 Vehicle | 141 (31.5%) | 130 (52.6%) |
| 2 Vehicles | 224 (50.1%) | 32 (13.0%) |
| 3 or more Vehicles | 72 (16.1%) | 44 (17.8%) |
| Total | 447 (100.0%) | 247 (100.0%) |
Real Estate & Mortgages in Ferndale borough
Real Estate and Mortgage Overview in Ferndale borough
| Characteristic | Without Mortgage | With Mortgage |
| Housing Units | 230 | 217 |
| Median Property Value | $77,500 | $79,800 |
| Median Household Income | $53,571 | $13 |
| Monthly Housing Costs | $433 | $0 |
| Real Estate Taxes | $1,473 | $13 |
Property Value by Mortgage Status in Ferndale borough
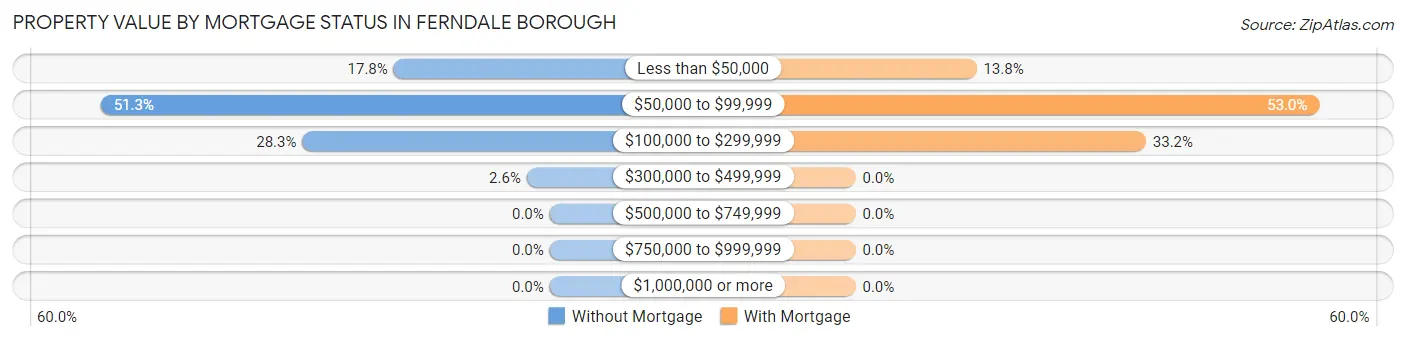
| Property Value | Without Mortgage | With Mortgage |
| Less than $50,000 | 41 (17.8%) | 30 (13.8%) |
| $50,000 to $99,999 | 118 (51.3%) | 115 (53.0%) |
| $100,000 to $299,999 | 65 (28.3%) | 72 (33.2%) |
| $300,000 to $499,999 | 6 (2.6%) | 0 (0.0%) |
| $500,000 to $749,999 | 0 (0.0%) | 0 (0.0%) |
| $750,000 to $999,999 | 0 (0.0%) | 0 (0.0%) |
| $1,000,000 or more | 0 (0.0%) | 0 (0.0%) |
| Total | 230 (100.0%) | 217 (100.0%) |
Household Income by Mortgage Status in Ferndale borough
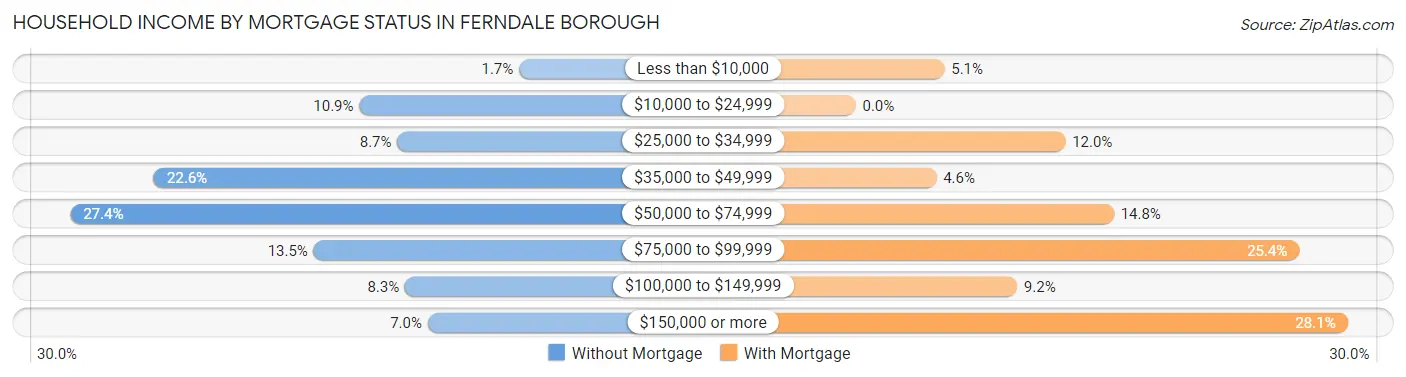
| Household Income | Without Mortgage | With Mortgage |
| Less than $10,000 | 4 (1.7%) | 11 (5.1%) |
| $10,000 to $24,999 | 25 (10.9%) | 0 (0.0%) |
| $25,000 to $34,999 | 20 (8.7%) | 26 (12.0%) |
| $35,000 to $49,999 | 52 (22.6%) | 10 (4.6%) |
| $50,000 to $74,999 | 63 (27.4%) | 32 (14.7%) |
| $75,000 to $99,999 | 31 (13.5%) | 55 (25.4%) |
| $100,000 to $149,999 | 19 (8.3%) | 20 (9.2%) |
| $150,000 or more | 16 (7.0%) | 61 (28.1%) |
| Total | 230 (100.0%) | 217 (100.0%) |
Property Value to Household Income Ratio in Ferndale borough
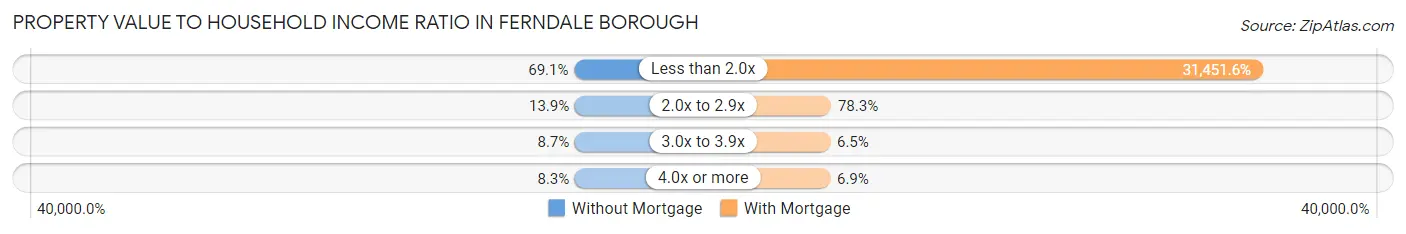
| Value-to-Income Ratio | Without Mortgage | With Mortgage |
| Less than 2.0x | 159 (69.1%) | 68,250 (31,451.6%) |
| 2.0x to 2.9x | 32 (13.9%) | 170 (78.3%) |
| 3.0x to 3.9x | 20 (8.7%) | 14 (6.5%) |
| 4.0x or more | 19 (8.3%) | 15 (6.9%) |
| Total | 230 (100.0%) | 217 (100.0%) |
Real Estate Taxes by Mortgage Status in Ferndale borough
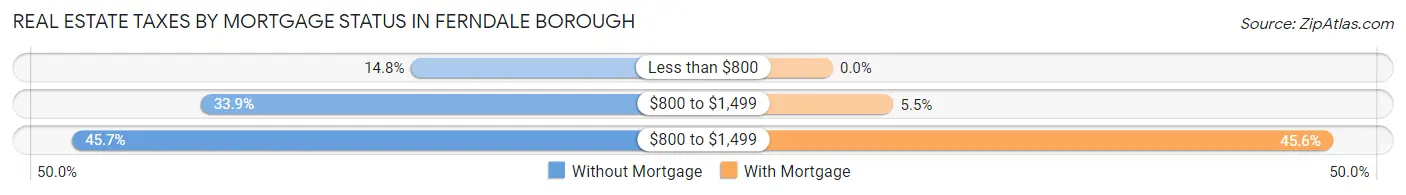
| Property Taxes | Without Mortgage | With Mortgage |
| Less than $800 | 34 (14.8%) | 0 (0.0%) |
| $800 to $1,499 | 78 (33.9%) | 12 (5.5%) |
| $800 to $1,499 | 105 (45.7%) | 99 (45.6%) |
| Total | 230 (100.0%) | 217 (100.0%) |
Health & Disability in Ferndale borough
Health Insurance Coverage by Age in Ferndale borough
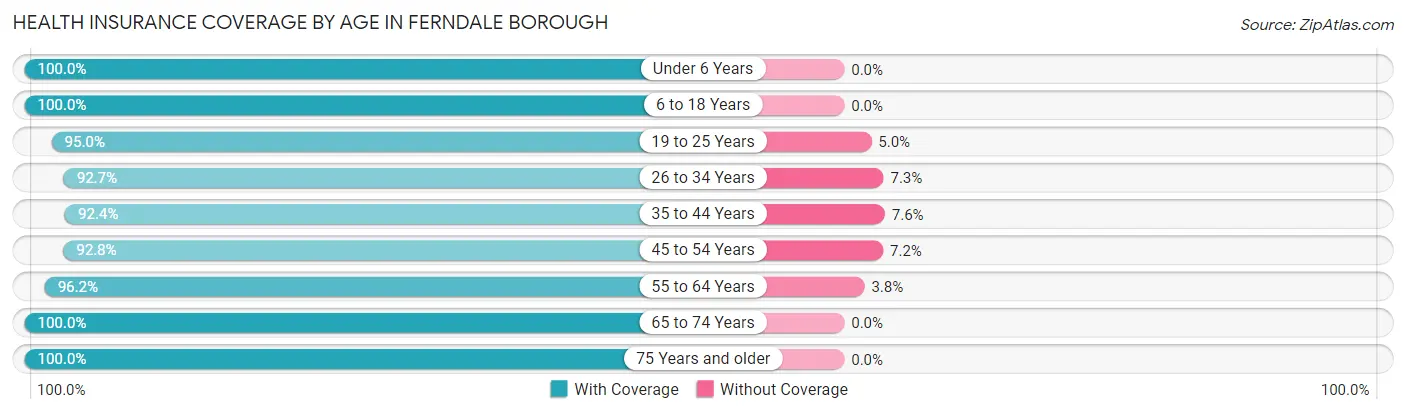
| Age Bracket | With Coverage | Without Coverage |
| Under 6 Years | 122 (100.0%) | 0 (0.0%) |
| 6 to 18 Years | 191 (100.0%) | 0 (0.0%) |
| 19 to 25 Years | 132 (95.0%) | 7 (5.0%) |
| 26 to 34 Years | 190 (92.7%) | 15 (7.3%) |
| 35 to 44 Years | 159 (92.4%) | 13 (7.6%) |
| 45 to 54 Years | 218 (92.8%) | 17 (7.2%) |
| 55 to 64 Years | 179 (96.2%) | 7 (3.8%) |
| 65 to 74 Years | 217 (100.0%) | 0 (0.0%) |
| 75 Years and older | 99 (100.0%) | 0 (0.0%) |
| Total | 1,507 (96.2%) | 59 (3.8%) |
Health Insurance Coverage by Citizenship Status in Ferndale borough
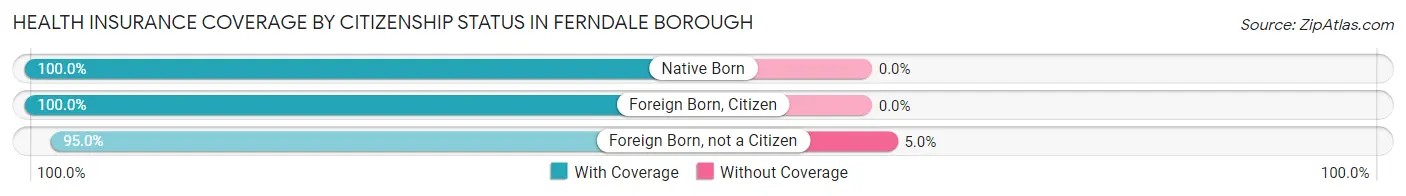
| Citizenship Status | With Coverage | Without Coverage |
| Native Born | 122 (100.0%) | 0 (0.0%) |
| Foreign Born, Citizen | 191 (100.0%) | 0 (0.0%) |
| Foreign Born, not a Citizen | 132 (95.0%) | 7 (5.0%) |
Health Insurance Coverage by Household Income in Ferndale borough
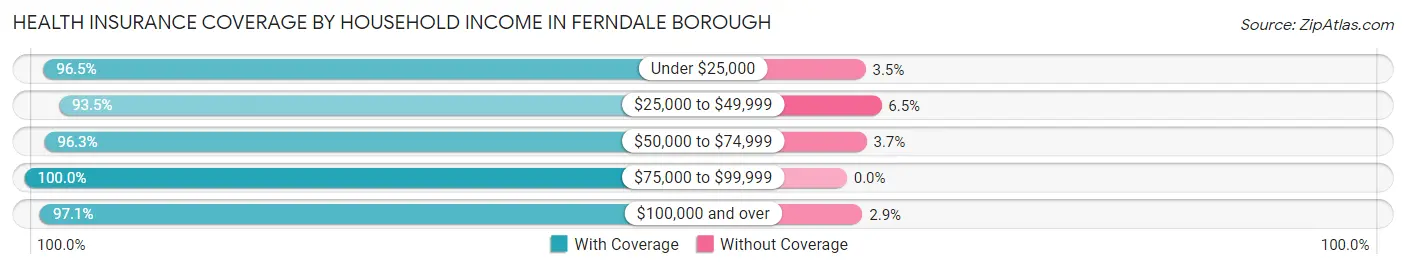
| Household Income | With Coverage | Without Coverage |
| Under $25,000 | 165 (96.5%) | 6 (3.5%) |
| $25,000 to $49,999 | 404 (93.5%) | 28 (6.5%) |
| $50,000 to $74,999 | 338 (96.3%) | 13 (3.7%) |
| $75,000 to $99,999 | 200 (100.0%) | 0 (0.0%) |
| $100,000 and over | 400 (97.1%) | 12 (2.9%) |
Public vs Private Health Insurance Coverage by Age in Ferndale borough
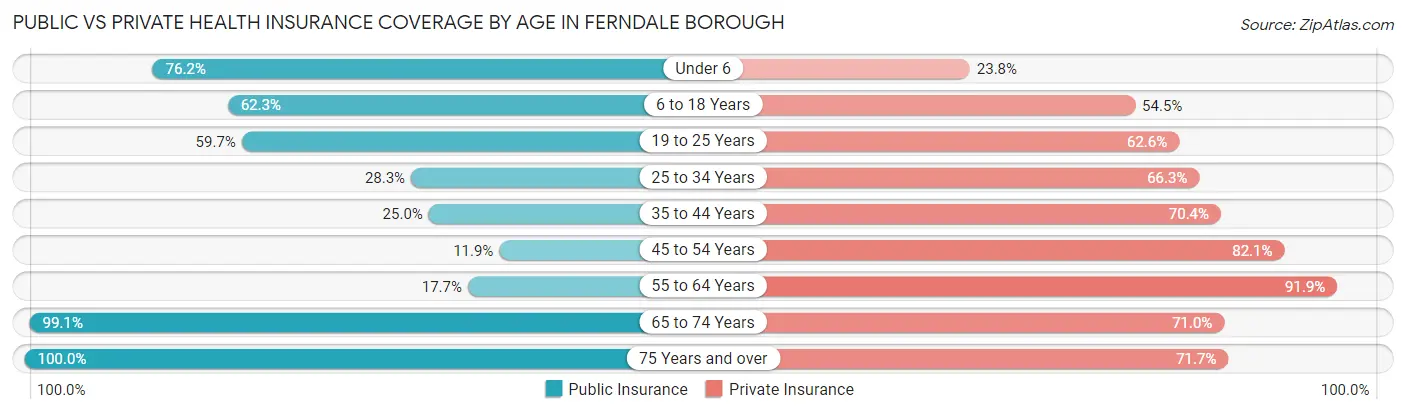
| Age Bracket | Public Insurance | Private Insurance |
| Under 6 | 93 (76.2%) | 29 (23.8%) |
| 6 to 18 Years | 119 (62.3%) | 104 (54.4%) |
| 19 to 25 Years | 83 (59.7%) | 87 (62.6%) |
| 25 to 34 Years | 58 (28.3%) | 136 (66.3%) |
| 35 to 44 Years | 43 (25.0%) | 121 (70.4%) |
| 45 to 54 Years | 28 (11.9%) | 193 (82.1%) |
| 55 to 64 Years | 33 (17.7%) | 171 (91.9%) |
| 65 to 74 Years | 215 (99.1%) | 154 (71.0%) |
| 75 Years and over | 99 (100.0%) | 71 (71.7%) |
| Total | 771 (49.2%) | 1,066 (68.1%) |
Disability Status by Sex by Age in Ferndale borough
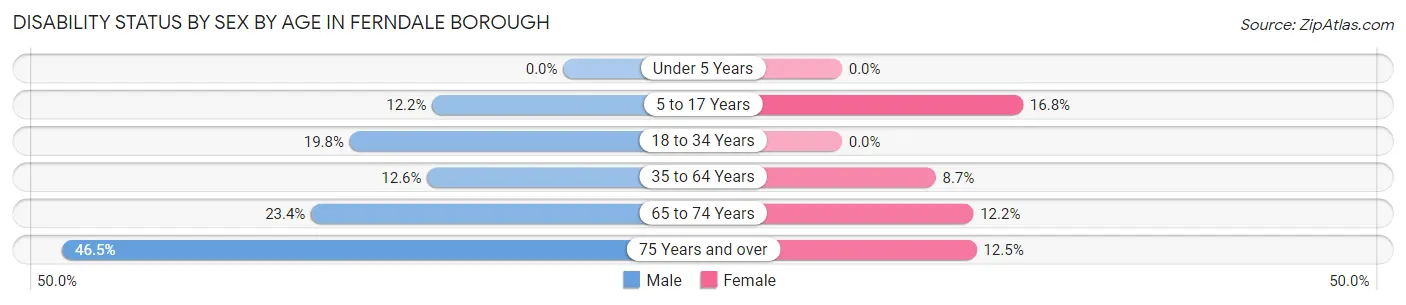
| Age Bracket | Male | Female |
| Under 5 Years | 0 (0.0%) | 0 (0.0%) |
| 5 to 17 Years | 9 (12.2%) | 20 (16.8%) |
| 18 to 34 Years | 43 (19.8%) | 0 (0.0%) |
| 35 to 64 Years | 40 (12.6%) | 24 (8.7%) |
| 65 to 74 Years | 22 (23.4%) | 15 (12.2%) |
| 75 Years and over | 20 (46.5%) | 7 (12.5%) |
Disability Class by Sex by Age in Ferndale borough
Disability Class: Hearing Difficulty
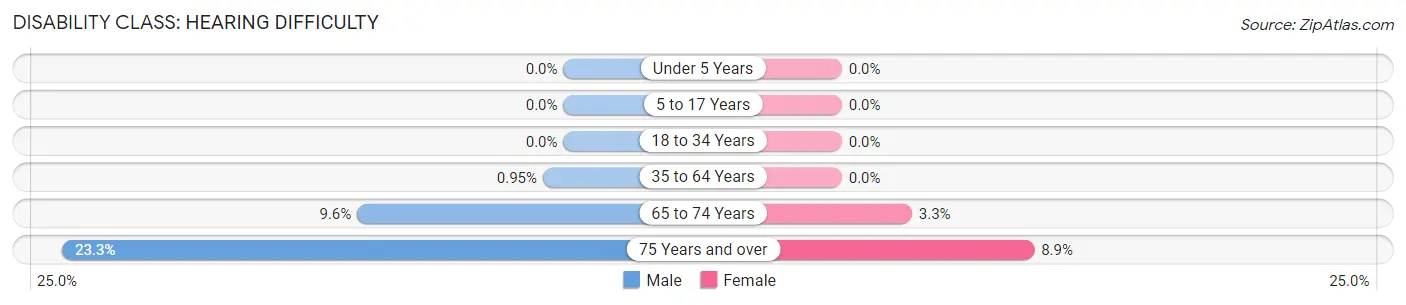
| Age Bracket | Male | Female |
| Under 5 Years | 0 (0.0%) | 0 (0.0%) |
| 5 to 17 Years | 0 (0.0%) | 0 (0.0%) |
| 18 to 34 Years | 0 (0.0%) | 0 (0.0%) |
| 35 to 64 Years | 3 (0.9%) | 0 (0.0%) |
| 65 to 74 Years | 9 (9.6%) | 4 (3.3%) |
| 75 Years and over | 10 (23.3%) | 5 (8.9%) |
Disability Class: Vision Difficulty
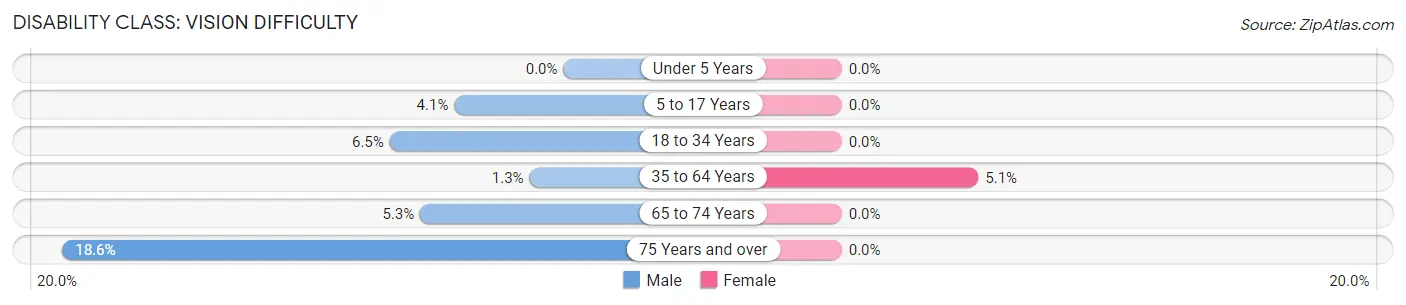
| Age Bracket | Male | Female |
| Under 5 Years | 0 (0.0%) | 0 (0.0%) |
| 5 to 17 Years | 3 (4.1%) | 0 (0.0%) |
| 18 to 34 Years | 14 (6.5%) | 0 (0.0%) |
| 35 to 64 Years | 4 (1.3%) | 14 (5.1%) |
| 65 to 74 Years | 5 (5.3%) | 0 (0.0%) |
| 75 Years and over | 8 (18.6%) | 0 (0.0%) |
Disability Class: Cognitive Difficulty
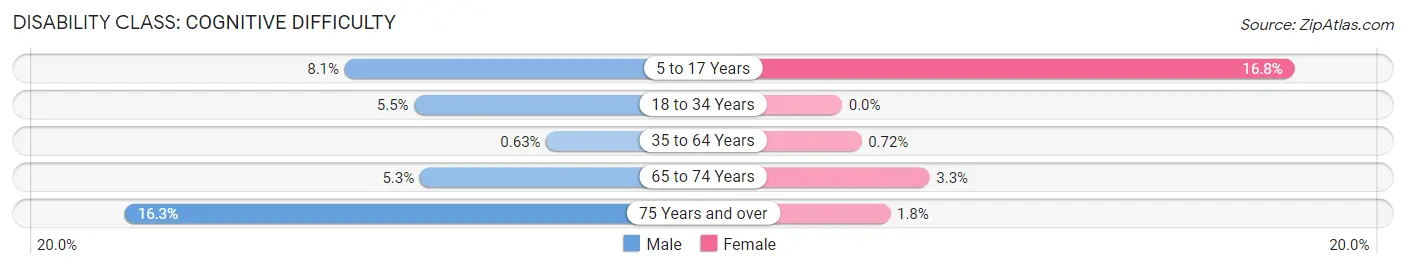
| Age Bracket | Male | Female |
| 5 to 17 Years | 6 (8.1%) | 20 (16.8%) |
| 18 to 34 Years | 12 (5.5%) | 0 (0.0%) |
| 35 to 64 Years | 2 (0.6%) | 2 (0.7%) |
| 65 to 74 Years | 5 (5.3%) | 4 (3.3%) |
| 75 Years and over | 7 (16.3%) | 1 (1.8%) |
Disability Class: Ambulatory Difficulty
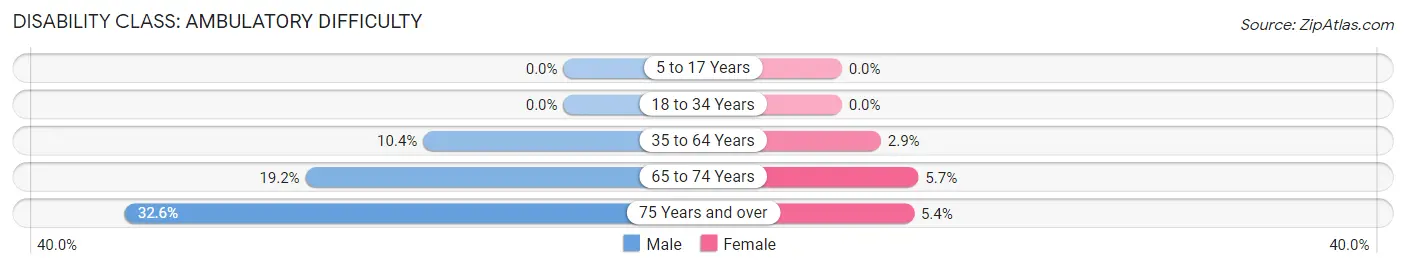
| Age Bracket | Male | Female |
| 5 to 17 Years | 0 (0.0%) | 0 (0.0%) |
| 18 to 34 Years | 0 (0.0%) | 0 (0.0%) |
| 35 to 64 Years | 33 (10.4%) | 8 (2.9%) |
| 65 to 74 Years | 18 (19.2%) | 7 (5.7%) |
| 75 Years and over | 14 (32.6%) | 3 (5.4%) |
Disability Class: Self-Care Difficulty
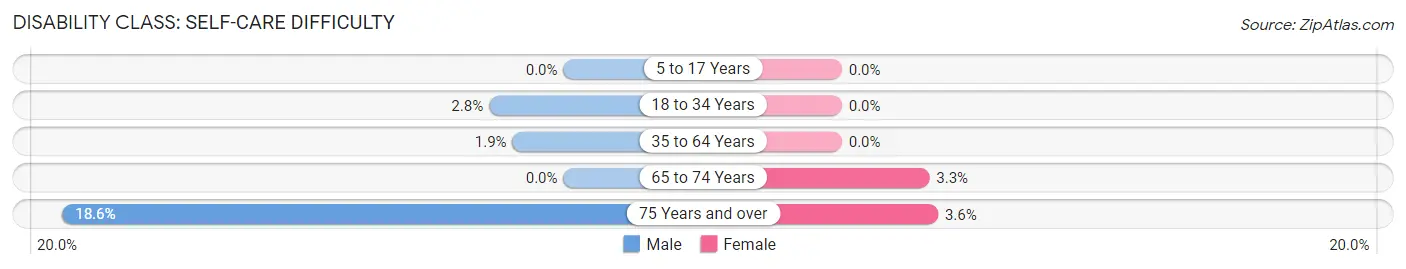
| Age Bracket | Male | Female |
| 5 to 17 Years | 0 (0.0%) | 0 (0.0%) |
| 18 to 34 Years | 6 (2.8%) | 0 (0.0%) |
| 35 to 64 Years | 6 (1.9%) | 0 (0.0%) |
| 65 to 74 Years | 0 (0.0%) | 4 (3.3%) |
| 75 Years and over | 8 (18.6%) | 2 (3.6%) |
Technology Access in Ferndale borough
Computing Device Access in Ferndale borough
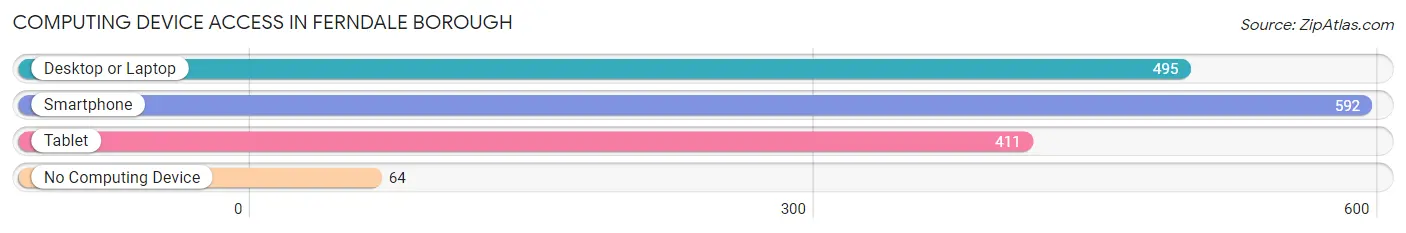
| Device Type | # Households | % Households |
| Desktop or Laptop | 495 | 71.3% |
| Smartphone | 592 | 85.3% |
| Tablet | 411 | 59.2% |
| No Computing Device | 64 | 9.2% |
| Total | 694 | 100.0% |
Internet Access in Ferndale borough
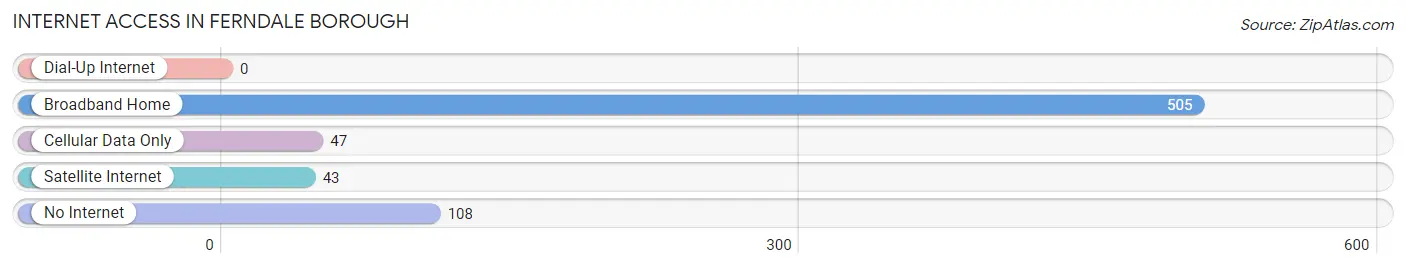
| Internet Type | # Households | % Households |
| Dial-Up Internet | 0 | 0.0% |
| Broadband Home | 505 | 72.8% |
| Cellular Data Only | 47 | 6.8% |
| Satellite Internet | 43 | 6.2% |
| No Internet | 108 | 15.6% |
| Total | 694 | 100.0% |
Ferndale borough Summary
Ferndale Borough is a small borough located in Allegheny County, Pennsylvania. It is situated in the western part of the county, approximately 10 miles from the city of Pittsburgh. The borough is bordered by the townships of West Deer, Frazer, and Indiana. The population of Ferndale Borough was 1,845 as of the 2010 census.
History
Ferndale Borough was founded in 1891 by a group of settlers from the nearby town of Tarentum. The settlers were looking for a place to build a new community and chose the area that is now Ferndale. The name of the borough was derived from the abundance of ferns that grew in the area. The first post office in the borough was established in 1892.
In the early 1900s, the borough began to grow and develop. The first school was built in 1906 and the first church was built in 1908. The borough also had a number of businesses, including a general store, a blacksmith shop, and a sawmill.
In the 1950s, the borough began to experience a period of growth and development. The population increased from 1,000 in 1950 to 1,845 in 2010. The borough also saw the construction of new homes, businesses, and public facilities.
Geography
Ferndale Borough is located in western Allegheny County, approximately 10 miles from the city of Pittsburgh. The borough is bordered by the townships of West Deer, Frazer, and Indiana. The borough has a total area of 1.2 square miles, all of which is land.
The borough is located in the Allegheny Plateau region of Pennsylvania. The terrain is mostly flat with some rolling hills. The borough is located in the Allegheny River watershed and is home to several creeks, including Deer Creek, which flows through the borough.
Economy
The economy of Ferndale Borough is largely based on the service industry. The borough is home to a number of small businesses, including restaurants, retail stores, and professional services. The borough also has a number of manufacturing companies, including a steel mill and a paper mill.
The borough is also home to a number of educational institutions, including a public school district and a community college. The borough is also home to a number of parks and recreational facilities, including a public pool and a golf course.
Demographics
As of the 2010 census, the population of Ferndale Borough was 1,845. The racial makeup of the borough was 97.3% White, 0.9% African American, 0.2% Native American, 0.4% Asian, and 0.9% from other races. Hispanic or Latino of any race were 1.2% of the population.
The median household income in Ferndale Borough was $45,938 in 2010. The per capita income was $20,945. About 8.3% of the population was below the poverty line.
Conclusion
Ferndale Borough is a small borough located in western Allegheny County, Pennsylvania. The borough was founded in 1891 by a group of settlers from the nearby town of Tarentum. The population of Ferndale Borough was 1,845 as of the 2010 census. The economy of the borough is largely based on the service industry and the borough is home to a number of educational institutions, businesses, and recreational facilities. The racial makeup of the borough was 97.3% White, 0.9% African American, 0.2% Native American, 0.4% Asian, and 0.9% from other races. The median household income in Ferndale Borough was $45,938 in 2010.
Common Questions
What is Per Capita Income in Ferndale borough?
Per Capita income in Ferndale borough is $28,797.
What is the Median Family Income in Ferndale borough?
Median Family Income in Ferndale borough is $55,000.
What is the Median Household income in Ferndale borough?
Median Household Income in Ferndale borough is $50,952.
What is Income or Wage Gap in Ferndale borough?
Income or Wage Gap in Ferndale borough is 11.3%.
Women in Ferndale borough earn 88.7 cents for every dollar earned by a man.
What is Inequality or Gini Index in Ferndale borough?
Inequality or Gini Index in Ferndale borough is 0.37.
What is the Total Population of Ferndale borough?
Total Population of Ferndale borough is 1,566.
What is the Total Male Population of Ferndale borough?
Total Male Population of Ferndale borough is 796.
What is the Total Female Population of Ferndale borough?
Total Female Population of Ferndale borough is 770.
What is the Ratio of Males per 100 Females in Ferndale borough?
There are 103.38 Males per 100 Females in Ferndale borough.
What is the Ratio of Females per 100 Males in Ferndale borough?
There are 96.73 Females per 100 Males in Ferndale borough.
What is the Median Population Age in Ferndale borough?
Median Population Age in Ferndale borough is 43.0 Years.
What is the Average Family Size in Ferndale borough
Average Family Size in Ferndale borough is 2.7 People.
What is the Average Household Size in Ferndale borough
Average Household Size in Ferndale borough is 2.3 People.
How Large is the Labor Force in Ferndale borough?
There are 864 People in the Labor Forcein in Ferndale borough.
What is the Percentage of People in the Labor Force in Ferndale borough?
66.6% of People are in the Labor Force in Ferndale borough.
What is the Unemployment Rate in Ferndale borough?
Unemployment Rate in Ferndale borough is 4.9%.