Saxonburg borough, PA Map & Demographics
Saxonburg borough Overview
$34,587
PER CAPITA INCOME
$85,938
AVG FAMILY INCOME
$54,632
AVG HOUSEHOLD INCOME
30.6%
WAGE / INCOME GAP [ % ]
69.4¢/ $1
WAGE / INCOME GAP [ $ ]
0.43
INEQUALITY / GINI INDEX
1,333
TOTAL POPULATION
553
MALE POPULATION
780
FEMALE POPULATION
70.90
MALES / 100 FEMALES
141.05
FEMALES / 100 MALES
53.7
MEDIAN AGE
2.8
AVG FAMILY SIZE
2.0
AVG HOUSEHOLD SIZE
628
LABOR FORCE [ PEOPLE ]
55.0%
PERCENT IN LABOR FORCE
2.2%
UNEMPLOYMENT RATE
Income in Saxonburg borough
Income Overview in Saxonburg borough
Per Capita Income in Saxonburg borough is $34,587, while median incomes of families and households are $85,938 and $54,632 respectively.
| Characteristic | Number | Measure |
| Per Capita Income | 1,333 | $34,587 |
| Median Family Income | 333 | $85,938 |
| Mean Family Income | 333 | $98,435 |
| Median Household Income | 629 | $54,632 |
| Mean Household Income | 629 | $69,838 |
| Income Deficit | 333 | $0 |
| Wage / Income Gap (%) | 1,333 | 30.57% |
| Wage / Income Gap ($) | 1,333 | 69.43¢ per $1 |
| Gini / Inequality Index | 1,333 | 0.43 |
Earnings by Sex in Saxonburg borough
Average Earnings in Saxonburg borough are $40,833, $52,500 for men and $36,452 for women, a difference of 30.6%.
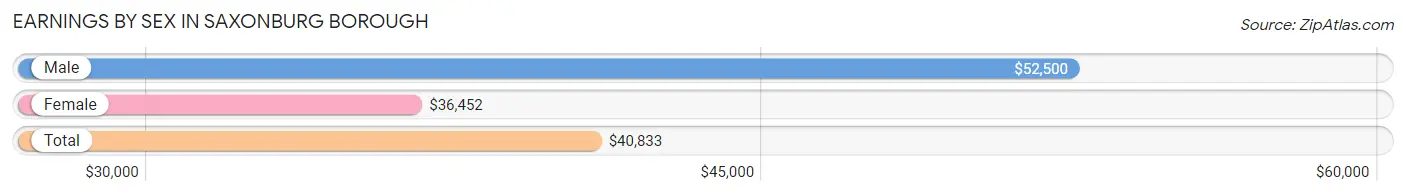
| Sex | Number | Average Earnings |
| Male | 302 (47.3%) | $52,500 |
| Female | 336 (52.7%) | $36,452 |
| Total | 638 (100.0%) | $40,833 |
Earnings by Sex by Income Bracket in Saxonburg borough
The most common earnings brackets in Saxonburg borough are $75,000 to $99,999 for men (42 | 13.9%) and $35,000 to $39,999 for women (53 | 15.8%).
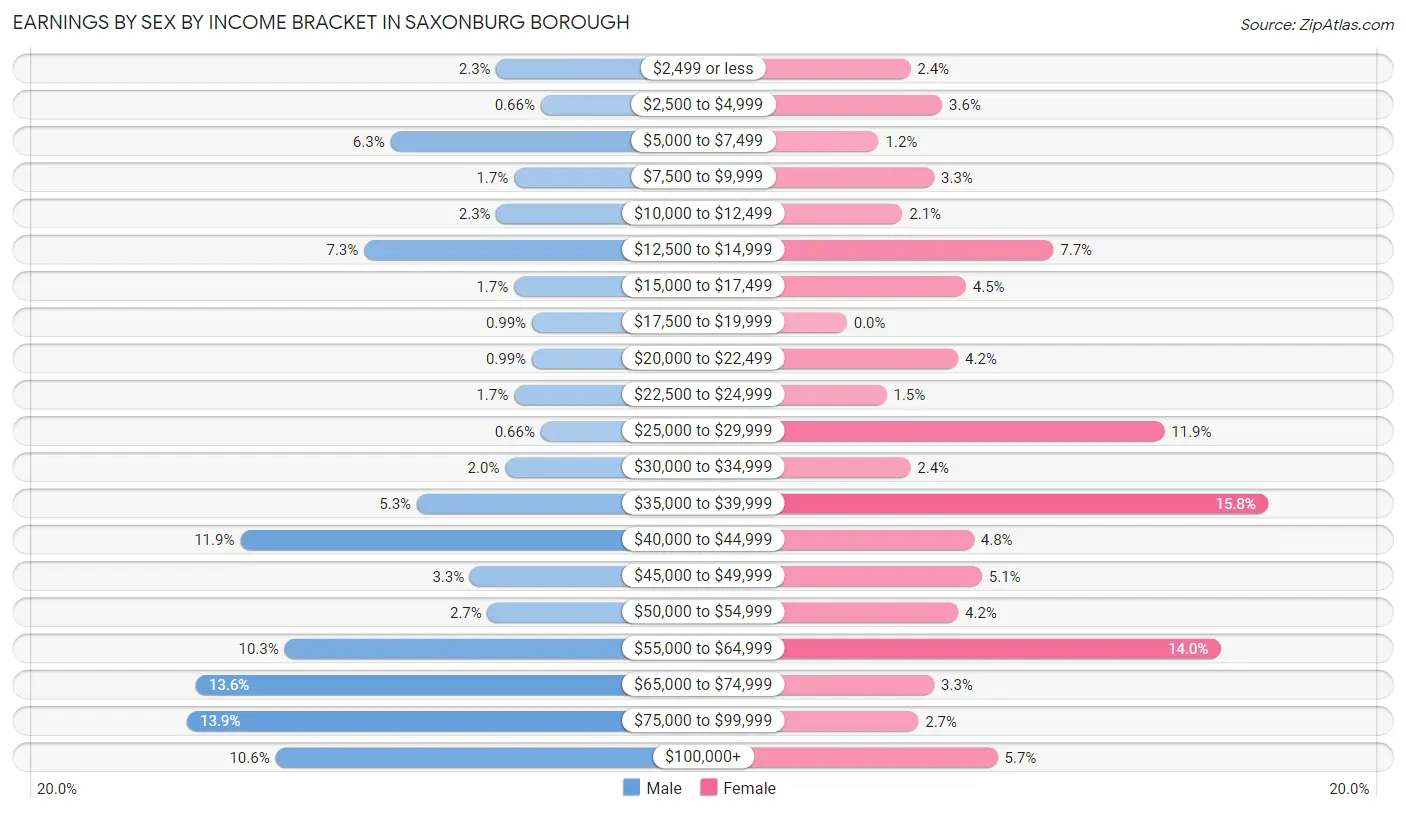
| Income | Male | Female |
| $2,499 or less | 7 (2.3%) | 8 (2.4%) |
| $2,500 to $4,999 | 2 (0.7%) | 12 (3.6%) |
| $5,000 to $7,499 | 19 (6.3%) | 4 (1.2%) |
| $7,500 to $9,999 | 5 (1.7%) | 11 (3.3%) |
| $10,000 to $12,499 | 7 (2.3%) | 7 (2.1%) |
| $12,500 to $14,999 | 22 (7.3%) | 26 (7.7%) |
| $15,000 to $17,499 | 5 (1.7%) | 15 (4.5%) |
| $17,500 to $19,999 | 3 (1.0%) | 0 (0.0%) |
| $20,000 to $22,499 | 3 (1.0%) | 14 (4.2%) |
| $22,500 to $24,999 | 5 (1.7%) | 5 (1.5%) |
| $25,000 to $29,999 | 2 (0.7%) | 40 (11.9%) |
| $30,000 to $34,999 | 6 (2.0%) | 8 (2.4%) |
| $35,000 to $39,999 | 16 (5.3%) | 53 (15.8%) |
| $40,000 to $44,999 | 36 (11.9%) | 16 (4.8%) |
| $45,000 to $49,999 | 10 (3.3%) | 17 (5.1%) |
| $50,000 to $54,999 | 8 (2.6%) | 14 (4.2%) |
| $55,000 to $64,999 | 31 (10.3%) | 47 (14.0%) |
| $65,000 to $74,999 | 41 (13.6%) | 11 (3.3%) |
| $75,000 to $99,999 | 42 (13.9%) | 9 (2.7%) |
| $100,000+ | 32 (10.6%) | 19 (5.7%) |
| Total | 302 (100.0%) | 336 (100.0%) |
Earnings by Sex by Educational Attainment in Saxonburg borough
Average earnings in Saxonburg borough are $56,691 for men and $37,177 for women, a difference of 34.4%. Men with an educational attainment of graduate degree enjoy the highest average annual earnings of $103,750, while those with high school diploma education earn the least with $40,536. Women with an educational attainment of graduate degree earn the most with the average annual earnings of $61,563, while those with college or associate's degree education have the smallest earnings of $35,313.
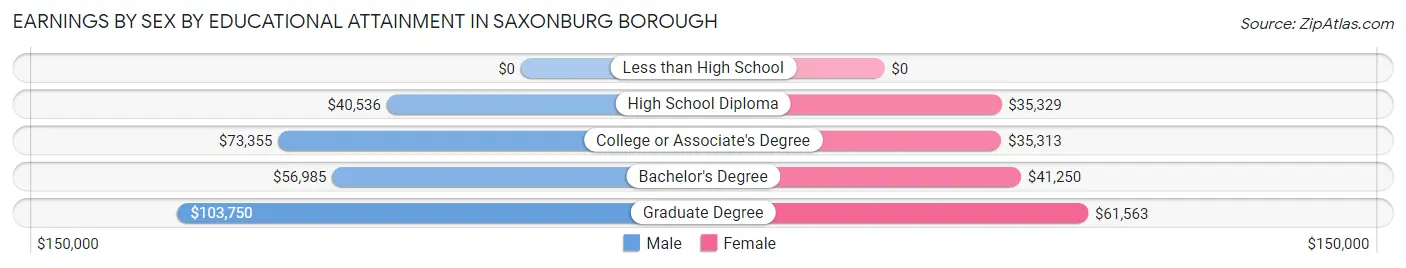
| Educational Attainment | Male Income | Female Income |
| Less than High School | - | - |
| High School Diploma | $40,536 | $35,329 |
| College or Associate's Degree | $73,355 | $35,313 |
| Bachelor's Degree | $56,985 | $41,250 |
| Graduate Degree | $103,750 | $61,563 |
| Total | $56,691 | $37,177 |
Family Income in Saxonburg borough
Family Income Brackets in Saxonburg borough
According to the Saxonburg borough family income data, there are 81 families falling into the $75,000 to $99,999 income range, which is the most common income bracket and makes up 24.3% of all families.
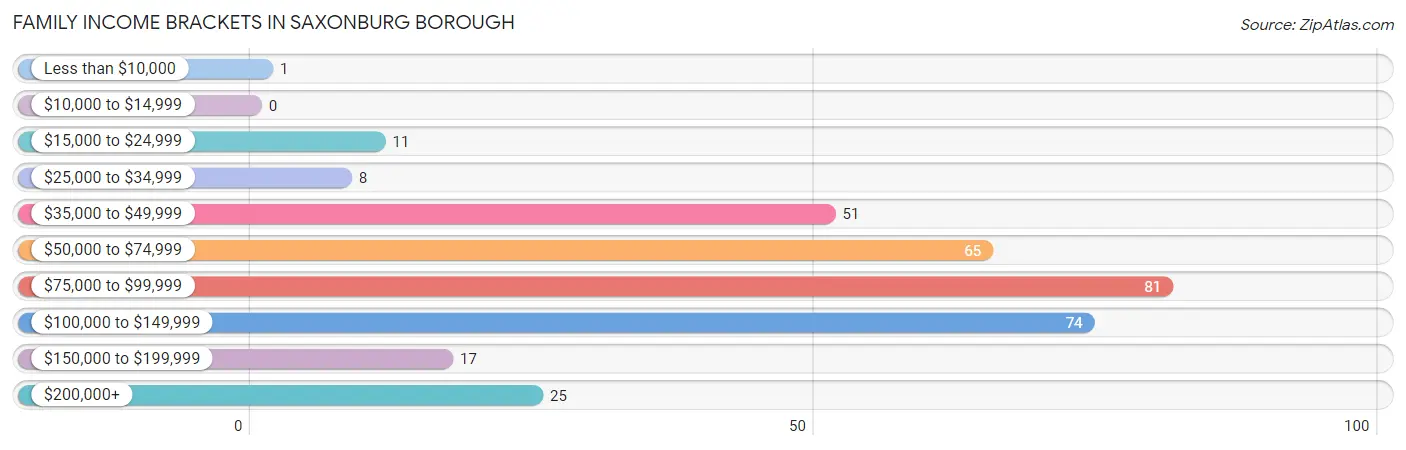
| Income Bracket | # Families | % Families |
| Less than $10,000 | 1 | 0.3% |
| $10,000 to $14,999 | 0 | 0.0% |
| $15,000 to $24,999 | 11 | 3.3% |
| $25,000 to $34,999 | 8 | 2.4% |
| $35,000 to $49,999 | 51 | 15.3% |
| $50,000 to $74,999 | 65 | 19.5% |
| $75,000 to $99,999 | 81 | 24.3% |
| $100,000 to $149,999 | 74 | 22.2% |
| $150,000 to $199,999 | 17 | 5.1% |
| $200,000+ | 25 | 7.5% |
Family Income by Famaliy Size in Saxonburg borough
5-person families (18 | 5.4%) account for the highest median family income in Saxonburg borough with $147,045 per family, while 2-person families (198 | 59.5%) have the highest median income of $35,000 per family member.
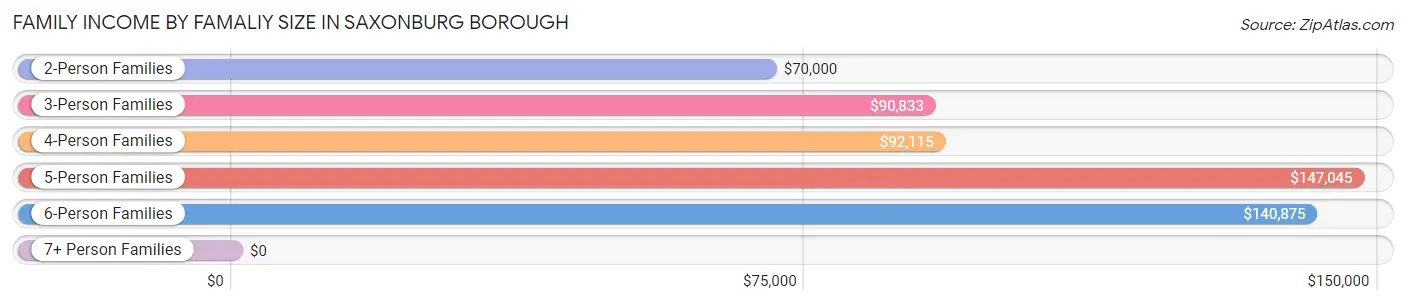
| Income Bracket | # Families | Median Income |
| 2-Person Families | 198 (59.5%) | $70,000 |
| 3-Person Families | 60 (18.0%) | $90,833 |
| 4-Person Families | 36 (10.8%) | $92,115 |
| 5-Person Families | 18 (5.4%) | $147,045 |
| 6-Person Families | 21 (6.3%) | $140,875 |
| 7+ Person Families | 0 (0.0%) | $0 |
| Total | 333 (100.0%) | $85,938 |
Family Income by Number of Earners in Saxonburg borough
The median family income in Saxonburg borough is $85,938, with families comprising 3+ earners (44) having the highest median family income of $145,227, while families with 1 earner (90) have the lowest median family income of $61,250, accounting for 13.2% and 27.0% of families, respectively.
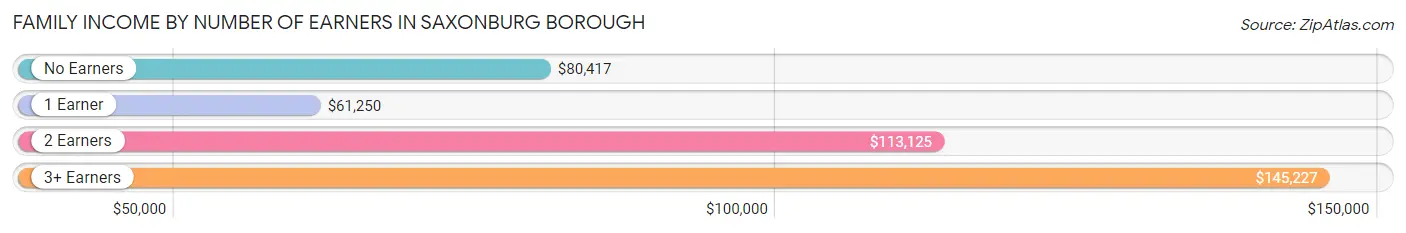
| Number of Earners | # Families | Median Income |
| No Earners | 73 (21.9%) | $80,417 |
| 1 Earner | 90 (27.0%) | $61,250 |
| 2 Earners | 126 (37.8%) | $113,125 |
| 3+ Earners | 44 (13.2%) | $145,227 |
| Total | 333 (100.0%) | $85,938 |
Household Income in Saxonburg borough
Household Income Brackets in Saxonburg borough
With 117 households falling in the category, the $50,000 to $74,999 income range is the most frequent in Saxonburg borough, accounting for 18.6% of all households. In contrast, only 20 households (3.2%) fall into the $10,000 to $14,999 income bracket, making it the least populous group.
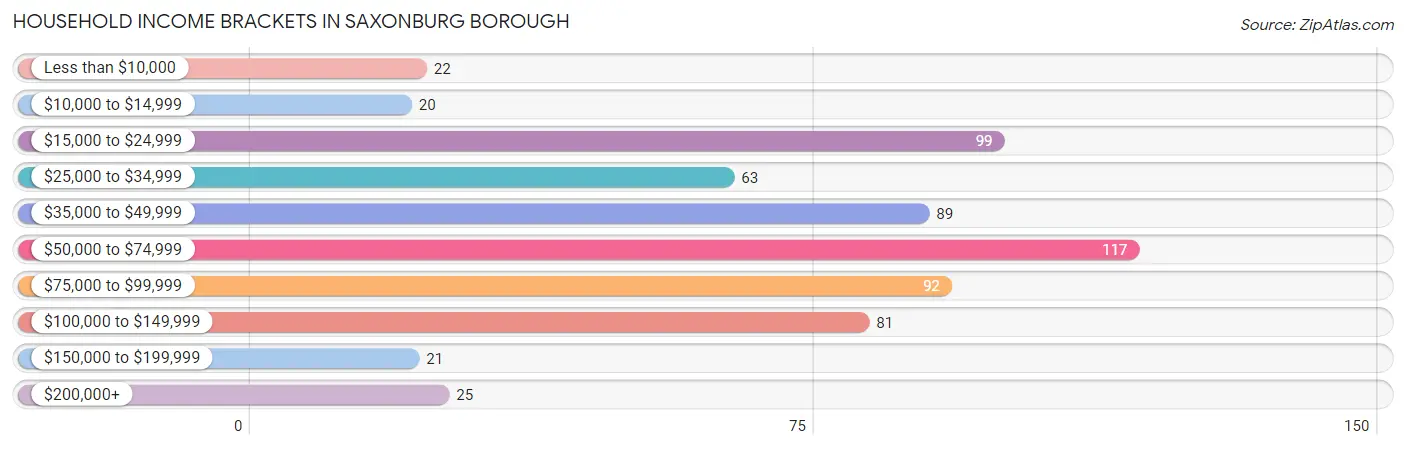
| Income Bracket | # Households | % Households |
| Less than $10,000 | 22 | 3.5% |
| $10,000 to $14,999 | 20 | 3.2% |
| $15,000 to $24,999 | 99 | 15.7% |
| $25,000 to $34,999 | 63 | 10.0% |
| $35,000 to $49,999 | 89 | 14.1% |
| $50,000 to $74,999 | 117 | 18.6% |
| $75,000 to $99,999 | 92 | 14.6% |
| $100,000 to $149,999 | 81 | 12.9% |
| $150,000 to $199,999 | 21 | 3.3% |
| $200,000+ | 25 | 4.0% |
Household Income by Householder Age in Saxonburg borough
The median household income in Saxonburg borough is $54,632, with the highest median household income of $89,167 found in the 25 to 44 years age bracket for the primary householder. A total of 158 households (25.1%) fall into this category. Meanwhile, the 15 to 24 years age bracket for the primary householder has the lowest median household income of $0, with 13 households (2.1%) in this group.
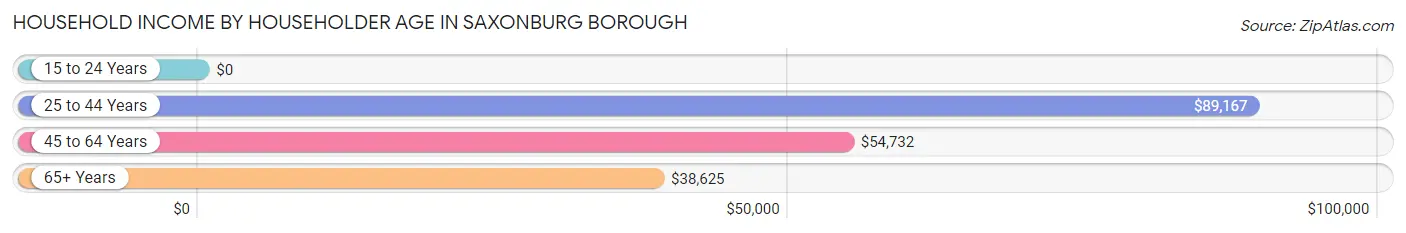
| Income Bracket | # Households | Median Income |
| 15 to 24 Years | 13 (2.1%) | $0 |
| 25 to 44 Years | 158 (25.1%) | $89,167 |
| 45 to 64 Years | 173 (27.5%) | $54,732 |
| 65+ Years | 285 (45.3%) | $38,625 |
| Total | 629 (100.0%) | $54,632 |
Poverty in Saxonburg borough
Income Below Poverty by Sex and Age in Saxonburg borough
With 5.2% poverty level for males and 6.8% for females among the residents of Saxonburg borough, 75 year old and over males and 55 to 64 year old females are the most vulnerable to poverty, with 12 males (15.6%) and 31 females (27.0%) in their respective age groups living below the poverty level.
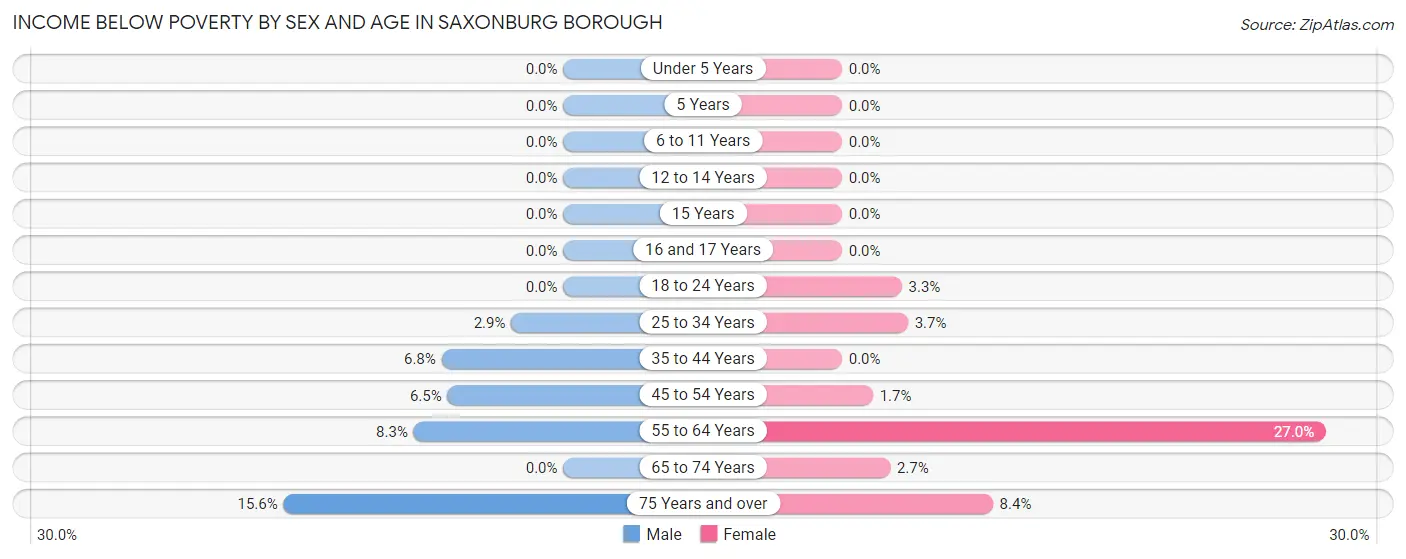
| Age Bracket | Male | Female |
| Under 5 Years | 0 (0.0%) | 0 (0.0%) |
| 5 Years | 0 (0.0%) | 0 (0.0%) |
| 6 to 11 Years | 0 (0.0%) | 0 (0.0%) |
| 12 to 14 Years | 0 (0.0%) | 0 (0.0%) |
| 15 Years | 0 (0.0%) | 0 (0.0%) |
| 16 and 17 Years | 0 (0.0%) | 0 (0.0%) |
| 18 to 24 Years | 0 (0.0%) | 1 (3.3%) |
| 25 to 34 Years | 2 (2.9%) | 4 (3.7%) |
| 35 to 44 Years | 4 (6.8%) | 0 (0.0%) |
| 45 to 54 Years | 4 (6.5%) | 1 (1.7%) |
| 55 to 64 Years | 6 (8.3%) | 31 (27.0%) |
| 65 to 74 Years | 0 (0.0%) | 3 (2.7%) |
| 75 Years and over | 12 (15.6%) | 10 (8.4%) |
| Total | 28 (5.2%) | 50 (6.8%) |
Income Above Poverty by Sex and Age in Saxonburg borough
According to the poverty statistics in Saxonburg borough, males aged under 5 years and females aged under 5 years are the age groups that are most secure financially, with 100.0% of males and 100.0% of females in these age groups living above the poverty line.
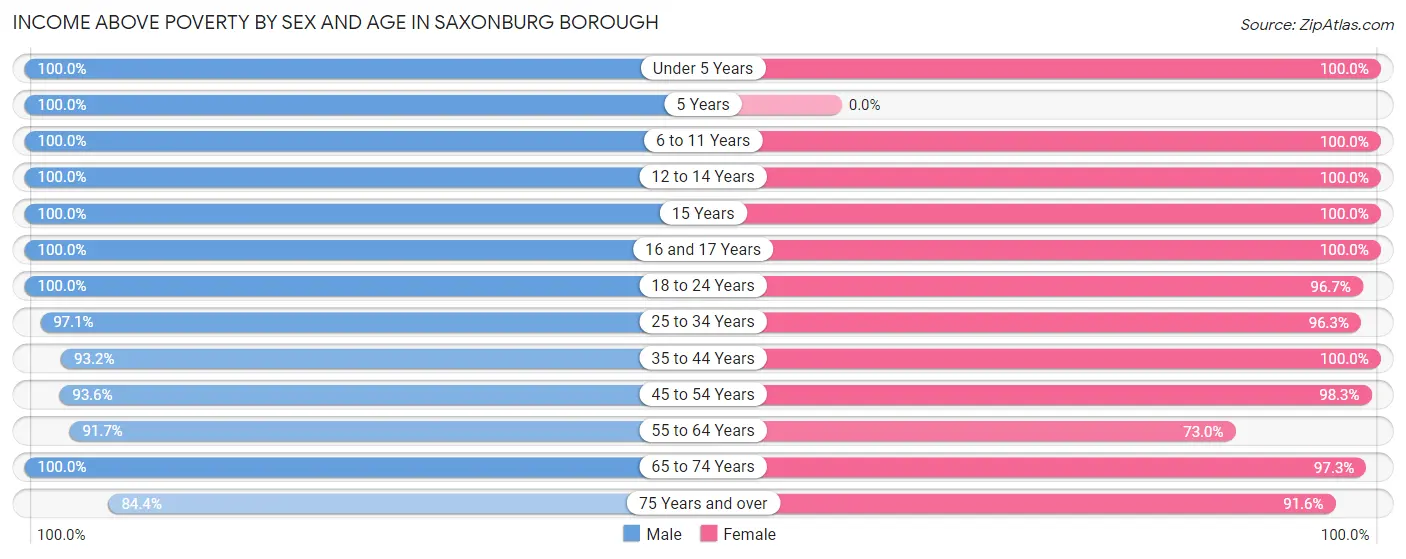
| Age Bracket | Male | Female |
| Under 5 Years | 32 (100.0%) | 45 (100.0%) |
| 5 Years | 2 (100.0%) | 0 (0.0%) |
| 6 to 11 Years | 20 (100.0%) | 44 (100.0%) |
| 12 to 14 Years | 13 (100.0%) | 18 (100.0%) |
| 15 Years | 8 (100.0%) | 9 (100.0%) |
| 16 and 17 Years | 7 (100.0%) | 5 (100.0%) |
| 18 to 24 Years | 31 (100.0%) | 29 (96.7%) |
| 25 to 34 Years | 67 (97.1%) | 105 (96.3%) |
| 35 to 44 Years | 55 (93.2%) | 67 (100.0%) |
| 45 to 54 Years | 58 (93.5%) | 57 (98.3%) |
| 55 to 64 Years | 66 (91.7%) | 84 (73.0%) |
| 65 to 74 Years | 87 (100.0%) | 109 (97.3%) |
| 75 Years and over | 65 (84.4%) | 109 (91.6%) |
| Total | 511 (94.8%) | 681 (93.2%) |
Income Below Poverty Among Married-Couple Families in Saxonburg borough
The poverty statistics for married-couple families in Saxonburg borough show that 2.9% or 8 of the total 280 families live below the poverty line. Families with no children have the highest poverty rate of 4.3%, comprising of 8 families. On the other hand, families with 1 or 2 children have the lowest poverty rate of 0.0%, which includes 0 families.
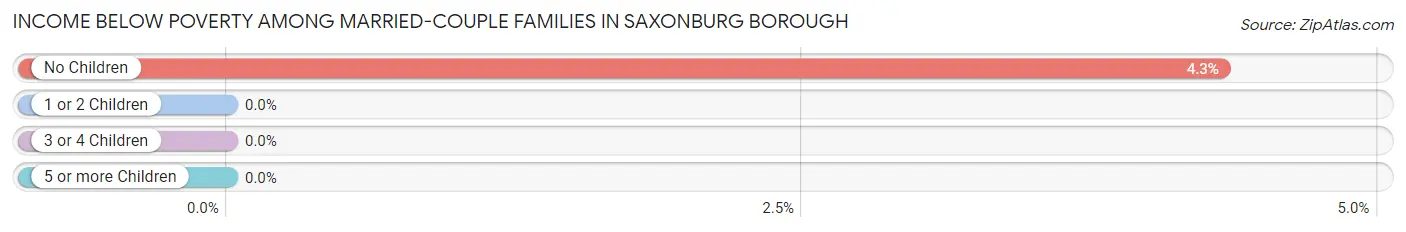
| Children | Above Poverty | Below Poverty |
| No Children | 177 (95.7%) | 8 (4.3%) |
| 1 or 2 Children | 77 (100.0%) | 0 (0.0%) |
| 3 or 4 Children | 18 (100.0%) | 0 (0.0%) |
| 5 or more Children | 0 (0.0%) | 0 (0.0%) |
| Total | 272 (97.1%) | 8 (2.9%) |
Income Below Poverty Among Single-Parent Households in Saxonburg borough
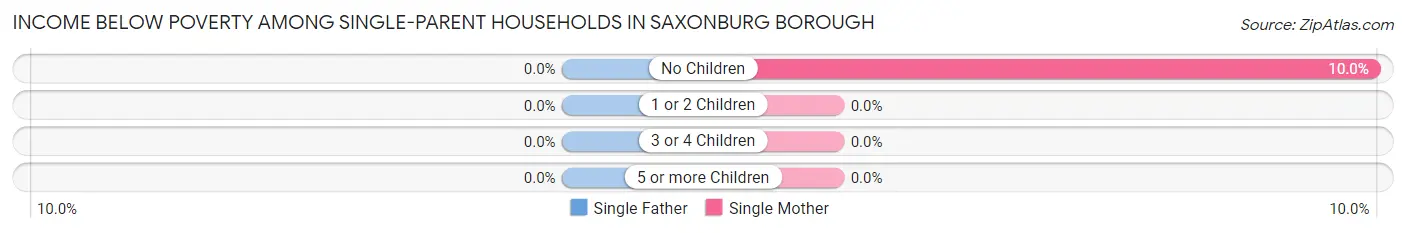
| Children | Single Father | Single Mother |
| No Children | 0 (0.0%) | 1 (10.0%) |
| 1 or 2 Children | 0 (0.0%) | 0 (0.0%) |
| 3 or 4 Children | 0 (0.0%) | 0 (0.0%) |
| 5 or more Children | 0 (0.0%) | 0 (0.0%) |
| Total | 0 (0.0%) | 1 (3.0%) |
Income Below Poverty Among Married-Couple vs Single-Parent Households in Saxonburg borough
The poverty data for Saxonburg borough shows that 8 of the married-couple family households (2.9%) and 1 of the single-parent households (1.9%) are living below the poverty level. Within the married-couple family households, those with no children have the highest poverty rate, with 8 households (4.3%) falling below the poverty line. Among the single-parent households, those with no children have the highest poverty rate, with 1 household (4.2%) living below poverty.
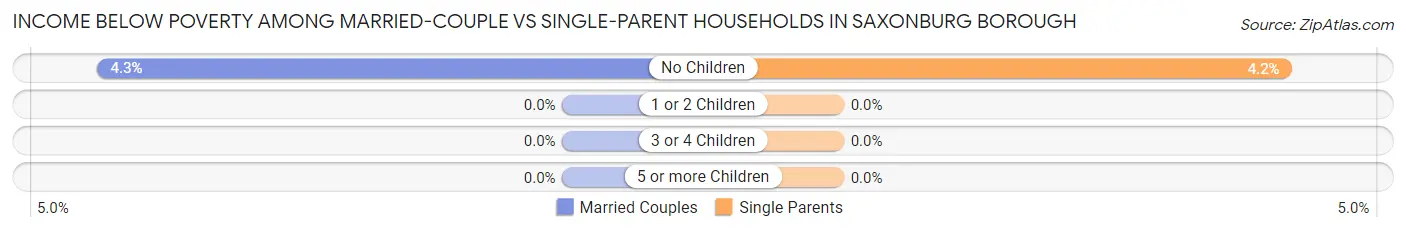
| Children | Married-Couple Families | Single-Parent Households |
| No Children | 8 (4.3%) | 1 (4.2%) |
| 1 or 2 Children | 0 (0.0%) | 0 (0.0%) |
| 3 or 4 Children | 0 (0.0%) | 0 (0.0%) |
| 5 or more Children | 0 (0.0%) | 0 (0.0%) |
| Total | 8 (2.9%) | 1 (1.9%) |
Race in Saxonburg borough
The most populous races in Saxonburg borough are White / Caucasian (1,323 | 99.3%), Two or more Races (10 | 0.7%), and Hispanic or Latino (9 | 0.7%).
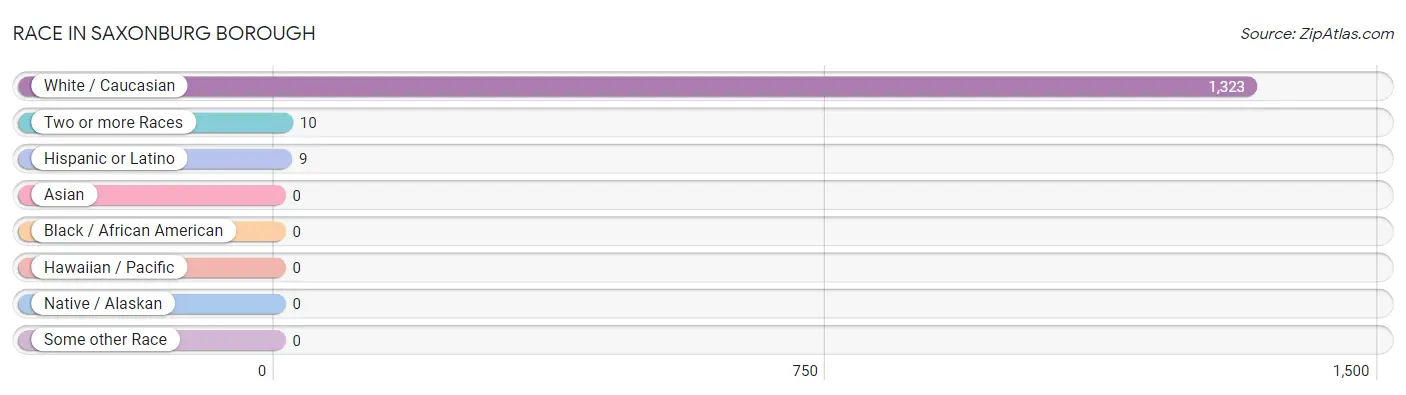
| Race | # Population | % Population |
| Asian | 0 | 0.0% |
| Black / African American | 0 | 0.0% |
| Hawaiian / Pacific | 0 | 0.0% |
| Hispanic or Latino | 9 | 0.7% |
| Native / Alaskan | 0 | 0.0% |
| White / Caucasian | 1,323 | 99.3% |
| Two or more Races | 10 | 0.7% |
| Some other Race | 0 | 0.0% |
| Total | 1,333 | 100.0% |
Ancestry in Saxonburg borough
The most populous ancestries reported in Saxonburg borough are German (576 | 43.2%), Irish (231 | 17.3%), English (151 | 11.3%), Italian (114 | 8.6%), and Polish (70 | 5.2%), together accounting for 85.7% of all Saxonburg borough residents.
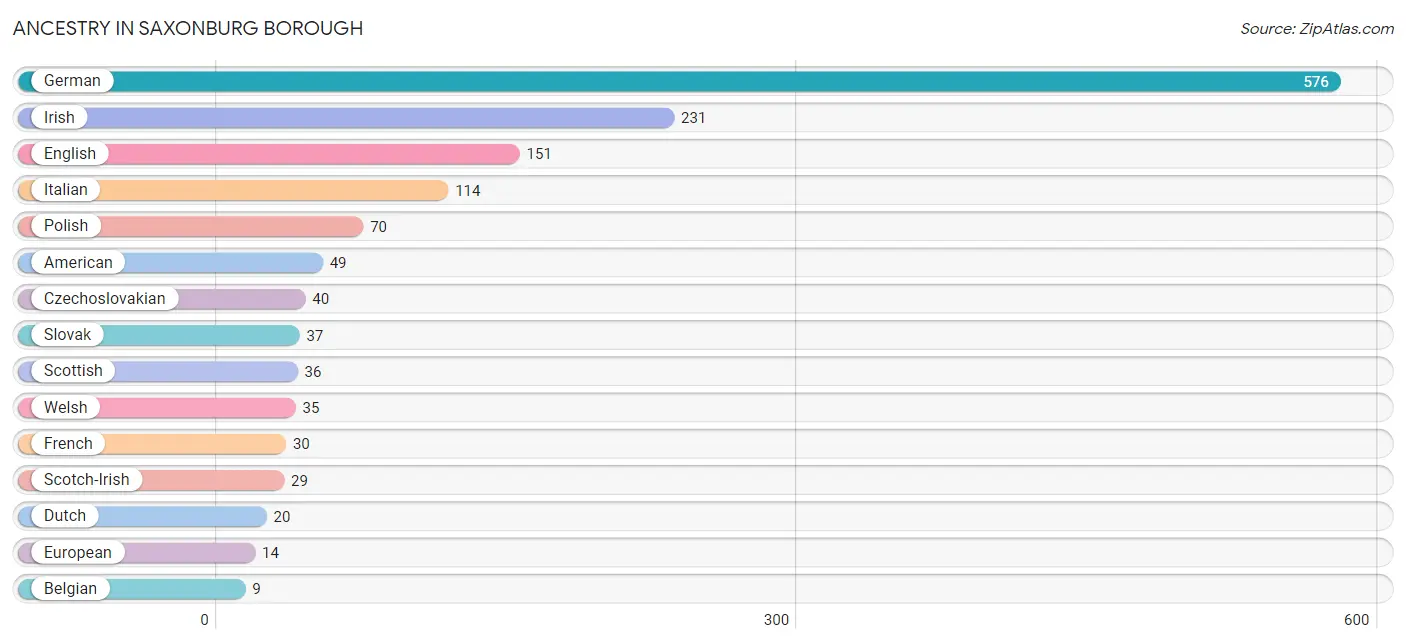
| Ancestry | # Population | % Population |
| American | 49 | 3.7% |
| Austrian | 7 | 0.5% |
| Belgian | 9 | 0.7% |
| Croatian | 6 | 0.4% |
| Czechoslovakian | 40 | 3.0% |
| Danish | 3 | 0.2% |
| Dutch | 20 | 1.5% |
| English | 151 | 11.3% |
| European | 14 | 1.1% |
| French | 30 | 2.2% |
| German | 576 | 43.2% |
| Greek | 4 | 0.3% |
| Hungarian | 4 | 0.3% |
| Irish | 231 | 17.3% |
| Italian | 114 | 8.6% |
| Lithuanian | 3 | 0.2% |
| Mexican | 9 | 0.7% |
| Polish | 70 | 5.2% |
| Portuguese | 9 | 0.7% |
| Russian | 3 | 0.2% |
| Scotch-Irish | 29 | 2.2% |
| Scottish | 36 | 2.7% |
| Slovak | 37 | 2.8% |
| Swedish | 3 | 0.2% |
| Swiss | 2 | 0.2% |
| Welsh | 35 | 2.6% | View All 26 Rows |
Immigrants in Saxonburg borough

| Immigration Origin | # Population | % Population | View All 0 Rows |
Sex and Age in Saxonburg borough
Sex and Age in Saxonburg borough
The most populous age groups in Saxonburg borough are 30 to 34 Years (49 | 8.9%) for men and 85 Years and over (77 | 9.9%) for women.
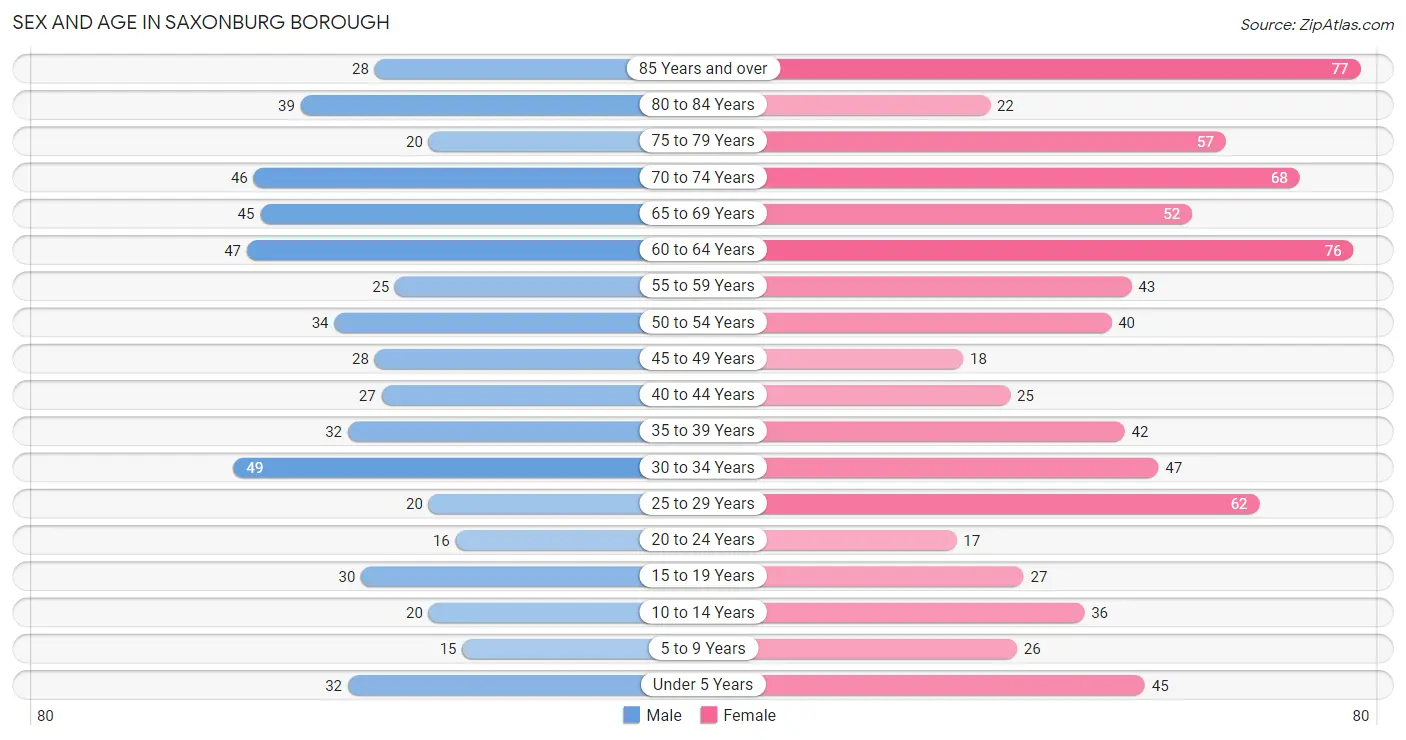
| Age Bracket | Male | Female |
| Under 5 Years | 32 (5.8%) | 45 (5.8%) |
| 5 to 9 Years | 15 (2.7%) | 26 (3.3%) |
| 10 to 14 Years | 20 (3.6%) | 36 (4.6%) |
| 15 to 19 Years | 30 (5.4%) | 27 (3.5%) |
| 20 to 24 Years | 16 (2.9%) | 17 (2.2%) |
| 25 to 29 Years | 20 (3.6%) | 62 (8.0%) |
| 30 to 34 Years | 49 (8.9%) | 47 (6.0%) |
| 35 to 39 Years | 32 (5.8%) | 42 (5.4%) |
| 40 to 44 Years | 27 (4.9%) | 25 (3.2%) |
| 45 to 49 Years | 28 (5.1%) | 18 (2.3%) |
| 50 to 54 Years | 34 (6.1%) | 40 (5.1%) |
| 55 to 59 Years | 25 (4.5%) | 43 (5.5%) |
| 60 to 64 Years | 47 (8.5%) | 76 (9.7%) |
| 65 to 69 Years | 45 (8.1%) | 52 (6.7%) |
| 70 to 74 Years | 46 (8.3%) | 68 (8.7%) |
| 75 to 79 Years | 20 (3.6%) | 57 (7.3%) |
| 80 to 84 Years | 39 (7.0%) | 22 (2.8%) |
| 85 Years and over | 28 (5.1%) | 77 (9.9%) |
| Total | 553 (100.0%) | 780 (100.0%) |
Families and Households in Saxonburg borough
Median Family Size in Saxonburg borough
The median family size in Saxonburg borough is 2.77 persons per family, with married-couple families (280 | 84.1%) accounting for the largest median family size of 2.86 persons per family. On the other hand, single female/mother families (33 | 9.9%) represent the smallest median family size with 2.21 persons per family.
| Family Type | # Families | Family Size |
| Married-Couple | 280 (84.1%) | 2.86 |
| Single Male/Father | 20 (6.0%) | 2.55 |
| Single Female/Mother | 33 (9.9%) | 2.21 |
| Total Families | 333 (100.0%) | 2.77 |
Median Household Size in Saxonburg borough
The median household size in Saxonburg borough is 2.01 persons per household, with married-couple households (280 | 44.5%) accounting for the largest median household size of 2.89 persons per household. non-family households (296 | 47.1%) represent the smallest median household size with 1.08 persons per household.
| Household Type | # Households | Household Size |
| Married-Couple | 280 (44.5%) | 2.89 |
| Single Male/Father | 20 (3.2%) | 2.70 |
| Single Female/Mother | 33 (5.2%) | 2.45 |
| Non-family | 296 (47.1%) | 1.08 |
| Total Households | 629 (100.0%) | 2.01 |
Household Size by Marriage Status in Saxonburg borough
Out of a total of 629 households in Saxonburg borough, 333 (52.9%) are family households, while 296 (47.1%) are nonfamily households. The most numerous type of family households are 2-person households, comprising 185, and the most common type of nonfamily households are 1-person households, comprising 273.
| Household Size | Family Households | Nonfamily Households |
| 1-Person Households | - | 273 (43.4%) |
| 2-Person Households | 185 (29.4%) | 23 (3.7%) |
| 3-Person Households | 66 (10.5%) | 0 (0.0%) |
| 4-Person Households | 43 (6.8%) | 0 (0.0%) |
| 5-Person Households | 18 (2.9%) | 0 (0.0%) |
| 6-Person Households | 21 (3.3%) | 0 (0.0%) |
| 7+ Person Households | 0 (0.0%) | 0 (0.0%) |
| Total | 333 (52.9%) | 296 (47.1%) |
Female Fertility in Saxonburg borough
Fertility by Age in Saxonburg borough
Average fertility rate in Saxonburg borough is 84.0 births per 1,000 women. Women in the age bracket of 15 to 19 years have the highest fertility rate with 259.0 births per 1,000 women. Women in the age bracket of 20 to 34 years acount for 66.7% of all women with births.
| Age Bracket | Women with Births | Births / 1,000 Women |
| 15 to 19 years | 7 (33.3%) | 259.0 |
| 20 to 34 years | 14 (66.7%) | 111.0 |
| 35 to 50 years | 0 (0.0%) | 0.0 |
| Total | 21 (100.0%) | 84.0 |
Fertility by Age by Marriage Status in Saxonburg borough
66.7% of women with births (21) in Saxonburg borough are married. The highest percentage of unmarried women with births falls into 15 to 19 years age bracket with 100.0% of them unmarried at the time of birth, while the lowest percentage of unmarried women with births belong to 20 to 34 years age bracket with 0.0% of them unmarried.
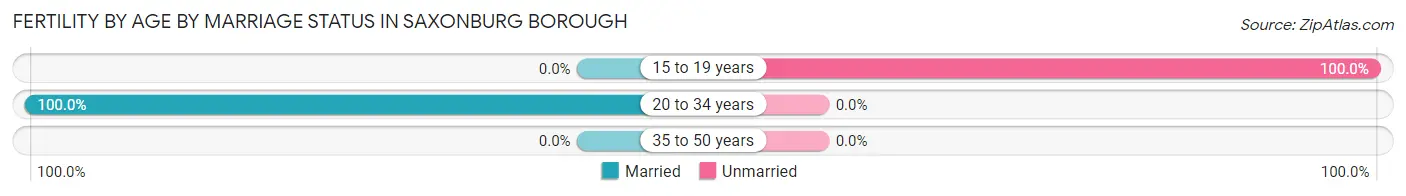
| Age Bracket | Married | Unmarried |
| 15 to 19 years | 0 (0.0%) | 7 (100.0%) |
| 20 to 34 years | 14 (100.0%) | 0 (0.0%) |
| 35 to 50 years | 0 (0.0%) | 0 (0.0%) |
| Total | 14 (66.7%) | 7 (33.3%) |
Fertility by Education in Saxonburg borough
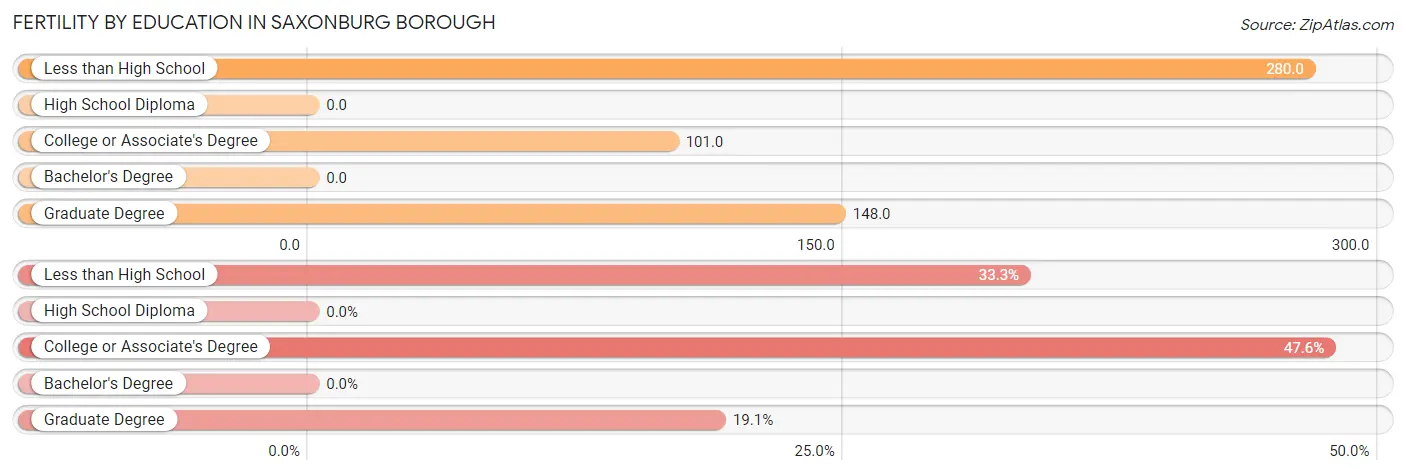
| Educational Attainment | Women with Births | Births / 1,000 Women |
| Less than High School | 7 (33.3%) | 280.0 |
| High School Diploma | 0 (0.0%) | 0.0 |
| College or Associate's Degree | 10 (47.6%) | 101.0 |
| Bachelor's Degree | 0 (0.0%) | 0.0 |
| Graduate Degree | 4 (19.1%) | 148.0 |
| Total | 21 (100.0%) | 84.0 |
Fertility by Education by Marriage Status in Saxonburg borough
33.3% of women with births in Saxonburg borough are unmarried. Women with the educational attainment of college or associate's degree are most likely to be married with 100.0% of them married at childbirth, while women with the educational attainment of less than high school are least likely to be married with 100.0% of them unmarried at childbirth.
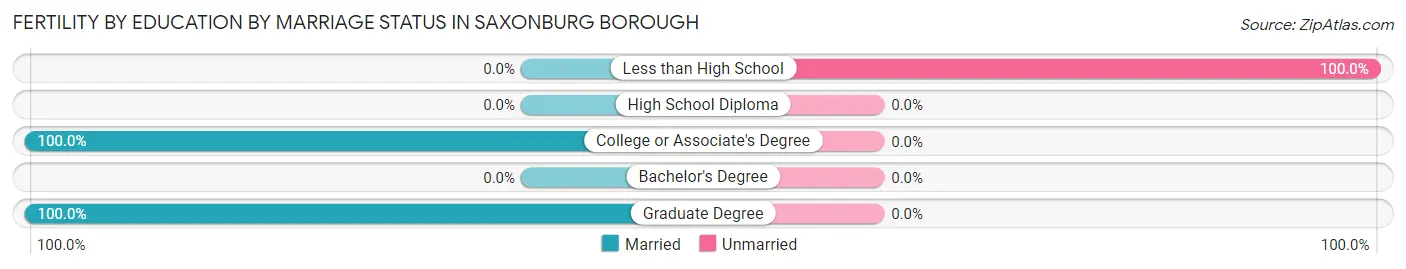
| Educational Attainment | Married | Unmarried |
| Less than High School | 0 (0.0%) | 7 (100.0%) |
| High School Diploma | 0 (0.0%) | 0 (0.0%) |
| College or Associate's Degree | 10 (100.0%) | 0 (0.0%) |
| Bachelor's Degree | 0 (0.0%) | 0 (0.0%) |
| Graduate Degree | 4 (100.0%) | 0 (0.0%) |
| Total | 14 (66.7%) | 7 (33.3%) |
Employment Characteristics in Saxonburg borough
Employment by Class of Employer in Saxonburg borough
Among the 594 employed individuals in Saxonburg borough, private company employees (411 | 69.2%), not-for-profit organizations (92 | 15.5%), and self-employed (incorporated) (36 | 6.1%) make up the most common classes of employment.
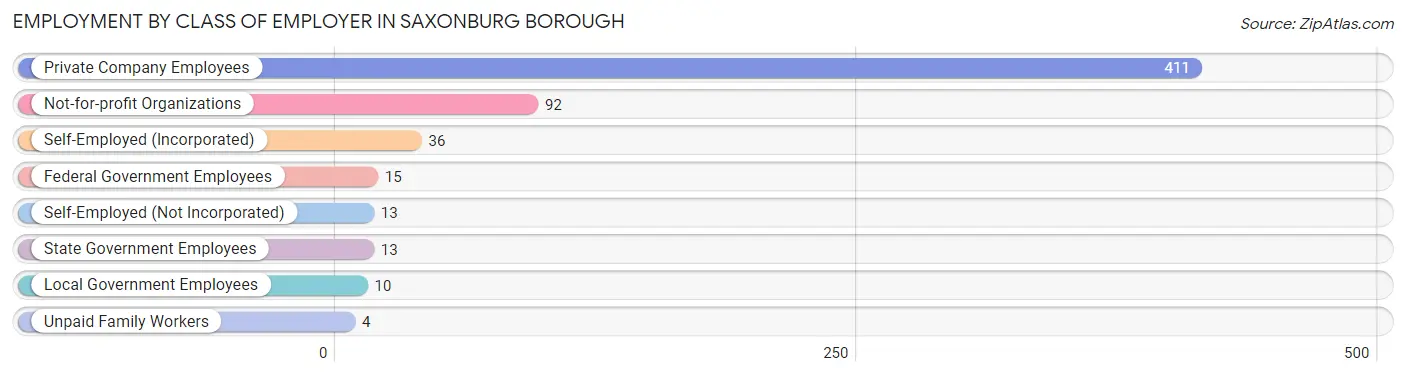
| Employer Class | # Employees | % Employees |
| Private Company Employees | 411 | 69.2% |
| Self-Employed (Incorporated) | 36 | 6.1% |
| Self-Employed (Not Incorporated) | 13 | 2.2% |
| Not-for-profit Organizations | 92 | 15.5% |
| Local Government Employees | 10 | 1.7% |
| State Government Employees | 13 | 2.2% |
| Federal Government Employees | 15 | 2.5% |
| Unpaid Family Workers | 4 | 0.7% |
| Total | 594 | 100.0% |
Employment Status by Age in Saxonburg borough
According to the labor force statistics for Saxonburg borough, out of the total population over 16 years of age (1,142), 55.0% or 628 individuals are in the labor force, with 2.2% or 14 of them unemployed. The age group with the highest labor force participation rate is 20 to 24 years, with 97.0% or 32 individuals in the labor force. Within the labor force, the 75 years and over age range has the highest percentage of unemployed individuals, with 11.1% or 1 of them being unemployed.
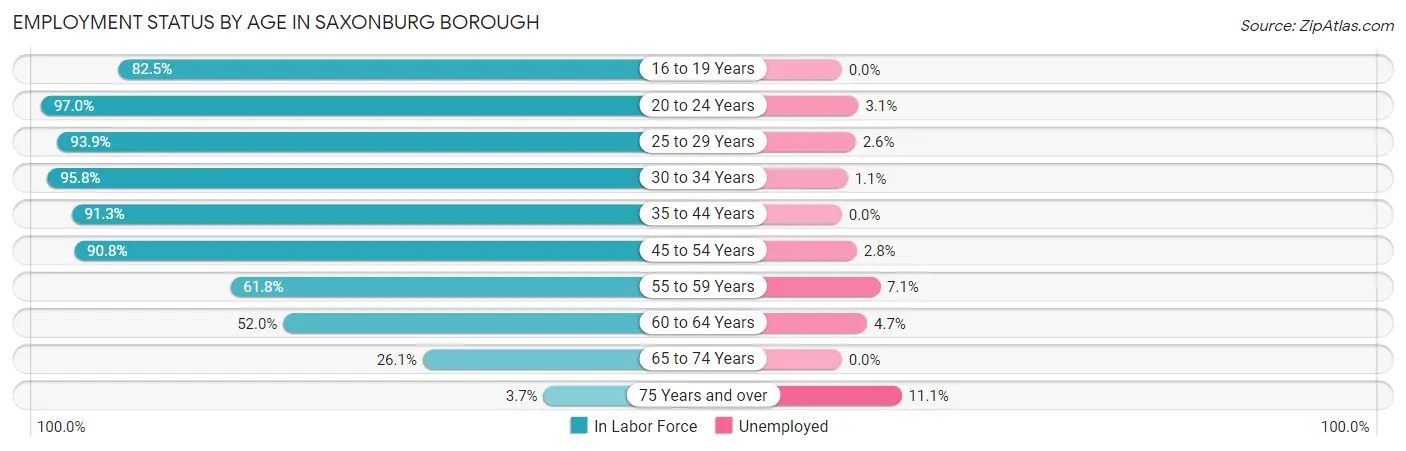
| Age Bracket | In Labor Force | Unemployed |
| 16 to 19 Years | 33 (82.5%) | 0 (0.0%) |
| 20 to 24 Years | 32 (97.0%) | 1 (3.1%) |
| 25 to 29 Years | 77 (93.9%) | 2 (2.6%) |
| 30 to 34 Years | 92 (95.8%) | 1 (1.1%) |
| 35 to 44 Years | 115 (91.3%) | 0 (0.0%) |
| 45 to 54 Years | 109 (90.8%) | 3 (2.8%) |
| 55 to 59 Years | 42 (61.8%) | 3 (7.1%) |
| 60 to 64 Years | 64 (52.0%) | 3 (4.7%) |
| 65 to 74 Years | 55 (26.1%) | 0 (0.0%) |
| 75 Years and over | 9 (3.7%) | 1 (11.1%) |
| Total | 628 (55.0%) | 14 (2.2%) |
Employment Status by Educational Attainment in Saxonburg borough
According to labor force statistics for Saxonburg borough, 81.1% of individuals (499) out of the total population between 25 and 64 years of age (615) are in the labor force, with 2.4% or 12 of them being unemployed. The group with the highest labor force participation rate are those with the educational attainment of bachelor's degree or higher, with 89.2% or 149 individuals in the labor force. Within the labor force, individuals with less than high school education have the highest percentage of unemployment, with 12.5% or 1 of them being unemployed.
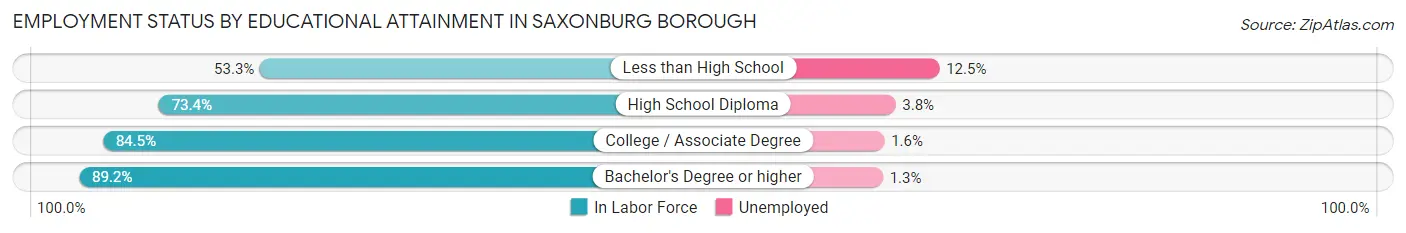
| Educational Attainment | In Labor Force | Unemployed |
| Less than High School | 8 (53.3%) | 2 (12.5%) |
| High School Diploma | 157 (73.4%) | 8 (3.8%) |
| College / Associate Degree | 185 (84.5%) | 4 (1.6%) |
| Bachelor's Degree or higher | 149 (89.2%) | 2 (1.3%) |
| Total | 499 (81.1%) | 15 (2.4%) |
Employment Occupations by Sex in Saxonburg borough
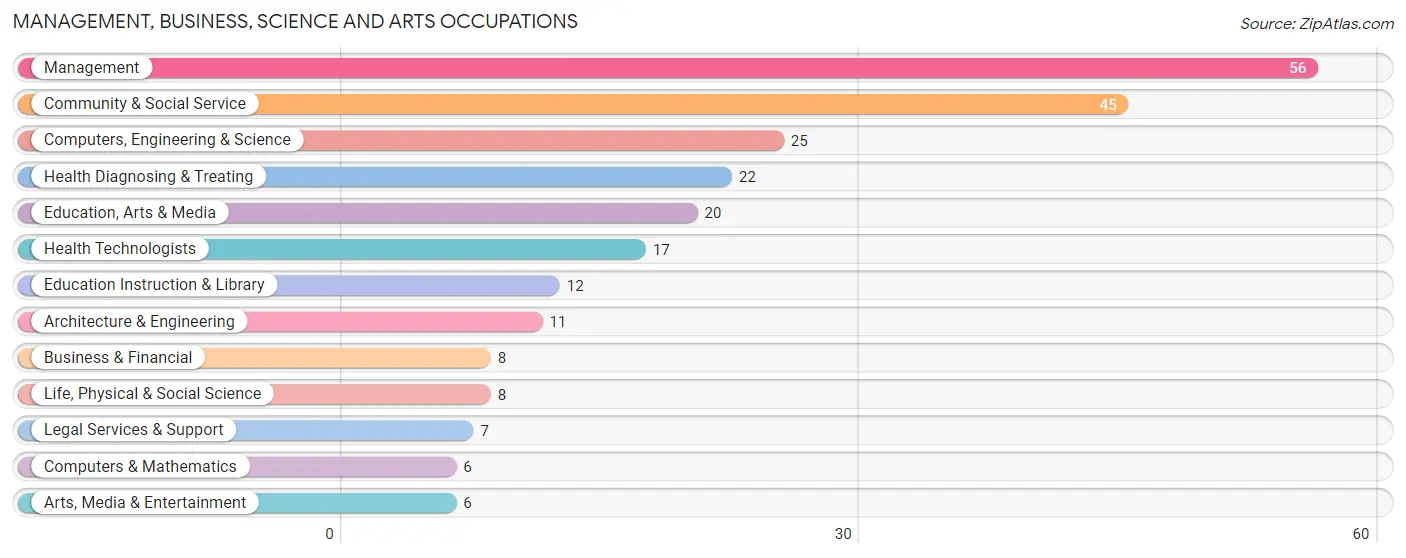
Management, Business, Science and Arts Occupations
The most common Management, Business, Science and Arts occupations in Saxonburg borough are Management (56 | 9.1%), Community & Social Service (45 | 7.3%), Computers, Engineering & Science (25 | 4.1%), Health Diagnosing & Treating (22 | 3.6%), and Education, Arts & Media (20 | 3.3%).
Management, Business, Science and Arts Occupations by Sex
Within the Management, Business, Science and Arts occupations in Saxonburg borough, the most male-oriented occupations are Business & Financial (100.0%), Architecture & Engineering (100.0%), and Computers, Engineering & Science (76.0%), while the most female-oriented occupations are Legal Services & Support (100.0%), Education Instruction & Library (100.0%), and Arts, Media & Entertainment (100.0%).
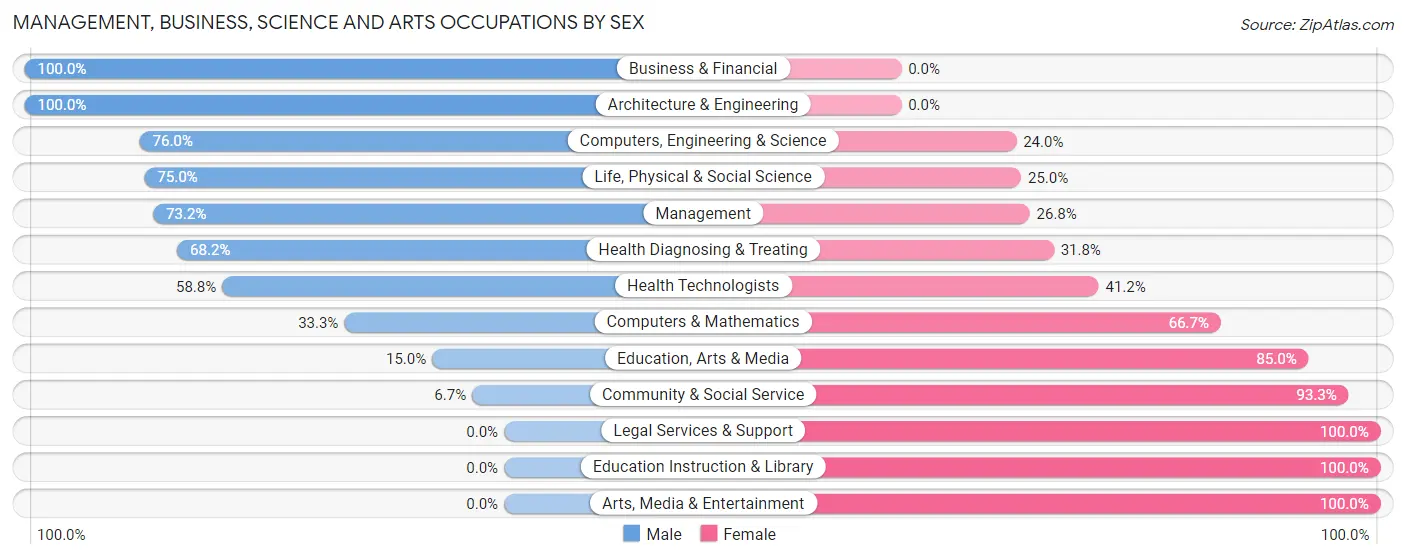
| Occupation | Male | Female |
| Management | 41 (73.2%) | 15 (26.8%) |
| Business & Financial | 8 (100.0%) | 0 (0.0%) |
| Computers, Engineering & Science | 19 (76.0%) | 6 (24.0%) |
| Computers & Mathematics | 2 (33.3%) | 4 (66.7%) |
| Architecture & Engineering | 11 (100.0%) | 0 (0.0%) |
| Life, Physical & Social Science | 6 (75.0%) | 2 (25.0%) |
| Community & Social Service | 3 (6.7%) | 42 (93.3%) |
| Education, Arts & Media | 3 (15.0%) | 17 (85.0%) |
| Legal Services & Support | 0 (0.0%) | 7 (100.0%) |
| Education Instruction & Library | 0 (0.0%) | 12 (100.0%) |
| Arts, Media & Entertainment | 0 (0.0%) | 6 (100.0%) |
| Health Diagnosing & Treating | 15 (68.2%) | 7 (31.8%) |
| Health Technologists | 10 (58.8%) | 7 (41.2%) |
| Total (Category) | 86 (55.1%) | 70 (44.9%) |
| Total (Overall) | 291 (47.4%) | 323 (52.6%) |
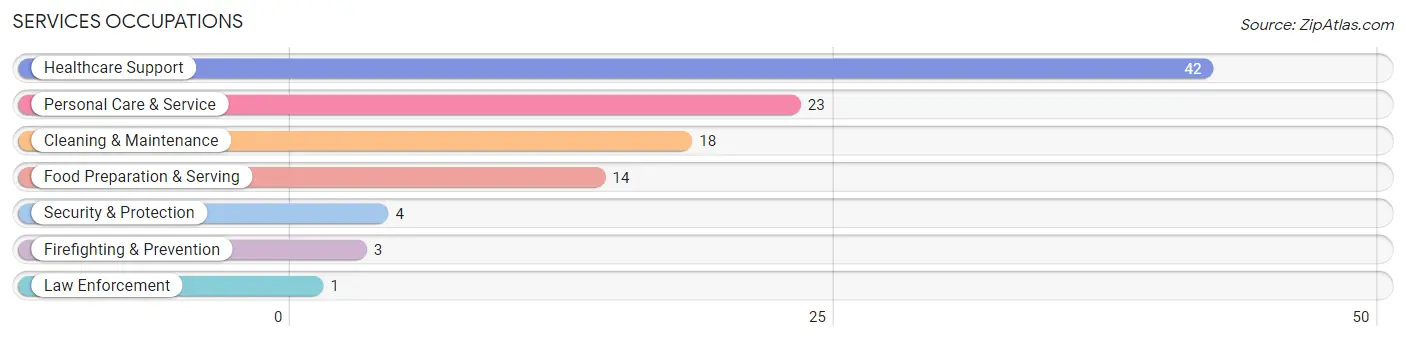
Services Occupations
The most common Services occupations in Saxonburg borough are Healthcare Support (42 | 6.8%), Personal Care & Service (23 | 3.7%), Cleaning & Maintenance (18 | 2.9%), Food Preparation & Serving (14 | 2.3%), and Security & Protection (4 | 0.6%).
Services Occupations by Sex
Within the Services occupations in Saxonburg borough, the most male-oriented occupations are Law Enforcement (100.0%), Security & Protection (25.0%), and Cleaning & Maintenance (16.7%), while the most female-oriented occupations are Healthcare Support (100.0%), Firefighting & Prevention (100.0%), and Personal Care & Service (100.0%).
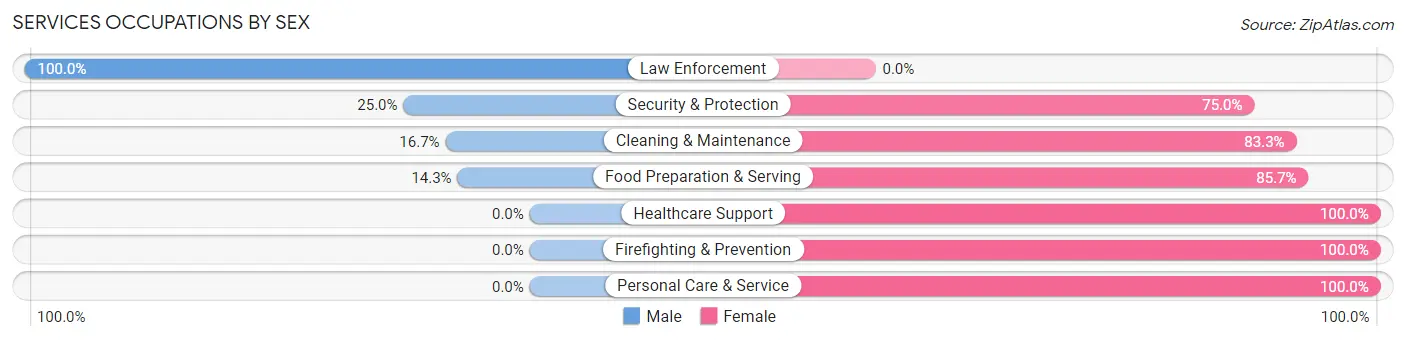
| Occupation | Male | Female |
| Healthcare Support | 0 (0.0%) | 42 (100.0%) |
| Security & Protection | 1 (25.0%) | 3 (75.0%) |
| Firefighting & Prevention | 0 (0.0%) | 3 (100.0%) |
| Law Enforcement | 1 (100.0%) | 0 (0.0%) |
| Food Preparation & Serving | 2 (14.3%) | 12 (85.7%) |
| Cleaning & Maintenance | 3 (16.7%) | 15 (83.3%) |
| Personal Care & Service | 0 (0.0%) | 23 (100.0%) |
| Total (Category) | 6 (5.9%) | 95 (94.1%) |
| Total (Overall) | 291 (47.4%) | 323 (52.6%) |
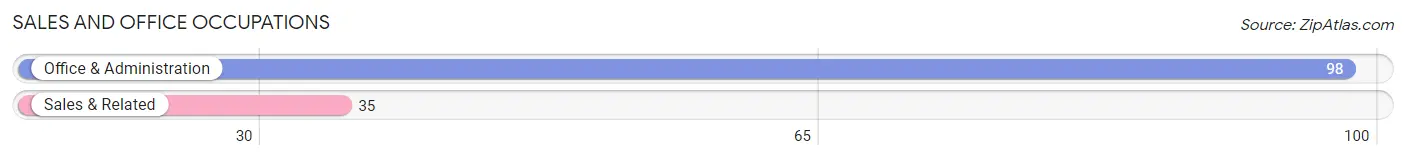
Sales and Office Occupations
The most common Sales and Office occupations in Saxonburg borough are Office & Administration (98 | 16.0%), and Sales & Related (35 | 5.7%).
Sales and Office Occupations by Sex
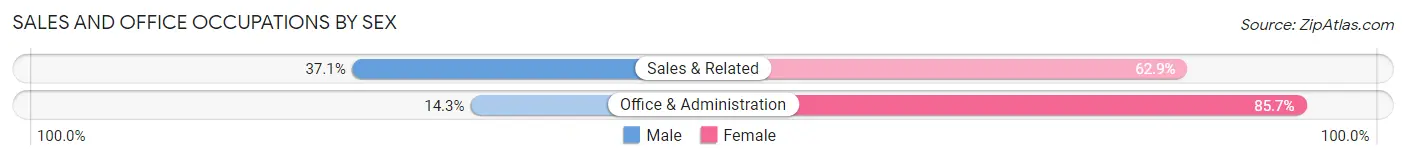
| Occupation | Male | Female |
| Sales & Related | 13 (37.1%) | 22 (62.9%) |
| Office & Administration | 14 (14.3%) | 84 (85.7%) |
| Total (Category) | 27 (20.3%) | 106 (79.7%) |
| Total (Overall) | 291 (47.4%) | 323 (52.6%) |
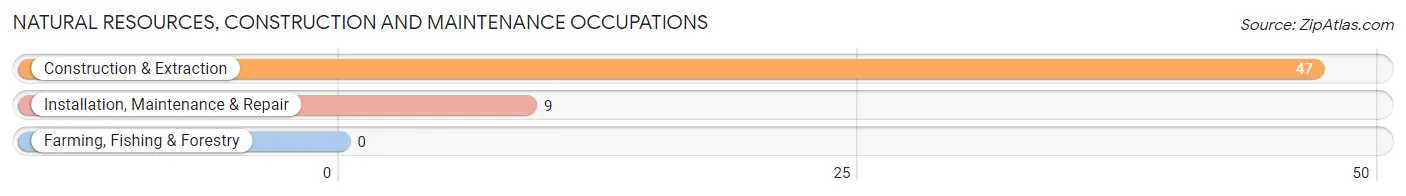
Natural Resources, Construction and Maintenance Occupations
The most common Natural Resources, Construction and Maintenance occupations in Saxonburg borough are Construction & Extraction (47 | 7.6%), and Installation, Maintenance & Repair (9 | 1.5%).
Natural Resources, Construction and Maintenance Occupations by Sex
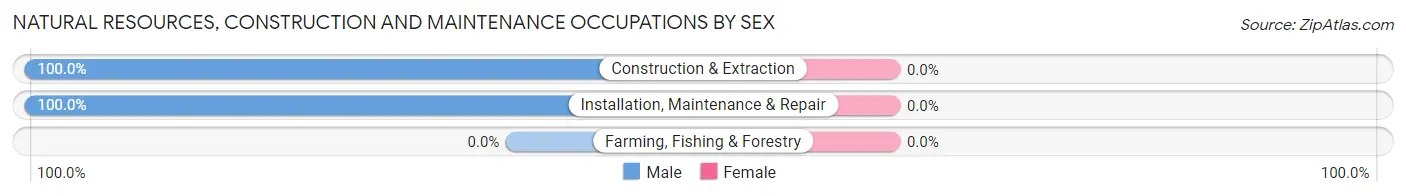
| Occupation | Male | Female |
| Farming, Fishing & Forestry | 0 (0.0%) | 0 (0.0%) |
| Construction & Extraction | 47 (100.0%) | 0 (0.0%) |
| Installation, Maintenance & Repair | 9 (100.0%) | 0 (0.0%) |
| Total (Category) | 56 (100.0%) | 0 (0.0%) |
| Total (Overall) | 291 (47.4%) | 323 (52.6%) |
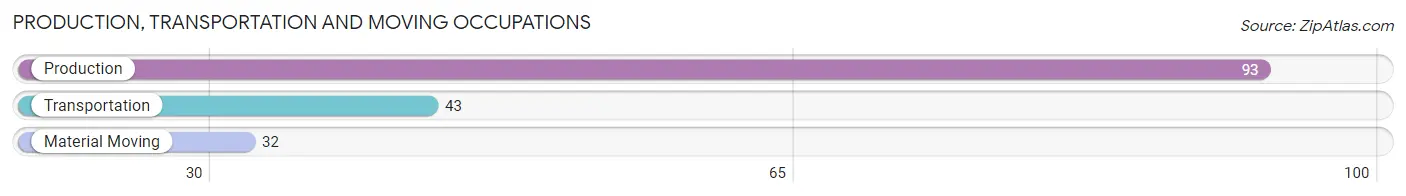
Production, Transportation and Moving Occupations
The most common Production, Transportation and Moving occupations in Saxonburg borough are Production (93 | 15.1%), Transportation (43 | 7.0%), and Material Moving (32 | 5.2%).
Production, Transportation and Moving Occupations by Sex
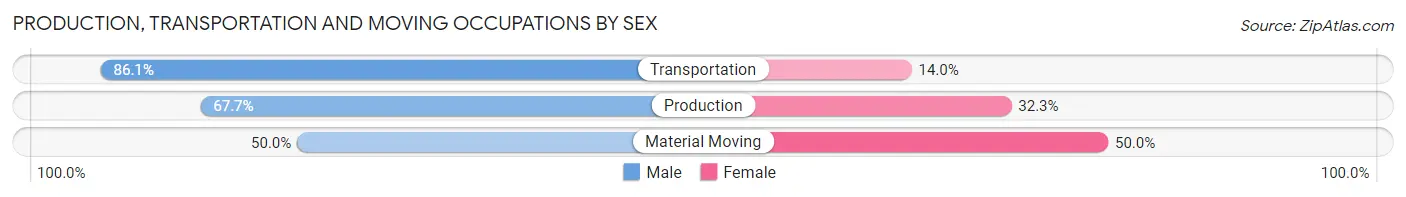
| Occupation | Male | Female |
| Production | 63 (67.7%) | 30 (32.3%) |
| Transportation | 37 (86.1%) | 6 (14.0%) |
| Material Moving | 16 (50.0%) | 16 (50.0%) |
| Total (Category) | 116 (69.1%) | 52 (30.9%) |
| Total (Overall) | 291 (47.4%) | 323 (52.6%) |
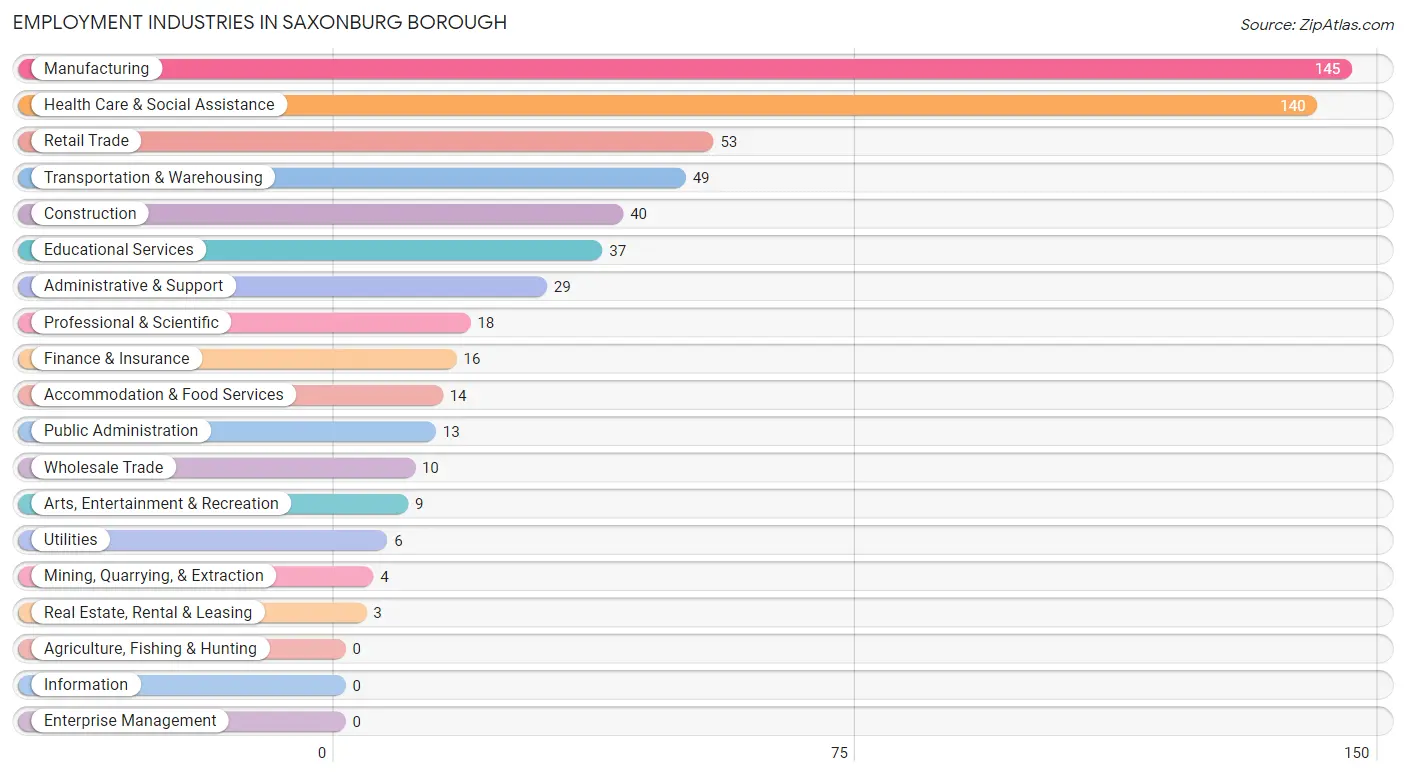
Employment Industries by Sex in Saxonburg borough
Employment Industries in Saxonburg borough
The major employment industries in Saxonburg borough include Manufacturing (145 | 23.6%), Health Care & Social Assistance (140 | 22.8%), Retail Trade (53 | 8.6%), Transportation & Warehousing (49 | 8.0%), and Construction (40 | 6.5%).
Employment Industries by Sex in Saxonburg borough
The Saxonburg borough industries that see more men than women are Mining, Quarrying, & Extraction (100.0%), Construction (100.0%), and Wholesale Trade (100.0%), whereas the industries that tend to have a higher number of women are Public Administration (92.3%), Accommodation & Food Services (85.7%), and Health Care & Social Assistance (85.0%).
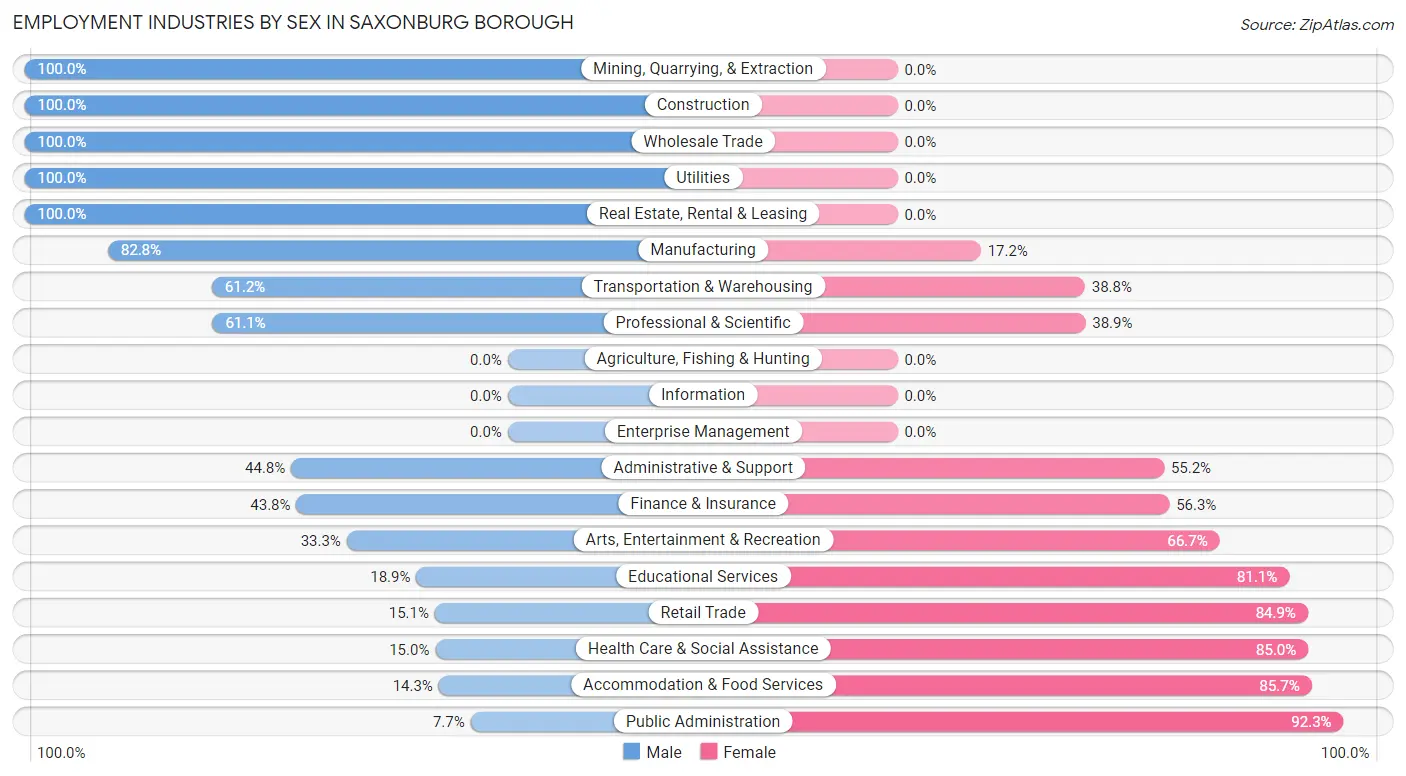
| Industry | Male | Female |
| Agriculture, Fishing & Hunting | 0 (0.0%) | 0 (0.0%) |
| Mining, Quarrying, & Extraction | 4 (100.0%) | 0 (0.0%) |
| Construction | 40 (100.0%) | 0 (0.0%) |
| Manufacturing | 120 (82.8%) | 25 (17.2%) |
| Wholesale Trade | 10 (100.0%) | 0 (0.0%) |
| Retail Trade | 8 (15.1%) | 45 (84.9%) |
| Transportation & Warehousing | 30 (61.2%) | 19 (38.8%) |
| Utilities | 6 (100.0%) | 0 (0.0%) |
| Information | 0 (0.0%) | 0 (0.0%) |
| Finance & Insurance | 7 (43.8%) | 9 (56.2%) |
| Real Estate, Rental & Leasing | 3 (100.0%) | 0 (0.0%) |
| Professional & Scientific | 11 (61.1%) | 7 (38.9%) |
| Enterprise Management | 0 (0.0%) | 0 (0.0%) |
| Administrative & Support | 13 (44.8%) | 16 (55.2%) |
| Educational Services | 7 (18.9%) | 30 (81.1%) |
| Health Care & Social Assistance | 21 (15.0%) | 119 (85.0%) |
| Arts, Entertainment & Recreation | 3 (33.3%) | 6 (66.7%) |
| Accommodation & Food Services | 2 (14.3%) | 12 (85.7%) |
| Public Administration | 1 (7.7%) | 12 (92.3%) |
| Total | 291 (47.4%) | 323 (52.6%) |
Education in Saxonburg borough
School Enrollment in Saxonburg borough
The most common levels of schooling among the 205 students in Saxonburg borough are middle school (49 | 23.9%), college / undergraduate (47 | 22.9%), and elementary school (44 | 21.5%).
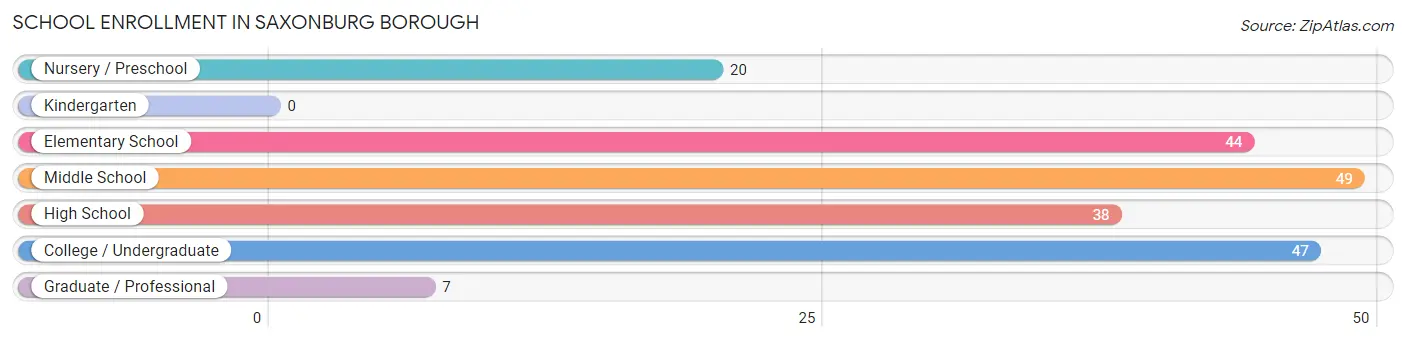
| School Level | # Students | % Students |
| Nursery / Preschool | 20 | 9.8% |
| Kindergarten | 0 | 0.0% |
| Elementary School | 44 | 21.5% |
| Middle School | 49 | 23.9% |
| High School | 38 | 18.5% |
| College / Undergraduate | 47 | 22.9% |
| Graduate / Professional | 7 | 3.4% |
| Total | 205 | 100.0% |
School Enrollment by Age by Funding Source in Saxonburg borough
Out of a total of 205 students who are enrolled in schools in Saxonburg borough, 39 (19.0%) attend a private institution, while the remaining 166 (81.0%) are enrolled in public schools. The age group of 25 to 34 year olds has the highest likelihood of being enrolled in private schools, with 12 (66.7% in the age bracket) enrolled. Conversely, the age group of 15 to 17 year olds has the lowest likelihood of being enrolled in a private school, with 29 (100.0% in the age bracket) attending a public institution.
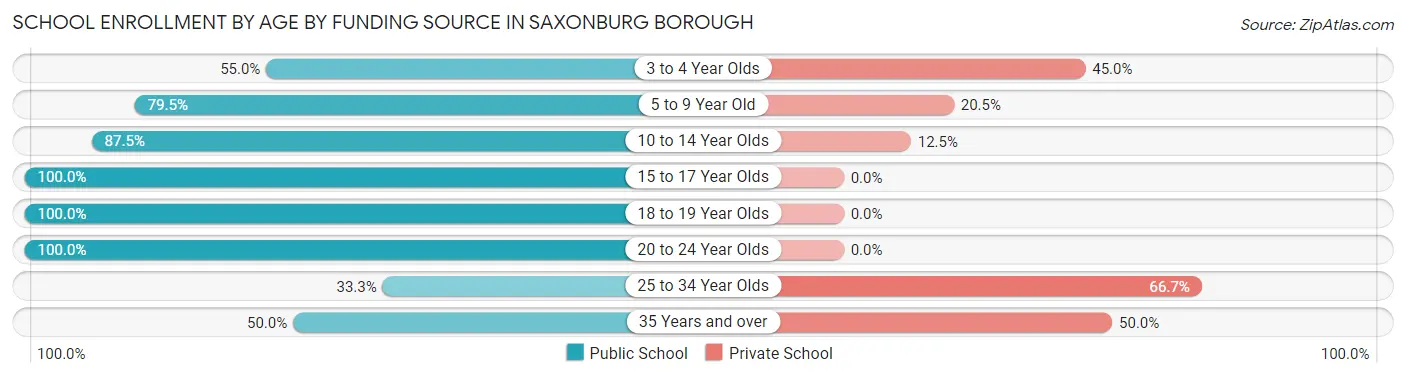
| Age Bracket | Public School | Private School |
| 3 to 4 Year Olds | 11 (55.0%) | 9 (45.0%) |
| 5 to 9 Year Old | 31 (79.5%) | 8 (20.5%) |
| 10 to 14 Year Olds | 49 (87.5%) | 7 (12.5%) |
| 15 to 17 Year Olds | 29 (100.0%) | 0 (0.0%) |
| 18 to 19 Year Olds | 25 (100.0%) | 0 (0.0%) |
| 20 to 24 Year Olds | 12 (100.0%) | 0 (0.0%) |
| 25 to 34 Year Olds | 6 (33.3%) | 12 (66.7%) |
| 35 Years and over | 3 (50.0%) | 3 (50.0%) |
| Total | 166 (81.0%) | 39 (19.0%) |
Educational Attainment by Field of Study in Saxonburg borough
Education (56 | 21.5%), business (53 | 20.3%), social sciences (26 | 10.0%), science & technology (19 | 7.3%), and bio, nature & agricultural (18 | 6.9%) are the most common fields of study among 261 individuals in Saxonburg borough who have obtained a bachelor's degree or higher.
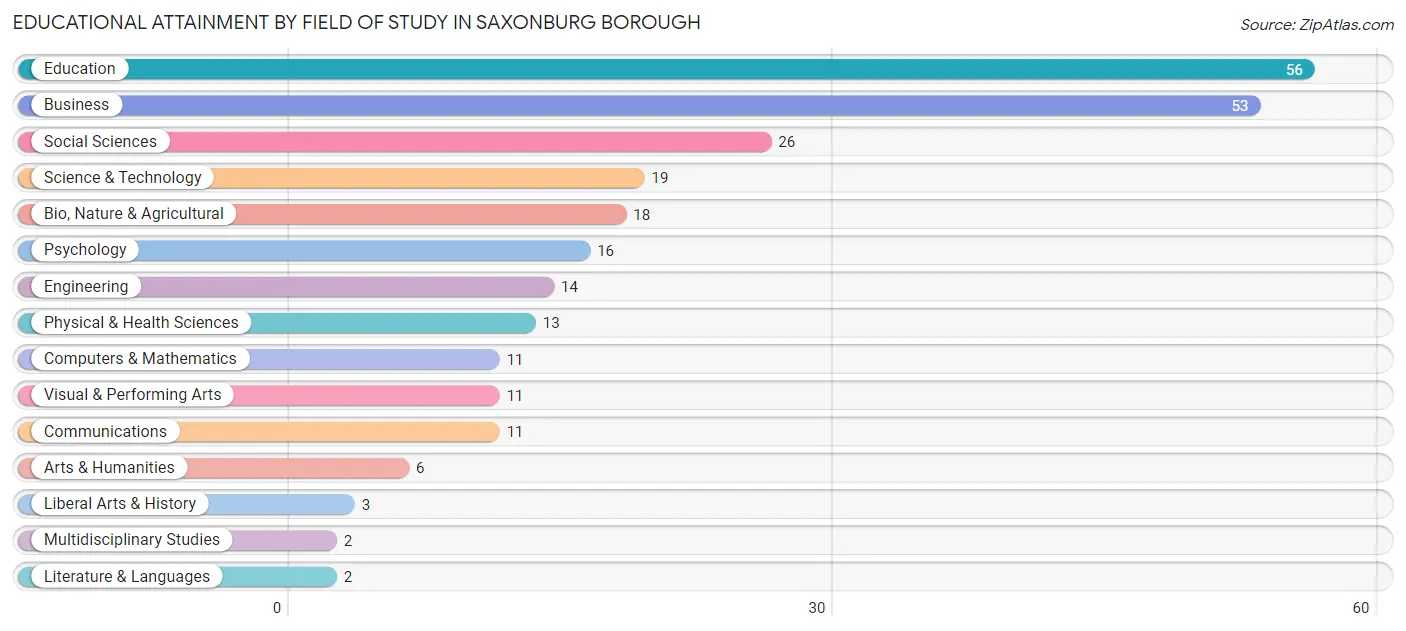
| Field of Study | # Graduates | % Graduates |
| Computers & Mathematics | 11 | 4.2% |
| Bio, Nature & Agricultural | 18 | 6.9% |
| Physical & Health Sciences | 13 | 5.0% |
| Psychology | 16 | 6.1% |
| Social Sciences | 26 | 10.0% |
| Engineering | 14 | 5.4% |
| Multidisciplinary Studies | 2 | 0.8% |
| Science & Technology | 19 | 7.3% |
| Business | 53 | 20.3% |
| Education | 56 | 21.5% |
| Literature & Languages | 2 | 0.8% |
| Liberal Arts & History | 3 | 1.1% |
| Visual & Performing Arts | 11 | 4.2% |
| Communications | 11 | 4.2% |
| Arts & Humanities | 6 | 2.3% |
| Total | 261 | 100.0% |
Transportation & Commute in Saxonburg borough
Vehicle Availability by Sex in Saxonburg borough
The most prevalent vehicle ownership categories in Saxonburg borough are males with 2 vehicles (139, accounting for 49.1%) and females with 2 vehicles (116, making up 44.8%).
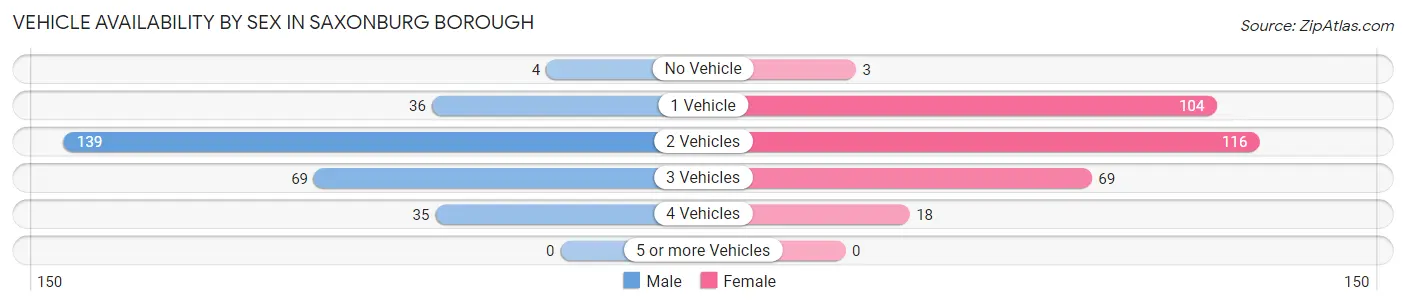
| Vehicles Available | Male | Female |
| No Vehicle | 4 (1.4%) | 3 (1.0%) |
| 1 Vehicle | 36 (12.7%) | 104 (33.6%) |
| 2 Vehicles | 139 (49.1%) | 116 (37.4%) |
| 3 Vehicles | 69 (24.4%) | 69 (22.3%) |
| 4 Vehicles | 35 (12.4%) | 18 (5.8%) |
| 5 or more Vehicles | 0 (0.0%) | 0 (0.0%) |
| Total | 283 (100.0%) | 310 (100.0%) |
Commute Time in Saxonburg borough
The most frequently occuring commute durations in Saxonburg borough are 20 to 24 minutes (88 commuters, 16.4%), 5 to 9 minutes (75 commuters, 14.0%), and 10 to 14 minutes (71 commuters, 13.3%).
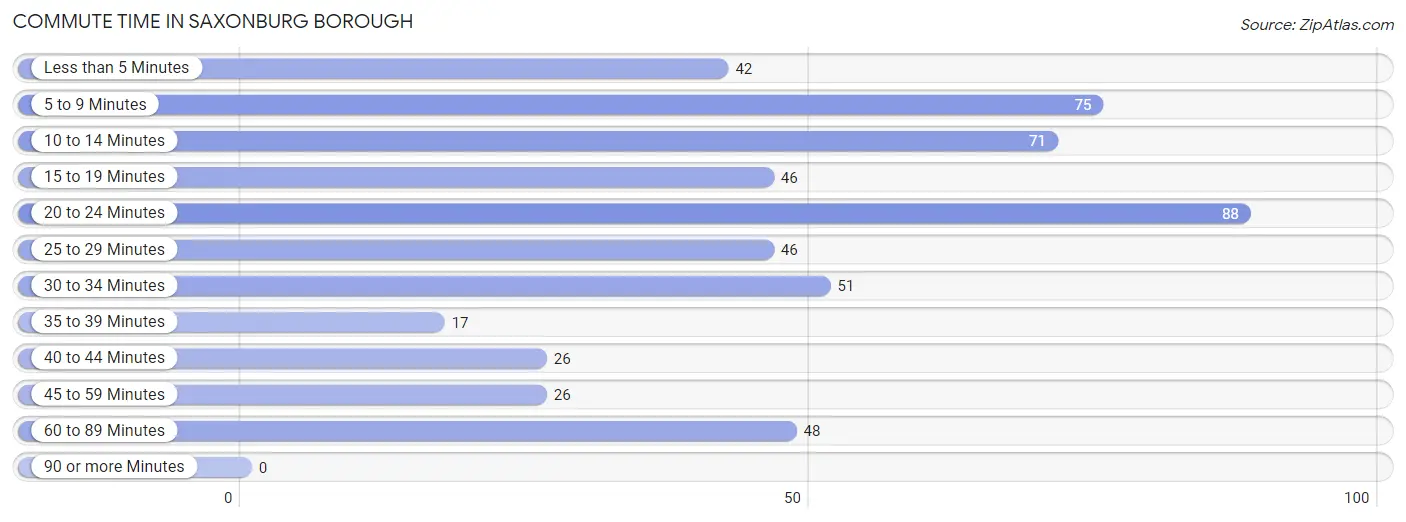
| Commute Time | # Commuters | % Commuters |
| Less than 5 Minutes | 42 | 7.8% |
| 5 to 9 Minutes | 75 | 14.0% |
| 10 to 14 Minutes | 71 | 13.3% |
| 15 to 19 Minutes | 46 | 8.6% |
| 20 to 24 Minutes | 88 | 16.4% |
| 25 to 29 Minutes | 46 | 8.6% |
| 30 to 34 Minutes | 51 | 9.5% |
| 35 to 39 Minutes | 17 | 3.2% |
| 40 to 44 Minutes | 26 | 4.9% |
| 45 to 59 Minutes | 26 | 4.9% |
| 60 to 89 Minutes | 48 | 9.0% |
| 90 or more Minutes | 0 | 0.0% |
Commute Time by Sex in Saxonburg borough
The most common commute times in Saxonburg borough are 20 to 24 minutes (36 commuters, 14.0%) for males and 20 to 24 minutes (52 commuters, 18.6%) for females.
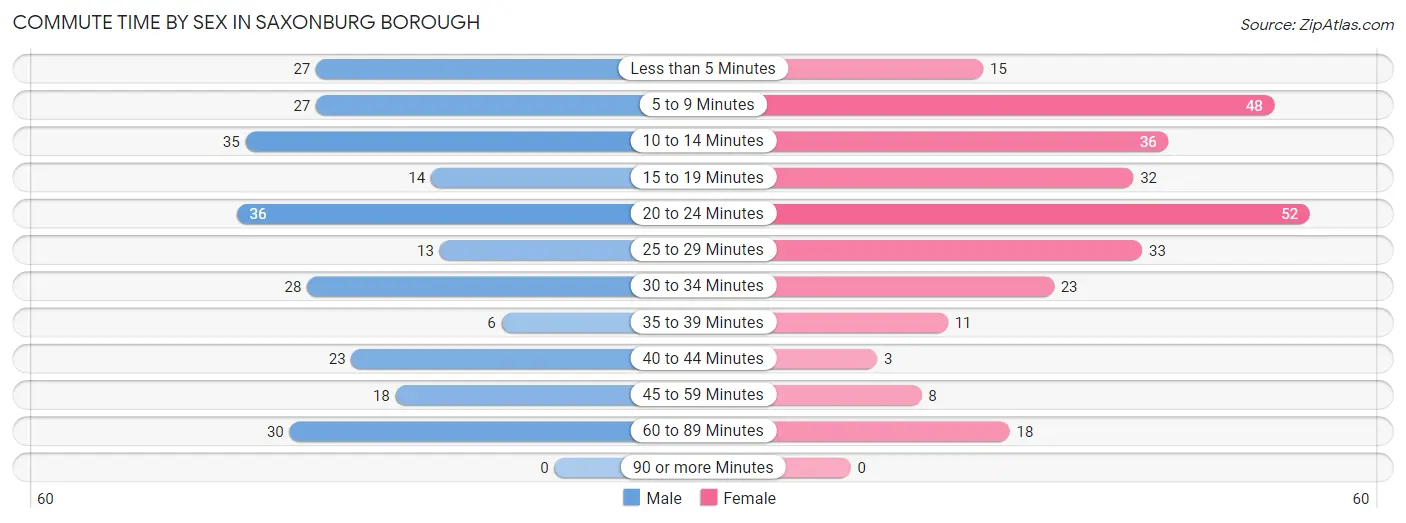
| Commute Time | Male | Female |
| Less than 5 Minutes | 27 (10.5%) | 15 (5.4%) |
| 5 to 9 Minutes | 27 (10.5%) | 48 (17.2%) |
| 10 to 14 Minutes | 35 (13.6%) | 36 (12.9%) |
| 15 to 19 Minutes | 14 (5.4%) | 32 (11.5%) |
| 20 to 24 Minutes | 36 (14.0%) | 52 (18.6%) |
| 25 to 29 Minutes | 13 (5.1%) | 33 (11.8%) |
| 30 to 34 Minutes | 28 (10.9%) | 23 (8.2%) |
| 35 to 39 Minutes | 6 (2.3%) | 11 (3.9%) |
| 40 to 44 Minutes | 23 (8.9%) | 3 (1.1%) |
| 45 to 59 Minutes | 18 (7.0%) | 8 (2.9%) |
| 60 to 89 Minutes | 30 (11.7%) | 18 (6.5%) |
| 90 or more Minutes | 0 (0.0%) | 0 (0.0%) |
Time of Departure to Work by Sex in Saxonburg borough
The most frequent times of departure to work in Saxonburg borough are 6:30 AM to 6:59 AM (37, 14.4%) for males and 7:00 AM to 7:29 AM (48, 17.2%) for females.
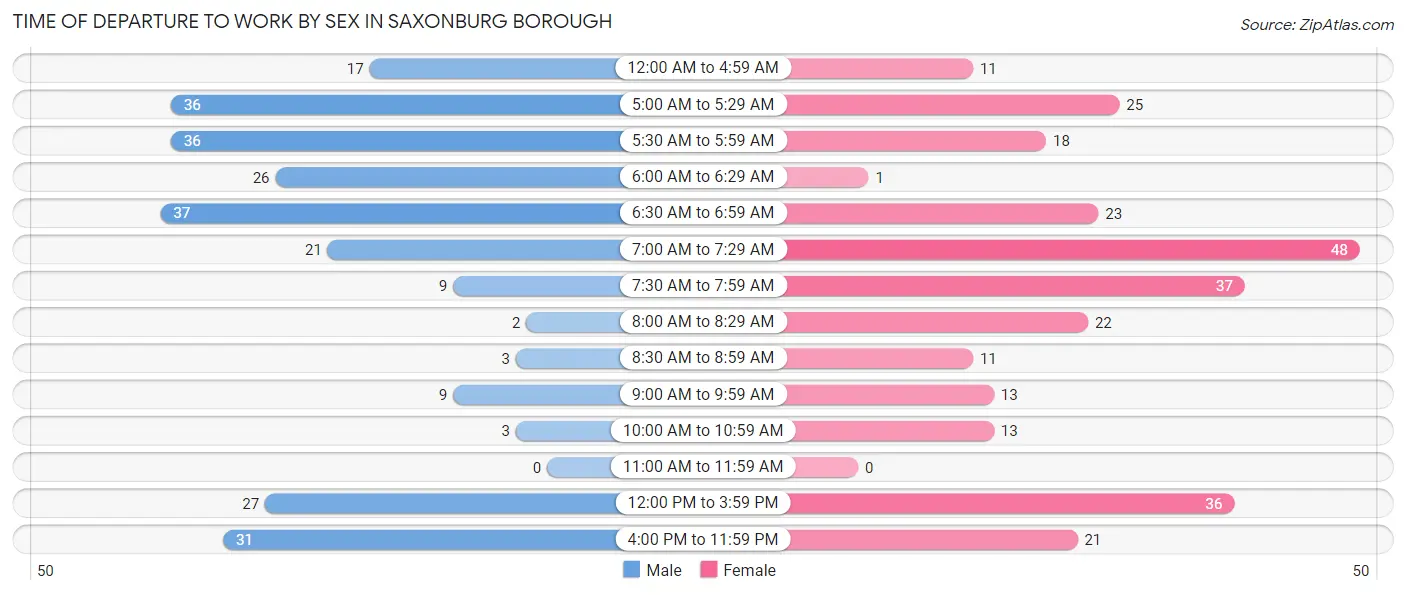
| Time of Departure | Male | Female |
| 12:00 AM to 4:59 AM | 17 (6.6%) | 11 (3.9%) |
| 5:00 AM to 5:29 AM | 36 (14.0%) | 25 (9.0%) |
| 5:30 AM to 5:59 AM | 36 (14.0%) | 18 (6.5%) |
| 6:00 AM to 6:29 AM | 26 (10.1%) | 1 (0.4%) |
| 6:30 AM to 6:59 AM | 37 (14.4%) | 23 (8.2%) |
| 7:00 AM to 7:29 AM | 21 (8.2%) | 48 (17.2%) |
| 7:30 AM to 7:59 AM | 9 (3.5%) | 37 (13.3%) |
| 8:00 AM to 8:29 AM | 2 (0.8%) | 22 (7.9%) |
| 8:30 AM to 8:59 AM | 3 (1.2%) | 11 (3.9%) |
| 9:00 AM to 9:59 AM | 9 (3.5%) | 13 (4.7%) |
| 10:00 AM to 10:59 AM | 3 (1.2%) | 13 (4.7%) |
| 11:00 AM to 11:59 AM | 0 (0.0%) | 0 (0.0%) |
| 12:00 PM to 3:59 PM | 27 (10.5%) | 36 (12.9%) |
| 4:00 PM to 11:59 PM | 31 (12.1%) | 21 (7.5%) |
| Total | 257 (100.0%) | 279 (100.0%) |
Housing Occupancy in Saxonburg borough
Occupancy by Ownership in Saxonburg borough
Of the total 629 dwellings in Saxonburg borough, owner-occupied units account for 350 (55.6%), while renter-occupied units make up 279 (44.4%).
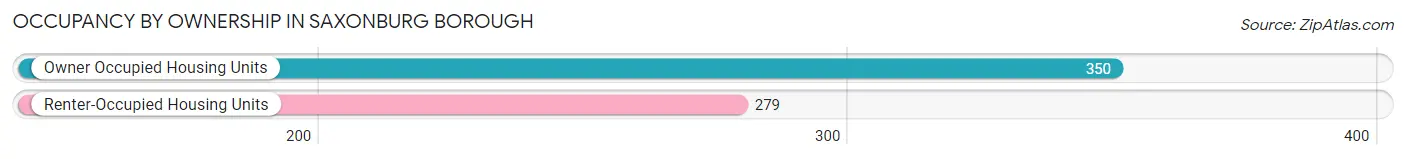
| Occupancy | # Housing Units | % Housing Units |
| Owner Occupied Housing Units | 350 | 55.6% |
| Renter-Occupied Housing Units | 279 | 44.4% |
| Total Occupied Housing Units | 629 | 100.0% |
Occupancy by Household Size in Saxonburg borough
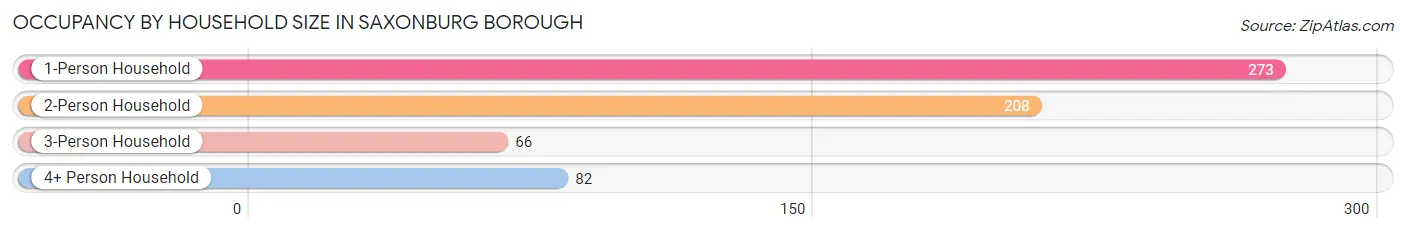
| Household Size | # Housing Units | % Housing Units |
| 1-Person Household | 273 | 43.4% |
| 2-Person Household | 208 | 33.1% |
| 3-Person Household | 66 | 10.5% |
| 4+ Person Household | 82 | 13.0% |
| Total Housing Units | 629 | 100.0% |
Occupancy by Ownership by Household Size in Saxonburg borough
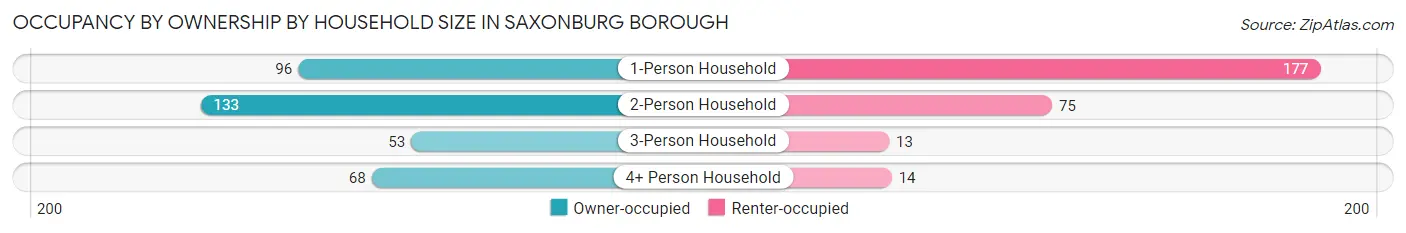
| Household Size | Owner-occupied | Renter-occupied |
| 1-Person Household | 96 (35.2%) | 177 (64.8%) |
| 2-Person Household | 133 (63.9%) | 75 (36.1%) |
| 3-Person Household | 53 (80.3%) | 13 (19.7%) |
| 4+ Person Household | 68 (82.9%) | 14 (17.1%) |
| Total Housing Units | 350 (55.6%) | 279 (44.4%) |
Occupancy by Educational Attainment in Saxonburg borough
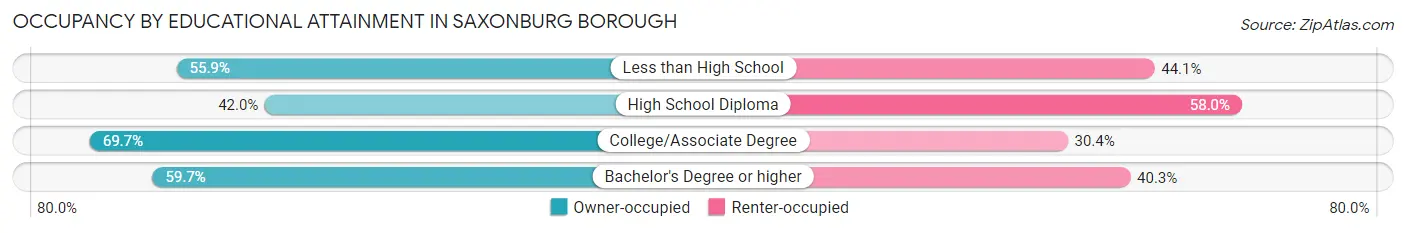
| Household Size | Owner-occupied | Renter-occupied |
| Less than High School | 19 (55.9%) | 15 (44.1%) |
| High School Diploma | 105 (42.0%) | 145 (58.0%) |
| College/Associate Degree | 140 (69.7%) | 61 (30.3%) |
| Bachelor's Degree or higher | 86 (59.7%) | 58 (40.3%) |
Occupancy by Age of Householder in Saxonburg borough
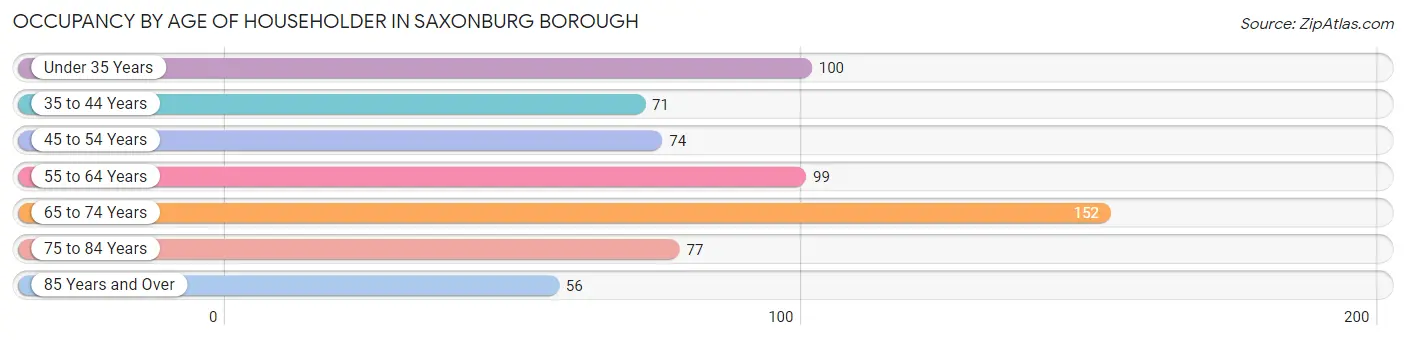
| Age Bracket | # Households | % Households |
| Under 35 Years | 100 | 15.9% |
| 35 to 44 Years | 71 | 11.3% |
| 45 to 54 Years | 74 | 11.8% |
| 55 to 64 Years | 99 | 15.7% |
| 65 to 74 Years | 152 | 24.2% |
| 75 to 84 Years | 77 | 12.2% |
| 85 Years and Over | 56 | 8.9% |
| Total | 629 | 100.0% |
Housing Finances in Saxonburg borough
Median Income by Occupancy in Saxonburg borough
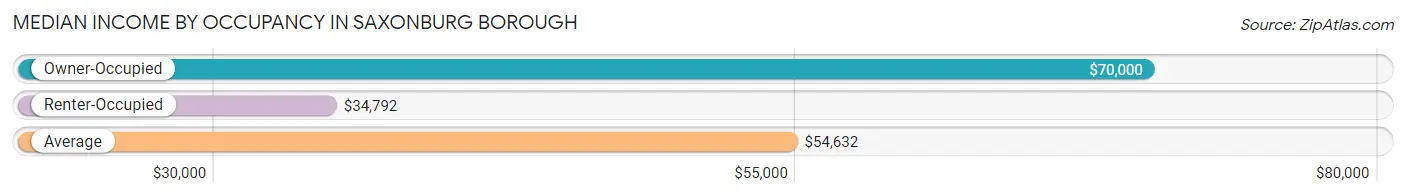
| Occupancy Type | # Households | Median Income |
| Owner-Occupied | 350 (55.6%) | $70,000 |
| Renter-Occupied | 279 (44.4%) | $34,792 |
| Average | 629 (100.0%) | $54,632 |
Occupancy by Householder Income Bracket in Saxonburg borough
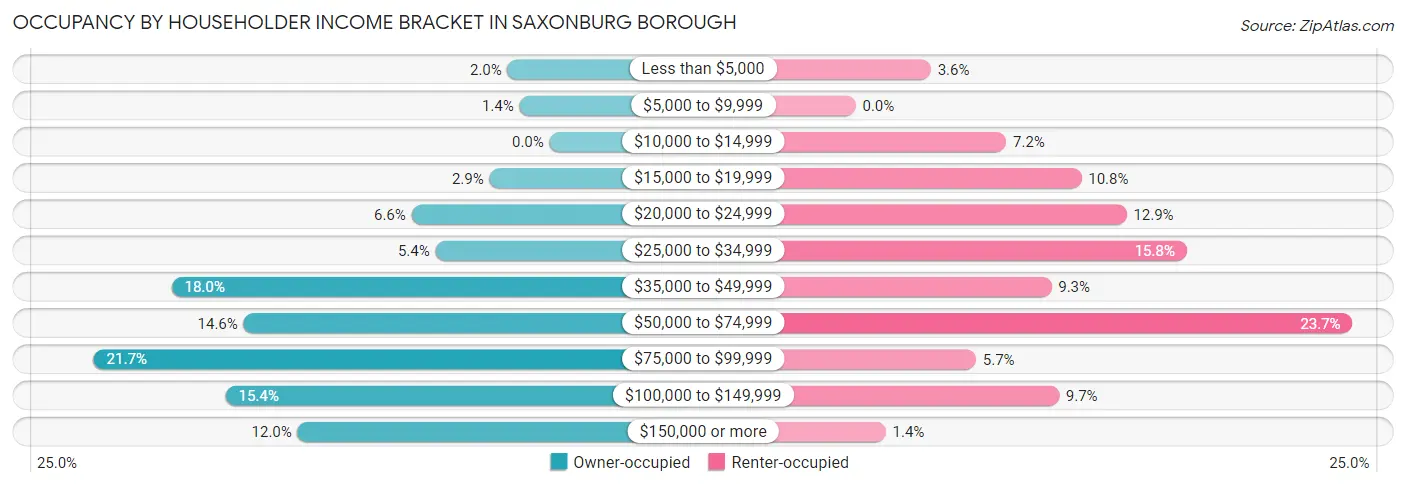
| Income Bracket | Owner-occupied | Renter-occupied |
| Less than $5,000 | 7 (2.0%) | 10 (3.6%) |
| $5,000 to $9,999 | 5 (1.4%) | 0 (0.0%) |
| $10,000 to $14,999 | 0 (0.0%) | 20 (7.2%) |
| $15,000 to $19,999 | 10 (2.9%) | 30 (10.7%) |
| $20,000 to $24,999 | 23 (6.6%) | 36 (12.9%) |
| $25,000 to $34,999 | 19 (5.4%) | 44 (15.8%) |
| $35,000 to $49,999 | 63 (18.0%) | 26 (9.3%) |
| $50,000 to $74,999 | 51 (14.6%) | 66 (23.7%) |
| $75,000 to $99,999 | 76 (21.7%) | 16 (5.7%) |
| $100,000 to $149,999 | 54 (15.4%) | 27 (9.7%) |
| $150,000 or more | 42 (12.0%) | 4 (1.4%) |
| Total | 350 (100.0%) | 279 (100.0%) |
Monthly Housing Cost Tiers in Saxonburg borough
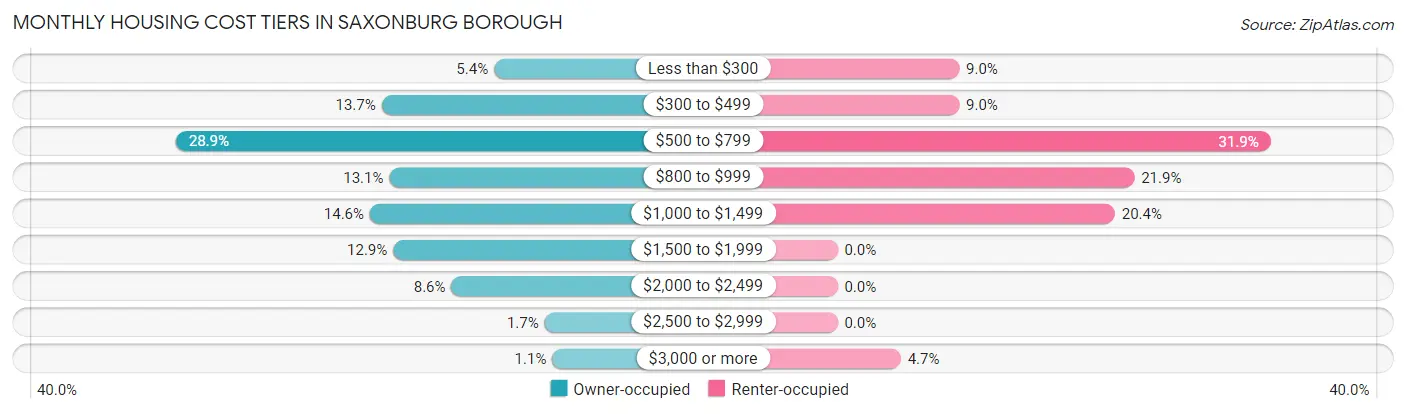
| Monthly Cost | Owner-occupied | Renter-occupied |
| Less than $300 | 19 (5.4%) | 25 (9.0%) |
| $300 to $499 | 48 (13.7%) | 25 (9.0%) |
| $500 to $799 | 101 (28.9%) | 89 (31.9%) |
| $800 to $999 | 46 (13.1%) | 61 (21.9%) |
| $1,000 to $1,499 | 51 (14.6%) | 57 (20.4%) |
| $1,500 to $1,999 | 45 (12.9%) | 0 (0.0%) |
| $2,000 to $2,499 | 30 (8.6%) | 0 (0.0%) |
| $2,500 to $2,999 | 6 (1.7%) | 0 (0.0%) |
| $3,000 or more | 4 (1.1%) | 13 (4.7%) |
| Total | 350 (100.0%) | 279 (100.0%) |
Physical Housing Characteristics in Saxonburg borough
Housing Structures in Saxonburg borough
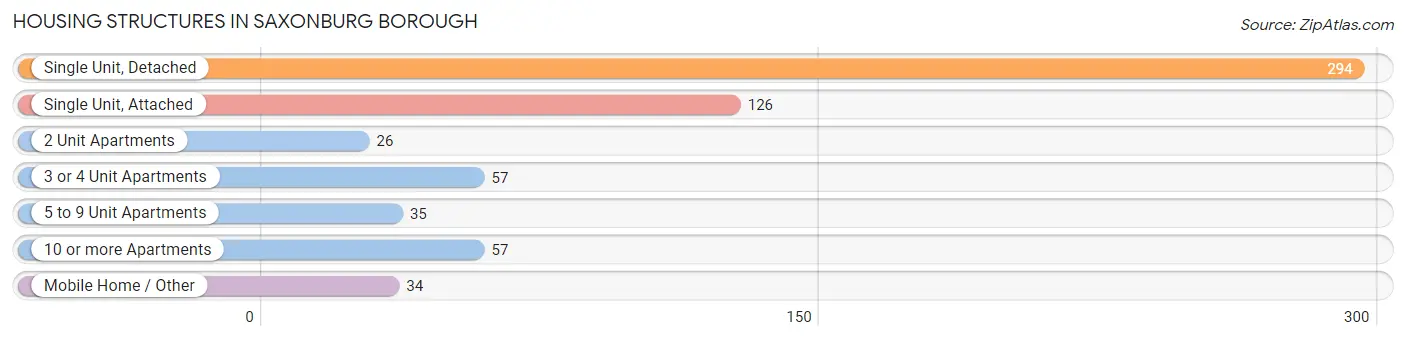
| Structure Type | # Housing Units | % Housing Units |
| Single Unit, Detached | 294 | 46.7% |
| Single Unit, Attached | 126 | 20.0% |
| 2 Unit Apartments | 26 | 4.1% |
| 3 or 4 Unit Apartments | 57 | 9.1% |
| 5 to 9 Unit Apartments | 35 | 5.6% |
| 10 or more Apartments | 57 | 9.1% |
| Mobile Home / Other | 34 | 5.4% |
| Total | 629 | 100.0% |
Housing Structures by Occupancy in Saxonburg borough
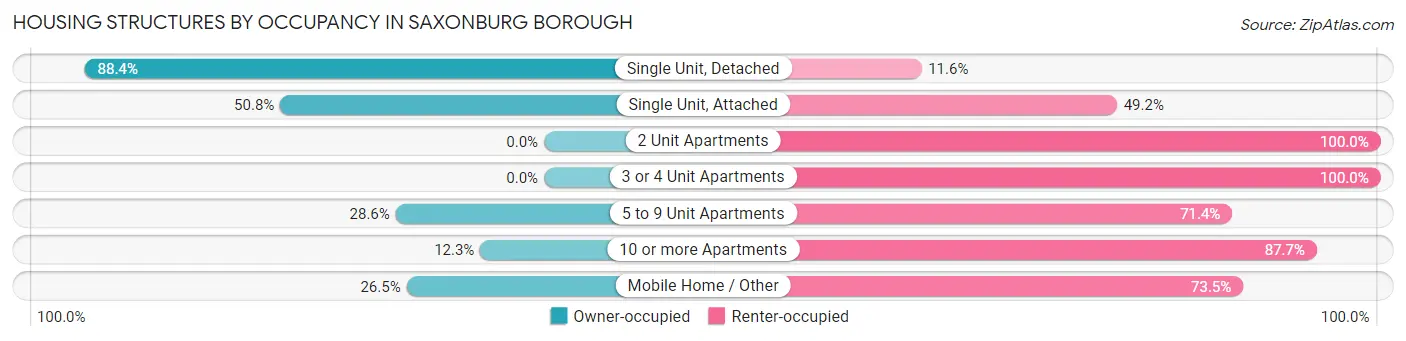
| Structure Type | Owner-occupied | Renter-occupied |
| Single Unit, Detached | 260 (88.4%) | 34 (11.6%) |
| Single Unit, Attached | 64 (50.8%) | 62 (49.2%) |
| 2 Unit Apartments | 0 (0.0%) | 26 (100.0%) |
| 3 or 4 Unit Apartments | 0 (0.0%) | 57 (100.0%) |
| 5 to 9 Unit Apartments | 10 (28.6%) | 25 (71.4%) |
| 10 or more Apartments | 7 (12.3%) | 50 (87.7%) |
| Mobile Home / Other | 9 (26.5%) | 25 (73.5%) |
| Total | 350 (55.6%) | 279 (44.4%) |
Housing Structures by Number of Rooms in Saxonburg borough
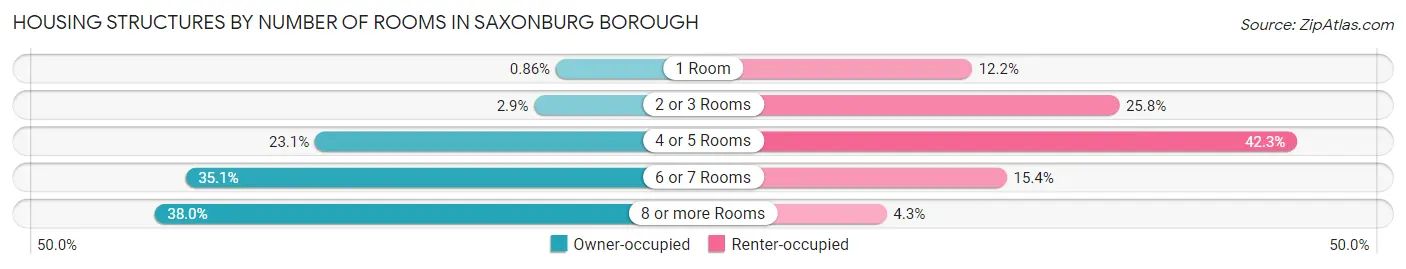
| Number of Rooms | Owner-occupied | Renter-occupied |
| 1 Room | 3 (0.9%) | 34 (12.2%) |
| 2 or 3 Rooms | 10 (2.9%) | 72 (25.8%) |
| 4 or 5 Rooms | 81 (23.1%) | 118 (42.3%) |
| 6 or 7 Rooms | 123 (35.1%) | 43 (15.4%) |
| 8 or more Rooms | 133 (38.0%) | 12 (4.3%) |
| Total | 350 (100.0%) | 279 (100.0%) |
Housing Structure by Heating Type in Saxonburg borough
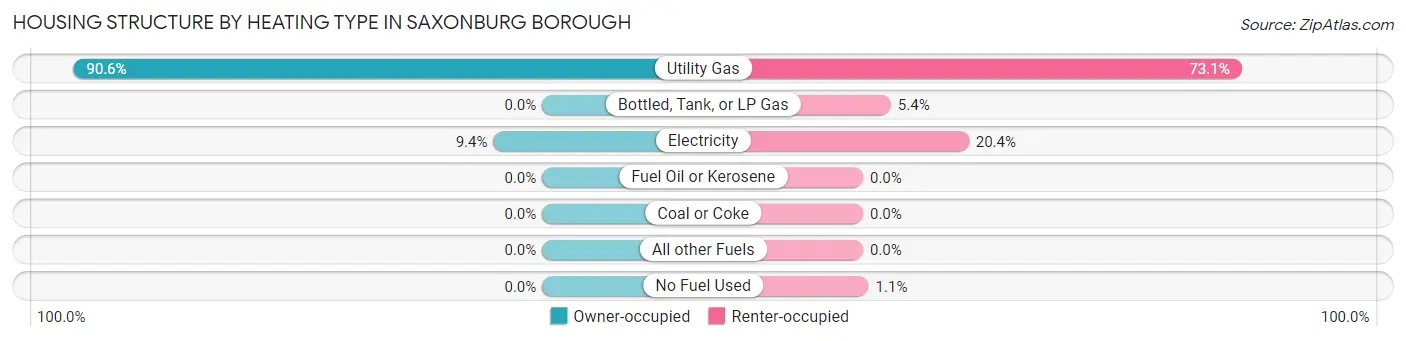
| Heating Type | Owner-occupied | Renter-occupied |
| Utility Gas | 317 (90.6%) | 204 (73.1%) |
| Bottled, Tank, or LP Gas | 0 (0.0%) | 15 (5.4%) |
| Electricity | 33 (9.4%) | 57 (20.4%) |
| Fuel Oil or Kerosene | 0 (0.0%) | 0 (0.0%) |
| Coal or Coke | 0 (0.0%) | 0 (0.0%) |
| All other Fuels | 0 (0.0%) | 0 (0.0%) |
| No Fuel Used | 0 (0.0%) | 3 (1.1%) |
| Total | 350 (100.0%) | 279 (100.0%) |
Household Vehicle Usage in Saxonburg borough
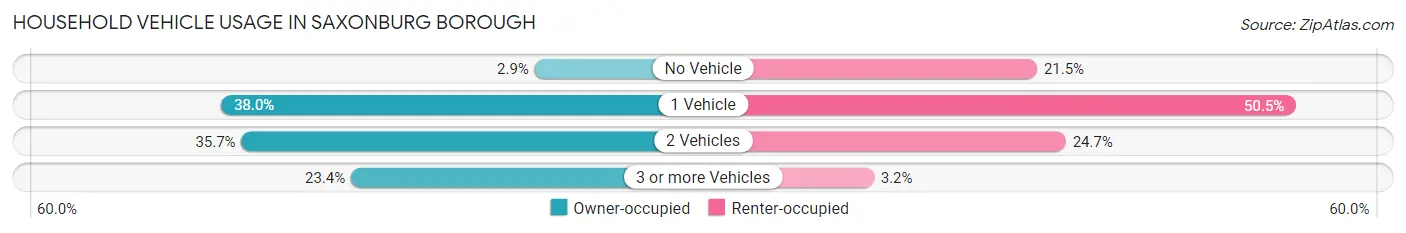
| Vehicles per Household | Owner-occupied | Renter-occupied |
| No Vehicle | 10 (2.9%) | 60 (21.5%) |
| 1 Vehicle | 133 (38.0%) | 141 (50.5%) |
| 2 Vehicles | 125 (35.7%) | 69 (24.7%) |
| 3 or more Vehicles | 82 (23.4%) | 9 (3.2%) |
| Total | 350 (100.0%) | 279 (100.0%) |
Real Estate & Mortgages in Saxonburg borough
Real Estate and Mortgage Overview in Saxonburg borough
| Characteristic | Without Mortgage | With Mortgage |
| Housing Units | 153 | 197 |
| Median Property Value | $169,000 | $200,900 |
| Median Household Income | $51,563 | $33 |
| Monthly Housing Costs | $546 | $4 |
| Real Estate Taxes | $2,375 | $0 |
Property Value by Mortgage Status in Saxonburg borough
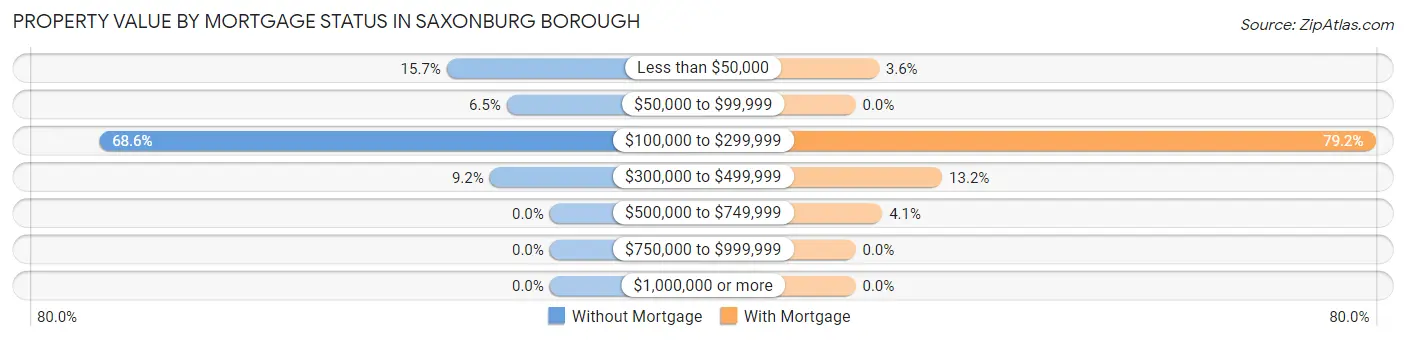
| Property Value | Without Mortgage | With Mortgage |
| Less than $50,000 | 24 (15.7%) | 7 (3.5%) |
| $50,000 to $99,999 | 10 (6.5%) | 0 (0.0%) |
| $100,000 to $299,999 | 105 (68.6%) | 156 (79.2%) |
| $300,000 to $499,999 | 14 (9.1%) | 26 (13.2%) |
| $500,000 to $749,999 | 0 (0.0%) | 8 (4.1%) |
| $750,000 to $999,999 | 0 (0.0%) | 0 (0.0%) |
| $1,000,000 or more | 0 (0.0%) | 0 (0.0%) |
| Total | 153 (100.0%) | 197 (100.0%) |
Household Income by Mortgage Status in Saxonburg borough
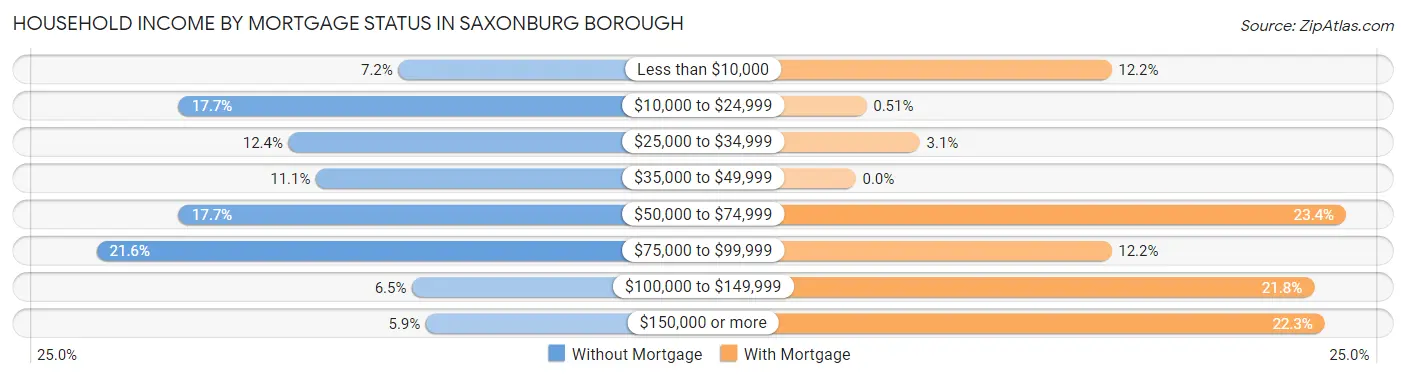
| Household Income | Without Mortgage | With Mortgage |
| Less than $10,000 | 11 (7.2%) | 24 (12.2%) |
| $10,000 to $24,999 | 27 (17.6%) | 1 (0.5%) |
| $25,000 to $34,999 | 19 (12.4%) | 6 (3.0%) |
| $35,000 to $49,999 | 17 (11.1%) | 0 (0.0%) |
| $50,000 to $74,999 | 27 (17.6%) | 46 (23.4%) |
| $75,000 to $99,999 | 33 (21.6%) | 24 (12.2%) |
| $100,000 to $149,999 | 10 (6.5%) | 43 (21.8%) |
| $150,000 or more | 9 (5.9%) | 44 (22.3%) |
| Total | 153 (100.0%) | 197 (100.0%) |
Property Value to Household Income Ratio in Saxonburg borough
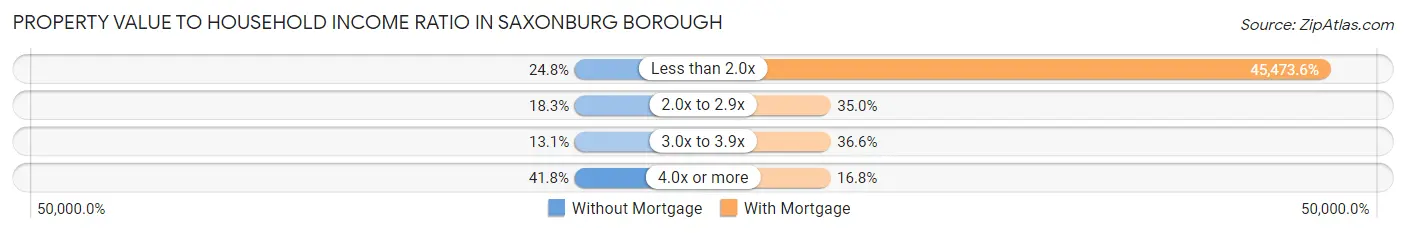
| Value-to-Income Ratio | Without Mortgage | With Mortgage |
| Less than 2.0x | 38 (24.8%) | 89,583 (45,473.6%) |
| 2.0x to 2.9x | 28 (18.3%) | 69 (35.0%) |
| 3.0x to 3.9x | 20 (13.1%) | 72 (36.5%) |
| 4.0x or more | 64 (41.8%) | 33 (16.8%) |
| Total | 153 (100.0%) | 197 (100.0%) |
Real Estate Taxes by Mortgage Status in Saxonburg borough
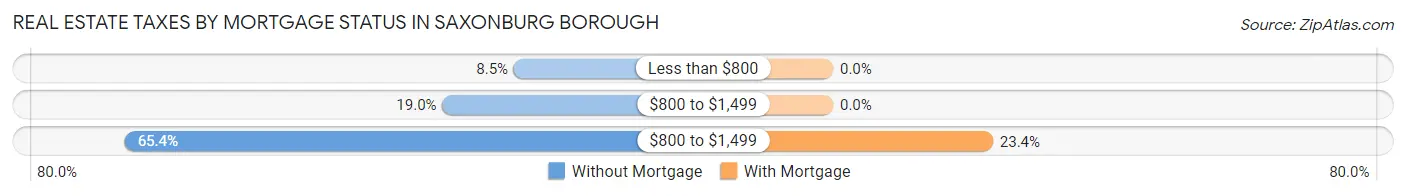
| Property Taxes | Without Mortgage | With Mortgage |
| Less than $800 | 13 (8.5%) | 0 (0.0%) |
| $800 to $1,499 | 29 (19.0%) | 0 (0.0%) |
| $800 to $1,499 | 100 (65.4%) | 46 (23.4%) |
| Total | 153 (100.0%) | 197 (100.0%) |
Health & Disability in Saxonburg borough
Health Insurance Coverage by Age in Saxonburg borough
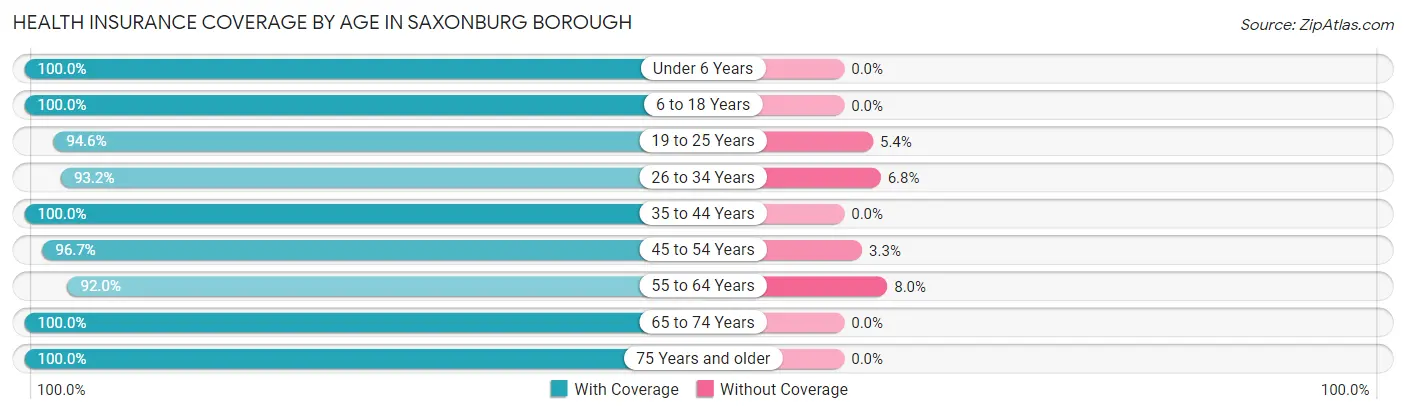
| Age Bracket | With Coverage | Without Coverage |
| Under 6 Years | 79 (100.0%) | 0 (0.0%) |
| 6 to 18 Years | 145 (100.0%) | 0 (0.0%) |
| 19 to 25 Years | 53 (94.6%) | 3 (5.4%) |
| 26 to 34 Years | 151 (93.2%) | 11 (6.8%) |
| 35 to 44 Years | 126 (100.0%) | 0 (0.0%) |
| 45 to 54 Years | 116 (96.7%) | 4 (3.3%) |
| 55 to 64 Years | 172 (92.0%) | 15 (8.0%) |
| 65 to 74 Years | 199 (100.0%) | 0 (0.0%) |
| 75 Years and older | 196 (100.0%) | 0 (0.0%) |
| Total | 1,237 (97.4%) | 33 (2.6%) |
Health Insurance Coverage by Citizenship Status in Saxonburg borough
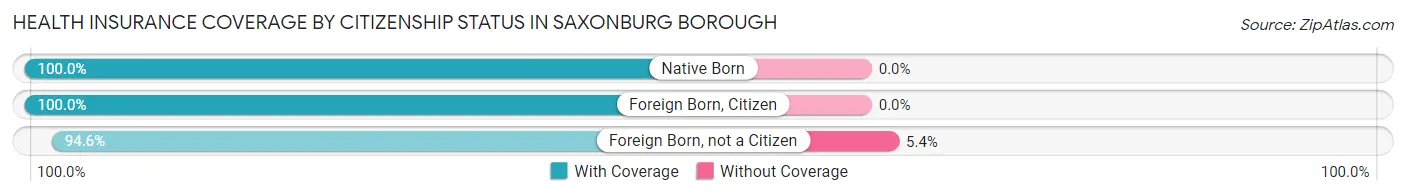
| Citizenship Status | With Coverage | Without Coverage |
| Native Born | 79 (100.0%) | 0 (0.0%) |
| Foreign Born, Citizen | 145 (100.0%) | 0 (0.0%) |
| Foreign Born, not a Citizen | 53 (94.6%) | 3 (5.4%) |
Health Insurance Coverage by Household Income in Saxonburg borough
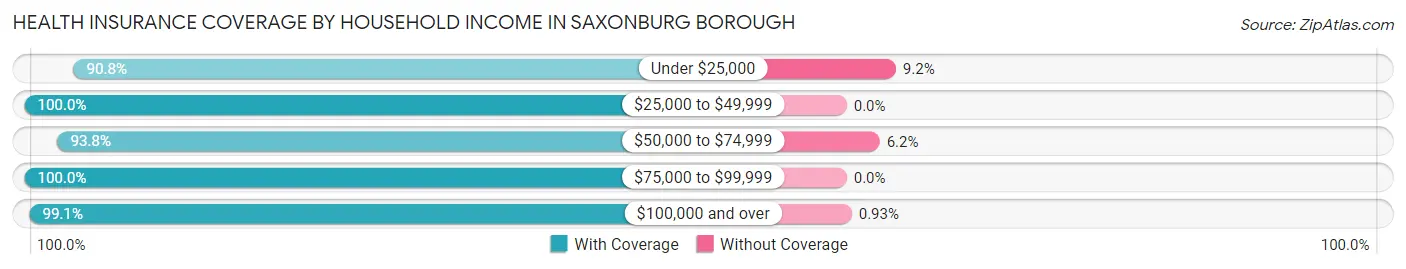
| Household Income | With Coverage | Without Coverage |
| Under $25,000 | 148 (90.8%) | 15 (9.2%) |
| $25,000 to $49,999 | 226 (100.0%) | 0 (0.0%) |
| $50,000 to $74,999 | 213 (93.8%) | 14 (6.2%) |
| $75,000 to $99,999 | 220 (100.0%) | 0 (0.0%) |
| $100,000 and over | 425 (99.1%) | 4 (0.9%) |
Public vs Private Health Insurance Coverage by Age in Saxonburg borough
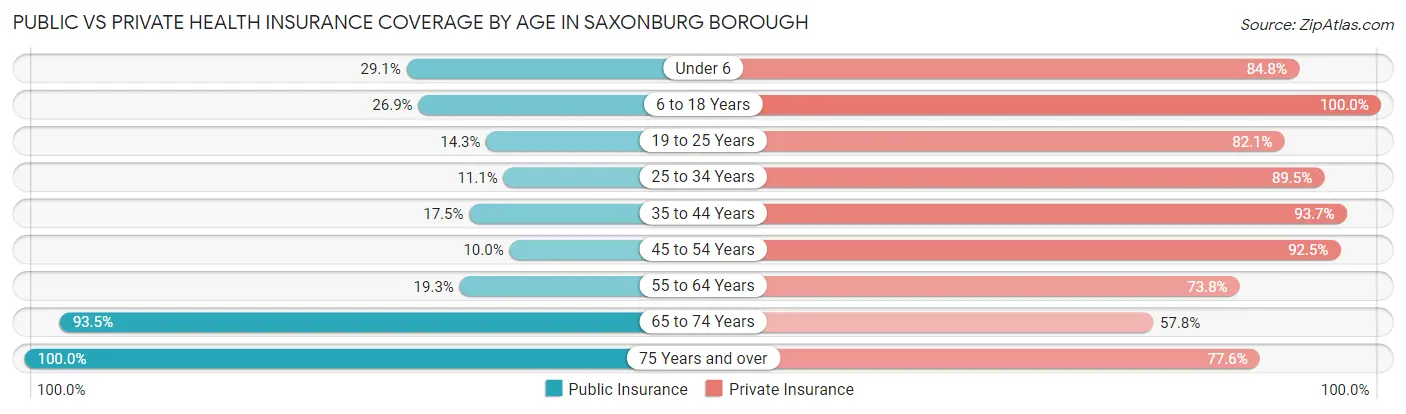
| Age Bracket | Public Insurance | Private Insurance |
| Under 6 | 23 (29.1%) | 67 (84.8%) |
| 6 to 18 Years | 39 (26.9%) | 145 (100.0%) |
| 19 to 25 Years | 8 (14.3%) | 46 (82.1%) |
| 25 to 34 Years | 18 (11.1%) | 145 (89.5%) |
| 35 to 44 Years | 22 (17.5%) | 118 (93.6%) |
| 45 to 54 Years | 12 (10.0%) | 111 (92.5%) |
| 55 to 64 Years | 36 (19.3%) | 138 (73.8%) |
| 65 to 74 Years | 186 (93.5%) | 115 (57.8%) |
| 75 Years and over | 196 (100.0%) | 152 (77.5%) |
| Total | 540 (42.5%) | 1,037 (81.7%) |
Disability Status by Sex by Age in Saxonburg borough
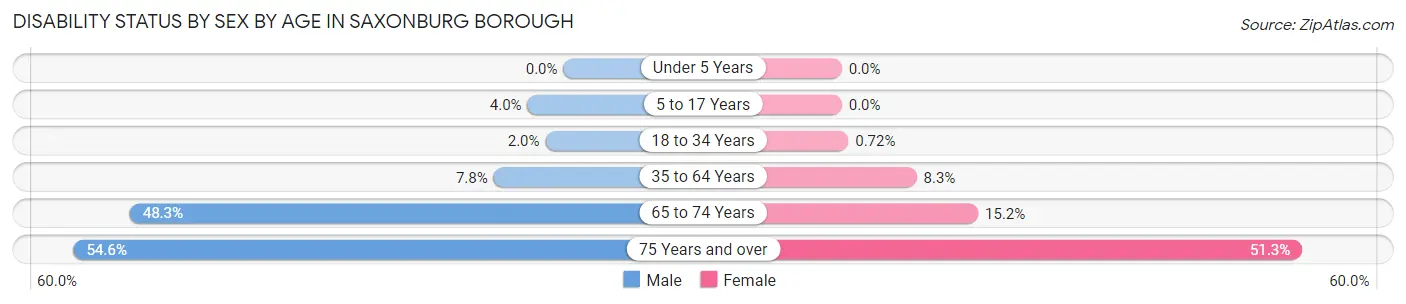
| Age Bracket | Male | Female |
| Under 5 Years | 0 (0.0%) | 0 (0.0%) |
| 5 to 17 Years | 2 (4.0%) | 0 (0.0%) |
| 18 to 34 Years | 2 (2.0%) | 1 (0.7%) |
| 35 to 64 Years | 15 (7.8%) | 20 (8.3%) |
| 65 to 74 Years | 42 (48.3%) | 17 (15.2%) |
| 75 Years and over | 42 (54.5%) | 61 (51.3%) |
Disability Class by Sex by Age in Saxonburg borough
Disability Class: Hearing Difficulty
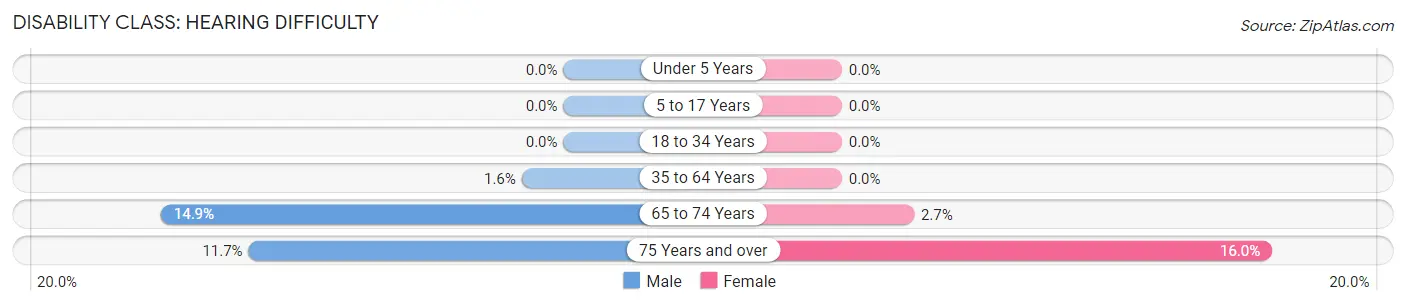
| Age Bracket | Male | Female |
| Under 5 Years | 0 (0.0%) | 0 (0.0%) |
| 5 to 17 Years | 0 (0.0%) | 0 (0.0%) |
| 18 to 34 Years | 0 (0.0%) | 0 (0.0%) |
| 35 to 64 Years | 3 (1.5%) | 0 (0.0%) |
| 65 to 74 Years | 13 (14.9%) | 3 (2.7%) |
| 75 Years and over | 9 (11.7%) | 19 (16.0%) |
Disability Class: Vision Difficulty
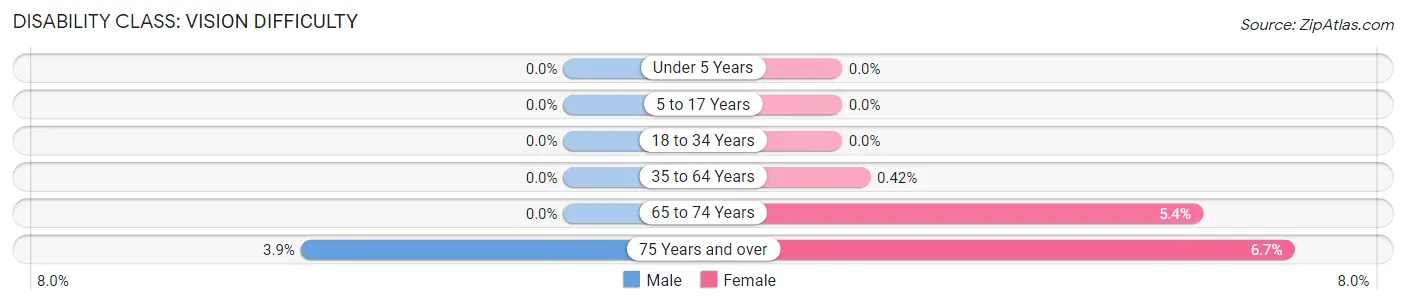
| Age Bracket | Male | Female |
| Under 5 Years | 0 (0.0%) | 0 (0.0%) |
| 5 to 17 Years | 0 (0.0%) | 0 (0.0%) |
| 18 to 34 Years | 0 (0.0%) | 0 (0.0%) |
| 35 to 64 Years | 0 (0.0%) | 1 (0.4%) |
| 65 to 74 Years | 0 (0.0%) | 6 (5.4%) |
| 75 Years and over | 3 (3.9%) | 8 (6.7%) |
Disability Class: Cognitive Difficulty
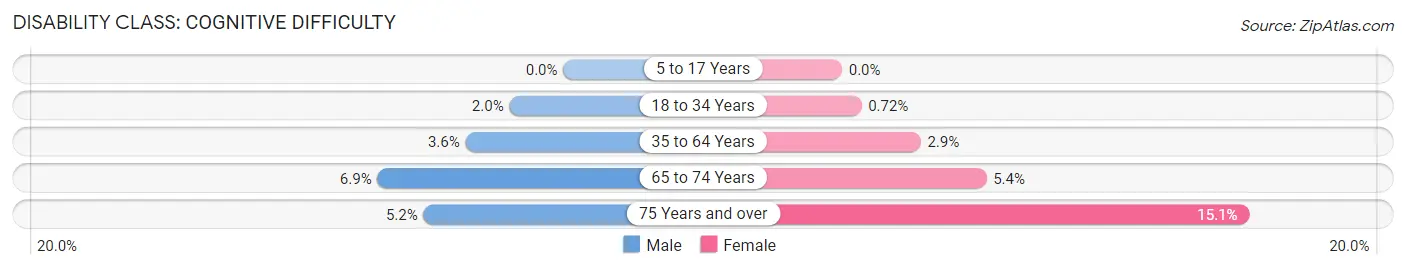
| Age Bracket | Male | Female |
| 5 to 17 Years | 0 (0.0%) | 0 (0.0%) |
| 18 to 34 Years | 2 (2.0%) | 1 (0.7%) |
| 35 to 64 Years | 7 (3.6%) | 7 (2.9%) |
| 65 to 74 Years | 6 (6.9%) | 6 (5.4%) |
| 75 Years and over | 4 (5.2%) | 18 (15.1%) |
Disability Class: Ambulatory Difficulty
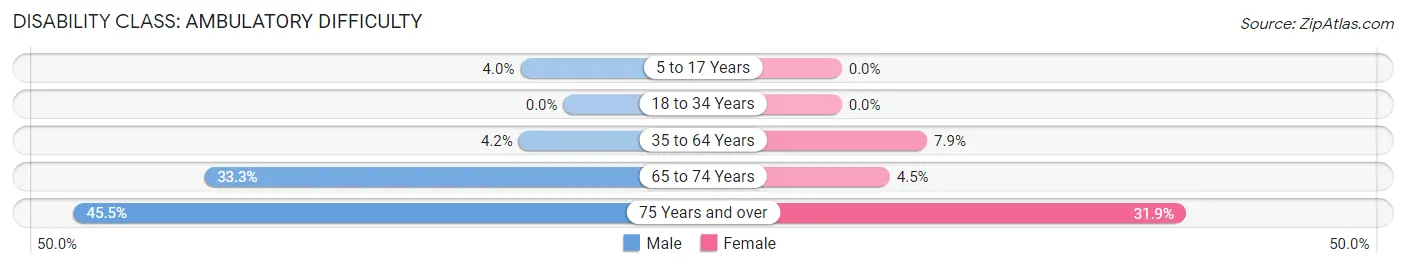
| Age Bracket | Male | Female |
| 5 to 17 Years | 2 (4.0%) | 0 (0.0%) |
| 18 to 34 Years | 0 (0.0%) | 0 (0.0%) |
| 35 to 64 Years | 8 (4.2%) | 19 (7.9%) |
| 65 to 74 Years | 29 (33.3%) | 5 (4.5%) |
| 75 Years and over | 35 (45.5%) | 38 (31.9%) |
Disability Class: Self-Care Difficulty
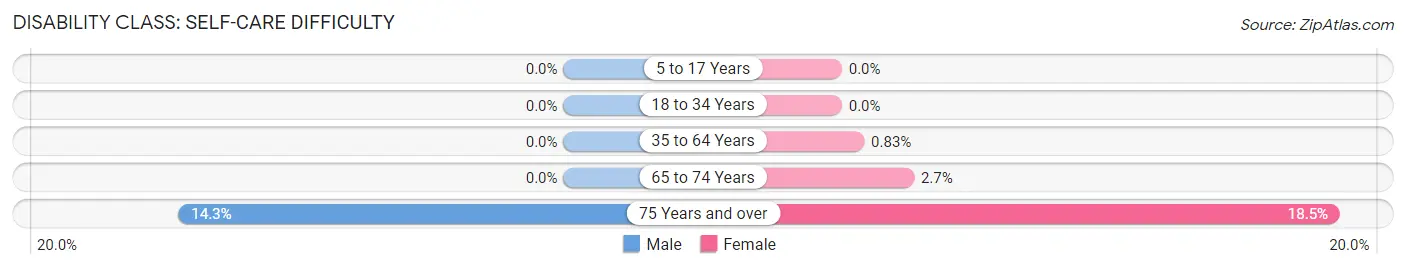
| Age Bracket | Male | Female |
| 5 to 17 Years | 0 (0.0%) | 0 (0.0%) |
| 18 to 34 Years | 0 (0.0%) | 0 (0.0%) |
| 35 to 64 Years | 0 (0.0%) | 2 (0.8%) |
| 65 to 74 Years | 0 (0.0%) | 3 (2.7%) |
| 75 Years and over | 11 (14.3%) | 22 (18.5%) |
Technology Access in Saxonburg borough
Computing Device Access in Saxonburg borough
| Device Type | # Households | % Households |
| Desktop or Laptop | 425 | 67.6% |
| Smartphone | 433 | 68.8% |
| Tablet | 368 | 58.5% |
| No Computing Device | 83 | 13.2% |
| Total | 629 | 100.0% |
Internet Access in Saxonburg borough
| Internet Type | # Households | % Households |
| Dial-Up Internet | 5 | 0.8% |
| Broadband Home | 460 | 73.1% |
| Cellular Data Only | 51 | 8.1% |
| Satellite Internet | 17 | 2.7% |
| No Internet | 99 | 15.7% |
| Total | 629 | 100.0% |
Saxonburg borough Summary
Saxonburg Borough is a small borough located in Butler County, Pennsylvania. It is situated in the western part of the state, approximately 30 miles north of Pittsburgh. The borough was founded in 1832 by John A. Roebling, a German immigrant who is best known for his work on the Brooklyn Bridge. Saxonburg is a quaint, rural community with a population of just over 1,000 people.
Geography
Saxonburg Borough is located in the western part of Butler County, Pennsylvania. It is situated in the Allegheny Plateau region of the state, which is characterized by rolling hills and valleys. The borough is bordered by the townships of Buffalo, Forward, and Winfield. The borough is located approximately 30 miles north of Pittsburgh and is accessible via Interstate 79.
The borough is situated on the banks of the Connoquenessing Creek, which flows through the center of the borough. The creek is a tributary of the Allegheny River and is a popular destination for fishing and recreational activities. The borough is also home to several parks, including Saxonburg Memorial Park, which features a playground, picnic area, and walking trails.
Economy
Saxonburg Borough is a small, rural community with a population of just over 1,000 people. The borough is home to several small businesses, including a grocery store, a hardware store, and a few restaurants. The borough is also home to several manufacturing companies, including a steel mill and a paper mill.
The borough is also home to several farms, which produce a variety of crops, including corn, soybeans, and hay. The borough is also home to several wineries, which produce a variety of wines.
Demographics
As of the 2010 census, the population of Saxonburg Borough was 1,072. The racial makeup of the borough was 97.3% White, 0.9% African American, 0.2% Native American, 0.3% Asian, and 1.3% from two or more races. Hispanic or Latino of any race were 0.7% of the population.
The median household income in Saxonburg Borough was $45,938, and the median family income was $51,250. The per capita income for the borough was $20,945. About 8.2% of families and 10.2% of the population were below the poverty line, including 14.3% of those under age 18 and 5.2% of those age 65 or over.
Conclusion
Saxonburg Borough is a small, rural community located in Butler County, Pennsylvania. The borough was founded in 1832 by John A. Roebling and is home to just over 1,000 people. The borough is situated on the banks of the Connoquenessing Creek and is home to several small businesses, manufacturing companies, farms, and wineries. The population of Saxonburg Borough is predominantly White, with a median household income of $45,938 and a median family income of $51,250.
Common Questions
What is Per Capita Income in Saxonburg borough?
Per Capita income in Saxonburg borough is $34,587.
What is the Median Family Income in Saxonburg borough?
Median Family Income in Saxonburg borough is $85,938.
What is the Median Household income in Saxonburg borough?
Median Household Income in Saxonburg borough is $54,632.
What is Income or Wage Gap in Saxonburg borough?
Income or Wage Gap in Saxonburg borough is 30.6%.
Women in Saxonburg borough earn 69.4 cents for every dollar earned by a man.
What is Inequality or Gini Index in Saxonburg borough?
Inequality or Gini Index in Saxonburg borough is 0.43.
What is the Total Population of Saxonburg borough?
Total Population of Saxonburg borough is 1,333.
What is the Total Male Population of Saxonburg borough?
Total Male Population of Saxonburg borough is 553.
What is the Total Female Population of Saxonburg borough?
Total Female Population of Saxonburg borough is 780.
What is the Ratio of Males per 100 Females in Saxonburg borough?
There are 70.90 Males per 100 Females in Saxonburg borough.
What is the Ratio of Females per 100 Males in Saxonburg borough?
There are 141.05 Females per 100 Males in Saxonburg borough.
What is the Median Population Age in Saxonburg borough?
Median Population Age in Saxonburg borough is 53.7 Years.
What is the Average Family Size in Saxonburg borough
Average Family Size in Saxonburg borough is 2.8 People.
What is the Average Household Size in Saxonburg borough
Average Household Size in Saxonburg borough is 2.0 People.
How Large is the Labor Force in Saxonburg borough?
There are 628 People in the Labor Forcein in Saxonburg borough.
What is the Percentage of People in the Labor Force in Saxonburg borough?
55.0% of People are in the Labor Force in Saxonburg borough.
What is the Unemployment Rate in Saxonburg borough?
Unemployment Rate in Saxonburg borough is 2.2%.