Honey Brook borough, PA Map & Demographics
Honey Brook borough Overview
$36,480
PER CAPITA INCOME
$82,750
AVG FAMILY INCOME
$87,885
AVG HOUSEHOLD INCOME
34.6%
WAGE / INCOME GAP [ % ]
65.4¢/ $1
WAGE / INCOME GAP [ $ ]
0.33
INEQUALITY / GINI INDEX
2,005
TOTAL POPULATION
984
MALE POPULATION
1,021
FEMALE POPULATION
96.38
MALES / 100 FEMALES
103.76
FEMALES / 100 MALES
34.1
MEDIAN AGE
3.4
AVG FAMILY SIZE
2.9
AVG HOUSEHOLD SIZE
1,081
LABOR FORCE [ PEOPLE ]
75.2%
PERCENT IN LABOR FORCE
2.3%
UNEMPLOYMENT RATE
Income in Honey Brook borough
Income Overview in Honey Brook borough
Per Capita Income in Honey Brook borough is $36,480, while median incomes of families and households are $82,750 and $87,885 respectively.
| Characteristic | Number | Measure |
| Per Capita Income | 2,005 | $36,480 |
| Median Family Income | 468 | $82,750 |
| Mean Family Income | 468 | $101,928 |
| Median Household Income | 702 | $87,885 |
| Mean Household Income | 702 | $102,309 |
| Income Deficit | 468 | $0 |
| Wage / Income Gap (%) | 2,005 | 34.61% |
| Wage / Income Gap ($) | 2,005 | 65.39¢ per $1 |
| Gini / Inequality Index | 2,005 | 0.33 |
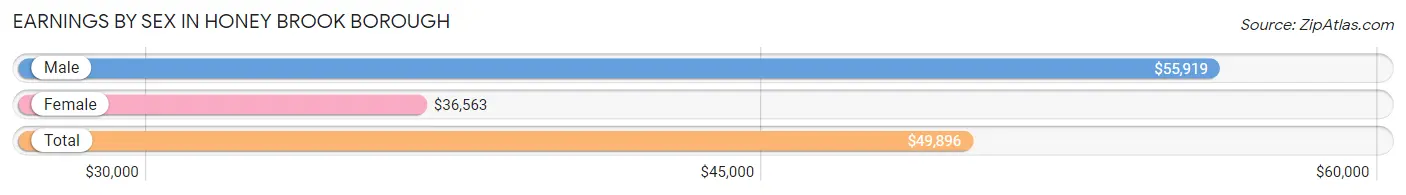
Earnings by Sex in Honey Brook borough
Average Earnings in Honey Brook borough are $49,896, $55,919 for men and $36,563 for women, a difference of 34.6%.
| Sex | Number | Average Earnings |
| Male | 627 (54.5%) | $55,919 |
| Female | 524 (45.5%) | $36,563 |
| Total | 1,151 (100.0%) | $49,896 |
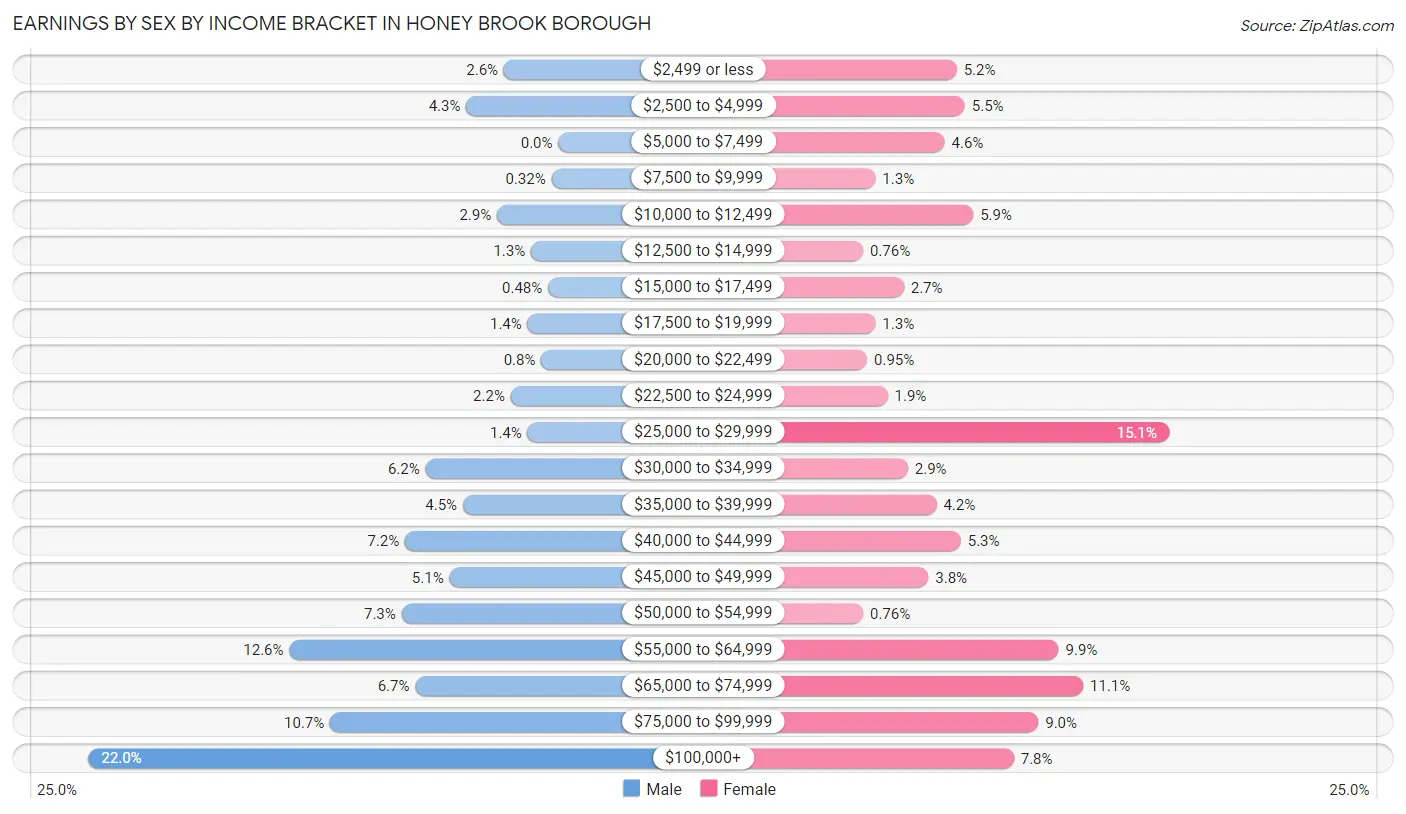
Earnings by Sex by Income Bracket in Honey Brook borough
The most common earnings brackets in Honey Brook borough are $100,000+ for men (138 | 22.0%) and $25,000 to $29,999 for women (79 | 15.1%).
| Income | Male | Female |
| $2,499 or less | 16 (2.5%) | 27 (5.1%) |
| $2,500 to $4,999 | 27 (4.3%) | 29 (5.5%) |
| $5,000 to $7,499 | 0 (0.0%) | 24 (4.6%) |
| $7,500 to $9,999 | 2 (0.3%) | 7 (1.3%) |
| $10,000 to $12,499 | 18 (2.9%) | 31 (5.9%) |
| $12,500 to $14,999 | 8 (1.3%) | 4 (0.8%) |
| $15,000 to $17,499 | 3 (0.5%) | 14 (2.7%) |
| $17,500 to $19,999 | 9 (1.4%) | 7 (1.3%) |
| $20,000 to $22,499 | 5 (0.8%) | 5 (0.9%) |
| $22,500 to $24,999 | 14 (2.2%) | 10 (1.9%) |
| $25,000 to $29,999 | 9 (1.4%) | 79 (15.1%) |
| $30,000 to $34,999 | 39 (6.2%) | 15 (2.9%) |
| $35,000 to $39,999 | 28 (4.5%) | 22 (4.2%) |
| $40,000 to $44,999 | 45 (7.2%) | 28 (5.3%) |
| $45,000 to $49,999 | 32 (5.1%) | 20 (3.8%) |
| $50,000 to $54,999 | 46 (7.3%) | 4 (0.8%) |
| $55,000 to $64,999 | 79 (12.6%) | 52 (9.9%) |
| $65,000 to $74,999 | 42 (6.7%) | 58 (11.1%) |
| $75,000 to $99,999 | 67 (10.7%) | 47 (9.0%) |
| $100,000+ | 138 (22.0%) | 41 (7.8%) |
| Total | 627 (100.0%) | 524 (100.0%) |
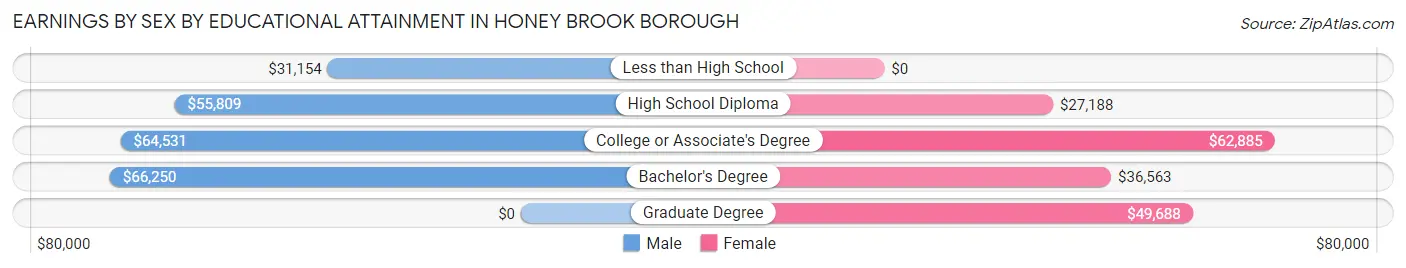
Earnings by Sex by Educational Attainment in Honey Brook borough
Average earnings in Honey Brook borough are $60,417 for men and $42,891 for women, a difference of 29.0%. Men with an educational attainment of bachelor's degree enjoy the highest average annual earnings of $66,250, while those with less than high school education earn the least with $31,154. Women with an educational attainment of college or associate's degree earn the most with the average annual earnings of $62,885, while those with high school diploma education have the smallest earnings of $27,188.
| Educational Attainment | Male Income | Female Income |
| Less than High School | $31,154 | $0 |
| High School Diploma | $55,809 | $27,188 |
| College or Associate's Degree | $64,531 | $62,885 |
| Bachelor's Degree | $66,250 | $36,563 |
| Graduate Degree | - | - |
| Total | $60,417 | $42,891 |
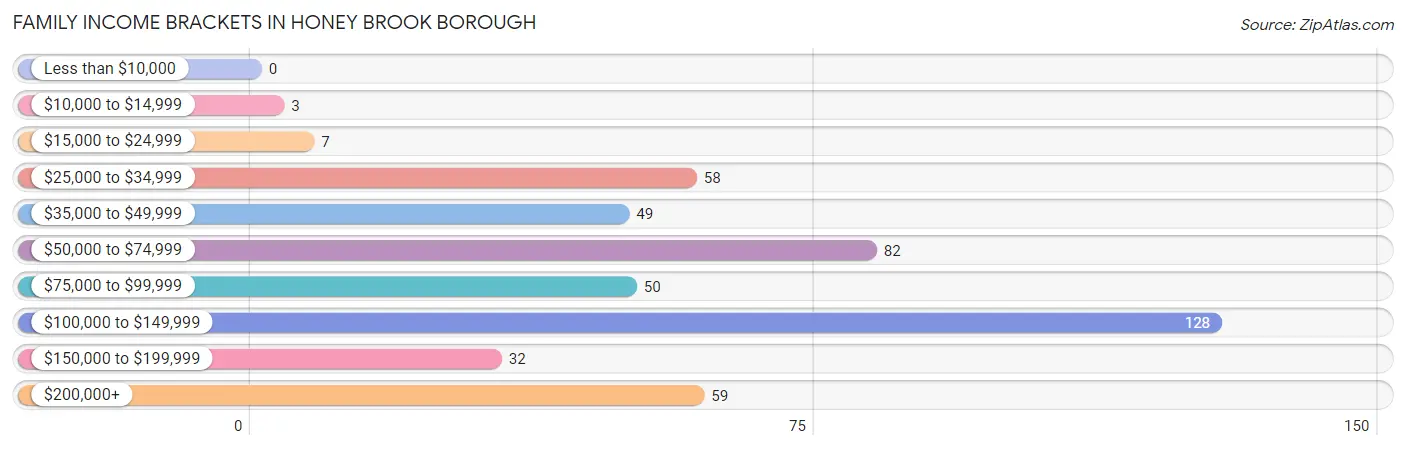
Family Income in Honey Brook borough
Family Income Brackets in Honey Brook borough
According to the Honey Brook borough family income data, there are 128 families falling into the $100,000 to $149,999 income range, which is the most common income bracket and makes up 27.4% of all families.
| Income Bracket | # Families | % Families |
| Less than $10,000 | 0 | 0.0% |
| $10,000 to $14,999 | 3 | 0.6% |
| $15,000 to $24,999 | 7 | 1.5% |
| $25,000 to $34,999 | 58 | 12.4% |
| $35,000 to $49,999 | 49 | 10.5% |
| $50,000 to $74,999 | 82 | 17.5% |
| $75,000 to $99,999 | 50 | 10.7% |
| $100,000 to $149,999 | 128 | 27.4% |
| $150,000 to $199,999 | 32 | 6.8% |
| $200,000+ | 59 | 12.6% |
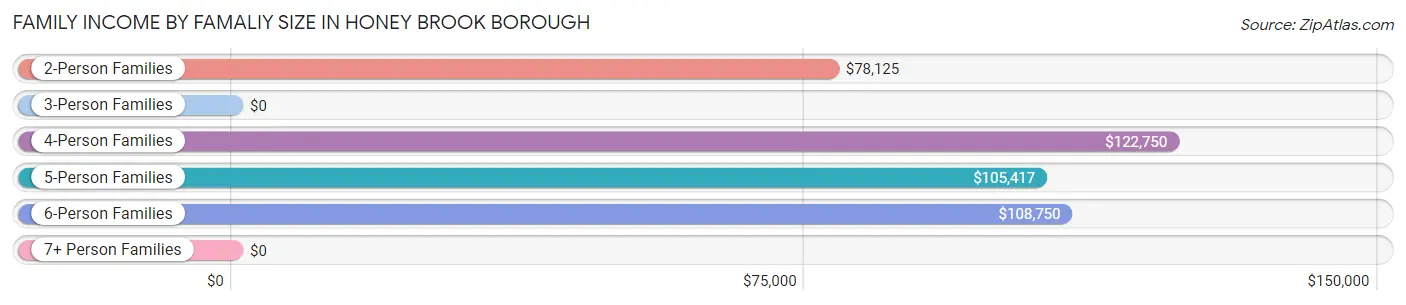
Family Income by Famaliy Size in Honey Brook borough
4-person families (172 | 36.7%) account for the highest median family income in Honey Brook borough with $122,750 per family, while 2-person families (140 | 29.9%) have the highest median income of $39,062 per family member.
| Income Bracket | # Families | Median Income |
| 2-Person Families | 140 (29.9%) | $78,125 |
| 3-Person Families | 106 (22.7%) | $0 |
| 4-Person Families | 172 (36.7%) | $122,750 |
| 5-Person Families | 43 (9.2%) | $105,417 |
| 6-Person Families | 7 (1.5%) | $108,750 |
| 7+ Person Families | 0 (0.0%) | $0 |
| Total | 468 (100.0%) | $82,750 |
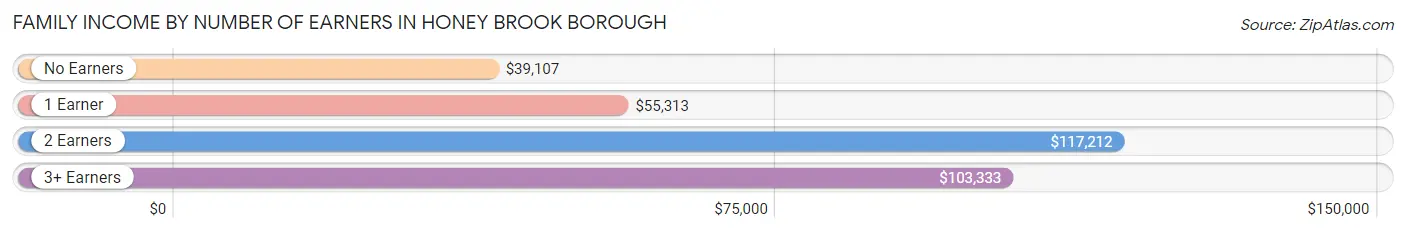
Family Income by Number of Earners in Honey Brook borough
The median family income in Honey Brook borough is $82,750, with families comprising 2 earners (219) having the highest median family income of $117,212, while families with no earners (29) have the lowest median family income of $39,107, accounting for 46.8% and 6.2% of families, respectively.
| Number of Earners | # Families | Median Income |
| No Earners | 29 (6.2%) | $39,107 |
| 1 Earner | 162 (34.6%) | $55,313 |
| 2 Earners | 219 (46.8%) | $117,212 |
| 3+ Earners | 58 (12.4%) | $103,333 |
| Total | 468 (100.0%) | $82,750 |
Household Income in Honey Brook borough
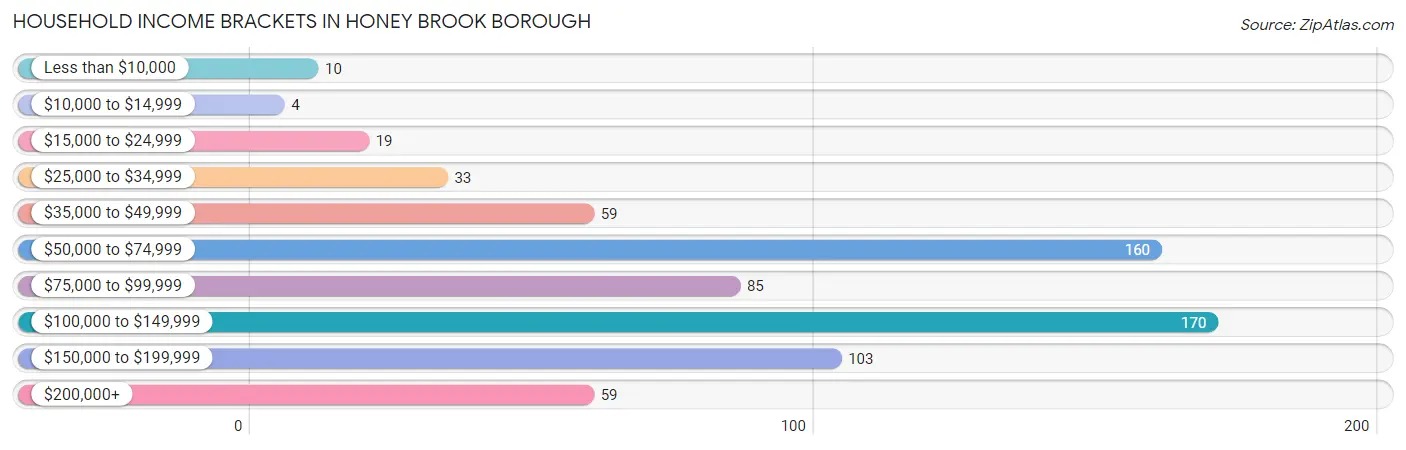
Household Income Brackets in Honey Brook borough
With 170 households falling in the category, the $100,000 to $149,999 income range is the most frequent in Honey Brook borough, accounting for 24.2% of all households. In contrast, only 4 households (0.6%) fall into the $10,000 to $14,999 income bracket, making it the least populous group.
| Income Bracket | # Households | % Households |
| Less than $10,000 | 10 | 1.4% |
| $10,000 to $14,999 | 4 | 0.6% |
| $15,000 to $24,999 | 19 | 2.7% |
| $25,000 to $34,999 | 33 | 4.7% |
| $35,000 to $49,999 | 59 | 8.4% |
| $50,000 to $74,999 | 160 | 22.8% |
| $75,000 to $99,999 | 85 | 12.1% |
| $100,000 to $149,999 | 170 | 24.2% |
| $150,000 to $199,999 | 103 | 14.7% |
| $200,000+ | 59 | 8.4% |
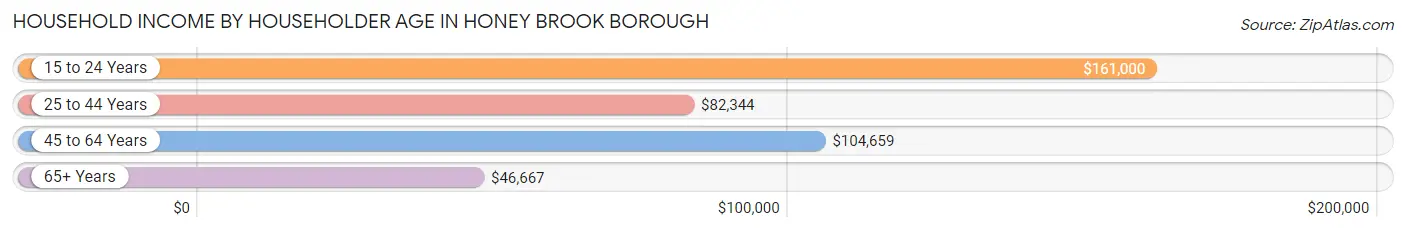
Household Income by Householder Age in Honey Brook borough
The median household income in Honey Brook borough is $87,885, with the highest median household income of $161,000 found in the 15 to 24 years age bracket for the primary householder. A total of 42 households (6.0%) fall into this category. Meanwhile, the 65+ years age bracket for the primary householder has the lowest median household income of $46,667, with 134 households (19.1%) in this group.
| Income Bracket | # Households | Median Income |
| 15 to 24 Years | 42 (6.0%) | $161,000 |
| 25 to 44 Years | 259 (36.9%) | $82,344 |
| 45 to 64 Years | 267 (38.0%) | $104,659 |
| 65+ Years | 134 (19.1%) | $46,667 |
| Total | 702 (100.0%) | $87,885 |
Poverty in Honey Brook borough
Income Below Poverty by Sex and Age in Honey Brook borough
With 1.5% poverty level for males and 6.2% for females among the residents of Honey Brook borough, 12 to 14 year old males and 15 year old females are the most vulnerable to poverty, with 3 males (12.5%) and 3 females (42.9%) in their respective age groups living below the poverty level.
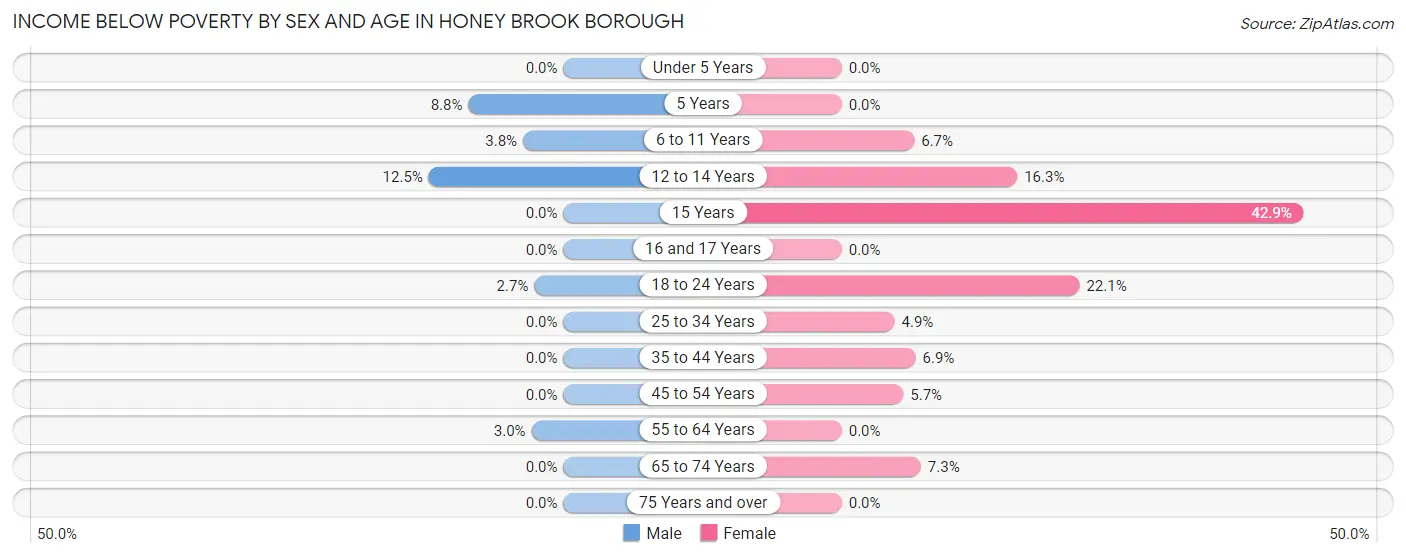
| Age Bracket | Male | Female |
| Under 5 Years | 0 (0.0%) | 0 (0.0%) |
| 5 Years | 3 (8.8%) | 0 (0.0%) |
| 6 to 11 Years | 3 (3.7%) | 7 (6.7%) |
| 12 to 14 Years | 3 (12.5%) | 7 (16.3%) |
| 15 Years | 0 (0.0%) | 3 (42.9%) |
| 16 and 17 Years | 0 (0.0%) | 0 (0.0%) |
| 18 to 24 Years | 2 (2.7%) | 15 (22.1%) |
| 25 to 34 Years | 0 (0.0%) | 7 (4.9%) |
| 35 to 44 Years | 0 (0.0%) | 10 (6.9%) |
| 45 to 54 Years | 0 (0.0%) | 4 (5.7%) |
| 55 to 64 Years | 4 (3.0%) | 0 (0.0%) |
| 65 to 74 Years | 0 (0.0%) | 8 (7.3%) |
| 75 Years and over | 0 (0.0%) | 0 (0.0%) |
| Total | 15 (1.5%) | 61 (6.2%) |
Income Above Poverty by Sex and Age in Honey Brook borough
According to the poverty statistics in Honey Brook borough, males aged under 5 years and females aged under 5 years are the age groups that are most secure financially, with 100.0% of males and 100.0% of females in these age groups living above the poverty line.
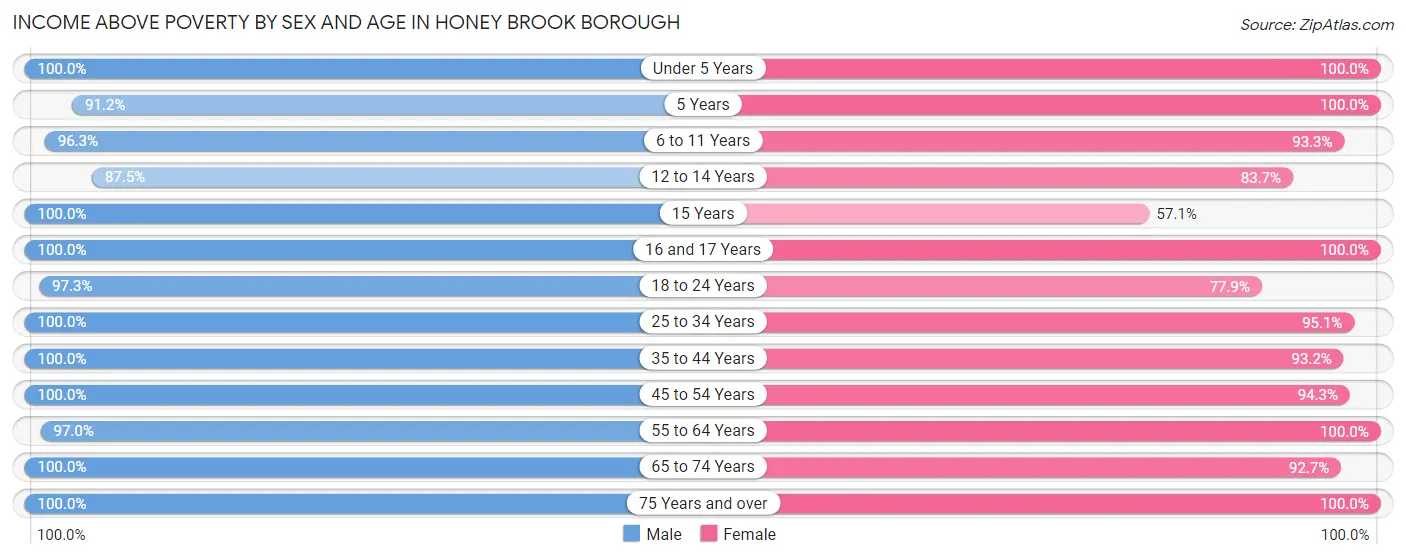
| Age Bracket | Male | Female |
| Under 5 Years | 90 (100.0%) | 110 (100.0%) |
| 5 Years | 31 (91.2%) | 8 (100.0%) |
| 6 to 11 Years | 77 (96.3%) | 97 (93.3%) |
| 12 to 14 Years | 21 (87.5%) | 36 (83.7%) |
| 15 Years | 18 (100.0%) | 4 (57.1%) |
| 16 and 17 Years | 2 (100.0%) | 10 (100.0%) |
| 18 to 24 Years | 72 (97.3%) | 53 (77.9%) |
| 25 to 34 Years | 182 (100.0%) | 136 (95.1%) |
| 35 to 44 Years | 160 (100.0%) | 136 (93.1%) |
| 45 to 54 Years | 103 (100.0%) | 66 (94.3%) |
| 55 to 64 Years | 131 (97.0%) | 122 (100.0%) |
| 65 to 74 Years | 56 (100.0%) | 101 (92.7%) |
| 75 Years and over | 19 (100.0%) | 39 (100.0%) |
| Total | 962 (98.5%) | 918 (93.8%) |
Income Below Poverty Among Married-Couple Families in Honey Brook borough
The poverty statistics for married-couple families in Honey Brook borough show that 0.6% or 2 of the total 335 families live below the poverty line. Families with 1 or 2 children have the highest poverty rate of 1.3%, comprising of 2 families. On the other hand, families with no children have the lowest poverty rate of 0.0%, which includes 0 families.
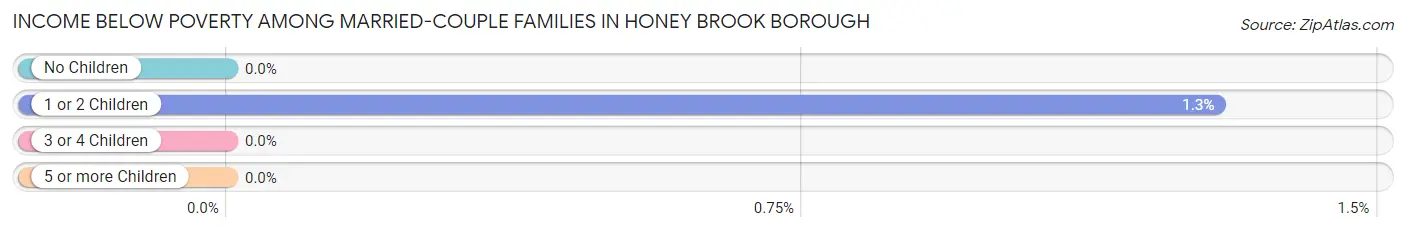
| Children | Above Poverty | Below Poverty |
| No Children | 158 (100.0%) | 0 (0.0%) |
| 1 or 2 Children | 153 (98.7%) | 2 (1.3%) |
| 3 or 4 Children | 22 (100.0%) | 0 (0.0%) |
| 5 or more Children | 0 (0.0%) | 0 (0.0%) |
| Total | 333 (99.4%) | 2 (0.6%) |
Income Below Poverty Among Single-Parent Households in Honey Brook borough
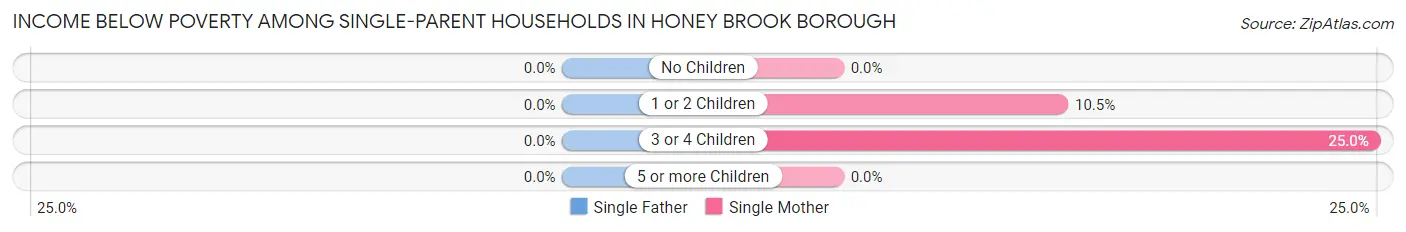
| Children | Single Father | Single Mother |
| No Children | 0 (0.0%) | 0 (0.0%) |
| 1 or 2 Children | 0 (0.0%) | 7 (10.4%) |
| 3 or 4 Children | 0 (0.0%) | 3 (25.0%) |
| 5 or more Children | 0 (0.0%) | 0 (0.0%) |
| Total | 0 (0.0%) | 10 (11.0%) |
Income Below Poverty Among Married-Couple vs Single-Parent Households in Honey Brook borough
The poverty data for Honey Brook borough shows that 2 of the married-couple family households (0.6%) and 10 of the single-parent households (7.5%) are living below the poverty level. Within the married-couple family households, those with 1 or 2 children have the highest poverty rate, with 2 households (1.3%) falling below the poverty line. Among the single-parent households, those with 3 or 4 children have the highest poverty rate, with 3 household (25.0%) living below poverty.
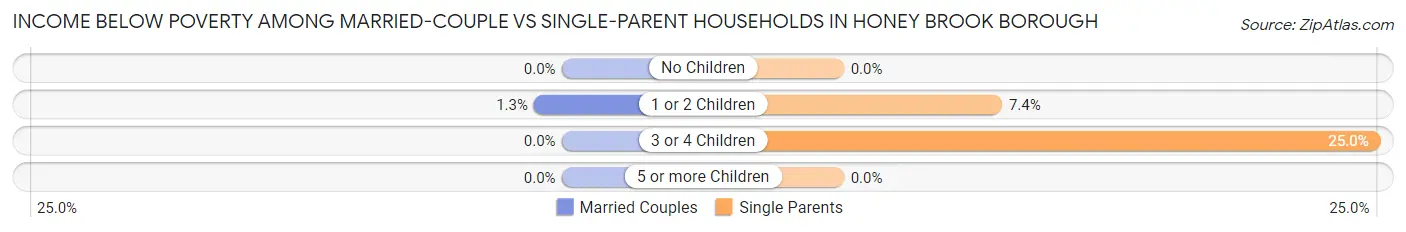
| Children | Married-Couple Families | Single-Parent Households |
| No Children | 0 (0.0%) | 0 (0.0%) |
| 1 or 2 Children | 2 (1.3%) | 7 (7.4%) |
| 3 or 4 Children | 0 (0.0%) | 3 (25.0%) |
| 5 or more Children | 0 (0.0%) | 0 (0.0%) |
| Total | 2 (0.6%) | 10 (7.5%) |
Race in Honey Brook borough
The most populous races in Honey Brook borough are White / Caucasian (1,853 | 92.4%), Two or more Races (121 | 6.0%), and Hispanic or Latino (96 | 4.8%).
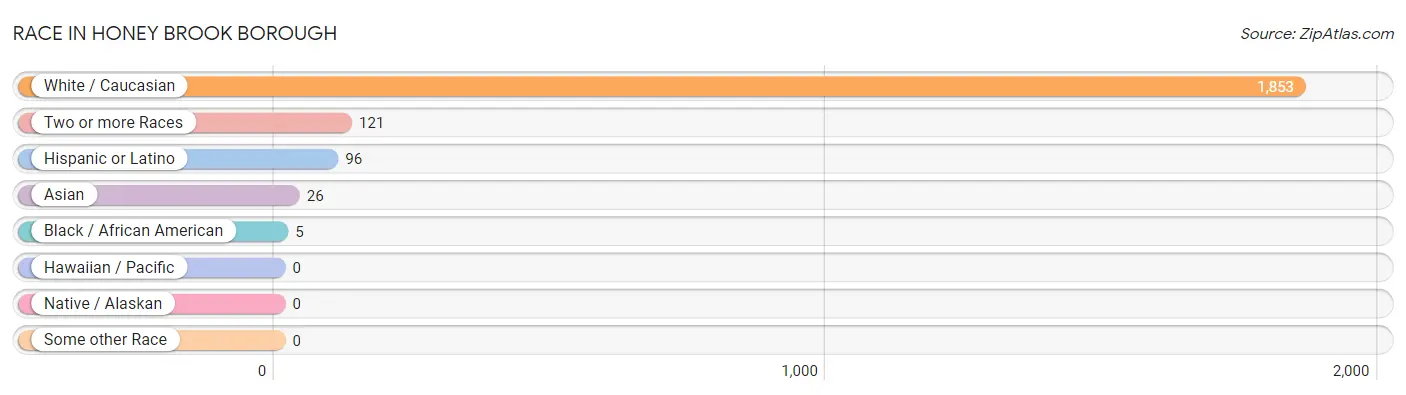
| Race | # Population | % Population |
| Asian | 26 | 1.3% |
| Black / African American | 5 | 0.3% |
| Hawaiian / Pacific | 0 | 0.0% |
| Hispanic or Latino | 96 | 4.8% |
| Native / Alaskan | 0 | 0.0% |
| White / Caucasian | 1,853 | 92.4% |
| Two or more Races | 121 | 6.0% |
| Some other Race | 0 | 0.0% |
| Total | 2,005 | 100.0% |
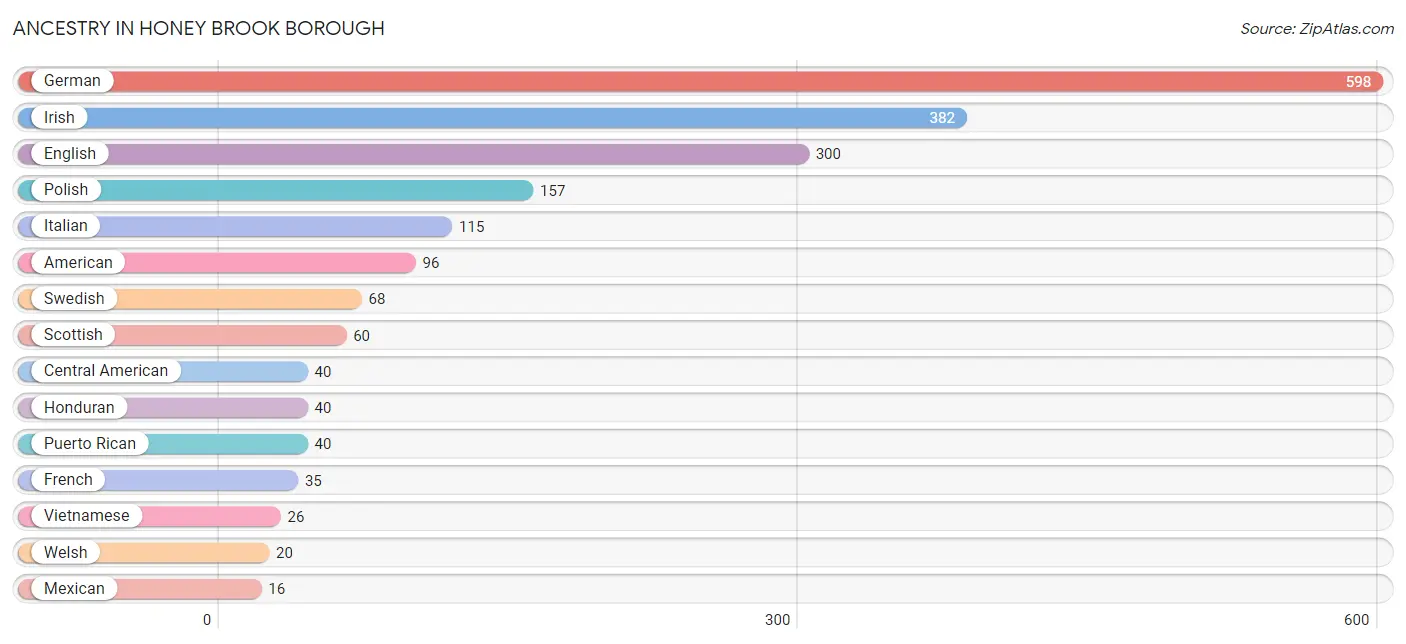
Ancestry in Honey Brook borough
The most populous ancestries reported in Honey Brook borough are German (598 | 29.8%), Irish (382 | 19.1%), English (300 | 15.0%), Polish (157 | 7.8%), and Italian (115 | 5.7%), together accounting for 77.4% of all Honey Brook borough residents.
| Ancestry | # Population | % Population |
| American | 96 | 4.8% |
| British | 12 | 0.6% |
| Central American | 40 | 2.0% |
| Cherokee | 4 | 0.2% |
| Czech | 13 | 0.6% |
| Dutch | 8 | 0.4% |
| Eastern European | 3 | 0.2% |
| English | 300 | 15.0% |
| French | 35 | 1.8% |
| French Canadian | 5 | 0.3% |
| German | 598 | 29.8% |
| Greek | 3 | 0.2% |
| Honduran | 40 | 2.0% |
| Hungarian | 3 | 0.2% |
| Irish | 382 | 19.1% |
| Italian | 115 | 5.7% |
| Lithuanian | 5 | 0.3% |
| Mexican | 16 | 0.8% |
| Norwegian | 5 | 0.3% |
| Polish | 157 | 7.8% |
| Puerto Rican | 40 | 2.0% |
| Russian | 13 | 0.6% |
| Scotch-Irish | 15 | 0.7% |
| Scottish | 60 | 3.0% |
| Swedish | 68 | 3.4% |
| Ukrainian | 16 | 0.8% |
| Vietnamese | 26 | 1.3% |
| Welsh | 20 | 1.0% | View All 28 Rows |
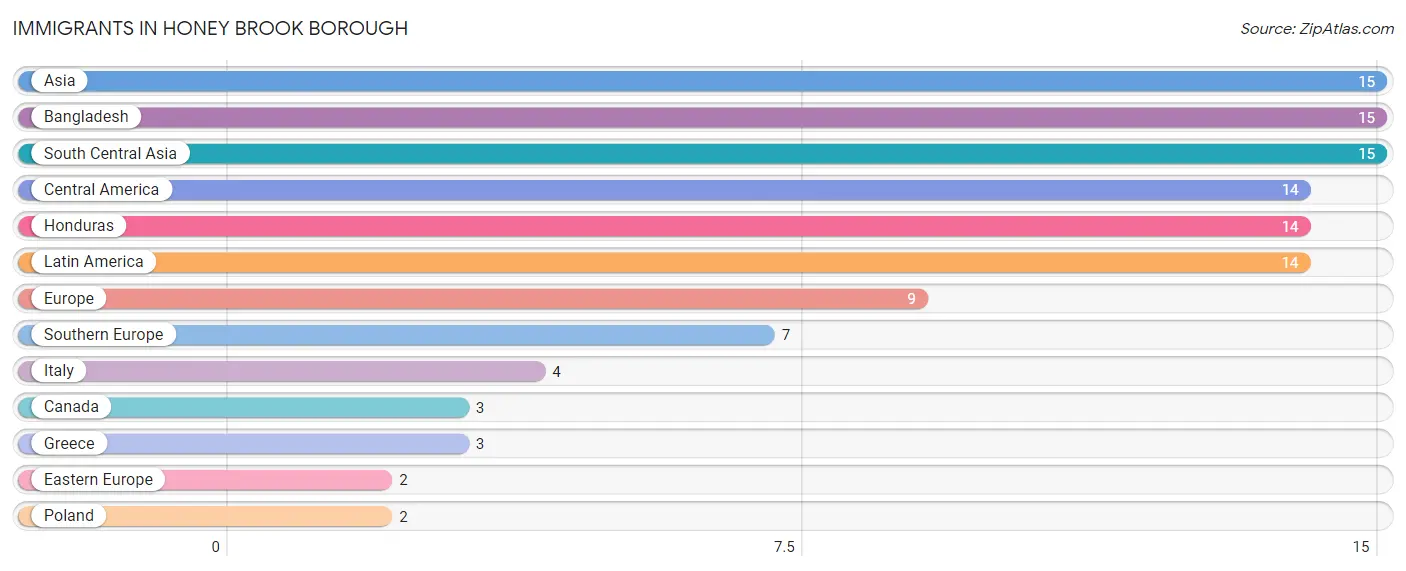
Immigrants in Honey Brook borough
The most numerous immigrant groups reported in Honey Brook borough came from Asia (15 | 0.7%), Bangladesh (15 | 0.7%), South Central Asia (15 | 0.7%), Central America (14 | 0.7%), and Honduras (14 | 0.7%), together accounting for 3.6% of all Honey Brook borough residents.
| Immigration Origin | # Population | % Population |
| Asia | 15 | 0.7% |
| Bangladesh | 15 | 0.7% |
| Canada | 3 | 0.2% |
| Central America | 14 | 0.7% |
| Eastern Europe | 2 | 0.1% |
| Europe | 9 | 0.4% |
| Greece | 3 | 0.2% |
| Honduras | 14 | 0.7% |
| Italy | 4 | 0.2% |
| Latin America | 14 | 0.7% |
| Poland | 2 | 0.1% |
| South Central Asia | 15 | 0.7% |
| Southern Europe | 7 | 0.4% | View All 13 Rows |
Sex and Age in Honey Brook borough
Sex and Age in Honey Brook borough
The most populous age groups in Honey Brook borough are 35 to 39 Years (98 | 10.0%) for men and Under 5 Years (114 | 11.2%) for women.
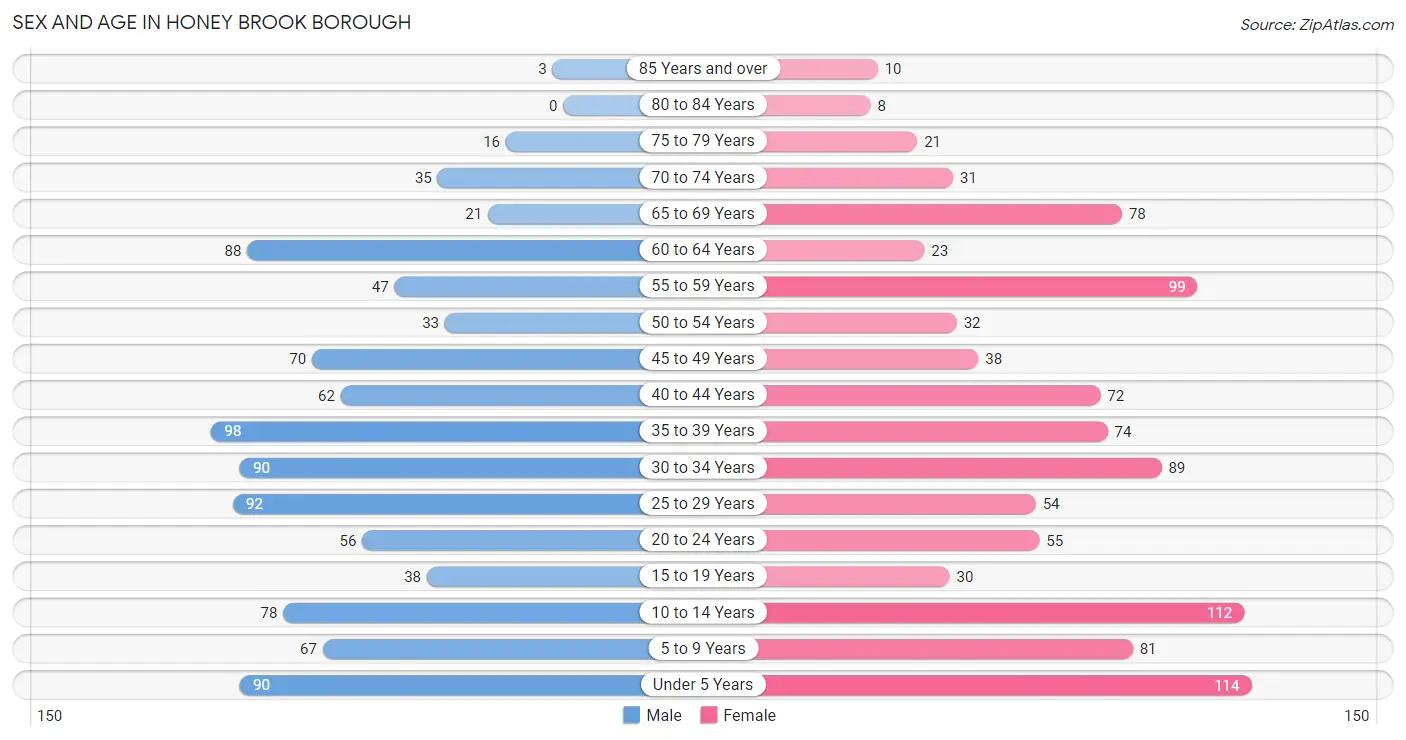
| Age Bracket | Male | Female |
| Under 5 Years | 90 (9.1%) | 114 (11.2%) |
| 5 to 9 Years | 67 (6.8%) | 81 (7.9%) |
| 10 to 14 Years | 78 (7.9%) | 112 (11.0%) |
| 15 to 19 Years | 38 (3.9%) | 30 (2.9%) |
| 20 to 24 Years | 56 (5.7%) | 55 (5.4%) |
| 25 to 29 Years | 92 (9.3%) | 54 (5.3%) |
| 30 to 34 Years | 90 (9.1%) | 89 (8.7%) |
| 35 to 39 Years | 98 (10.0%) | 74 (7.2%) |
| 40 to 44 Years | 62 (6.3%) | 72 (7.0%) |
| 45 to 49 Years | 70 (7.1%) | 38 (3.7%) |
| 50 to 54 Years | 33 (3.4%) | 32 (3.1%) |
| 55 to 59 Years | 47 (4.8%) | 99 (9.7%) |
| 60 to 64 Years | 88 (8.9%) | 23 (2.2%) |
| 65 to 69 Years | 21 (2.1%) | 78 (7.6%) |
| 70 to 74 Years | 35 (3.6%) | 31 (3.0%) |
| 75 to 79 Years | 16 (1.6%) | 21 (2.1%) |
| 80 to 84 Years | 0 (0.0%) | 8 (0.8%) |
| 85 Years and over | 3 (0.3%) | 10 (1.0%) |
| Total | 984 (100.0%) | 1,021 (100.0%) |
Families and Households in Honey Brook borough
Median Family Size in Honey Brook borough
The median family size in Honey Brook borough is 3.39 persons per family, with married-couple families (335 | 71.6%) accounting for the largest median family size of 3.65 persons per family. On the other hand, single male/father families (42 | 9.0%) represent the smallest median family size with 2.50 persons per family.
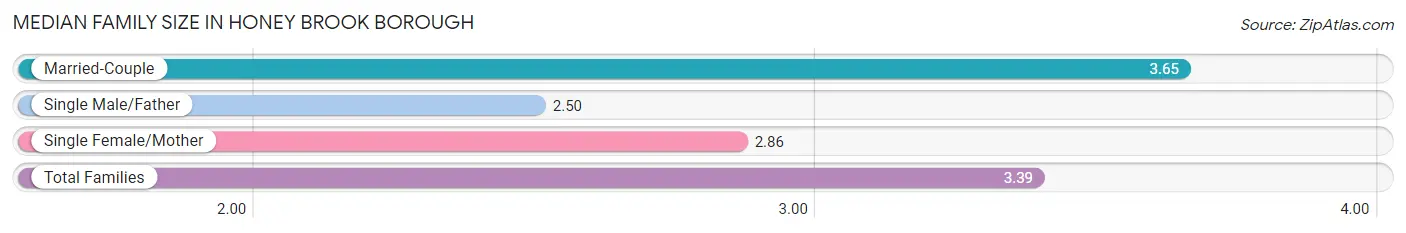
| Family Type | # Families | Family Size |
| Married-Couple | 335 (71.6%) | 3.65 |
| Single Male/Father | 42 (9.0%) | 2.50 |
| Single Female/Mother | 91 (19.4%) | 2.86 |
| Total Families | 468 (100.0%) | 3.39 |
Median Household Size in Honey Brook borough
The median household size in Honey Brook borough is 2.86 persons per household, with married-couple households (335 | 47.7%) accounting for the largest median household size of 3.82 persons per household. non-family households (234 | 33.3%) represent the smallest median household size with 1.24 persons per household.
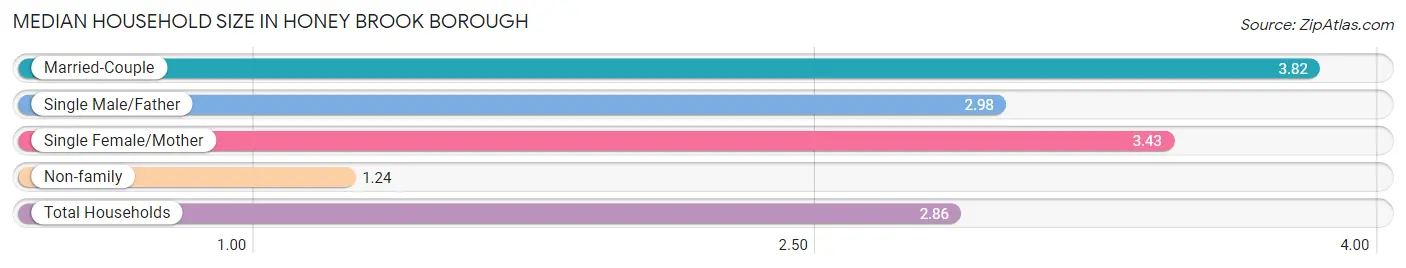
| Household Type | # Households | Household Size |
| Married-Couple | 335 (47.7%) | 3.82 |
| Single Male/Father | 42 (6.0%) | 2.98 |
| Single Female/Mother | 91 (13.0%) | 3.43 |
| Non-family | 234 (33.3%) | 1.24 |
| Total Households | 702 (100.0%) | 2.86 |
Household Size by Marriage Status in Honey Brook borough
Out of a total of 702 households in Honey Brook borough, 468 (66.7%) are family households, while 234 (33.3%) are nonfamily households. The most numerous type of family households are 4-person households, comprising 201, and the most common type of nonfamily households are 1-person households, comprising 166.
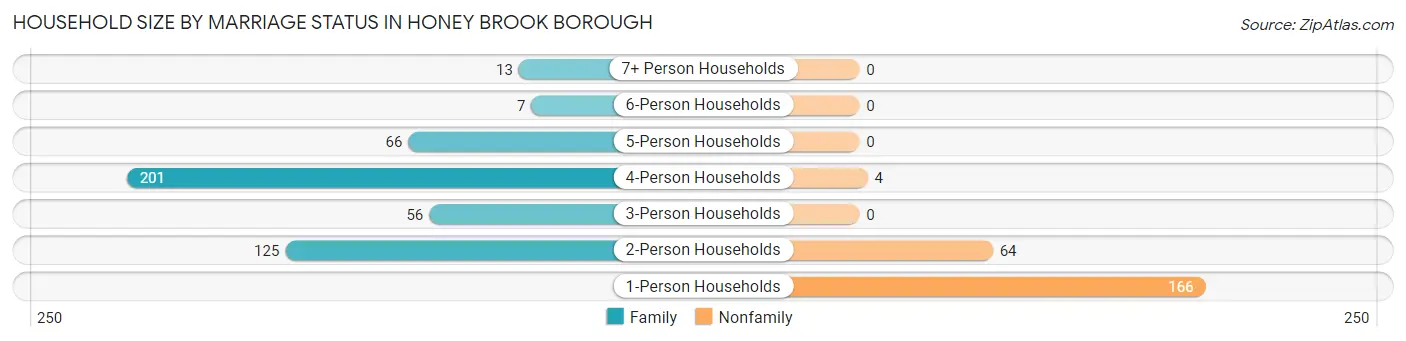
| Household Size | Family Households | Nonfamily Households |
| 1-Person Households | - | 166 (23.6%) |
| 2-Person Households | 125 (17.8%) | 64 (9.1%) |
| 3-Person Households | 56 (8.0%) | 0 (0.0%) |
| 4-Person Households | 201 (28.6%) | 4 (0.6%) |
| 5-Person Households | 66 (9.4%) | 0 (0.0%) |
| 6-Person Households | 7 (1.0%) | 0 (0.0%) |
| 7+ Person Households | 13 (1.8%) | 0 (0.0%) |
| Total | 468 (66.7%) | 234 (33.3%) |
Female Fertility in Honey Brook borough
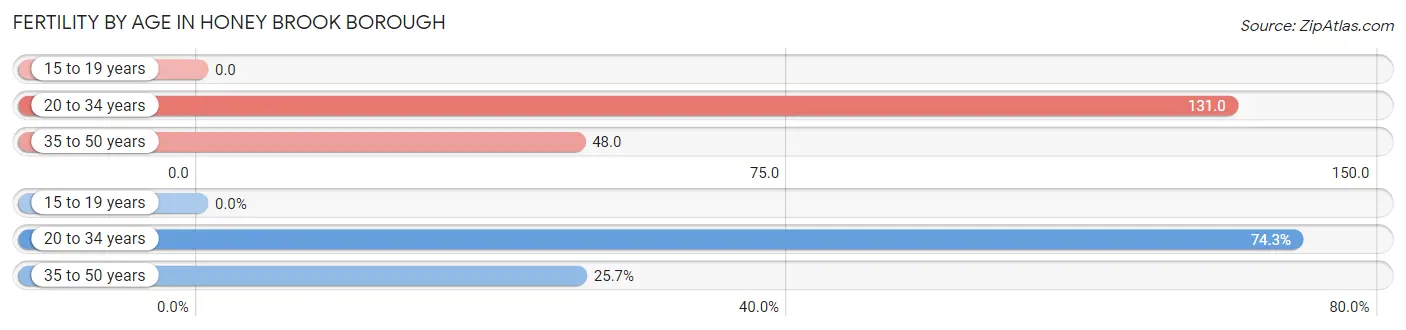
Fertility by Age in Honey Brook borough
Average fertility rate in Honey Brook borough is 84.0 births per 1,000 women. Women in the age bracket of 20 to 34 years have the highest fertility rate with 131.0 births per 1,000 women. Women in the age bracket of 20 to 34 years acount for 74.3% of all women with births.
| Age Bracket | Women with Births | Births / 1,000 Women |
| 15 to 19 years | 0 (0.0%) | 0.0 |
| 20 to 34 years | 26 (74.3%) | 131.0 |
| 35 to 50 years | 9 (25.7%) | 48.0 |
| Total | 35 (100.0%) | 84.0 |
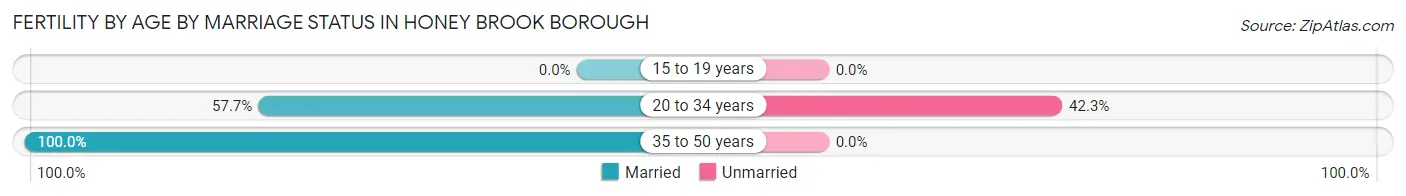
Fertility by Age by Marriage Status in Honey Brook borough
68.6% of women with births (35) in Honey Brook borough are married. The highest percentage of unmarried women with births falls into 20 to 34 years age bracket with 42.3% of them unmarried at the time of birth, while the lowest percentage of unmarried women with births belong to 35 to 50 years age bracket with 0.0% of them unmarried.
| Age Bracket | Married | Unmarried |
| 15 to 19 years | 0 (0.0%) | 0 (0.0%) |
| 20 to 34 years | 15 (57.7%) | 11 (42.3%) |
| 35 to 50 years | 9 (100.0%) | 0 (0.0%) |
| Total | 24 (68.6%) | 11 (31.4%) |
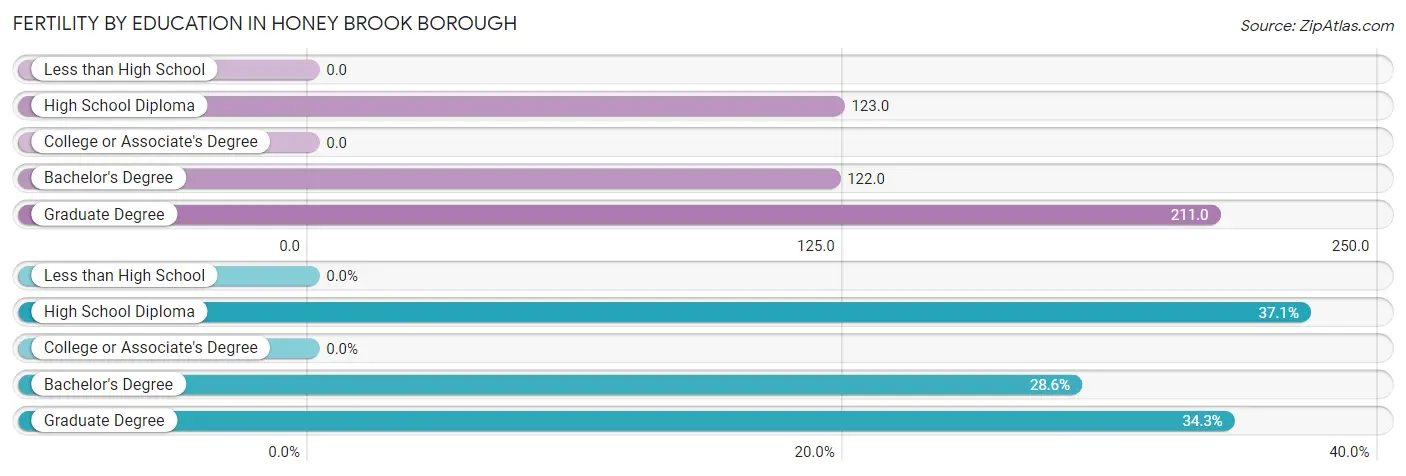
Fertility by Education in Honey Brook borough
| Educational Attainment | Women with Births | Births / 1,000 Women |
| Less than High School | 0 (0.0%) | 0.0 |
| High School Diploma | 13 (37.1%) | 123.0 |
| College or Associate's Degree | 0 (0.0%) | 0.0 |
| Bachelor's Degree | 10 (28.6%) | 122.0 |
| Graduate Degree | 12 (34.3%) | 211.0 |
| Total | 35 (100.0%) | 84.0 |
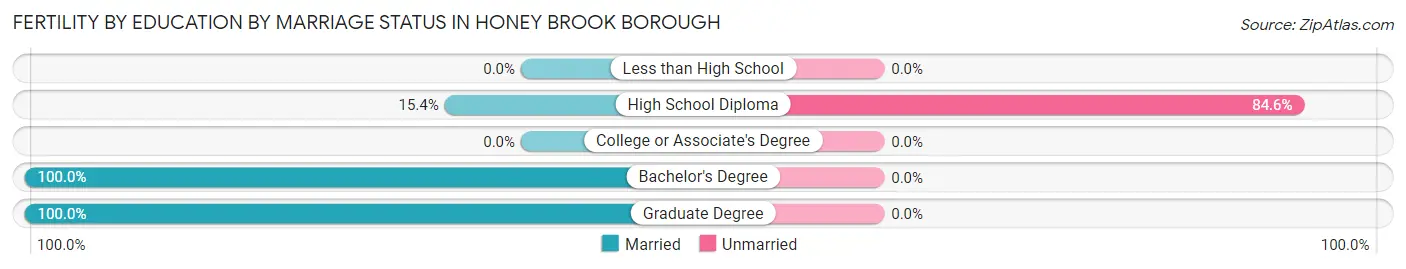
Fertility by Education by Marriage Status in Honey Brook borough
31.4% of women with births in Honey Brook borough are unmarried. Women with the educational attainment of bachelor's degree are most likely to be married with 100.0% of them married at childbirth, while women with the educational attainment of high school diploma are least likely to be married with 84.6% of them unmarried at childbirth.
| Educational Attainment | Married | Unmarried |
| Less than High School | 0 (0.0%) | 0 (0.0%) |
| High School Diploma | 2 (15.4%) | 11 (84.6%) |
| College or Associate's Degree | 0 (0.0%) | 0 (0.0%) |
| Bachelor's Degree | 10 (100.0%) | 0 (0.0%) |
| Graduate Degree | 12 (100.0%) | 0 (0.0%) |
| Total | 24 (68.6%) | 11 (31.4%) |
Employment Characteristics in Honey Brook borough
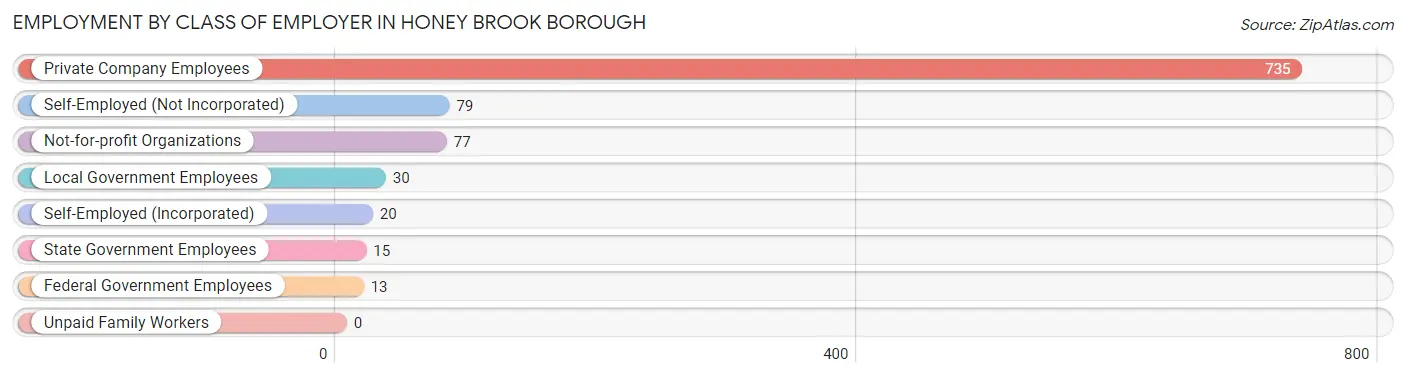
Employment by Class of Employer in Honey Brook borough
Among the 969 employed individuals in Honey Brook borough, private company employees (735 | 75.8%), self-employed (not incorporated) (79 | 8.2%), and not-for-profit organizations (77 | 8.0%) make up the most common classes of employment.
| Employer Class | # Employees | % Employees |
| Private Company Employees | 735 | 75.8% |
| Self-Employed (Incorporated) | 20 | 2.1% |
| Self-Employed (Not Incorporated) | 79 | 8.2% |
| Not-for-profit Organizations | 77 | 8.0% |
| Local Government Employees | 30 | 3.1% |
| State Government Employees | 15 | 1.5% |
| Federal Government Employees | 13 | 1.3% |
| Unpaid Family Workers | 0 | 0.0% |
| Total | 969 | 100.0% |
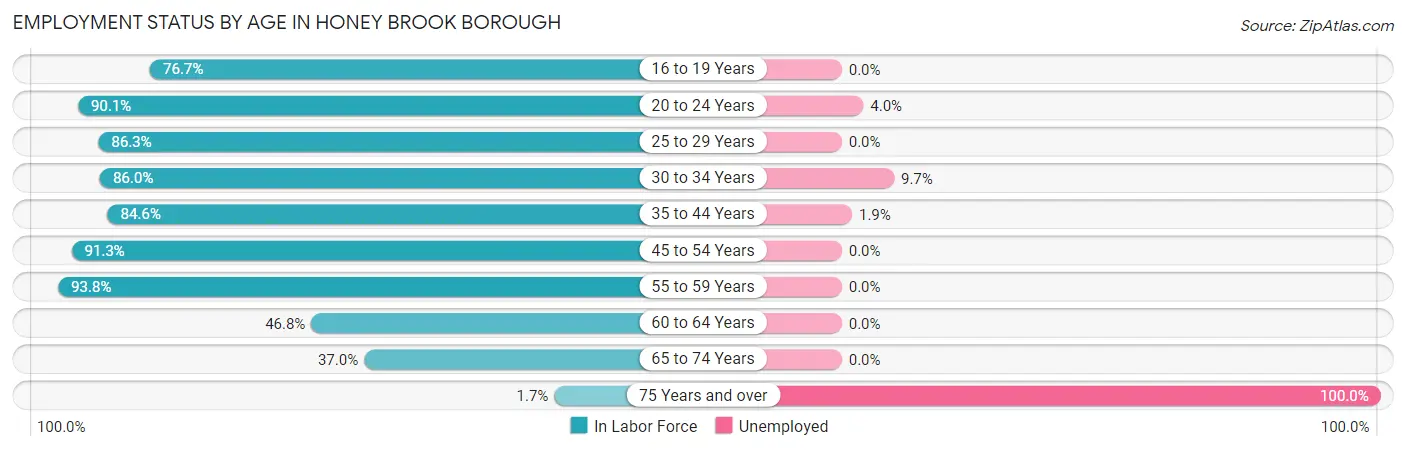
Employment Status by Age in Honey Brook borough
According to the labor force statistics for Honey Brook borough, out of the total population over 16 years of age (1,438), 75.2% or 1,081 individuals are in the labor force, with 2.3% or 25 of them unemployed. The age group with the highest labor force participation rate is 55 to 59 years, with 93.8% or 137 individuals in the labor force. Within the labor force, the 75 years and over age range has the highest percentage of unemployed individuals, with 100.0% or 1 of them being unemployed.
| Age Bracket | In Labor Force | Unemployed |
| 16 to 19 Years | 33 (76.7%) | 0 (0.0%) |
| 20 to 24 Years | 100 (90.1%) | 4 (4.0%) |
| 25 to 29 Years | 126 (86.3%) | 0 (0.0%) |
| 30 to 34 Years | 154 (86.0%) | 15 (9.7%) |
| 35 to 44 Years | 259 (84.6%) | 5 (1.9%) |
| 45 to 54 Years | 158 (91.3%) | 0 (0.0%) |
| 55 to 59 Years | 137 (93.8%) | 0 (0.0%) |
| 60 to 64 Years | 52 (46.8%) | 0 (0.0%) |
| 65 to 74 Years | 61 (37.0%) | 0 (0.0%) |
| 75 Years and over | 1 (1.7%) | 1 (100.0%) |
| Total | 1,081 (75.2%) | 25 (2.3%) |
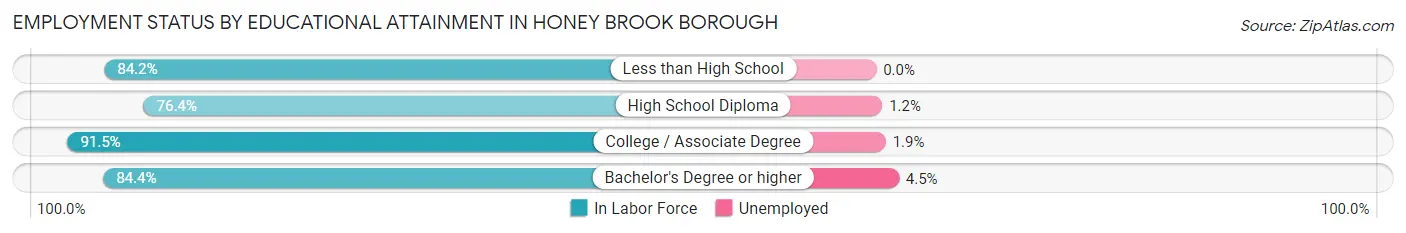
Employment Status by Educational Attainment in Honey Brook borough
According to labor force statistics for Honey Brook borough, 83.5% of individuals (886) out of the total population between 25 and 64 years of age (1,061) are in the labor force, with 2.3% or 20 of them being unemployed. The group with the highest labor force participation rate are those with the educational attainment of college / associate degree, with 91.5% or 312 individuals in the labor force. Within the labor force, individuals with bachelor's degree or higher education have the highest percentage of unemployment, with 4.5% or 10 of them being unemployed.
| Educational Attainment | In Labor Force | Unemployed |
| Less than High School | 32 (84.2%) | 0 (0.0%) |
| High School Diploma | 321 (76.4%) | 5 (1.2%) |
| College / Associate Degree | 312 (91.5%) | 6 (1.9%) |
| Bachelor's Degree or higher | 221 (84.4%) | 12 (4.5%) |
| Total | 886 (83.5%) | 24 (2.3%) |
Employment Occupations by Sex in Honey Brook borough
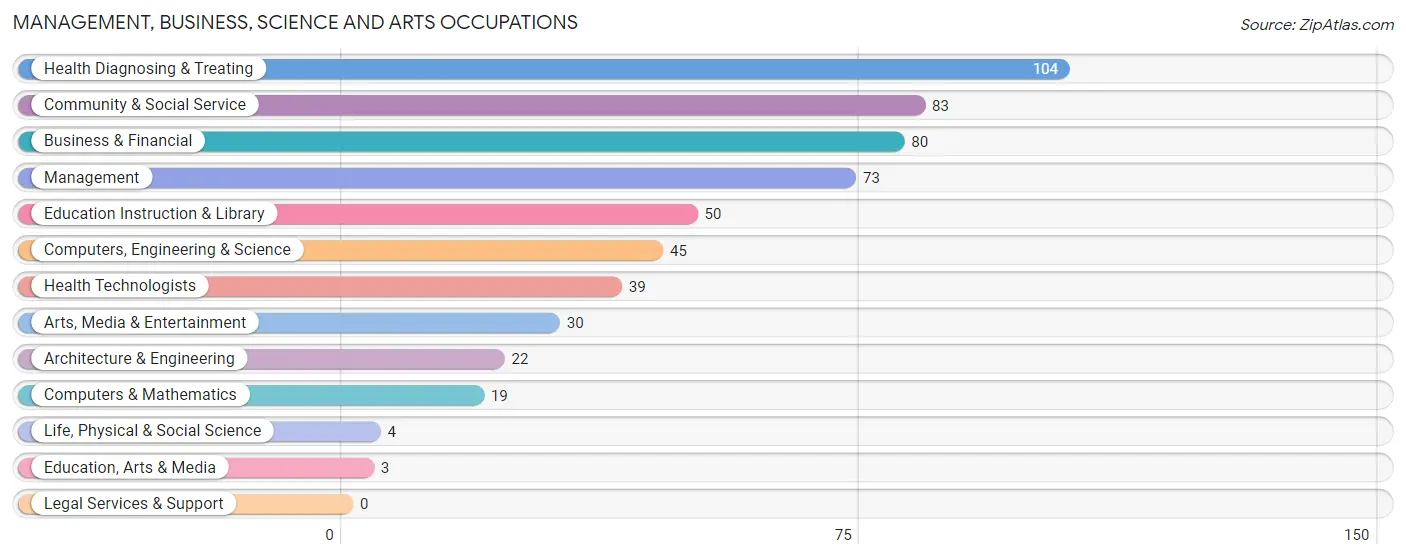
Management, Business, Science and Arts Occupations
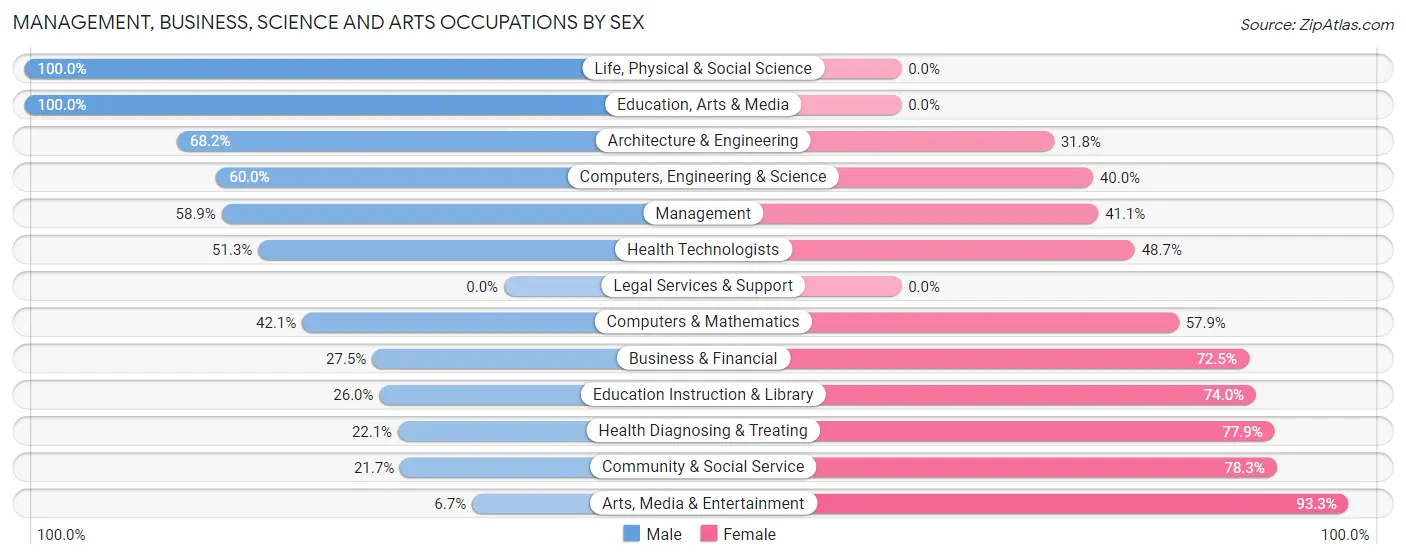
The most common Management, Business, Science and Arts occupations in Honey Brook borough are Health Diagnosing & Treating (104 | 9.9%), Community & Social Service (83 | 7.9%), Business & Financial (80 | 7.6%), Management (73 | 6.9%), and Education Instruction & Library (50 | 4.7%).
Management, Business, Science and Arts Occupations by Sex
Within the Management, Business, Science and Arts occupations in Honey Brook borough, the most male-oriented occupations are Life, Physical & Social Science (100.0%), Education, Arts & Media (100.0%), and Architecture & Engineering (68.2%), while the most female-oriented occupations are Arts, Media & Entertainment (93.3%), Community & Social Service (78.3%), and Health Diagnosing & Treating (77.9%).
| Occupation | Male | Female |
| Management | 43 (58.9%) | 30 (41.1%) |
| Business & Financial | 22 (27.5%) | 58 (72.5%) |
| Computers, Engineering & Science | 27 (60.0%) | 18 (40.0%) |
| Computers & Mathematics | 8 (42.1%) | 11 (57.9%) |
| Architecture & Engineering | 15 (68.2%) | 7 (31.8%) |
| Life, Physical & Social Science | 4 (100.0%) | 0 (0.0%) |
| Community & Social Service | 18 (21.7%) | 65 (78.3%) |
| Education, Arts & Media | 3 (100.0%) | 0 (0.0%) |
| Legal Services & Support | 0 (0.0%) | 0 (0.0%) |
| Education Instruction & Library | 13 (26.0%) | 37 (74.0%) |
| Arts, Media & Entertainment | 2 (6.7%) | 28 (93.3%) |
| Health Diagnosing & Treating | 23 (22.1%) | 81 (77.9%) |
| Health Technologists | 20 (51.3%) | 19 (48.7%) |
| Total (Category) | 133 (34.5%) | 252 (65.4%) |
| Total (Overall) | 578 (54.7%) | 478 (45.3%) |
Services Occupations
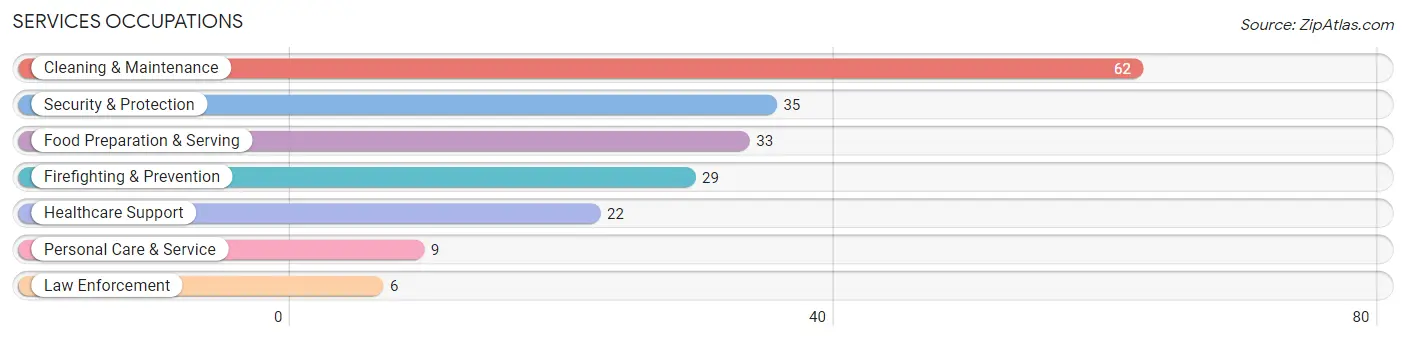
The most common Services occupations in Honey Brook borough are Cleaning & Maintenance (62 | 5.9%), Security & Protection (35 | 3.3%), Food Preparation & Serving (33 | 3.1%), Firefighting & Prevention (29 | 2.8%), and Healthcare Support (22 | 2.1%).
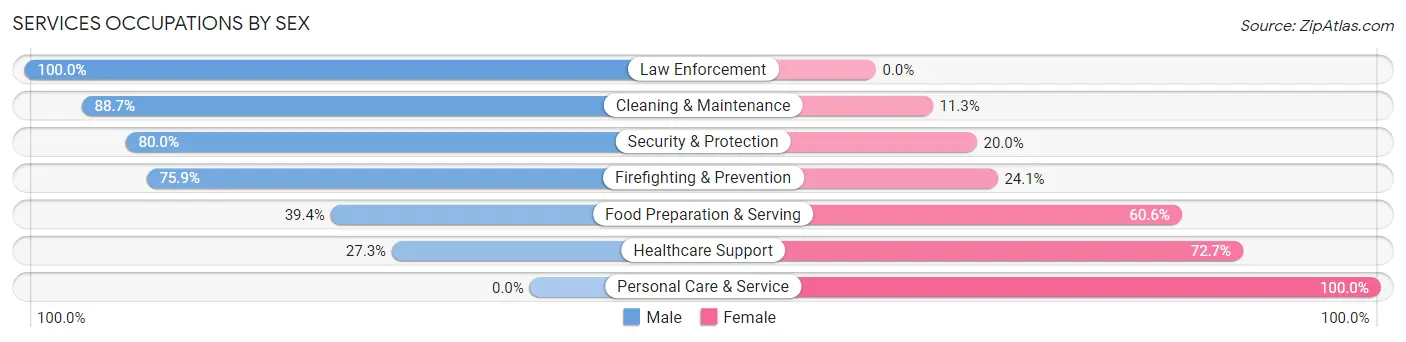
Services Occupations by Sex
Within the Services occupations in Honey Brook borough, the most male-oriented occupations are Law Enforcement (100.0%), Cleaning & Maintenance (88.7%), and Security & Protection (80.0%), while the most female-oriented occupations are Personal Care & Service (100.0%), Healthcare Support (72.7%), and Food Preparation & Serving (60.6%).
| Occupation | Male | Female |
| Healthcare Support | 6 (27.3%) | 16 (72.7%) |
| Security & Protection | 28 (80.0%) | 7 (20.0%) |
| Firefighting & Prevention | 22 (75.9%) | 7 (24.1%) |
| Law Enforcement | 6 (100.0%) | 0 (0.0%) |
| Food Preparation & Serving | 13 (39.4%) | 20 (60.6%) |
| Cleaning & Maintenance | 55 (88.7%) | 7 (11.3%) |
| Personal Care & Service | 0 (0.0%) | 9 (100.0%) |
| Total (Category) | 102 (63.3%) | 59 (36.6%) |
| Total (Overall) | 578 (54.7%) | 478 (45.3%) |
Sales and Office Occupations
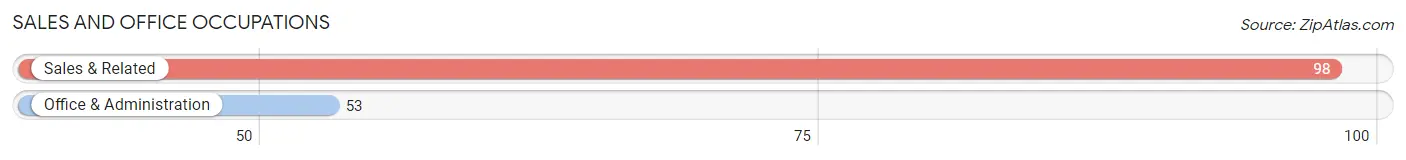
The most common Sales and Office occupations in Honey Brook borough are Sales & Related (98 | 9.3%), and Office & Administration (53 | 5.0%).
Sales and Office Occupations by Sex
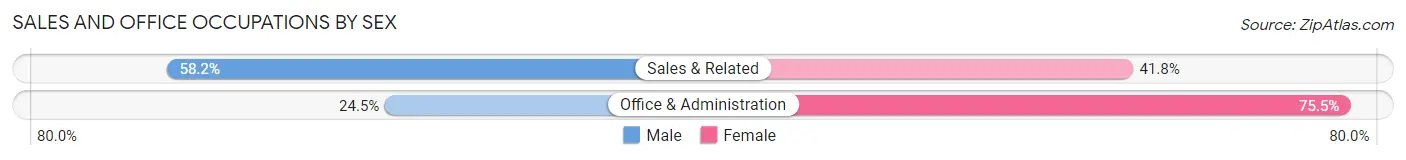
| Occupation | Male | Female |
| Sales & Related | 57 (58.2%) | 41 (41.8%) |
| Office & Administration | 13 (24.5%) | 40 (75.5%) |
| Total (Category) | 70 (46.4%) | 81 (53.6%) |
| Total (Overall) | 578 (54.7%) | 478 (45.3%) |
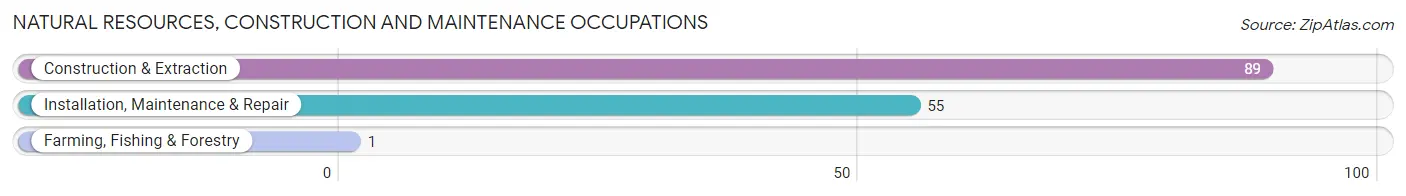
Natural Resources, Construction and Maintenance Occupations
The most common Natural Resources, Construction and Maintenance occupations in Honey Brook borough are Construction & Extraction (89 | 8.4%), Installation, Maintenance & Repair (55 | 5.2%), and Farming, Fishing & Forestry (1 | 0.1%).
Natural Resources, Construction and Maintenance Occupations by Sex
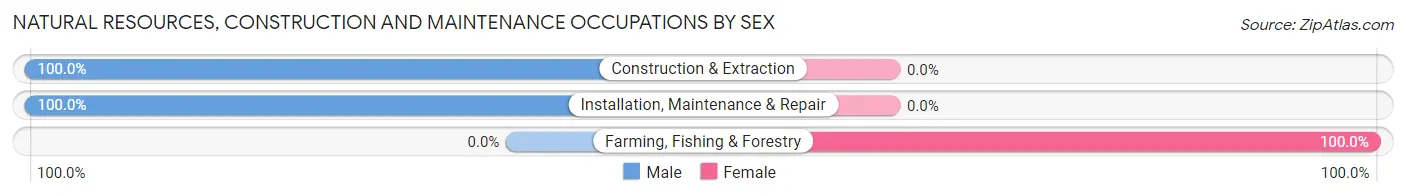
| Occupation | Male | Female |
| Farming, Fishing & Forestry | 0 (0.0%) | 1 (100.0%) |
| Construction & Extraction | 89 (100.0%) | 0 (0.0%) |
| Installation, Maintenance & Repair | 55 (100.0%) | 0 (0.0%) |
| Total (Category) | 144 (99.3%) | 1 (0.7%) |
| Total (Overall) | 578 (54.7%) | 478 (45.3%) |
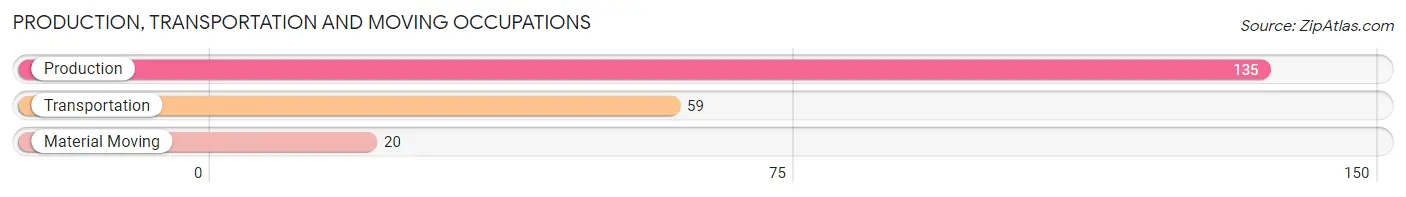
Production, Transportation and Moving Occupations
The most common Production, Transportation and Moving occupations in Honey Brook borough are Production (135 | 12.8%), Transportation (59 | 5.6%), and Material Moving (20 | 1.9%).
Production, Transportation and Moving Occupations by Sex
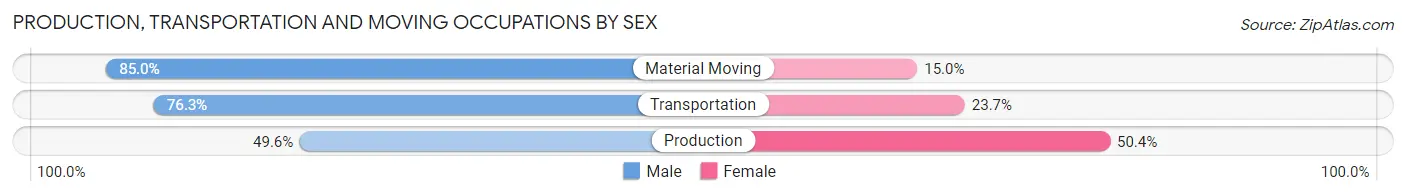
| Occupation | Male | Female |
| Production | 67 (49.6%) | 68 (50.4%) |
| Transportation | 45 (76.3%) | 14 (23.7%) |
| Material Moving | 17 (85.0%) | 3 (15.0%) |
| Total (Category) | 129 (60.3%) | 85 (39.7%) |
| Total (Overall) | 578 (54.7%) | 478 (45.3%) |
Employment Industries by Sex in Honey Brook borough
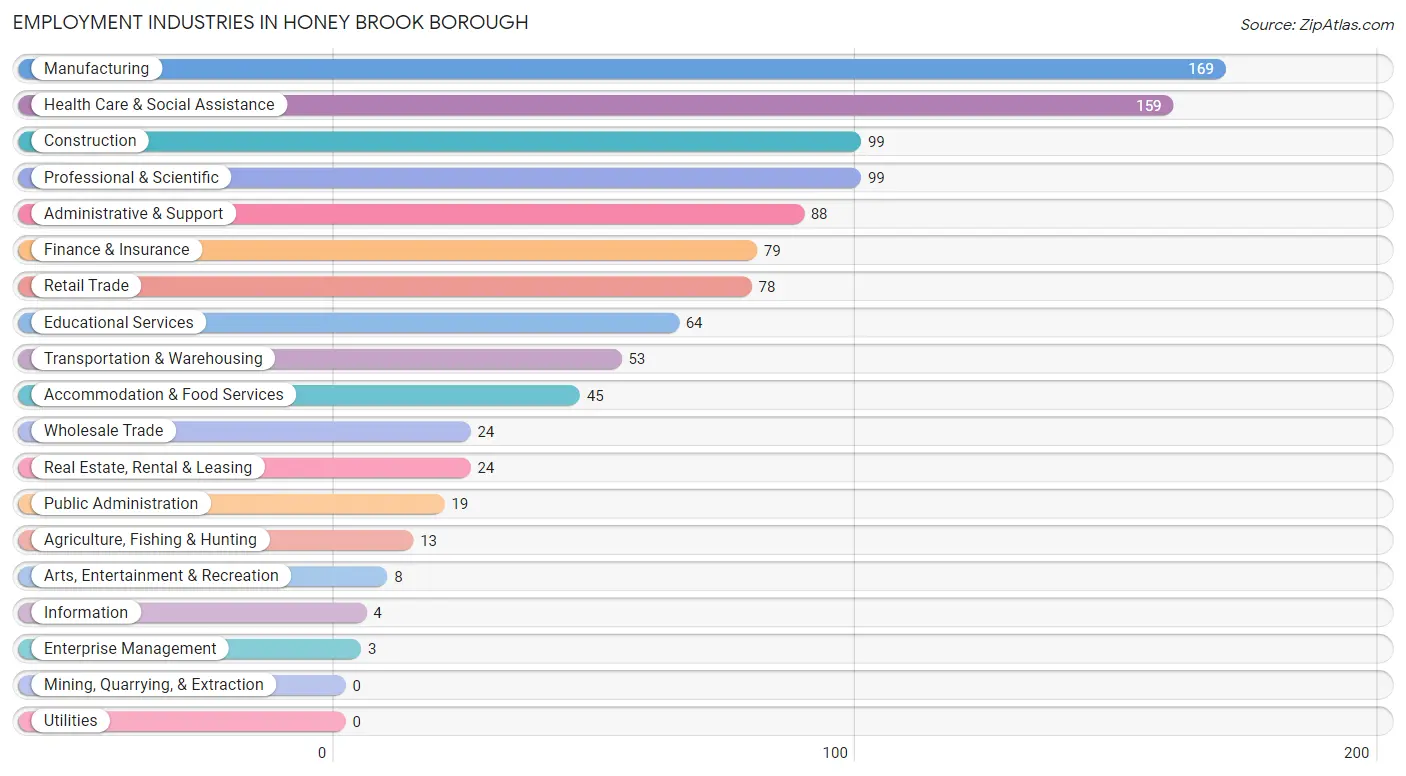
Employment Industries in Honey Brook borough
The major employment industries in Honey Brook borough include Manufacturing (169 | 16.0%), Health Care & Social Assistance (159 | 15.1%), Construction (99 | 9.4%), Professional & Scientific (99 | 9.4%), and Administrative & Support (88 | 8.3%).
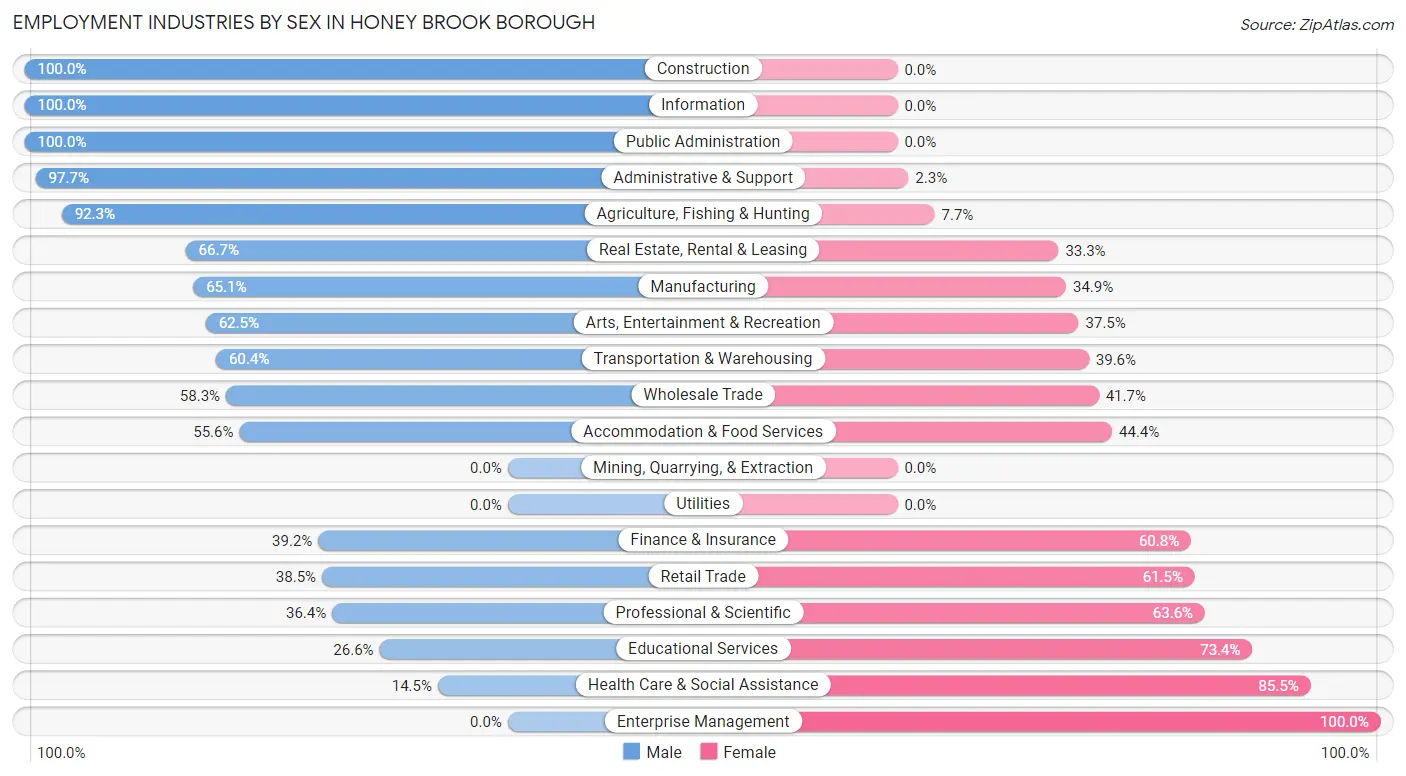
Employment Industries by Sex in Honey Brook borough
The Honey Brook borough industries that see more men than women are Construction (100.0%), Information (100.0%), and Public Administration (100.0%), whereas the industries that tend to have a higher number of women are Enterprise Management (100.0%), Health Care & Social Assistance (85.5%), and Educational Services (73.4%).
| Industry | Male | Female |
| Agriculture, Fishing & Hunting | 12 (92.3%) | 1 (7.7%) |
| Mining, Quarrying, & Extraction | 0 (0.0%) | 0 (0.0%) |
| Construction | 99 (100.0%) | 0 (0.0%) |
| Manufacturing | 110 (65.1%) | 59 (34.9%) |
| Wholesale Trade | 14 (58.3%) | 10 (41.7%) |
| Retail Trade | 30 (38.5%) | 48 (61.5%) |
| Transportation & Warehousing | 32 (60.4%) | 21 (39.6%) |
| Utilities | 0 (0.0%) | 0 (0.0%) |
| Information | 4 (100.0%) | 0 (0.0%) |
| Finance & Insurance | 31 (39.2%) | 48 (60.8%) |
| Real Estate, Rental & Leasing | 16 (66.7%) | 8 (33.3%) |
| Professional & Scientific | 36 (36.4%) | 63 (63.6%) |
| Enterprise Management | 0 (0.0%) | 3 (100.0%) |
| Administrative & Support | 86 (97.7%) | 2 (2.3%) |
| Educational Services | 17 (26.6%) | 47 (73.4%) |
| Health Care & Social Assistance | 23 (14.5%) | 136 (85.5%) |
| Arts, Entertainment & Recreation | 5 (62.5%) | 3 (37.5%) |
| Accommodation & Food Services | 25 (55.6%) | 20 (44.4%) |
| Public Administration | 19 (100.0%) | 0 (0.0%) |
| Total | 578 (54.7%) | 478 (45.3%) |
Education in Honey Brook borough
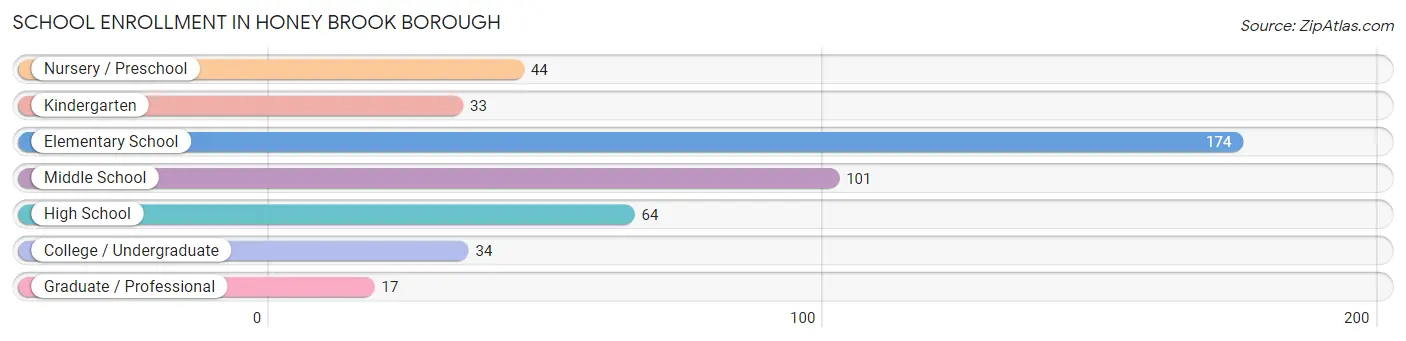
School Enrollment in Honey Brook borough
The most common levels of schooling among the 467 students in Honey Brook borough are elementary school (174 | 37.3%), middle school (101 | 21.6%), and high school (64 | 13.7%).
| School Level | # Students | % Students |
| Nursery / Preschool | 44 | 9.4% |
| Kindergarten | 33 | 7.1% |
| Elementary School | 174 | 37.3% |
| Middle School | 101 | 21.6% |
| High School | 64 | 13.7% |
| College / Undergraduate | 34 | 7.3% |
| Graduate / Professional | 17 | 3.6% |
| Total | 467 | 100.0% |
School Enrollment by Age by Funding Source in Honey Brook borough
Out of a total of 467 students who are enrolled in schools in Honey Brook borough, 92 (19.7%) attend a private institution, while the remaining 375 (80.3%) are enrolled in public schools. The age group of 3 to 4 year olds has the highest likelihood of being enrolled in private schools, with 28 (84.9% in the age bracket) enrolled. Conversely, the age group of 15 to 17 year olds has the lowest likelihood of being enrolled in a private school, with 37 (100.0% in the age bracket) attending a public institution.
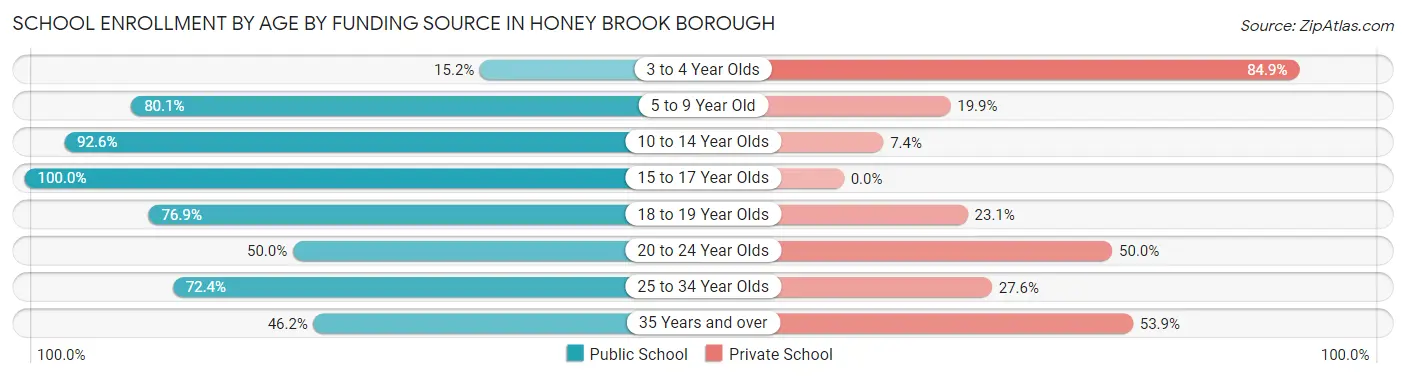
| Age Bracket | Public School | Private School |
| 3 to 4 Year Olds | 5 (15.1%) | 28 (84.9%) |
| 5 to 9 Year Old | 117 (80.1%) | 29 (19.9%) |
| 10 to 14 Year Olds | 176 (92.6%) | 14 (7.4%) |
| 15 to 17 Year Olds | 37 (100.0%) | 0 (0.0%) |
| 18 to 19 Year Olds | 10 (76.9%) | 3 (23.1%) |
| 20 to 24 Year Olds | 3 (50.0%) | 3 (50.0%) |
| 25 to 34 Year Olds | 21 (72.4%) | 8 (27.6%) |
| 35 Years and over | 6 (46.2%) | 7 (53.8%) |
| Total | 375 (80.3%) | 92 (19.7%) |
Educational Attainment by Field of Study in Honey Brook borough
Business (59 | 17.1%), bio, nature & agricultural (47 | 13.6%), education (37 | 10.7%), science & technology (27 | 7.8%), and visual & performing arts (25 | 7.2%) are the most common fields of study among 345 individuals in Honey Brook borough who have obtained a bachelor's degree or higher.
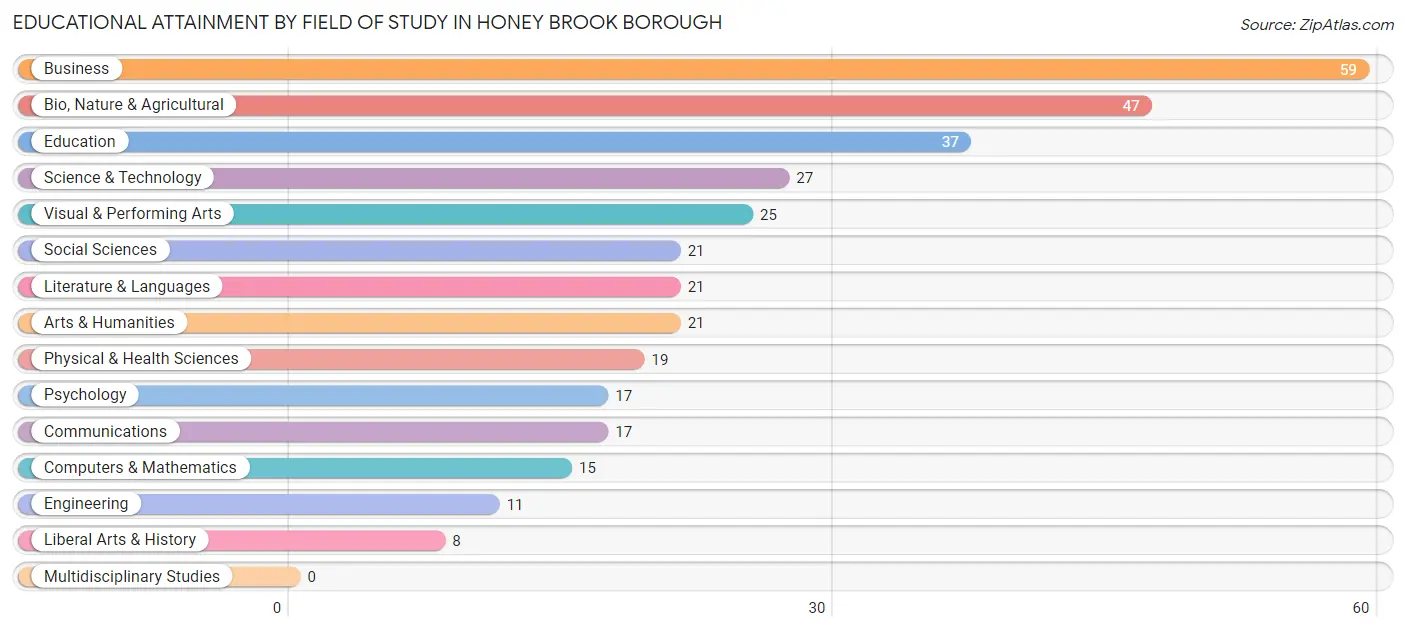
| Field of Study | # Graduates | % Graduates |
| Computers & Mathematics | 15 | 4.3% |
| Bio, Nature & Agricultural | 47 | 13.6% |
| Physical & Health Sciences | 19 | 5.5% |
| Psychology | 17 | 4.9% |
| Social Sciences | 21 | 6.1% |
| Engineering | 11 | 3.2% |
| Multidisciplinary Studies | 0 | 0.0% |
| Science & Technology | 27 | 7.8% |
| Business | 59 | 17.1% |
| Education | 37 | 10.7% |
| Literature & Languages | 21 | 6.1% |
| Liberal Arts & History | 8 | 2.3% |
| Visual & Performing Arts | 25 | 7.2% |
| Communications | 17 | 4.9% |
| Arts & Humanities | 21 | 6.1% |
| Total | 345 | 100.0% |
Transportation & Commute in Honey Brook borough
Vehicle Availability by Sex in Honey Brook borough
The most prevalent vehicle ownership categories in Honey Brook borough are males with 2 vehicles (247, accounting for 46.3%) and females with 2 vehicles (239, making up 56.8%).
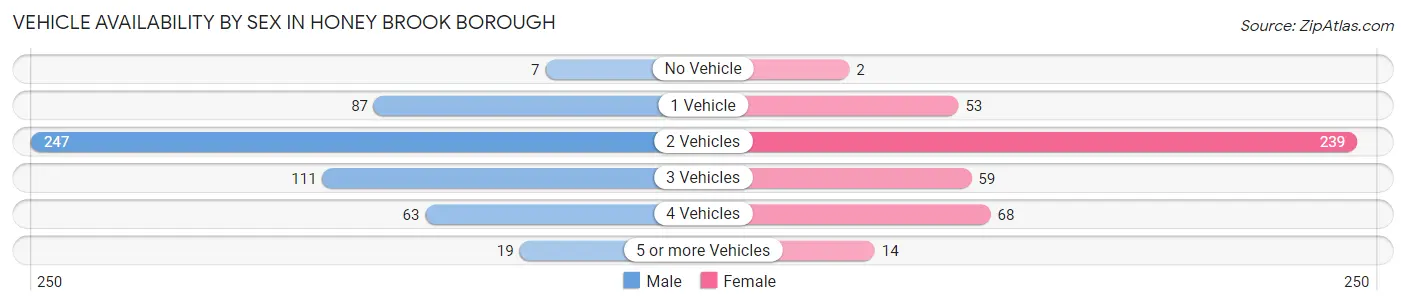
| Vehicles Available | Male | Female |
| No Vehicle | 7 (1.3%) | 2 (0.5%) |
| 1 Vehicle | 87 (16.3%) | 53 (12.2%) |
| 2 Vehicles | 247 (46.3%) | 239 (54.9%) |
| 3 Vehicles | 111 (20.8%) | 59 (13.6%) |
| 4 Vehicles | 63 (11.8%) | 68 (15.6%) |
| 5 or more Vehicles | 19 (3.6%) | 14 (3.2%) |
| Total | 534 (100.0%) | 435 (100.0%) |
Commute Time in Honey Brook borough
The most frequently occuring commute durations in Honey Brook borough are 45 to 59 minutes (193 commuters, 21.3%), 30 to 34 minutes (152 commuters, 16.8%), and 20 to 24 minutes (144 commuters, 15.9%).
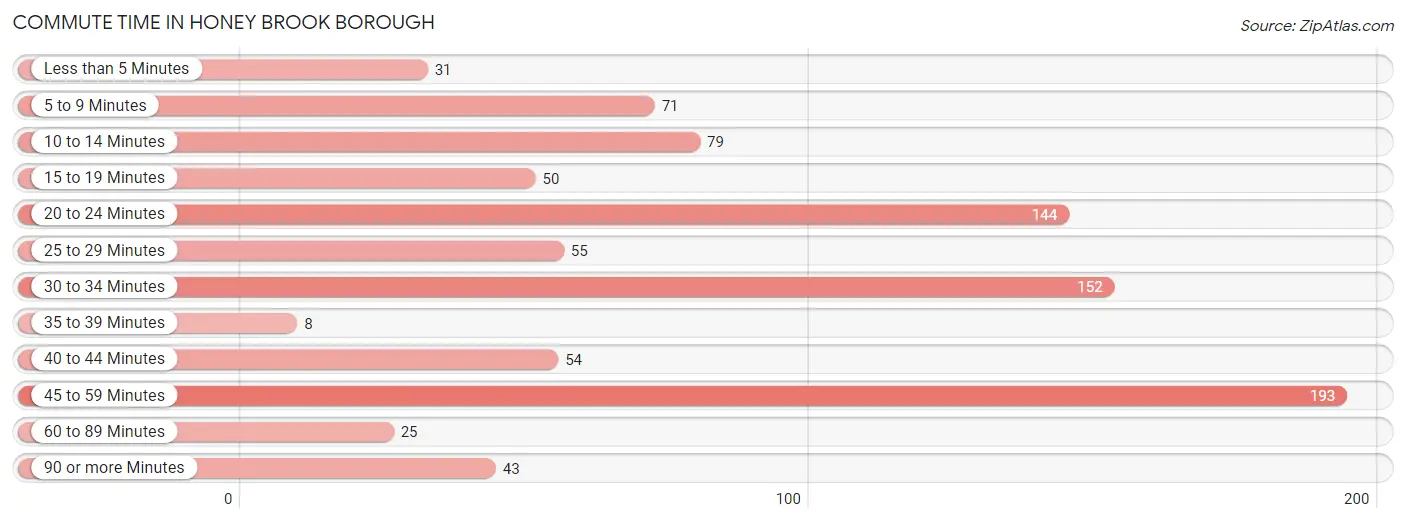
| Commute Time | # Commuters | % Commuters |
| Less than 5 Minutes | 31 | 3.4% |
| 5 to 9 Minutes | 71 | 7.9% |
| 10 to 14 Minutes | 79 | 8.7% |
| 15 to 19 Minutes | 50 | 5.5% |
| 20 to 24 Minutes | 144 | 15.9% |
| 25 to 29 Minutes | 55 | 6.1% |
| 30 to 34 Minutes | 152 | 16.8% |
| 35 to 39 Minutes | 8 | 0.9% |
| 40 to 44 Minutes | 54 | 6.0% |
| 45 to 59 Minutes | 193 | 21.3% |
| 60 to 89 Minutes | 25 | 2.8% |
| 90 or more Minutes | 43 | 4.8% |
Commute Time by Sex in Honey Brook borough
The most common commute times in Honey Brook borough are 45 to 59 minutes (128 commuters, 25.4%) for males and 30 to 34 minutes (99 commuters, 24.7%) for females.
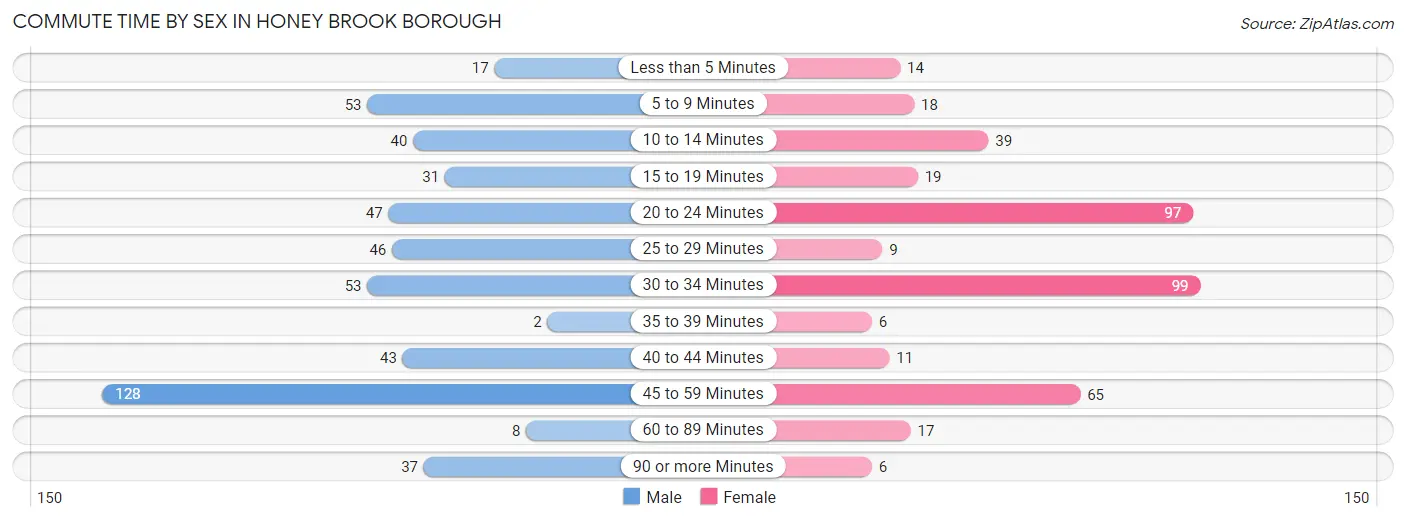
| Commute Time | Male | Female |
| Less than 5 Minutes | 17 (3.4%) | 14 (3.5%) |
| 5 to 9 Minutes | 53 (10.5%) | 18 (4.5%) |
| 10 to 14 Minutes | 40 (7.9%) | 39 (9.8%) |
| 15 to 19 Minutes | 31 (6.1%) | 19 (4.8%) |
| 20 to 24 Minutes | 47 (9.3%) | 97 (24.2%) |
| 25 to 29 Minutes | 46 (9.1%) | 9 (2.2%) |
| 30 to 34 Minutes | 53 (10.5%) | 99 (24.7%) |
| 35 to 39 Minutes | 2 (0.4%) | 6 (1.5%) |
| 40 to 44 Minutes | 43 (8.5%) | 11 (2.8%) |
| 45 to 59 Minutes | 128 (25.4%) | 65 (16.3%) |
| 60 to 89 Minutes | 8 (1.6%) | 17 (4.3%) |
| 90 or more Minutes | 37 (7.3%) | 6 (1.5%) |
Time of Departure to Work by Sex in Honey Brook borough
The most frequent times of departure to work in Honey Brook borough are 7:00 AM to 7:29 AM (114, 22.6%) for males and 6:30 AM to 6:59 AM (96, 24.0%) for females.
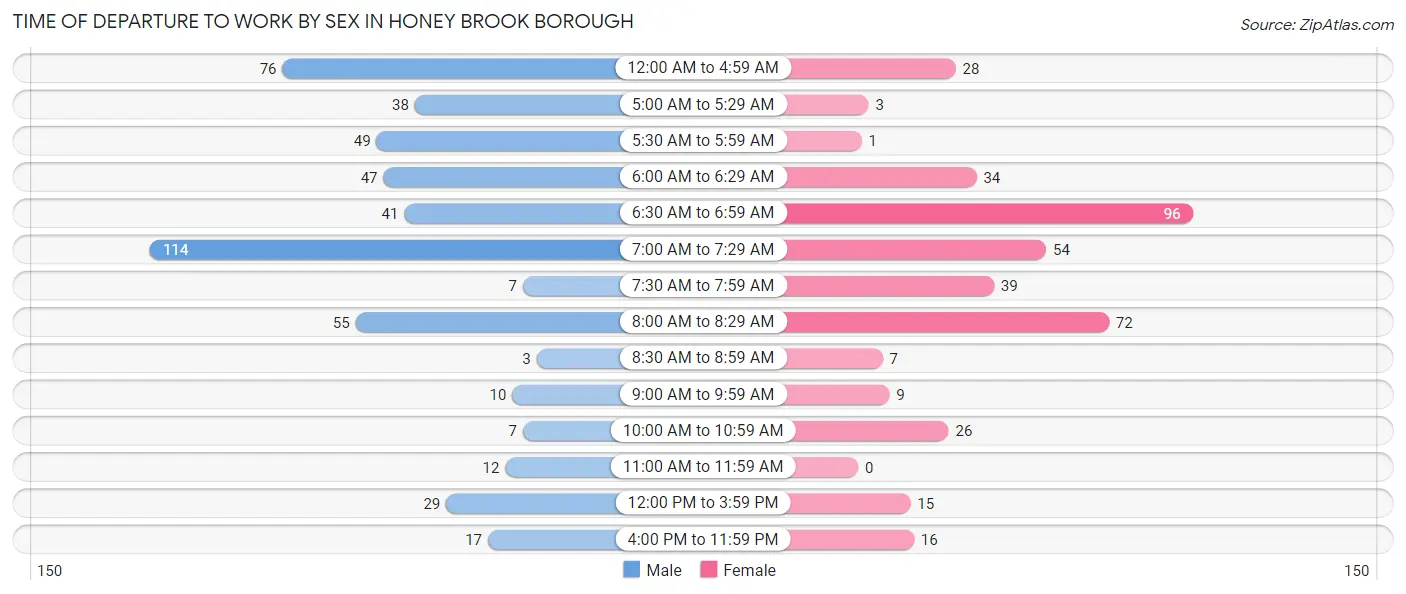
| Time of Departure | Male | Female |
| 12:00 AM to 4:59 AM | 76 (15.0%) | 28 (7.0%) |
| 5:00 AM to 5:29 AM | 38 (7.5%) | 3 (0.7%) |
| 5:30 AM to 5:59 AM | 49 (9.7%) | 1 (0.3%) |
| 6:00 AM to 6:29 AM | 47 (9.3%) | 34 (8.5%) |
| 6:30 AM to 6:59 AM | 41 (8.1%) | 96 (24.0%) |
| 7:00 AM to 7:29 AM | 114 (22.6%) | 54 (13.5%) |
| 7:30 AM to 7:59 AM | 7 (1.4%) | 39 (9.8%) |
| 8:00 AM to 8:29 AM | 55 (10.9%) | 72 (18.0%) |
| 8:30 AM to 8:59 AM | 3 (0.6%) | 7 (1.8%) |
| 9:00 AM to 9:59 AM | 10 (2.0%) | 9 (2.2%) |
| 10:00 AM to 10:59 AM | 7 (1.4%) | 26 (6.5%) |
| 11:00 AM to 11:59 AM | 12 (2.4%) | 0 (0.0%) |
| 12:00 PM to 3:59 PM | 29 (5.7%) | 15 (3.7%) |
| 4:00 PM to 11:59 PM | 17 (3.4%) | 16 (4.0%) |
| Total | 505 (100.0%) | 400 (100.0%) |
Housing Occupancy in Honey Brook borough
Occupancy by Ownership in Honey Brook borough
Of the total 702 dwellings in Honey Brook borough, owner-occupied units account for 539 (76.8%), while renter-occupied units make up 163 (23.2%).
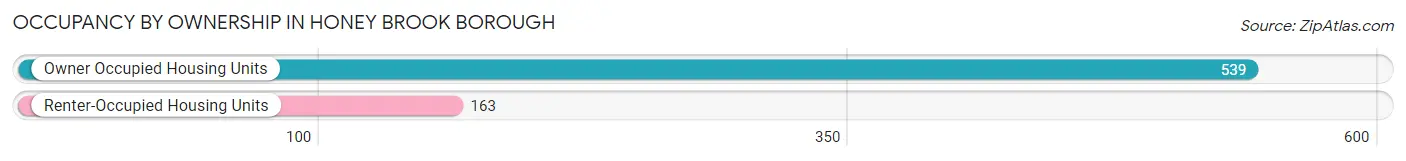
| Occupancy | # Housing Units | % Housing Units |
| Owner Occupied Housing Units | 539 | 76.8% |
| Renter-Occupied Housing Units | 163 | 23.2% |
| Total Occupied Housing Units | 702 | 100.0% |
Occupancy by Household Size in Honey Brook borough
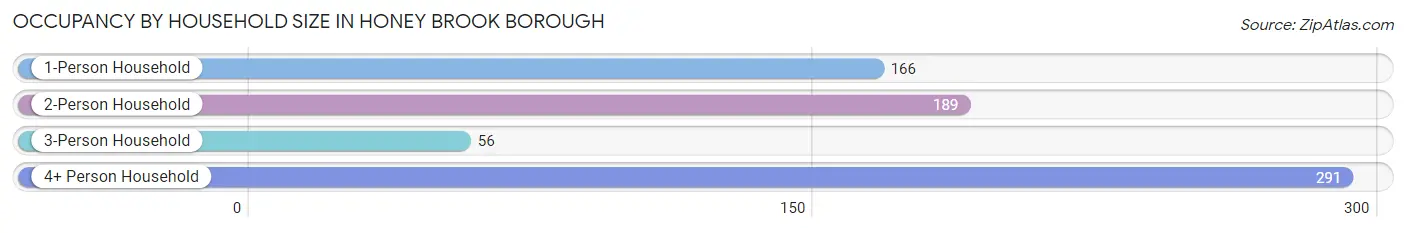
| Household Size | # Housing Units | % Housing Units |
| 1-Person Household | 166 | 23.6% |
| 2-Person Household | 189 | 26.9% |
| 3-Person Household | 56 | 8.0% |
| 4+ Person Household | 291 | 41.4% |
| Total Housing Units | 702 | 100.0% |
Occupancy by Ownership by Household Size in Honey Brook borough
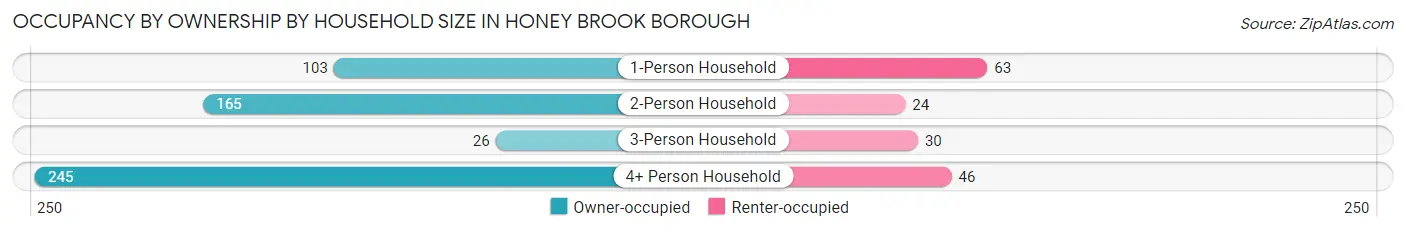
| Household Size | Owner-occupied | Renter-occupied |
| 1-Person Household | 103 (62.1%) | 63 (38.0%) |
| 2-Person Household | 165 (87.3%) | 24 (12.7%) |
| 3-Person Household | 26 (46.4%) | 30 (53.6%) |
| 4+ Person Household | 245 (84.2%) | 46 (15.8%) |
| Total Housing Units | 539 (76.8%) | 163 (23.2%) |
Occupancy by Educational Attainment in Honey Brook borough
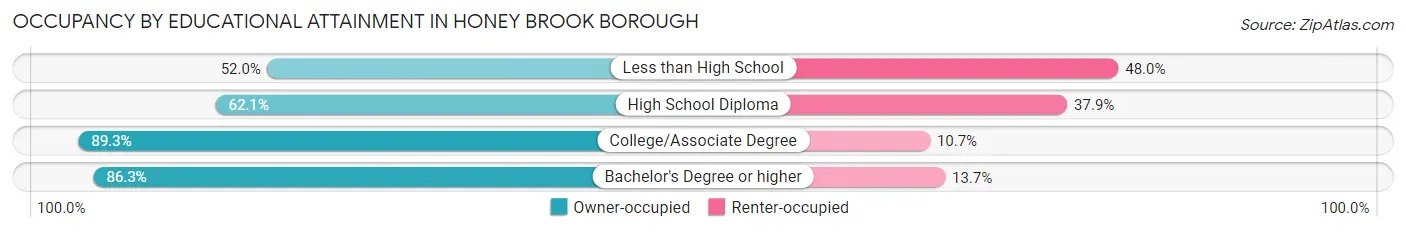
| Household Size | Owner-occupied | Renter-occupied |
| Less than High School | 13 (52.0%) | 12 (48.0%) |
| High School Diploma | 169 (62.1%) | 103 (37.9%) |
| College/Associate Degree | 218 (89.3%) | 26 (10.7%) |
| Bachelor's Degree or higher | 139 (86.3%) | 22 (13.7%) |
Occupancy by Age of Householder in Honey Brook borough
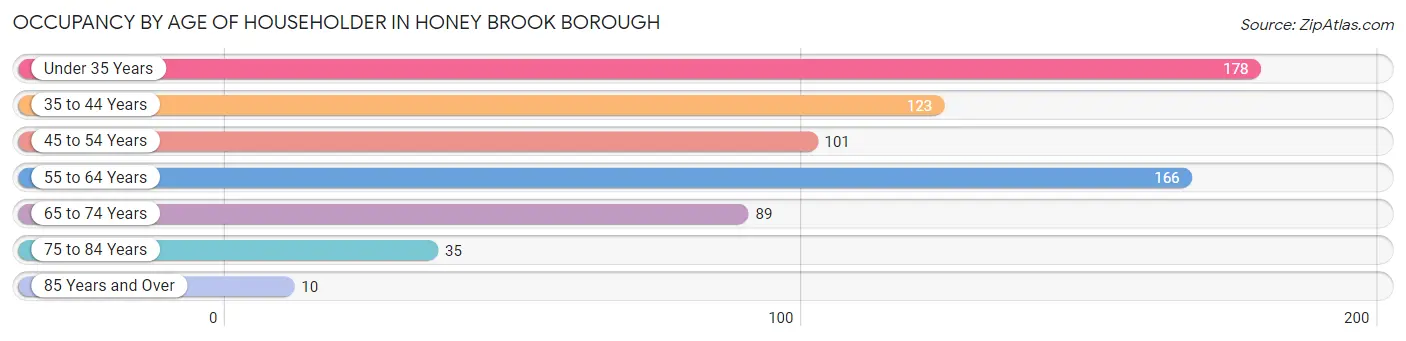
| Age Bracket | # Households | % Households |
| Under 35 Years | 178 | 25.4% |
| 35 to 44 Years | 123 | 17.5% |
| 45 to 54 Years | 101 | 14.4% |
| 55 to 64 Years | 166 | 23.6% |
| 65 to 74 Years | 89 | 12.7% |
| 75 to 84 Years | 35 | 5.0% |
| 85 Years and Over | 10 | 1.4% |
| Total | 702 | 100.0% |
Housing Finances in Honey Brook borough
Median Income by Occupancy in Honey Brook borough
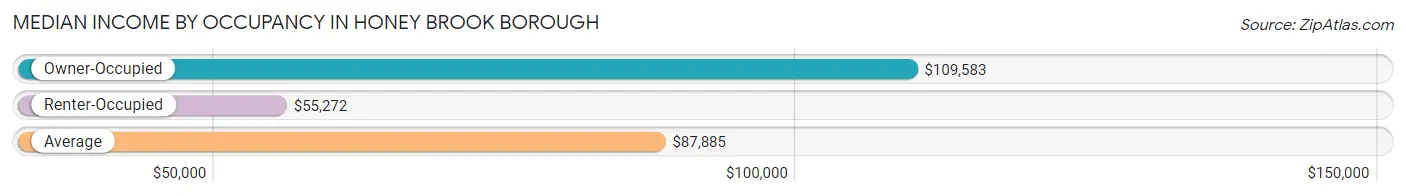
| Occupancy Type | # Households | Median Income |
| Owner-Occupied | 539 (76.8%) | $109,583 |
| Renter-Occupied | 163 (23.2%) | $55,272 |
| Average | 702 (100.0%) | $87,885 |
Occupancy by Householder Income Bracket in Honey Brook borough
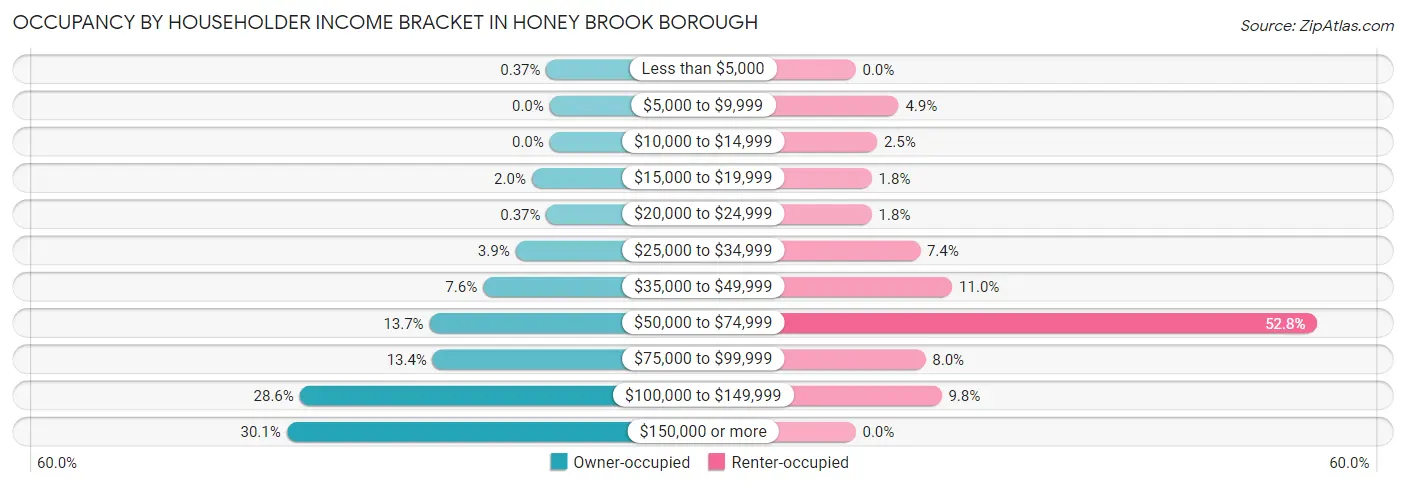
| Income Bracket | Owner-occupied | Renter-occupied |
| Less than $5,000 | 2 (0.4%) | 0 (0.0%) |
| $5,000 to $9,999 | 0 (0.0%) | 8 (4.9%) |
| $10,000 to $14,999 | 0 (0.0%) | 4 (2.5%) |
| $15,000 to $19,999 | 11 (2.0%) | 3 (1.8%) |
| $20,000 to $24,999 | 2 (0.4%) | 3 (1.8%) |
| $25,000 to $34,999 | 21 (3.9%) | 12 (7.4%) |
| $35,000 to $49,999 | 41 (7.6%) | 18 (11.0%) |
| $50,000 to $74,999 | 74 (13.7%) | 86 (52.8%) |
| $75,000 to $99,999 | 72 (13.4%) | 13 (8.0%) |
| $100,000 to $149,999 | 154 (28.6%) | 16 (9.8%) |
| $150,000 or more | 162 (30.1%) | 0 (0.0%) |
| Total | 539 (100.0%) | 163 (100.0%) |
Monthly Housing Cost Tiers in Honey Brook borough
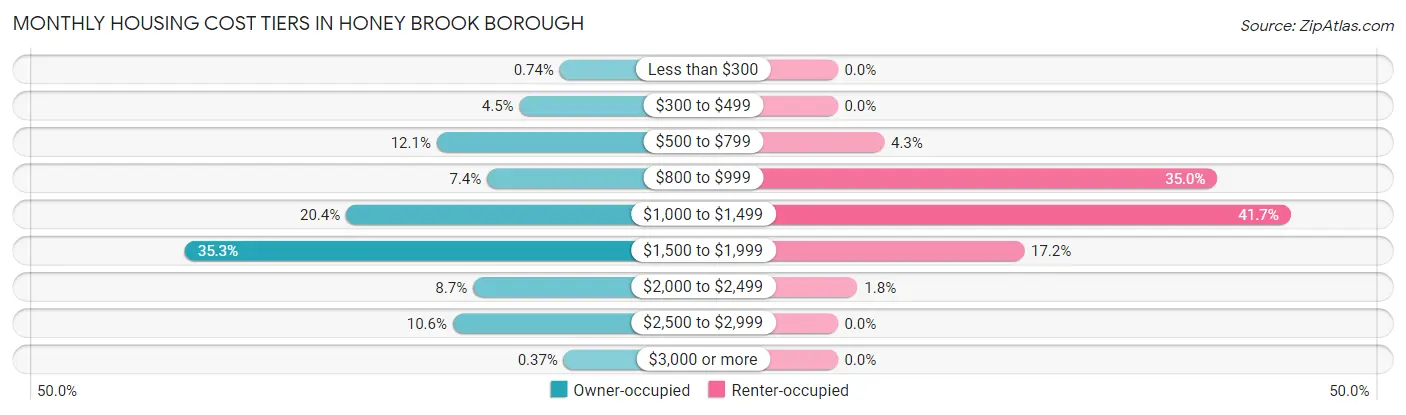
| Monthly Cost | Owner-occupied | Renter-occupied |
| Less than $300 | 4 (0.7%) | 0 (0.0%) |
| $300 to $499 | 24 (4.4%) | 0 (0.0%) |
| $500 to $799 | 65 (12.1%) | 7 (4.3%) |
| $800 to $999 | 40 (7.4%) | 57 (35.0%) |
| $1,000 to $1,499 | 110 (20.4%) | 68 (41.7%) |
| $1,500 to $1,999 | 190 (35.2%) | 28 (17.2%) |
| $2,000 to $2,499 | 47 (8.7%) | 3 (1.8%) |
| $2,500 to $2,999 | 57 (10.6%) | 0 (0.0%) |
| $3,000 or more | 2 (0.4%) | 0 (0.0%) |
| Total | 539 (100.0%) | 163 (100.0%) |
Physical Housing Characteristics in Honey Brook borough
Housing Structures in Honey Brook borough
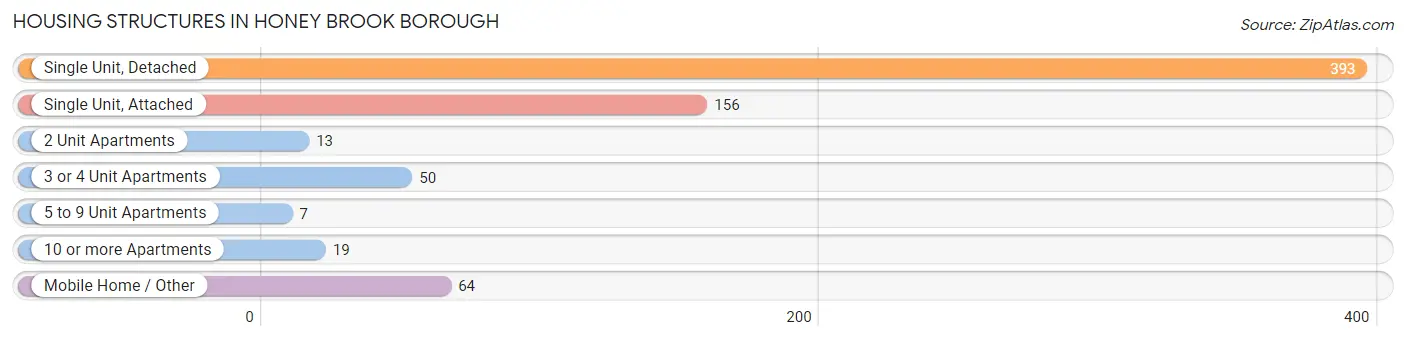
| Structure Type | # Housing Units | % Housing Units |
| Single Unit, Detached | 393 | 56.0% |
| Single Unit, Attached | 156 | 22.2% |
| 2 Unit Apartments | 13 | 1.8% |
| 3 or 4 Unit Apartments | 50 | 7.1% |
| 5 to 9 Unit Apartments | 7 | 1.0% |
| 10 or more Apartments | 19 | 2.7% |
| Mobile Home / Other | 64 | 9.1% |
| Total | 702 | 100.0% |
Housing Structures by Occupancy in Honey Brook borough
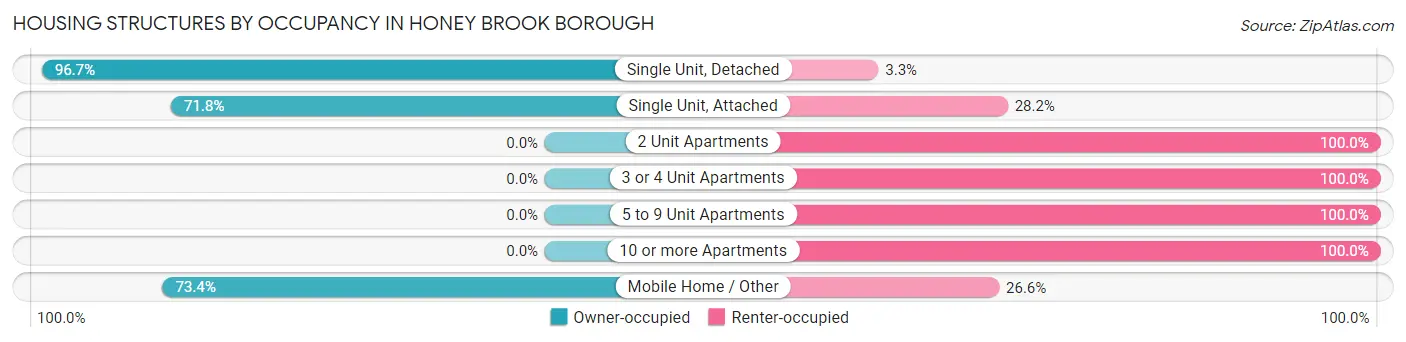
| Structure Type | Owner-occupied | Renter-occupied |
| Single Unit, Detached | 380 (96.7%) | 13 (3.3%) |
| Single Unit, Attached | 112 (71.8%) | 44 (28.2%) |
| 2 Unit Apartments | 0 (0.0%) | 13 (100.0%) |
| 3 or 4 Unit Apartments | 0 (0.0%) | 50 (100.0%) |
| 5 to 9 Unit Apartments | 0 (0.0%) | 7 (100.0%) |
| 10 or more Apartments | 0 (0.0%) | 19 (100.0%) |
| Mobile Home / Other | 47 (73.4%) | 17 (26.6%) |
| Total | 539 (76.8%) | 163 (23.2%) |
Housing Structures by Number of Rooms in Honey Brook borough
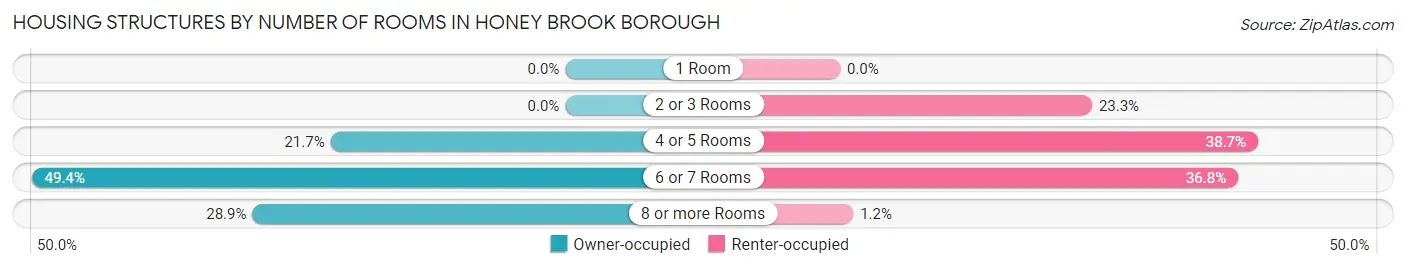
| Number of Rooms | Owner-occupied | Renter-occupied |
| 1 Room | 0 (0.0%) | 0 (0.0%) |
| 2 or 3 Rooms | 0 (0.0%) | 38 (23.3%) |
| 4 or 5 Rooms | 117 (21.7%) | 63 (38.7%) |
| 6 or 7 Rooms | 266 (49.3%) | 60 (36.8%) |
| 8 or more Rooms | 156 (28.9%) | 2 (1.2%) |
| Total | 539 (100.0%) | 163 (100.0%) |
Housing Structure by Heating Type in Honey Brook borough
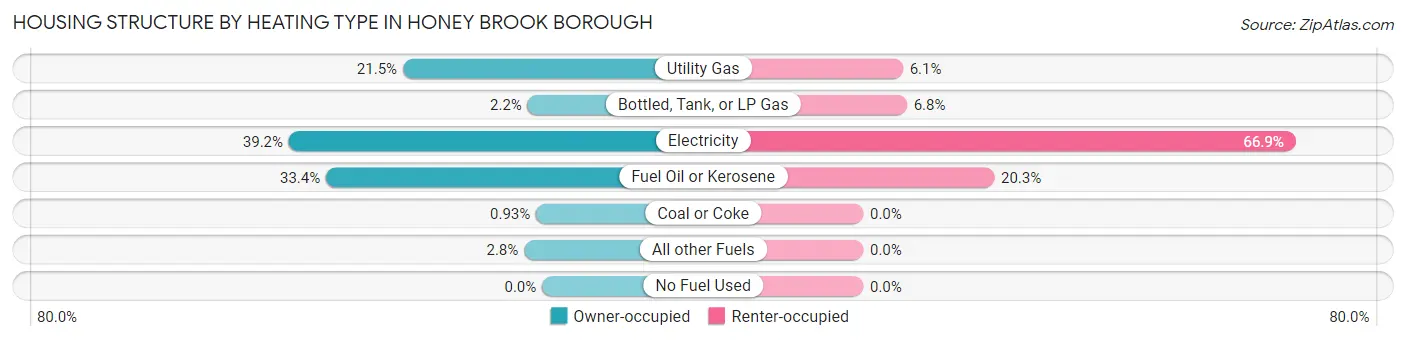
| Heating Type | Owner-occupied | Renter-occupied |
| Utility Gas | 116 (21.5%) | 10 (6.1%) |
| Bottled, Tank, or LP Gas | 12 (2.2%) | 11 (6.8%) |
| Electricity | 211 (39.2%) | 109 (66.9%) |
| Fuel Oil or Kerosene | 180 (33.4%) | 33 (20.3%) |
| Coal or Coke | 5 (0.9%) | 0 (0.0%) |
| All other Fuels | 15 (2.8%) | 0 (0.0%) |
| No Fuel Used | 0 (0.0%) | 0 (0.0%) |
| Total | 539 (100.0%) | 163 (100.0%) |
Household Vehicle Usage in Honey Brook borough
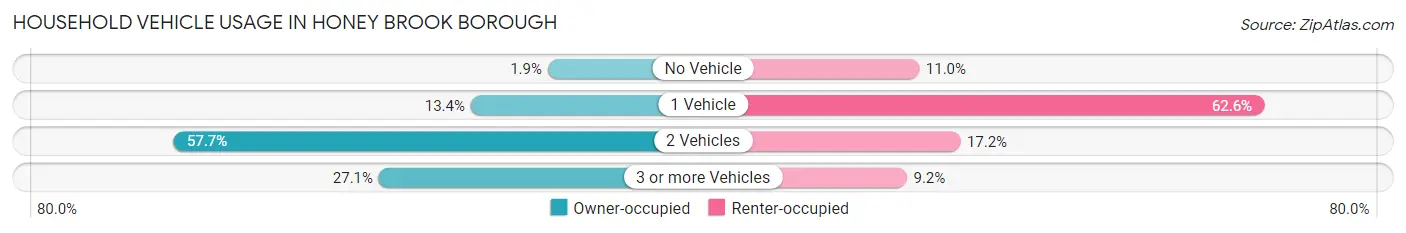
| Vehicles per Household | Owner-occupied | Renter-occupied |
| No Vehicle | 10 (1.9%) | 18 (11.0%) |
| 1 Vehicle | 72 (13.4%) | 102 (62.6%) |
| 2 Vehicles | 311 (57.7%) | 28 (17.2%) |
| 3 or more Vehicles | 146 (27.1%) | 15 (9.2%) |
| Total | 539 (100.0%) | 163 (100.0%) |
Real Estate & Mortgages in Honey Brook borough
Real Estate and Mortgage Overview in Honey Brook borough
| Characteristic | Without Mortgage | With Mortgage |
| Housing Units | 151 | 388 |
| Median Property Value | $159,400 | $249,700 |
| Median Household Income | $75,703 | $143 |
| Monthly Housing Costs | $730 | $2 |
| Real Estate Taxes | $3,157 | $0 |
Property Value by Mortgage Status in Honey Brook borough
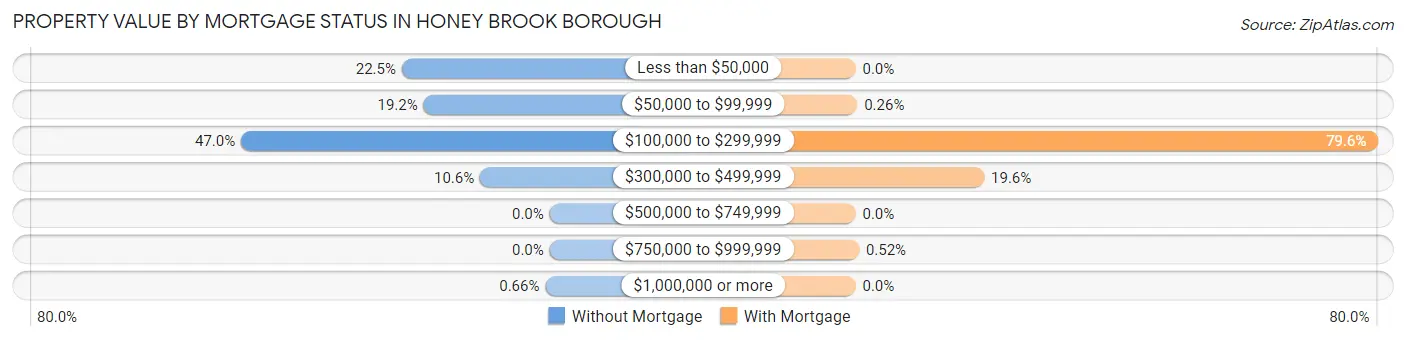
| Property Value | Without Mortgage | With Mortgage |
| Less than $50,000 | 34 (22.5%) | 0 (0.0%) |
| $50,000 to $99,999 | 29 (19.2%) | 1 (0.3%) |
| $100,000 to $299,999 | 71 (47.0%) | 309 (79.6%) |
| $300,000 to $499,999 | 16 (10.6%) | 76 (19.6%) |
| $500,000 to $749,999 | 0 (0.0%) | 0 (0.0%) |
| $750,000 to $999,999 | 0 (0.0%) | 2 (0.5%) |
| $1,000,000 or more | 1 (0.7%) | 0 (0.0%) |
| Total | 151 (100.0%) | 388 (100.0%) |
Household Income by Mortgage Status in Honey Brook borough
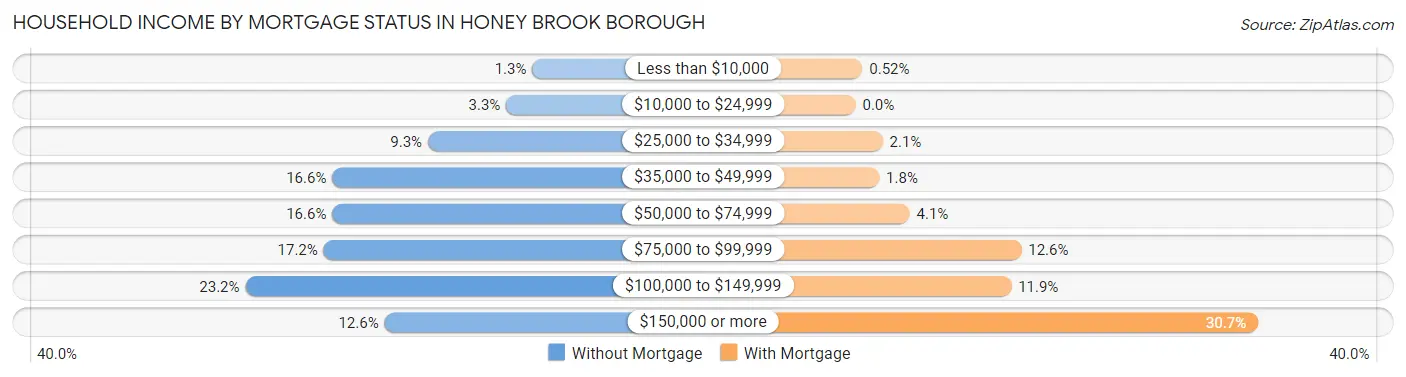
| Household Income | Without Mortgage | With Mortgage |
| Less than $10,000 | 2 (1.3%) | 2 (0.5%) |
| $10,000 to $24,999 | 5 (3.3%) | 0 (0.0%) |
| $25,000 to $34,999 | 14 (9.3%) | 8 (2.1%) |
| $35,000 to $49,999 | 25 (16.6%) | 7 (1.8%) |
| $50,000 to $74,999 | 25 (16.6%) | 16 (4.1%) |
| $75,000 to $99,999 | 26 (17.2%) | 49 (12.6%) |
| $100,000 to $149,999 | 35 (23.2%) | 46 (11.9%) |
| $150,000 or more | 19 (12.6%) | 119 (30.7%) |
| Total | 151 (100.0%) | 388 (100.0%) |
Property Value to Household Income Ratio in Honey Brook borough
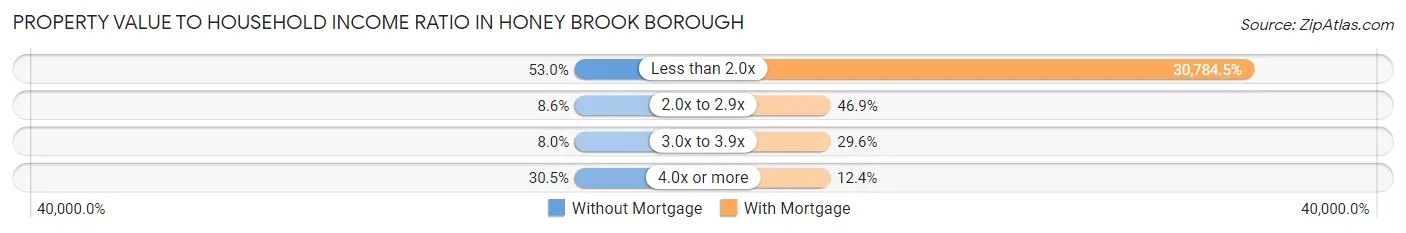
| Value-to-Income Ratio | Without Mortgage | With Mortgage |
| Less than 2.0x | 80 (53.0%) | 119,444 (30,784.5%) |
| 2.0x to 2.9x | 13 (8.6%) | 182 (46.9%) |
| 3.0x to 3.9x | 12 (8.0%) | 115 (29.6%) |
| 4.0x or more | 46 (30.5%) | 48 (12.4%) |
| Total | 151 (100.0%) | 388 (100.0%) |
Real Estate Taxes by Mortgage Status in Honey Brook borough
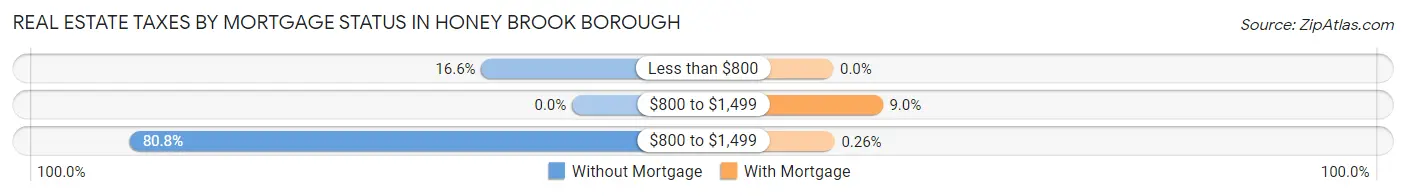
| Property Taxes | Without Mortgage | With Mortgage |
| Less than $800 | 25 (16.6%) | 0 (0.0%) |
| $800 to $1,499 | 0 (0.0%) | 35 (9.0%) |
| $800 to $1,499 | 122 (80.8%) | 1 (0.3%) |
| Total | 151 (100.0%) | 388 (100.0%) |
Health & Disability in Honey Brook borough
Health Insurance Coverage by Age in Honey Brook borough
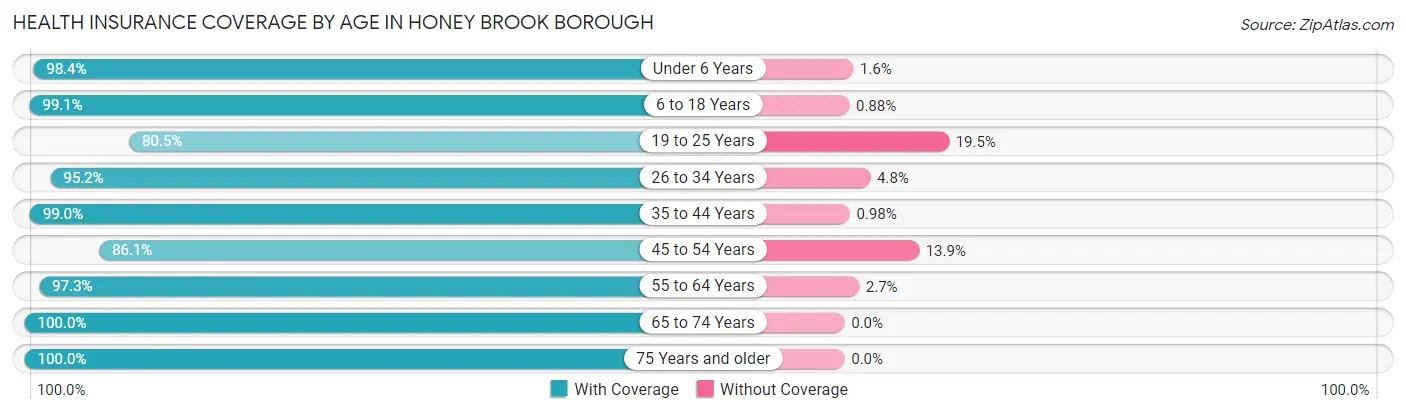
| Age Bracket | With Coverage | Without Coverage |
| Under 6 Years | 242 (98.4%) | 4 (1.6%) |
| 6 to 18 Years | 337 (99.1%) | 3 (0.9%) |
| 19 to 25 Years | 153 (80.5%) | 37 (19.5%) |
| 26 to 34 Years | 257 (95.2%) | 13 (4.8%) |
| 35 to 44 Years | 303 (99.0%) | 3 (1.0%) |
| 45 to 54 Years | 149 (86.1%) | 24 (13.9%) |
| 55 to 64 Years | 250 (97.3%) | 7 (2.7%) |
| 65 to 74 Years | 165 (100.0%) | 0 (0.0%) |
| 75 Years and older | 58 (100.0%) | 0 (0.0%) |
| Total | 1,914 (95.5%) | 91 (4.5%) |
Health Insurance Coverage by Citizenship Status in Honey Brook borough
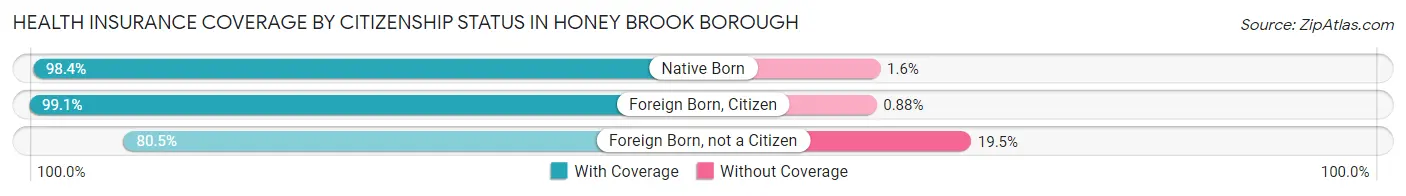
| Citizenship Status | With Coverage | Without Coverage |
| Native Born | 242 (98.4%) | 4 (1.6%) |
| Foreign Born, Citizen | 337 (99.1%) | 3 (0.9%) |
| Foreign Born, not a Citizen | 153 (80.5%) | 37 (19.5%) |
Health Insurance Coverage by Household Income in Honey Brook borough
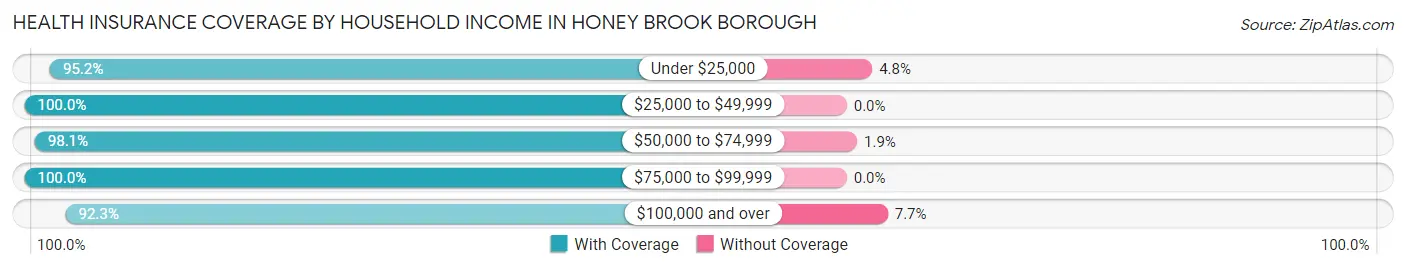
| Household Income | With Coverage | Without Coverage |
| Under $25,000 | 40 (95.2%) | 2 (4.8%) |
| $25,000 to $49,999 | 172 (100.0%) | 0 (0.0%) |
| $50,000 to $74,999 | 406 (98.1%) | 8 (1.9%) |
| $75,000 to $99,999 | 322 (100.0%) | 0 (0.0%) |
| $100,000 and over | 974 (92.3%) | 81 (7.7%) |
Public vs Private Health Insurance Coverage by Age in Honey Brook borough
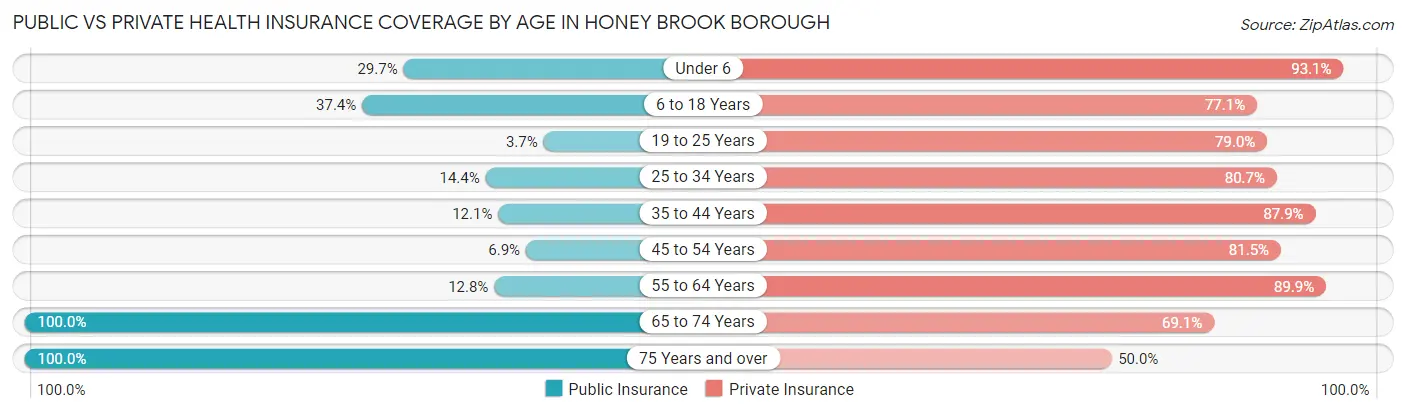
| Age Bracket | Public Insurance | Private Insurance |
| Under 6 | 73 (29.7%) | 229 (93.1%) |
| 6 to 18 Years | 127 (37.3%) | 262 (77.1%) |
| 19 to 25 Years | 7 (3.7%) | 150 (78.9%) |
| 25 to 34 Years | 39 (14.4%) | 218 (80.7%) |
| 35 to 44 Years | 37 (12.1%) | 269 (87.9%) |
| 45 to 54 Years | 12 (6.9%) | 141 (81.5%) |
| 55 to 64 Years | 33 (12.8%) | 231 (89.9%) |
| 65 to 74 Years | 165 (100.0%) | 114 (69.1%) |
| 75 Years and over | 58 (100.0%) | 29 (50.0%) |
| Total | 551 (27.5%) | 1,643 (82.0%) |
Disability Status by Sex by Age in Honey Brook borough
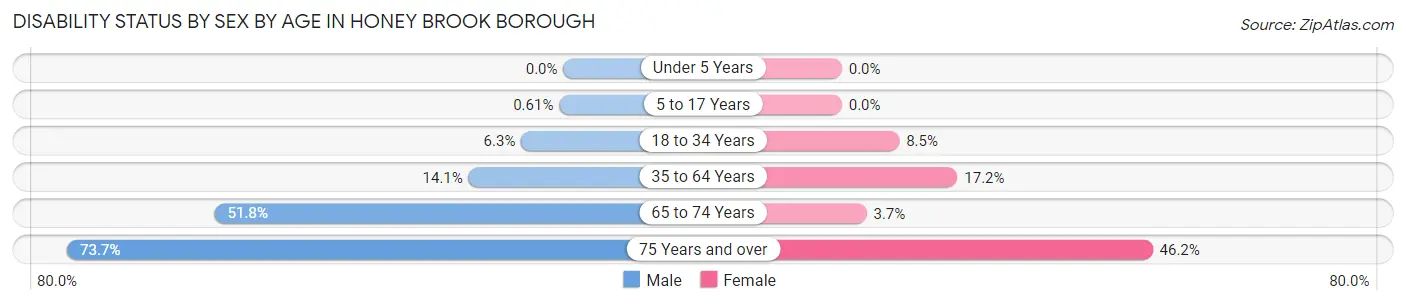
| Age Bracket | Male | Female |
| Under 5 Years | 0 (0.0%) | 0 (0.0%) |
| 5 to 17 Years | 1 (0.6%) | 0 (0.0%) |
| 18 to 34 Years | 16 (6.2%) | 18 (8.5%) |
| 35 to 64 Years | 56 (14.1%) | 58 (17.2%) |
| 65 to 74 Years | 29 (51.8%) | 4 (3.7%) |
| 75 Years and over | 14 (73.7%) | 18 (46.2%) |
Disability Class by Sex by Age in Honey Brook borough
Disability Class: Hearing Difficulty
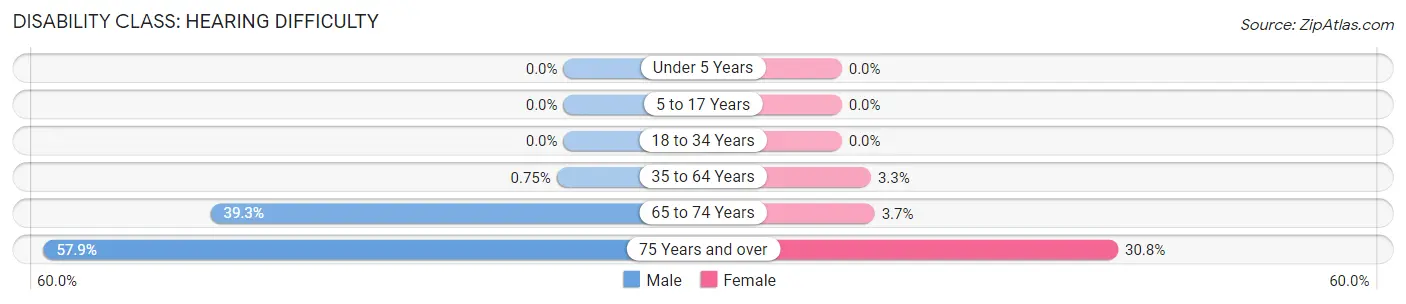
| Age Bracket | Male | Female |
| Under 5 Years | 0 (0.0%) | 0 (0.0%) |
| 5 to 17 Years | 0 (0.0%) | 0 (0.0%) |
| 18 to 34 Years | 0 (0.0%) | 0 (0.0%) |
| 35 to 64 Years | 3 (0.7%) | 11 (3.3%) |
| 65 to 74 Years | 22 (39.3%) | 4 (3.7%) |
| 75 Years and over | 11 (57.9%) | 12 (30.8%) |
Disability Class: Vision Difficulty
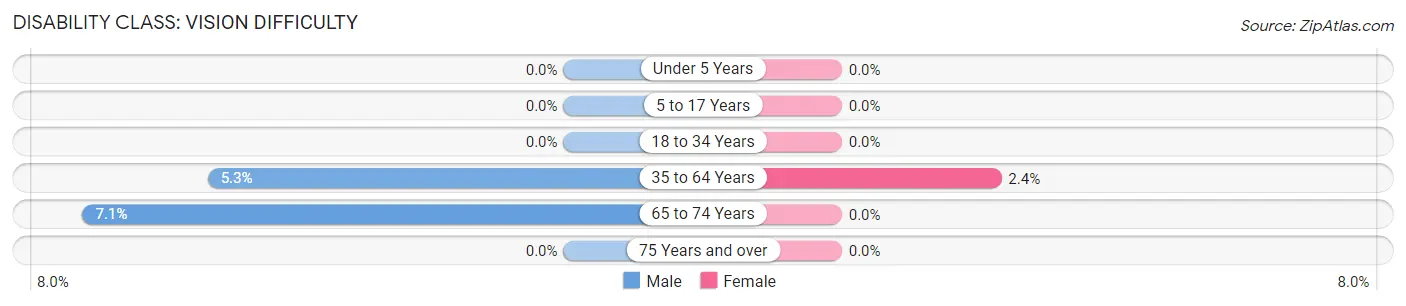
| Age Bracket | Male | Female |
| Under 5 Years | 0 (0.0%) | 0 (0.0%) |
| 5 to 17 Years | 0 (0.0%) | 0 (0.0%) |
| 18 to 34 Years | 0 (0.0%) | 0 (0.0%) |
| 35 to 64 Years | 21 (5.3%) | 8 (2.4%) |
| 65 to 74 Years | 4 (7.1%) | 0 (0.0%) |
| 75 Years and over | 0 (0.0%) | 0 (0.0%) |
Disability Class: Cognitive Difficulty
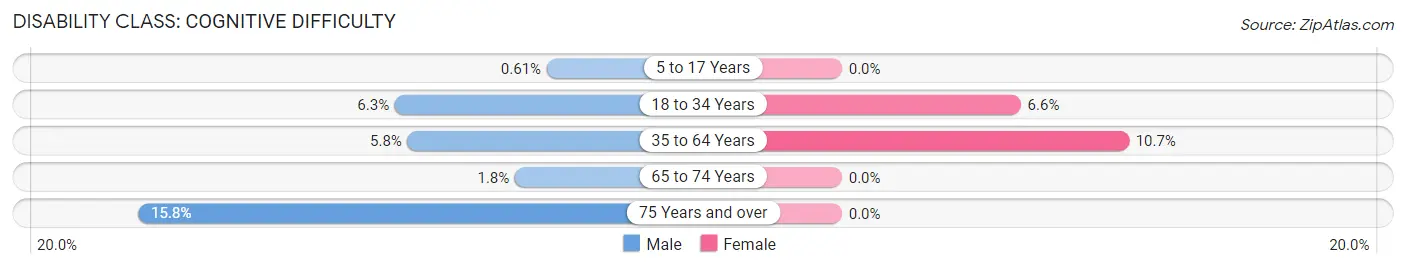
| Age Bracket | Male | Female |
| 5 to 17 Years | 1 (0.6%) | 0 (0.0%) |
| 18 to 34 Years | 16 (6.2%) | 14 (6.6%) |
| 35 to 64 Years | 23 (5.8%) | 36 (10.6%) |
| 65 to 74 Years | 1 (1.8%) | 0 (0.0%) |
| 75 Years and over | 3 (15.8%) | 0 (0.0%) |
Disability Class: Ambulatory Difficulty
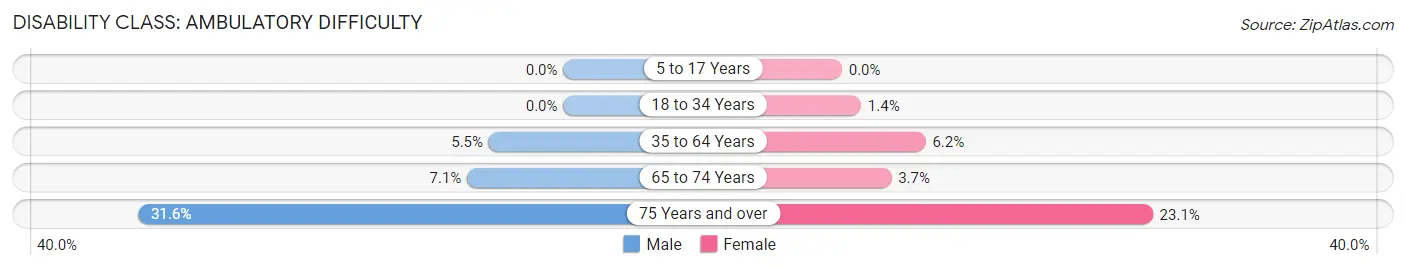
| Age Bracket | Male | Female |
| 5 to 17 Years | 0 (0.0%) | 0 (0.0%) |
| 18 to 34 Years | 0 (0.0%) | 3 (1.4%) |
| 35 to 64 Years | 22 (5.5%) | 21 (6.2%) |
| 65 to 74 Years | 4 (7.1%) | 4 (3.7%) |
| 75 Years and over | 6 (31.6%) | 9 (23.1%) |
Disability Class: Self-Care Difficulty
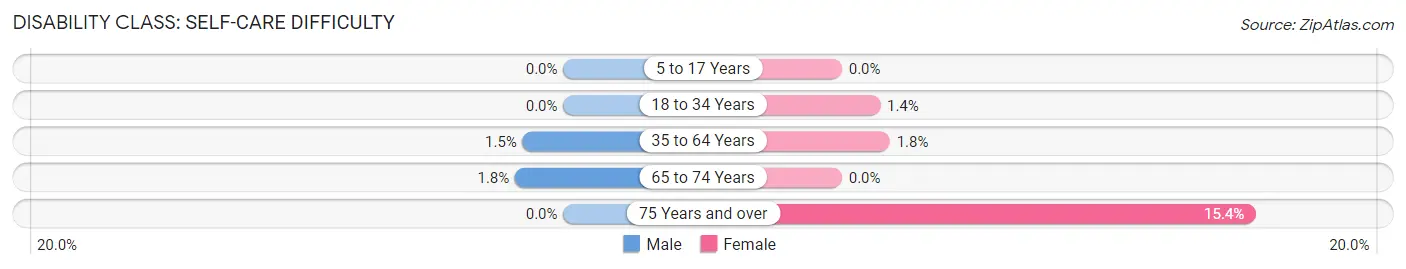
| Age Bracket | Male | Female |
| 5 to 17 Years | 0 (0.0%) | 0 (0.0%) |
| 18 to 34 Years | 0 (0.0%) | 3 (1.4%) |
| 35 to 64 Years | 6 (1.5%) | 6 (1.8%) |
| 65 to 74 Years | 1 (1.8%) | 0 (0.0%) |
| 75 Years and over | 0 (0.0%) | 6 (15.4%) |
Technology Access in Honey Brook borough
Computing Device Access in Honey Brook borough
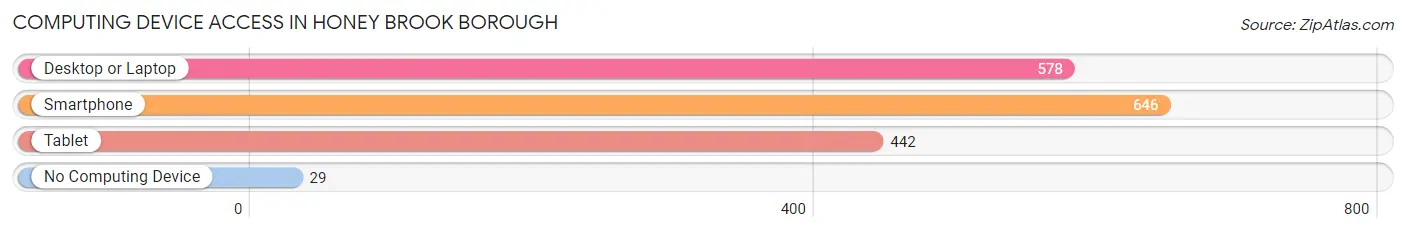
| Device Type | # Households | % Households |
| Desktop or Laptop | 578 | 82.3% |
| Smartphone | 646 | 92.0% |
| Tablet | 442 | 63.0% |
| No Computing Device | 29 | 4.1% |
| Total | 702 | 100.0% |
Internet Access in Honey Brook borough
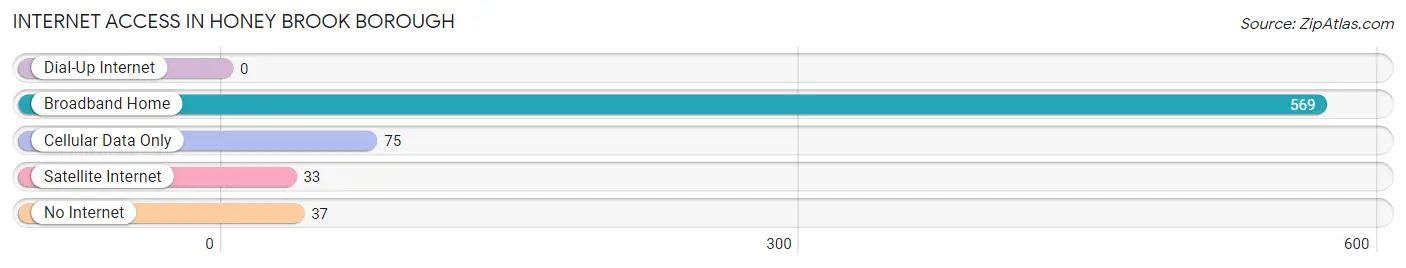
| Internet Type | # Households | % Households |
| Dial-Up Internet | 0 | 0.0% |
| Broadband Home | 569 | 81.0% |
| Cellular Data Only | 75 | 10.7% |
| Satellite Internet | 33 | 4.7% |
| No Internet | 37 | 5.3% |
| Total | 702 | 100.0% |
Honey Brook borough Summary
Honey Brook Borough is a borough located in Chester County, Pennsylvania, United States. The population was 2,717 at the 2010 census. It is part of the Philadelphia metropolitan area.
History
Honey Brook Borough was founded in 1737 by a group of Quakers from Philadelphia. The town was named after the Honey Brook Creek, which runs through the area. The creek was named for the abundance of wild honey found in the area. The town was originally part of Lancaster County, but was transferred to Chester County in 1789.
In the 19th century, the town was a center of the iron industry. The iron industry was centered around the Honey Brook Forge, which was built in 1810. The forge was the largest in the area and produced a variety of products, including nails, horseshoes, and tools. The forge was in operation until the early 20th century.
Geography
Honey Brook Borough is located at 40°7'17" North, 75°59'45" West (40.1214, -75.9958). According to the United States Census Bureau, the borough has a total area of 1.2 square miles (3.1 km2), all of it land.
Economy
Honey Brook Borough is a small, rural community with a population of just over 2,700 people. The economy of the borough is largely based on agriculture and small businesses. The town is home to several small businesses, including a grocery store, a hardware store, and a few restaurants.
Demographics
As of the 2010 census, there were 2,717 people, 1,072 households, and 745 families residing in the borough. The population density was 2,269.2 people per square mile (876.7/km2). There were 1,097 housing units at an average density of 908.3 per square mile (351.2/km2). The racial makeup of the borough was 97.2% White, 0.7% African American, 0.2% Native American, 0.4% Asian, 0.2% from other races, and 1.3% from two or more races. Hispanic or Latino of any race were 1.3% of the population.
There were 1,072 households, out of which 33.2% had children under the age of 18 living with them, 54.2% were married couples living together, 10.2% had a female householder with no husband present, and 30.2% were non-families. 25.2% of all households were made up of individuals, and 11.2% had someone living alone who was 65 years of age or older. The average household size was 2.54 and the average family size was 3.05.
In the borough, the population was spread out, with 25.2% under the age of 18, 7.2% from 18 to 24, 28.7% from 25 to 44, 24.2% from 45 to 64, and 14.7% who were 65 years of age or older. The median age was 38 years. For every 100 females, there were 97.2 males. For every 100 females age 18 and over, there were 94.2 males.
The median income for a household in the borough was $45,000, and the median income for a family was $51,250. Males had a median income of $37,500 versus $27,500 for females. The per capita income for the borough was $20,945. About 4.2% of families and 5.7% of the population were below the poverty line, including 6.2% of those under age 18 and 6.2% of those age 65 or over.
Common Questions
What is Per Capita Income in Honey Brook borough?
Per Capita income in Honey Brook borough is $36,480.
What is the Median Family Income in Honey Brook borough?
Median Family Income in Honey Brook borough is $82,750.
What is the Median Household income in Honey Brook borough?
Median Household Income in Honey Brook borough is $87,885.
What is Income or Wage Gap in Honey Brook borough?
Income or Wage Gap in Honey Brook borough is 34.6%.
Women in Honey Brook borough earn 65.4 cents for every dollar earned by a man.
What is Inequality or Gini Index in Honey Brook borough?
Inequality or Gini Index in Honey Brook borough is 0.33.
What is the Total Population of Honey Brook borough?
Total Population of Honey Brook borough is 2,005.
What is the Total Male Population of Honey Brook borough?
Total Male Population of Honey Brook borough is 984.
What is the Total Female Population of Honey Brook borough?
Total Female Population of Honey Brook borough is 1,021.
What is the Ratio of Males per 100 Females in Honey Brook borough?
There are 96.38 Males per 100 Females in Honey Brook borough.
What is the Ratio of Females per 100 Males in Honey Brook borough?
There are 103.76 Females per 100 Males in Honey Brook borough.
What is the Median Population Age in Honey Brook borough?
Median Population Age in Honey Brook borough is 34.1 Years.
What is the Average Family Size in Honey Brook borough
Average Family Size in Honey Brook borough is 3.4 People.
What is the Average Household Size in Honey Brook borough
Average Household Size in Honey Brook borough is 2.9 People.
How Large is the Labor Force in Honey Brook borough?
There are 1,081 People in the Labor Forcein in Honey Brook borough.
What is the Percentage of People in the Labor Force in Honey Brook borough?
75.2% of People are in the Labor Force in Honey Brook borough.
What is the Unemployment Rate in Honey Brook borough?
Unemployment Rate in Honey Brook borough is 2.3%.