Dravosburg borough, PA Map & Demographics
Dravosburg borough Overview
$37,504
PER CAPITA INCOME
$69,875
AVG FAMILY INCOME
$43,208
AVG HOUSEHOLD INCOME
33.4%
WAGE / INCOME GAP [ % ]
66.6¢/ $1
WAGE / INCOME GAP [ $ ]
0.51
INEQUALITY / GINI INDEX
1,614
TOTAL POPULATION
797
MALE POPULATION
817
FEMALE POPULATION
97.55
MALES / 100 FEMALES
102.51
FEMALES / 100 MALES
47.9
MEDIAN AGE
2.8
AVG FAMILY SIZE
2.0
AVG HOUSEHOLD SIZE
860
LABOR FORCE [ PEOPLE ]
57.3%
PERCENT IN LABOR FORCE
6.9%
UNEMPLOYMENT RATE
Income in Dravosburg borough
Income Overview in Dravosburg borough
Per Capita Income in Dravosburg borough is $37,504, while median incomes of families and households are $69,875 and $43,208 respectively.
| Characteristic | Number | Measure |
| Per Capita Income | 1,614 | $37,504 |
| Median Family Income | 410 | $69,875 |
| Mean Family Income | 410 | $105,831 |
| Median Household Income | 823 | $43,208 |
| Mean Household Income | 823 | $71,037 |
| Income Deficit | 410 | $0 |
| Wage / Income Gap (%) | 1,614 | 33.40% |
| Wage / Income Gap ($) | 1,614 | 66.60¢ per $1 |
| Gini / Inequality Index | 1,614 | 0.51 |
Earnings by Sex in Dravosburg borough
Average Earnings in Dravosburg borough are $34,973, $42,750 for men and $28,472 for women, a difference of 33.4%.
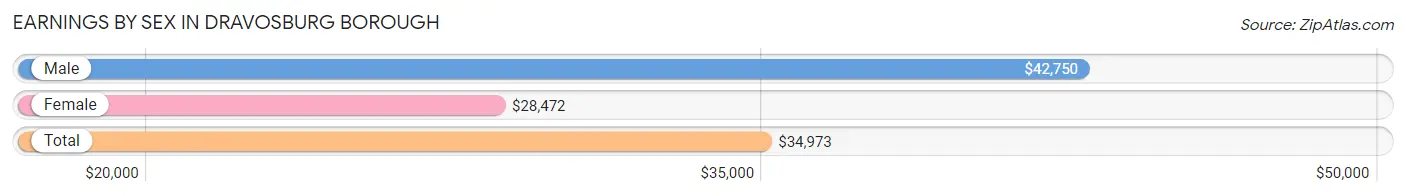
| Sex | Number | Average Earnings |
| Male | 479 (53.3%) | $42,750 |
| Female | 420 (46.7%) | $28,472 |
| Total | 899 (100.0%) | $34,973 |
Earnings by Sex by Income Bracket in Dravosburg borough
The most common earnings brackets in Dravosburg borough are $75,000 to $99,999 for men (46 | 9.6%) and $40,000 to $44,999 for women (44 | 10.5%).
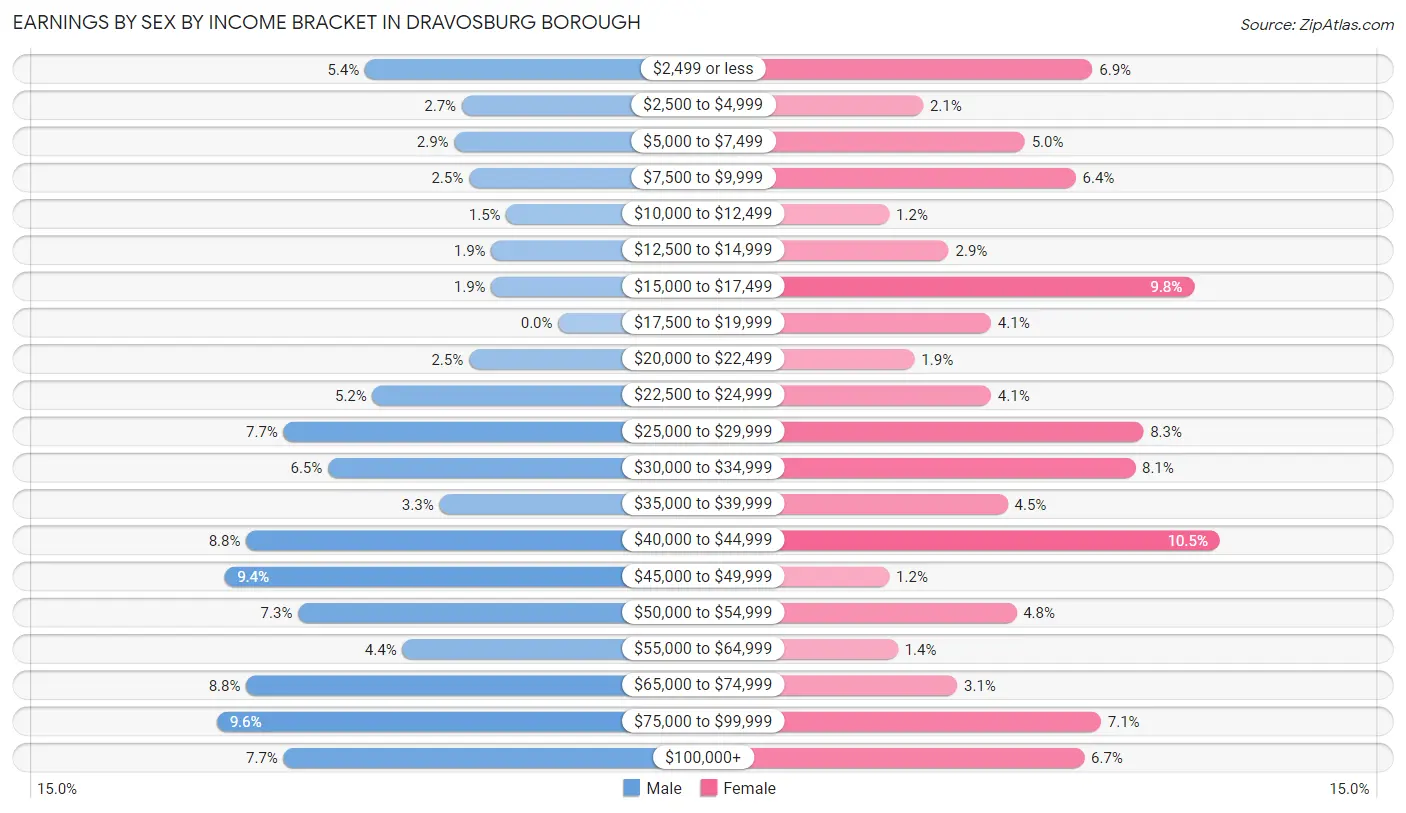
| Income | Male | Female |
| $2,499 or less | 26 (5.4%) | 29 (6.9%) |
| $2,500 to $4,999 | 13 (2.7%) | 9 (2.1%) |
| $5,000 to $7,499 | 14 (2.9%) | 21 (5.0%) |
| $7,500 to $9,999 | 12 (2.5%) | 27 (6.4%) |
| $10,000 to $12,499 | 7 (1.5%) | 5 (1.2%) |
| $12,500 to $14,999 | 9 (1.9%) | 12 (2.9%) |
| $15,000 to $17,499 | 9 (1.9%) | 41 (9.8%) |
| $17,500 to $19,999 | 0 (0.0%) | 17 (4.1%) |
| $20,000 to $22,499 | 12 (2.5%) | 8 (1.9%) |
| $22,500 to $24,999 | 25 (5.2%) | 17 (4.1%) |
| $25,000 to $29,999 | 37 (7.7%) | 35 (8.3%) |
| $30,000 to $34,999 | 31 (6.5%) | 34 (8.1%) |
| $35,000 to $39,999 | 16 (3.3%) | 19 (4.5%) |
| $40,000 to $44,999 | 42 (8.8%) | 44 (10.5%) |
| $45,000 to $49,999 | 45 (9.4%) | 5 (1.2%) |
| $50,000 to $54,999 | 35 (7.3%) | 20 (4.8%) |
| $55,000 to $64,999 | 21 (4.4%) | 6 (1.4%) |
| $65,000 to $74,999 | 42 (8.8%) | 13 (3.1%) |
| $75,000 to $99,999 | 46 (9.6%) | 30 (7.1%) |
| $100,000+ | 37 (7.7%) | 28 (6.7%) |
| Total | 479 (100.0%) | 420 (100.0%) |
Earnings by Sex by Educational Attainment in Dravosburg borough
Average earnings in Dravosburg borough are $44,417 for men and $34,148 for women, a difference of 23.1%. Men with an educational attainment of bachelor's degree enjoy the highest average annual earnings of $53,077, while those with high school diploma education earn the least with $41,442. Women with an educational attainment of graduate degree earn the most with the average annual earnings of $84,063, while those with high school diploma education have the smallest earnings of $24,559.
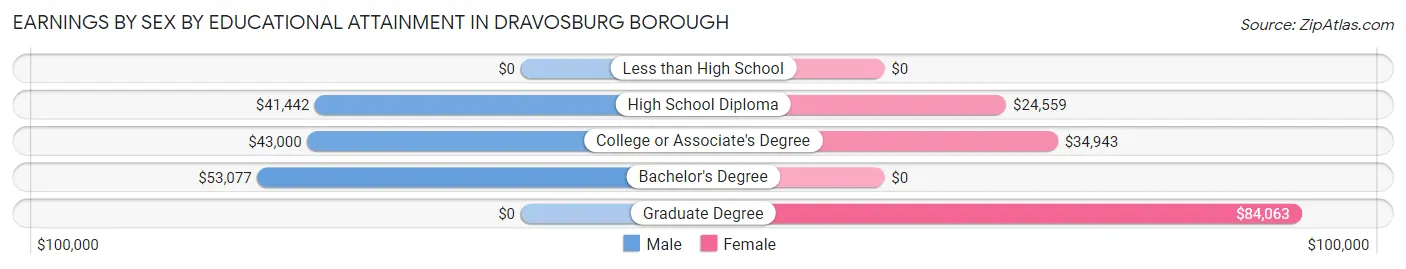
| Educational Attainment | Male Income | Female Income |
| Less than High School | - | - |
| High School Diploma | $41,442 | $24,559 |
| College or Associate's Degree | $43,000 | $34,943 |
| Bachelor's Degree | $53,077 | $0 |
| Graduate Degree | - | - |
| Total | $44,417 | $34,148 |
Family Income in Dravosburg borough
Family Income Brackets in Dravosburg borough
According to the Dravosburg borough family income data, there are 115 families falling into the $50,000 to $74,999 income range, which is the most common income bracket and makes up 28.1% of all families.
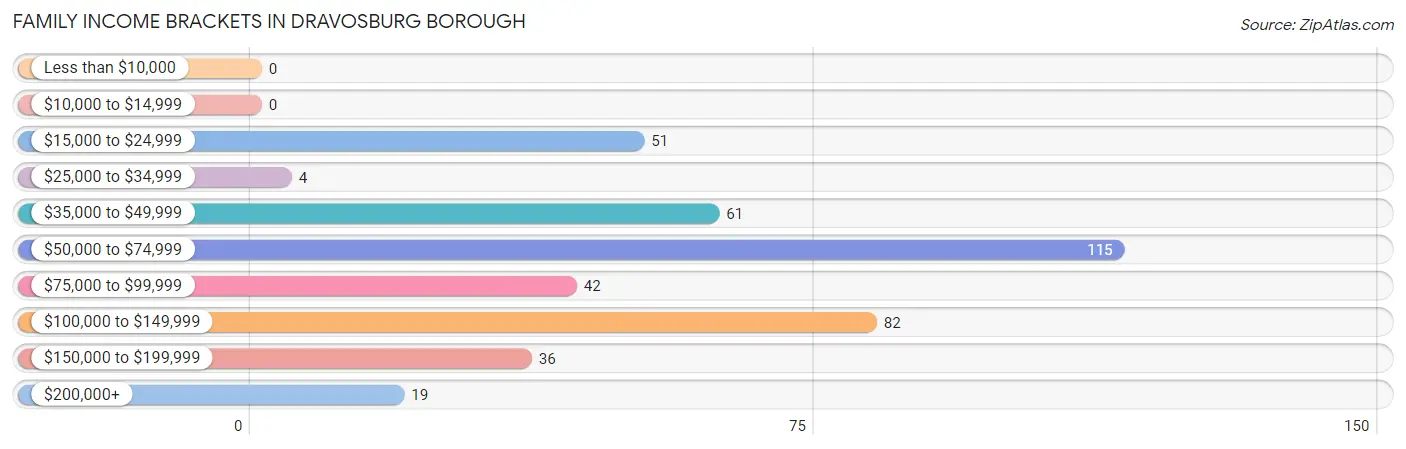
| Income Bracket | # Families | % Families |
| Less than $10,000 | 0 | 0.0% |
| $10,000 to $14,999 | 0 | 0.0% |
| $15,000 to $24,999 | 51 | 12.4% |
| $25,000 to $34,999 | 4 | 1.0% |
| $35,000 to $49,999 | 61 | 14.9% |
| $50,000 to $74,999 | 115 | 28.0% |
| $75,000 to $99,999 | 42 | 10.2% |
| $100,000 to $149,999 | 82 | 20.0% |
| $150,000 to $199,999 | 36 | 8.8% |
| $200,000+ | 19 | 4.6% |
Family Income by Famaliy Size in Dravosburg borough
4-person families (56 | 13.7%) account for the highest median family income in Dravosburg borough with $72,000 per family, while 2-person families (199 | 48.5%) have the highest median income of $34,236 per family member.
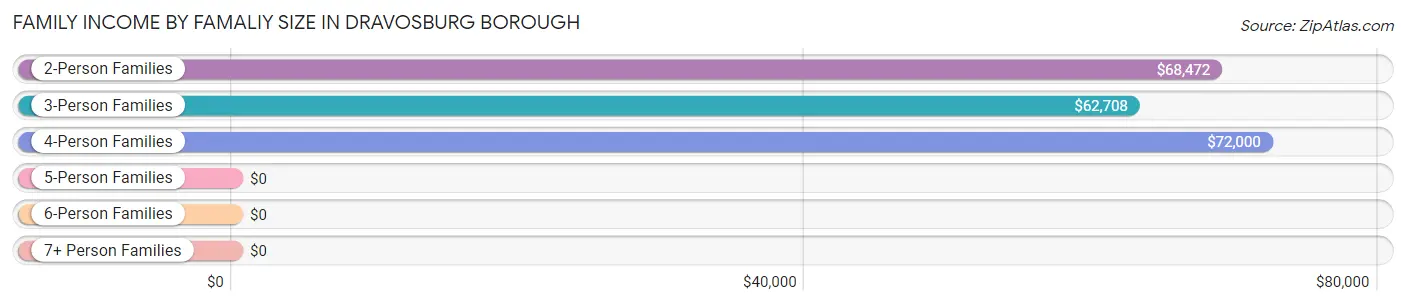
| Income Bracket | # Families | Median Income |
| 2-Person Families | 199 (48.5%) | $68,472 |
| 3-Person Families | 145 (35.4%) | $62,708 |
| 4-Person Families | 56 (13.7%) | $72,000 |
| 5-Person Families | 10 (2.4%) | $0 |
| 6-Person Families | 0 (0.0%) | $0 |
| 7+ Person Families | 0 (0.0%) | $0 |
| Total | 410 (100.0%) | $69,875 |
Family Income by Number of Earners in Dravosburg borough
The median family income in Dravosburg borough is $69,875, with families comprising 3+ earners (41) having the highest median family income of $143,125, while families with 1 earner (161) have the lowest median family income of $49,904, accounting for 10.0% and 39.3% of families, respectively.
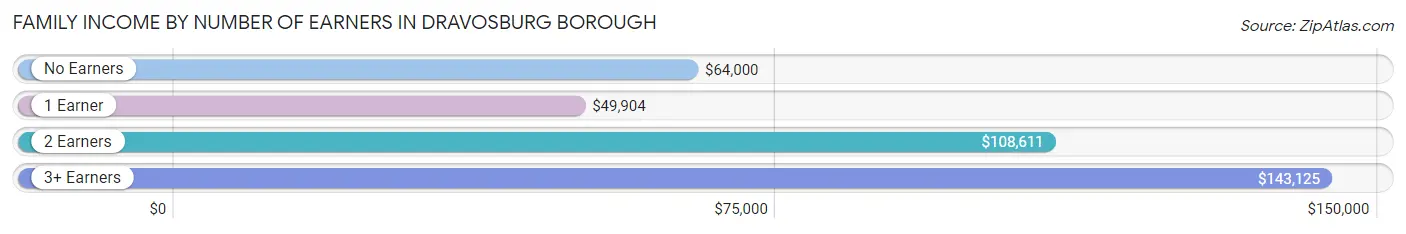
| Number of Earners | # Families | Median Income |
| No Earners | 46 (11.2%) | $64,000 |
| 1 Earner | 161 (39.3%) | $49,904 |
| 2 Earners | 162 (39.5%) | $108,611 |
| 3+ Earners | 41 (10.0%) | $143,125 |
| Total | 410 (100.0%) | $69,875 |
Household Income in Dravosburg borough
Household Income Brackets in Dravosburg borough
With 158 households falling in the category, the $25,000 to $34,999 income range is the most frequent in Dravosburg borough, accounting for 19.2% of all households. In contrast, only 18 households (2.2%) fall into the $10,000 to $14,999 income bracket, making it the least populous group.
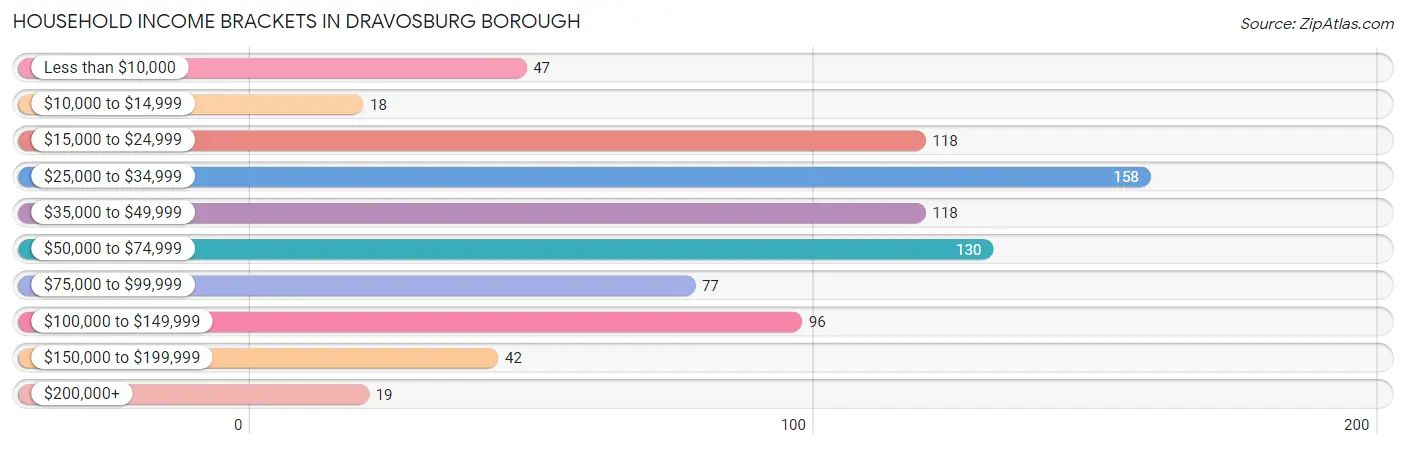
| Income Bracket | # Households | % Households |
| Less than $10,000 | 47 | 5.7% |
| $10,000 to $14,999 | 18 | 2.2% |
| $15,000 to $24,999 | 118 | 14.3% |
| $25,000 to $34,999 | 158 | 19.2% |
| $35,000 to $49,999 | 118 | 14.3% |
| $50,000 to $74,999 | 130 | 15.8% |
| $75,000 to $99,999 | 77 | 9.4% |
| $100,000 to $149,999 | 96 | 11.7% |
| $150,000 to $199,999 | 42 | 5.1% |
| $200,000+ | 19 | 2.3% |
Household Income by Householder Age in Dravosburg borough
The median household income in Dravosburg borough is $43,208, with the highest median household income of $61,250 found in the 25 to 44 years age bracket for the primary householder. A total of 128 households (15.5%) fall into this category. Meanwhile, the 15 to 24 years age bracket for the primary householder has the lowest median household income of $26,691, with 27 households (3.3%) in this group.
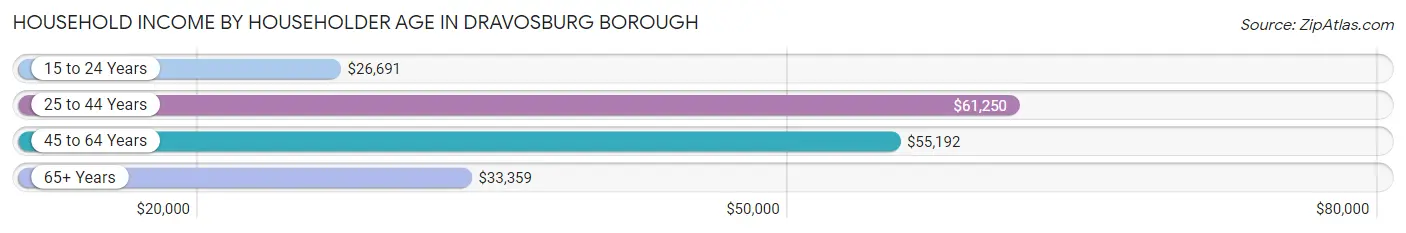
| Income Bracket | # Households | Median Income |
| 15 to 24 Years | 27 (3.3%) | $26,691 |
| 25 to 44 Years | 128 (15.5%) | $61,250 |
| 45 to 64 Years | 348 (42.3%) | $55,192 |
| 65+ Years | 320 (38.9%) | $33,359 |
| Total | 823 (100.0%) | $43,208 |
Poverty in Dravosburg borough
Income Below Poverty by Sex and Age in Dravosburg borough
With 6.3% poverty level for males and 20.6% for females among the residents of Dravosburg borough, 16 and 17 year old males and 45 to 54 year old females are the most vulnerable to poverty, with 10 males (47.6%) and 57 females (51.3%) in their respective age groups living below the poverty level.
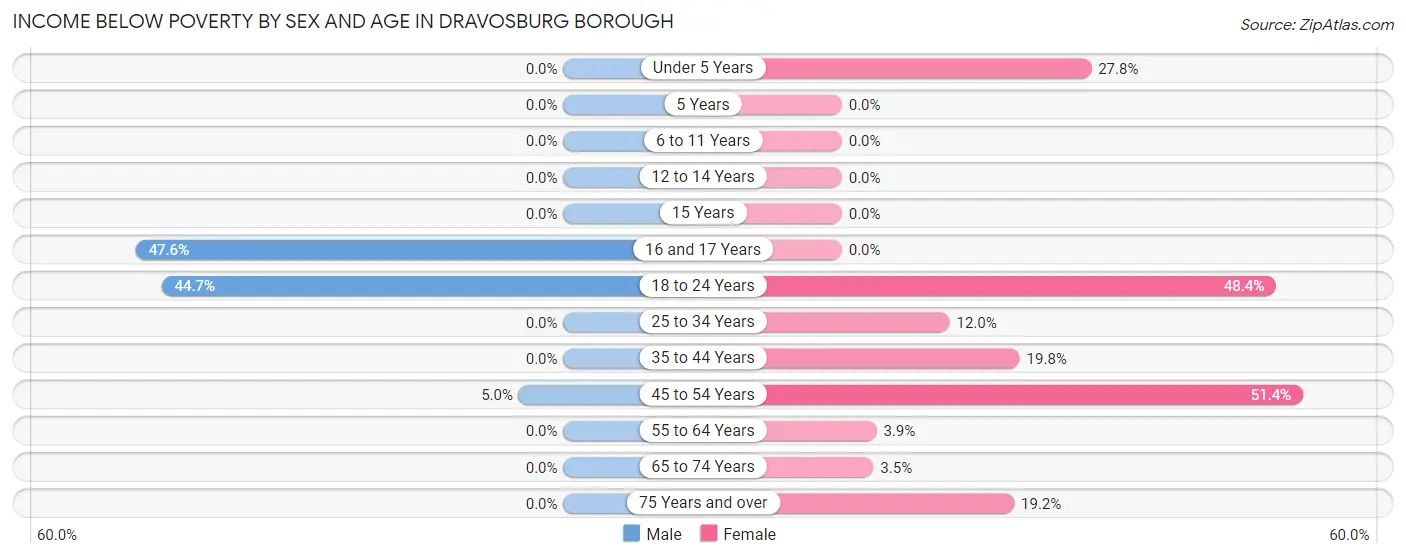
| Age Bracket | Male | Female |
| Under 5 Years | 0 (0.0%) | 10 (27.8%) |
| 5 Years | 0 (0.0%) | 0 (0.0%) |
| 6 to 11 Years | 0 (0.0%) | 0 (0.0%) |
| 12 to 14 Years | 0 (0.0%) | 0 (0.0%) |
| 15 Years | 0 (0.0%) | 0 (0.0%) |
| 16 and 17 Years | 10 (47.6%) | 0 (0.0%) |
| 18 to 24 Years | 34 (44.7%) | 44 (48.3%) |
| 25 to 34 Years | 0 (0.0%) | 6 (12.0%) |
| 35 to 44 Years | 0 (0.0%) | 21 (19.8%) |
| 45 to 54 Years | 6 (5.0%) | 57 (51.3%) |
| 55 to 64 Years | 0 (0.0%) | 6 (3.9%) |
| 65 to 74 Years | 0 (0.0%) | 5 (3.5%) |
| 75 Years and over | 0 (0.0%) | 19 (19.2%) |
| Total | 50 (6.3%) | 168 (20.6%) |
Income Above Poverty by Sex and Age in Dravosburg borough
According to the poverty statistics in Dravosburg borough, males aged under 5 years and females aged 6 to 11 years are the age groups that are most secure financially, with 100.0% of males and 100.0% of females in these age groups living above the poverty line.
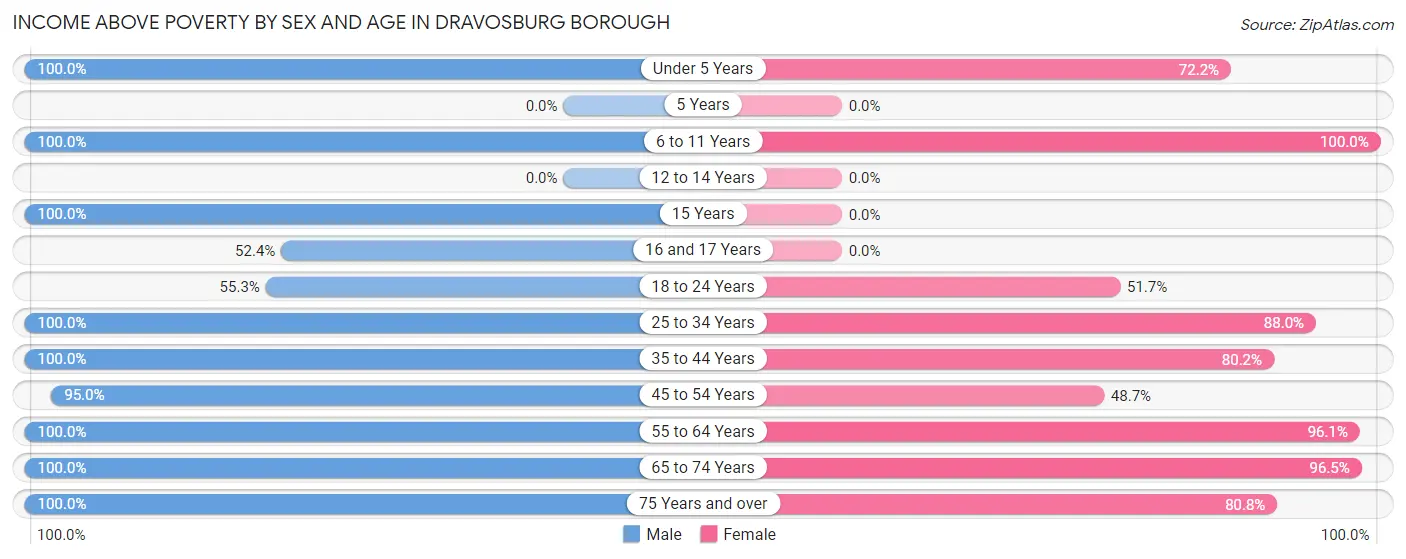
| Age Bracket | Male | Female |
| Under 5 Years | 11 (100.0%) | 26 (72.2%) |
| 5 Years | 0 (0.0%) | 0 (0.0%) |
| 6 to 11 Years | 19 (100.0%) | 27 (100.0%) |
| 12 to 14 Years | 0 (0.0%) | 0 (0.0%) |
| 15 Years | 20 (100.0%) | 0 (0.0%) |
| 16 and 17 Years | 11 (52.4%) | 0 (0.0%) |
| 18 to 24 Years | 42 (55.3%) | 47 (51.6%) |
| 25 to 34 Years | 154 (100.0%) | 44 (88.0%) |
| 35 to 44 Years | 83 (100.0%) | 85 (80.2%) |
| 45 to 54 Years | 115 (95.0%) | 54 (48.6%) |
| 55 to 64 Years | 128 (100.0%) | 149 (96.1%) |
| 65 to 74 Years | 76 (100.0%) | 137 (96.5%) |
| 75 Years and over | 88 (100.0%) | 80 (80.8%) |
| Total | 747 (93.7%) | 649 (79.4%) |
Income Below Poverty Among Married-Couple Families in Dravosburg borough
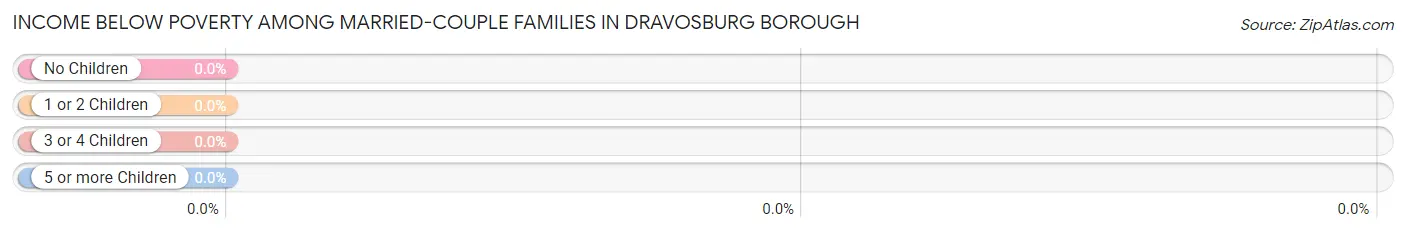
| Children | Above Poverty | Below Poverty |
| No Children | 155 (100.0%) | 0 (0.0%) |
| 1 or 2 Children | 40 (100.0%) | 0 (0.0%) |
| 3 or 4 Children | 0 (0.0%) | 0 (0.0%) |
| 5 or more Children | 0 (0.0%) | 0 (0.0%) |
| Total | 195 (100.0%) | 0 (0.0%) |
Income Below Poverty Among Single-Parent Households in Dravosburg borough

| Children | Single Father | Single Mother |
| No Children | 0 (0.0%) | 40 (38.8%) |
| 1 or 2 Children | 0 (0.0%) | 9 (15.8%) |
| 3 or 4 Children | 0 (0.0%) | 0 (0.0%) |
| 5 or more Children | 0 (0.0%) | 0 (0.0%) |
| Total | 0 (0.0%) | 49 (30.6%) |
Income Below Poverty Among Married-Couple vs Single-Parent Households in Dravosburg borough
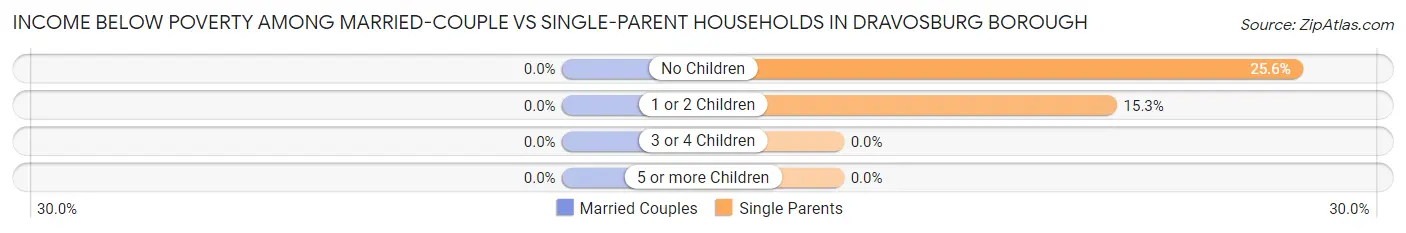
| Children | Married-Couple Families | Single-Parent Households |
| No Children | 0 (0.0%) | 40 (25.6%) |
| 1 or 2 Children | 0 (0.0%) | 9 (15.2%) |
| 3 or 4 Children | 0 (0.0%) | 0 (0.0%) |
| 5 or more Children | 0 (0.0%) | 0 (0.0%) |
| Total | 0 (0.0%) | 49 (22.8%) |
Race in Dravosburg borough
The most populous races in Dravosburg borough are White / Caucasian (1,517 | 94.0%), Hispanic or Latino (65 | 4.0%), and Some other Race (41 | 2.5%).
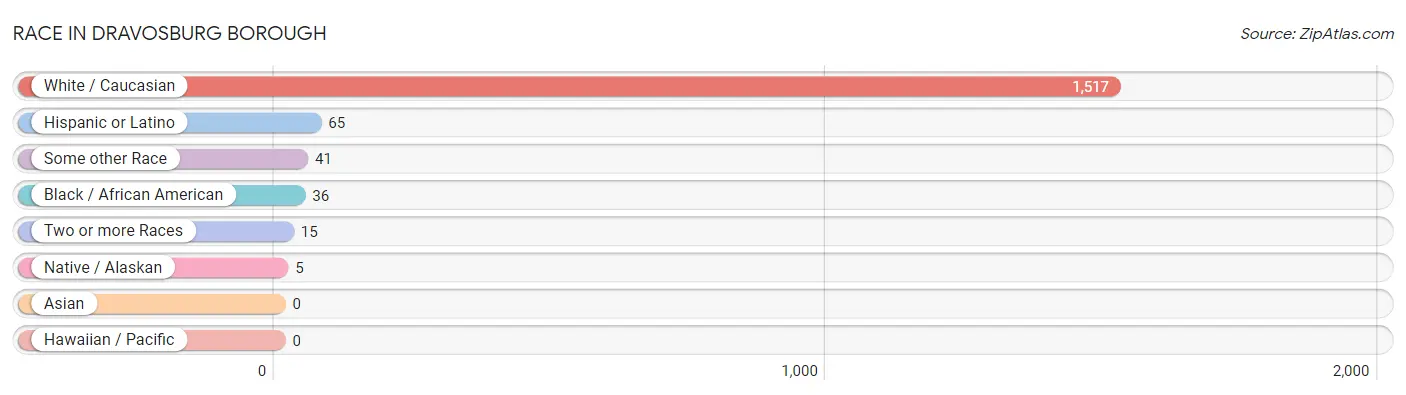
| Race | # Population | % Population |
| Asian | 0 | 0.0% |
| Black / African American | 36 | 2.2% |
| Hawaiian / Pacific | 0 | 0.0% |
| Hispanic or Latino | 65 | 4.0% |
| Native / Alaskan | 5 | 0.3% |
| White / Caucasian | 1,517 | 94.0% |
| Two or more Races | 15 | 0.9% |
| Some other Race | 41 | 2.5% |
| Total | 1,614 | 100.0% |
Ancestry in Dravosburg borough
The most populous ancestries reported in Dravosburg borough are German (551 | 34.1%), Irish (324 | 20.1%), Polish (163 | 10.1%), English (145 | 9.0%), and Italian (140 | 8.7%), together accounting for 82.0% of all Dravosburg borough residents.
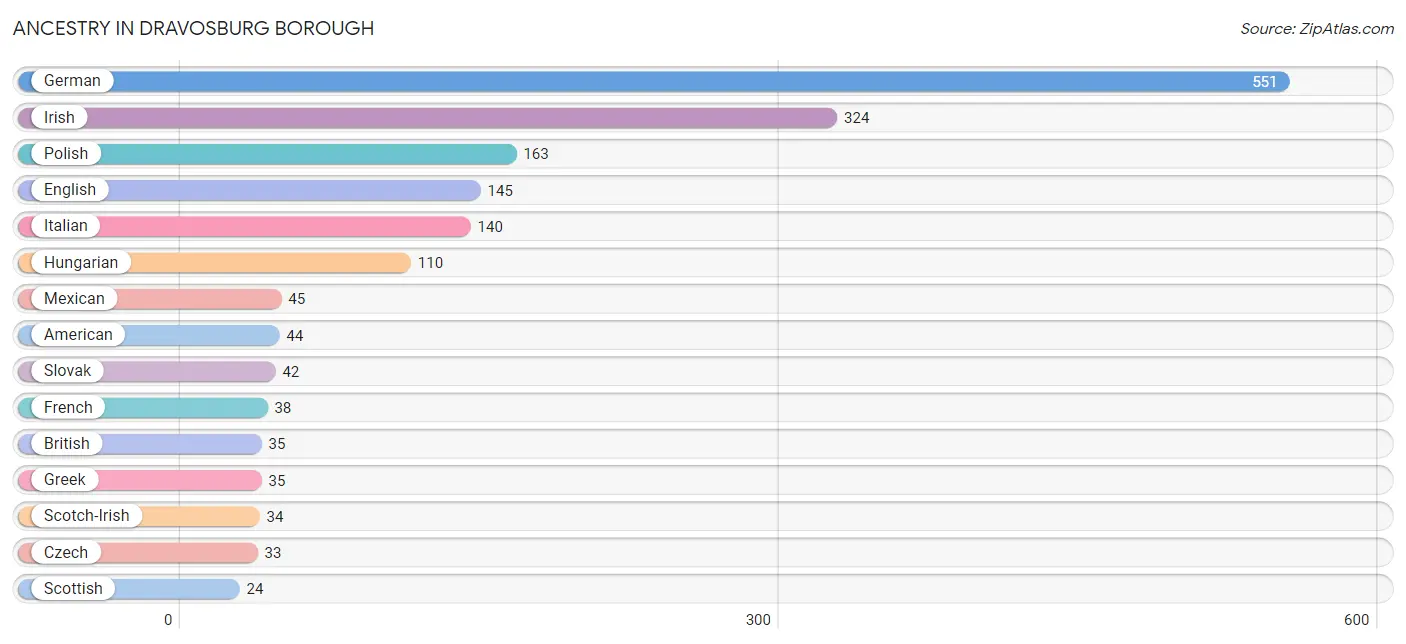
| Ancestry | # Population | % Population |
| American | 44 | 2.7% |
| Austrian | 4 | 0.3% |
| British | 35 | 2.2% |
| Cherokee | 5 | 0.3% |
| Croatian | 15 | 0.9% |
| Czech | 33 | 2.0% |
| Danish | 9 | 0.6% |
| Dutch | 5 | 0.3% |
| Eastern European | 10 | 0.6% |
| English | 145 | 9.0% |
| French | 38 | 2.4% |
| German | 551 | 34.1% |
| Greek | 35 | 2.2% |
| Haitian | 8 | 0.5% |
| Hungarian | 110 | 6.8% |
| Irish | 324 | 20.1% |
| Italian | 140 | 8.7% |
| Mexican | 45 | 2.8% |
| Polish | 163 | 10.1% |
| Puerto Rican | 5 | 0.3% |
| Russian | 20 | 1.2% |
| Scotch-Irish | 34 | 2.1% |
| Scottish | 24 | 1.5% |
| Serbian | 5 | 0.3% |
| Slovak | 42 | 2.6% |
| Spanish | 15 | 0.9% |
| Swedish | 12 | 0.7% |
| Ukrainian | 10 | 0.6% |
| Welsh | 15 | 0.9% | View All 29 Rows |
Immigrants in Dravosburg borough
The most numerous immigrant groups reported in Dravosburg borough came from Latin America (19 | 1.2%), Central America (11 | 0.7%), Mexico (11 | 0.7%), Caribbean (8 | 0.5%), and Haiti (8 | 0.5%), together accounting for 3.5% of all Dravosburg borough residents.
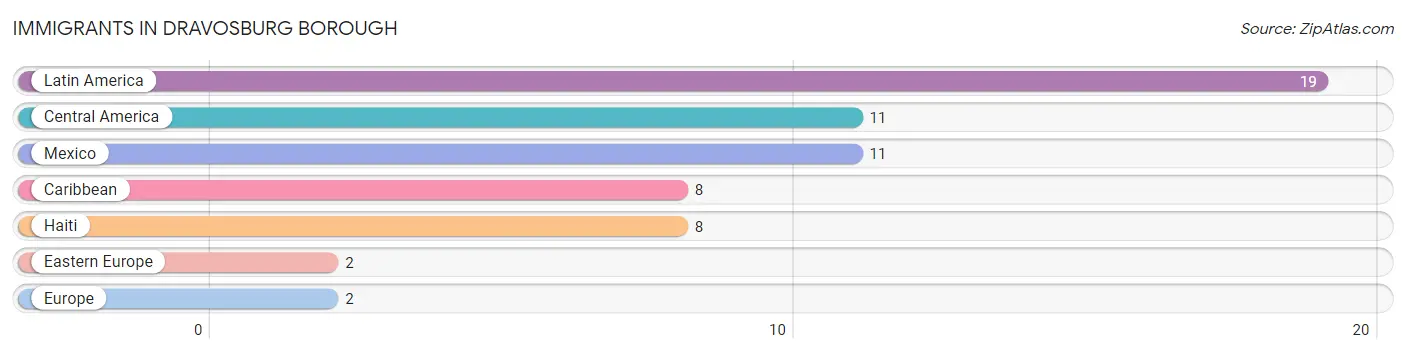
| Immigration Origin | # Population | % Population |
| Caribbean | 8 | 0.5% |
| Central America | 11 | 0.7% |
| Eastern Europe | 2 | 0.1% |
| Europe | 2 | 0.1% |
| Haiti | 8 | 0.5% |
| Latin America | 19 | 1.2% |
| Mexico | 11 | 0.7% | View All 7 Rows |
Sex and Age in Dravosburg borough
Sex and Age in Dravosburg borough
The most populous age groups in Dravosburg borough are 60 to 64 Years (108 | 13.6%) for men and 35 to 39 Years (80 | 9.8%) for women.
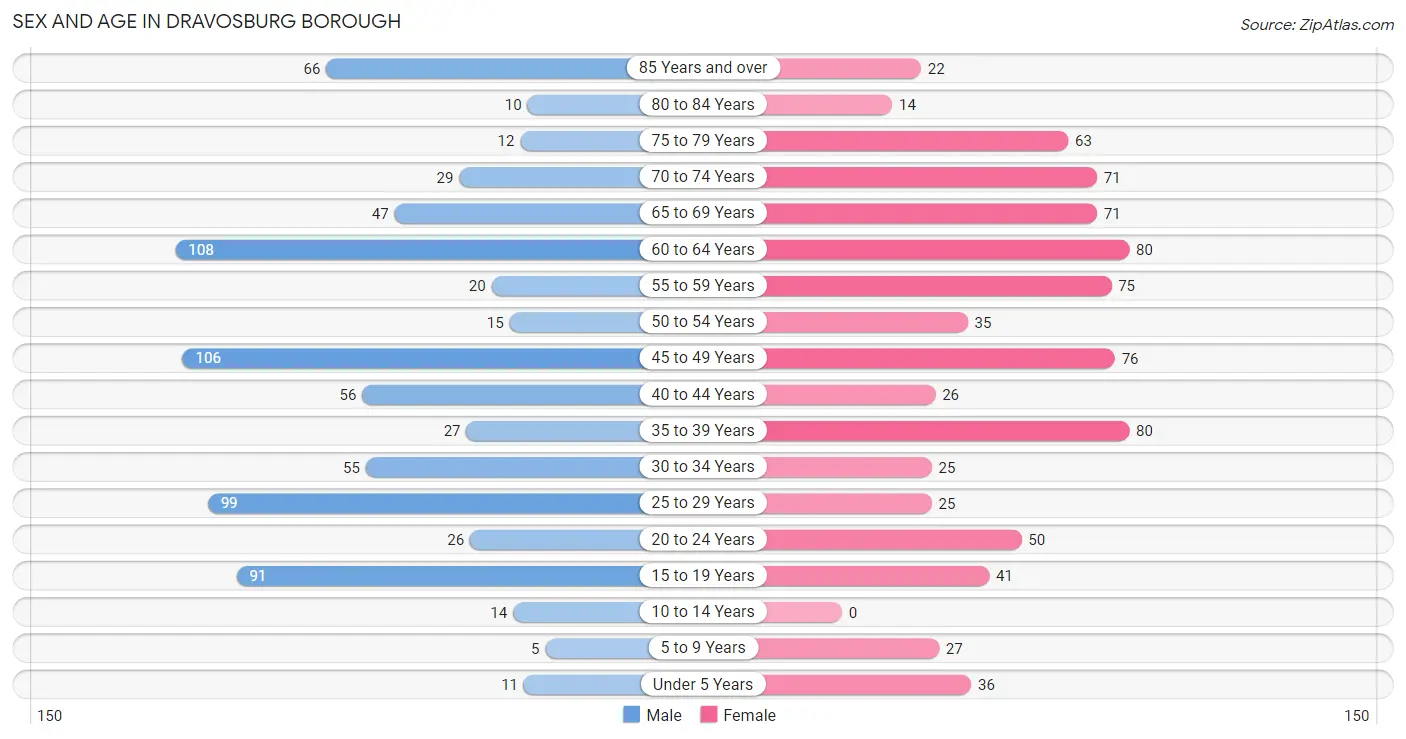
| Age Bracket | Male | Female |
| Under 5 Years | 11 (1.4%) | 36 (4.4%) |
| 5 to 9 Years | 5 (0.6%) | 27 (3.3%) |
| 10 to 14 Years | 14 (1.8%) | 0 (0.0%) |
| 15 to 19 Years | 91 (11.4%) | 41 (5.0%) |
| 20 to 24 Years | 26 (3.3%) | 50 (6.1%) |
| 25 to 29 Years | 99 (12.4%) | 25 (3.1%) |
| 30 to 34 Years | 55 (6.9%) | 25 (3.1%) |
| 35 to 39 Years | 27 (3.4%) | 80 (9.8%) |
| 40 to 44 Years | 56 (7.0%) | 26 (3.2%) |
| 45 to 49 Years | 106 (13.3%) | 76 (9.3%) |
| 50 to 54 Years | 15 (1.9%) | 35 (4.3%) |
| 55 to 59 Years | 20 (2.5%) | 75 (9.2%) |
| 60 to 64 Years | 108 (13.6%) | 80 (9.8%) |
| 65 to 69 Years | 47 (5.9%) | 71 (8.7%) |
| 70 to 74 Years | 29 (3.6%) | 71 (8.7%) |
| 75 to 79 Years | 12 (1.5%) | 63 (7.7%) |
| 80 to 84 Years | 10 (1.3%) | 14 (1.7%) |
| 85 Years and over | 66 (8.3%) | 22 (2.7%) |
| Total | 797 (100.0%) | 817 (100.0%) |
Families and Households in Dravosburg borough
Median Family Size in Dravosburg borough
The median family size in Dravosburg borough is 2.83 persons per family, with single female/mother families (160 | 39.0%) accounting for the largest median family size of 3.03 persons per family. On the other hand, single male/father families (55 | 13.4%) represent the smallest median family size with 2.47 persons per family.
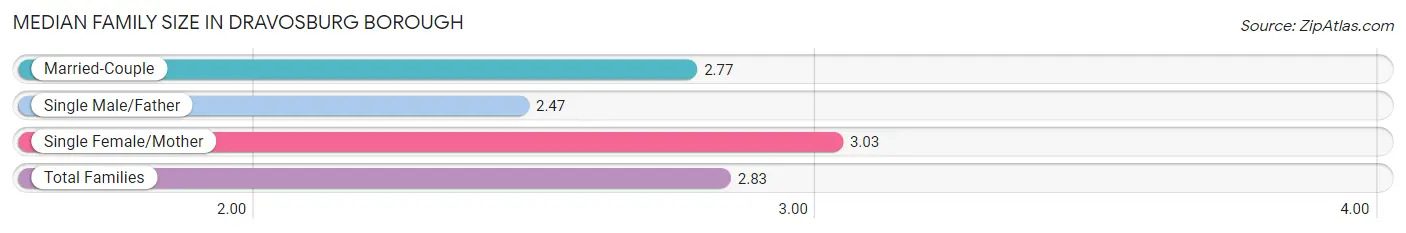
| Family Type | # Families | Family Size |
| Married-Couple | 195 (47.6%) | 2.77 |
| Single Male/Father | 55 (13.4%) | 2.47 |
| Single Female/Mother | 160 (39.0%) | 3.03 |
| Total Families | 410 (100.0%) | 2.83 |
Median Household Size in Dravosburg borough
The median household size in Dravosburg borough is 1.96 persons per household, with single female/mother households (160 | 19.4%) accounting for the largest median household size of 3.03 persons per household. non-family households (413 | 50.2%) represent the smallest median household size with 1.09 persons per household.
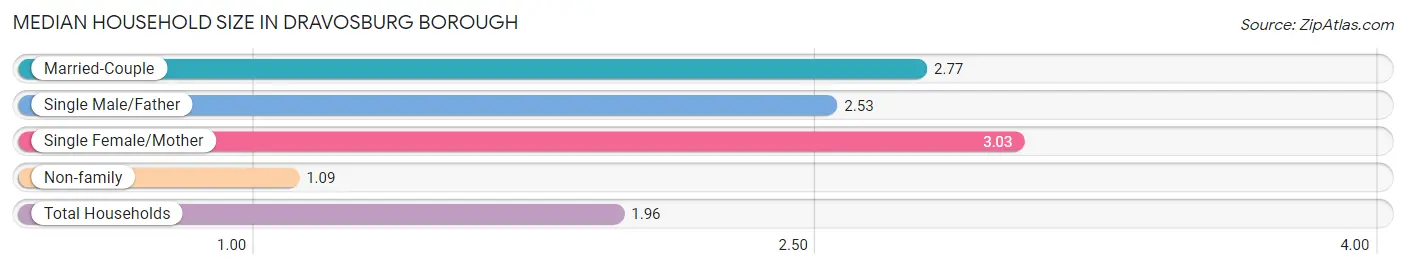
| Household Type | # Households | Household Size |
| Married-Couple | 195 (23.7%) | 2.77 |
| Single Male/Father | 55 (6.7%) | 2.53 |
| Single Female/Mother | 160 (19.4%) | 3.03 |
| Non-family | 413 (50.2%) | 1.09 |
| Total Households | 823 (100.0%) | 1.96 |
Household Size by Marriage Status in Dravosburg borough
Out of a total of 823 households in Dravosburg borough, 410 (49.8%) are family households, while 413 (50.2%) are nonfamily households. The most numerous type of family households are 2-person households, comprising 197, and the most common type of nonfamily households are 1-person households, comprising 387.
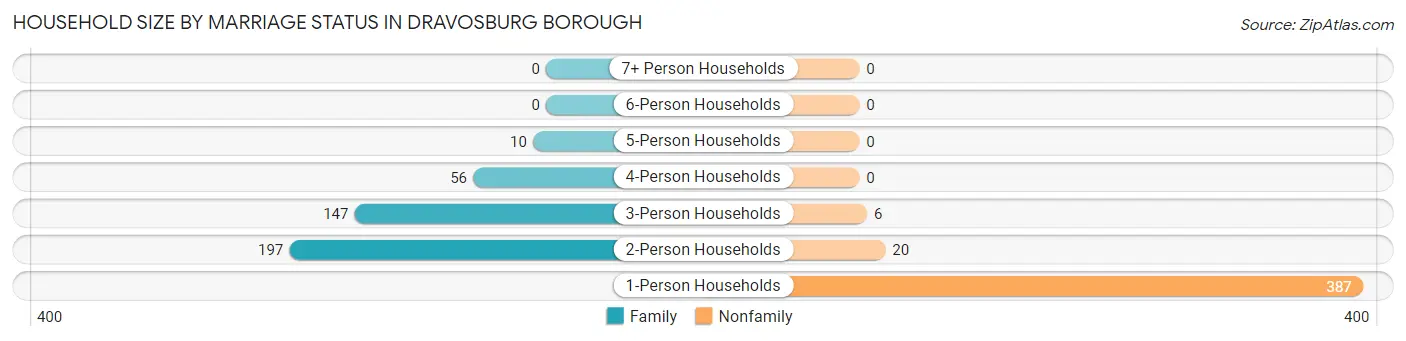
| Household Size | Family Households | Nonfamily Households |
| 1-Person Households | - | 387 (47.0%) |
| 2-Person Households | 197 (23.9%) | 20 (2.4%) |
| 3-Person Households | 147 (17.9%) | 6 (0.7%) |
| 4-Person Households | 56 (6.8%) | 0 (0.0%) |
| 5-Person Households | 10 (1.2%) | 0 (0.0%) |
| 6-Person Households | 0 (0.0%) | 0 (0.0%) |
| 7+ Person Households | 0 (0.0%) | 0 (0.0%) |
| Total | 410 (49.8%) | 413 (50.2%) |
Female Fertility in Dravosburg borough
Fertility by Age in Dravosburg borough
Average fertility rate in Dravosburg borough is 43.0 births per 1,000 women. Women in the age bracket of 20 to 34 years have the highest fertility rate with 140.0 births per 1,000 women. Women in the age bracket of 20 to 34 years acount for 100.0% of all women with births.
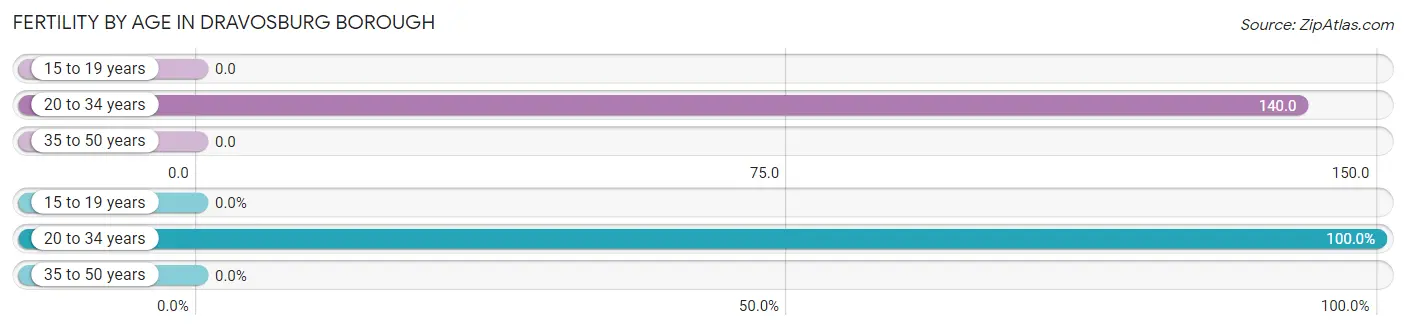
| Age Bracket | Women with Births | Births / 1,000 Women |
| 15 to 19 years | 0 (0.0%) | 0.0 |
| 20 to 34 years | 14 (100.0%) | 140.0 |
| 35 to 50 years | 0 (0.0%) | 0.0 |
| Total | 14 (100.0%) | 43.0 |
Fertility by Age by Marriage Status in Dravosburg borough
78.6% of women with births (14) in Dravosburg borough are married. The highest percentage of unmarried women with births falls into 20 to 34 years age bracket with 21.4% of them unmarried at the time of birth, while the lowest percentage of unmarried women with births belong to 20 to 34 years age bracket with 21.4% of them unmarried.
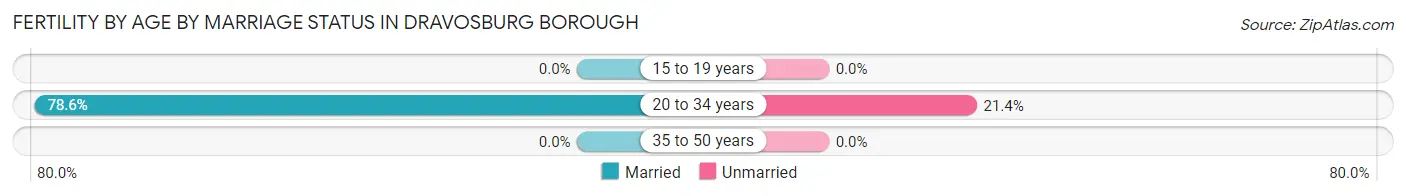
| Age Bracket | Married | Unmarried |
| 15 to 19 years | 0 (0.0%) | 0 (0.0%) |
| 20 to 34 years | 11 (78.6%) | 3 (21.4%) |
| 35 to 50 years | 0 (0.0%) | 0 (0.0%) |
| Total | 11 (78.6%) | 3 (21.4%) |
Fertility by Education in Dravosburg borough
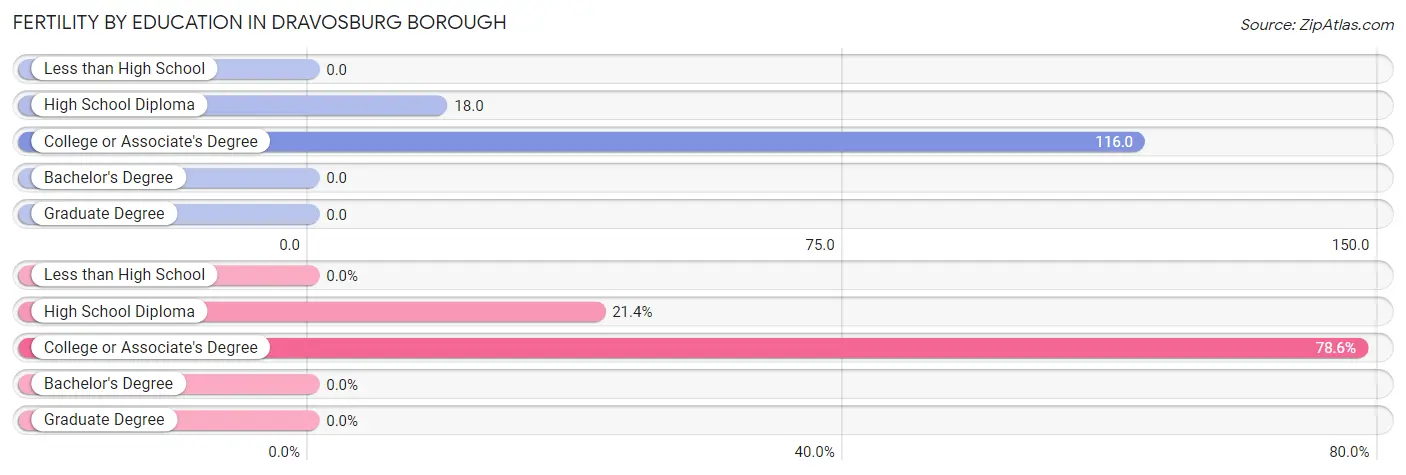
| Educational Attainment | Women with Births | Births / 1,000 Women |
| Less than High School | 0 (0.0%) | 0.0 |
| High School Diploma | 3 (21.4%) | 18.0 |
| College or Associate's Degree | 11 (78.6%) | 116.0 |
| Bachelor's Degree | 0 (0.0%) | 0.0 |
| Graduate Degree | 0 (0.0%) | 0.0 |
| Total | 14 (100.0%) | 43.0 |
Fertility by Education by Marriage Status in Dravosburg borough
21.4% of women with births in Dravosburg borough are unmarried. Women with the educational attainment of college or associate's degree are most likely to be married with 100.0% of them married at childbirth, while women with the educational attainment of high school diploma are least likely to be married with 100.0% of them unmarried at childbirth.
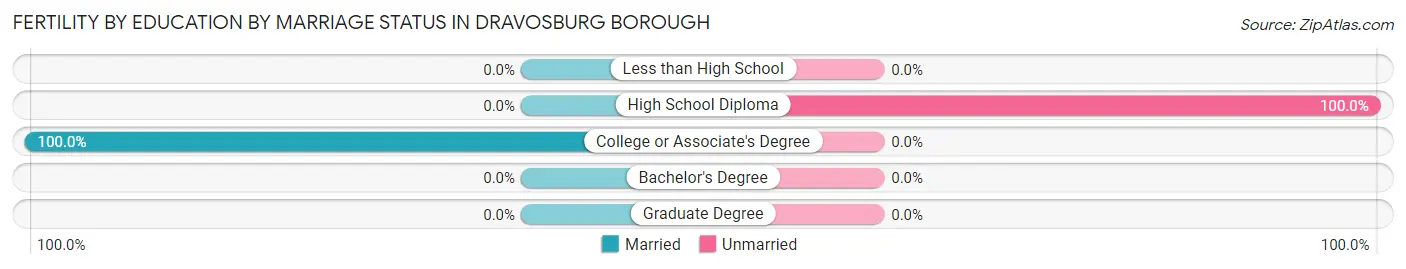
| Educational Attainment | Married | Unmarried |
| Less than High School | 0 (0.0%) | 0 (0.0%) |
| High School Diploma | 0 (0.0%) | 3 (100.0%) |
| College or Associate's Degree | 11 (100.0%) | 0 (0.0%) |
| Bachelor's Degree | 0 (0.0%) | 0 (0.0%) |
| Graduate Degree | 0 (0.0%) | 0 (0.0%) |
| Total | 11 (78.6%) | 3 (21.4%) |
Employment Characteristics in Dravosburg borough
Employment by Class of Employer in Dravosburg borough
Among the 789 employed individuals in Dravosburg borough, private company employees (576 | 73.0%), not-for-profit organizations (137 | 17.4%), and local government employees (29 | 3.7%) make up the most common classes of employment.
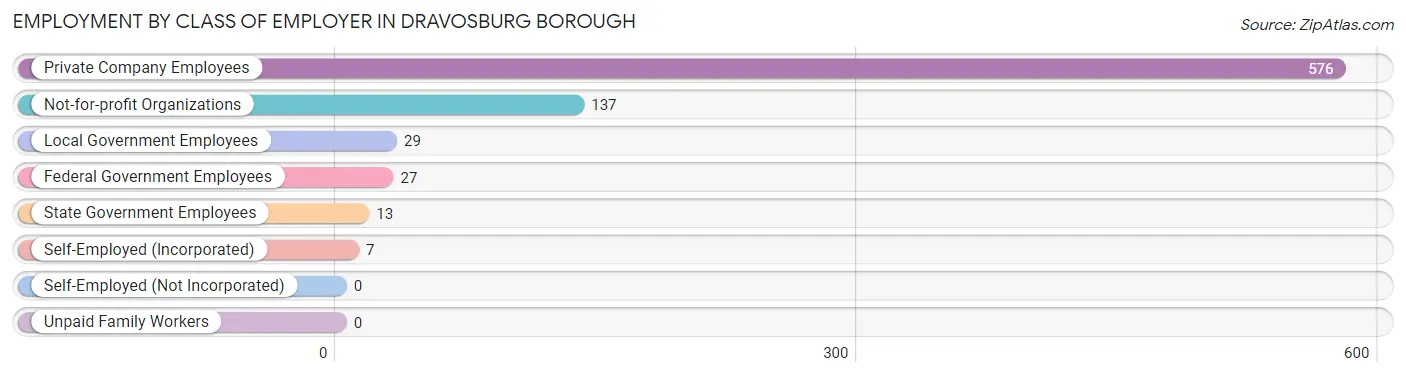
| Employer Class | # Employees | % Employees |
| Private Company Employees | 576 | 73.0% |
| Self-Employed (Incorporated) | 7 | 0.9% |
| Self-Employed (Not Incorporated) | 0 | 0.0% |
| Not-for-profit Organizations | 137 | 17.4% |
| Local Government Employees | 29 | 3.7% |
| State Government Employees | 13 | 1.7% |
| Federal Government Employees | 27 | 3.4% |
| Unpaid Family Workers | 0 | 0.0% |
| Total | 789 | 100.0% |
Employment Status by Age in Dravosburg borough
According to the labor force statistics for Dravosburg borough, out of the total population over 16 years of age (1,501), 57.3% or 860 individuals are in the labor force, with 6.9% or 59 of them unemployed. The age group with the highest labor force participation rate is 30 to 34 years, with 100.0% or 80 individuals in the labor force. Within the labor force, the 55 to 59 years age range has the highest percentage of unemployed individuals, with 19.4% or 12 of them being unemployed.
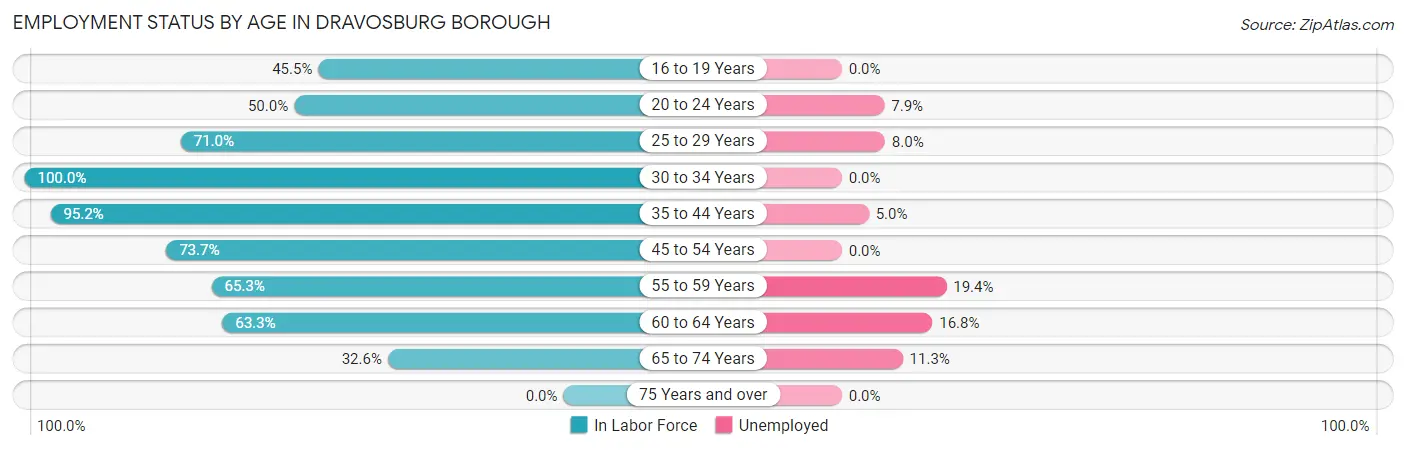
| Age Bracket | In Labor Force | Unemployed |
| 16 to 19 Years | 51 (45.5%) | 0 (0.0%) |
| 20 to 24 Years | 38 (50.0%) | 3 (7.9%) |
| 25 to 29 Years | 88 (71.0%) | 7 (8.0%) |
| 30 to 34 Years | 80 (100.0%) | 0 (0.0%) |
| 35 to 44 Years | 180 (95.2%) | 9 (5.0%) |
| 45 to 54 Years | 171 (73.7%) | 0 (0.0%) |
| 55 to 59 Years | 62 (65.3%) | 12 (19.4%) |
| 60 to 64 Years | 119 (63.3%) | 20 (16.8%) |
| 65 to 74 Years | 71 (32.6%) | 8 (11.3%) |
| 75 Years and over | 0 (0.0%) | 0 (0.0%) |
| Total | 860 (57.3%) | 59 (6.9%) |
Employment Status by Educational Attainment in Dravosburg borough
According to labor force statistics for Dravosburg borough, 77.1% of individuals (700) out of the total population between 25 and 64 years of age (908) are in the labor force, with 6.9% or 48 of them being unemployed. The group with the highest labor force participation rate are those with the educational attainment of bachelor's degree or higher, with 96.7% or 177 individuals in the labor force. Within the labor force, individuals with less than high school education have the highest percentage of unemployment, with 23.2% or 13 of them being unemployed.
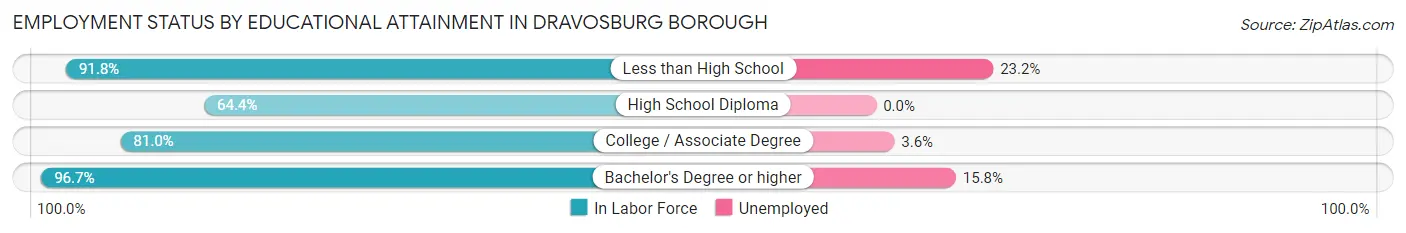
| Educational Attainment | In Labor Force | Unemployed |
| Less than High School | 56 (91.8%) | 14 (23.2%) |
| High School Diploma | 275 (64.4%) | 0 (0.0%) |
| College / Associate Degree | 192 (81.0%) | 9 (3.6%) |
| Bachelor's Degree or higher | 177 (96.7%) | 29 (15.8%) |
| Total | 700 (77.1%) | 63 (6.9%) |
Employment Occupations by Sex in Dravosburg borough
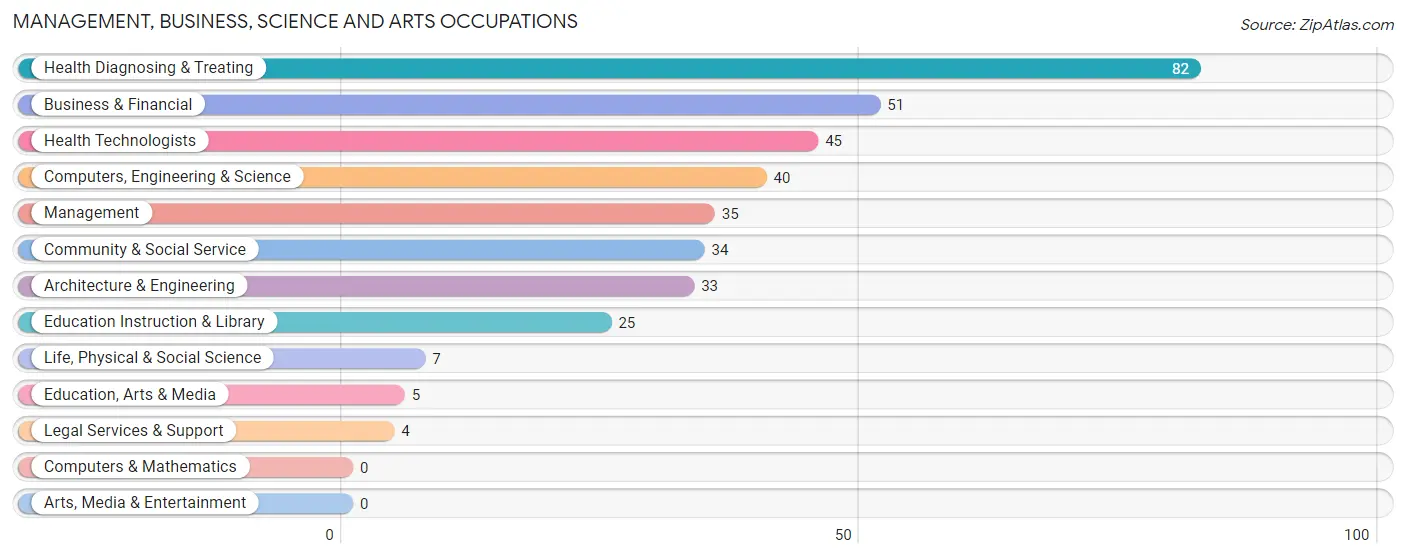
Management, Business, Science and Arts Occupations
The most common Management, Business, Science and Arts occupations in Dravosburg borough are Health Diagnosing & Treating (82 | 10.2%), Business & Financial (51 | 6.4%), Health Technologists (45 | 5.6%), Computers, Engineering & Science (40 | 5.0%), and Management (35 | 4.4%).
Management, Business, Science and Arts Occupations by Sex
Within the Management, Business, Science and Arts occupations in Dravosburg borough, the most male-oriented occupations are Life, Physical & Social Science (100.0%), Computers, Engineering & Science (85.0%), and Architecture & Engineering (81.8%), while the most female-oriented occupations are Education, Arts & Media (100.0%), Legal Services & Support (100.0%), and Health Technologists (100.0%).
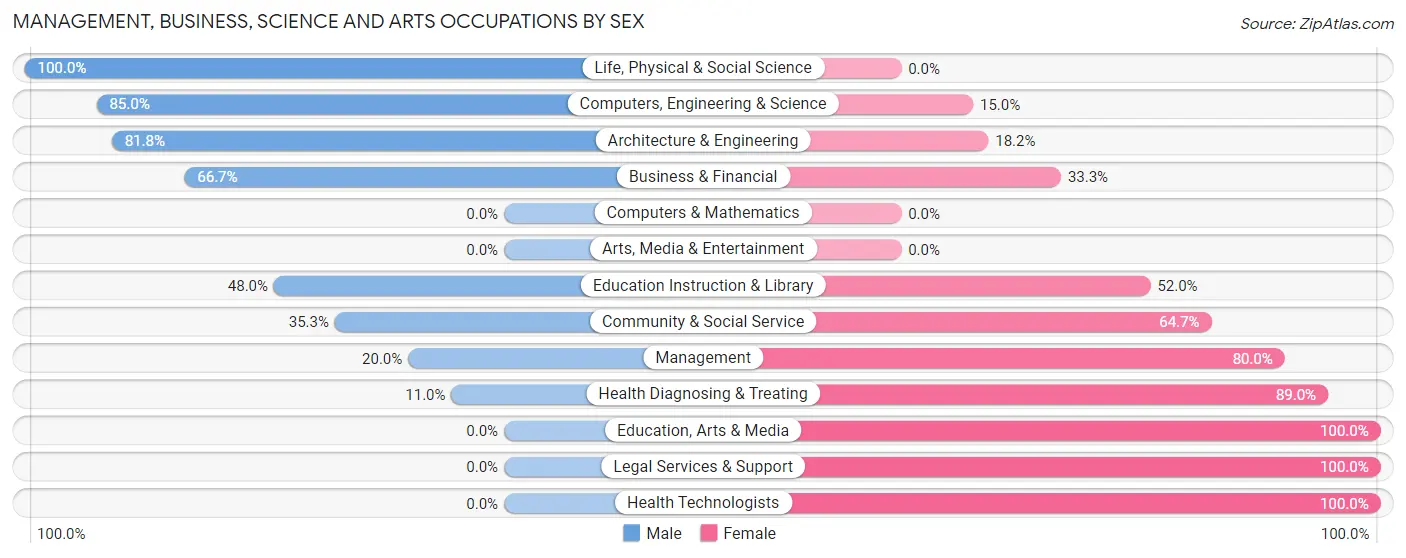
| Occupation | Male | Female |
| Management | 7 (20.0%) | 28 (80.0%) |
| Business & Financial | 34 (66.7%) | 17 (33.3%) |
| Computers, Engineering & Science | 34 (85.0%) | 6 (15.0%) |
| Computers & Mathematics | 0 (0.0%) | 0 (0.0%) |
| Architecture & Engineering | 27 (81.8%) | 6 (18.2%) |
| Life, Physical & Social Science | 7 (100.0%) | 0 (0.0%) |
| Community & Social Service | 12 (35.3%) | 22 (64.7%) |
| Education, Arts & Media | 0 (0.0%) | 5 (100.0%) |
| Legal Services & Support | 0 (0.0%) | 4 (100.0%) |
| Education Instruction & Library | 12 (48.0%) | 13 (52.0%) |
| Arts, Media & Entertainment | 0 (0.0%) | 0 (0.0%) |
| Health Diagnosing & Treating | 9 (11.0%) | 73 (89.0%) |
| Health Technologists | 0 (0.0%) | 45 (100.0%) |
| Total (Category) | 96 (39.7%) | 146 (60.3%) |
| Total (Overall) | 420 (52.4%) | 381 (47.6%) |
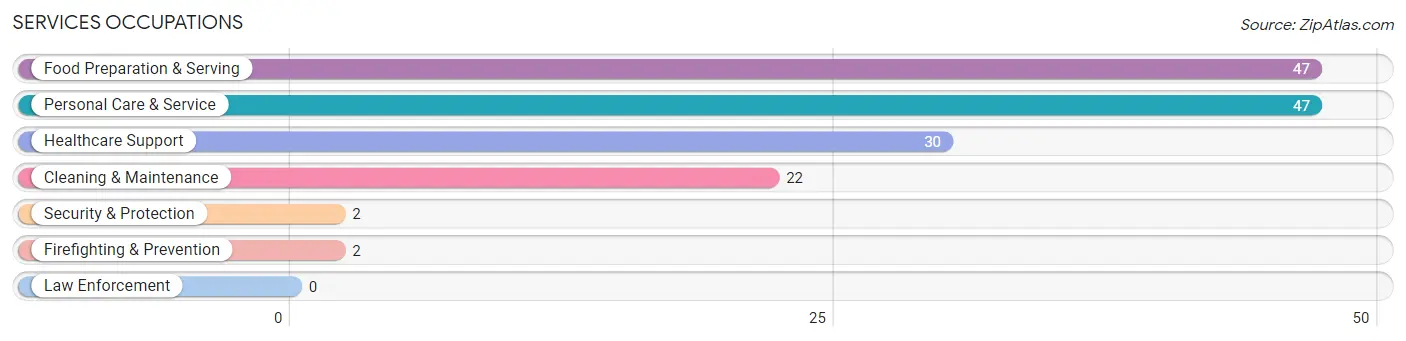
Services Occupations
The most common Services occupations in Dravosburg borough are Food Preparation & Serving (47 | 5.9%), Personal Care & Service (47 | 5.9%), Healthcare Support (30 | 3.7%), Cleaning & Maintenance (22 | 2.8%), and Security & Protection (2 | 0.3%).
Services Occupations by Sex
Within the Services occupations in Dravosburg borough, the most male-oriented occupations are Security & Protection (100.0%), Firefighting & Prevention (100.0%), and Cleaning & Maintenance (77.3%), while the most female-oriented occupations are Food Preparation & Serving (87.2%), Personal Care & Service (72.3%), and Healthcare Support (70.0%).
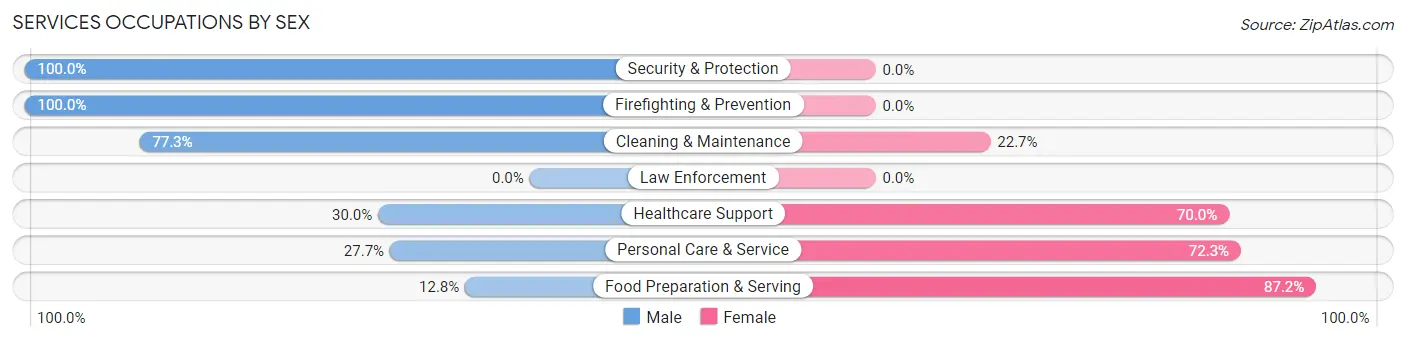
| Occupation | Male | Female |
| Healthcare Support | 9 (30.0%) | 21 (70.0%) |
| Security & Protection | 2 (100.0%) | 0 (0.0%) |
| Firefighting & Prevention | 2 (100.0%) | 0 (0.0%) |
| Law Enforcement | 0 (0.0%) | 0 (0.0%) |
| Food Preparation & Serving | 6 (12.8%) | 41 (87.2%) |
| Cleaning & Maintenance | 17 (77.3%) | 5 (22.7%) |
| Personal Care & Service | 13 (27.7%) | 34 (72.3%) |
| Total (Category) | 47 (31.8%) | 101 (68.2%) |
| Total (Overall) | 420 (52.4%) | 381 (47.6%) |
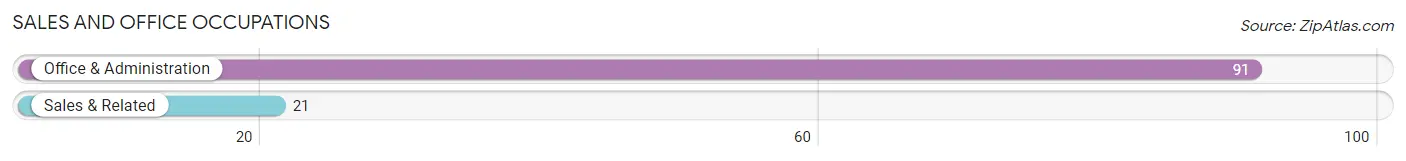
Sales and Office Occupations
The most common Sales and Office occupations in Dravosburg borough are Office & Administration (91 | 11.4%), and Sales & Related (21 | 2.6%).
Sales and Office Occupations by Sex
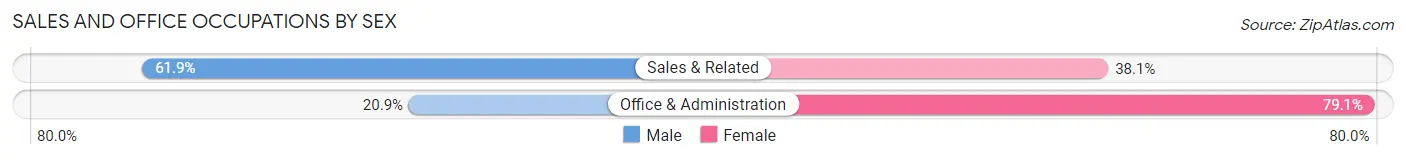
| Occupation | Male | Female |
| Sales & Related | 13 (61.9%) | 8 (38.1%) |
| Office & Administration | 19 (20.9%) | 72 (79.1%) |
| Total (Category) | 32 (28.6%) | 80 (71.4%) |
| Total (Overall) | 420 (52.4%) | 381 (47.6%) |
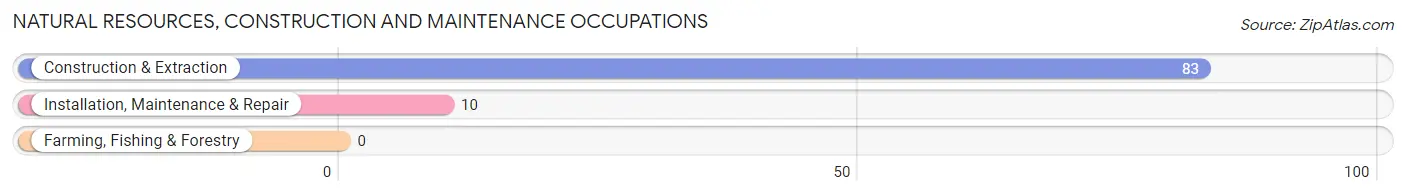
Natural Resources, Construction and Maintenance Occupations
The most common Natural Resources, Construction and Maintenance occupations in Dravosburg borough are Construction & Extraction (83 | 10.4%), and Installation, Maintenance & Repair (10 | 1.3%).
Natural Resources, Construction and Maintenance Occupations by Sex
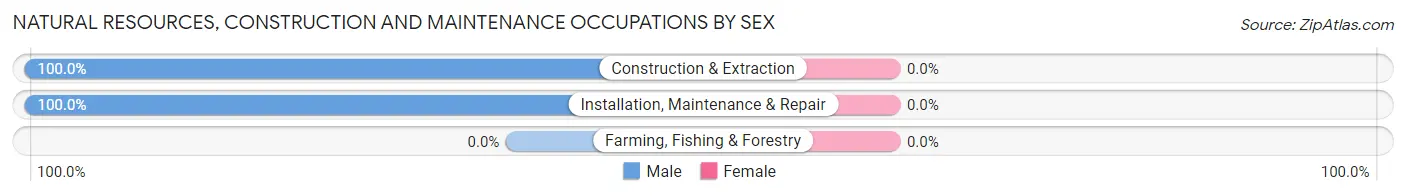
| Occupation | Male | Female |
| Farming, Fishing & Forestry | 0 (0.0%) | 0 (0.0%) |
| Construction & Extraction | 83 (100.0%) | 0 (0.0%) |
| Installation, Maintenance & Repair | 10 (100.0%) | 0 (0.0%) |
| Total (Category) | 93 (100.0%) | 0 (0.0%) |
| Total (Overall) | 420 (52.4%) | 381 (47.6%) |
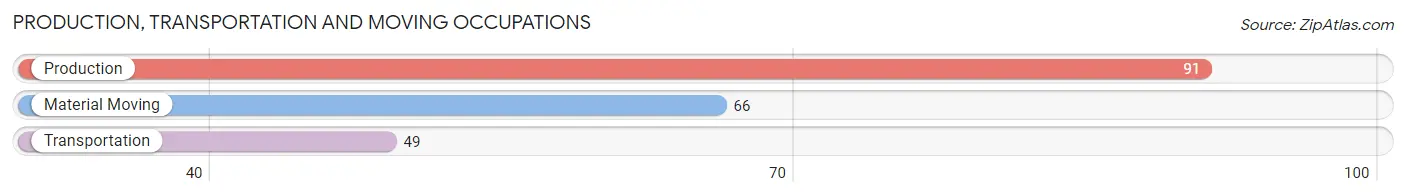
Production, Transportation and Moving Occupations
The most common Production, Transportation and Moving occupations in Dravosburg borough are Production (91 | 11.4%), Material Moving (66 | 8.2%), and Transportation (49 | 6.1%).
Production, Transportation and Moving Occupations by Sex
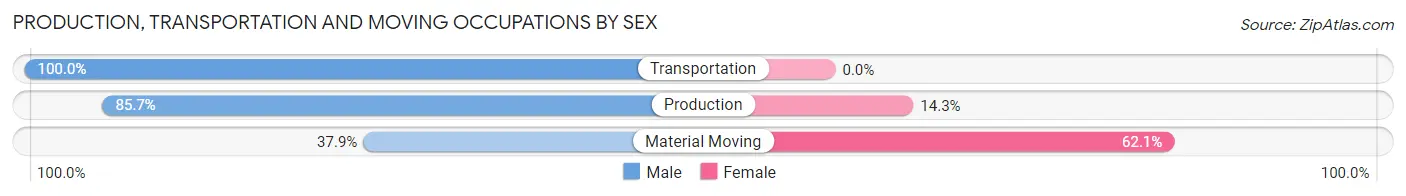
| Occupation | Male | Female |
| Production | 78 (85.7%) | 13 (14.3%) |
| Transportation | 49 (100.0%) | 0 (0.0%) |
| Material Moving | 25 (37.9%) | 41 (62.1%) |
| Total (Category) | 152 (73.8%) | 54 (26.2%) |
| Total (Overall) | 420 (52.4%) | 381 (47.6%) |
Employment Industries by Sex in Dravosburg borough
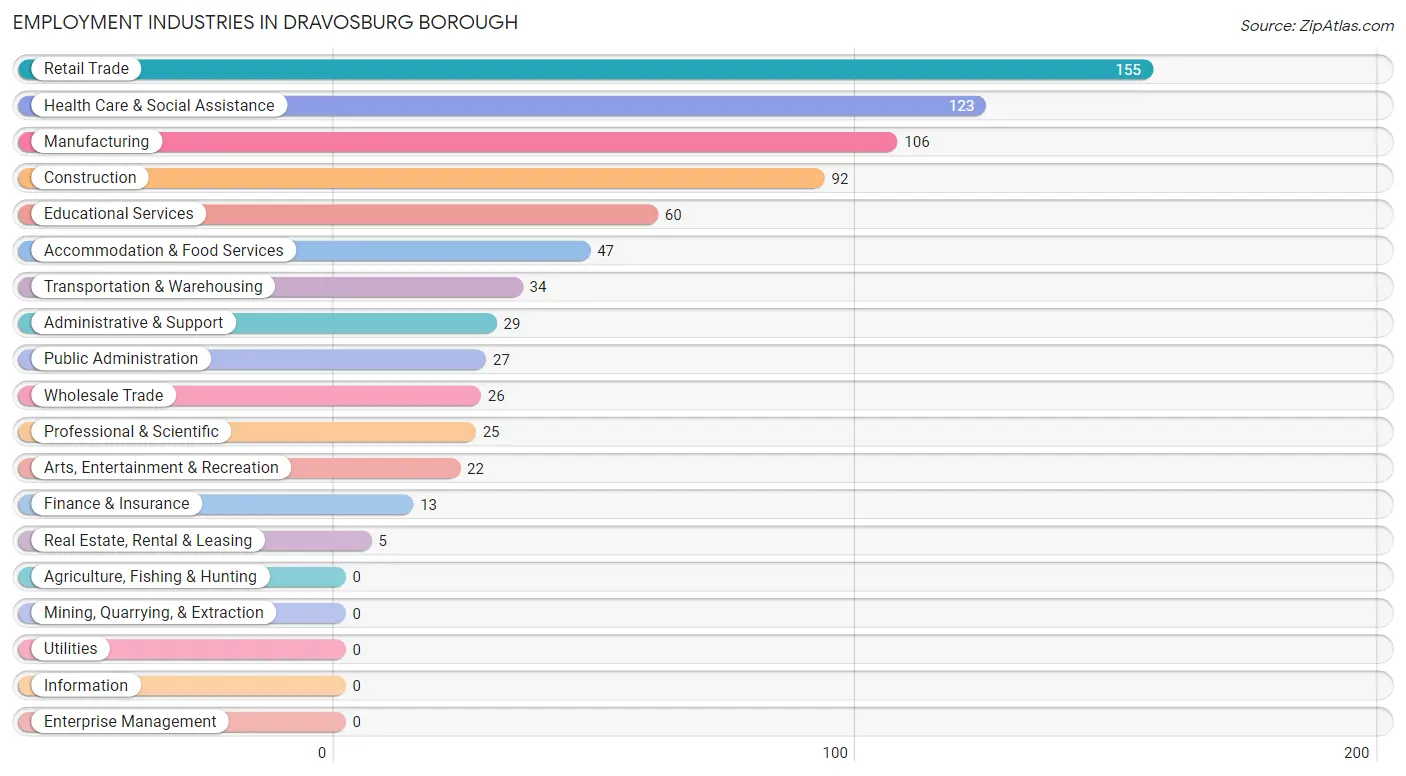
Employment Industries in Dravosburg borough
The major employment industries in Dravosburg borough include Retail Trade (155 | 19.4%), Health Care & Social Assistance (123 | 15.4%), Manufacturing (106 | 13.2%), Construction (92 | 11.5%), and Educational Services (60 | 7.5%).
Employment Industries by Sex in Dravosburg borough
The Dravosburg borough industries that see more men than women are Construction (100.0%), Wholesale Trade (100.0%), and Finance & Insurance (100.0%), whereas the industries that tend to have a higher number of women are Administrative & Support (93.1%), Accommodation & Food Services (87.2%), and Health Care & Social Assistance (85.4%).
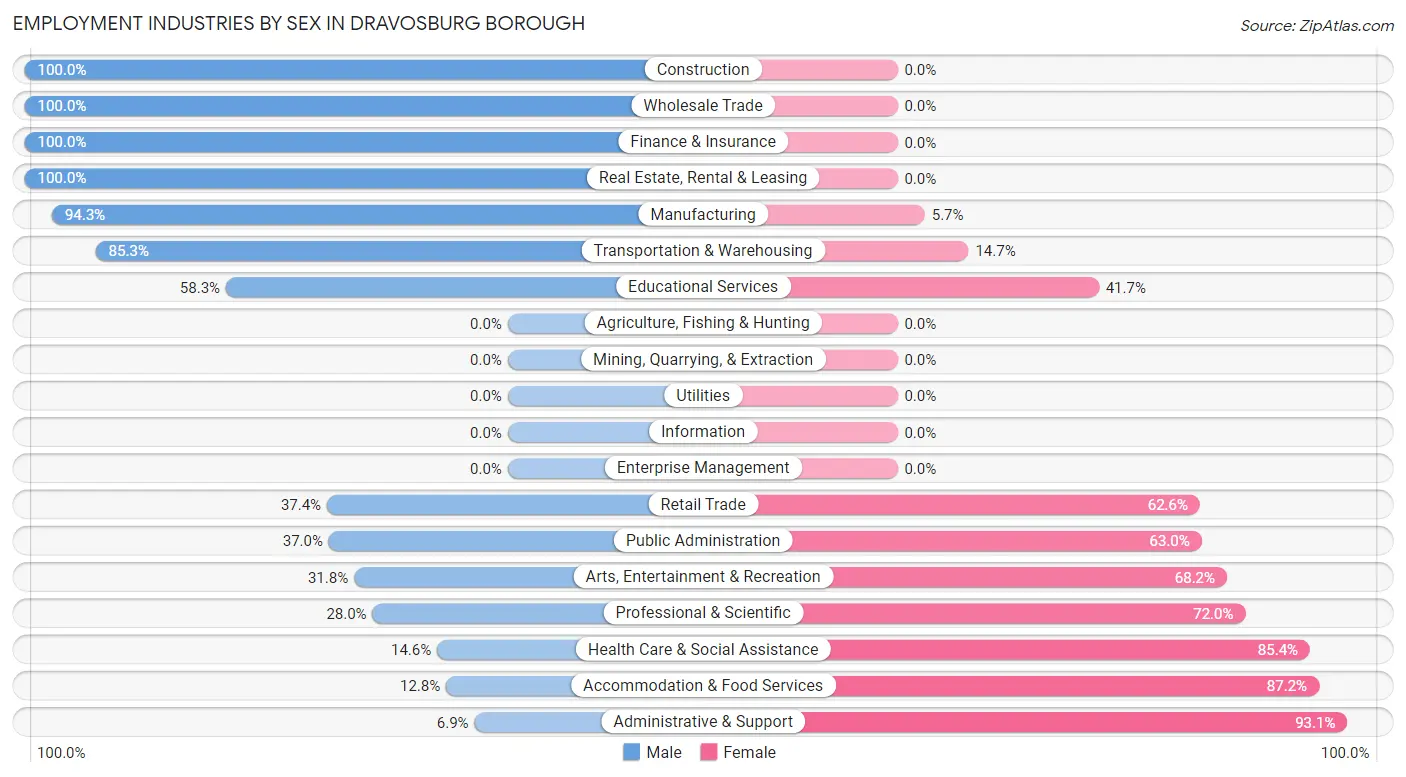
| Industry | Male | Female |
| Agriculture, Fishing & Hunting | 0 (0.0%) | 0 (0.0%) |
| Mining, Quarrying, & Extraction | 0 (0.0%) | 0 (0.0%) |
| Construction | 92 (100.0%) | 0 (0.0%) |
| Manufacturing | 100 (94.3%) | 6 (5.7%) |
| Wholesale Trade | 26 (100.0%) | 0 (0.0%) |
| Retail Trade | 58 (37.4%) | 97 (62.6%) |
| Transportation & Warehousing | 29 (85.3%) | 5 (14.7%) |
| Utilities | 0 (0.0%) | 0 (0.0%) |
| Information | 0 (0.0%) | 0 (0.0%) |
| Finance & Insurance | 13 (100.0%) | 0 (0.0%) |
| Real Estate, Rental & Leasing | 5 (100.0%) | 0 (0.0%) |
| Professional & Scientific | 7 (28.0%) | 18 (72.0%) |
| Enterprise Management | 0 (0.0%) | 0 (0.0%) |
| Administrative & Support | 2 (6.9%) | 27 (93.1%) |
| Educational Services | 35 (58.3%) | 25 (41.7%) |
| Health Care & Social Assistance | 18 (14.6%) | 105 (85.4%) |
| Arts, Entertainment & Recreation | 7 (31.8%) | 15 (68.2%) |
| Accommodation & Food Services | 6 (12.8%) | 41 (87.2%) |
| Public Administration | 10 (37.0%) | 17 (63.0%) |
| Total | 420 (52.4%) | 381 (47.6%) |
Education in Dravosburg borough
School Enrollment in Dravosburg borough
The most common levels of schooling among the 218 students in Dravosburg borough are high school (91 | 41.7%), college / undergraduate (49 | 22.5%), and elementary school (37 | 17.0%).
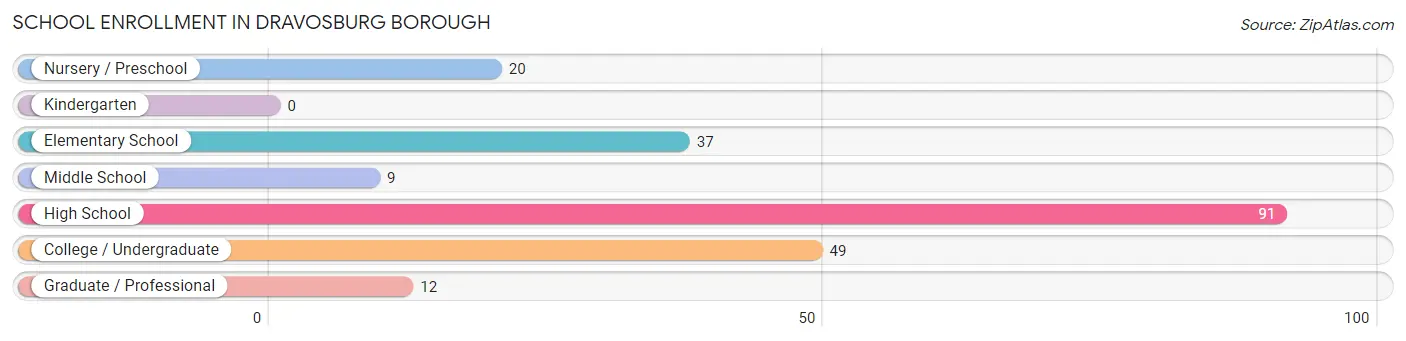
| School Level | # Students | % Students |
| Nursery / Preschool | 20 | 9.2% |
| Kindergarten | 0 | 0.0% |
| Elementary School | 37 | 17.0% |
| Middle School | 9 | 4.1% |
| High School | 91 | 41.7% |
| College / Undergraduate | 49 | 22.5% |
| Graduate / Professional | 12 | 5.5% |
| Total | 218 | 100.0% |
School Enrollment by Age by Funding Source in Dravosburg borough
Out of a total of 218 students who are enrolled in schools in Dravosburg borough, 97 (44.5%) attend a private institution, while the remaining 121 (55.5%) are enrolled in public schools. The age group of 18 to 19 year olds has the highest likelihood of being enrolled in private schools, with 75 (82.4% in the age bracket) enrolled. Conversely, the age group of 3 to 4 year olds has the lowest likelihood of being enrolled in a private school, with 20 (100.0% in the age bracket) attending a public institution.
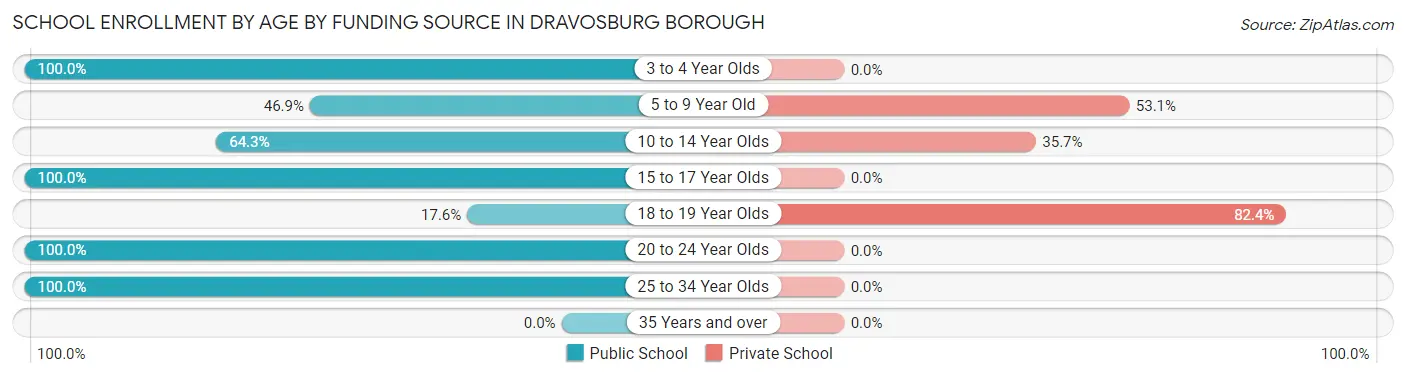
| Age Bracket | Public School | Private School |
| 3 to 4 Year Olds | 20 (100.0%) | 0 (0.0%) |
| 5 to 9 Year Old | 15 (46.9%) | 17 (53.1%) |
| 10 to 14 Year Olds | 9 (64.3%) | 5 (35.7%) |
| 15 to 17 Year Olds | 41 (100.0%) | 0 (0.0%) |
| 18 to 19 Year Olds | 16 (17.6%) | 75 (82.4%) |
| 20 to 24 Year Olds | 8 (100.0%) | 0 (0.0%) |
| 25 to 34 Year Olds | 12 (100.0%) | 0 (0.0%) |
| 35 Years and over | 0 (0.0%) | 0 (0.0%) |
| Total | 121 (55.5%) | 97 (44.5%) |
Educational Attainment by Field of Study in Dravosburg borough
Science & technology (59 | 21.8%), business (49 | 18.1%), education (45 | 16.7%), liberal arts & history (21 | 7.8%), and social sciences (20 | 7.4%) are the most common fields of study among 270 individuals in Dravosburg borough who have obtained a bachelor's degree or higher.
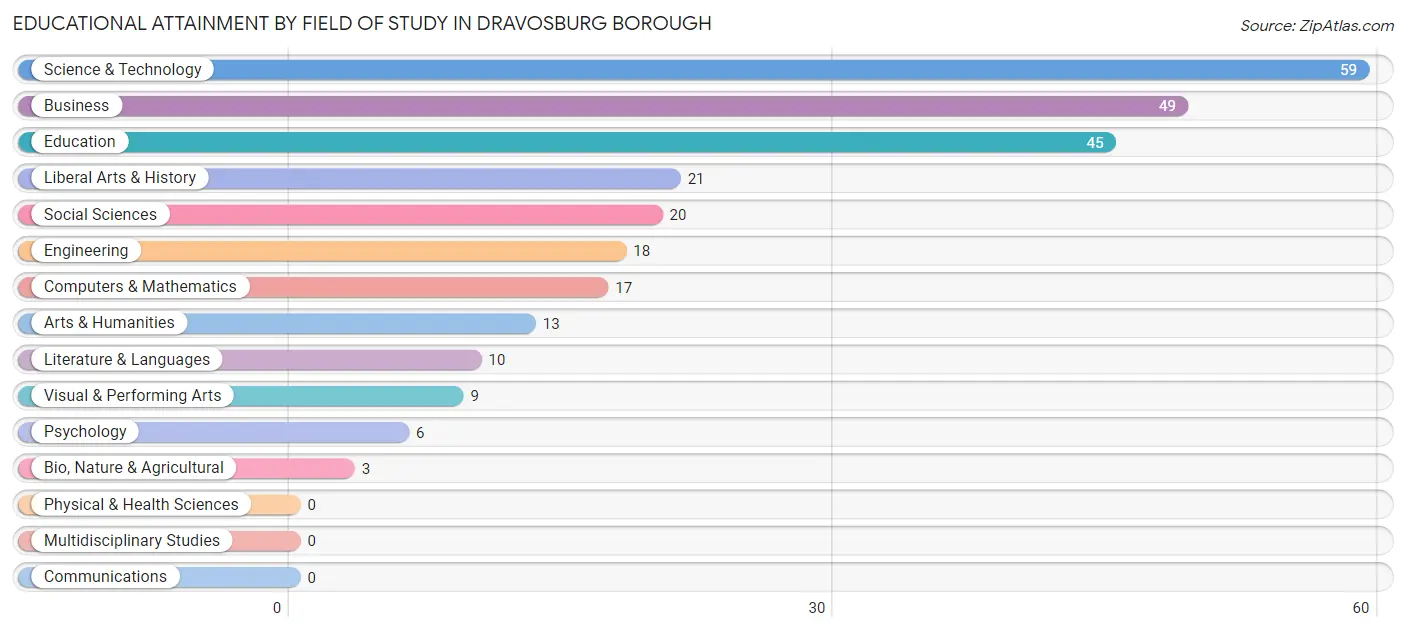
| Field of Study | # Graduates | % Graduates |
| Computers & Mathematics | 17 | 6.3% |
| Bio, Nature & Agricultural | 3 | 1.1% |
| Physical & Health Sciences | 0 | 0.0% |
| Psychology | 6 | 2.2% |
| Social Sciences | 20 | 7.4% |
| Engineering | 18 | 6.7% |
| Multidisciplinary Studies | 0 | 0.0% |
| Science & Technology | 59 | 21.8% |
| Business | 49 | 18.1% |
| Education | 45 | 16.7% |
| Literature & Languages | 10 | 3.7% |
| Liberal Arts & History | 21 | 7.8% |
| Visual & Performing Arts | 9 | 3.3% |
| Communications | 0 | 0.0% |
| Arts & Humanities | 13 | 4.8% |
| Total | 270 | 100.0% |
Transportation & Commute in Dravosburg borough
Vehicle Availability by Sex in Dravosburg borough
The most prevalent vehicle ownership categories in Dravosburg borough are males with 2 vehicles (209, accounting for 49.8%) and females with 2 vehicles (105, making up 56.6%).
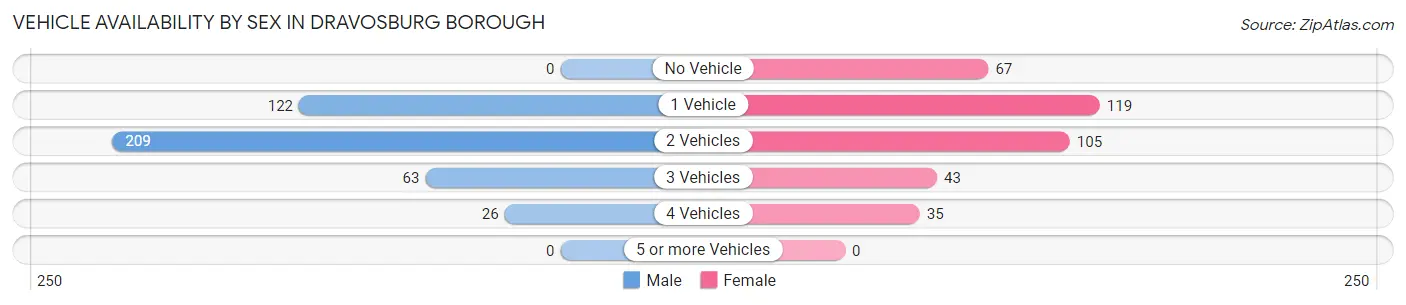
| Vehicles Available | Male | Female |
| No Vehicle | 0 (0.0%) | 67 (18.2%) |
| 1 Vehicle | 122 (29.0%) | 119 (32.3%) |
| 2 Vehicles | 209 (49.8%) | 105 (28.5%) |
| 3 Vehicles | 63 (15.0%) | 43 (11.7%) |
| 4 Vehicles | 26 (6.2%) | 35 (9.5%) |
| 5 or more Vehicles | 0 (0.0%) | 0 (0.0%) |
| Total | 420 (100.0%) | 369 (100.0%) |
Commute Time in Dravosburg borough
The most frequently occuring commute durations in Dravosburg borough are 30 to 34 minutes (190 commuters, 25.4%), 20 to 24 minutes (112 commuters, 15.0%), and 15 to 19 minutes (105 commuters, 14.0%).
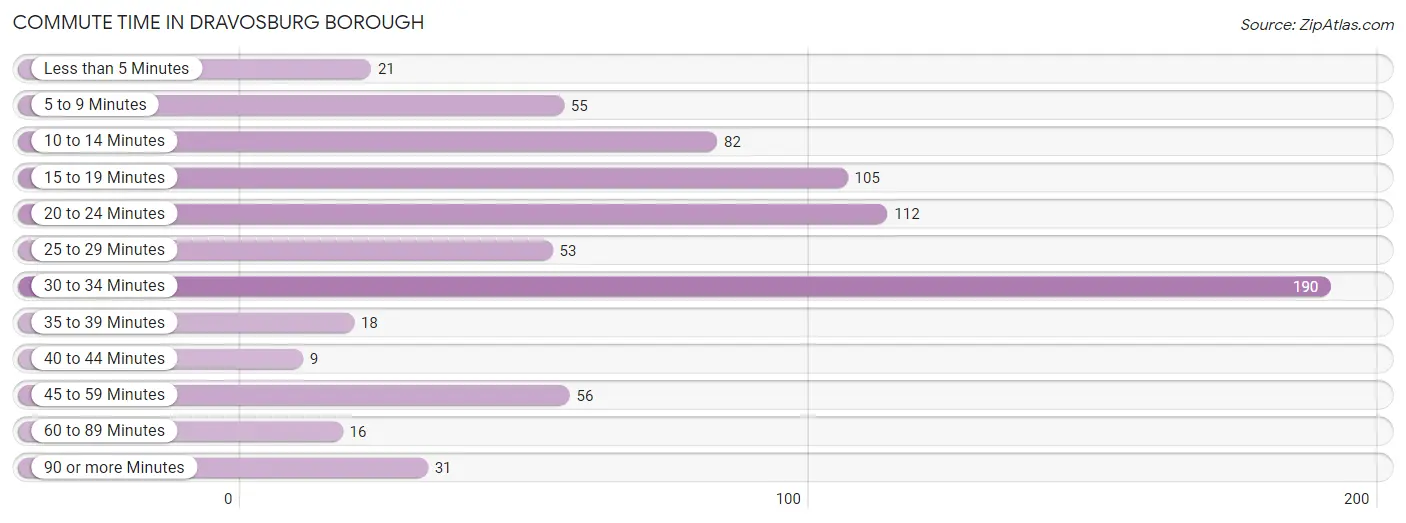
| Commute Time | # Commuters | % Commuters |
| Less than 5 Minutes | 21 | 2.8% |
| 5 to 9 Minutes | 55 | 7.3% |
| 10 to 14 Minutes | 82 | 11.0% |
| 15 to 19 Minutes | 105 | 14.0% |
| 20 to 24 Minutes | 112 | 15.0% |
| 25 to 29 Minutes | 53 | 7.1% |
| 30 to 34 Minutes | 190 | 25.4% |
| 35 to 39 Minutes | 18 | 2.4% |
| 40 to 44 Minutes | 9 | 1.2% |
| 45 to 59 Minutes | 56 | 7.5% |
| 60 to 89 Minutes | 16 | 2.1% |
| 90 or more Minutes | 31 | 4.1% |
Commute Time by Sex in Dravosburg borough
The most common commute times in Dravosburg borough are 30 to 34 minutes (123 commuters, 30.2%) for males and 30 to 34 minutes (67 commuters, 19.7%) for females.
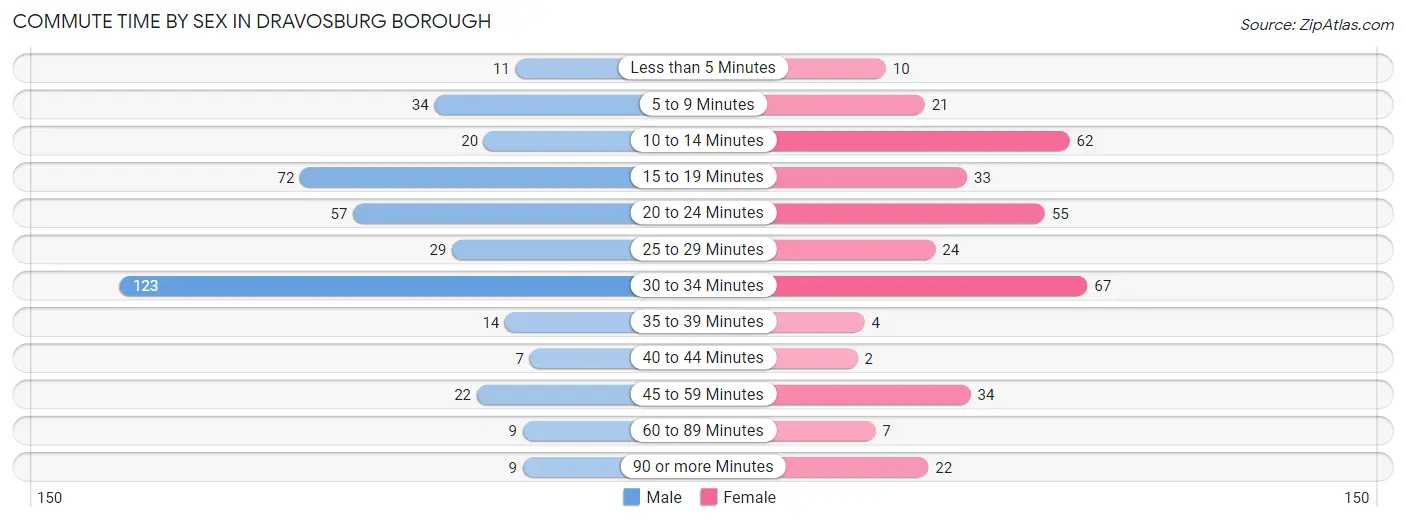
| Commute Time | Male | Female |
| Less than 5 Minutes | 11 (2.7%) | 10 (2.9%) |
| 5 to 9 Minutes | 34 (8.4%) | 21 (6.2%) |
| 10 to 14 Minutes | 20 (4.9%) | 62 (18.2%) |
| 15 to 19 Minutes | 72 (17.7%) | 33 (9.7%) |
| 20 to 24 Minutes | 57 (14.0%) | 55 (16.1%) |
| 25 to 29 Minutes | 29 (7.1%) | 24 (7.0%) |
| 30 to 34 Minutes | 123 (30.2%) | 67 (19.7%) |
| 35 to 39 Minutes | 14 (3.4%) | 4 (1.2%) |
| 40 to 44 Minutes | 7 (1.7%) | 2 (0.6%) |
| 45 to 59 Minutes | 22 (5.4%) | 34 (10.0%) |
| 60 to 89 Minutes | 9 (2.2%) | 7 (2.1%) |
| 90 or more Minutes | 9 (2.2%) | 22 (6.5%) |
Time of Departure to Work by Sex in Dravosburg borough
The most frequent times of departure to work in Dravosburg borough are 6:30 AM to 6:59 AM (91, 22.4%) for males and 12:00 PM to 3:59 PM (91, 26.7%) for females.
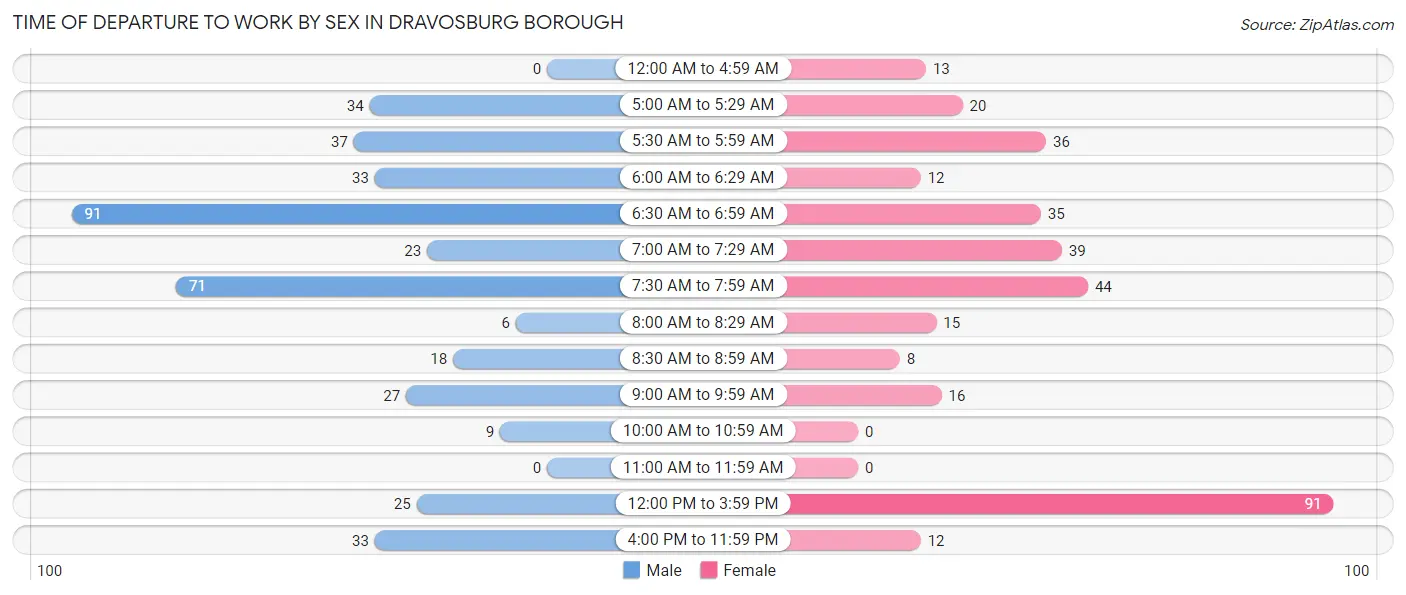
| Time of Departure | Male | Female |
| 12:00 AM to 4:59 AM | 0 (0.0%) | 13 (3.8%) |
| 5:00 AM to 5:29 AM | 34 (8.4%) | 20 (5.9%) |
| 5:30 AM to 5:59 AM | 37 (9.1%) | 36 (10.6%) |
| 6:00 AM to 6:29 AM | 33 (8.1%) | 12 (3.5%) |
| 6:30 AM to 6:59 AM | 91 (22.4%) | 35 (10.3%) |
| 7:00 AM to 7:29 AM | 23 (5.7%) | 39 (11.4%) |
| 7:30 AM to 7:59 AM | 71 (17.4%) | 44 (12.9%) |
| 8:00 AM to 8:29 AM | 6 (1.5%) | 15 (4.4%) |
| 8:30 AM to 8:59 AM | 18 (4.4%) | 8 (2.4%) |
| 9:00 AM to 9:59 AM | 27 (6.6%) | 16 (4.7%) |
| 10:00 AM to 10:59 AM | 9 (2.2%) | 0 (0.0%) |
| 11:00 AM to 11:59 AM | 0 (0.0%) | 0 (0.0%) |
| 12:00 PM to 3:59 PM | 25 (6.1%) | 91 (26.7%) |
| 4:00 PM to 11:59 PM | 33 (8.1%) | 12 (3.5%) |
| Total | 407 (100.0%) | 341 (100.0%) |
Housing Occupancy in Dravosburg borough
Occupancy by Ownership in Dravosburg borough
Of the total 823 dwellings in Dravosburg borough, owner-occupied units account for 421 (51.1%), while renter-occupied units make up 402 (48.8%).
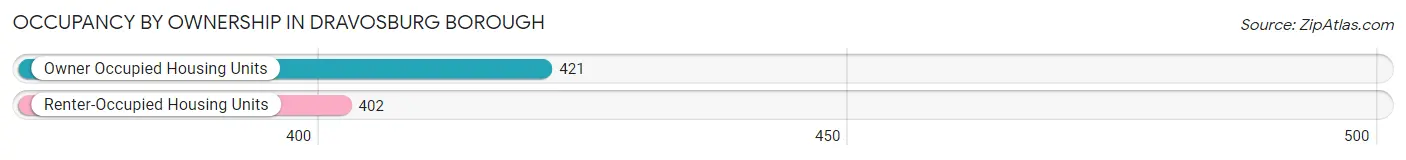
| Occupancy | # Housing Units | % Housing Units |
| Owner Occupied Housing Units | 421 | 51.1% |
| Renter-Occupied Housing Units | 402 | 48.8% |
| Total Occupied Housing Units | 823 | 100.0% |
Occupancy by Household Size in Dravosburg borough
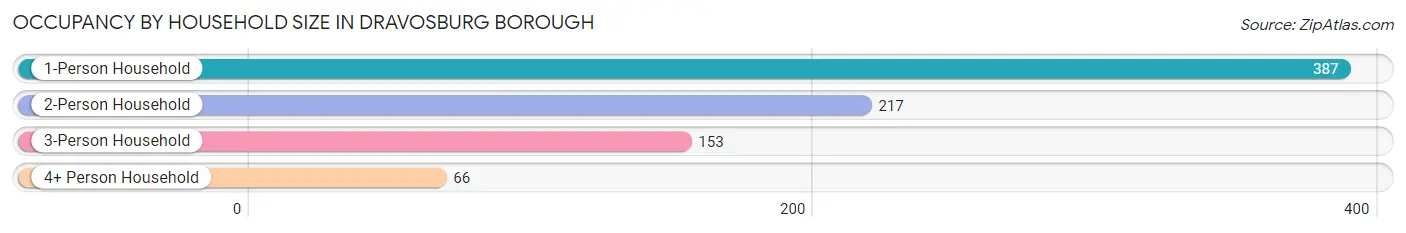
| Household Size | # Housing Units | % Housing Units |
| 1-Person Household | 387 | 47.0% |
| 2-Person Household | 217 | 26.4% |
| 3-Person Household | 153 | 18.6% |
| 4+ Person Household | 66 | 8.0% |
| Total Housing Units | 823 | 100.0% |
Occupancy by Ownership by Household Size in Dravosburg borough
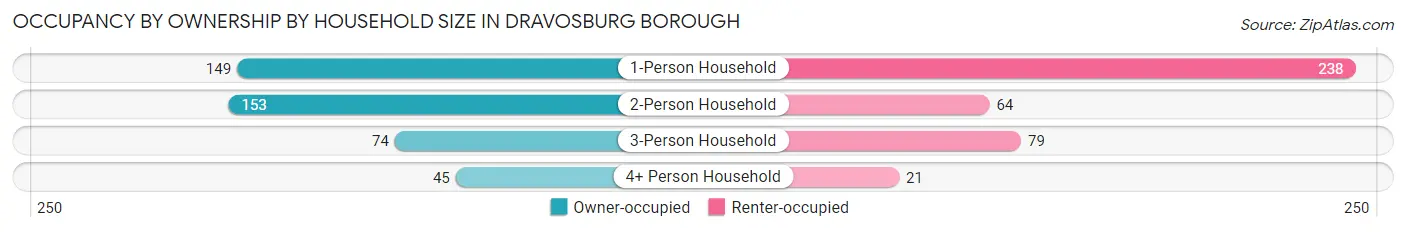
| Household Size | Owner-occupied | Renter-occupied |
| 1-Person Household | 149 (38.5%) | 238 (61.5%) |
| 2-Person Household | 153 (70.5%) | 64 (29.5%) |
| 3-Person Household | 74 (48.4%) | 79 (51.6%) |
| 4+ Person Household | 45 (68.2%) | 21 (31.8%) |
| Total Housing Units | 421 (51.1%) | 402 (48.8%) |
Occupancy by Educational Attainment in Dravosburg borough
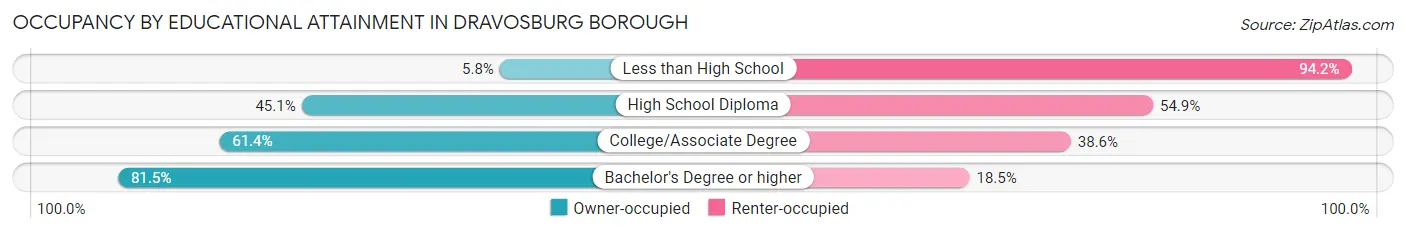
| Household Size | Owner-occupied | Renter-occupied |
| Less than High School | 5 (5.8%) | 81 (94.2%) |
| High School Diploma | 161 (45.1%) | 196 (54.9%) |
| College/Associate Degree | 167 (61.4%) | 105 (38.6%) |
| Bachelor's Degree or higher | 88 (81.5%) | 20 (18.5%) |
Occupancy by Age of Householder in Dravosburg borough
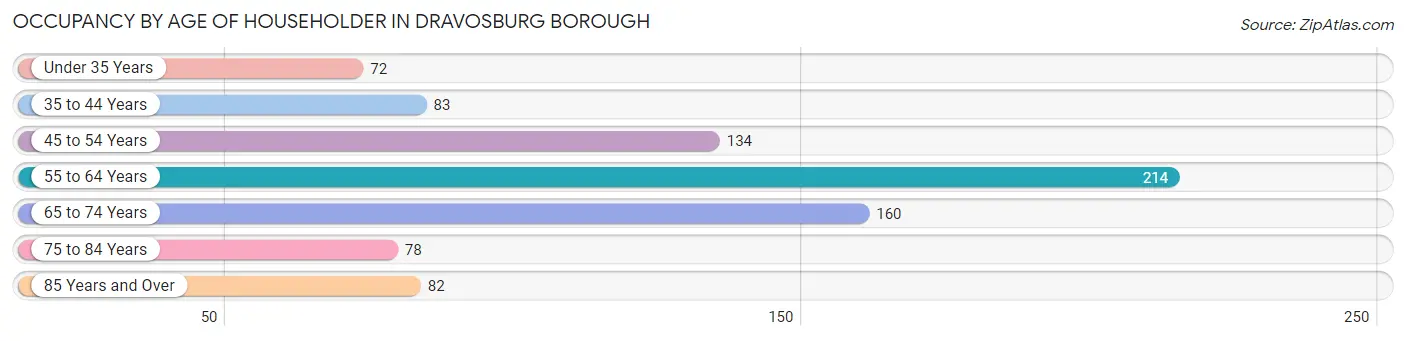
| Age Bracket | # Households | % Households |
| Under 35 Years | 72 | 8.7% |
| 35 to 44 Years | 83 | 10.1% |
| 45 to 54 Years | 134 | 16.3% |
| 55 to 64 Years | 214 | 26.0% |
| 65 to 74 Years | 160 | 19.4% |
| 75 to 84 Years | 78 | 9.5% |
| 85 Years and Over | 82 | 10.0% |
| Total | 823 | 100.0% |
Housing Finances in Dravosburg borough
Median Income by Occupancy in Dravosburg borough
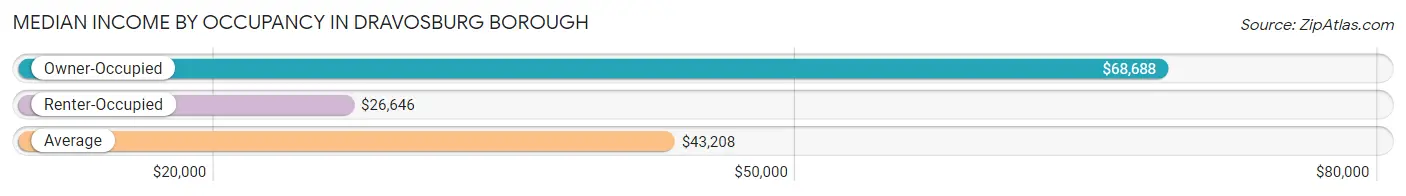
| Occupancy Type | # Households | Median Income |
| Owner-Occupied | 421 (51.1%) | $68,688 |
| Renter-Occupied | 402 (48.8%) | $26,646 |
| Average | 823 (100.0%) | $43,208 |
Occupancy by Householder Income Bracket in Dravosburg borough
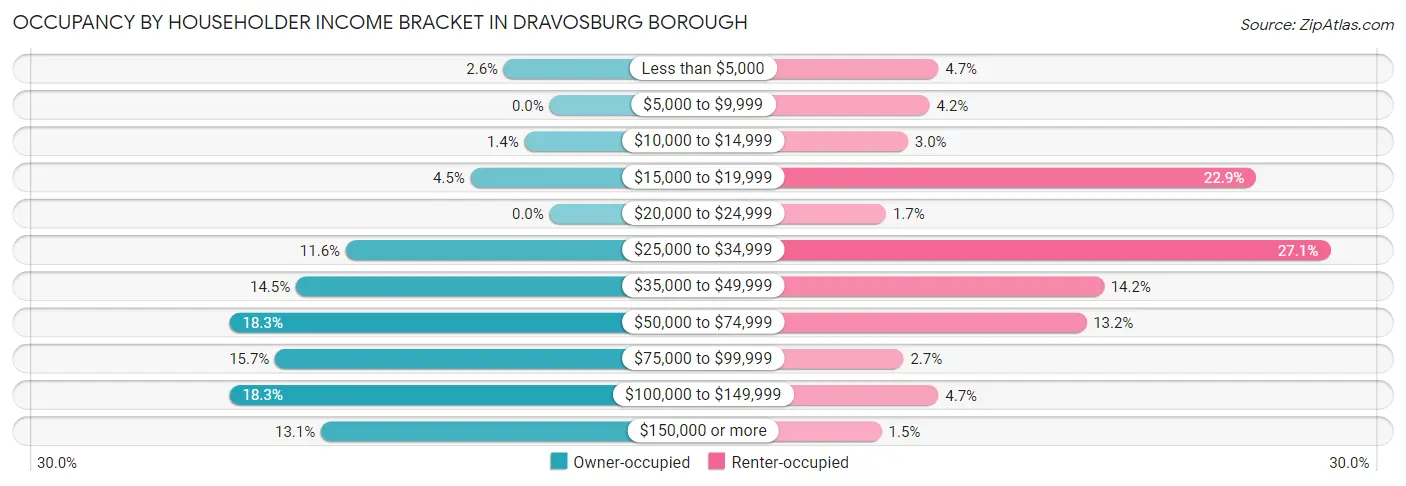
| Income Bracket | Owner-occupied | Renter-occupied |
| Less than $5,000 | 11 (2.6%) | 19 (4.7%) |
| $5,000 to $9,999 | 0 (0.0%) | 17 (4.2%) |
| $10,000 to $14,999 | 6 (1.4%) | 12 (3.0%) |
| $15,000 to $19,999 | 19 (4.5%) | 92 (22.9%) |
| $20,000 to $24,999 | 0 (0.0%) | 7 (1.7%) |
| $25,000 to $34,999 | 49 (11.6%) | 109 (27.1%) |
| $35,000 to $49,999 | 61 (14.5%) | 57 (14.2%) |
| $50,000 to $74,999 | 77 (18.3%) | 53 (13.2%) |
| $75,000 to $99,999 | 66 (15.7%) | 11 (2.7%) |
| $100,000 to $149,999 | 77 (18.3%) | 19 (4.7%) |
| $150,000 or more | 55 (13.1%) | 6 (1.5%) |
| Total | 421 (100.0%) | 402 (100.0%) |
Monthly Housing Cost Tiers in Dravosburg borough
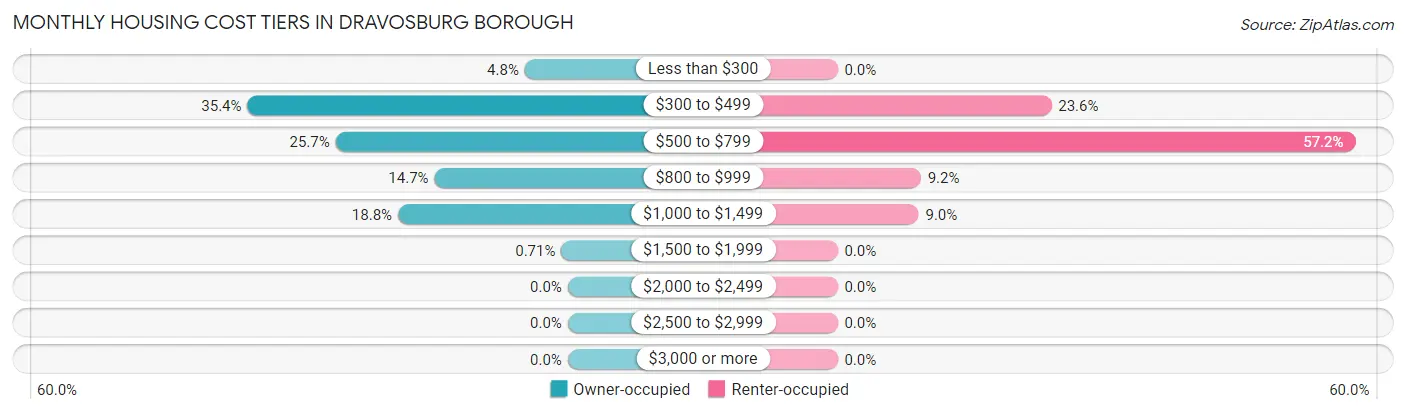
| Monthly Cost | Owner-occupied | Renter-occupied |
| Less than $300 | 20 (4.8%) | 0 (0.0%) |
| $300 to $499 | 149 (35.4%) | 95 (23.6%) |
| $500 to $799 | 108 (25.7%) | 230 (57.2%) |
| $800 to $999 | 62 (14.7%) | 37 (9.2%) |
| $1,000 to $1,499 | 79 (18.8%) | 36 (9.0%) |
| $1,500 to $1,999 | 3 (0.7%) | 0 (0.0%) |
| $2,000 to $2,499 | 0 (0.0%) | 0 (0.0%) |
| $2,500 to $2,999 | 0 (0.0%) | 0 (0.0%) |
| $3,000 or more | 0 (0.0%) | 0 (0.0%) |
| Total | 421 (100.0%) | 402 (100.0%) |
Physical Housing Characteristics in Dravosburg borough
Housing Structures in Dravosburg borough
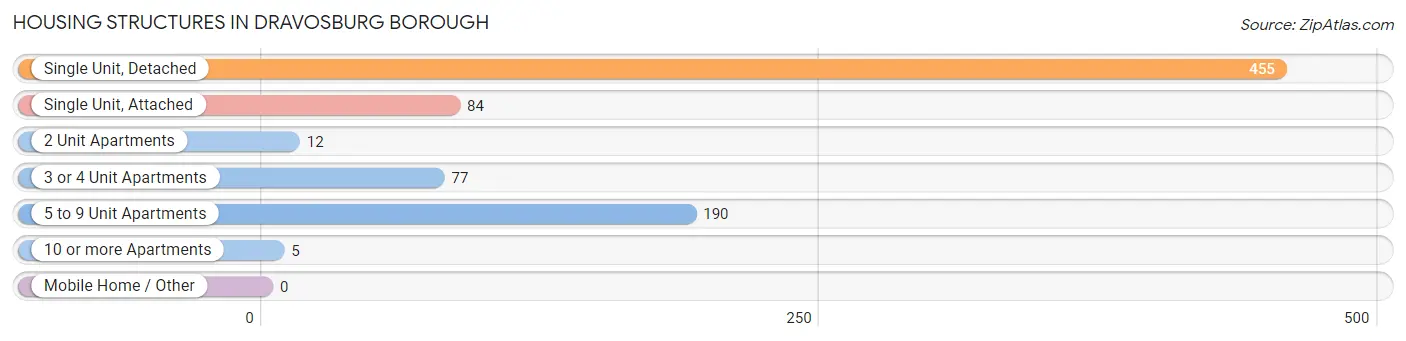
| Structure Type | # Housing Units | % Housing Units |
| Single Unit, Detached | 455 | 55.3% |
| Single Unit, Attached | 84 | 10.2% |
| 2 Unit Apartments | 12 | 1.5% |
| 3 or 4 Unit Apartments | 77 | 9.4% |
| 5 to 9 Unit Apartments | 190 | 23.1% |
| 10 or more Apartments | 5 | 0.6% |
| Mobile Home / Other | 0 | 0.0% |
| Total | 823 | 100.0% |
Housing Structures by Occupancy in Dravosburg borough
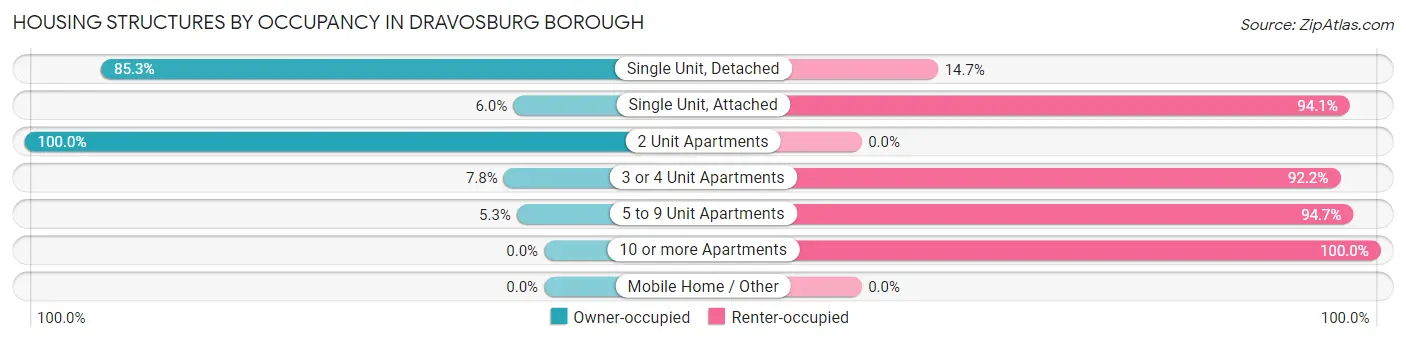
| Structure Type | Owner-occupied | Renter-occupied |
| Single Unit, Detached | 388 (85.3%) | 67 (14.7%) |
| Single Unit, Attached | 5 (5.9%) | 79 (94.1%) |
| 2 Unit Apartments | 12 (100.0%) | 0 (0.0%) |
| 3 or 4 Unit Apartments | 6 (7.8%) | 71 (92.2%) |
| 5 to 9 Unit Apartments | 10 (5.3%) | 180 (94.7%) |
| 10 or more Apartments | 0 (0.0%) | 5 (100.0%) |
| Mobile Home / Other | 0 (0.0%) | 0 (0.0%) |
| Total | 421 (51.1%) | 402 (48.8%) |
Housing Structures by Number of Rooms in Dravosburg borough
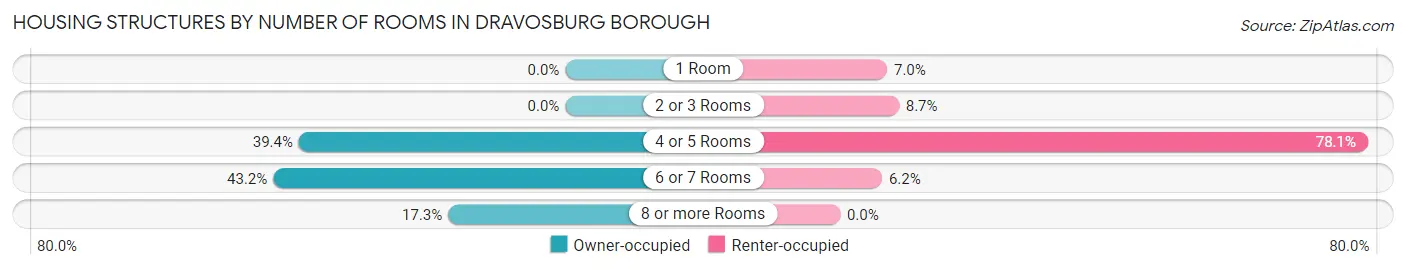
| Number of Rooms | Owner-occupied | Renter-occupied |
| 1 Room | 0 (0.0%) | 28 (7.0%) |
| 2 or 3 Rooms | 0 (0.0%) | 35 (8.7%) |
| 4 or 5 Rooms | 166 (39.4%) | 314 (78.1%) |
| 6 or 7 Rooms | 182 (43.2%) | 25 (6.2%) |
| 8 or more Rooms | 73 (17.3%) | 0 (0.0%) |
| Total | 421 (100.0%) | 402 (100.0%) |
Housing Structure by Heating Type in Dravosburg borough
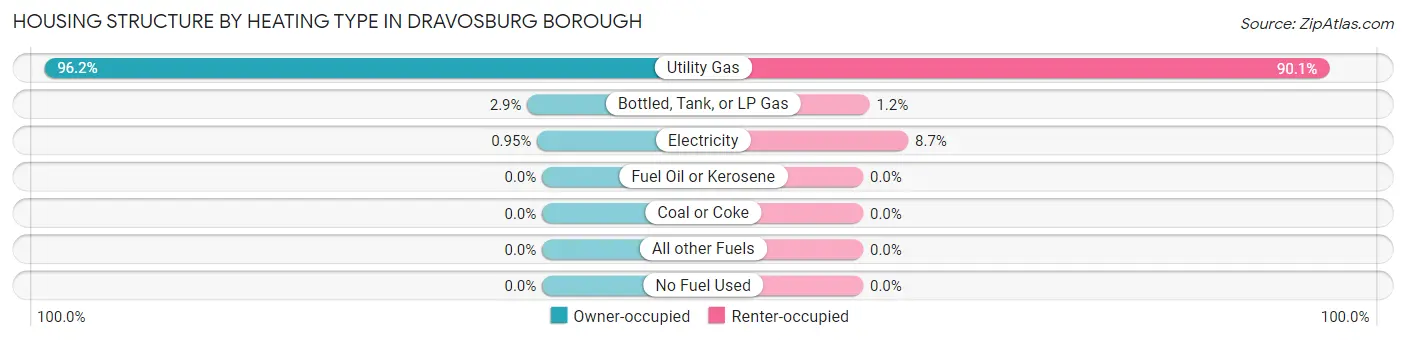
| Heating Type | Owner-occupied | Renter-occupied |
| Utility Gas | 405 (96.2%) | 362 (90.0%) |
| Bottled, Tank, or LP Gas | 12 (2.9%) | 5 (1.2%) |
| Electricity | 4 (0.9%) | 35 (8.7%) |
| Fuel Oil or Kerosene | 0 (0.0%) | 0 (0.0%) |
| Coal or Coke | 0 (0.0%) | 0 (0.0%) |
| All other Fuels | 0 (0.0%) | 0 (0.0%) |
| No Fuel Used | 0 (0.0%) | 0 (0.0%) |
| Total | 421 (100.0%) | 402 (100.0%) |
Household Vehicle Usage in Dravosburg borough
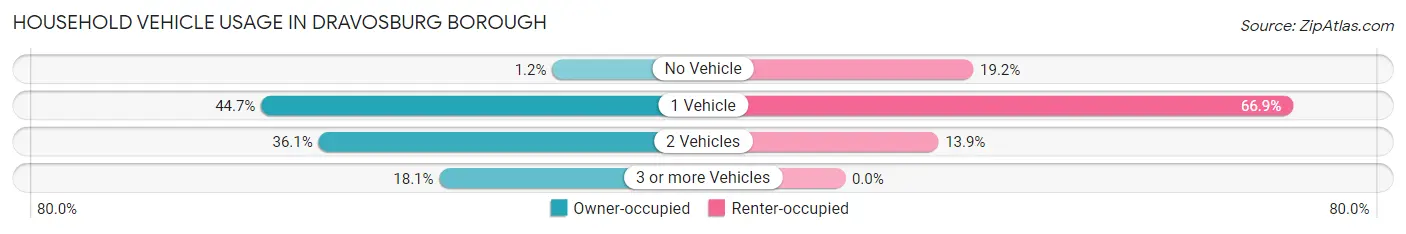
| Vehicles per Household | Owner-occupied | Renter-occupied |
| No Vehicle | 5 (1.2%) | 77 (19.2%) |
| 1 Vehicle | 188 (44.7%) | 269 (66.9%) |
| 2 Vehicles | 152 (36.1%) | 56 (13.9%) |
| 3 or more Vehicles | 76 (18.0%) | 0 (0.0%) |
| Total | 421 (100.0%) | 402 (100.0%) |
Real Estate & Mortgages in Dravosburg borough
Real Estate and Mortgage Overview in Dravosburg borough
| Characteristic | Without Mortgage | With Mortgage |
| Housing Units | 229 | 192 |
| Median Property Value | $94,200 | $87,600 |
| Median Household Income | $68,194 | $6 |
| Monthly Housing Costs | $443 | $0 |
| Real Estate Taxes | $938 | $4 |
Property Value by Mortgage Status in Dravosburg borough
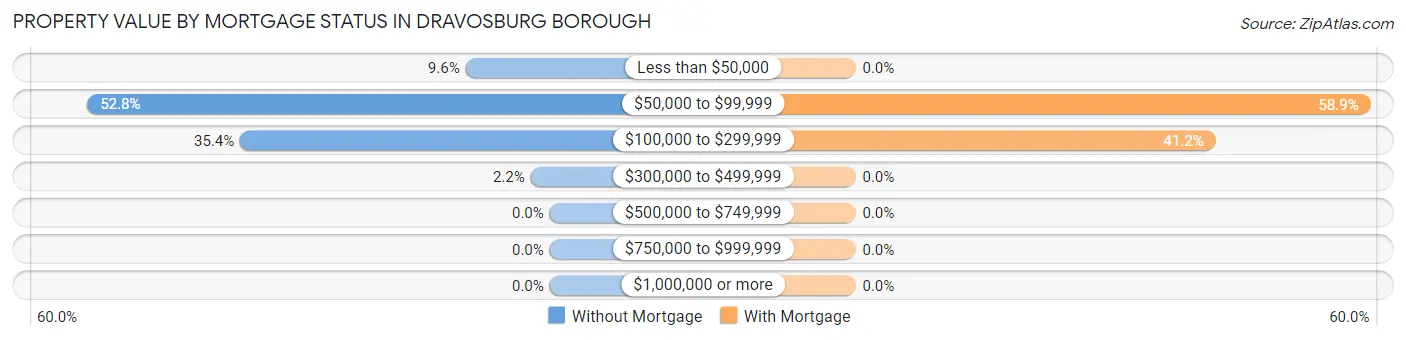
| Property Value | Without Mortgage | With Mortgage |
| Less than $50,000 | 22 (9.6%) | 0 (0.0%) |
| $50,000 to $99,999 | 121 (52.8%) | 113 (58.9%) |
| $100,000 to $299,999 | 81 (35.4%) | 79 (41.1%) |
| $300,000 to $499,999 | 5 (2.2%) | 0 (0.0%) |
| $500,000 to $749,999 | 0 (0.0%) | 0 (0.0%) |
| $750,000 to $999,999 | 0 (0.0%) | 0 (0.0%) |
| $1,000,000 or more | 0 (0.0%) | 0 (0.0%) |
| Total | 229 (100.0%) | 192 (100.0%) |
Household Income by Mortgage Status in Dravosburg borough
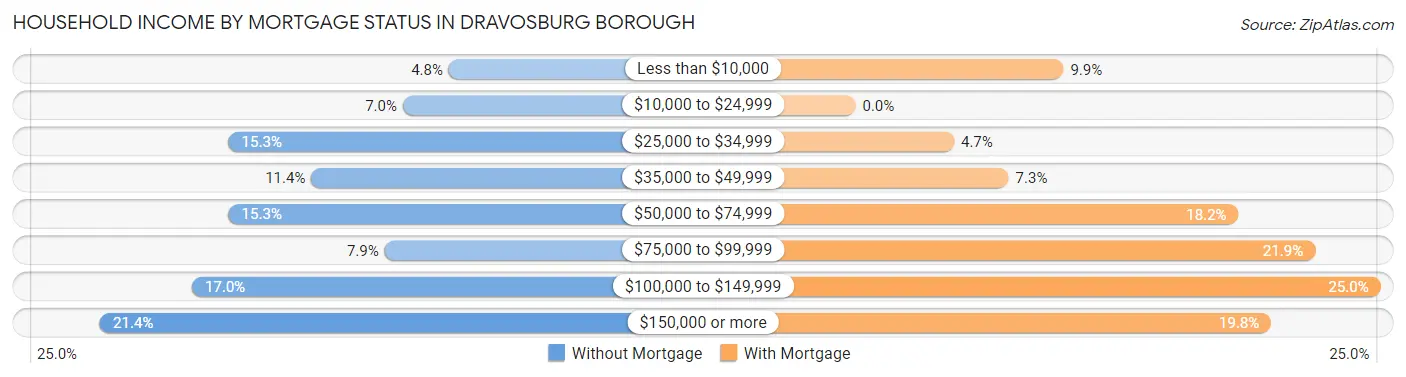
| Household Income | Without Mortgage | With Mortgage |
| Less than $10,000 | 11 (4.8%) | 19 (9.9%) |
| $10,000 to $24,999 | 16 (7.0%) | 0 (0.0%) |
| $25,000 to $34,999 | 35 (15.3%) | 9 (4.7%) |
| $35,000 to $49,999 | 26 (11.4%) | 14 (7.3%) |
| $50,000 to $74,999 | 35 (15.3%) | 35 (18.2%) |
| $75,000 to $99,999 | 18 (7.9%) | 42 (21.9%) |
| $100,000 to $149,999 | 39 (17.0%) | 48 (25.0%) |
| $150,000 or more | 49 (21.4%) | 38 (19.8%) |
| Total | 229 (100.0%) | 192 (100.0%) |
Property Value to Household Income Ratio in Dravosburg borough
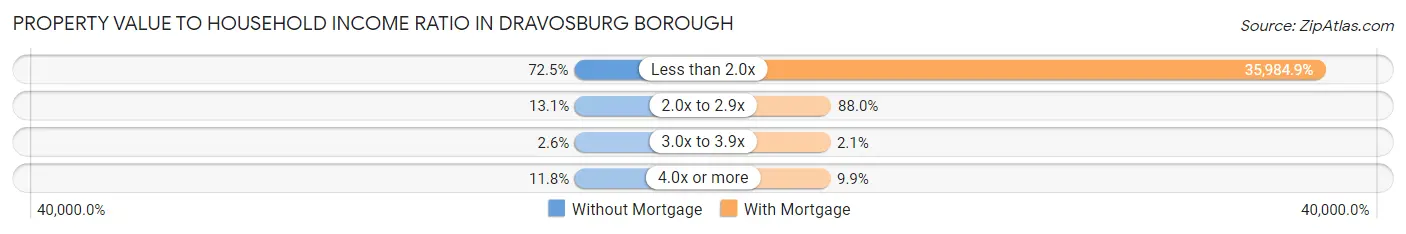
| Value-to-Income Ratio | Without Mortgage | With Mortgage |
| Less than 2.0x | 166 (72.5%) | 69,091 (35,984.9%) |
| 2.0x to 2.9x | 30 (13.1%) | 169 (88.0%) |
| 3.0x to 3.9x | 6 (2.6%) | 4 (2.1%) |
| 4.0x or more | 27 (11.8%) | 19 (9.9%) |
| Total | 229 (100.0%) | 192 (100.0%) |
Real Estate Taxes by Mortgage Status in Dravosburg borough
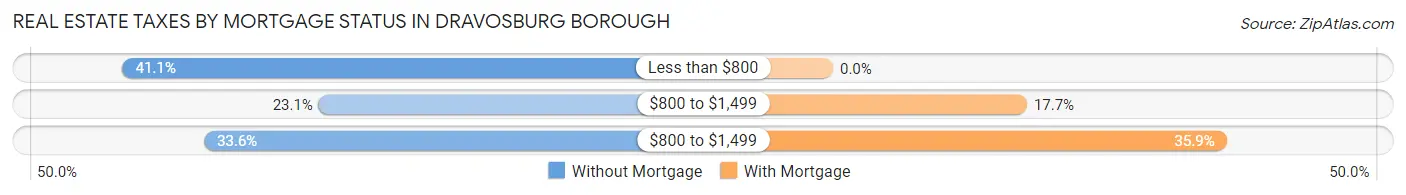
| Property Taxes | Without Mortgage | With Mortgage |
| Less than $800 | 94 (41.0%) | 0 (0.0%) |
| $800 to $1,499 | 53 (23.1%) | 34 (17.7%) |
| $800 to $1,499 | 77 (33.6%) | 69 (35.9%) |
| Total | 229 (100.0%) | 192 (100.0%) |
Health & Disability in Dravosburg borough
Health Insurance Coverage by Age in Dravosburg borough
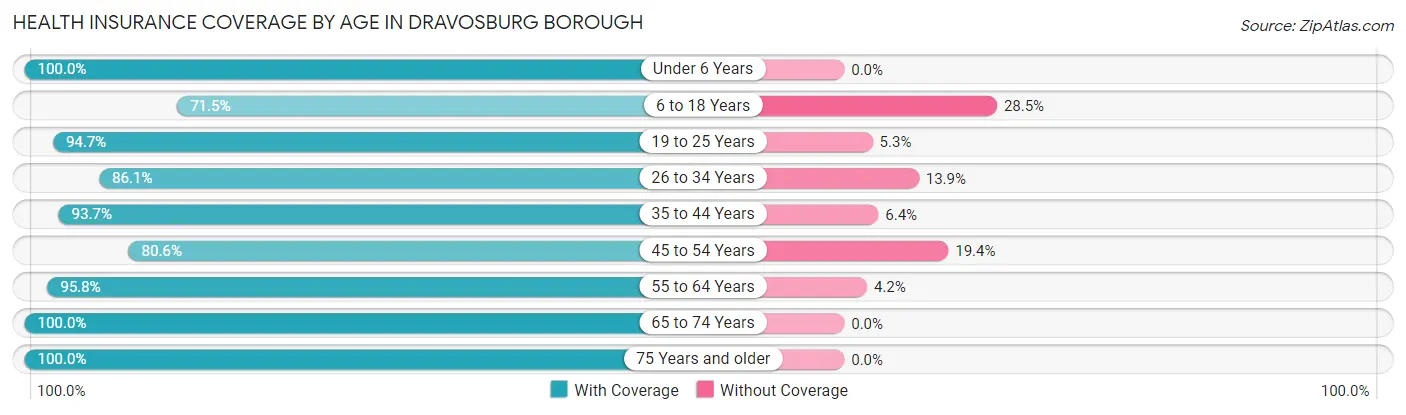
| Age Bracket | With Coverage | Without Coverage |
| Under 6 Years | 47 (100.0%) | 0 (0.0%) |
| 6 to 18 Years | 103 (71.5%) | 41 (28.5%) |
| 19 to 25 Years | 161 (94.7%) | 9 (5.3%) |
| 26 to 34 Years | 124 (86.1%) | 20 (13.9%) |
| 35 to 44 Years | 177 (93.6%) | 12 (6.4%) |
| 45 to 54 Years | 187 (80.6%) | 45 (19.4%) |
| 55 to 64 Years | 271 (95.8%) | 12 (4.2%) |
| 65 to 74 Years | 218 (100.0%) | 0 (0.0%) |
| 75 Years and older | 187 (100.0%) | 0 (0.0%) |
| Total | 1,475 (91.4%) | 139 (8.6%) |
Health Insurance Coverage by Citizenship Status in Dravosburg borough
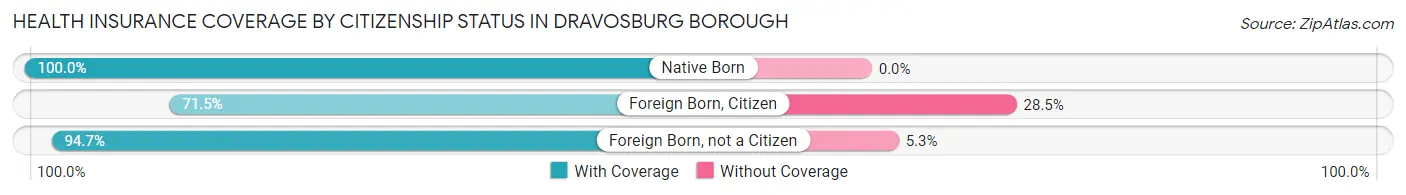
| Citizenship Status | With Coverage | Without Coverage |
| Native Born | 47 (100.0%) | 0 (0.0%) |
| Foreign Born, Citizen | 103 (71.5%) | 41 (28.5%) |
| Foreign Born, not a Citizen | 161 (94.7%) | 9 (5.3%) |
Health Insurance Coverage by Household Income in Dravosburg borough
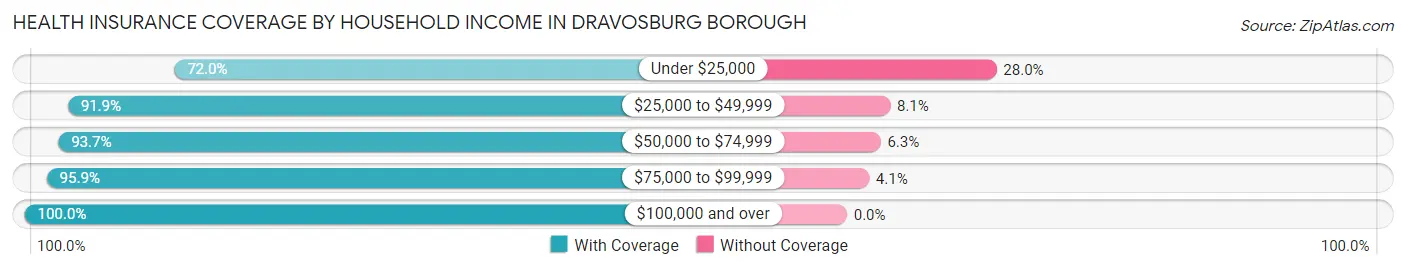
| Household Income | With Coverage | Without Coverage |
| Under $25,000 | 208 (72.0%) | 81 (28.0%) |
| $25,000 to $49,999 | 363 (91.9%) | 32 (8.1%) |
| $50,000 to $74,999 | 297 (93.7%) | 20 (6.3%) |
| $75,000 to $99,999 | 139 (95.9%) | 6 (4.1%) |
| $100,000 and over | 468 (100.0%) | 0 (0.0%) |
Public vs Private Health Insurance Coverage by Age in Dravosburg borough
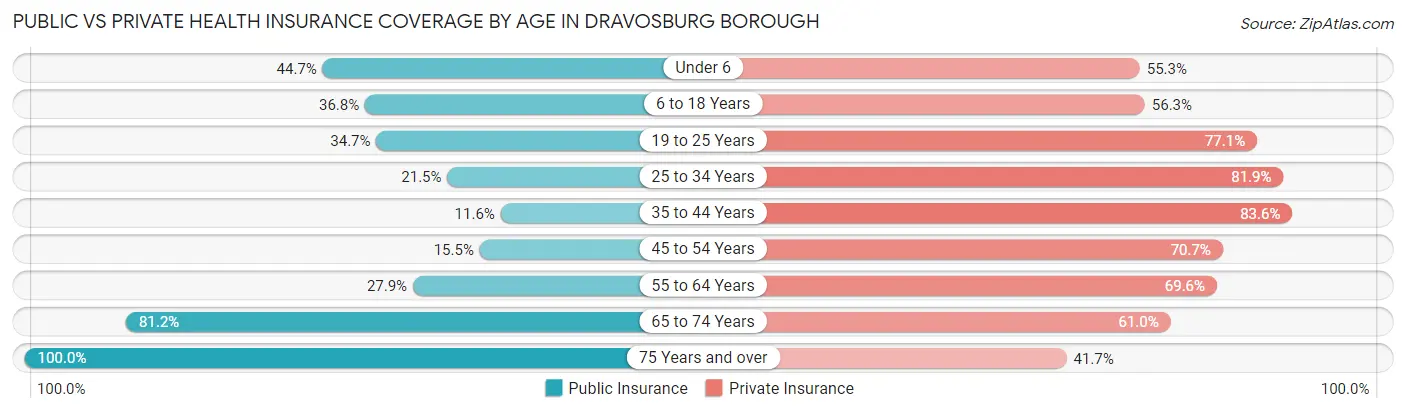
| Age Bracket | Public Insurance | Private Insurance |
| Under 6 | 21 (44.7%) | 26 (55.3%) |
| 6 to 18 Years | 53 (36.8%) | 81 (56.2%) |
| 19 to 25 Years | 59 (34.7%) | 131 (77.1%) |
| 25 to 34 Years | 31 (21.5%) | 118 (81.9%) |
| 35 to 44 Years | 22 (11.6%) | 158 (83.6%) |
| 45 to 54 Years | 36 (15.5%) | 164 (70.7%) |
| 55 to 64 Years | 79 (27.9%) | 197 (69.6%) |
| 65 to 74 Years | 177 (81.2%) | 133 (61.0%) |
| 75 Years and over | 187 (100.0%) | 78 (41.7%) |
| Total | 665 (41.2%) | 1,086 (67.3%) |
Disability Status by Sex by Age in Dravosburg borough
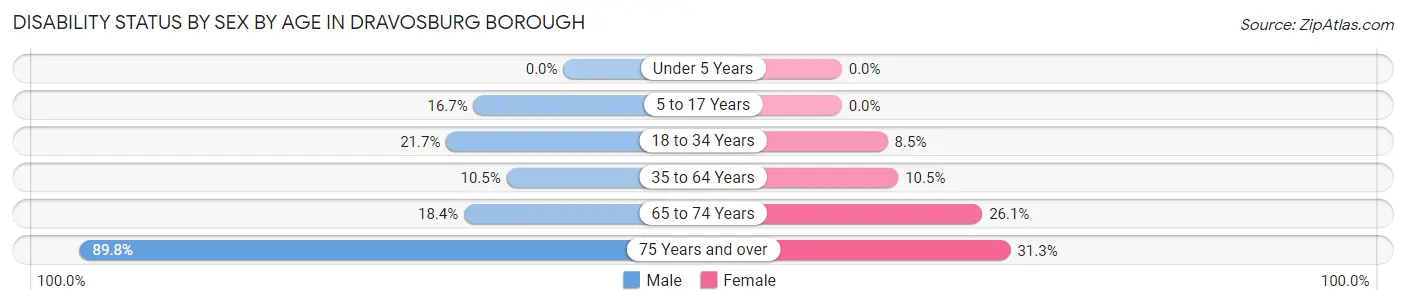
| Age Bracket | Male | Female |
| Under 5 Years | 0 (0.0%) | 0 (0.0%) |
| 5 to 17 Years | 10 (16.7%) | 0 (0.0%) |
| 18 to 34 Years | 50 (21.7%) | 12 (8.5%) |
| 35 to 64 Years | 35 (10.5%) | 39 (10.5%) |
| 65 to 74 Years | 14 (18.4%) | 37 (26.1%) |
| 75 Years and over | 79 (89.8%) | 31 (31.3%) |
Disability Class by Sex by Age in Dravosburg borough
Disability Class: Hearing Difficulty
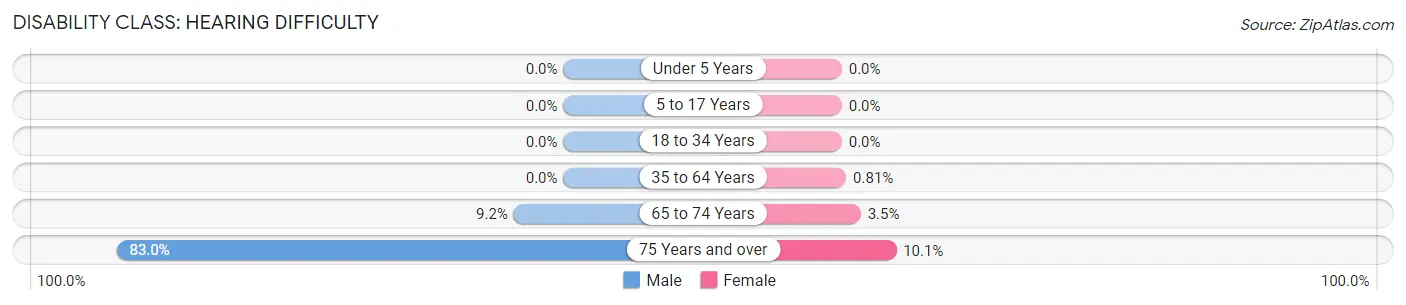
| Age Bracket | Male | Female |
| Under 5 Years | 0 (0.0%) | 0 (0.0%) |
| 5 to 17 Years | 0 (0.0%) | 0 (0.0%) |
| 18 to 34 Years | 0 (0.0%) | 0 (0.0%) |
| 35 to 64 Years | 0 (0.0%) | 3 (0.8%) |
| 65 to 74 Years | 7 (9.2%) | 5 (3.5%) |
| 75 Years and over | 73 (83.0%) | 10 (10.1%) |
Disability Class: Vision Difficulty
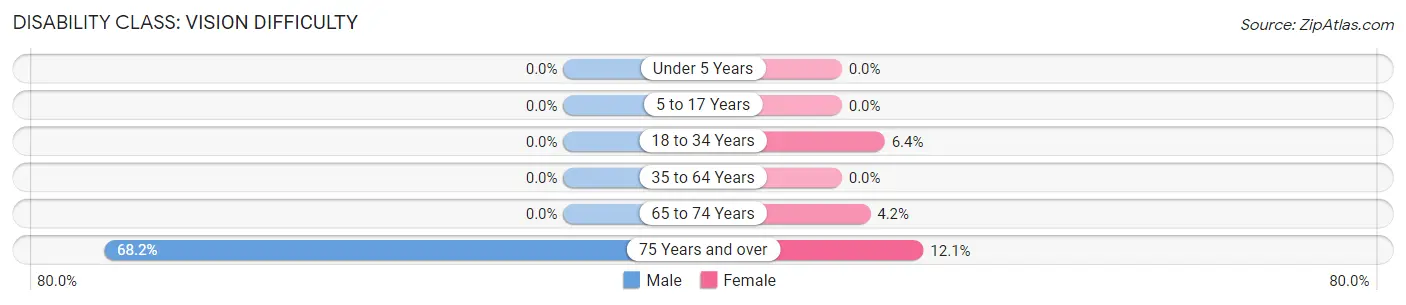
| Age Bracket | Male | Female |
| Under 5 Years | 0 (0.0%) | 0 (0.0%) |
| 5 to 17 Years | 0 (0.0%) | 0 (0.0%) |
| 18 to 34 Years | 0 (0.0%) | 9 (6.4%) |
| 35 to 64 Years | 0 (0.0%) | 0 (0.0%) |
| 65 to 74 Years | 0 (0.0%) | 6 (4.2%) |
| 75 Years and over | 60 (68.2%) | 12 (12.1%) |
Disability Class: Cognitive Difficulty
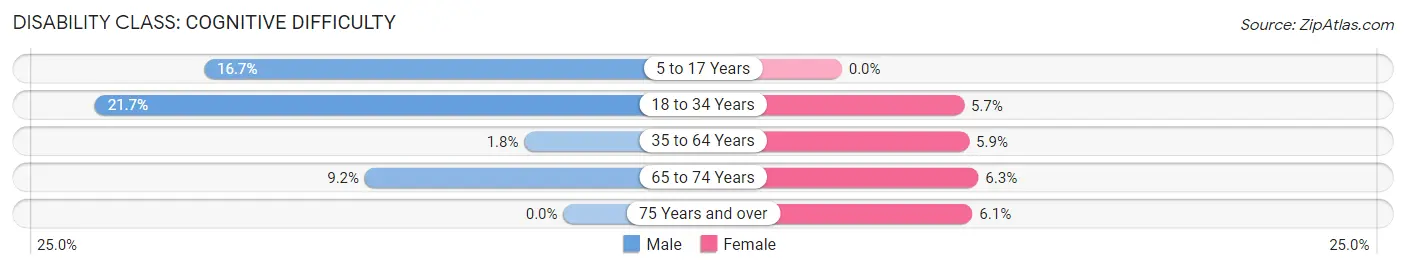
| Age Bracket | Male | Female |
| 5 to 17 Years | 10 (16.7%) | 0 (0.0%) |
| 18 to 34 Years | 50 (21.7%) | 8 (5.7%) |
| 35 to 64 Years | 6 (1.8%) | 22 (5.9%) |
| 65 to 74 Years | 7 (9.2%) | 9 (6.3%) |
| 75 Years and over | 0 (0.0%) | 6 (6.1%) |
Disability Class: Ambulatory Difficulty
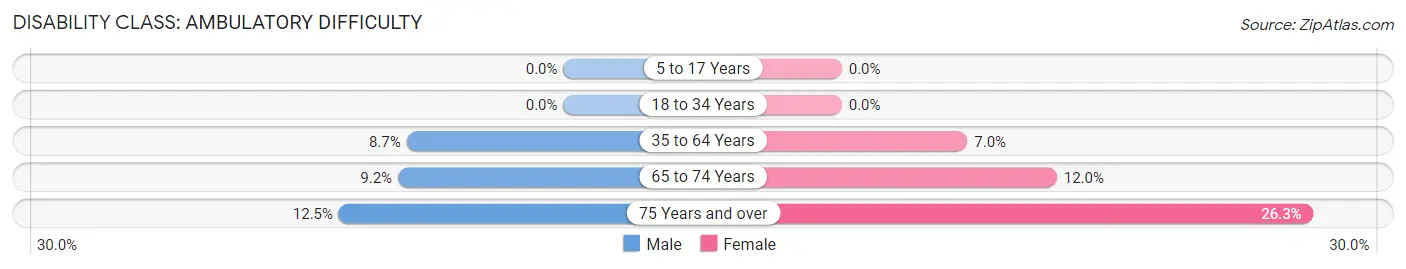
| Age Bracket | Male | Female |
| 5 to 17 Years | 0 (0.0%) | 0 (0.0%) |
| 18 to 34 Years | 0 (0.0%) | 0 (0.0%) |
| 35 to 64 Years | 29 (8.7%) | 26 (7.0%) |
| 65 to 74 Years | 7 (9.2%) | 17 (12.0%) |
| 75 Years and over | 11 (12.5%) | 26 (26.3%) |
Disability Class: Self-Care Difficulty
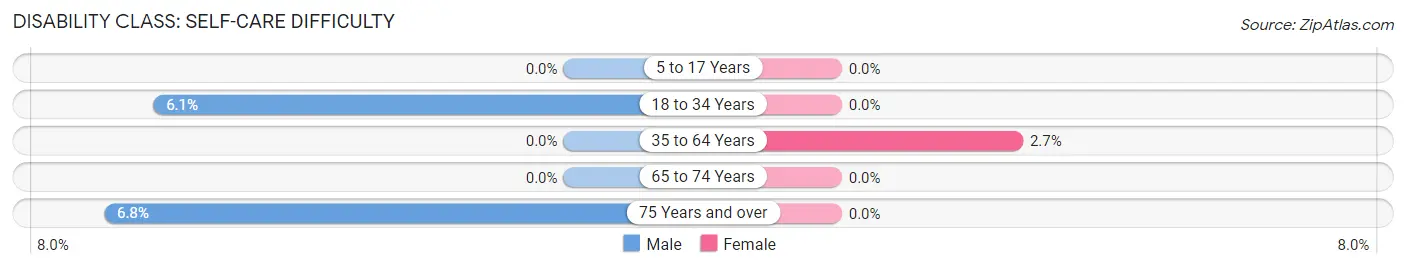
| Age Bracket | Male | Female |
| 5 to 17 Years | 0 (0.0%) | 0 (0.0%) |
| 18 to 34 Years | 14 (6.1%) | 0 (0.0%) |
| 35 to 64 Years | 0 (0.0%) | 10 (2.7%) |
| 65 to 74 Years | 0 (0.0%) | 0 (0.0%) |
| 75 Years and over | 6 (6.8%) | 0 (0.0%) |
Technology Access in Dravosburg borough
Computing Device Access in Dravosburg borough
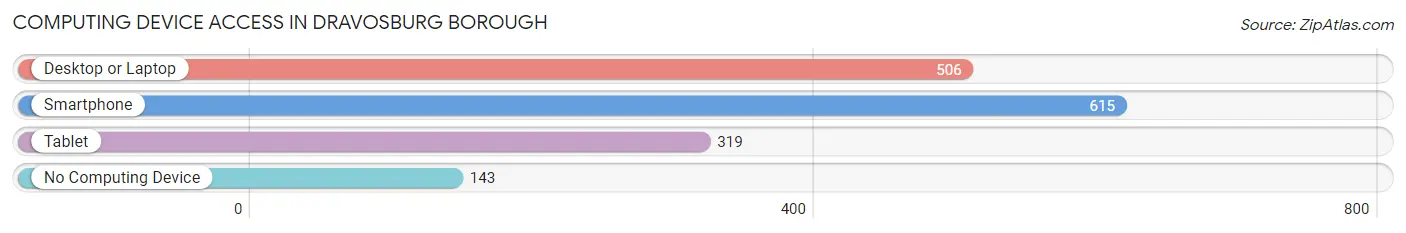
| Device Type | # Households | % Households |
| Desktop or Laptop | 506 | 61.5% |
| Smartphone | 615 | 74.7% |
| Tablet | 319 | 38.8% |
| No Computing Device | 143 | 17.4% |
| Total | 823 | 100.0% |
Internet Access in Dravosburg borough
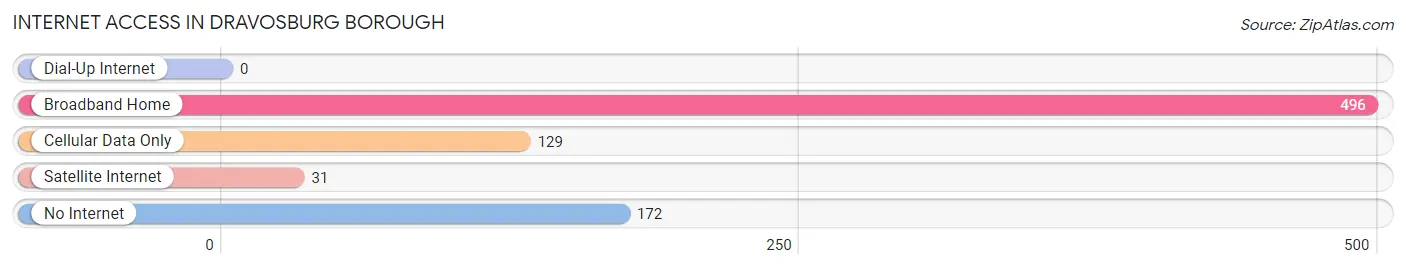
| Internet Type | # Households | % Households |
| Dial-Up Internet | 0 | 0.0% |
| Broadband Home | 496 | 60.3% |
| Cellular Data Only | 129 | 15.7% |
| Satellite Internet | 31 | 3.8% |
| No Internet | 172 | 20.9% |
| Total | 823 | 100.0% |
Dravosburg borough Summary
Dravosburg Borough is a small borough located in Allegheny County, Pennsylvania. It is situated along the Monongahela River, just south of the city of Pittsburgh. The borough was incorporated in 1891 and has a population of 1,845 as of the 2010 census.
History
The area that is now Dravosburg Borough was first settled in the late 1700s by German and Irish immigrants. The first settlers were mostly farmers, and the area was known as “Dravosburg” after the Dravo family, who were among the first settlers. The area was officially incorporated as a borough in 1891.
In the early 1900s, the borough was a thriving industrial center, with several steel mills and other factories located in the area. The steel mills provided employment for many of the residents, and the borough was home to a number of businesses, including a bank, a hotel, and a movie theater.
The steel industry declined in the mid-1900s, and the borough’s economy shifted to a more service-oriented one. The borough is now home to a number of small businesses, including restaurants, retail stores, and professional services.
Geography
Dravosburg Borough is located in Allegheny County, Pennsylvania, along the Monongahela River. The borough is bordered by the city of Pittsburgh to the north, West Mifflin to the east, and McKeesport to the south. The borough covers an area of 1.2 square miles, and has a population density of 1,521 people per square mile.
The borough is located in the Allegheny Plateau region of Pennsylvania, and is characterized by rolling hills and valleys. The borough is home to several parks, including Dravosburg Park, which features a playground, basketball court, and picnic area.
Economy
The economy of Dravosburg Borough is largely service-oriented, with a number of small businesses located in the area. The borough is home to a number of restaurants, retail stores, and professional services. The borough also has a number of manufacturing and industrial businesses, including a steel mill and a chemical plant.
The borough is home to a number of small businesses, including a bank, a hotel, and a movie theater. The borough also has a number of churches, including the Dravosburg United Methodist Church and the Dravosburg Presbyterian Church.
Demographics
As of the 2010 census, the population of Dravosburg Borough was 1,845. The racial makeup of the borough was 94.3% White, 3.2% African American, 0.3% Native American, 0.3% Asian, and 1.9% from other races. The median household income was $37,917, and the median family income was $45,938.
The borough is home to a number of ethnic and religious groups, including Irish, German, and Italian. The borough is also home to a number of churches, including the Dravosburg United Methodist Church and the Dravosburg Presbyterian Church.
Conclusion
Dravosburg Borough is a small borough located in Allegheny County, Pennsylvania. It is situated along the Monongahela River, just south of the city of Pittsburgh. The borough was incorporated in 1891 and has a population of 1,845 as of the 2010 census. The economy of the borough is largely service-oriented, with a number of small businesses located in the area. The borough is home to a number of ethnic and religious groups, including Irish, German, and Italian.
Common Questions
What is Per Capita Income in Dravosburg borough?
Per Capita income in Dravosburg borough is $37,504.
What is the Median Family Income in Dravosburg borough?
Median Family Income in Dravosburg borough is $69,875.
What is the Median Household income in Dravosburg borough?
Median Household Income in Dravosburg borough is $43,208.
What is Income or Wage Gap in Dravosburg borough?
Income or Wage Gap in Dravosburg borough is 33.4%.
Women in Dravosburg borough earn 66.6 cents for every dollar earned by a man.
What is Inequality or Gini Index in Dravosburg borough?
Inequality or Gini Index in Dravosburg borough is 0.51.
What is the Total Population of Dravosburg borough?
Total Population of Dravosburg borough is 1,614.
What is the Total Male Population of Dravosburg borough?
Total Male Population of Dravosburg borough is 797.
What is the Total Female Population of Dravosburg borough?
Total Female Population of Dravosburg borough is 817.
What is the Ratio of Males per 100 Females in Dravosburg borough?
There are 97.55 Males per 100 Females in Dravosburg borough.
What is the Ratio of Females per 100 Males in Dravosburg borough?
There are 102.51 Females per 100 Males in Dravosburg borough.
What is the Median Population Age in Dravosburg borough?
Median Population Age in Dravosburg borough is 47.9 Years.
What is the Average Family Size in Dravosburg borough
Average Family Size in Dravosburg borough is 2.8 People.
What is the Average Household Size in Dravosburg borough
Average Household Size in Dravosburg borough is 2.0 People.
How Large is the Labor Force in Dravosburg borough?
There are 860 People in the Labor Forcein in Dravosburg borough.
What is the Percentage of People in the Labor Force in Dravosburg borough?
57.3% of People are in the Labor Force in Dravosburg borough.
What is the Unemployment Rate in Dravosburg borough?
Unemployment Rate in Dravosburg borough is 6.9%.