Atglen borough, PA Map & Demographics
Atglen borough Overview
$37,191
PER CAPITA INCOME
$99,167
AVG FAMILY INCOME
$86,688
AVG HOUSEHOLD INCOME
40.6%
WAGE / INCOME GAP [ % ]
59.4¢/ $1
WAGE / INCOME GAP [ $ ]
0.44
INEQUALITY / GINI INDEX
1,174
TOTAL POPULATION
588
MALE POPULATION
586
FEMALE POPULATION
100.34
MALES / 100 FEMALES
99.66
FEMALES / 100 MALES
31.4
MEDIAN AGE
3.2
AVG FAMILY SIZE
3.0
AVG HOUSEHOLD SIZE
643
LABOR FORCE [ PEOPLE ]
72.9%
PERCENT IN LABOR FORCE
1.4%
UNEMPLOYMENT RATE
Income in Atglen borough
Income Overview in Atglen borough
Per Capita Income in Atglen borough is $37,191, while median incomes of families and households are $99,167 and $86,688 respectively.
| Characteristic | Number | Measure |
| Per Capita Income | 1,174 | $37,191 |
| Median Family Income | 320 | $99,167 |
| Mean Family Income | 320 | $108,823 |
| Median Household Income | 389 | $86,688 |
| Mean Household Income | 389 | $109,487 |
| Income Deficit | 320 | $0 |
| Wage / Income Gap (%) | 1,174 | 40.64% |
| Wage / Income Gap ($) | 1,174 | 59.36¢ per $1 |
| Gini / Inequality Index | 1,174 | 0.44 |
Earnings by Sex in Atglen borough
Average Earnings in Atglen borough are $43,125, $56,667 for men and $33,636 for women, a difference of 40.6%.
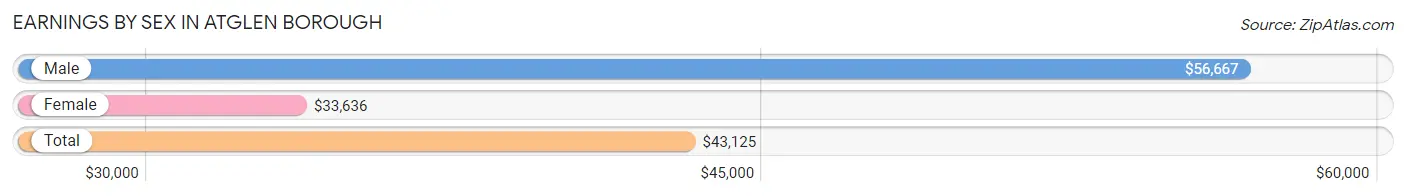
| Sex | Number | Average Earnings |
| Male | 352 (52.2%) | $56,667 |
| Female | 322 (47.8%) | $33,636 |
| Total | 674 (100.0%) | $43,125 |
Earnings by Sex by Income Bracket in Atglen borough
The most common earnings brackets in Atglen borough are $55,000 to $64,999 for men (56 | 15.9%) and $2,499 or less for women (43 | 13.4%).
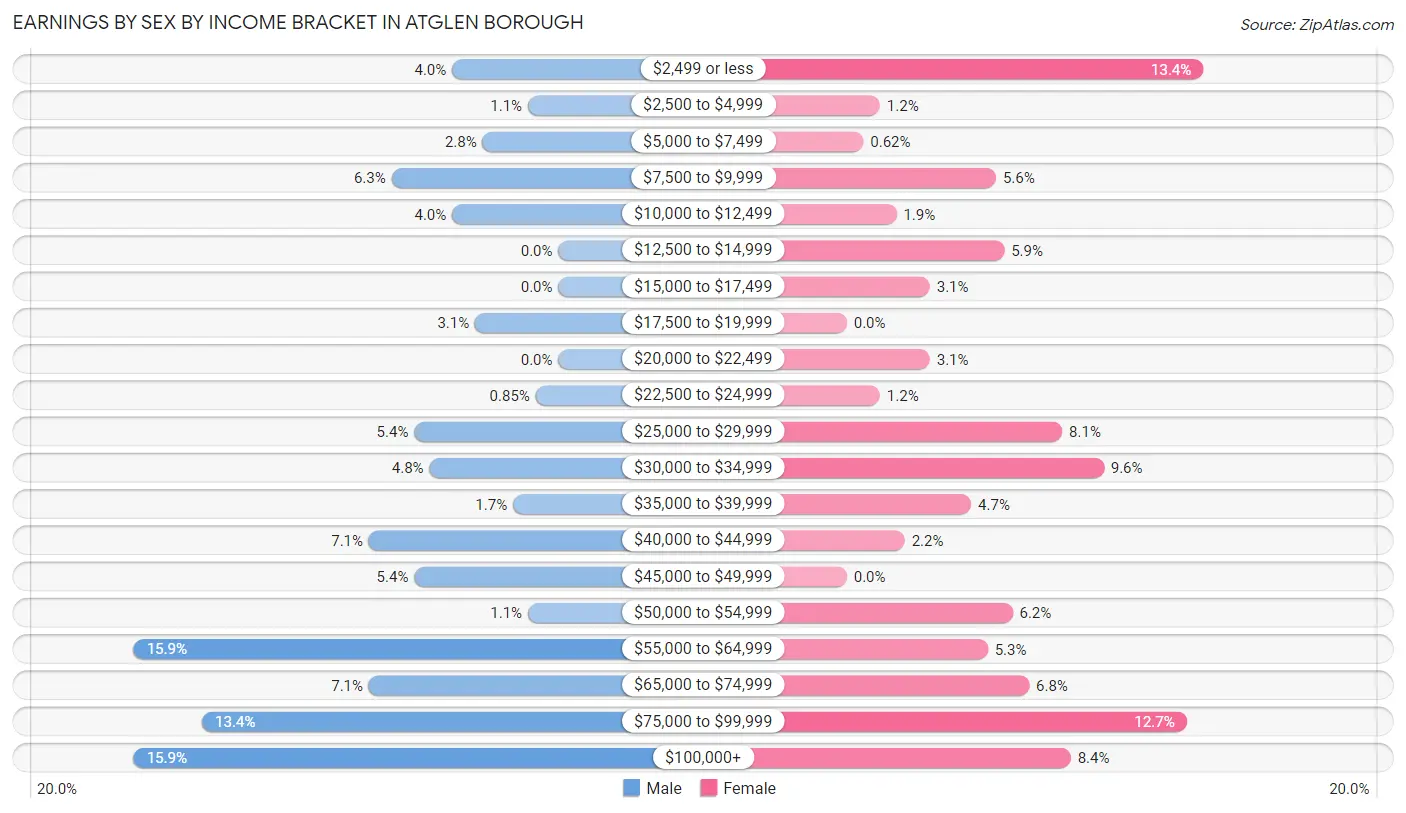
| Income | Male | Female |
| $2,499 or less | 14 (4.0%) | 43 (13.4%) |
| $2,500 to $4,999 | 4 (1.1%) | 4 (1.2%) |
| $5,000 to $7,499 | 10 (2.8%) | 2 (0.6%) |
| $7,500 to $9,999 | 22 (6.2%) | 18 (5.6%) |
| $10,000 to $12,499 | 14 (4.0%) | 6 (1.9%) |
| $12,500 to $14,999 | 0 (0.0%) | 19 (5.9%) |
| $15,000 to $17,499 | 0 (0.0%) | 10 (3.1%) |
| $17,500 to $19,999 | 11 (3.1%) | 0 (0.0%) |
| $20,000 to $22,499 | 0 (0.0%) | 10 (3.1%) |
| $22,500 to $24,999 | 3 (0.9%) | 4 (1.2%) |
| $25,000 to $29,999 | 19 (5.4%) | 26 (8.1%) |
| $30,000 to $34,999 | 17 (4.8%) | 31 (9.6%) |
| $35,000 to $39,999 | 6 (1.7%) | 15 (4.7%) |
| $40,000 to $44,999 | 25 (7.1%) | 7 (2.2%) |
| $45,000 to $49,999 | 19 (5.4%) | 0 (0.0%) |
| $50,000 to $54,999 | 4 (1.1%) | 20 (6.2%) |
| $55,000 to $64,999 | 56 (15.9%) | 17 (5.3%) |
| $65,000 to $74,999 | 25 (7.1%) | 22 (6.8%) |
| $75,000 to $99,999 | 47 (13.4%) | 41 (12.7%) |
| $100,000+ | 56 (15.9%) | 27 (8.4%) |
| Total | 352 (100.0%) | 322 (100.0%) |
Earnings by Sex by Educational Attainment in Atglen borough
Average earnings in Atglen borough are $63,958 for men and $39,107 for women, a difference of 38.9%. Men with an educational attainment of graduate degree enjoy the highest average annual earnings of $76,250, while those with bachelor's degree education earn the least with $58,750. Women with an educational attainment of bachelor's degree earn the most with the average annual earnings of $54,375, while those with high school diploma education have the smallest earnings of $29,821.
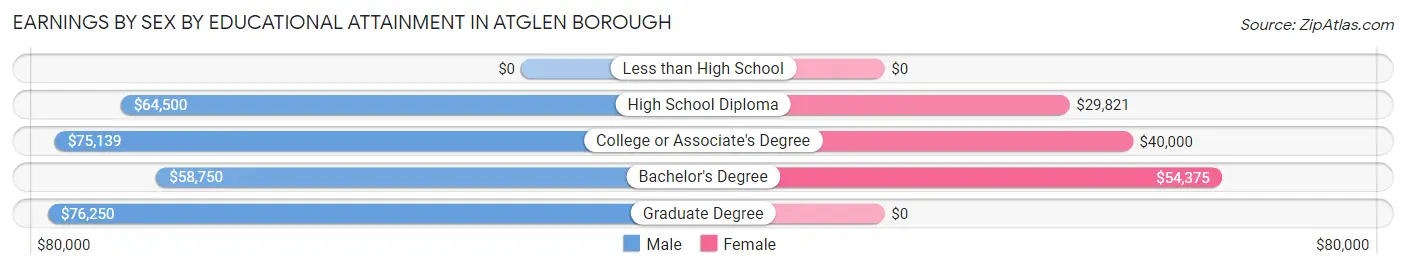
| Educational Attainment | Male Income | Female Income |
| Less than High School | - | - |
| High School Diploma | $64,500 | $29,821 |
| College or Associate's Degree | $75,139 | $40,000 |
| Bachelor's Degree | $58,750 | $54,375 |
| Graduate Degree | $76,250 | $0 |
| Total | $63,958 | $39,107 |
Family Income in Atglen borough
Family Income Brackets in Atglen borough
According to the Atglen borough family income data, there are 78 families falling into the $150,000 to $199,999 income range, which is the most common income bracket and makes up 24.4% of all families. Conversely, the $15,000 to $24,999 income bracket is the least frequent group with only 3 families (0.9%) belonging to this category.
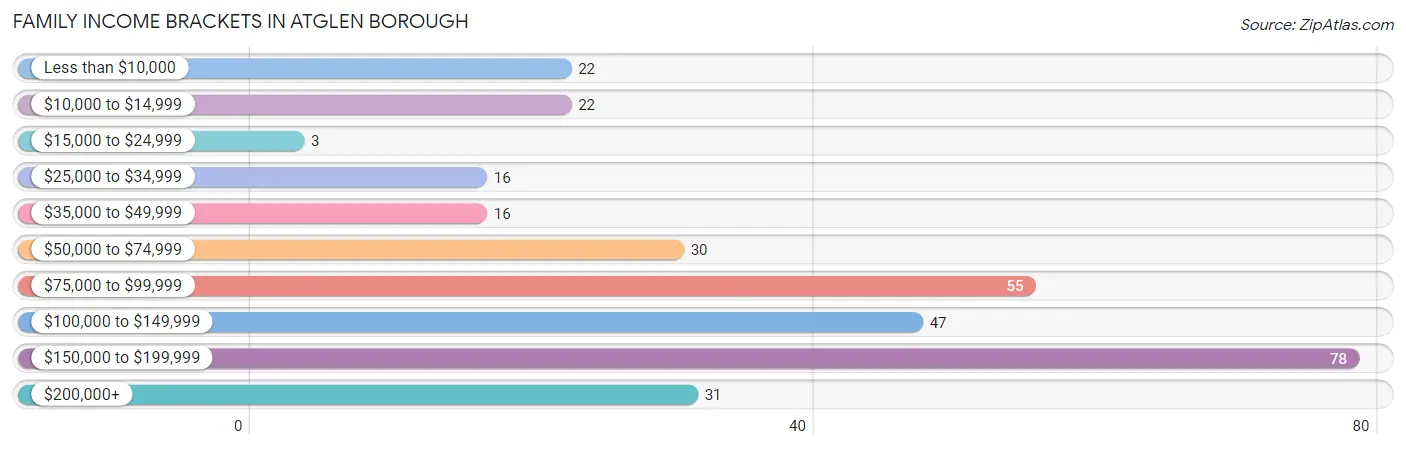
| Income Bracket | # Families | % Families |
| Less than $10,000 | 22 | 6.9% |
| $10,000 to $14,999 | 22 | 6.9% |
| $15,000 to $24,999 | 3 | 0.9% |
| $25,000 to $34,999 | 16 | 5.0% |
| $35,000 to $49,999 | 16 | 5.0% |
| $50,000 to $74,999 | 30 | 9.4% |
| $75,000 to $99,999 | 55 | 17.2% |
| $100,000 to $149,999 | 47 | 14.7% |
| $150,000 to $199,999 | 78 | 24.4% |
| $200,000+ | 31 | 9.7% |
Family Income by Famaliy Size in Atglen borough
4-person families (74 | 23.1%) account for the highest median family income in Atglen borough with $161,944 per family, while 4-person families (74 | 23.1%) have the highest median income of $40,486 per family member.
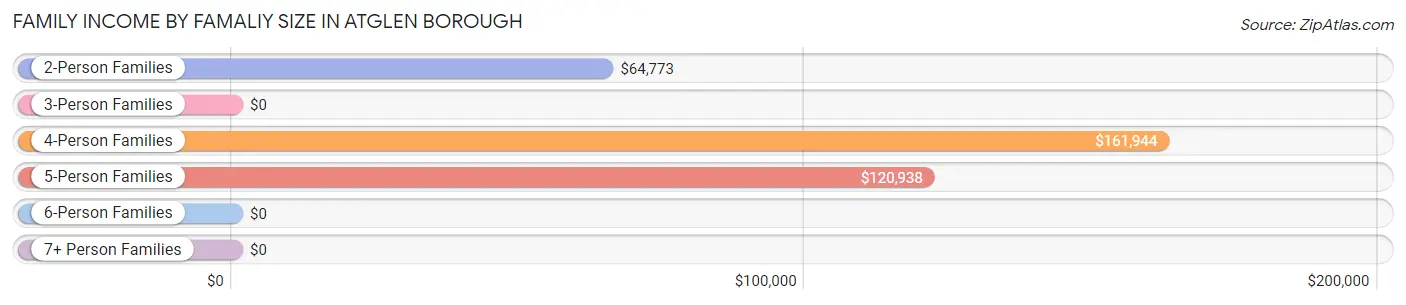
| Income Bracket | # Families | Median Income |
| 2-Person Families | 138 (43.1%) | $64,773 |
| 3-Person Families | 74 (23.1%) | $0 |
| 4-Person Families | 74 (23.1%) | $161,944 |
| 5-Person Families | 21 (6.6%) | $120,938 |
| 6-Person Families | 10 (3.1%) | $0 |
| 7+ Person Families | 3 (0.9%) | $0 |
| Total | 320 (100.0%) | $99,167 |
Family Income by Number of Earners in Atglen borough
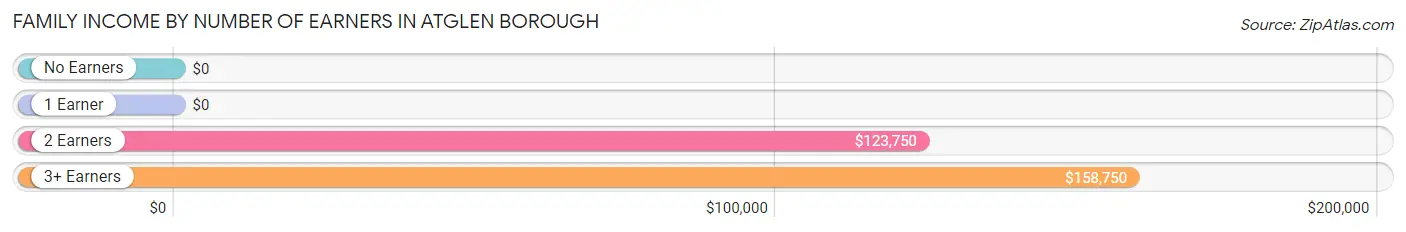
| Number of Earners | # Families | Median Income |
| No Earners | 40 (12.5%) | $0 |
| 1 Earner | 69 (21.6%) | $0 |
| 2 Earners | 149 (46.6%) | $123,750 |
| 3+ Earners | 62 (19.4%) | $158,750 |
| Total | 320 (100.0%) | $99,167 |
Household Income in Atglen borough
Household Income Brackets in Atglen borough
With 78 households falling in the category, the $150,000 to $199,999 income range is the most frequent in Atglen borough, accounting for 20.1% of all households. In contrast, only 14 households (3.6%) fall into the less than $10,000 income bracket, making it the least populous group.
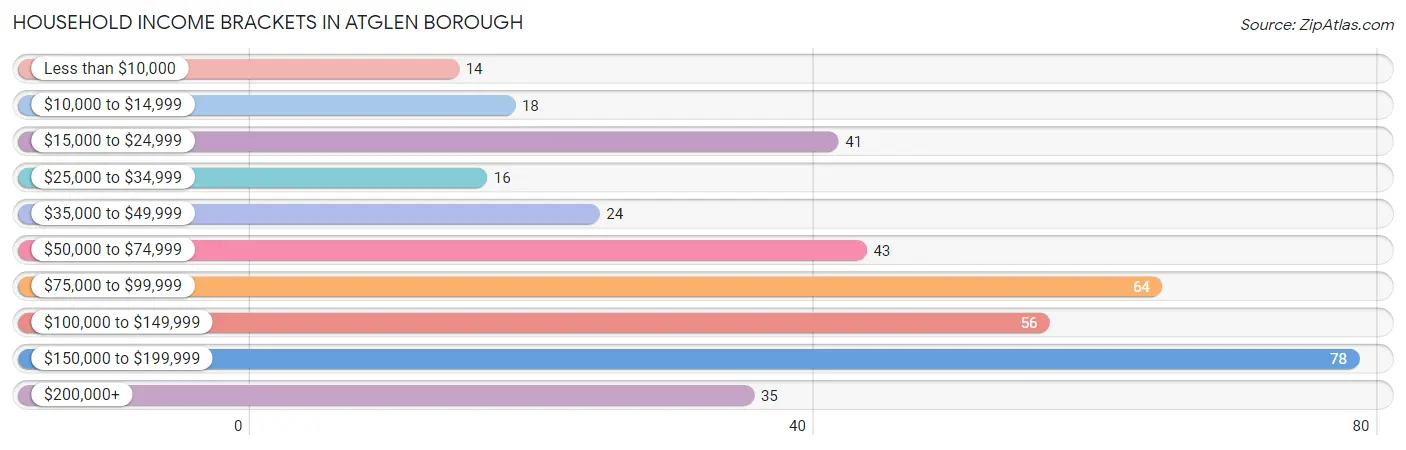
| Income Bracket | # Households | % Households |
| Less than $10,000 | 14 | 3.6% |
| $10,000 to $14,999 | 18 | 4.6% |
| $15,000 to $24,999 | 41 | 10.5% |
| $25,000 to $34,999 | 16 | 4.1% |
| $35,000 to $49,999 | 24 | 6.2% |
| $50,000 to $74,999 | 43 | 11.1% |
| $75,000 to $99,999 | 64 | 16.5% |
| $100,000 to $149,999 | 56 | 14.4% |
| $150,000 to $199,999 | 78 | 20.1% |
| $200,000+ | 35 | 9.0% |
Household Income by Householder Age in Atglen borough
The median household income in Atglen borough is $86,688, with the highest median household income of $111,406 found in the 45 to 64 years age bracket for the primary householder. A total of 173 households (44.5%) fall into this category. Meanwhile, the 15 to 24 years age bracket for the primary householder has the lowest median household income of $0, with 20 households (5.1%) in this group.
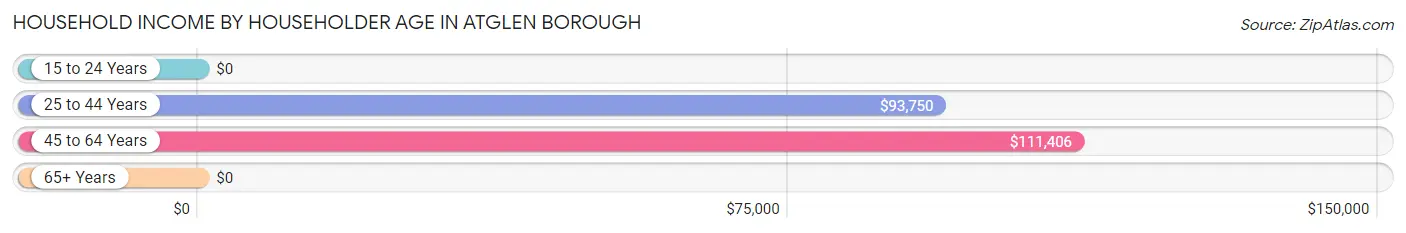
| Income Bracket | # Households | Median Income |
| 15 to 24 Years | 20 (5.1%) | $0 |
| 25 to 44 Years | 128 (32.9%) | $93,750 |
| 45 to 64 Years | 173 (44.5%) | $111,406 |
| 65+ Years | 68 (17.5%) | $0 |
| Total | 389 (100.0%) | $86,688 |
Poverty in Atglen borough
Income Below Poverty by Sex and Age in Atglen borough
With 10.9% poverty level for males and 21.0% for females among the residents of Atglen borough, 75 year old and over males and under 5 year old females are the most vulnerable to poverty, with 12 males (41.4%) and 37 females (78.7%) in their respective age groups living below the poverty level.
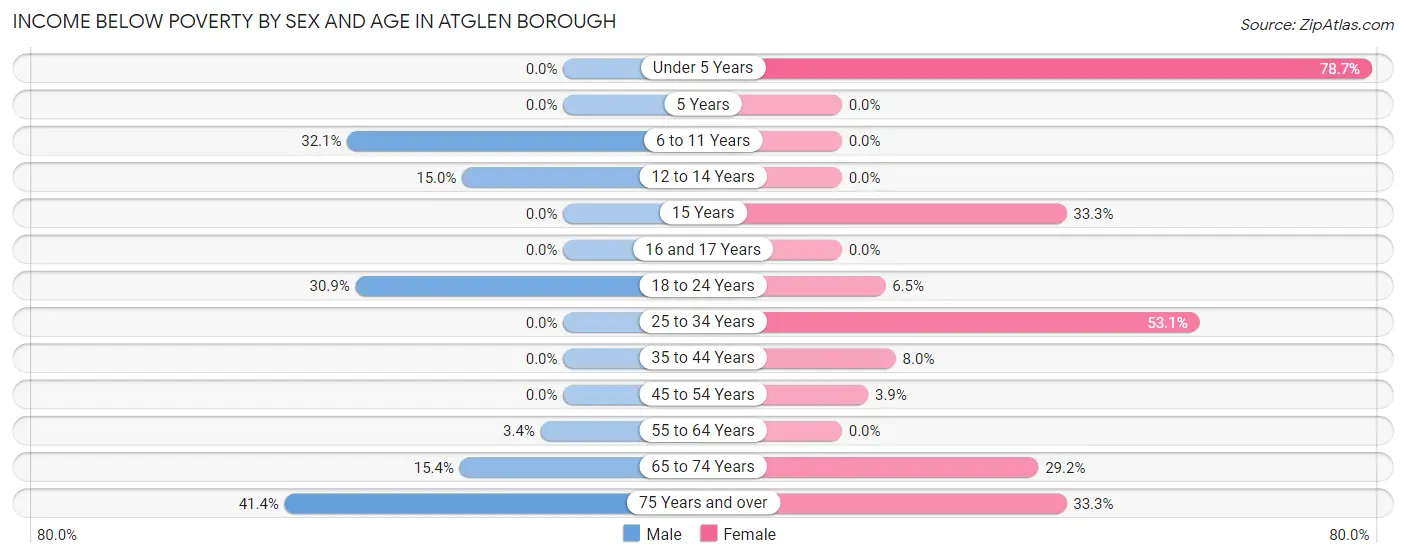
| Age Bracket | Male | Female |
| Under 5 Years | 0 (0.0%) | 37 (78.7%) |
| 5 Years | 0 (0.0%) | 0 (0.0%) |
| 6 to 11 Years | 17 (32.1%) | 0 (0.0%) |
| 12 to 14 Years | 3 (15.0%) | 0 (0.0%) |
| 15 Years | 0 (0.0%) | 7 (33.3%) |
| 16 and 17 Years | 0 (0.0%) | 0 (0.0%) |
| 18 to 24 Years | 25 (30.9%) | 4 (6.5%) |
| 25 to 34 Years | 0 (0.0%) | 51 (53.1%) |
| 35 to 44 Years | 0 (0.0%) | 4 (8.0%) |
| 45 to 54 Years | 0 (0.0%) | 3 (3.9%) |
| 55 to 64 Years | 3 (3.4%) | 0 (0.0%) |
| 65 to 74 Years | 4 (15.4%) | 7 (29.2%) |
| 75 Years and over | 12 (41.4%) | 10 (33.3%) |
| Total | 64 (10.9%) | 123 (21.0%) |
Income Above Poverty by Sex and Age in Atglen borough
According to the poverty statistics in Atglen borough, males aged under 5 years and females aged 6 to 11 years are the age groups that are most secure financially, with 100.0% of males and 100.0% of females in these age groups living above the poverty line.
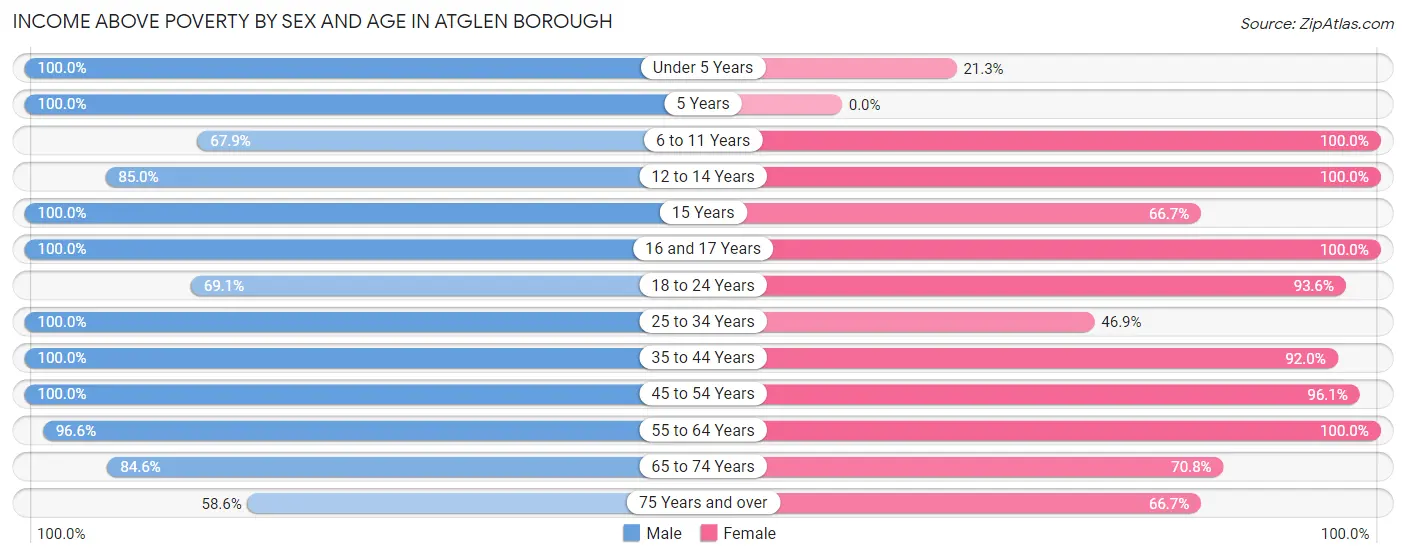
| Age Bracket | Male | Female |
| Under 5 Years | 61 (100.0%) | 10 (21.3%) |
| 5 Years | 4 (100.0%) | 0 (0.0%) |
| 6 to 11 Years | 36 (67.9%) | 64 (100.0%) |
| 12 to 14 Years | 17 (85.0%) | 14 (100.0%) |
| 15 Years | 8 (100.0%) | 14 (66.7%) |
| 16 and 17 Years | 15 (100.0%) | 9 (100.0%) |
| 18 to 24 Years | 56 (69.1%) | 58 (93.5%) |
| 25 to 34 Years | 80 (100.0%) | 45 (46.9%) |
| 35 to 44 Years | 45 (100.0%) | 46 (92.0%) |
| 45 to 54 Years | 77 (100.0%) | 74 (96.1%) |
| 55 to 64 Years | 86 (96.6%) | 92 (100.0%) |
| 65 to 74 Years | 22 (84.6%) | 17 (70.8%) |
| 75 Years and over | 17 (58.6%) | 20 (66.7%) |
| Total | 524 (89.1%) | 463 (79.0%) |
Income Below Poverty Among Married-Couple Families in Atglen borough
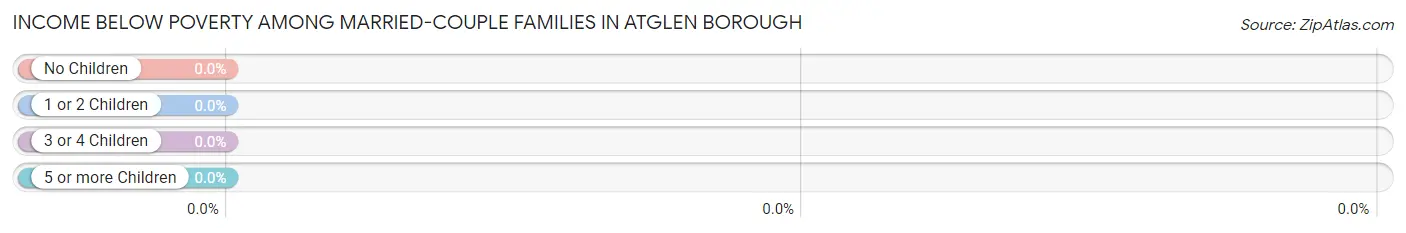
| Children | Above Poverty | Below Poverty |
| No Children | 120 (100.0%) | 0 (0.0%) |
| 1 or 2 Children | 69 (100.0%) | 0 (0.0%) |
| 3 or 4 Children | 22 (100.0%) | 0 (0.0%) |
| 5 or more Children | 0 (0.0%) | 0 (0.0%) |
| Total | 211 (100.0%) | 0 (0.0%) |
Income Below Poverty Among Single-Parent Households in Atglen borough
According to the poverty data in Atglen borough, 9.5% or 4 single-father households and 64.2% or 43 single-mother households are living below the poverty line. Among single-father households, those with 1 or 2 children have the highest poverty rate, with 4 households (12.5%) experiencing poverty. Likewise, among single-mother households, those with 1 or 2 children have the highest poverty rate, with 43 households (79.6%) falling below the poverty line.
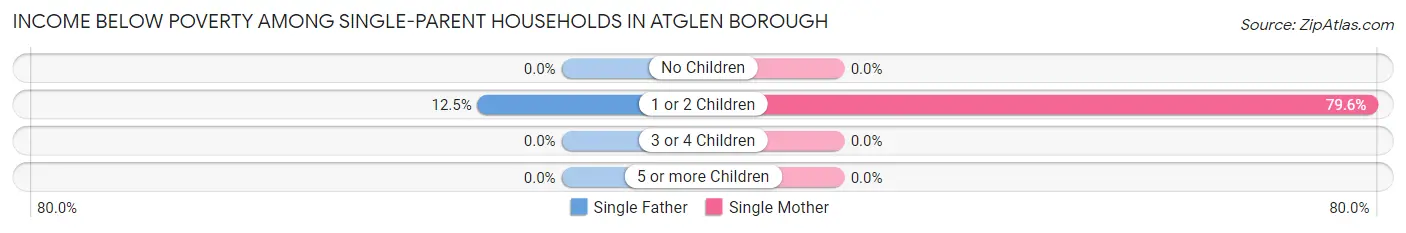
| Children | Single Father | Single Mother |
| No Children | 0 (0.0%) | 0 (0.0%) |
| 1 or 2 Children | 4 (12.5%) | 43 (79.6%) |
| 3 or 4 Children | 0 (0.0%) | 0 (0.0%) |
| 5 or more Children | 0 (0.0%) | 0 (0.0%) |
| Total | 4 (9.5%) | 43 (64.2%) |
Income Below Poverty Among Married-Couple vs Single-Parent Households in Atglen borough
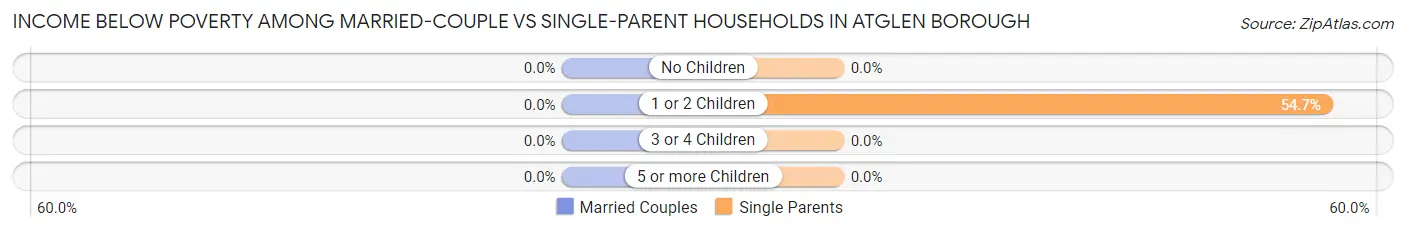
| Children | Married-Couple Families | Single-Parent Households |
| No Children | 0 (0.0%) | 0 (0.0%) |
| 1 or 2 Children | 0 (0.0%) | 47 (54.6%) |
| 3 or 4 Children | 0 (0.0%) | 0 (0.0%) |
| 5 or more Children | 0 (0.0%) | 0 (0.0%) |
| Total | 0 (0.0%) | 47 (43.1%) |
Race in Atglen borough
The most populous races in Atglen borough are White / Caucasian (1,005 | 85.6%), Hispanic or Latino (157 | 13.4%), and Black / African American (100 | 8.5%).
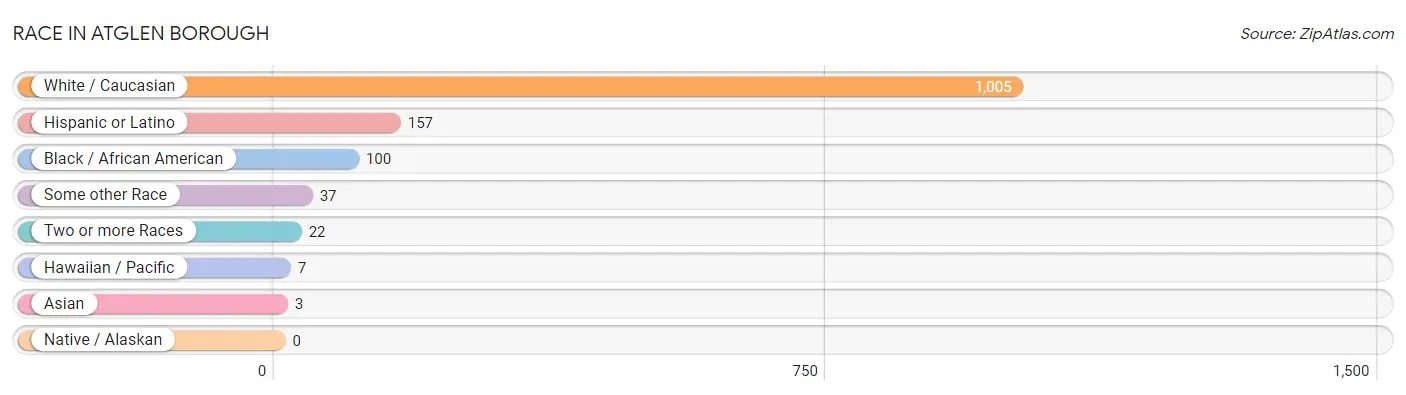
| Race | # Population | % Population |
| Asian | 3 | 0.3% |
| Black / African American | 100 | 8.5% |
| Hawaiian / Pacific | 7 | 0.6% |
| Hispanic or Latino | 157 | 13.4% |
| Native / Alaskan | 0 | 0.0% |
| White / Caucasian | 1,005 | 85.6% |
| Two or more Races | 22 | 1.9% |
| Some other Race | 37 | 3.2% |
| Total | 1,174 | 100.0% |
Ancestry in Atglen borough
The most populous ancestries reported in Atglen borough are German (324 | 27.6%), Irish (323 | 27.5%), Italian (144 | 12.3%), English (105 | 8.9%), and Mexican (85 | 7.2%), together accounting for 83.6% of all Atglen borough residents.
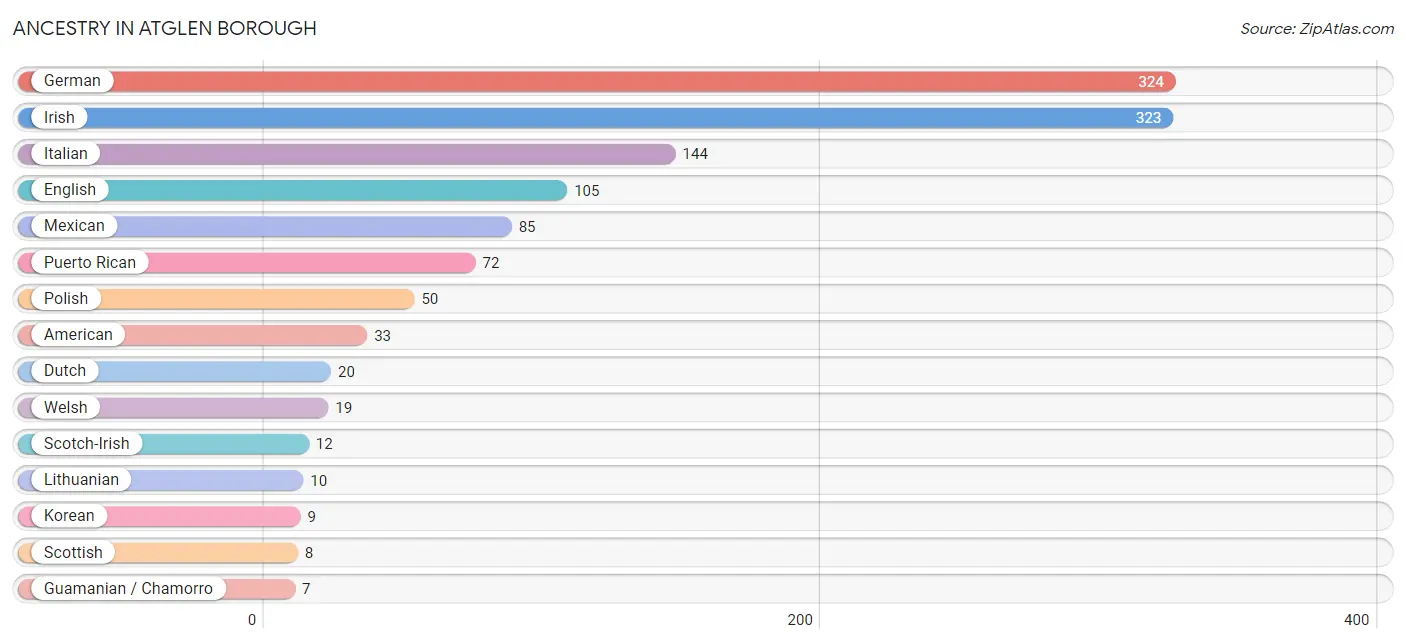
| Ancestry | # Population | % Population |
| American | 33 | 2.8% |
| Dutch | 20 | 1.7% |
| English | 105 | 8.9% |
| European | 3 | 0.3% |
| French | 4 | 0.3% |
| French Canadian | 4 | 0.3% |
| German | 324 | 27.6% |
| Guamanian / Chamorro | 7 | 0.6% |
| Hungarian | 2 | 0.2% |
| Irish | 323 | 27.5% |
| Italian | 144 | 12.3% |
| Korean | 9 | 0.8% |
| Lithuanian | 10 | 0.9% |
| Mexican | 85 | 7.2% |
| Polish | 50 | 4.3% |
| Puerto Rican | 72 | 6.1% |
| Scotch-Irish | 12 | 1.0% |
| Scottish | 8 | 0.7% |
| Slovak | 4 | 0.3% |
| Swedish | 7 | 0.6% |
| Swiss | 4 | 0.3% |
| Welsh | 19 | 1.6% | View All 22 Rows |
Immigrants in Atglen borough
The most numerous immigrant groups reported in Atglen borough came from Central America (20 | 1.7%), Latin America (20 | 1.7%), and Mexico (20 | 1.7%), together accounting for 5.1% of all Atglen borough residents.
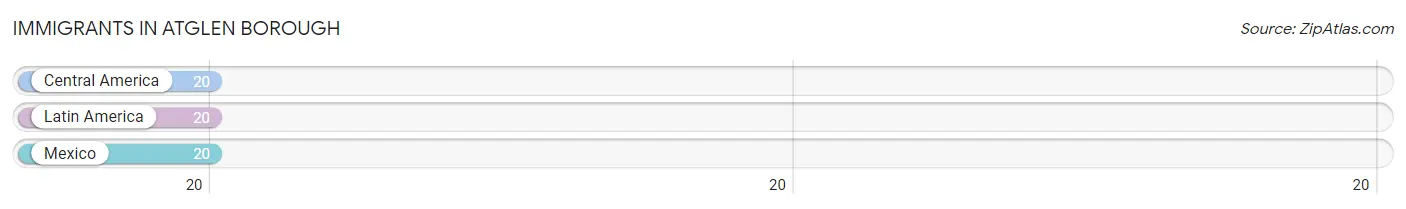
| Immigration Origin | # Population | % Population |
| Central America | 20 | 1.7% |
| Latin America | 20 | 1.7% |
| Mexico | 20 | 1.7% | View All 3 Rows |
Sex and Age in Atglen borough
Sex and Age in Atglen borough
The most populous age groups in Atglen borough are 20 to 24 Years (62 | 10.5%) for men and 25 to 29 Years (70 | 11.9%) for women.
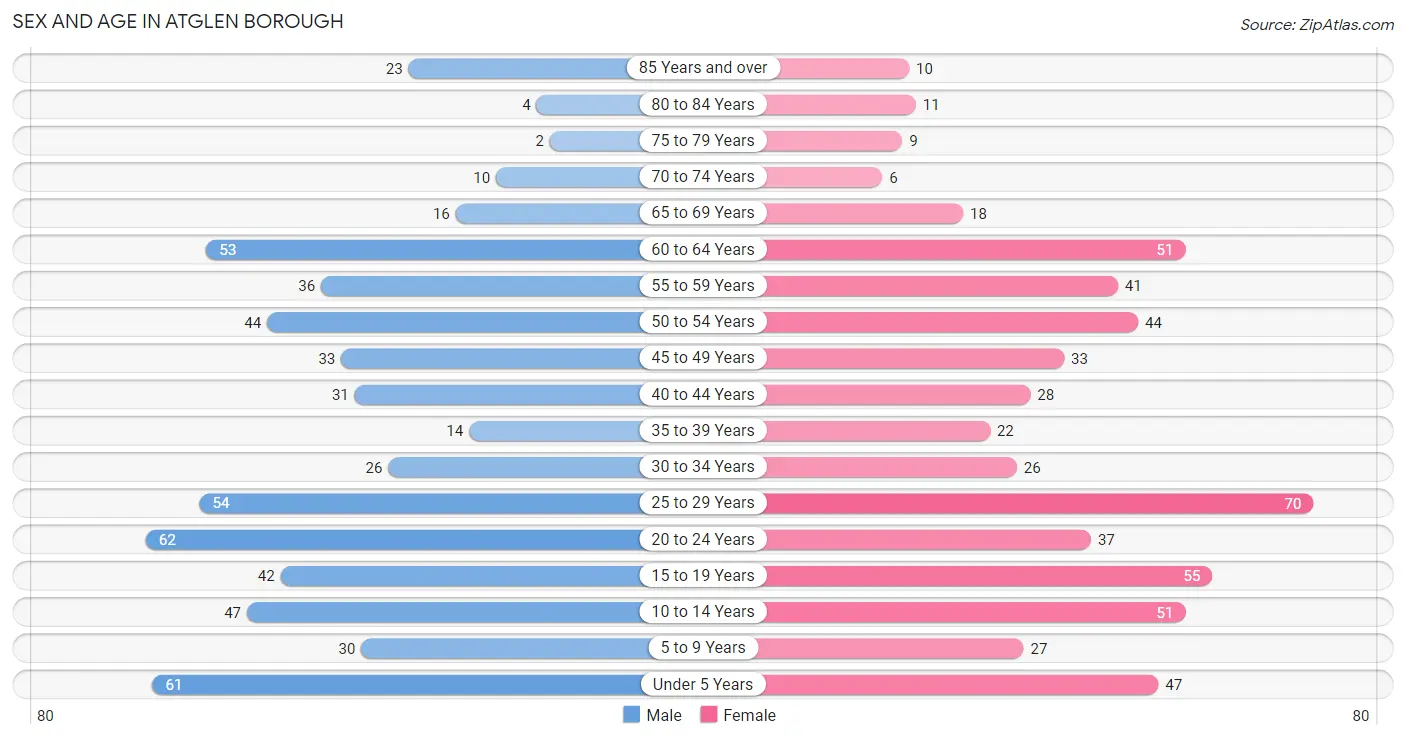
| Age Bracket | Male | Female |
| Under 5 Years | 61 (10.4%) | 47 (8.0%) |
| 5 to 9 Years | 30 (5.1%) | 27 (4.6%) |
| 10 to 14 Years | 47 (8.0%) | 51 (8.7%) |
| 15 to 19 Years | 42 (7.1%) | 55 (9.4%) |
| 20 to 24 Years | 62 (10.5%) | 37 (6.3%) |
| 25 to 29 Years | 54 (9.2%) | 70 (11.9%) |
| 30 to 34 Years | 26 (4.4%) | 26 (4.4%) |
| 35 to 39 Years | 14 (2.4%) | 22 (3.7%) |
| 40 to 44 Years | 31 (5.3%) | 28 (4.8%) |
| 45 to 49 Years | 33 (5.6%) | 33 (5.6%) |
| 50 to 54 Years | 44 (7.5%) | 44 (7.5%) |
| 55 to 59 Years | 36 (6.1%) | 41 (7.0%) |
| 60 to 64 Years | 53 (9.0%) | 51 (8.7%) |
| 65 to 69 Years | 16 (2.7%) | 18 (3.1%) |
| 70 to 74 Years | 10 (1.7%) | 6 (1.0%) |
| 75 to 79 Years | 2 (0.3%) | 9 (1.5%) |
| 80 to 84 Years | 4 (0.7%) | 11 (1.9%) |
| 85 Years and over | 23 (3.9%) | 10 (1.7%) |
| Total | 588 (100.0%) | 586 (100.0%) |
Families and Households in Atglen borough
Median Family Size in Atglen borough
The median family size in Atglen borough is 3.24 persons per family, with married-couple families (211 | 65.9%) accounting for the largest median family size of 3.55 persons per family. On the other hand, single female/mother families (67 | 20.9%) represent the smallest median family size with 2.55 persons per family.
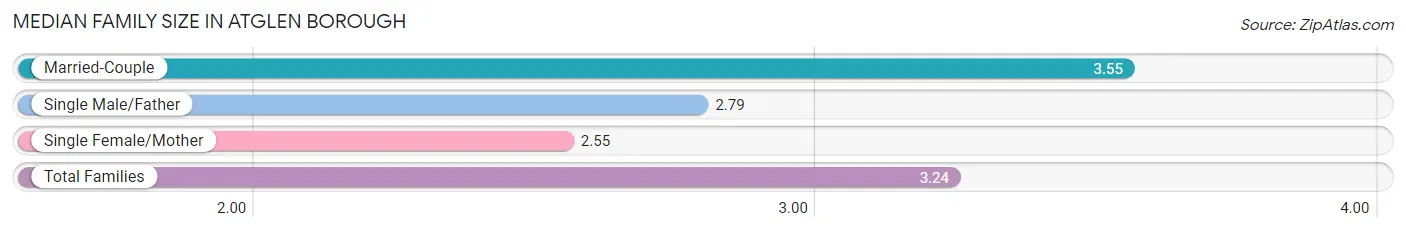
| Family Type | # Families | Family Size |
| Married-Couple | 211 (65.9%) | 3.55 |
| Single Male/Father | 42 (13.1%) | 2.79 |
| Single Female/Mother | 67 (20.9%) | 2.55 |
| Total Families | 320 (100.0%) | 3.24 |
Median Household Size in Atglen borough
The median household size in Atglen borough is 3.02 persons per household, with married-couple households (211 | 54.2%) accounting for the largest median household size of 3.55 persons per household. non-family households (69 | 17.7%) represent the smallest median household size with 1.17 persons per household.
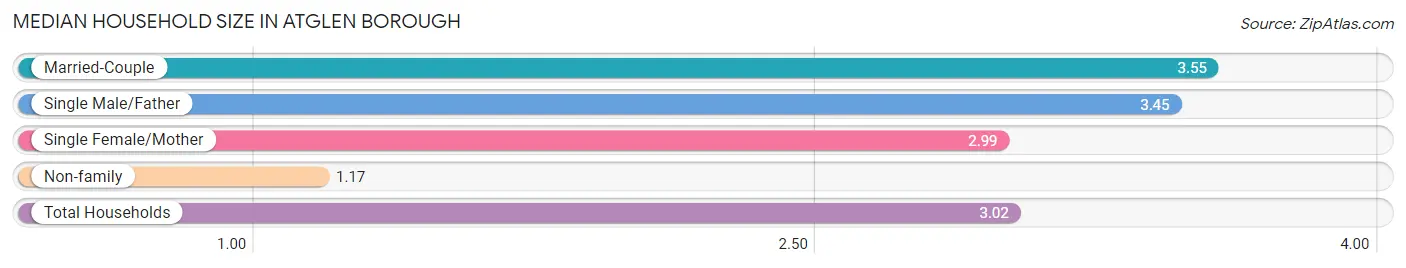
| Household Type | # Households | Household Size |
| Married-Couple | 211 (54.2%) | 3.55 |
| Single Male/Father | 42 (10.8%) | 3.45 |
| Single Female/Mother | 67 (17.2%) | 2.99 |
| Non-family | 69 (17.7%) | 1.17 |
| Total Households | 389 (100.0%) | 3.02 |
Household Size by Marriage Status in Atglen borough
Out of a total of 389 households in Atglen borough, 320 (82.3%) are family households, while 69 (17.7%) are nonfamily households. The most numerous type of family households are 2-person households, comprising 111, and the most common type of nonfamily households are 1-person households, comprising 59.
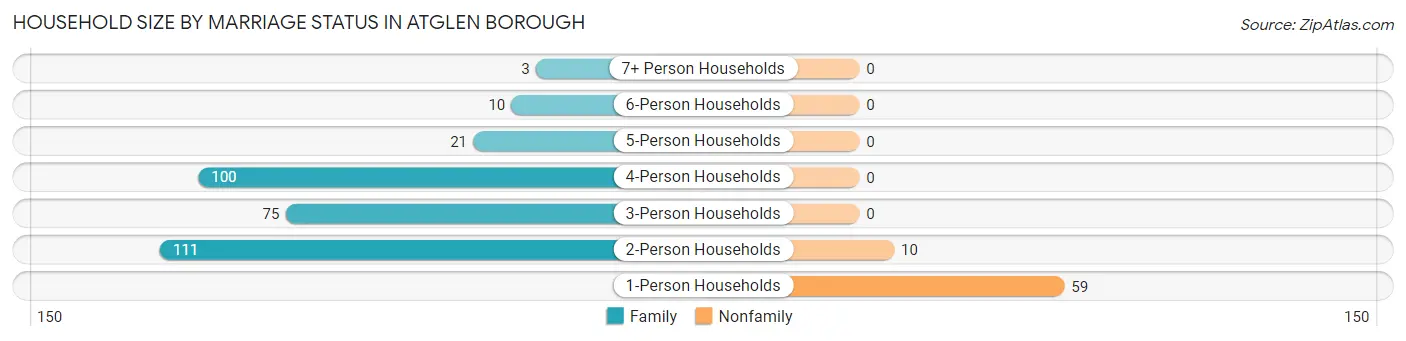
| Household Size | Family Households | Nonfamily Households |
| 1-Person Households | - | 59 (15.2%) |
| 2-Person Households | 111 (28.5%) | 10 (2.6%) |
| 3-Person Households | 75 (19.3%) | 0 (0.0%) |
| 4-Person Households | 100 (25.7%) | 0 (0.0%) |
| 5-Person Households | 21 (5.4%) | 0 (0.0%) |
| 6-Person Households | 10 (2.6%) | 0 (0.0%) |
| 7+ Person Households | 3 (0.8%) | 0 (0.0%) |
| Total | 320 (82.3%) | 69 (17.7%) |
Female Fertility in Atglen borough
Fertility by Age in Atglen borough
Average fertility rate in Atglen borough is 103.0 births per 1,000 women. Women in the age bracket of 20 to 34 years have the highest fertility rate with 218.0 births per 1,000 women. Women in the age bracket of 20 to 34 years acount for 100.0% of all women with births.
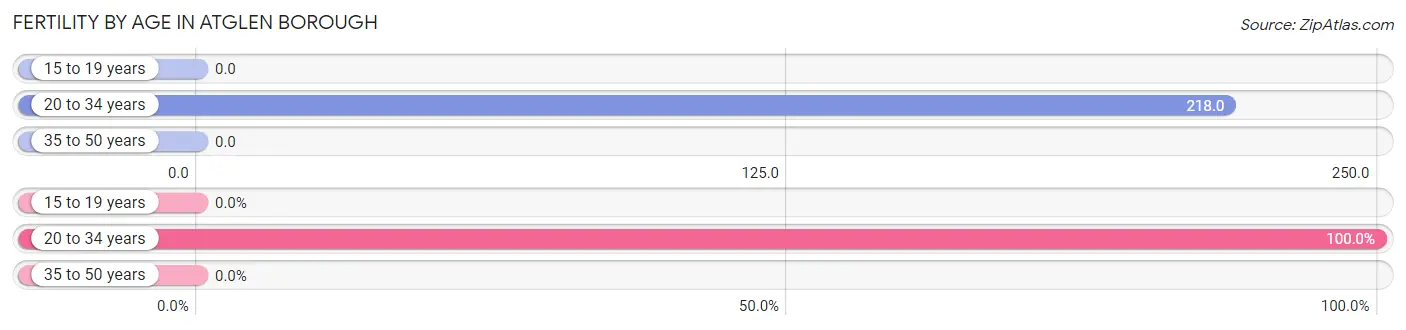
| Age Bracket | Women with Births | Births / 1,000 Women |
| 15 to 19 years | 0 (0.0%) | 0.0 |
| 20 to 34 years | 29 (100.0%) | 218.0 |
| 35 to 50 years | 0 (0.0%) | 0.0 |
| Total | 29 (100.0%) | 103.0 |
Fertility by Age by Marriage Status in Atglen borough
34.5% of women with births (29) in Atglen borough are married. The highest percentage of unmarried women with births falls into 20 to 34 years age bracket with 65.5% of them unmarried at the time of birth, while the lowest percentage of unmarried women with births belong to 20 to 34 years age bracket with 65.5% of them unmarried.
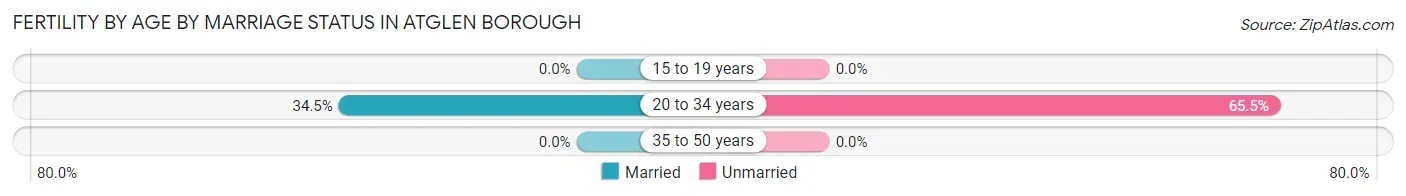
| Age Bracket | Married | Unmarried |
| 15 to 19 years | 0 (0.0%) | 0 (0.0%) |
| 20 to 34 years | 10 (34.5%) | 19 (65.5%) |
| 35 to 50 years | 0 (0.0%) | 0 (0.0%) |
| Total | 10 (34.5%) | 19 (65.5%) |
Fertility by Education in Atglen borough
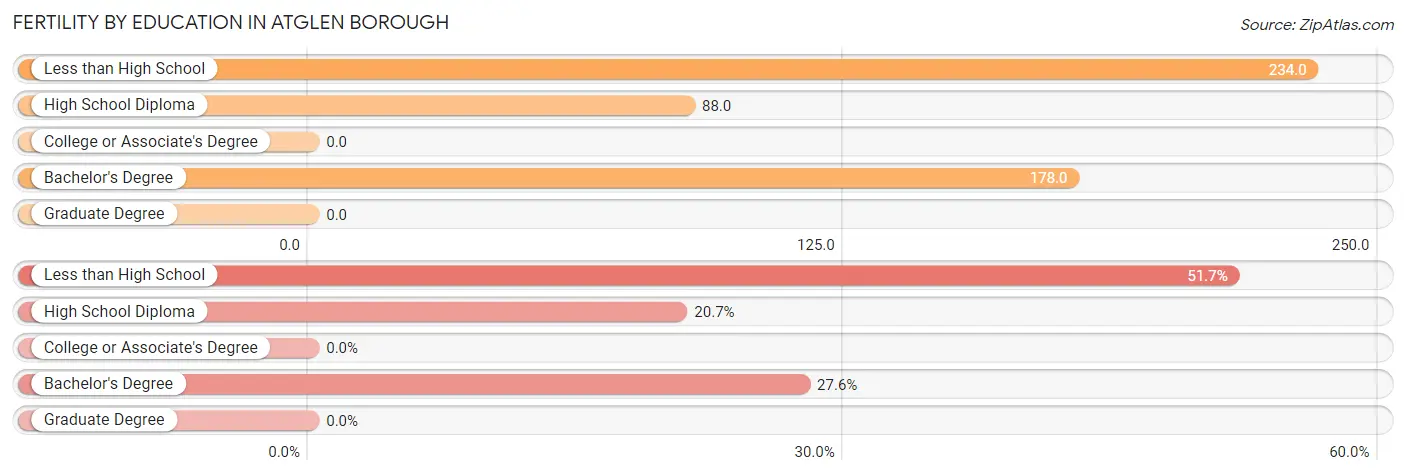
| Educational Attainment | Women with Births | Births / 1,000 Women |
| Less than High School | 15 (51.7%) | 234.0 |
| High School Diploma | 6 (20.7%) | 88.0 |
| College or Associate's Degree | 0 (0.0%) | 0.0 |
| Bachelor's Degree | 8 (27.6%) | 178.0 |
| Graduate Degree | 0 (0.0%) | 0.0 |
| Total | 29 (100.0%) | 103.0 |
Fertility by Education by Marriage Status in Atglen borough
65.5% of women with births in Atglen borough are unmarried. Women with the educational attainment of high school diploma are most likely to be married with 100.0% of them married at childbirth, while women with the educational attainment of less than high school are least likely to be married with 100.0% of them unmarried at childbirth.
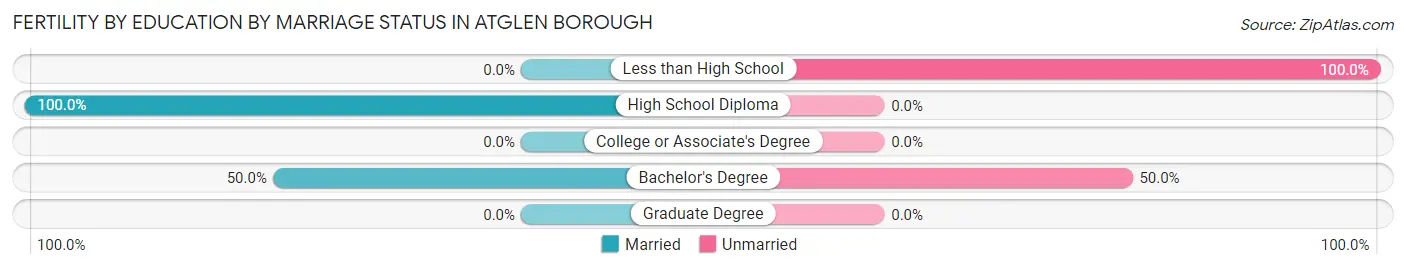
| Educational Attainment | Married | Unmarried |
| Less than High School | 0 (0.0%) | 15 (100.0%) |
| High School Diploma | 6 (100.0%) | 0 (0.0%) |
| College or Associate's Degree | 0 (0.0%) | 0 (0.0%) |
| Bachelor's Degree | 4 (50.0%) | 4 (50.0%) |
| Graduate Degree | 0 (0.0%) | 0 (0.0%) |
| Total | 10 (34.5%) | 19 (65.5%) |
Employment Characteristics in Atglen borough
Employment by Class of Employer in Atglen borough
Among the 621 employed individuals in Atglen borough, private company employees (486 | 78.3%), not-for-profit organizations (54 | 8.7%), and state government employees (30 | 4.8%) make up the most common classes of employment.
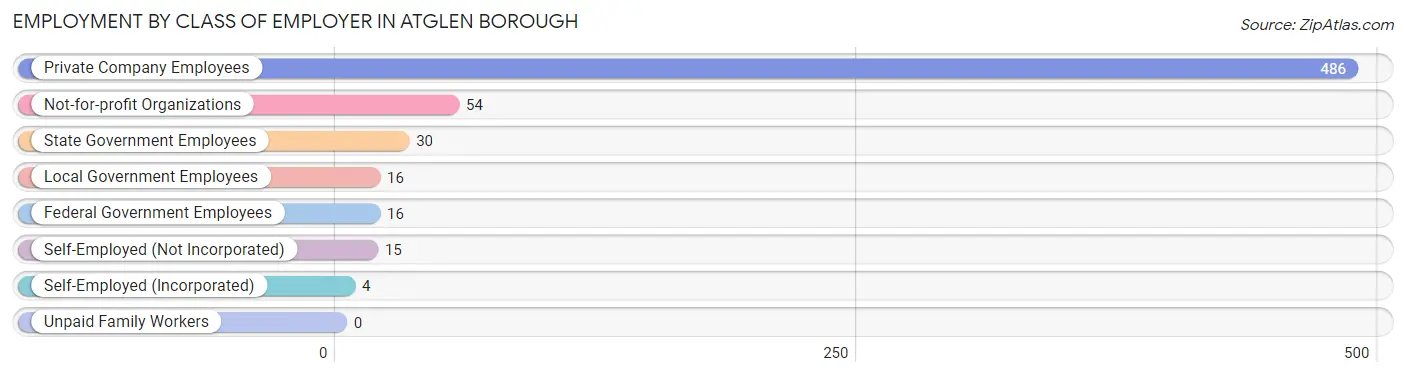
| Employer Class | # Employees | % Employees |
| Private Company Employees | 486 | 78.3% |
| Self-Employed (Incorporated) | 4 | 0.6% |
| Self-Employed (Not Incorporated) | 15 | 2.4% |
| Not-for-profit Organizations | 54 | 8.7% |
| Local Government Employees | 16 | 2.6% |
| State Government Employees | 30 | 4.8% |
| Federal Government Employees | 16 | 2.6% |
| Unpaid Family Workers | 0 | 0.0% |
| Total | 621 | 100.0% |
Employment Status by Age in Atglen borough
According to the labor force statistics for Atglen borough, out of the total population over 16 years of age (882), 72.9% or 643 individuals are in the labor force, with 1.4% or 9 of them unemployed. The age group with the highest labor force participation rate is 45 to 54 years, with 93.5% or 144 individuals in the labor force. Within the labor force, the 55 to 59 years age range has the highest percentage of unemployed individuals, with 6.5% or 3 of them being unemployed.
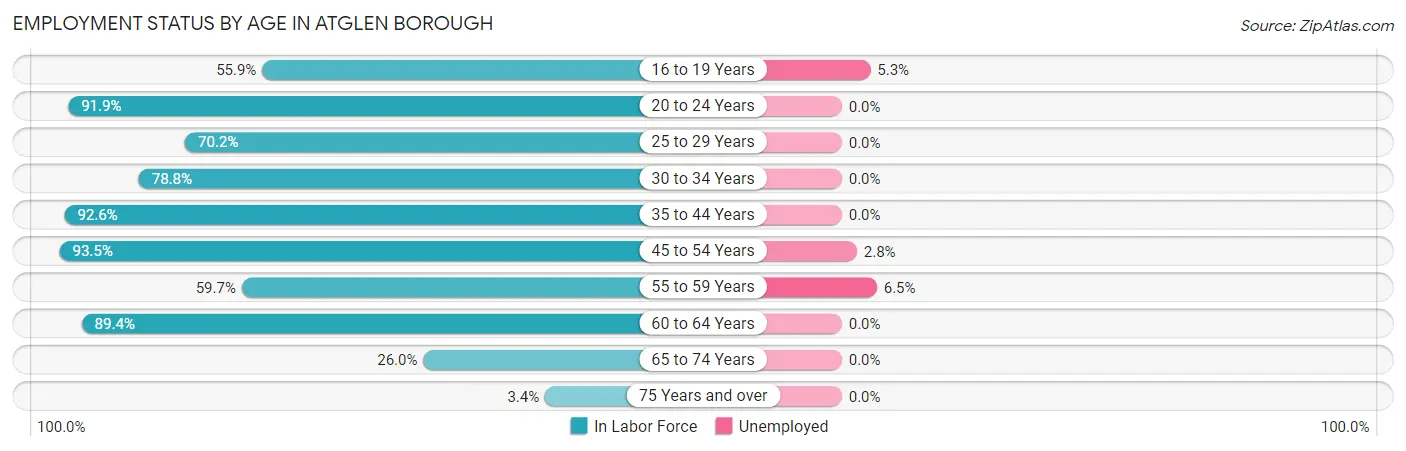
| Age Bracket | In Labor Force | Unemployed |
| 16 to 19 Years | 38 (55.9%) | 2 (5.3%) |
| 20 to 24 Years | 91 (91.9%) | 0 (0.0%) |
| 25 to 29 Years | 87 (70.2%) | 0 (0.0%) |
| 30 to 34 Years | 41 (78.8%) | 0 (0.0%) |
| 35 to 44 Years | 88 (92.6%) | 0 (0.0%) |
| 45 to 54 Years | 144 (93.5%) | 4 (2.8%) |
| 55 to 59 Years | 46 (59.7%) | 3 (6.5%) |
| 60 to 64 Years | 93 (89.4%) | 0 (0.0%) |
| 65 to 74 Years | 13 (26.0%) | 0 (0.0%) |
| 75 Years and over | 2 (3.4%) | 0 (0.0%) |
| Total | 643 (72.9%) | 9 (1.4%) |
Employment Status by Educational Attainment in Atglen borough
According to labor force statistics for Atglen borough, 82.3% of individuals (499) out of the total population between 25 and 64 years of age (606) are in the labor force, with 1.4% or 7 of them being unemployed. The group with the highest labor force participation rate are those with the educational attainment of college / associate degree, with 97.2% or 140 individuals in the labor force. Within the labor force, individuals with bachelor's degree or higher education have the highest percentage of unemployment, with 2.2% or 4 of them being unemployed.
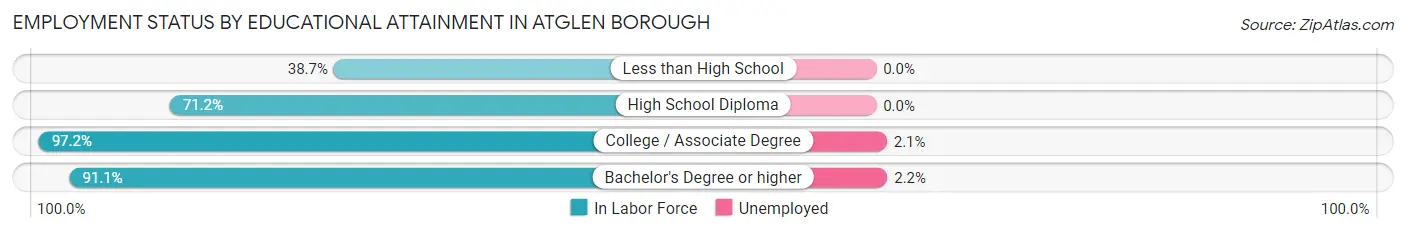
| Educational Attainment | In Labor Force | Unemployed |
| Less than High School | 12 (38.7%) | 0 (0.0%) |
| High School Diploma | 163 (71.2%) | 0 (0.0%) |
| College / Associate Degree | 140 (97.2%) | 3 (2.1%) |
| Bachelor's Degree or higher | 184 (91.1%) | 4 (2.2%) |
| Total | 499 (82.3%) | 8 (1.4%) |
Employment Occupations by Sex in Atglen borough
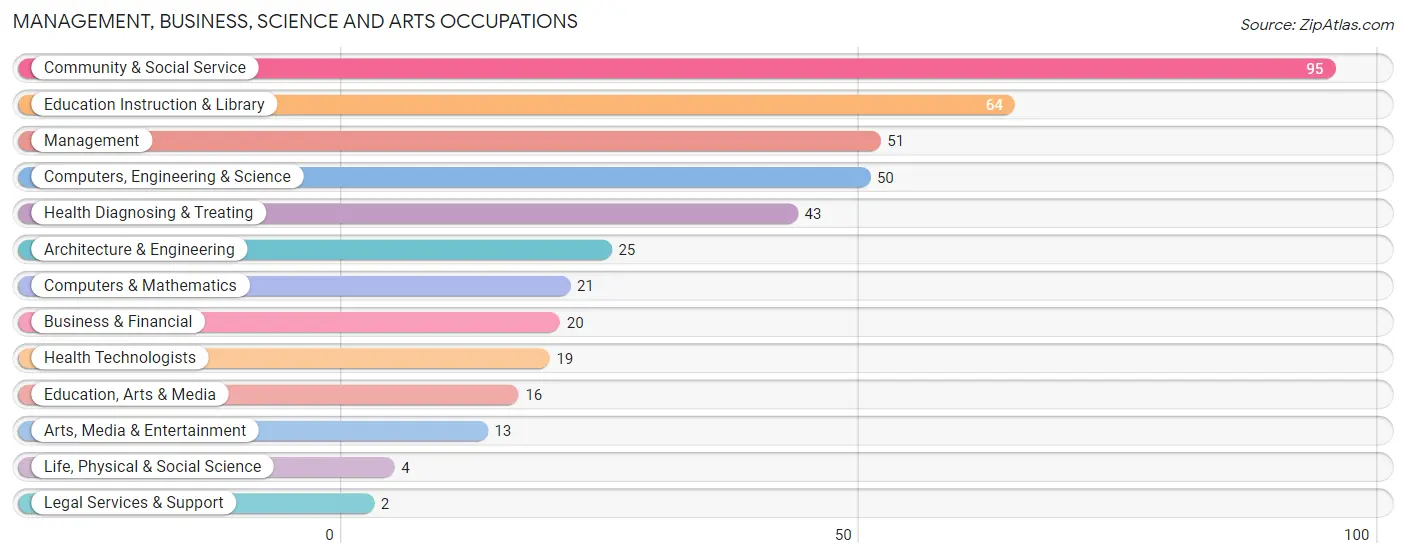
Management, Business, Science and Arts Occupations
The most common Management, Business, Science and Arts occupations in Atglen borough are Community & Social Service (95 | 15.0%), Education Instruction & Library (64 | 10.1%), Management (51 | 8.0%), Computers, Engineering & Science (50 | 7.9%), and Health Diagnosing & Treating (43 | 6.8%).
Management, Business, Science and Arts Occupations by Sex
Within the Management, Business, Science and Arts occupations in Atglen borough, the most male-oriented occupations are Computers & Mathematics (100.0%), Management (78.4%), and Computers, Engineering & Science (68.0%), while the most female-oriented occupations are Life, Physical & Social Science (100.0%), Legal Services & Support (100.0%), and Health Diagnosing & Treating (100.0%).
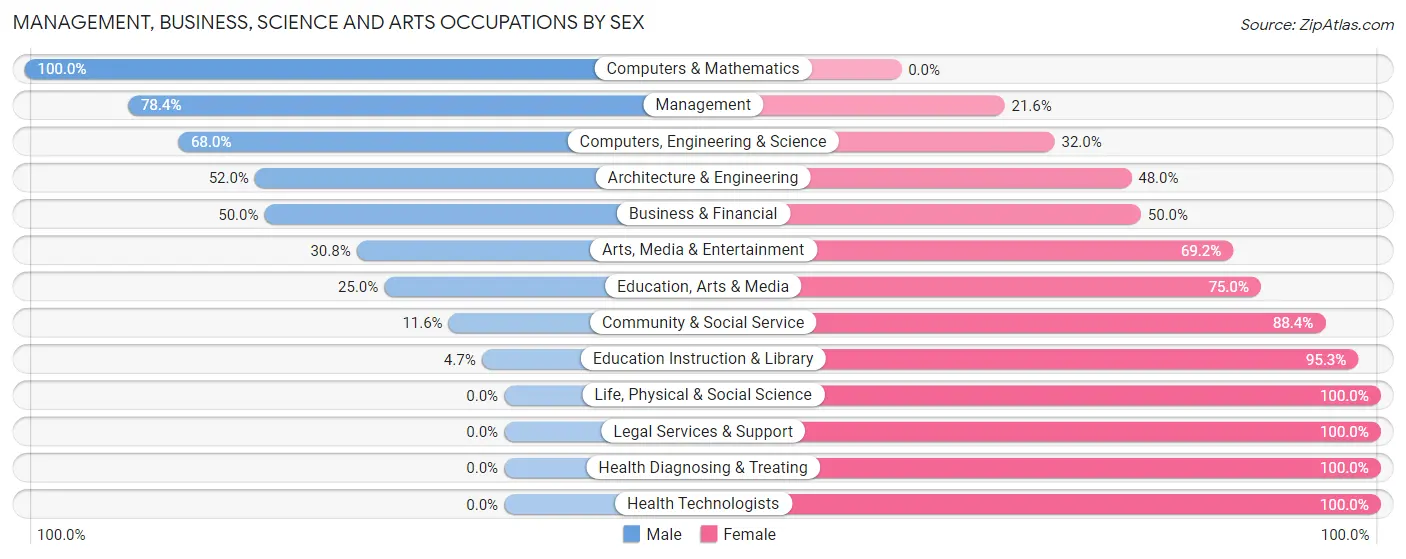
| Occupation | Male | Female |
| Management | 40 (78.4%) | 11 (21.6%) |
| Business & Financial | 10 (50.0%) | 10 (50.0%) |
| Computers, Engineering & Science | 34 (68.0%) | 16 (32.0%) |
| Computers & Mathematics | 21 (100.0%) | 0 (0.0%) |
| Architecture & Engineering | 13 (52.0%) | 12 (48.0%) |
| Life, Physical & Social Science | 0 (0.0%) | 4 (100.0%) |
| Community & Social Service | 11 (11.6%) | 84 (88.4%) |
| Education, Arts & Media | 4 (25.0%) | 12 (75.0%) |
| Legal Services & Support | 0 (0.0%) | 2 (100.0%) |
| Education Instruction & Library | 3 (4.7%) | 61 (95.3%) |
| Arts, Media & Entertainment | 4 (30.8%) | 9 (69.2%) |
| Health Diagnosing & Treating | 0 (0.0%) | 43 (100.0%) |
| Health Technologists | 0 (0.0%) | 19 (100.0%) |
| Total (Category) | 95 (36.7%) | 164 (63.3%) |
| Total (Overall) | 332 (52.4%) | 302 (47.6%) |
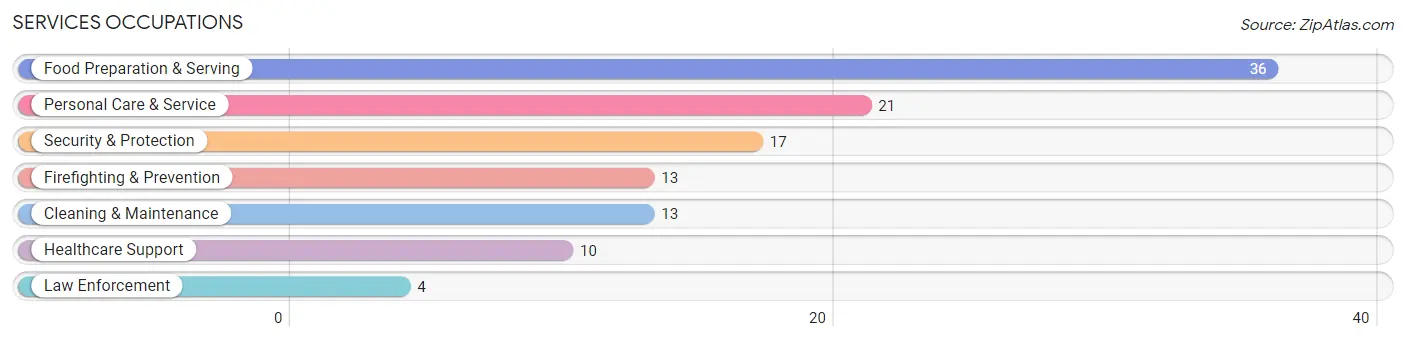
Services Occupations
The most common Services occupations in Atglen borough are Food Preparation & Serving (36 | 5.7%), Personal Care & Service (21 | 3.3%), Security & Protection (17 | 2.7%), Firefighting & Prevention (13 | 2.1%), and Cleaning & Maintenance (13 | 2.1%).
Services Occupations by Sex
Within the Services occupations in Atglen borough, the most male-oriented occupations are Law Enforcement (100.0%), Food Preparation & Serving (72.2%), and Security & Protection (64.7%), while the most female-oriented occupations are Healthcare Support (100.0%), Personal Care & Service (100.0%), and Cleaning & Maintenance (69.2%).
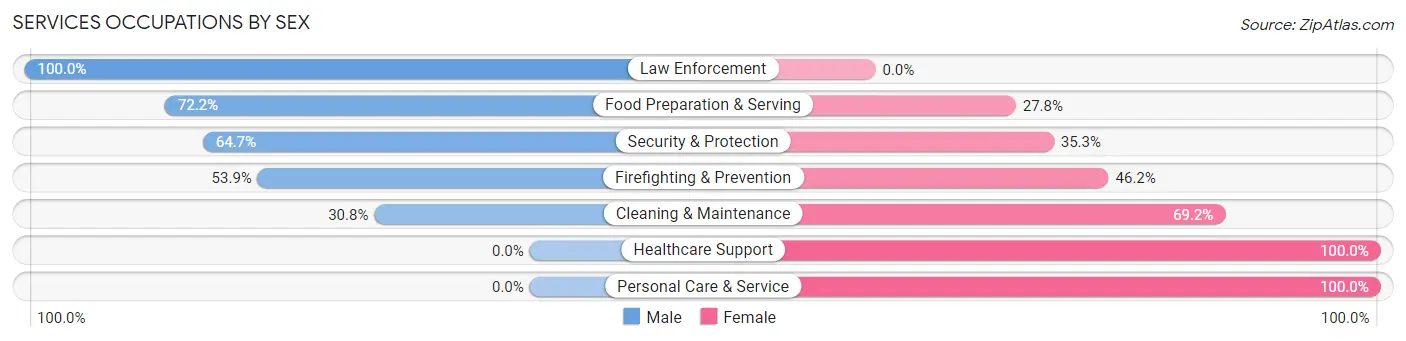
| Occupation | Male | Female |
| Healthcare Support | 0 (0.0%) | 10 (100.0%) |
| Security & Protection | 11 (64.7%) | 6 (35.3%) |
| Firefighting & Prevention | 7 (53.8%) | 6 (46.2%) |
| Law Enforcement | 4 (100.0%) | 0 (0.0%) |
| Food Preparation & Serving | 26 (72.2%) | 10 (27.8%) |
| Cleaning & Maintenance | 4 (30.8%) | 9 (69.2%) |
| Personal Care & Service | 0 (0.0%) | 21 (100.0%) |
| Total (Category) | 41 (42.3%) | 56 (57.7%) |
| Total (Overall) | 332 (52.4%) | 302 (47.6%) |
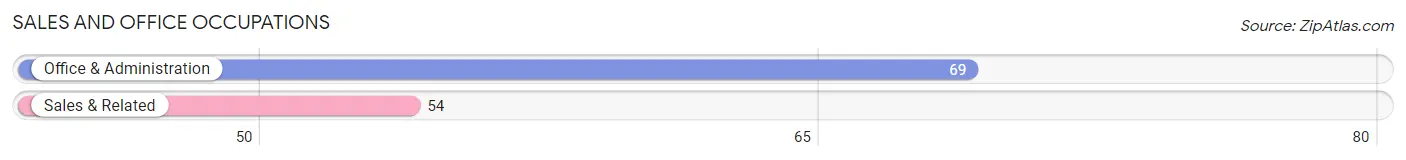
Sales and Office Occupations
The most common Sales and Office occupations in Atglen borough are Office & Administration (69 | 10.9%), and Sales & Related (54 | 8.5%).
Sales and Office Occupations by Sex
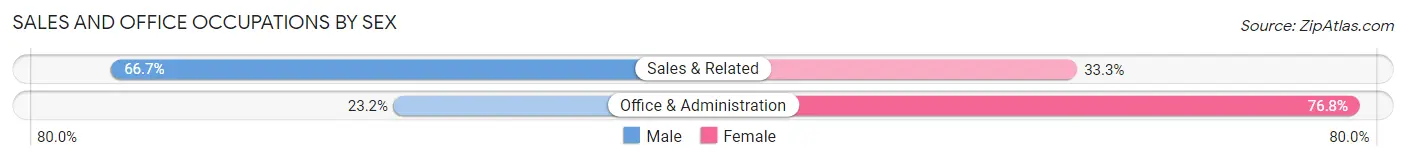
| Occupation | Male | Female |
| Sales & Related | 36 (66.7%) | 18 (33.3%) |
| Office & Administration | 16 (23.2%) | 53 (76.8%) |
| Total (Category) | 52 (42.3%) | 71 (57.7%) |
| Total (Overall) | 332 (52.4%) | 302 (47.6%) |
Natural Resources, Construction and Maintenance Occupations
The most common Natural Resources, Construction and Maintenance occupations in Atglen borough are Installation, Maintenance & Repair (28 | 4.4%), Construction & Extraction (16 | 2.5%), and Farming, Fishing & Forestry (12 | 1.9%).
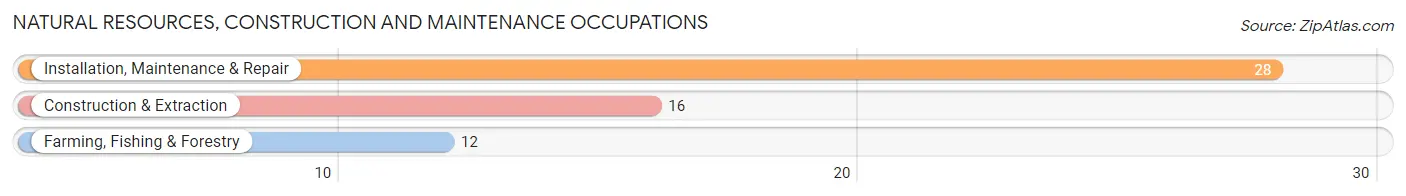
Natural Resources, Construction and Maintenance Occupations by Sex
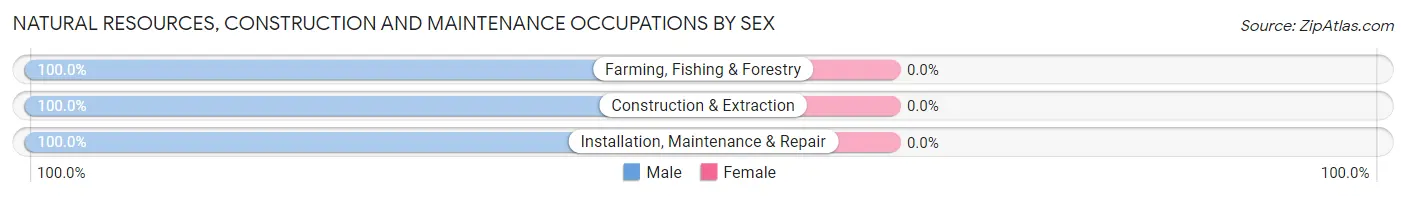
| Occupation | Male | Female |
| Farming, Fishing & Forestry | 12 (100.0%) | 0 (0.0%) |
| Construction & Extraction | 16 (100.0%) | 0 (0.0%) |
| Installation, Maintenance & Repair | 28 (100.0%) | 0 (0.0%) |
| Total (Category) | 56 (100.0%) | 0 (0.0%) |
| Total (Overall) | 332 (52.4%) | 302 (47.6%) |
Production, Transportation and Moving Occupations
The most common Production, Transportation and Moving occupations in Atglen borough are Production (43 | 6.8%), Material Moving (38 | 6.0%), and Transportation (18 | 2.8%).
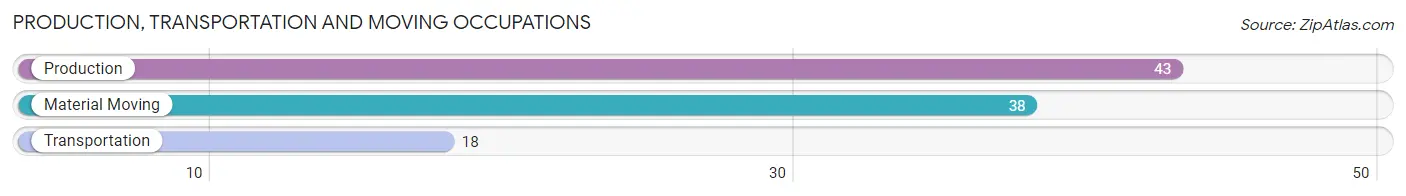
Production, Transportation and Moving Occupations by Sex
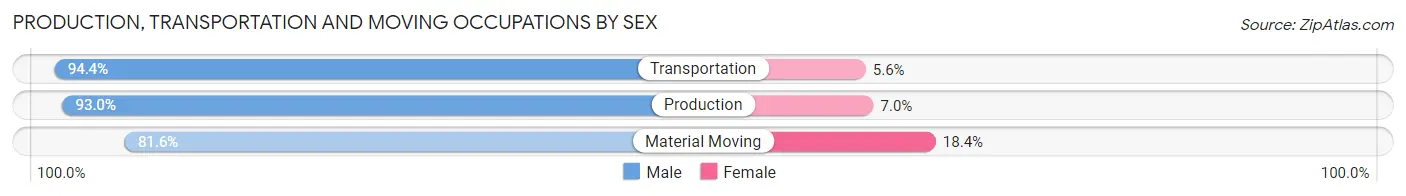
| Occupation | Male | Female |
| Production | 40 (93.0%) | 3 (7.0%) |
| Transportation | 17 (94.4%) | 1 (5.6%) |
| Material Moving | 31 (81.6%) | 7 (18.4%) |
| Total (Category) | 88 (88.9%) | 11 (11.1%) |
| Total (Overall) | 332 (52.4%) | 302 (47.6%) |
Employment Industries by Sex in Atglen borough
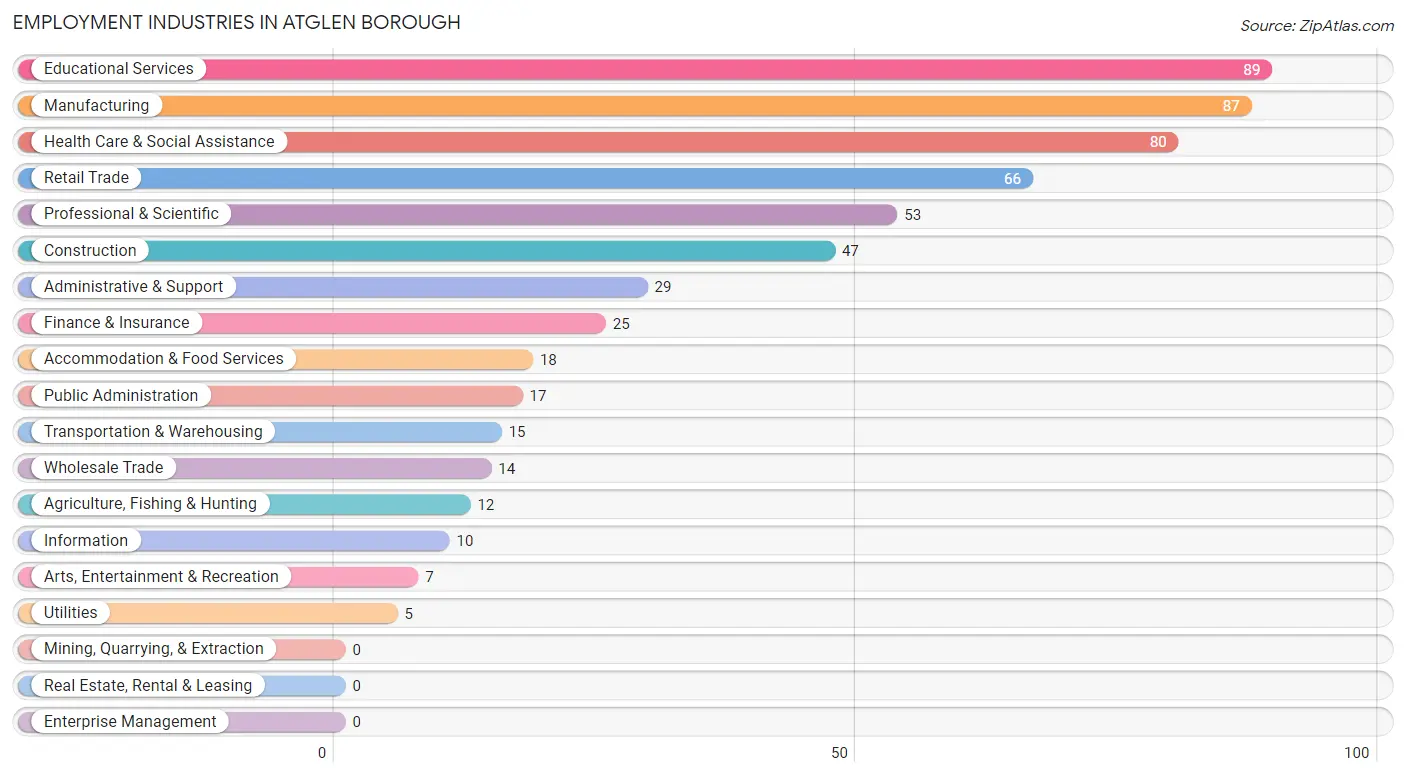
Employment Industries in Atglen borough
The major employment industries in Atglen borough include Educational Services (89 | 14.0%), Manufacturing (87 | 13.7%), Health Care & Social Assistance (80 | 12.6%), Retail Trade (66 | 10.4%), and Professional & Scientific (53 | 8.4%).
Employment Industries by Sex in Atglen borough
The Atglen borough industries that see more men than women are Agriculture, Fishing & Hunting (100.0%), Utilities (100.0%), and Arts, Entertainment & Recreation (100.0%), whereas the industries that tend to have a higher number of women are Educational Services (93.3%), Health Care & Social Assistance (72.5%), and Finance & Insurance (72.0%).
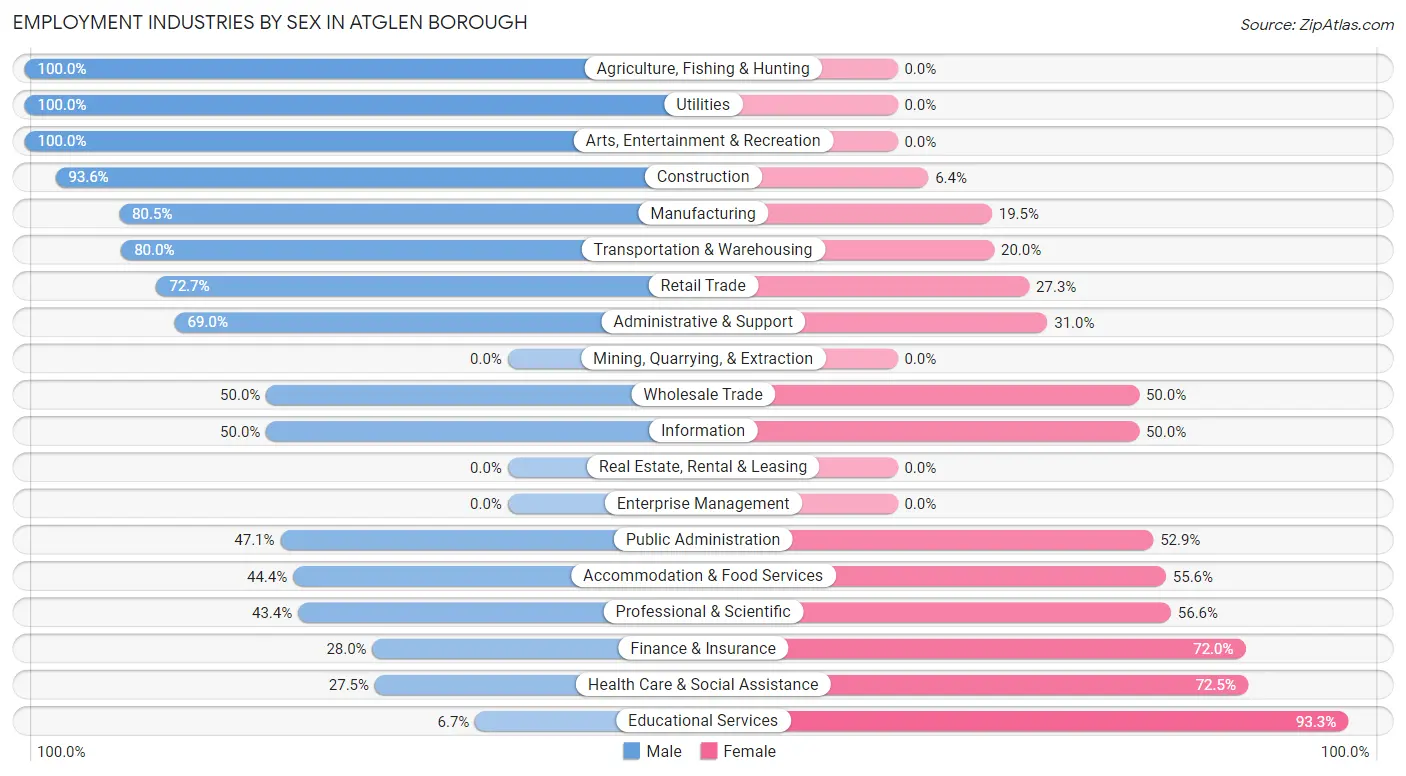
| Industry | Male | Female |
| Agriculture, Fishing & Hunting | 12 (100.0%) | 0 (0.0%) |
| Mining, Quarrying, & Extraction | 0 (0.0%) | 0 (0.0%) |
| Construction | 44 (93.6%) | 3 (6.4%) |
| Manufacturing | 70 (80.5%) | 17 (19.5%) |
| Wholesale Trade | 7 (50.0%) | 7 (50.0%) |
| Retail Trade | 48 (72.7%) | 18 (27.3%) |
| Transportation & Warehousing | 12 (80.0%) | 3 (20.0%) |
| Utilities | 5 (100.0%) | 0 (0.0%) |
| Information | 5 (50.0%) | 5 (50.0%) |
| Finance & Insurance | 7 (28.0%) | 18 (72.0%) |
| Real Estate, Rental & Leasing | 0 (0.0%) | 0 (0.0%) |
| Professional & Scientific | 23 (43.4%) | 30 (56.6%) |
| Enterprise Management | 0 (0.0%) | 0 (0.0%) |
| Administrative & Support | 20 (69.0%) | 9 (31.0%) |
| Educational Services | 6 (6.7%) | 83 (93.3%) |
| Health Care & Social Assistance | 22 (27.5%) | 58 (72.5%) |
| Arts, Entertainment & Recreation | 7 (100.0%) | 0 (0.0%) |
| Accommodation & Food Services | 8 (44.4%) | 10 (55.6%) |
| Public Administration | 8 (47.1%) | 9 (52.9%) |
| Total | 332 (52.4%) | 302 (47.6%) |
Education in Atglen borough
School Enrollment in Atglen borough
The most common levels of schooling among the 279 students in Atglen borough are high school (87 | 31.2%), middle school (83 | 29.7%), and elementary school (65 | 23.3%).
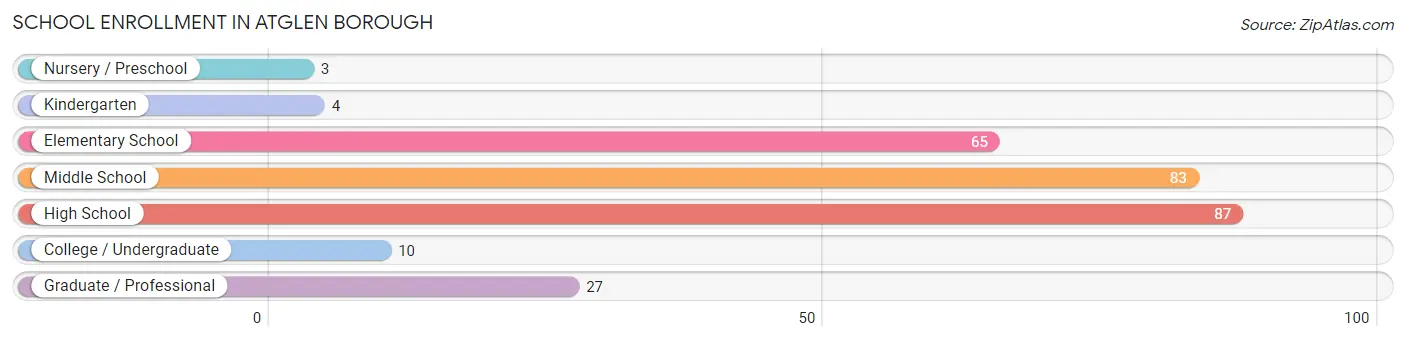
| School Level | # Students | % Students |
| Nursery / Preschool | 3 | 1.1% |
| Kindergarten | 4 | 1.4% |
| Elementary School | 65 | 23.3% |
| Middle School | 83 | 29.7% |
| High School | 87 | 31.2% |
| College / Undergraduate | 10 | 3.6% |
| Graduate / Professional | 27 | 9.7% |
| Total | 279 | 100.0% |
School Enrollment by Age by Funding Source in Atglen borough
Out of a total of 279 students who are enrolled in schools in Atglen borough, 13 (4.7%) attend a private institution, while the remaining 266 (95.3%) are enrolled in public schools. The age group of 3 to 4 year olds has the highest likelihood of being enrolled in private schools, with 3 (100.0% in the age bracket) enrolled. Conversely, the age group of 15 to 17 year olds has the lowest likelihood of being enrolled in a private school, with 53 (100.0% in the age bracket) attending a public institution.
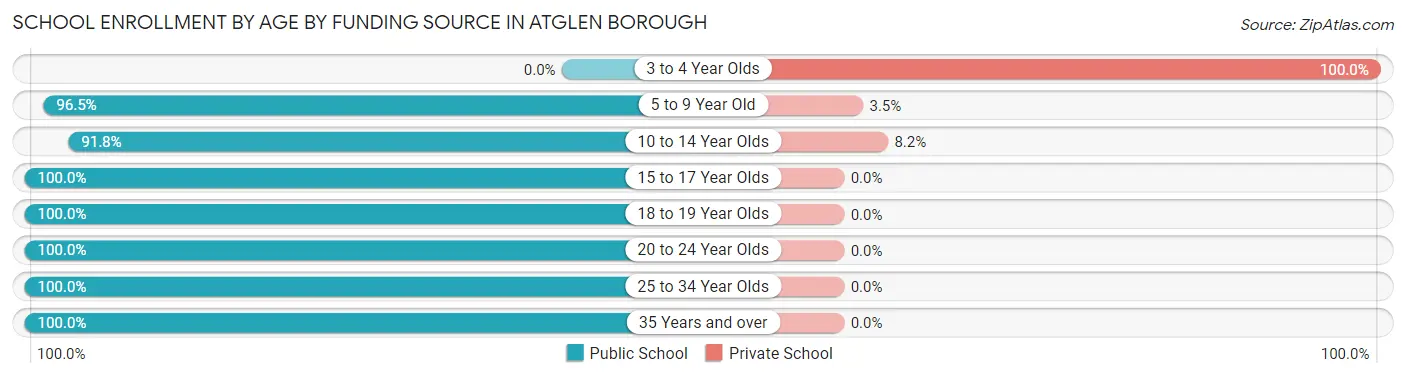
| Age Bracket | Public School | Private School |
| 3 to 4 Year Olds | 0 (0.0%) | 3 (100.0%) |
| 5 to 9 Year Old | 55 (96.5%) | 2 (3.5%) |
| 10 to 14 Year Olds | 90 (91.8%) | 8 (8.2%) |
| 15 to 17 Year Olds | 53 (100.0%) | 0 (0.0%) |
| 18 to 19 Year Olds | 31 (100.0%) | 0 (0.0%) |
| 20 to 24 Year Olds | 14 (100.0%) | 0 (0.0%) |
| 25 to 34 Year Olds | 18 (100.0%) | 0 (0.0%) |
| 35 Years and over | 5 (100.0%) | 0 (0.0%) |
| Total | 266 (95.3%) | 13 (4.7%) |
Educational Attainment by Field of Study in Atglen borough
Business (54 | 19.0%), education (37 | 13.0%), science & technology (35 | 12.3%), social sciences (27 | 9.5%), and literature & languages (25 | 8.8%) are the most common fields of study among 285 individuals in Atglen borough who have obtained a bachelor's degree or higher.
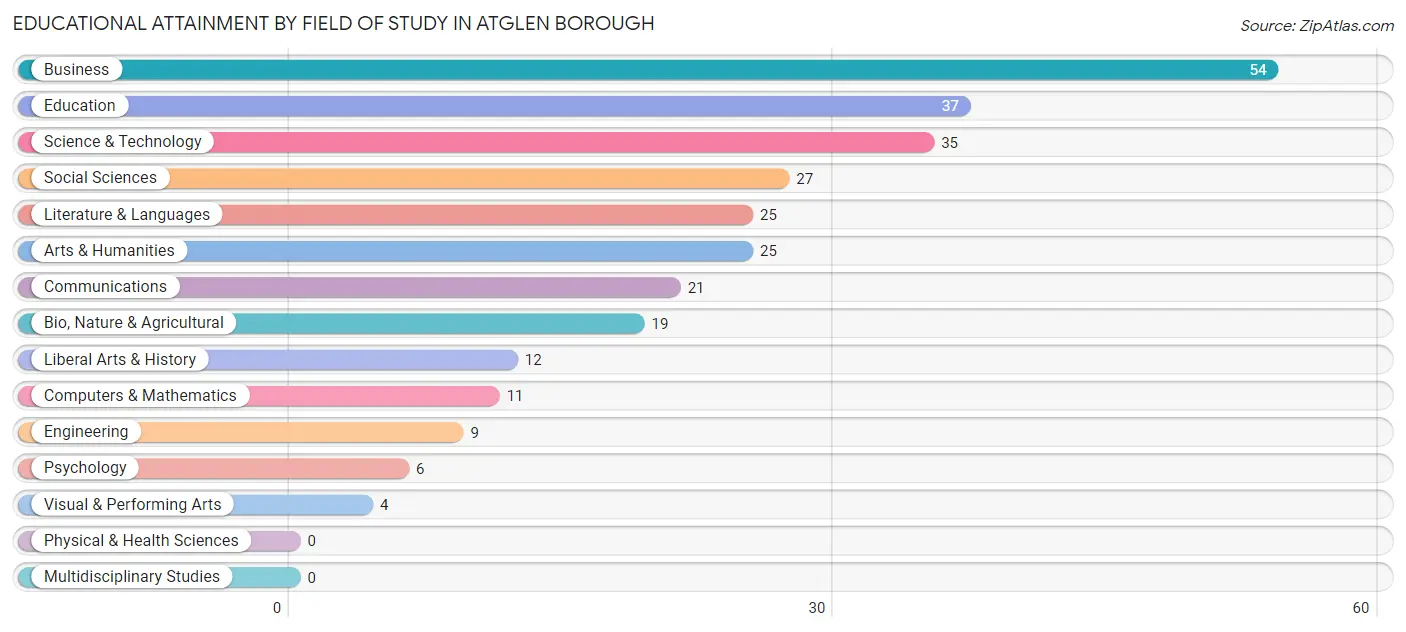
| Field of Study | # Graduates | % Graduates |
| Computers & Mathematics | 11 | 3.9% |
| Bio, Nature & Agricultural | 19 | 6.7% |
| Physical & Health Sciences | 0 | 0.0% |
| Psychology | 6 | 2.1% |
| Social Sciences | 27 | 9.5% |
| Engineering | 9 | 3.2% |
| Multidisciplinary Studies | 0 | 0.0% |
| Science & Technology | 35 | 12.3% |
| Business | 54 | 19.0% |
| Education | 37 | 13.0% |
| Literature & Languages | 25 | 8.8% |
| Liberal Arts & History | 12 | 4.2% |
| Visual & Performing Arts | 4 | 1.4% |
| Communications | 21 | 7.4% |
| Arts & Humanities | 25 | 8.8% |
| Total | 285 | 100.0% |
Transportation & Commute in Atglen borough
Vehicle Availability by Sex in Atglen borough
The most prevalent vehicle ownership categories in Atglen borough are males with 2 vehicles (121, accounting for 37.6%) and females with 2 vehicles (128, making up 40.5%).
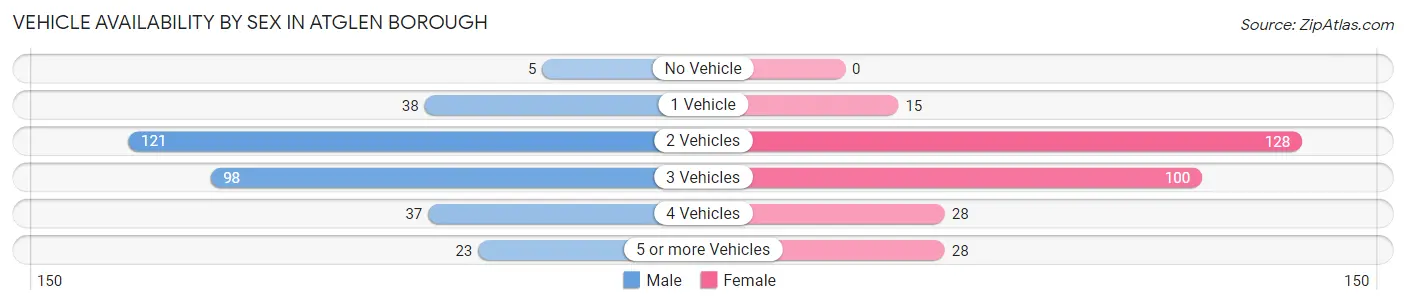
| Vehicles Available | Male | Female |
| No Vehicle | 5 (1.5%) | 0 (0.0%) |
| 1 Vehicle | 38 (11.8%) | 15 (5.0%) |
| 2 Vehicles | 121 (37.6%) | 128 (42.8%) |
| 3 Vehicles | 98 (30.4%) | 100 (33.4%) |
| 4 Vehicles | 37 (11.5%) | 28 (9.4%) |
| 5 or more Vehicles | 23 (7.1%) | 28 (9.4%) |
| Total | 322 (100.0%) | 299 (100.0%) |
Commute Time in Atglen borough
The most frequently occuring commute durations in Atglen borough are 5 to 9 minutes (122 commuters, 22.7%), 20 to 24 minutes (80 commuters, 14.9%), and 30 to 34 minutes (54 commuters, 10.0%).
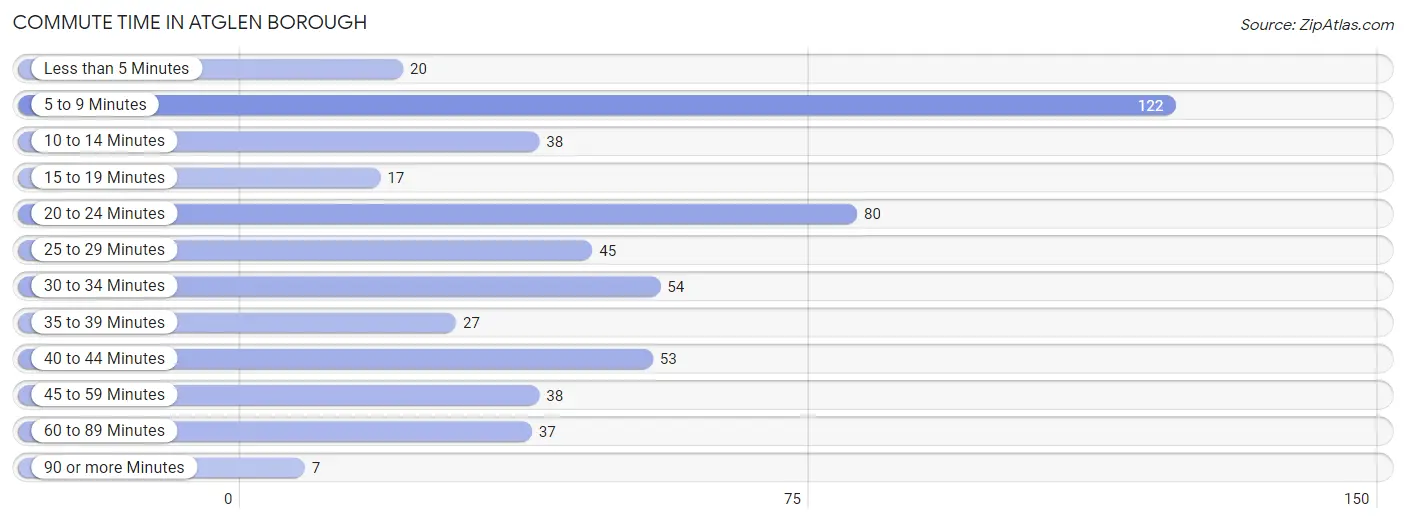
| Commute Time | # Commuters | % Commuters |
| Less than 5 Minutes | 20 | 3.7% |
| 5 to 9 Minutes | 122 | 22.7% |
| 10 to 14 Minutes | 38 | 7.1% |
| 15 to 19 Minutes | 17 | 3.2% |
| 20 to 24 Minutes | 80 | 14.9% |
| 25 to 29 Minutes | 45 | 8.4% |
| 30 to 34 Minutes | 54 | 10.0% |
| 35 to 39 Minutes | 27 | 5.0% |
| 40 to 44 Minutes | 53 | 9.9% |
| 45 to 59 Minutes | 38 | 7.1% |
| 60 to 89 Minutes | 37 | 6.9% |
| 90 or more Minutes | 7 | 1.3% |
Commute Time by Sex in Atglen borough
The most common commute times in Atglen borough are 5 to 9 minutes (57 commuters, 21.3%) for males and 5 to 9 minutes (65 commuters, 24.1%) for females.

| Commute Time | Male | Female |
| Less than 5 Minutes | 7 (2.6%) | 13 (4.8%) |
| 5 to 9 Minutes | 57 (21.3%) | 65 (24.1%) |
| 10 to 14 Minutes | 5 (1.9%) | 33 (12.2%) |
| 15 to 19 Minutes | 13 (4.9%) | 4 (1.5%) |
| 20 to 24 Minutes | 39 (14.5%) | 41 (15.2%) |
| 25 to 29 Minutes | 33 (12.3%) | 12 (4.4%) |
| 30 to 34 Minutes | 26 (9.7%) | 28 (10.4%) |
| 35 to 39 Minutes | 20 (7.5%) | 7 (2.6%) |
| 40 to 44 Minutes | 27 (10.1%) | 26 (9.6%) |
| 45 to 59 Minutes | 13 (4.9%) | 25 (9.3%) |
| 60 to 89 Minutes | 28 (10.4%) | 9 (3.3%) |
| 90 or more Minutes | 0 (0.0%) | 7 (2.6%) |
Time of Departure to Work by Sex in Atglen borough
The most frequent times of departure to work in Atglen borough are 12:00 AM to 4:59 AM (54, 20.2%) for males and 8:00 AM to 8:29 AM (52, 19.3%) for females.
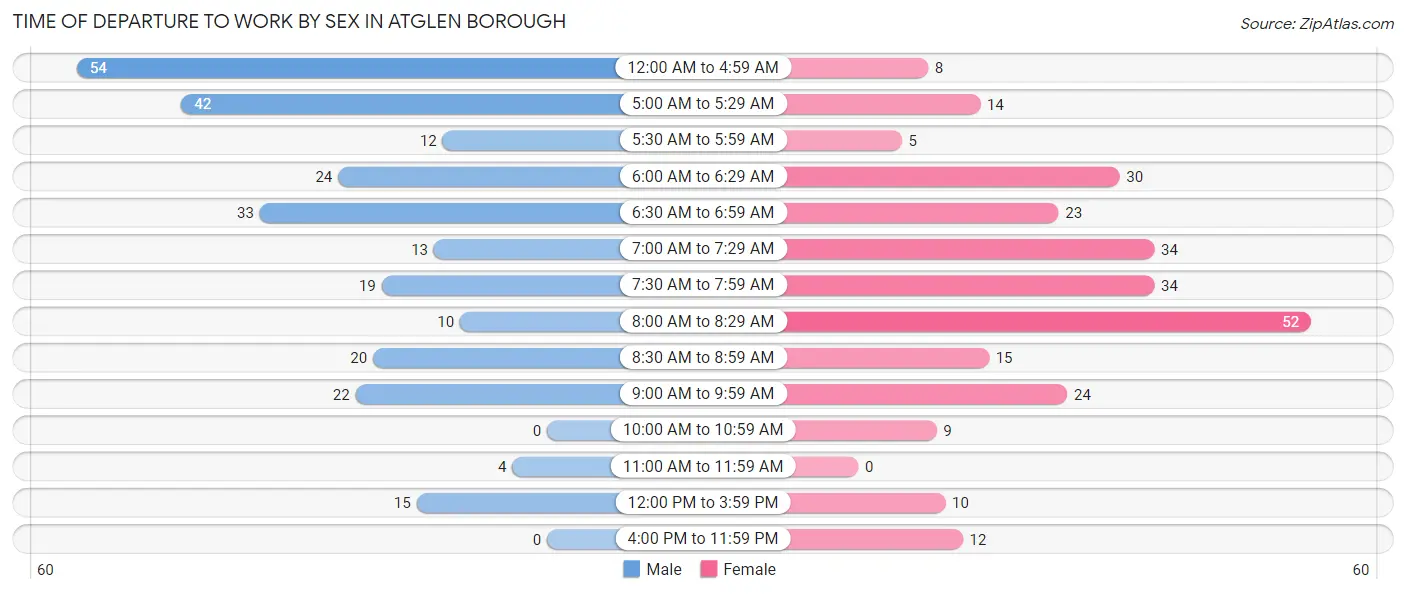
| Time of Departure | Male | Female |
| 12:00 AM to 4:59 AM | 54 (20.2%) | 8 (3.0%) |
| 5:00 AM to 5:29 AM | 42 (15.7%) | 14 (5.2%) |
| 5:30 AM to 5:59 AM | 12 (4.5%) | 5 (1.8%) |
| 6:00 AM to 6:29 AM | 24 (9.0%) | 30 (11.1%) |
| 6:30 AM to 6:59 AM | 33 (12.3%) | 23 (8.5%) |
| 7:00 AM to 7:29 AM | 13 (4.9%) | 34 (12.6%) |
| 7:30 AM to 7:59 AM | 19 (7.1%) | 34 (12.6%) |
| 8:00 AM to 8:29 AM | 10 (3.7%) | 52 (19.3%) |
| 8:30 AM to 8:59 AM | 20 (7.5%) | 15 (5.6%) |
| 9:00 AM to 9:59 AM | 22 (8.2%) | 24 (8.9%) |
| 10:00 AM to 10:59 AM | 0 (0.0%) | 9 (3.3%) |
| 11:00 AM to 11:59 AM | 4 (1.5%) | 0 (0.0%) |
| 12:00 PM to 3:59 PM | 15 (5.6%) | 10 (3.7%) |
| 4:00 PM to 11:59 PM | 0 (0.0%) | 12 (4.4%) |
| Total | 268 (100.0%) | 270 (100.0%) |
Housing Occupancy in Atglen borough
Occupancy by Ownership in Atglen borough
Of the total 389 dwellings in Atglen borough, owner-occupied units account for 305 (78.4%), while renter-occupied units make up 84 (21.6%).
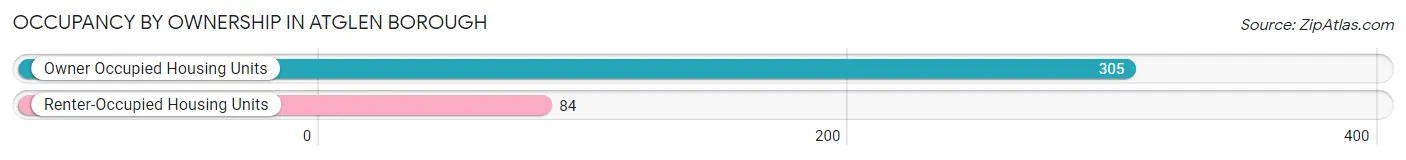
| Occupancy | # Housing Units | % Housing Units |
| Owner Occupied Housing Units | 305 | 78.4% |
| Renter-Occupied Housing Units | 84 | 21.6% |
| Total Occupied Housing Units | 389 | 100.0% |
Occupancy by Household Size in Atglen borough
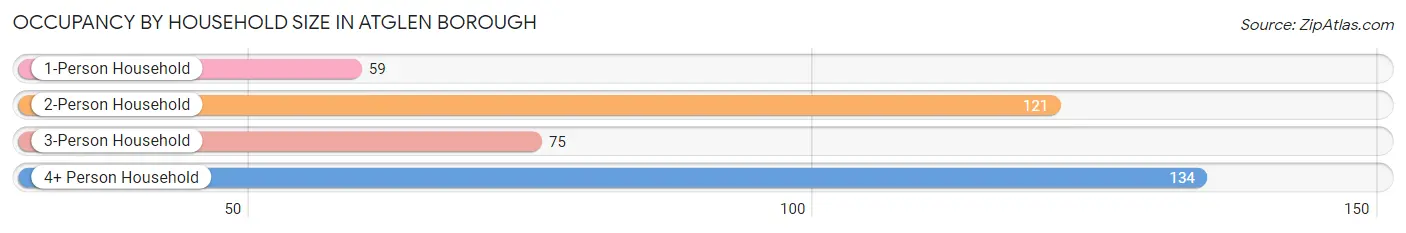
| Household Size | # Housing Units | % Housing Units |
| 1-Person Household | 59 | 15.2% |
| 2-Person Household | 121 | 31.1% |
| 3-Person Household | 75 | 19.3% |
| 4+ Person Household | 134 | 34.4% |
| Total Housing Units | 389 | 100.0% |
Occupancy by Ownership by Household Size in Atglen borough
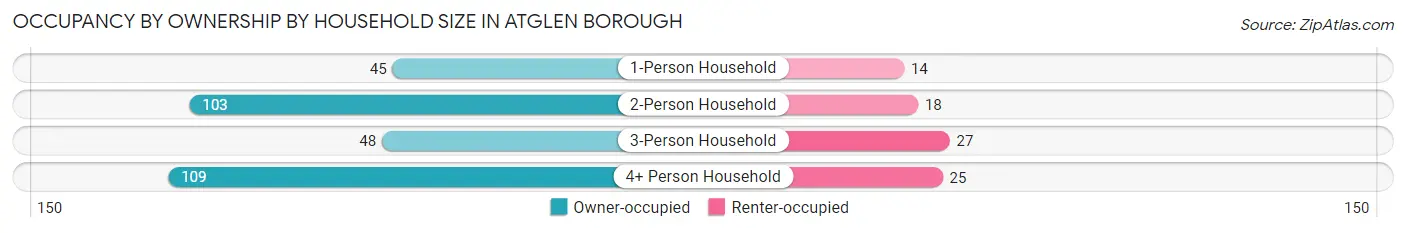
| Household Size | Owner-occupied | Renter-occupied |
| 1-Person Household | 45 (76.3%) | 14 (23.7%) |
| 2-Person Household | 103 (85.1%) | 18 (14.9%) |
| 3-Person Household | 48 (64.0%) | 27 (36.0%) |
| 4+ Person Household | 109 (81.3%) | 25 (18.7%) |
| Total Housing Units | 305 (78.4%) | 84 (21.6%) |
Occupancy by Educational Attainment in Atglen borough
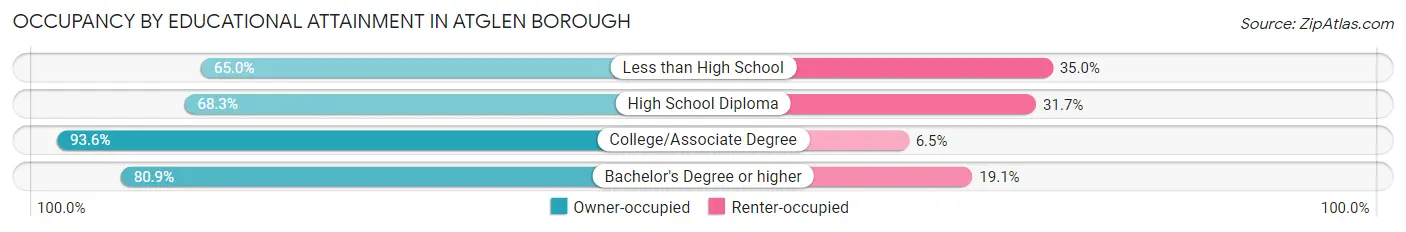
| Household Size | Owner-occupied | Renter-occupied |
| Less than High School | 13 (65.0%) | 7 (35.0%) |
| High School Diploma | 99 (68.3%) | 46 (31.7%) |
| College/Associate Degree | 87 (93.5%) | 6 (6.5%) |
| Bachelor's Degree or higher | 106 (80.9%) | 25 (19.1%) |
Occupancy by Age of Householder in Atglen borough
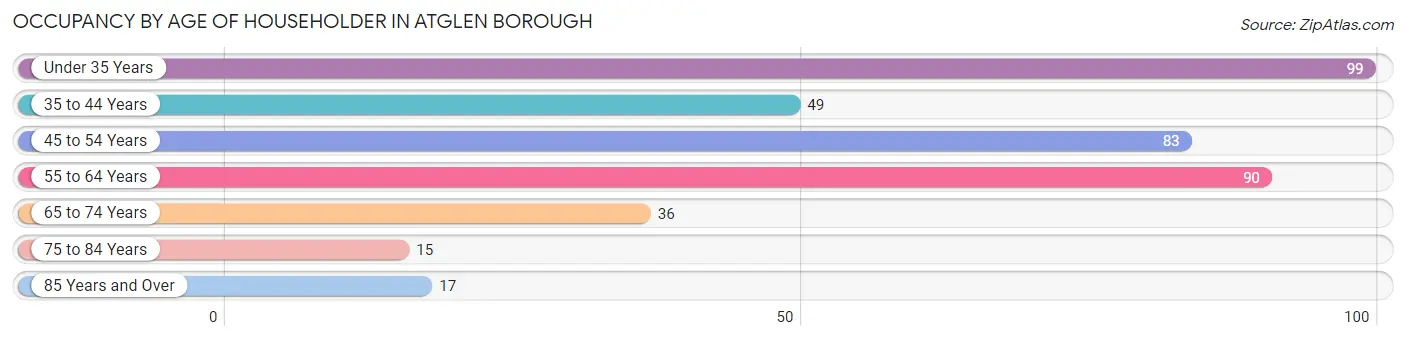
| Age Bracket | # Households | % Households |
| Under 35 Years | 99 | 25.5% |
| 35 to 44 Years | 49 | 12.6% |
| 45 to 54 Years | 83 | 21.3% |
| 55 to 64 Years | 90 | 23.1% |
| 65 to 74 Years | 36 | 9.2% |
| 75 to 84 Years | 15 | 3.9% |
| 85 Years and Over | 17 | 4.4% |
| Total | 389 | 100.0% |
Housing Finances in Atglen borough
Median Income by Occupancy in Atglen borough
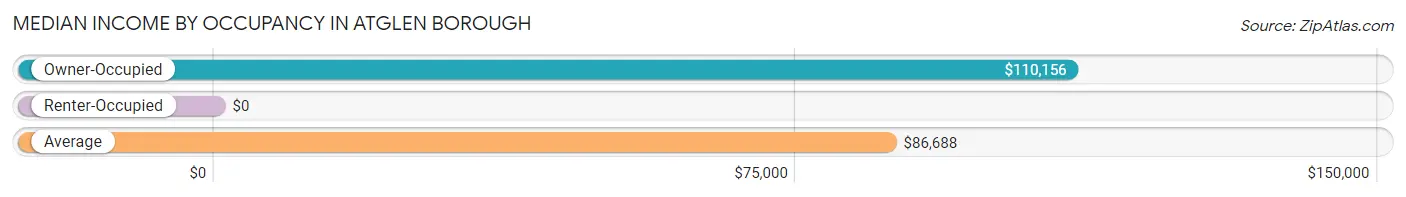
| Occupancy Type | # Households | Median Income |
| Owner-Occupied | 305 (78.4%) | $110,156 |
| Renter-Occupied | 84 (21.6%) | $0 |
| Average | 389 (100.0%) | $86,688 |
Occupancy by Householder Income Bracket in Atglen borough
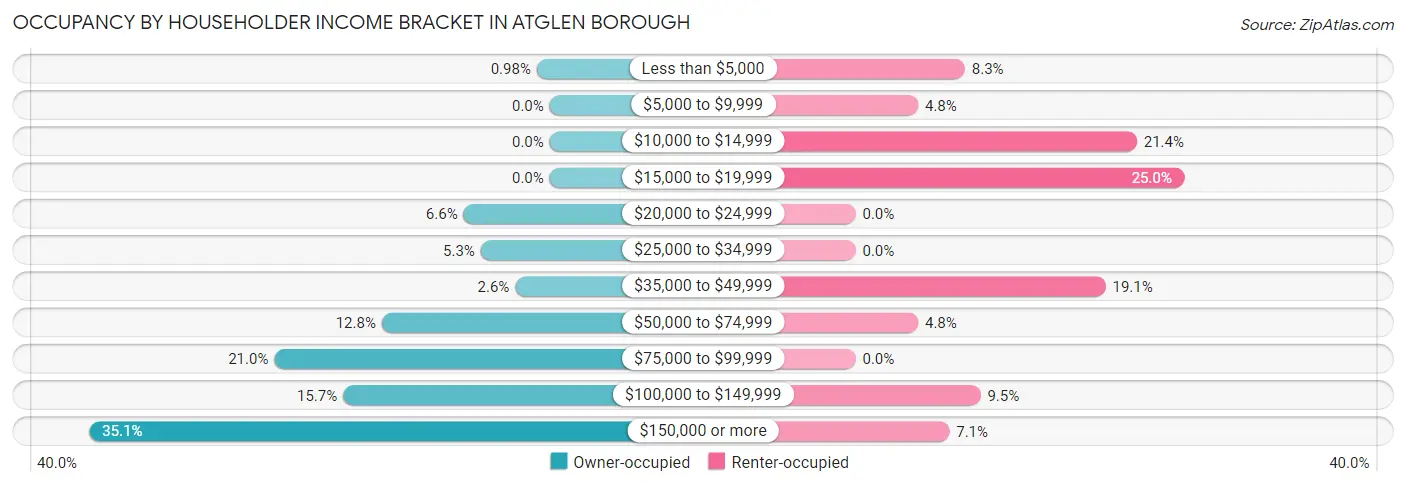
| Income Bracket | Owner-occupied | Renter-occupied |
| Less than $5,000 | 3 (1.0%) | 7 (8.3%) |
| $5,000 to $9,999 | 0 (0.0%) | 4 (4.8%) |
| $10,000 to $14,999 | 0 (0.0%) | 18 (21.4%) |
| $15,000 to $19,999 | 0 (0.0%) | 21 (25.0%) |
| $20,000 to $24,999 | 20 (6.6%) | 0 (0.0%) |
| $25,000 to $34,999 | 16 (5.2%) | 0 (0.0%) |
| $35,000 to $49,999 | 8 (2.6%) | 16 (19.1%) |
| $50,000 to $74,999 | 39 (12.8%) | 4 (4.8%) |
| $75,000 to $99,999 | 64 (21.0%) | 0 (0.0%) |
| $100,000 to $149,999 | 48 (15.7%) | 8 (9.5%) |
| $150,000 or more | 107 (35.1%) | 6 (7.1%) |
| Total | 305 (100.0%) | 84 (100.0%) |
Monthly Housing Cost Tiers in Atglen borough
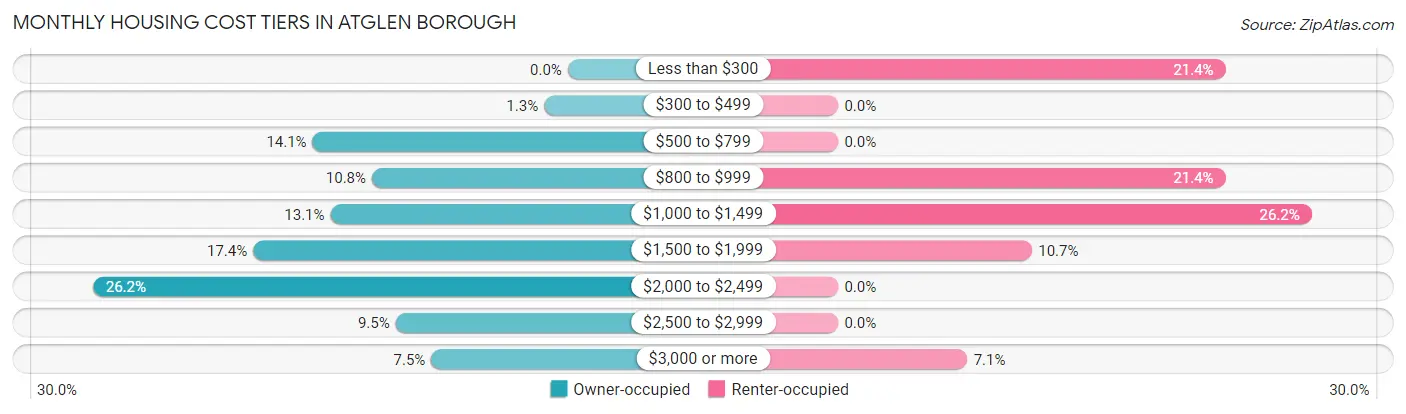
| Monthly Cost | Owner-occupied | Renter-occupied |
| Less than $300 | 0 (0.0%) | 18 (21.4%) |
| $300 to $499 | 4 (1.3%) | 0 (0.0%) |
| $500 to $799 | 43 (14.1%) | 0 (0.0%) |
| $800 to $999 | 33 (10.8%) | 18 (21.4%) |
| $1,000 to $1,499 | 40 (13.1%) | 22 (26.2%) |
| $1,500 to $1,999 | 53 (17.4%) | 9 (10.7%) |
| $2,000 to $2,499 | 80 (26.2%) | 0 (0.0%) |
| $2,500 to $2,999 | 29 (9.5%) | 0 (0.0%) |
| $3,000 or more | 23 (7.5%) | 6 (7.1%) |
| Total | 305 (100.0%) | 84 (100.0%) |
Physical Housing Characteristics in Atglen borough
Housing Structures in Atglen borough
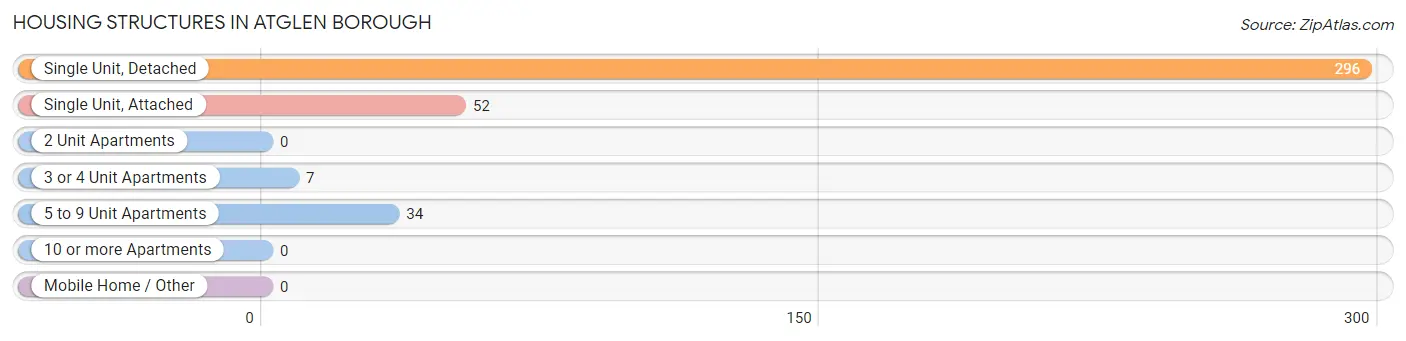
| Structure Type | # Housing Units | % Housing Units |
| Single Unit, Detached | 296 | 76.1% |
| Single Unit, Attached | 52 | 13.4% |
| 2 Unit Apartments | 0 | 0.0% |
| 3 or 4 Unit Apartments | 7 | 1.8% |
| 5 to 9 Unit Apartments | 34 | 8.7% |
| 10 or more Apartments | 0 | 0.0% |
| Mobile Home / Other | 0 | 0.0% |
| Total | 389 | 100.0% |
Housing Structures by Occupancy in Atglen borough
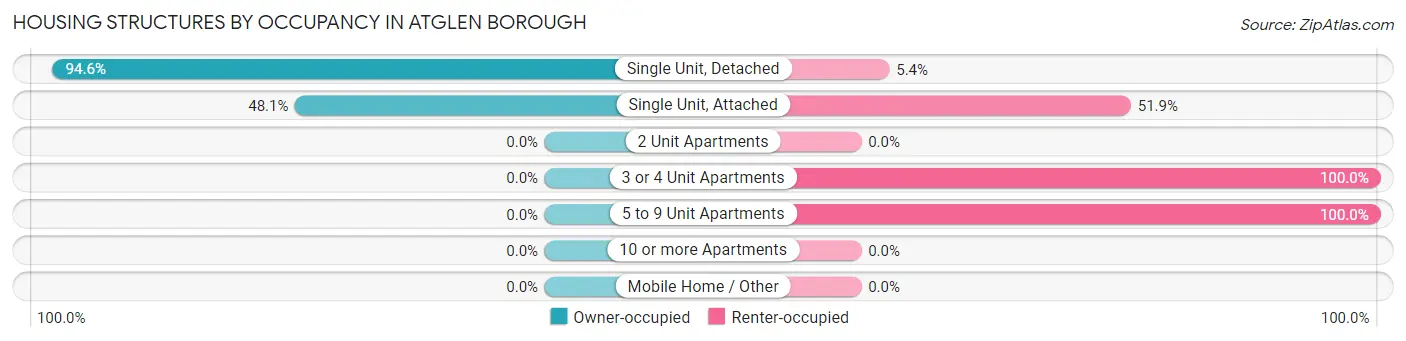
| Structure Type | Owner-occupied | Renter-occupied |
| Single Unit, Detached | 280 (94.6%) | 16 (5.4%) |
| Single Unit, Attached | 25 (48.1%) | 27 (51.9%) |
| 2 Unit Apartments | 0 (0.0%) | 0 (0.0%) |
| 3 or 4 Unit Apartments | 0 (0.0%) | 7 (100.0%) |
| 5 to 9 Unit Apartments | 0 (0.0%) | 34 (100.0%) |
| 10 or more Apartments | 0 (0.0%) | 0 (0.0%) |
| Mobile Home / Other | 0 (0.0%) | 0 (0.0%) |
| Total | 305 (78.4%) | 84 (21.6%) |
Housing Structures by Number of Rooms in Atglen borough
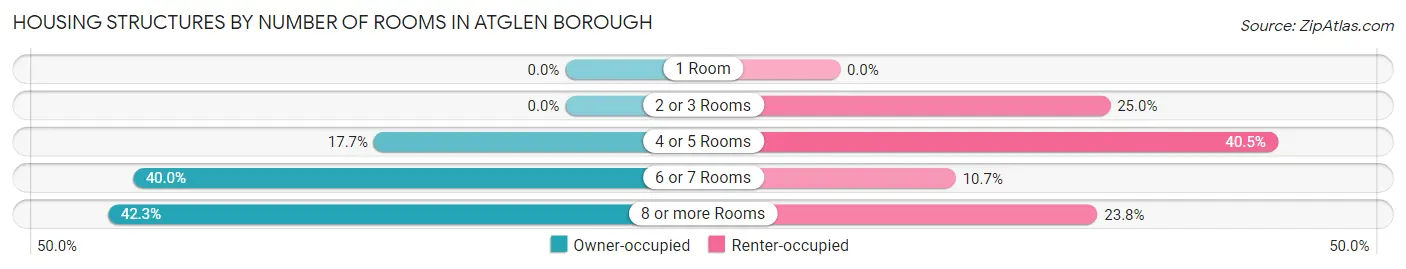
| Number of Rooms | Owner-occupied | Renter-occupied |
| 1 Room | 0 (0.0%) | 0 (0.0%) |
| 2 or 3 Rooms | 0 (0.0%) | 21 (25.0%) |
| 4 or 5 Rooms | 54 (17.7%) | 34 (40.5%) |
| 6 or 7 Rooms | 122 (40.0%) | 9 (10.7%) |
| 8 or more Rooms | 129 (42.3%) | 20 (23.8%) |
| Total | 305 (100.0%) | 84 (100.0%) |
Housing Structure by Heating Type in Atglen borough
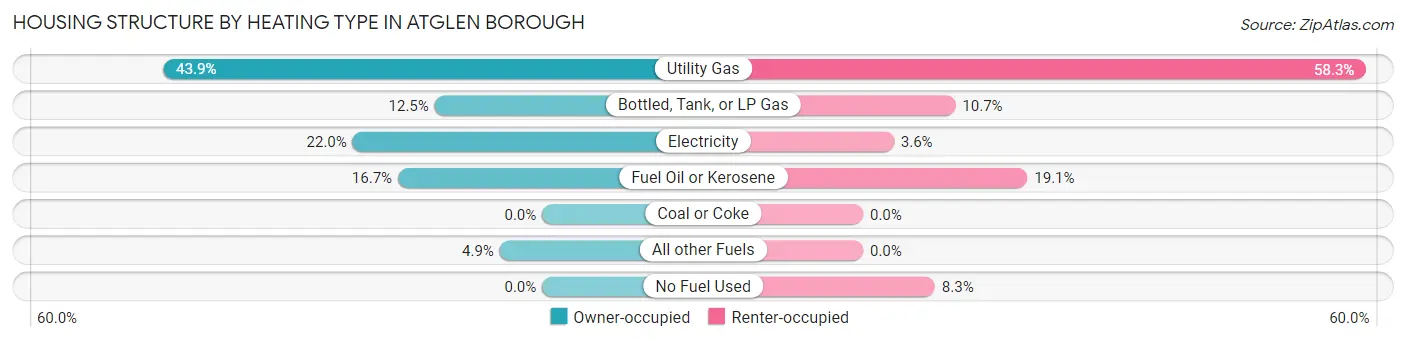
| Heating Type | Owner-occupied | Renter-occupied |
| Utility Gas | 134 (43.9%) | 49 (58.3%) |
| Bottled, Tank, or LP Gas | 38 (12.5%) | 9 (10.7%) |
| Electricity | 67 (22.0%) | 3 (3.6%) |
| Fuel Oil or Kerosene | 51 (16.7%) | 16 (19.1%) |
| Coal or Coke | 0 (0.0%) | 0 (0.0%) |
| All other Fuels | 15 (4.9%) | 0 (0.0%) |
| No Fuel Used | 0 (0.0%) | 7 (8.3%) |
| Total | 305 (100.0%) | 84 (100.0%) |
Household Vehicle Usage in Atglen borough
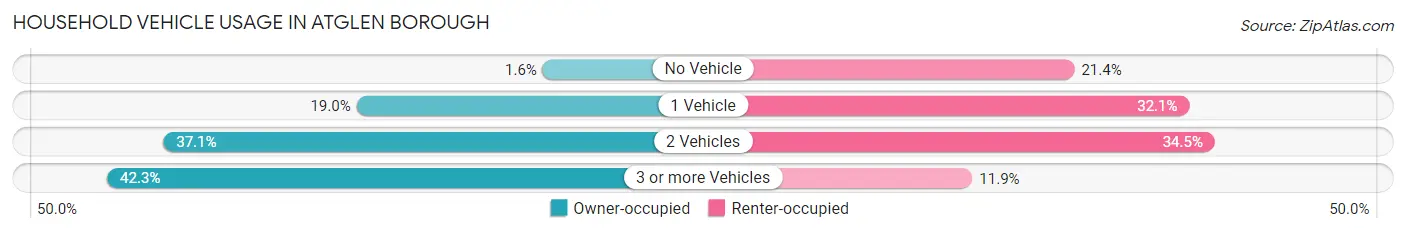
| Vehicles per Household | Owner-occupied | Renter-occupied |
| No Vehicle | 5 (1.6%) | 18 (21.4%) |
| 1 Vehicle | 58 (19.0%) | 27 (32.1%) |
| 2 Vehicles | 113 (37.0%) | 29 (34.5%) |
| 3 or more Vehicles | 129 (42.3%) | 10 (11.9%) |
| Total | 305 (100.0%) | 84 (100.0%) |
Real Estate & Mortgages in Atglen borough
Real Estate and Mortgage Overview in Atglen borough
| Characteristic | Without Mortgage | With Mortgage |
| Housing Units | 97 | 208 |
| Median Property Value | $199,300 | $274,000 |
| Median Household Income | $77,031 | $76 |
| Monthly Housing Costs | $820 | $23 |
| Real Estate Taxes | $5,446 | $3 |
Property Value by Mortgage Status in Atglen borough
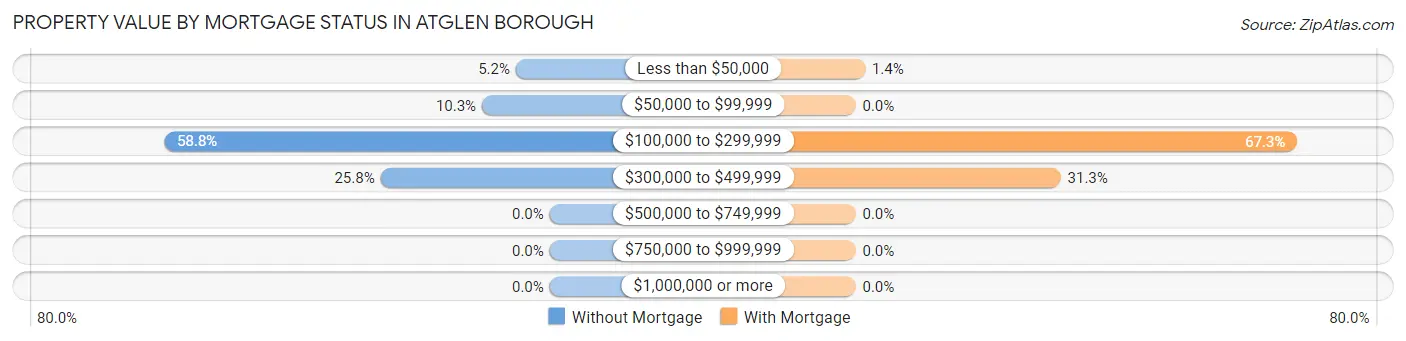
| Property Value | Without Mortgage | With Mortgage |
| Less than $50,000 | 5 (5.1%) | 3 (1.4%) |
| $50,000 to $99,999 | 10 (10.3%) | 0 (0.0%) |
| $100,000 to $299,999 | 57 (58.8%) | 140 (67.3%) |
| $300,000 to $499,999 | 25 (25.8%) | 65 (31.2%) |
| $500,000 to $749,999 | 0 (0.0%) | 0 (0.0%) |
| $750,000 to $999,999 | 0 (0.0%) | 0 (0.0%) |
| $1,000,000 or more | 0 (0.0%) | 0 (0.0%) |
| Total | 97 (100.0%) | 208 (100.0%) |
Household Income by Mortgage Status in Atglen borough
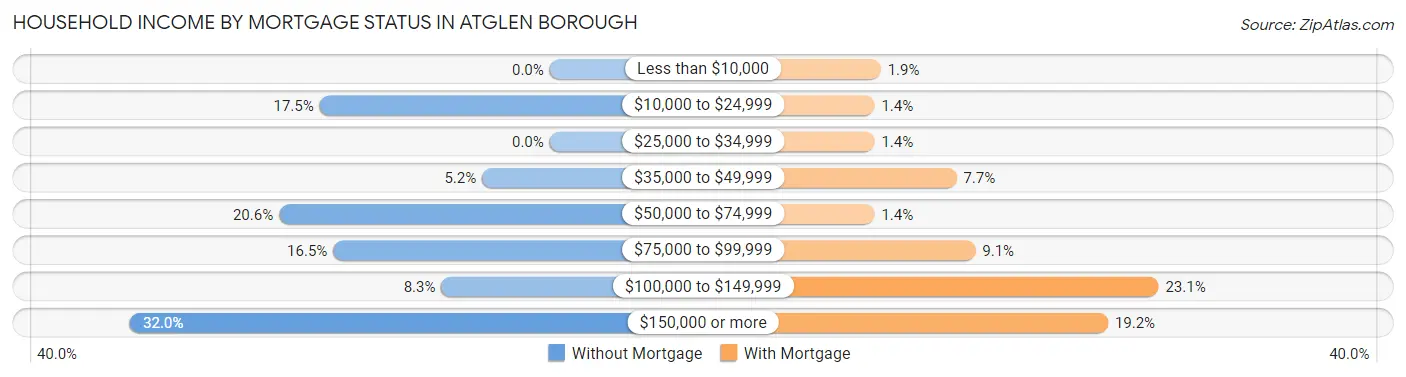
| Household Income | Without Mortgage | With Mortgage |
| Less than $10,000 | 0 (0.0%) | 4 (1.9%) |
| $10,000 to $24,999 | 17 (17.5%) | 3 (1.4%) |
| $25,000 to $34,999 | 0 (0.0%) | 3 (1.4%) |
| $35,000 to $49,999 | 5 (5.1%) | 16 (7.7%) |
| $50,000 to $74,999 | 20 (20.6%) | 3 (1.4%) |
| $75,000 to $99,999 | 16 (16.5%) | 19 (9.1%) |
| $100,000 to $149,999 | 8 (8.3%) | 48 (23.1%) |
| $150,000 or more | 31 (32.0%) | 40 (19.2%) |
| Total | 97 (100.0%) | 208 (100.0%) |
Property Value to Household Income Ratio in Atglen borough
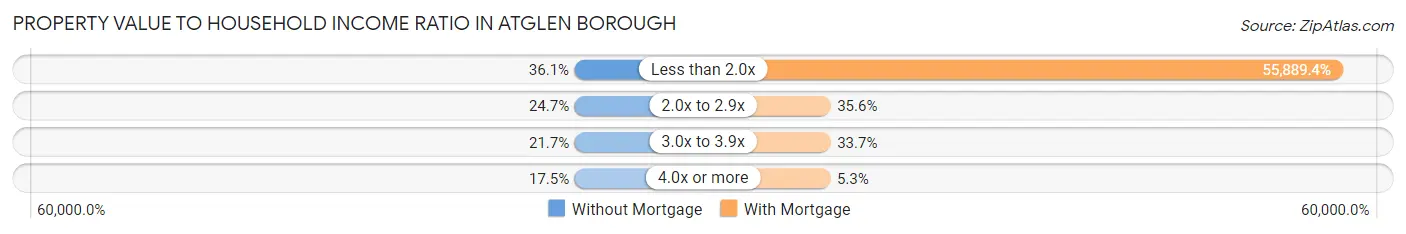
| Value-to-Income Ratio | Without Mortgage | With Mortgage |
| Less than 2.0x | 35 (36.1%) | 116,250 (55,889.4%) |
| 2.0x to 2.9x | 24 (24.7%) | 74 (35.6%) |
| 3.0x to 3.9x | 21 (21.6%) | 70 (33.7%) |
| 4.0x or more | 17 (17.5%) | 11 (5.3%) |
| Total | 97 (100.0%) | 208 (100.0%) |
Real Estate Taxes by Mortgage Status in Atglen borough
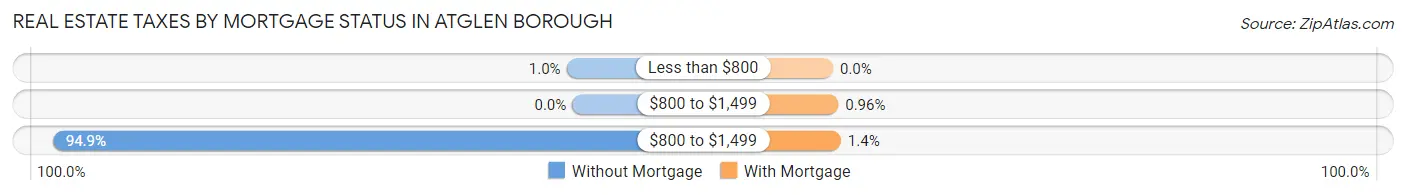
| Property Taxes | Without Mortgage | With Mortgage |
| Less than $800 | 1 (1.0%) | 0 (0.0%) |
| $800 to $1,499 | 0 (0.0%) | 2 (1.0%) |
| $800 to $1,499 | 92 (94.9%) | 3 (1.4%) |
| Total | 97 (100.0%) | 208 (100.0%) |
Health & Disability in Atglen borough
Health Insurance Coverage by Age in Atglen borough
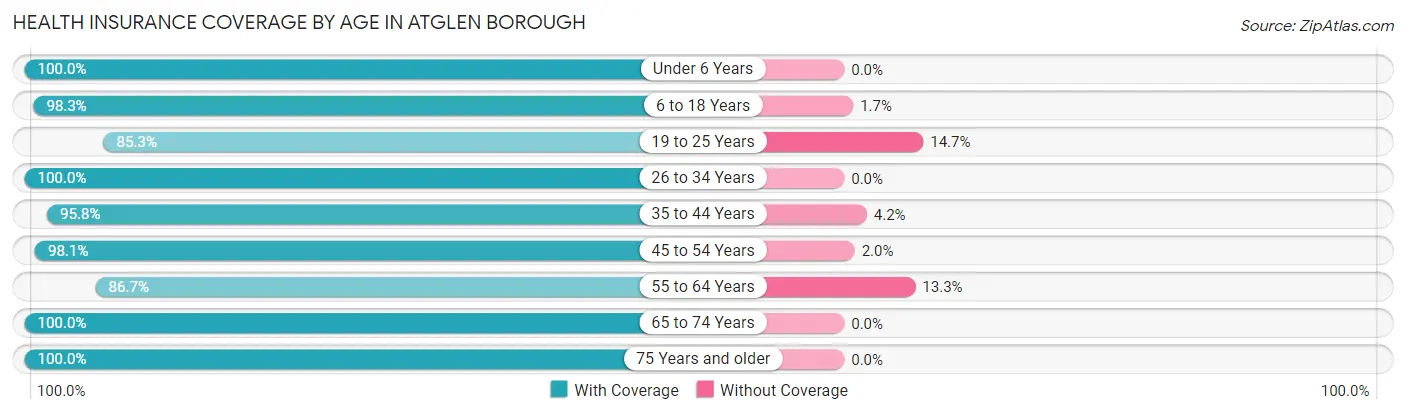
| Age Bracket | With Coverage | Without Coverage |
| Under 6 Years | 112 (100.0%) | 0 (0.0%) |
| 6 to 18 Years | 237 (98.3%) | 4 (1.7%) |
| 19 to 25 Years | 110 (85.3%) | 19 (14.7%) |
| 26 to 34 Years | 153 (100.0%) | 0 (0.0%) |
| 35 to 44 Years | 91 (95.8%) | 4 (4.2%) |
| 45 to 54 Years | 151 (98.1%) | 3 (1.9%) |
| 55 to 64 Years | 157 (86.7%) | 24 (13.3%) |
| 65 to 74 Years | 50 (100.0%) | 0 (0.0%) |
| 75 Years and older | 59 (100.0%) | 0 (0.0%) |
| Total | 1,120 (95.4%) | 54 (4.6%) |
Health Insurance Coverage by Citizenship Status in Atglen borough
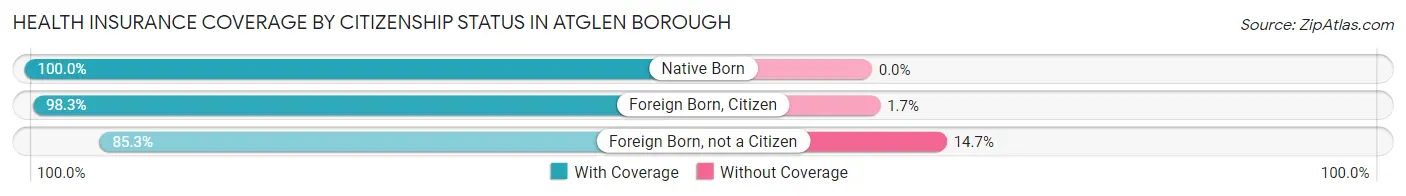
| Citizenship Status | With Coverage | Without Coverage |
| Native Born | 112 (100.0%) | 0 (0.0%) |
| Foreign Born, Citizen | 237 (98.3%) | 4 (1.7%) |
| Foreign Born, not a Citizen | 110 (85.3%) | 19 (14.7%) |
Health Insurance Coverage by Household Income in Atglen borough
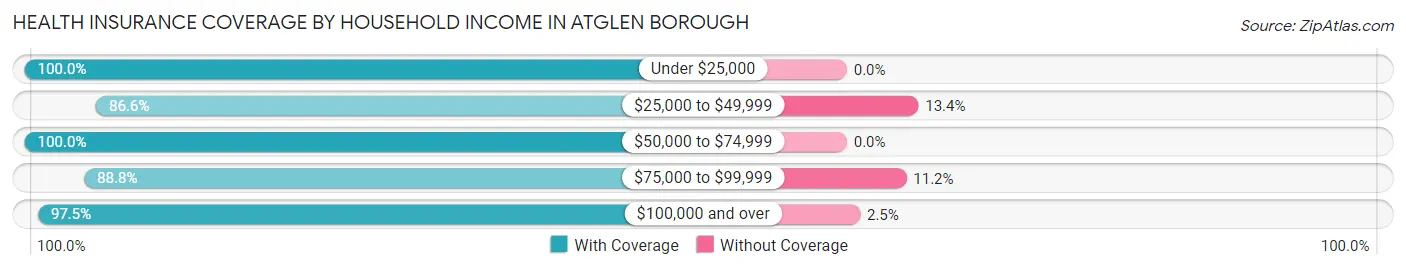
| Household Income | With Coverage | Without Coverage |
| Under $25,000 | 159 (100.0%) | 0 (0.0%) |
| $25,000 to $49,999 | 97 (86.6%) | 15 (13.4%) |
| $50,000 to $74,999 | 84 (100.0%) | 0 (0.0%) |
| $75,000 to $99,999 | 191 (88.8%) | 24 (11.2%) |
| $100,000 and over | 589 (97.5%) | 15 (2.5%) |
Public vs Private Health Insurance Coverage by Age in Atglen borough
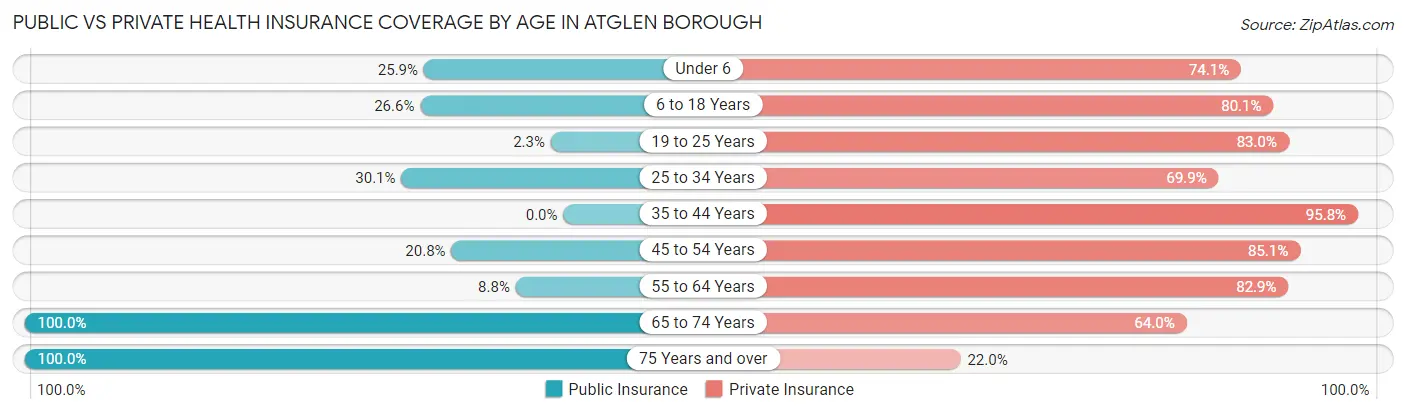
| Age Bracket | Public Insurance | Private Insurance |
| Under 6 | 29 (25.9%) | 83 (74.1%) |
| 6 to 18 Years | 64 (26.6%) | 193 (80.1%) |
| 19 to 25 Years | 3 (2.3%) | 107 (83.0%) |
| 25 to 34 Years | 46 (30.1%) | 107 (69.9%) |
| 35 to 44 Years | 0 (0.0%) | 91 (95.8%) |
| 45 to 54 Years | 32 (20.8%) | 131 (85.1%) |
| 55 to 64 Years | 16 (8.8%) | 150 (82.9%) |
| 65 to 74 Years | 50 (100.0%) | 32 (64.0%) |
| 75 Years and over | 59 (100.0%) | 13 (22.0%) |
| Total | 299 (25.5%) | 907 (77.3%) |
Disability Status by Sex by Age in Atglen borough
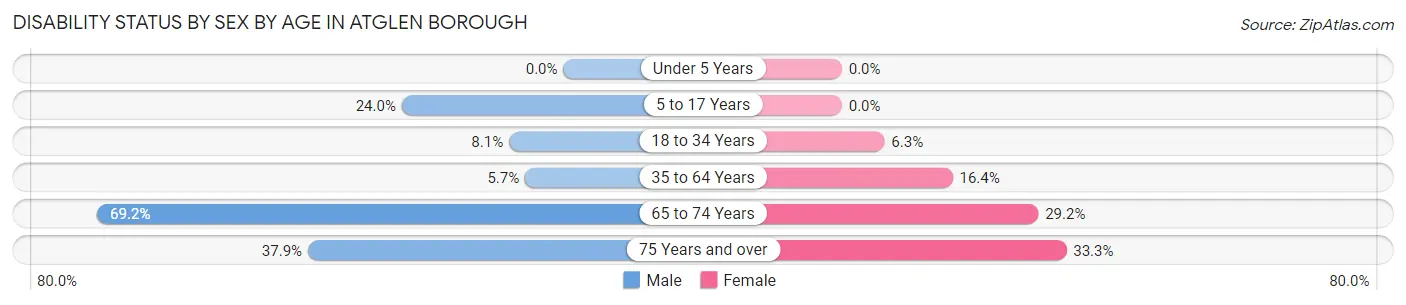
| Age Bracket | Male | Female |
| Under 5 Years | 0 (0.0%) | 0 (0.0%) |
| 5 to 17 Years | 24 (24.0%) | 0 (0.0%) |
| 18 to 34 Years | 13 (8.1%) | 10 (6.3%) |
| 35 to 64 Years | 12 (5.7%) | 36 (16.4%) |
| 65 to 74 Years | 18 (69.2%) | 7 (29.2%) |
| 75 Years and over | 11 (37.9%) | 10 (33.3%) |
Disability Class by Sex by Age in Atglen borough
Disability Class: Hearing Difficulty
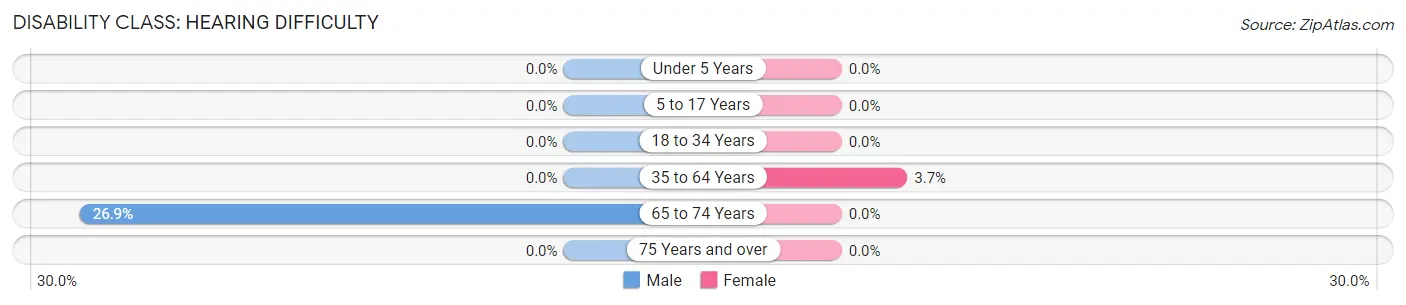
| Age Bracket | Male | Female |
| Under 5 Years | 0 (0.0%) | 0 (0.0%) |
| 5 to 17 Years | 0 (0.0%) | 0 (0.0%) |
| 18 to 34 Years | 0 (0.0%) | 0 (0.0%) |
| 35 to 64 Years | 0 (0.0%) | 8 (3.6%) |
| 65 to 74 Years | 7 (26.9%) | 0 (0.0%) |
| 75 Years and over | 0 (0.0%) | 0 (0.0%) |
Disability Class: Vision Difficulty
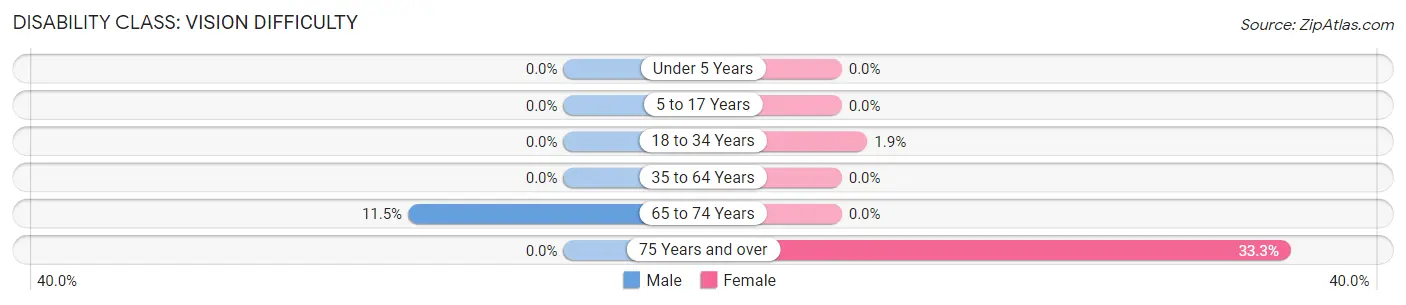
| Age Bracket | Male | Female |
| Under 5 Years | 0 (0.0%) | 0 (0.0%) |
| 5 to 17 Years | 0 (0.0%) | 0 (0.0%) |
| 18 to 34 Years | 0 (0.0%) | 3 (1.9%) |
| 35 to 64 Years | 0 (0.0%) | 0 (0.0%) |
| 65 to 74 Years | 3 (11.5%) | 0 (0.0%) |
| 75 Years and over | 0 (0.0%) | 10 (33.3%) |
Disability Class: Cognitive Difficulty
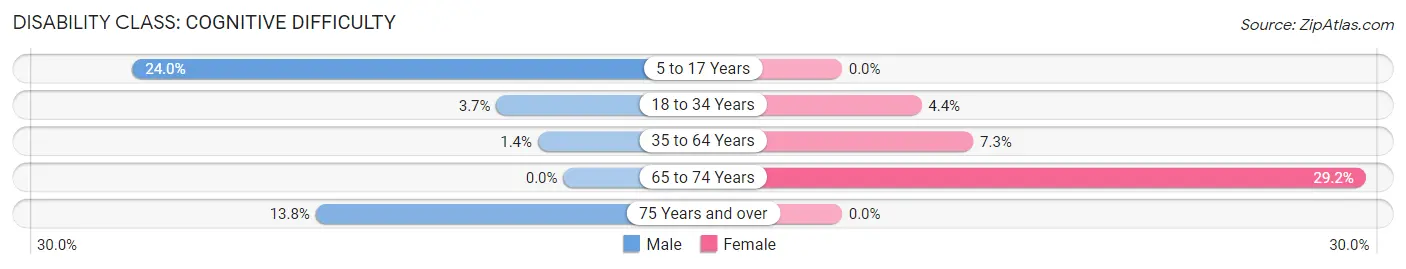
| Age Bracket | Male | Female |
| 5 to 17 Years | 24 (24.0%) | 0 (0.0%) |
| 18 to 34 Years | 6 (3.7%) | 7 (4.4%) |
| 35 to 64 Years | 3 (1.4%) | 16 (7.3%) |
| 65 to 74 Years | 0 (0.0%) | 7 (29.2%) |
| 75 Years and over | 4 (13.8%) | 0 (0.0%) |
Disability Class: Ambulatory Difficulty
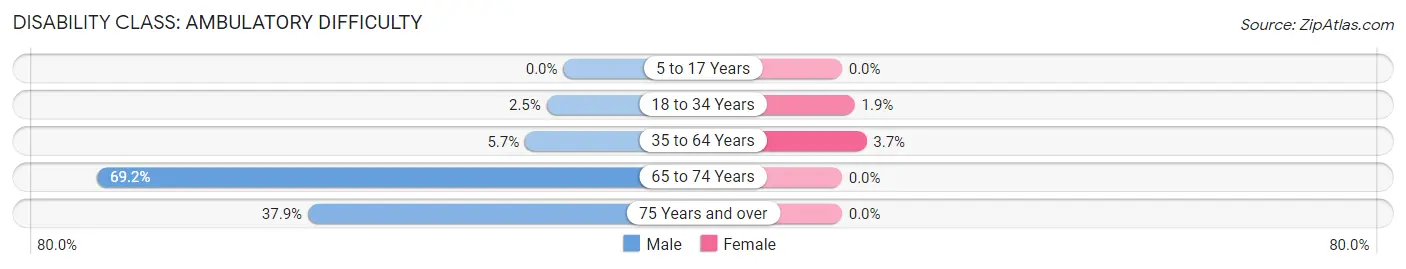
| Age Bracket | Male | Female |
| 5 to 17 Years | 0 (0.0%) | 0 (0.0%) |
| 18 to 34 Years | 4 (2.5%) | 3 (1.9%) |
| 35 to 64 Years | 12 (5.7%) | 8 (3.6%) |
| 65 to 74 Years | 18 (69.2%) | 0 (0.0%) |
| 75 Years and over | 11 (37.9%) | 0 (0.0%) |
Disability Class: Self-Care Difficulty
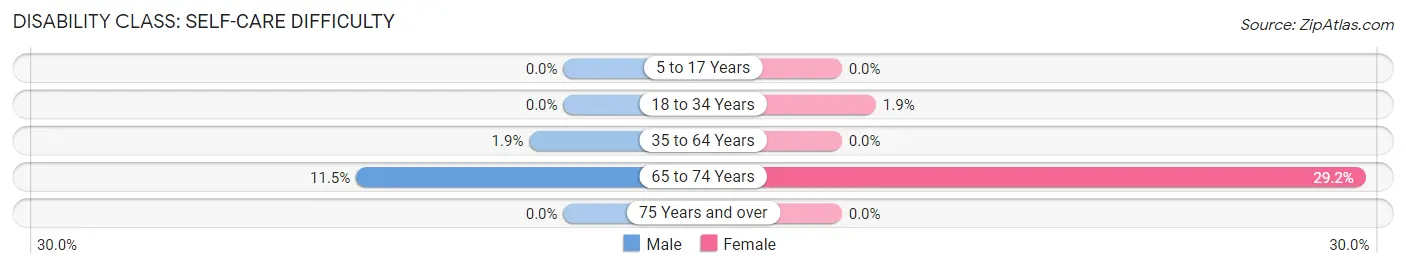
| Age Bracket | Male | Female |
| 5 to 17 Years | 0 (0.0%) | 0 (0.0%) |
| 18 to 34 Years | 0 (0.0%) | 3 (1.9%) |
| 35 to 64 Years | 4 (1.9%) | 0 (0.0%) |
| 65 to 74 Years | 3 (11.5%) | 7 (29.2%) |
| 75 Years and over | 0 (0.0%) | 0 (0.0%) |
Technology Access in Atglen borough
Computing Device Access in Atglen borough
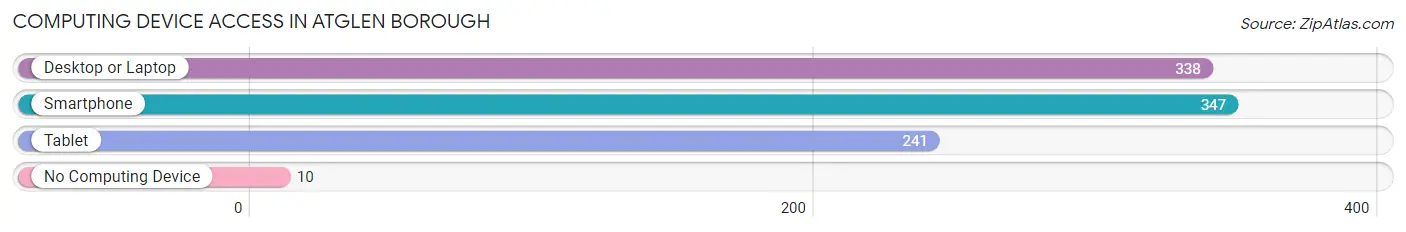
| Device Type | # Households | % Households |
| Desktop or Laptop | 338 | 86.9% |
| Smartphone | 347 | 89.2% |
| Tablet | 241 | 62.0% |
| No Computing Device | 10 | 2.6% |
| Total | 389 | 100.0% |
Internet Access in Atglen borough
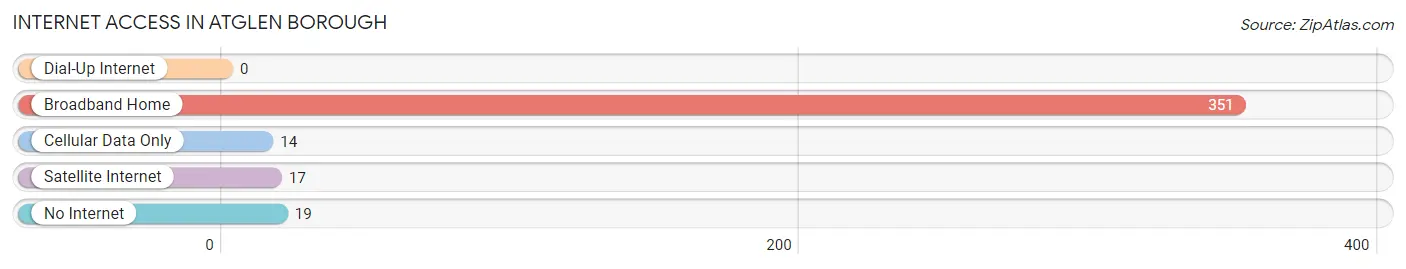
| Internet Type | # Households | % Households |
| Dial-Up Internet | 0 | 0.0% |
| Broadband Home | 351 | 90.2% |
| Cellular Data Only | 14 | 3.6% |
| Satellite Internet | 17 | 4.4% |
| No Internet | 19 | 4.9% |
| Total | 389 | 100.0% |
Atglen borough Summary
Atglen Borough is a small borough located in Chester County, Pennsylvania. It is situated in the southeastern corner of the county, approximately 25 miles west of Philadelphia. The borough is bordered by West Sadsbury Township to the north, Highland Township to the east, West Fallowfield Township to the south, and West Brandywine Township to the west. As of the 2010 census, the population of Atglen Borough was 1,092.
History
Atglen Borough was founded in 1851 by a group of settlers from the nearby town of Atglen. The settlers purchased a tract of land from the local Native American tribe, the Lenni Lenape, and established the borough. The name Atglen is derived from the Lenni Lenape word for “at the glen”, referring to the nearby glen in the area.
The borough was originally a farming community, with the main crops being wheat, corn, and oats. In the late 19th century, the borough began to industrialize, with the establishment of several factories, including a paper mill, a brickyard, and a sawmill. The paper mill was the largest employer in the borough, and it remained in operation until the early 20th century.
In the early 20th century, the borough began to experience a population boom, as many people moved to the area from Philadelphia and other nearby cities. This population growth led to the establishment of several businesses, including a grocery store, a hardware store, and a post office.
Geography
Atglen Borough is located in southeastern Chester County, approximately 25 miles west of Philadelphia. The borough is bordered by West Sadsbury Township to the north, Highland Township to the east, West Fallowfield Township to the south, and West Brandywine Township to the west.
The borough is situated in the Piedmont region of Pennsylvania, and is characterized by rolling hills and valleys. The borough is located in the watershed of the Brandywine Creek, which flows through the borough from the north to the south.
Economy
Atglen Borough’s economy is largely based on agriculture and light industry. The borough is home to several farms, which produce a variety of crops, including wheat, corn, and oats. The borough is also home to several small businesses, including a grocery store, a hardware store, and a post office.
Demographics
As of the 2010 census, the population of Atglen Borough was 1,092. The racial makeup of the borough was 94.3% White, 2.7% African American, 0.3% Native American, 0.7% Asian, 0.1% Pacific Islander, 0.7% from other races, and 1.2% from two or more races. Hispanic or Latino of any race were 2.2% of the population.
The median household income in Atglen Borough was $50,938, and the median family income was $60,000. The per capita income for the borough was $25,938. About 8.3% of families and 10.2% of the population were below the poverty line, including 14.3% of those under age 18 and 5.2% of those age 65 or over.
Common Questions
What is Per Capita Income in Atglen borough?
Per Capita income in Atglen borough is $37,191.
What is the Median Family Income in Atglen borough?
Median Family Income in Atglen borough is $99,167.
What is the Median Household income in Atglen borough?
Median Household Income in Atglen borough is $86,688.
What is Income or Wage Gap in Atglen borough?
Income or Wage Gap in Atglen borough is 40.6%.
Women in Atglen borough earn 59.4 cents for every dollar earned by a man.
What is Inequality or Gini Index in Atglen borough?
Inequality or Gini Index in Atglen borough is 0.44.
What is the Total Population of Atglen borough?
Total Population of Atglen borough is 1,174.
What is the Total Male Population of Atglen borough?
Total Male Population of Atglen borough is 588.
What is the Total Female Population of Atglen borough?
Total Female Population of Atglen borough is 586.
What is the Ratio of Males per 100 Females in Atglen borough?
There are 100.34 Males per 100 Females in Atglen borough.
What is the Ratio of Females per 100 Males in Atglen borough?
There are 99.66 Females per 100 Males in Atglen borough.
What is the Median Population Age in Atglen borough?
Median Population Age in Atglen borough is 31.4 Years.
What is the Average Family Size in Atglen borough
Average Family Size in Atglen borough is 3.2 People.
What is the Average Household Size in Atglen borough
Average Household Size in Atglen borough is 3.0 People.
How Large is the Labor Force in Atglen borough?
There are 643 People in the Labor Forcein in Atglen borough.
What is the Percentage of People in the Labor Force in Atglen borough?
72.9% of People are in the Labor Force in Atglen borough.
What is the Unemployment Rate in Atglen borough?
Unemployment Rate in Atglen borough is 1.4%.