Grove City borough, PA Map & Demographics
Grove City borough Overview
$25,447
PER CAPITA INCOME
$92,344
AVG FAMILY INCOME
$58,900
AVG HOUSEHOLD INCOME
43.2%
WAGE / INCOME GAP [ % ]
56.8¢/ $1
WAGE / INCOME GAP [ $ ]
0.43
INEQUALITY / GINI INDEX
7,908
TOTAL POPULATION
3,908
MALE POPULATION
4,000
FEMALE POPULATION
97.70
MALES / 100 FEMALES
102.35
FEMALES / 100 MALES
24.4
MEDIAN AGE
2.8
AVG FAMILY SIZE
2.1
AVG HOUSEHOLD SIZE
3,772
LABOR FORCE [ PEOPLE ]
53.4%
PERCENT IN LABOR FORCE
4.9%
UNEMPLOYMENT RATE
Income in Grove City borough
Income Overview in Grove City borough
Per Capita Income in Grove City borough is $25,447, while median incomes of families and households are $92,344 and $58,900 respectively.
| Characteristic | Number | Measure |
| Per Capita Income | 7,908 | $25,447 |
| Median Family Income | 1,378 | $92,344 |
| Mean Family Income | 1,378 | $99,451 |
| Median Household Income | 2,520 | $58,900 |
| Mean Household Income | 2,520 | $74,341 |
| Income Deficit | 1,378 | $0 |
| Wage / Income Gap (%) | 7,908 | 43.19% |
| Wage / Income Gap ($) | 7,908 | 56.81¢ per $1 |
| Gini / Inequality Index | 7,908 | 0.43 |
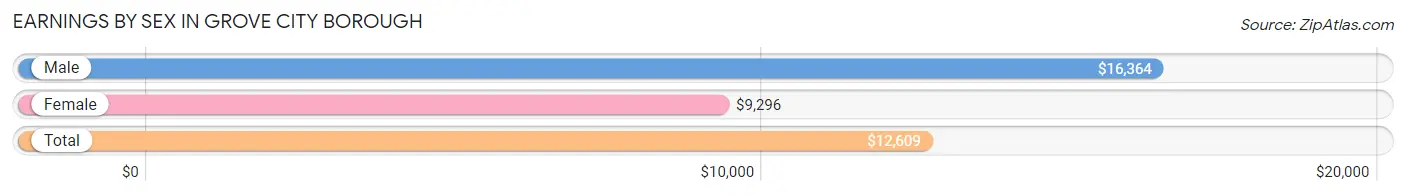
Earnings by Sex in Grove City borough
Average Earnings in Grove City borough are $12,609, $16,364 for men and $9,296 for women, a difference of 43.2%.
| Sex | Number | Average Earnings |
| Male | 2,654 (52.1%) | $16,364 |
| Female | 2,438 (47.9%) | $9,296 |
| Total | 5,092 (100.0%) | $12,609 |
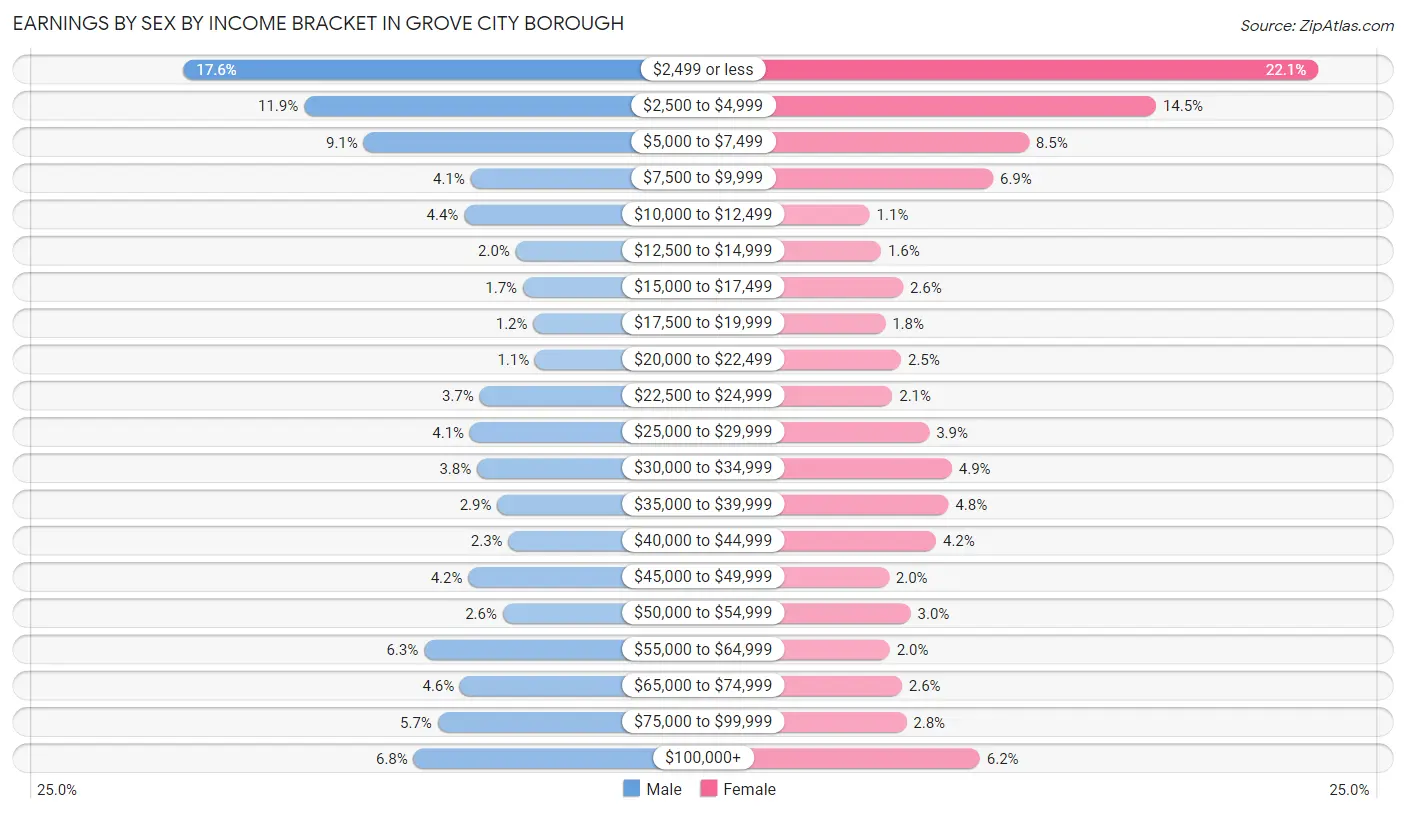
Earnings by Sex by Income Bracket in Grove City borough
The most common earnings brackets in Grove City borough are $2,499 or less for men (466 | 17.6%) and $2,499 or less for women (538 | 22.1%).
| Income | Male | Female |
| $2,499 or less | 466 (17.6%) | 538 (22.1%) |
| $2,500 to $4,999 | 316 (11.9%) | 353 (14.5%) |
| $5,000 to $7,499 | 242 (9.1%) | 208 (8.5%) |
| $7,500 to $9,999 | 109 (4.1%) | 167 (6.9%) |
| $10,000 to $12,499 | 117 (4.4%) | 26 (1.1%) |
| $12,500 to $14,999 | 53 (2.0%) | 39 (1.6%) |
| $15,000 to $17,499 | 44 (1.7%) | 64 (2.6%) |
| $17,500 to $19,999 | 31 (1.2%) | 44 (1.8%) |
| $20,000 to $22,499 | 29 (1.1%) | 62 (2.5%) |
| $22,500 to $24,999 | 98 (3.7%) | 52 (2.1%) |
| $25,000 to $29,999 | 110 (4.1%) | 94 (3.9%) |
| $30,000 to $34,999 | 101 (3.8%) | 120 (4.9%) |
| $35,000 to $39,999 | 76 (2.9%) | 116 (4.8%) |
| $40,000 to $44,999 | 62 (2.3%) | 102 (4.2%) |
| $45,000 to $49,999 | 112 (4.2%) | 48 (2.0%) |
| $50,000 to $54,999 | 69 (2.6%) | 73 (3.0%) |
| $55,000 to $64,999 | 167 (6.3%) | 49 (2.0%) |
| $65,000 to $74,999 | 122 (4.6%) | 63 (2.6%) |
| $75,000 to $99,999 | 150 (5.7%) | 68 (2.8%) |
| $100,000+ | 180 (6.8%) | 152 (6.2%) |
| Total | 2,654 (100.0%) | 2,438 (100.0%) |
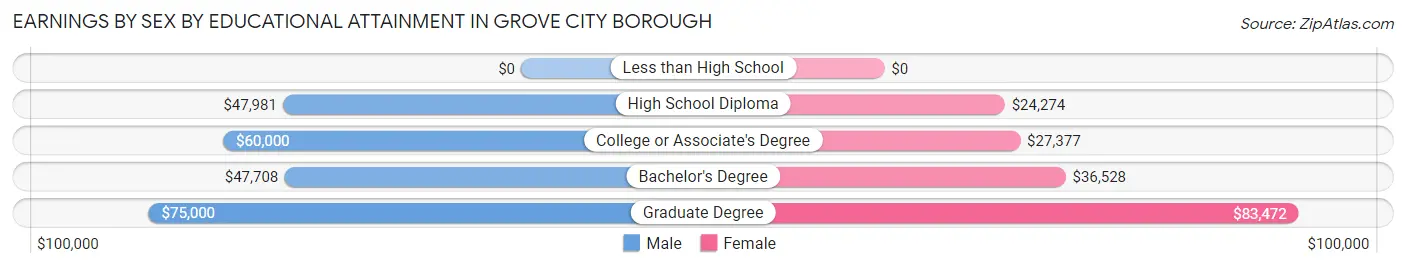
Earnings by Sex by Educational Attainment in Grove City borough
Average earnings in Grove City borough are $52,100 for men and $37,917 for women, a difference of 27.2%. Men with an educational attainment of graduate degree enjoy the highest average annual earnings of $75,000, while those with bachelor's degree education earn the least with $47,708. Women with an educational attainment of graduate degree earn the most with the average annual earnings of $83,472, while those with high school diploma education have the smallest earnings of $24,274.
| Educational Attainment | Male Income | Female Income |
| Less than High School | - | - |
| High School Diploma | $47,981 | $24,274 |
| College or Associate's Degree | $60,000 | $27,377 |
| Bachelor's Degree | $47,708 | $36,528 |
| Graduate Degree | $75,000 | $83,472 |
| Total | $52,100 | $37,917 |
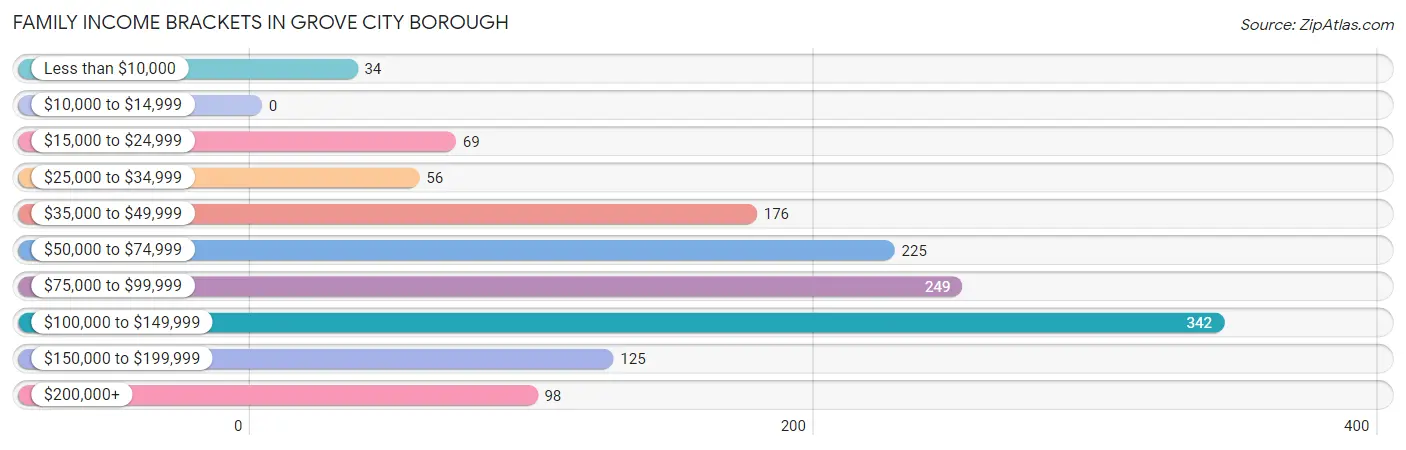
Family Income in Grove City borough
Family Income Brackets in Grove City borough
According to the Grove City borough family income data, there are 342 families falling into the $100,000 to $149,999 income range, which is the most common income bracket and makes up 24.8% of all families.
| Income Bracket | # Families | % Families |
| Less than $10,000 | 34 | 2.5% |
| $10,000 to $14,999 | 0 | 0.0% |
| $15,000 to $24,999 | 69 | 5.0% |
| $25,000 to $34,999 | 56 | 4.1% |
| $35,000 to $49,999 | 176 | 12.8% |
| $50,000 to $74,999 | 225 | 16.3% |
| $75,000 to $99,999 | 249 | 18.1% |
| $100,000 to $149,999 | 342 | 24.8% |
| $150,000 to $199,999 | 125 | 9.1% |
| $200,000+ | 98 | 7.1% |
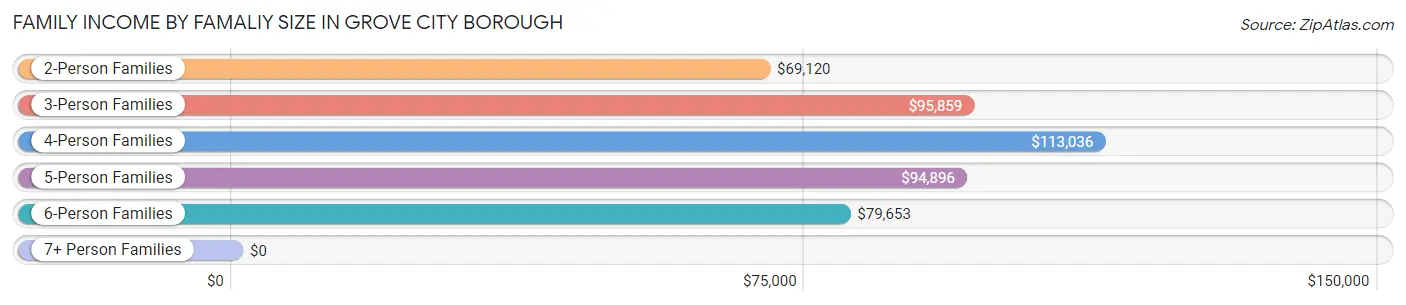
Family Income by Famaliy Size in Grove City borough
4-person families (227 | 16.5%) account for the highest median family income in Grove City borough with $113,036 per family, while 2-person families (715 | 51.9%) have the highest median income of $34,560 per family member.
| Income Bracket | # Families | Median Income |
| 2-Person Families | 715 (51.9%) | $69,120 |
| 3-Person Families | 289 (21.0%) | $95,859 |
| 4-Person Families | 227 (16.5%) | $113,036 |
| 5-Person Families | 89 (6.5%) | $94,896 |
| 6-Person Families | 41 (3.0%) | $79,653 |
| 7+ Person Families | 17 (1.2%) | $0 |
| Total | 1,378 (100.0%) | $92,344 |
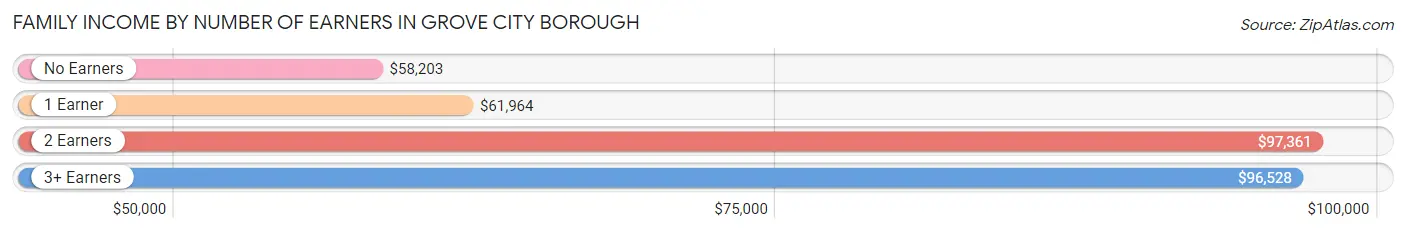
Family Income by Number of Earners in Grove City borough
The median family income in Grove City borough is $92,344, with families comprising 2 earners (631) having the highest median family income of $97,361, while families with no earners (167) have the lowest median family income of $58,203, accounting for 45.8% and 12.1% of families, respectively.
| Number of Earners | # Families | Median Income |
| No Earners | 167 (12.1%) | $58,203 |
| 1 Earner | 397 (28.8%) | $61,964 |
| 2 Earners | 631 (45.8%) | $97,361 |
| 3+ Earners | 183 (13.3%) | $96,528 |
| Total | 1,378 (100.0%) | $92,344 |
Household Income in Grove City borough
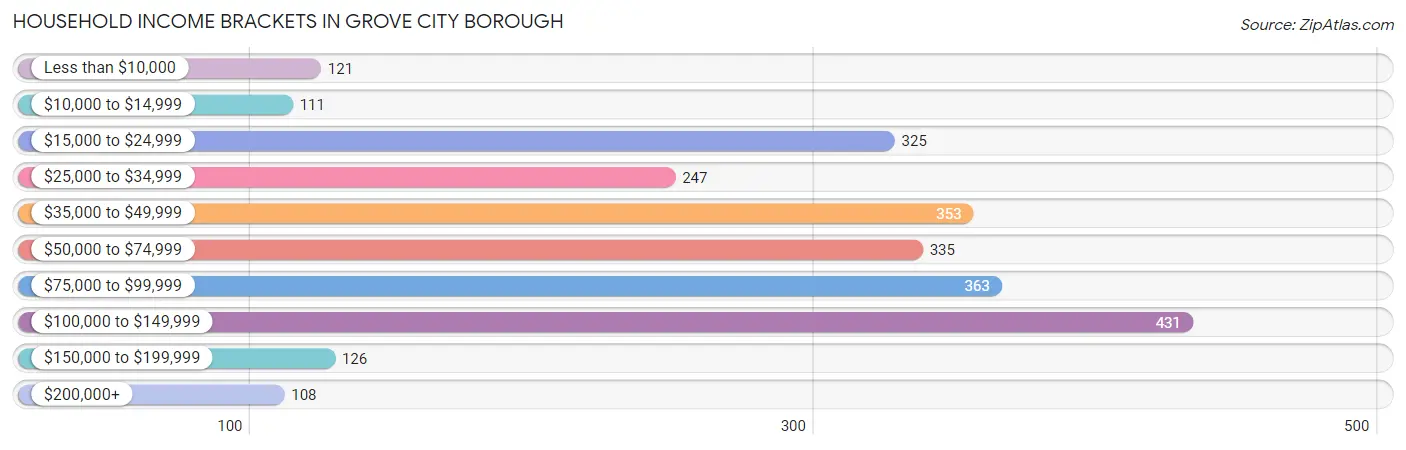
Household Income Brackets in Grove City borough
With 431 households falling in the category, the $100,000 to $149,999 income range is the most frequent in Grove City borough, accounting for 17.1% of all households. In contrast, only 108 households (4.3%) fall into the $200,000+ income bracket, making it the least populous group.
| Income Bracket | # Households | % Households |
| Less than $10,000 | 121 | 4.8% |
| $10,000 to $14,999 | 111 | 4.4% |
| $15,000 to $24,999 | 325 | 12.9% |
| $25,000 to $34,999 | 247 | 9.8% |
| $35,000 to $49,999 | 353 | 14.0% |
| $50,000 to $74,999 | 335 | 13.3% |
| $75,000 to $99,999 | 363 | 14.4% |
| $100,000 to $149,999 | 431 | 17.1% |
| $150,000 to $199,999 | 126 | 5.0% |
| $200,000+ | 108 | 4.3% |
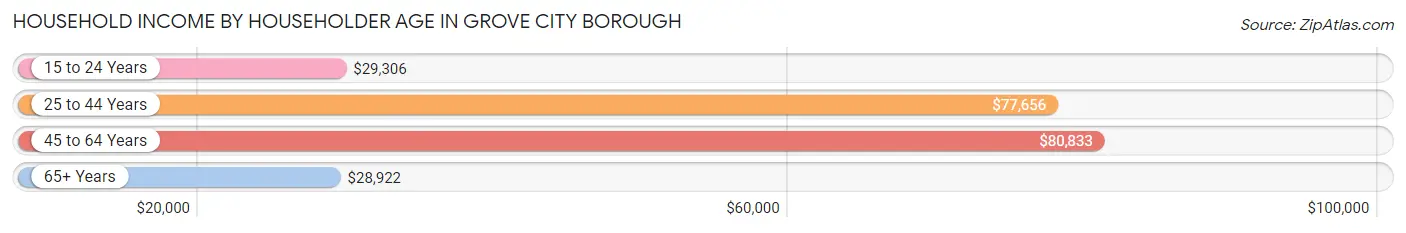
Household Income by Householder Age in Grove City borough
The median household income in Grove City borough is $58,900, with the highest median household income of $80,833 found in the 45 to 64 years age bracket for the primary householder. A total of 866 households (34.4%) fall into this category. Meanwhile, the 65+ years age bracket for the primary householder has the lowest median household income of $28,922, with 716 households (28.4%) in this group.
| Income Bracket | # Households | Median Income |
| 15 to 24 Years | 167 (6.6%) | $29,306 |
| 25 to 44 Years | 771 (30.6%) | $77,656 |
| 45 to 64 Years | 866 (34.4%) | $80,833 |
| 65+ Years | 716 (28.4%) | $28,922 |
| Total | 2,520 (100.0%) | $58,900 |
Poverty in Grove City borough
Income Below Poverty by Sex and Age in Grove City borough
With 7.7% poverty level for males and 14.1% for females among the residents of Grove City borough, under 5 year old males and 16 and 17 year old females are the most vulnerable to poverty, with 41 males (31.8%) and 25 females (38.5%) in their respective age groups living below the poverty level.
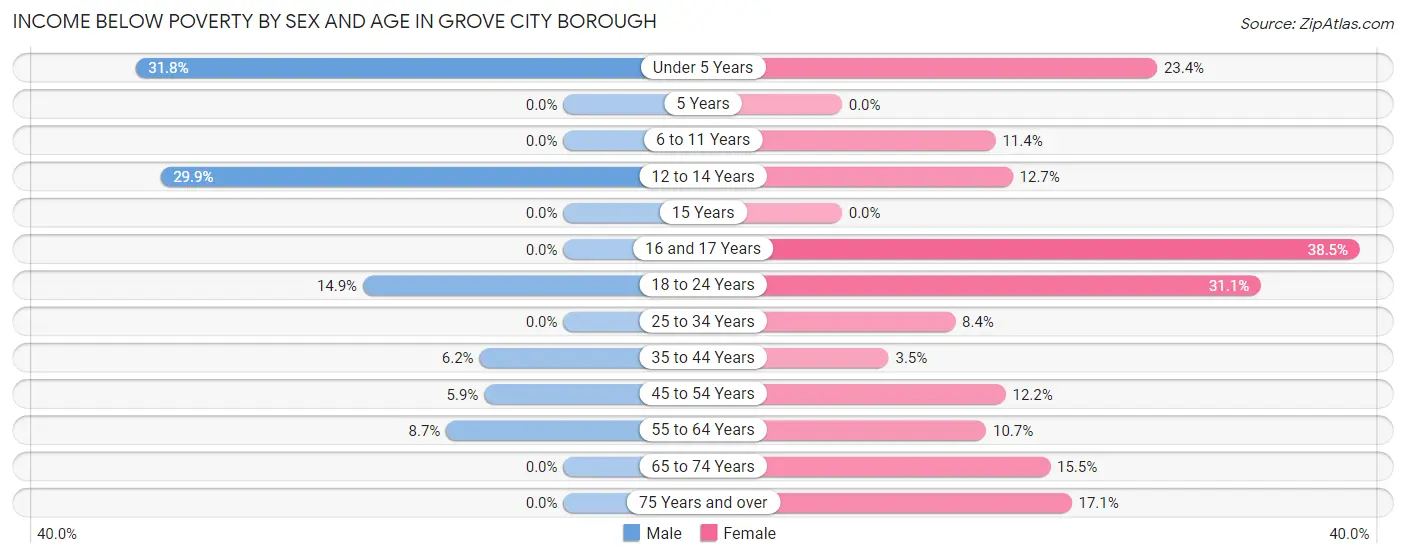
| Age Bracket | Male | Female |
| Under 5 Years | 41 (31.8%) | 11 (23.4%) |
| 5 Years | 0 (0.0%) | 0 (0.0%) |
| 6 to 11 Years | 0 (0.0%) | 21 (11.4%) |
| 12 to 14 Years | 44 (29.9%) | 9 (12.7%) |
| 15 Years | 0 (0.0%) | 0 (0.0%) |
| 16 and 17 Years | 0 (0.0%) | 25 (38.5%) |
| 18 to 24 Years | 43 (14.9%) | 89 (31.1%) |
| 25 to 34 Years | 0 (0.0%) | 29 (8.4%) |
| 35 to 44 Years | 19 (6.2%) | 10 (3.5%) |
| 45 to 54 Years | 19 (5.9%) | 58 (12.2%) |
| 55 to 64 Years | 28 (8.7%) | 30 (10.7%) |
| 65 to 74 Years | 0 (0.0%) | 60 (15.5%) |
| 75 Years and over | 0 (0.0%) | 51 (17.1%) |
| Total | 194 (7.7%) | 393 (14.1%) |
Income Above Poverty by Sex and Age in Grove City borough
According to the poverty statistics in Grove City borough, males aged 5 years and females aged 5 years are the age groups that are most secure financially, with 100.0% of males and 100.0% of females in these age groups living above the poverty line.
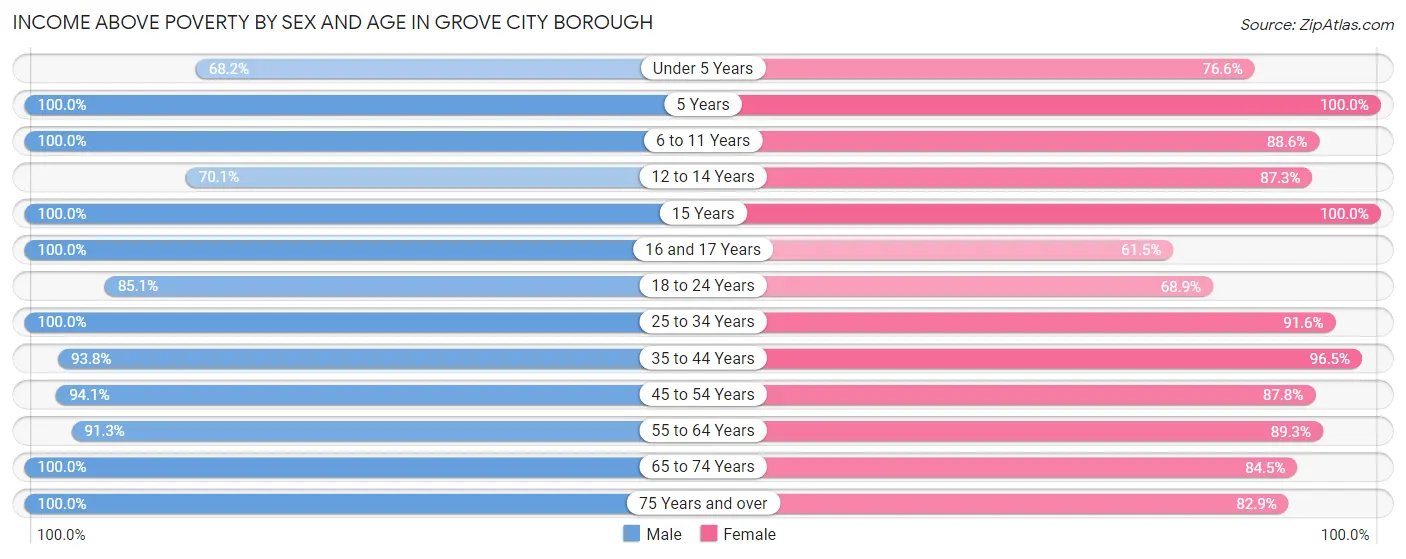
| Age Bracket | Male | Female |
| Under 5 Years | 88 (68.2%) | 36 (76.6%) |
| 5 Years | 13 (100.0%) | 29 (100.0%) |
| 6 to 11 Years | 107 (100.0%) | 163 (88.6%) |
| 12 to 14 Years | 103 (70.1%) | 62 (87.3%) |
| 15 Years | 43 (100.0%) | 24 (100.0%) |
| 16 and 17 Years | 147 (100.0%) | 40 (61.5%) |
| 18 to 24 Years | 246 (85.1%) | 197 (68.9%) |
| 25 to 34 Years | 399 (100.0%) | 316 (91.6%) |
| 35 to 44 Years | 286 (93.8%) | 278 (96.5%) |
| 45 to 54 Years | 304 (94.1%) | 419 (87.8%) |
| 55 to 64 Years | 294 (91.3%) | 250 (89.3%) |
| 65 to 74 Years | 118 (100.0%) | 328 (84.5%) |
| 75 Years and over | 163 (100.0%) | 248 (82.9%) |
| Total | 2,311 (92.3%) | 2,390 (85.9%) |
Income Below Poverty Among Married-Couple Families in Grove City borough
The poverty statistics for married-couple families in Grove City borough show that 2.7% or 29 of the total 1,077 families live below the poverty line. Families with 5 or more children have the highest poverty rate of 100.0%, comprising of 10 families. On the other hand, families with no children have the lowest poverty rate of 0.0%, which includes 0 families.
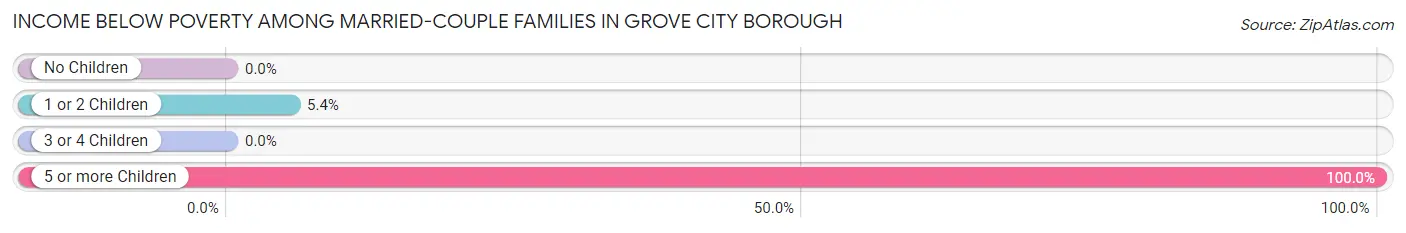
| Children | Above Poverty | Below Poverty |
| No Children | 638 (100.0%) | 0 (0.0%) |
| 1 or 2 Children | 333 (94.6%) | 19 (5.4%) |
| 3 or 4 Children | 77 (100.0%) | 0 (0.0%) |
| 5 or more Children | 0 (0.0%) | 10 (100.0%) |
| Total | 1,048 (97.3%) | 29 (2.7%) |
Income Below Poverty Among Single-Parent Households in Grove City borough
According to the poverty data in Grove City borough, 27.5% or 22 single-father households and 19.9% or 44 single-mother households are living below the poverty line. Among single-father households, those with no children have the highest poverty rate, with 15 households (71.4%) experiencing poverty. Likewise, among single-mother households, those with 1 or 2 children have the highest poverty rate, with 44 households (36.4%) falling below the poverty line.
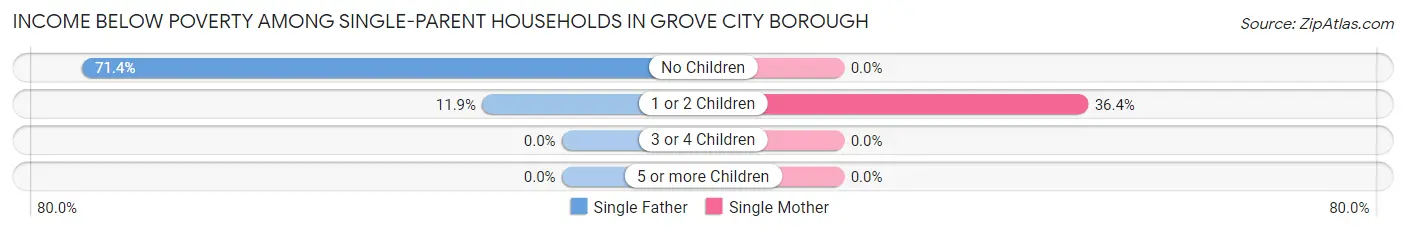
| Children | Single Father | Single Mother |
| No Children | 15 (71.4%) | 0 (0.0%) |
| 1 or 2 Children | 7 (11.9%) | 44 (36.4%) |
| 3 or 4 Children | 0 (0.0%) | 0 (0.0%) |
| 5 or more Children | 0 (0.0%) | 0 (0.0%) |
| Total | 22 (27.5%) | 44 (19.9%) |
Income Below Poverty Among Married-Couple vs Single-Parent Households in Grove City borough
The poverty data for Grove City borough shows that 29 of the married-couple family households (2.7%) and 66 of the single-parent households (21.9%) are living below the poverty level. Within the married-couple family households, those with 5 or more children have the highest poverty rate, with 10 households (100.0%) falling below the poverty line. Among the single-parent households, those with 1 or 2 children have the highest poverty rate, with 51 household (28.3%) living below poverty.
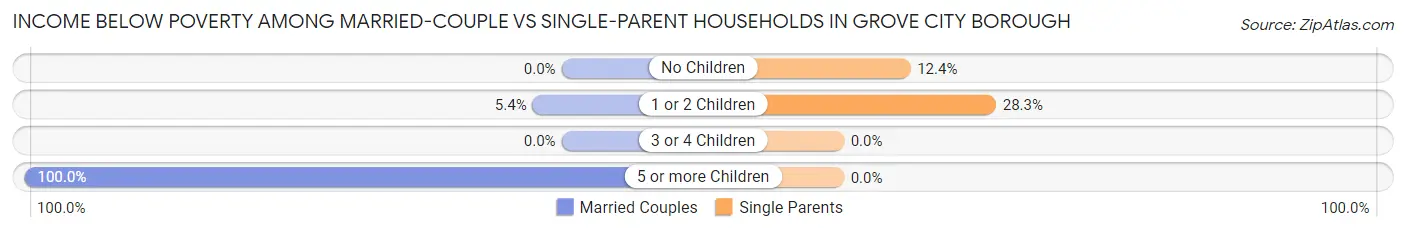
| Children | Married-Couple Families | Single-Parent Households |
| No Children | 0 (0.0%) | 15 (12.4%) |
| 1 or 2 Children | 19 (5.4%) | 51 (28.3%) |
| 3 or 4 Children | 0 (0.0%) | 0 (0.0%) |
| 5 or more Children | 10 (100.0%) | 0 (0.0%) |
| Total | 29 (2.7%) | 66 (21.9%) |
Race in Grove City borough
The most populous races in Grove City borough are White / Caucasian (7,199 | 91.0%), Two or more Races (234 | 3.0%), and Black / African American (233 | 2.9%).
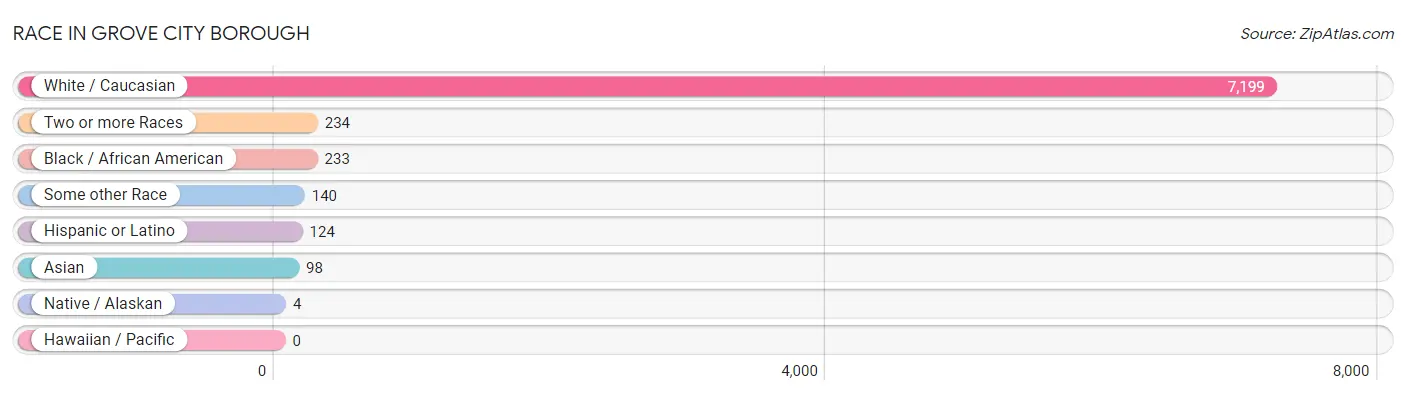
| Race | # Population | % Population |
| Asian | 98 | 1.2% |
| Black / African American | 233 | 2.9% |
| Hawaiian / Pacific | 0 | 0.0% |
| Hispanic or Latino | 124 | 1.6% |
| Native / Alaskan | 4 | 0.1% |
| White / Caucasian | 7,199 | 91.0% |
| Two or more Races | 234 | 3.0% |
| Some other Race | 140 | 1.8% |
| Total | 7,908 | 100.0% |
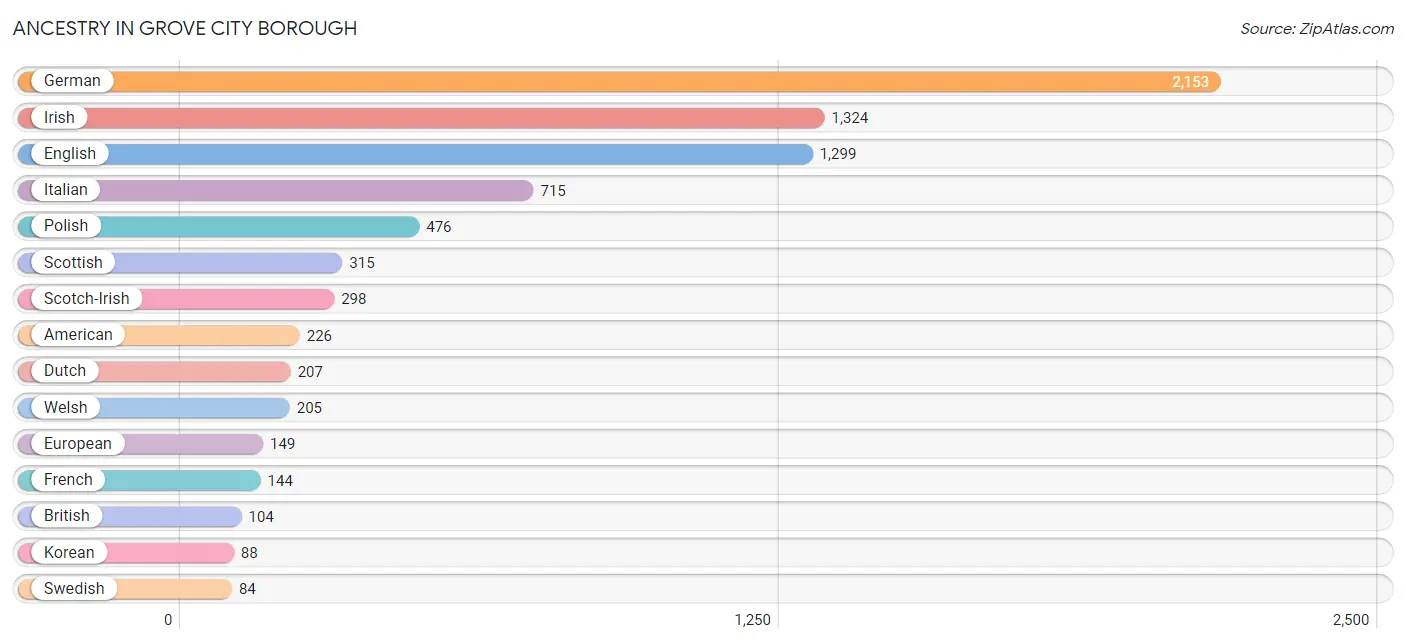
Ancestry in Grove City borough
The most populous ancestries reported in Grove City borough are German (2,153 | 27.2%), Irish (1,324 | 16.7%), English (1,299 | 16.4%), Italian (715 | 9.0%), and Polish (476 | 6.0%), together accounting for 75.5% of all Grove City borough residents.
| Ancestry | # Population | % Population |
| African | 1 | 0.0% |
| American | 226 | 2.9% |
| Arab | 7 | 0.1% |
| Armenian | 7 | 0.1% |
| Australian | 3 | 0.0% |
| Austrian | 38 | 0.5% |
| Belgian | 9 | 0.1% |
| Bhutanese | 15 | 0.2% |
| Blackfeet | 4 | 0.1% |
| British | 104 | 1.3% |
| Burmese | 16 | 0.2% |
| Canadian | 7 | 0.1% |
| Central American | 4 | 0.1% |
| Colombian | 7 | 0.1% |
| Croatian | 5 | 0.1% |
| Cuban | 1 | 0.0% |
| Czech | 44 | 0.6% |
| Danish | 13 | 0.2% |
| Dutch | 207 | 2.6% |
| Eastern European | 28 | 0.4% |
| English | 1,299 | 16.4% |
| European | 149 | 1.9% |
| Finnish | 8 | 0.1% |
| French | 144 | 1.8% |
| French Canadian | 30 | 0.4% |
| German | 2,153 | 27.2% |
| Greek | 49 | 0.6% |
| Guyanese | 6 | 0.1% |
| Haitian | 1 | 0.0% |
| Honduran | 4 | 0.1% |
| Hungarian | 7 | 0.1% |
| Indian (Asian) | 51 | 0.6% |
| Irish | 1,324 | 16.7% |
| Italian | 715 | 9.0% |
| Jamaican | 22 | 0.3% |
| Korean | 88 | 1.1% |
| Lithuanian | 19 | 0.2% |
| Mexican | 22 | 0.3% |
| Nigerian | 14 | 0.2% |
| Northern European | 24 | 0.3% |
| Norwegian | 14 | 0.2% |
| Pennsylvania German | 19 | 0.2% |
| Polish | 476 | 6.0% |
| Portuguese | 6 | 0.1% |
| Puerto Rican | 40 | 0.5% |
| Russian | 61 | 0.8% |
| Scandinavian | 7 | 0.1% |
| Scotch-Irish | 298 | 3.8% |
| Scottish | 315 | 4.0% |
| Serbian | 7 | 0.1% |
| Slovak | 69 | 0.9% |
| South African | 7 | 0.1% |
| South American | 7 | 0.1% |
| Subsaharan African | 22 | 0.3% |
| Swedish | 84 | 1.1% |
| Swiss | 66 | 0.8% |
| Syrian | 7 | 0.1% |
| Ukrainian | 4 | 0.1% |
| Welsh | 205 | 2.6% | View All 59 Rows |
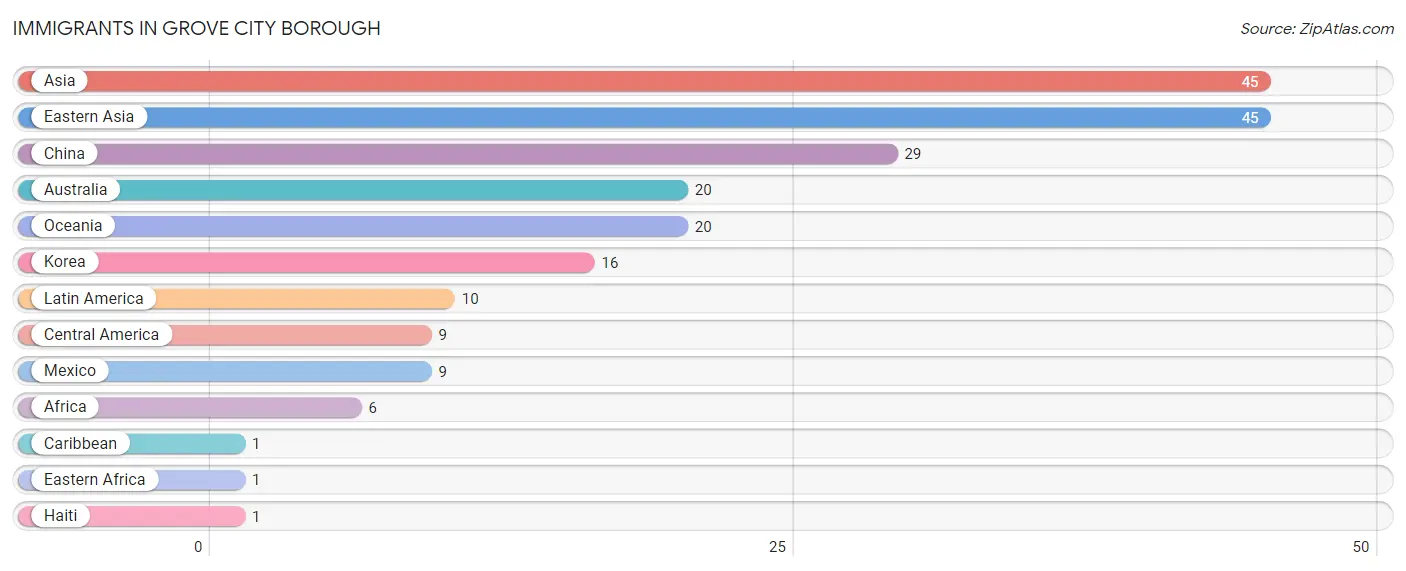
Immigrants in Grove City borough
The most numerous immigrant groups reported in Grove City borough came from Asia (45 | 0.6%), Eastern Asia (45 | 0.6%), China (29 | 0.4%), Australia (20 | 0.3%), and Oceania (20 | 0.3%), together accounting for 2.0% of all Grove City borough residents.
| Immigration Origin | # Population | % Population |
| Africa | 6 | 0.1% |
| Asia | 45 | 0.6% |
| Australia | 20 | 0.3% |
| Caribbean | 1 | 0.0% |
| Central America | 9 | 0.1% |
| China | 29 | 0.4% |
| Eastern Africa | 1 | 0.0% |
| Eastern Asia | 45 | 0.6% |
| Haiti | 1 | 0.0% |
| Korea | 16 | 0.2% |
| Latin America | 10 | 0.1% |
| Mexico | 9 | 0.1% |
| Oceania | 20 | 0.3% | View All 13 Rows |
Sex and Age in Grove City borough
Sex and Age in Grove City borough
The most populous age groups in Grove City borough are 20 to 24 Years (925 | 23.7%) for men and 20 to 24 Years (855 | 21.4%) for women.
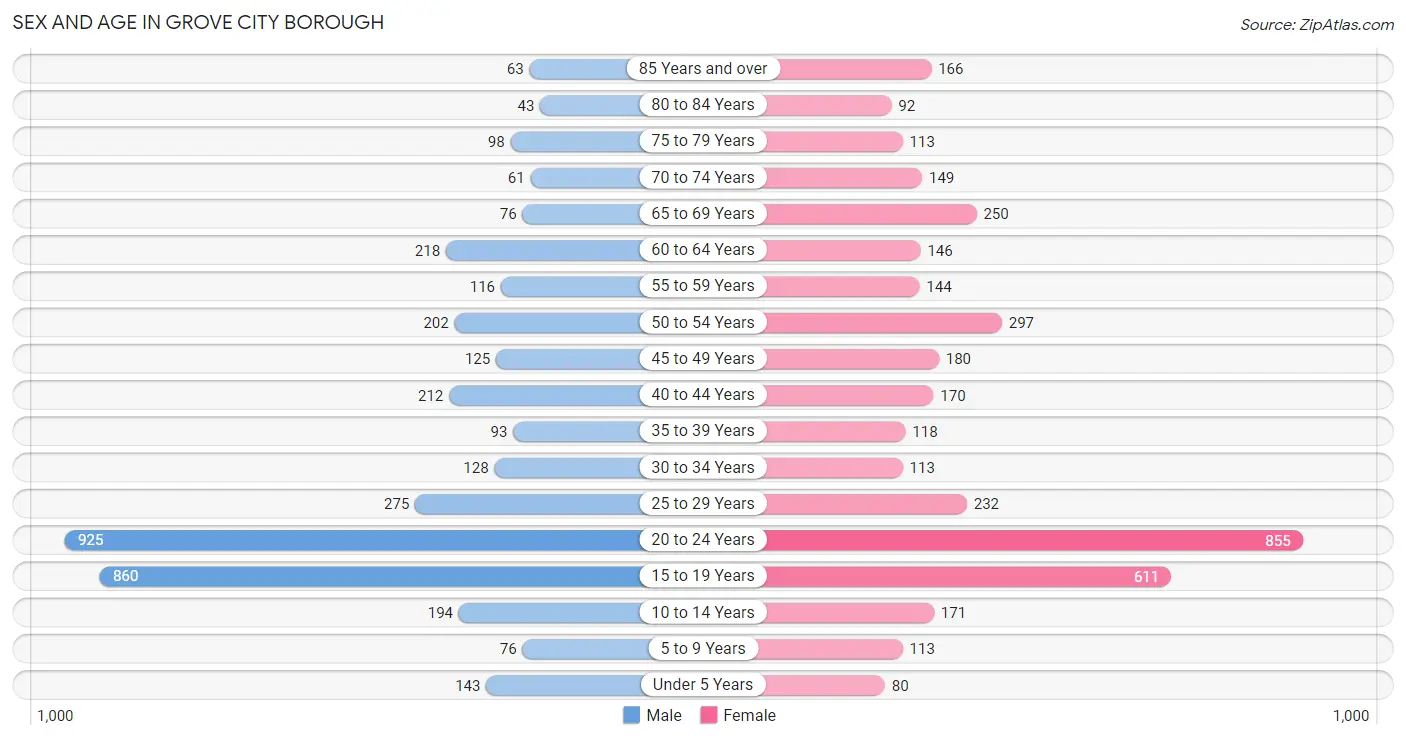
| Age Bracket | Male | Female |
| Under 5 Years | 143 (3.7%) | 80 (2.0%) |
| 5 to 9 Years | 76 (1.9%) | 113 (2.8%) |
| 10 to 14 Years | 194 (5.0%) | 171 (4.3%) |
| 15 to 19 Years | 860 (22.0%) | 611 (15.3%) |
| 20 to 24 Years | 925 (23.7%) | 855 (21.4%) |
| 25 to 29 Years | 275 (7.0%) | 232 (5.8%) |
| 30 to 34 Years | 128 (3.3%) | 113 (2.8%) |
| 35 to 39 Years | 93 (2.4%) | 118 (2.9%) |
| 40 to 44 Years | 212 (5.4%) | 170 (4.3%) |
| 45 to 49 Years | 125 (3.2%) | 180 (4.5%) |
| 50 to 54 Years | 202 (5.2%) | 297 (7.4%) |
| 55 to 59 Years | 116 (3.0%) | 144 (3.6%) |
| 60 to 64 Years | 218 (5.6%) | 146 (3.6%) |
| 65 to 69 Years | 76 (1.9%) | 250 (6.2%) |
| 70 to 74 Years | 61 (1.6%) | 149 (3.7%) |
| 75 to 79 Years | 98 (2.5%) | 113 (2.8%) |
| 80 to 84 Years | 43 (1.1%) | 92 (2.3%) |
| 85 Years and over | 63 (1.6%) | 166 (4.2%) |
| Total | 3,908 (100.0%) | 4,000 (100.0%) |
Families and Households in Grove City borough
Median Family Size in Grove City borough
The median family size in Grove City borough is 2.81 persons per family, with married-couple families (1,077 | 78.2%) accounting for the largest median family size of 2.97 persons per family. On the other hand, single male/father families (80 | 5.8%) represent the smallest median family size with 2.09 persons per family.
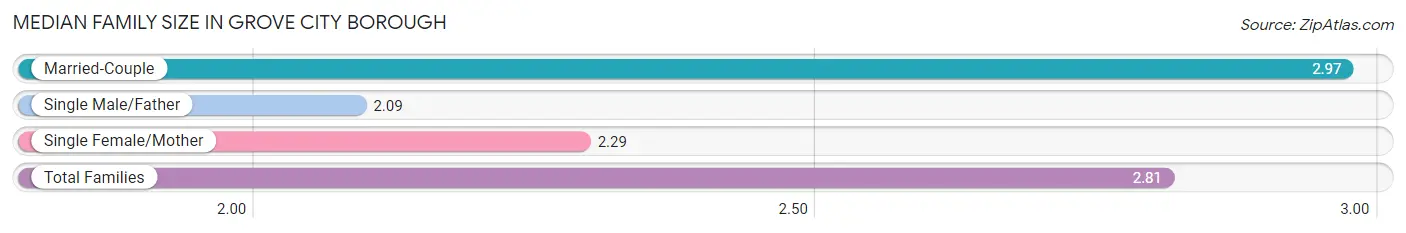
| Family Type | # Families | Family Size |
| Married-Couple | 1,077 (78.2%) | 2.97 |
| Single Male/Father | 80 (5.8%) | 2.09 |
| Single Female/Mother | 221 (16.0%) | 2.29 |
| Total Families | 1,378 (100.0%) | 2.81 |
Median Household Size in Grove City borough
The median household size in Grove City borough is 2.11 persons per household, with married-couple households (1,077 | 42.7%) accounting for the largest median household size of 3 persons per household. non-family households (1,142 | 45.3%) represent the smallest median household size with 1.15 persons per household.
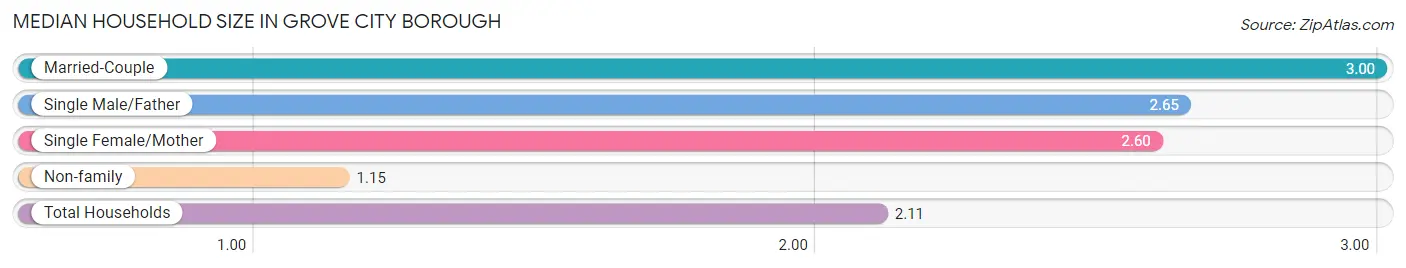
| Household Type | # Households | Household Size |
| Married-Couple | 1,077 (42.7%) | 3.00 |
| Single Male/Father | 80 (3.2%) | 2.65 |
| Single Female/Mother | 221 (8.8%) | 2.60 |
| Non-family | 1,142 (45.3%) | 1.15 |
| Total Households | 2,520 (100.0%) | 2.11 |
Household Size by Marriage Status in Grove City borough
Out of a total of 2,520 households in Grove City borough, 1,378 (54.7%) are family households, while 1,142 (45.3%) are nonfamily households. The most numerous type of family households are 2-person households, comprising 675, and the most common type of nonfamily households are 1-person households, comprising 986.
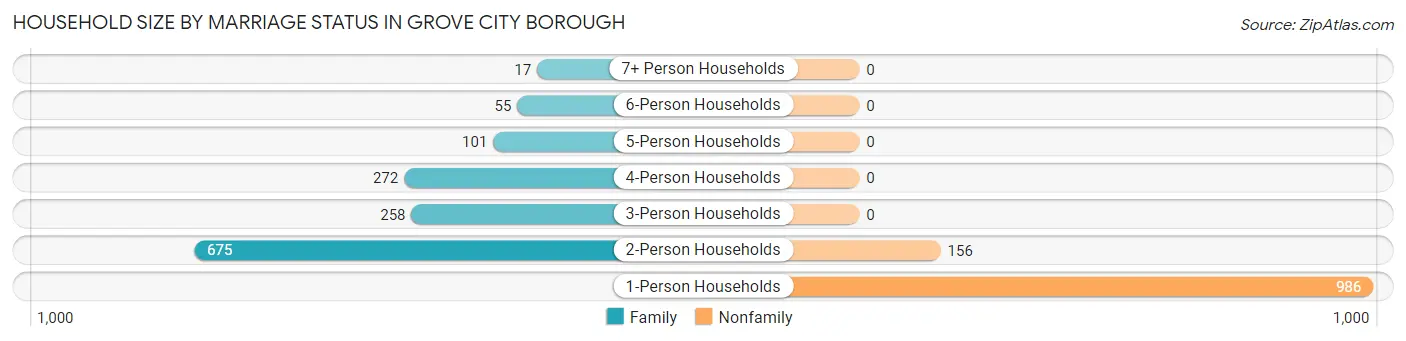
| Household Size | Family Households | Nonfamily Households |
| 1-Person Households | - | 986 (39.1%) |
| 2-Person Households | 675 (26.8%) | 156 (6.2%) |
| 3-Person Households | 258 (10.2%) | 0 (0.0%) |
| 4-Person Households | 272 (10.8%) | 0 (0.0%) |
| 5-Person Households | 101 (4.0%) | 0 (0.0%) |
| 6-Person Households | 55 (2.2%) | 0 (0.0%) |
| 7+ Person Households | 17 (0.7%) | 0 (0.0%) |
| Total | 1,378 (54.7%) | 1,142 (45.3%) |
Female Fertility in Grove City borough
Fertility by Age in Grove City borough
Average fertility rate in Grove City borough is 20.0 births per 1,000 women. Women in the age bracket of 20 to 34 years have the highest fertility rate with 29.0 births per 1,000 women. Women in the age bracket of 20 to 34 years acount for 74.5% of all women with births.
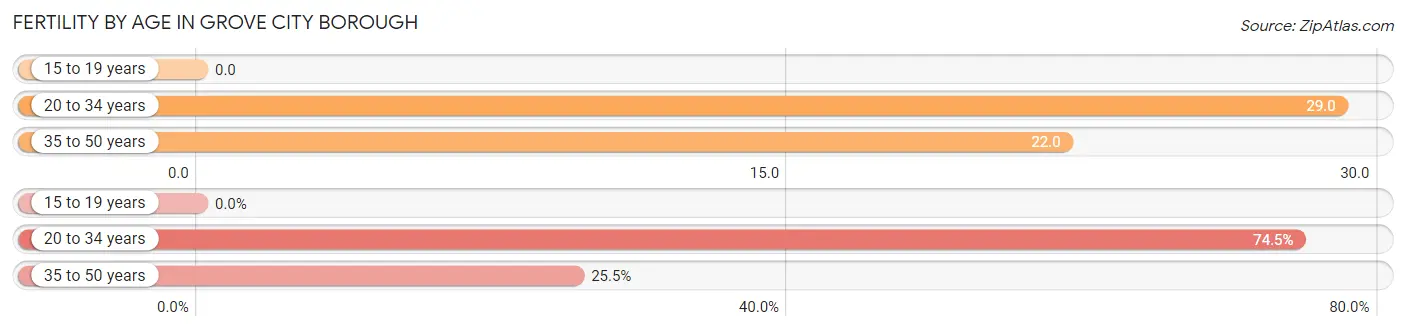
| Age Bracket | Women with Births | Births / 1,000 Women |
| 15 to 19 years | 0 (0.0%) | 0.0 |
| 20 to 34 years | 35 (74.5%) | 29.0 |
| 35 to 50 years | 12 (25.5%) | 22.0 |
| Total | 47 (100.0%) | 20.0 |
Fertility by Age by Marriage Status in Grove City borough
53.2% of women with births (47) in Grove City borough are married. The highest percentage of unmarried women with births falls into 20 to 34 years age bracket with 62.9% of them unmarried at the time of birth, while the lowest percentage of unmarried women with births belong to 35 to 50 years age bracket with 0.0% of them unmarried.
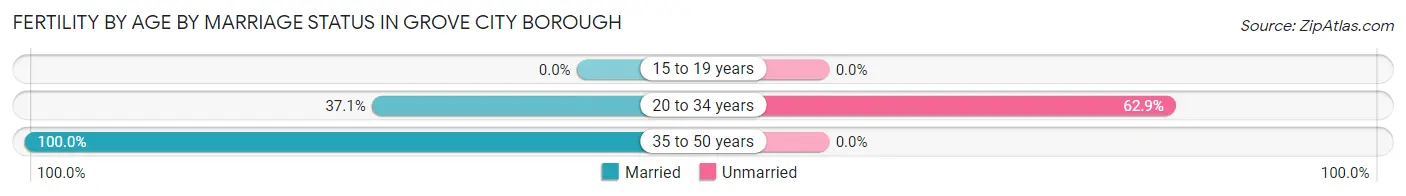
| Age Bracket | Married | Unmarried |
| 15 to 19 years | 0 (0.0%) | 0 (0.0%) |
| 20 to 34 years | 13 (37.1%) | 22 (62.9%) |
| 35 to 50 years | 12 (100.0%) | 0 (0.0%) |
| Total | 25 (53.2%) | 22 (46.8%) |
Fertility by Education in Grove City borough
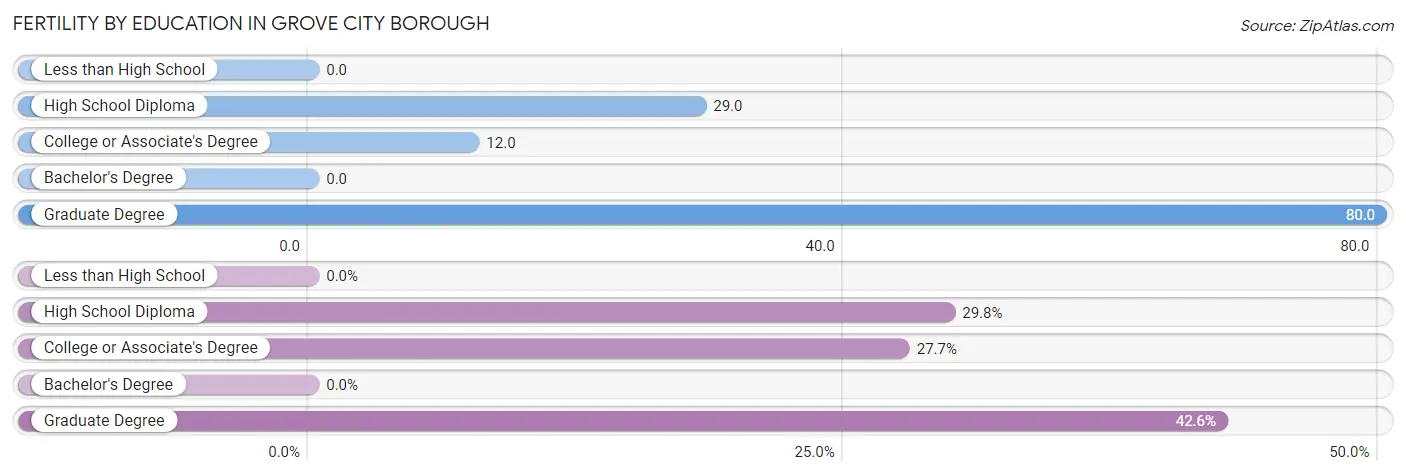
| Educational Attainment | Women with Births | Births / 1,000 Women |
| Less than High School | 0 (0.0%) | 0.0 |
| High School Diploma | 14 (29.8%) | 29.0 |
| College or Associate's Degree | 13 (27.7%) | 12.0 |
| Bachelor's Degree | 0 (0.0%) | 0.0 |
| Graduate Degree | 20 (42.5%) | 80.0 |
| Total | 47 (100.0%) | 20.0 |
Fertility by Education by Marriage Status in Grove City borough
46.8% of women with births in Grove City borough are unmarried. Women with the educational attainment of graduate degree are most likely to be married with 100.0% of them married at childbirth, while women with the educational attainment of college or associate's degree are least likely to be married with 100.0% of them unmarried at childbirth.
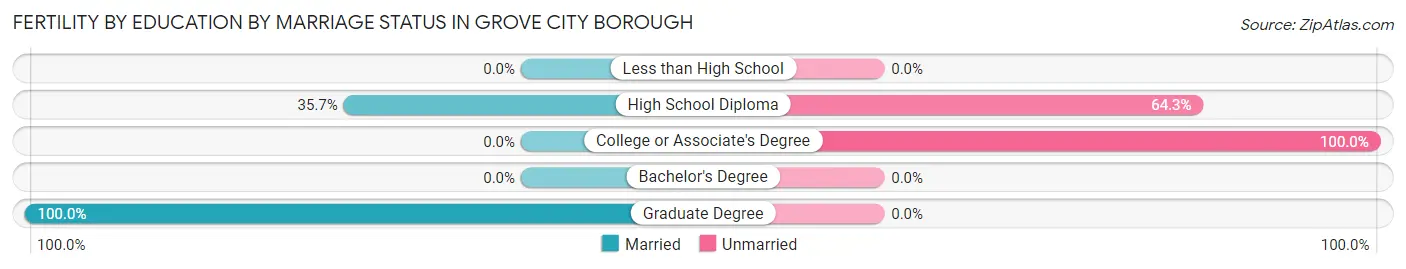
| Educational Attainment | Married | Unmarried |
| Less than High School | 0 (0.0%) | 0 (0.0%) |
| High School Diploma | 5 (35.7%) | 9 (64.3%) |
| College or Associate's Degree | 0 (0.0%) | 13 (100.0%) |
| Bachelor's Degree | 0 (0.0%) | 0 (0.0%) |
| Graduate Degree | 20 (100.0%) | 0 (0.0%) |
| Total | 25 (53.2%) | 22 (46.8%) |
Employment Characteristics in Grove City borough
Employment by Class of Employer in Grove City borough
Among the 3,527 employed individuals in Grove City borough, private company employees (2,306 | 65.4%), not-for-profit organizations (412 | 11.7%), and local government employees (253 | 7.2%) make up the most common classes of employment.
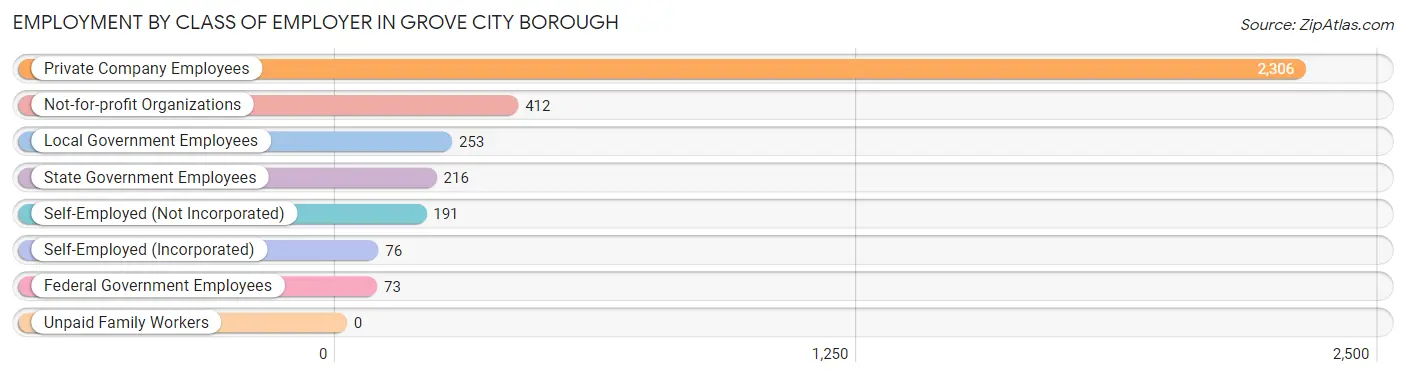
| Employer Class | # Employees | % Employees |
| Private Company Employees | 2,306 | 65.4% |
| Self-Employed (Incorporated) | 76 | 2.1% |
| Self-Employed (Not Incorporated) | 191 | 5.4% |
| Not-for-profit Organizations | 412 | 11.7% |
| Local Government Employees | 253 | 7.2% |
| State Government Employees | 216 | 6.1% |
| Federal Government Employees | 73 | 2.1% |
| Unpaid Family Workers | 0 | 0.0% |
| Total | 3,527 | 100.0% |
Employment Status by Age in Grove City borough
According to the labor force statistics for Grove City borough, out of the total population over 16 years of age (7,064), 53.4% or 3,772 individuals are in the labor force, with 4.9% or 185 of them unemployed. The age group with the highest labor force participation rate is 25 to 29 years, with 89.3% or 453 individuals in the labor force. Within the labor force, the 65 to 74 years age range has the highest percentage of unemployed individuals, with 33.3% or 49 of them being unemployed.
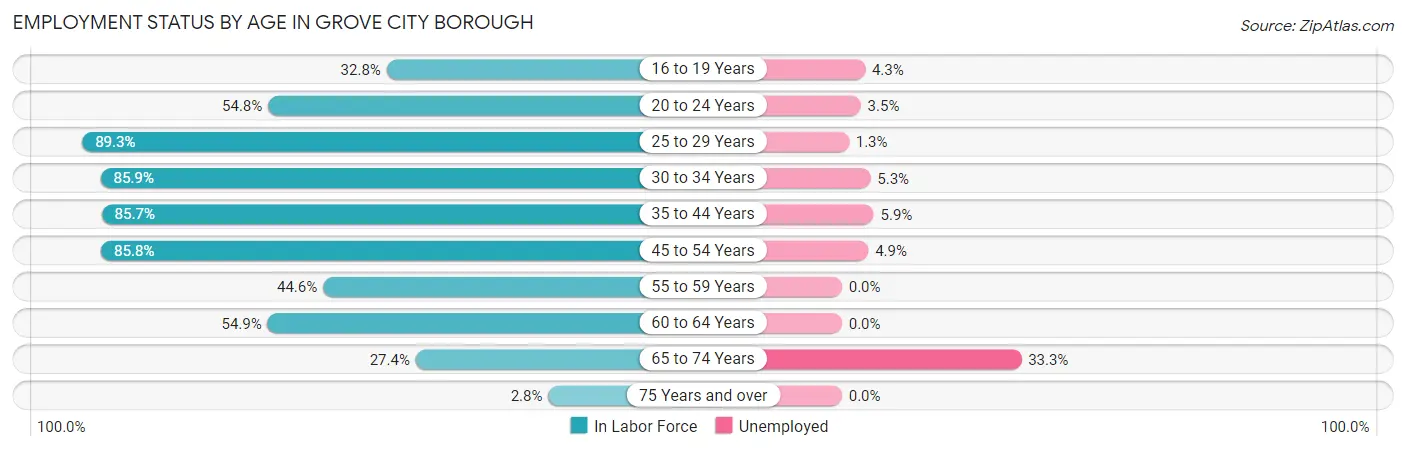
| Age Bracket | In Labor Force | Unemployed |
| 16 to 19 Years | 461 (32.8%) | 20 (4.3%) |
| 20 to 24 Years | 975 (54.8%) | 34 (3.5%) |
| 25 to 29 Years | 453 (89.3%) | 6 (1.3%) |
| 30 to 34 Years | 207 (85.9%) | 11 (5.3%) |
| 35 to 44 Years | 508 (85.7%) | 30 (5.9%) |
| 45 to 54 Years | 690 (85.8%) | 34 (4.9%) |
| 55 to 59 Years | 116 (44.6%) | 0 (0.0%) |
| 60 to 64 Years | 200 (54.9%) | 0 (0.0%) |
| 65 to 74 Years | 147 (27.4%) | 49 (33.3%) |
| 75 Years and over | 16 (2.8%) | 0 (0.0%) |
| Total | 3,772 (53.4%) | 185 (4.9%) |
Employment Status by Educational Attainment in Grove City borough
According to labor force statistics for Grove City borough, 78.5% of individuals (2,174) out of the total population between 25 and 64 years of age (2,769) are in the labor force, with 3.7% or 80 of them being unemployed. The group with the highest labor force participation rate are those with the educational attainment of bachelor's degree or higher, with 84.8% or 1,158 individuals in the labor force. Within the labor force, individuals with high school diploma education have the highest percentage of unemployment, with 10.5% or 47 of them being unemployed.
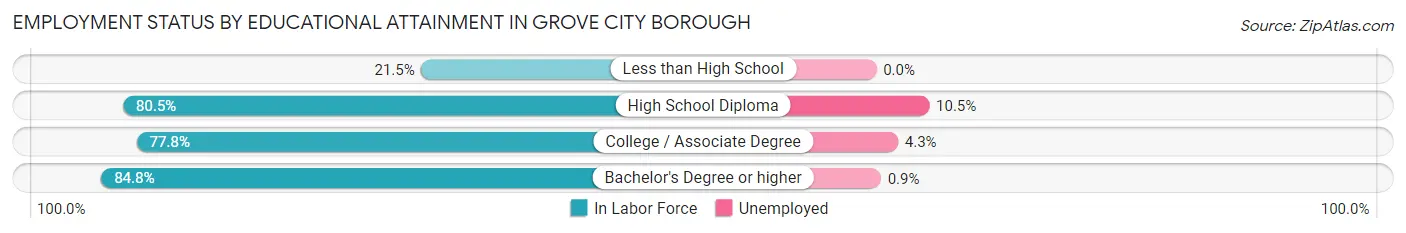
| Educational Attainment | In Labor Force | Unemployed |
| Less than High School | 35 (21.5%) | 0 (0.0%) |
| High School Diploma | 447 (80.5%) | 58 (10.5%) |
| College / Associate Degree | 533 (77.8%) | 29 (4.3%) |
| Bachelor's Degree or higher | 1,158 (84.8%) | 12 (0.9%) |
| Total | 2,174 (78.5%) | 102 (3.7%) |
Employment Occupations by Sex in Grove City borough
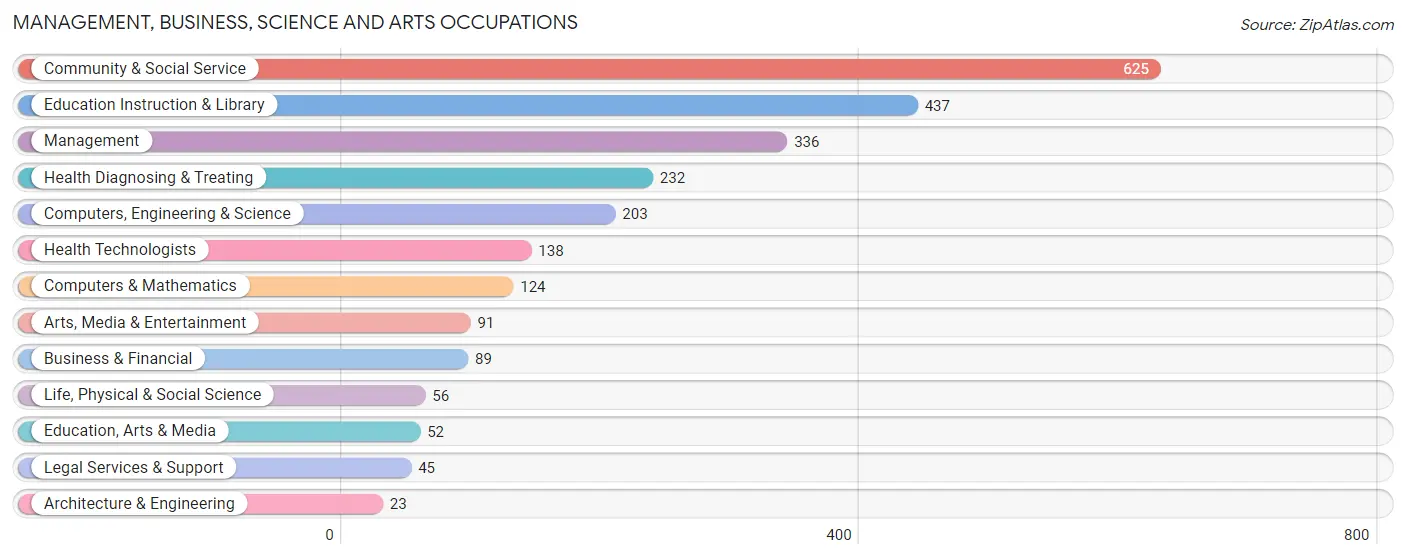
Management, Business, Science and Arts Occupations
The most common Management, Business, Science and Arts occupations in Grove City borough are Community & Social Service (625 | 17.4%), Education Instruction & Library (437 | 12.2%), Management (336 | 9.4%), Health Diagnosing & Treating (232 | 6.5%), and Computers, Engineering & Science (203 | 5.7%).
Management, Business, Science and Arts Occupations by Sex
Within the Management, Business, Science and Arts occupations in Grove City borough, the most male-oriented occupations are Legal Services & Support (100.0%), Computers & Mathematics (89.5%), and Computers, Engineering & Science (86.7%), while the most female-oriented occupations are Education Instruction & Library (78.3%), Health Technologists (76.8%), and Business & Financial (75.3%).
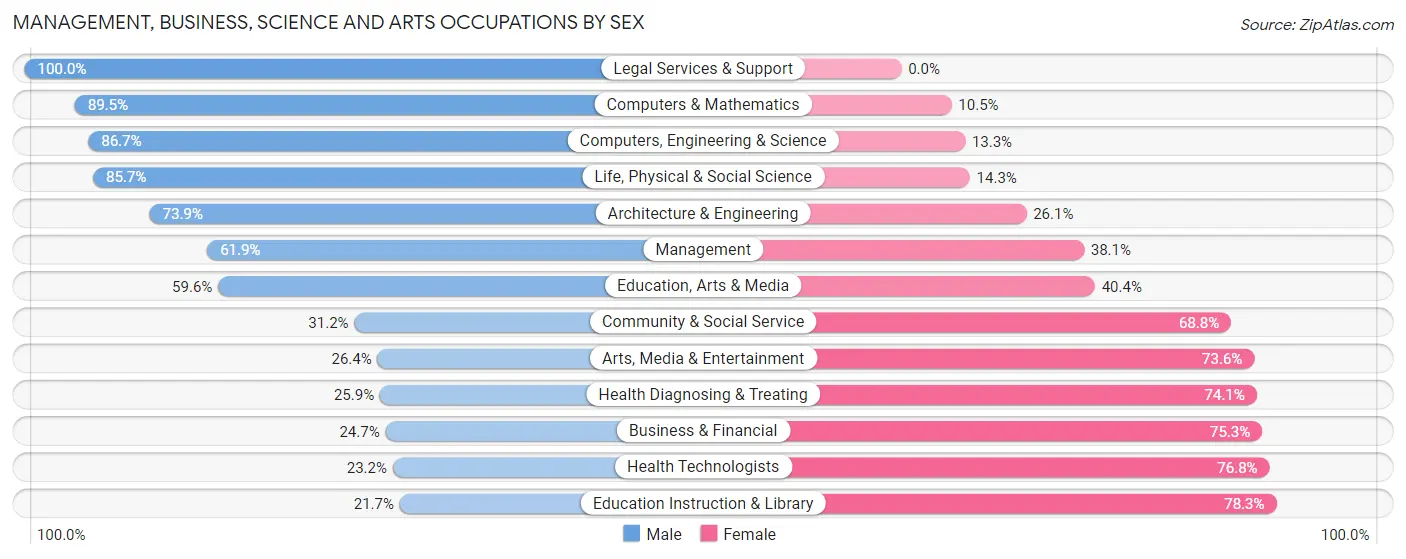
| Occupation | Male | Female |
| Management | 208 (61.9%) | 128 (38.1%) |
| Business & Financial | 22 (24.7%) | 67 (75.3%) |
| Computers, Engineering & Science | 176 (86.7%) | 27 (13.3%) |
| Computers & Mathematics | 111 (89.5%) | 13 (10.5%) |
| Architecture & Engineering | 17 (73.9%) | 6 (26.1%) |
| Life, Physical & Social Science | 48 (85.7%) | 8 (14.3%) |
| Community & Social Service | 195 (31.2%) | 430 (68.8%) |
| Education, Arts & Media | 31 (59.6%) | 21 (40.4%) |
| Legal Services & Support | 45 (100.0%) | 0 (0.0%) |
| Education Instruction & Library | 95 (21.7%) | 342 (78.3%) |
| Arts, Media & Entertainment | 24 (26.4%) | 67 (73.6%) |
| Health Diagnosing & Treating | 60 (25.9%) | 172 (74.1%) |
| Health Technologists | 32 (23.2%) | 106 (76.8%) |
| Total (Category) | 661 (44.5%) | 824 (55.5%) |
| Total (Overall) | 1,813 (50.5%) | 1,776 (49.5%) |
Services Occupations
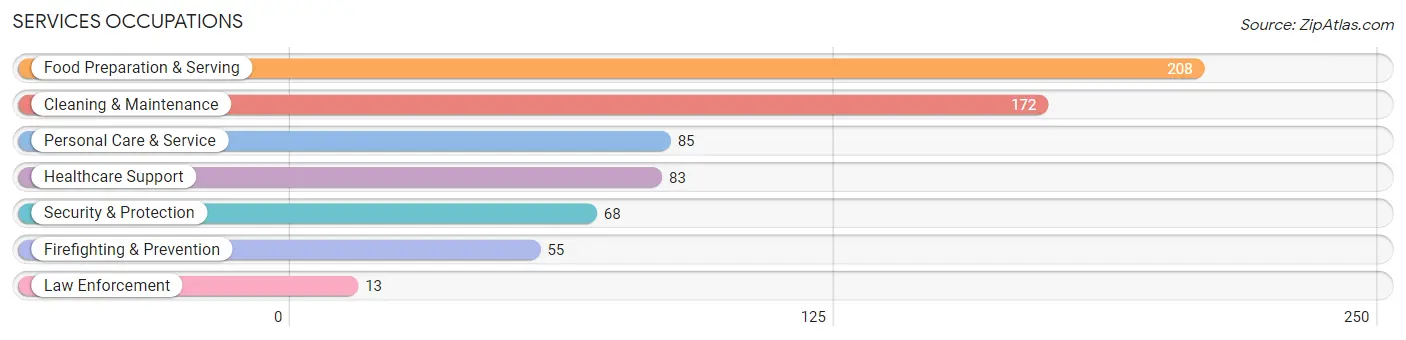
The most common Services occupations in Grove City borough are Food Preparation & Serving (208 | 5.8%), Cleaning & Maintenance (172 | 4.8%), Personal Care & Service (85 | 2.4%), Healthcare Support (83 | 2.3%), and Security & Protection (68 | 1.9%).
Services Occupations by Sex
Within the Services occupations in Grove City borough, the most male-oriented occupations are Firefighting & Prevention (74.6%), Security & Protection (60.3%), and Food Preparation & Serving (54.8%), while the most female-oriented occupations are Law Enforcement (100.0%), Cleaning & Maintenance (60.5%), and Healthcare Support (54.2%).
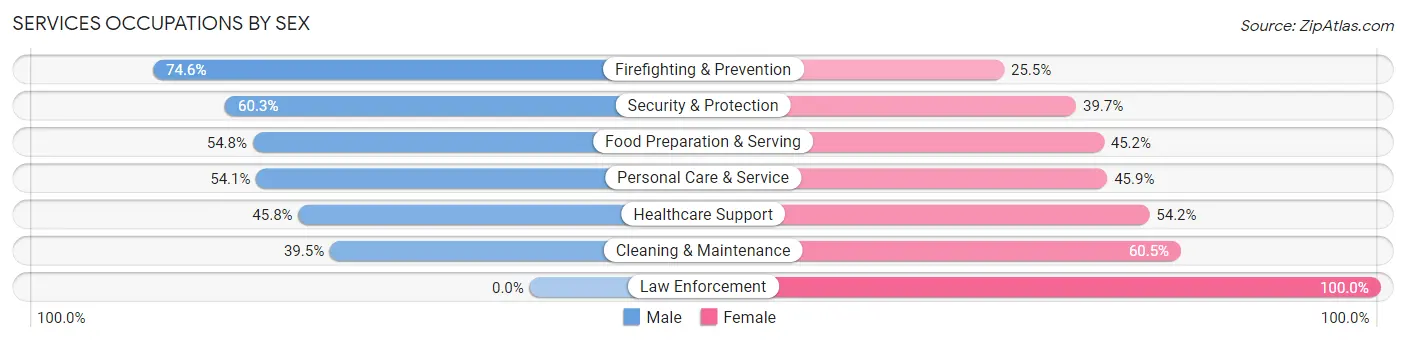
| Occupation | Male | Female |
| Healthcare Support | 38 (45.8%) | 45 (54.2%) |
| Security & Protection | 41 (60.3%) | 27 (39.7%) |
| Firefighting & Prevention | 41 (74.6%) | 14 (25.5%) |
| Law Enforcement | 0 (0.0%) | 13 (100.0%) |
| Food Preparation & Serving | 114 (54.8%) | 94 (45.2%) |
| Cleaning & Maintenance | 68 (39.5%) | 104 (60.5%) |
| Personal Care & Service | 46 (54.1%) | 39 (45.9%) |
| Total (Category) | 307 (49.8%) | 309 (50.2%) |
| Total (Overall) | 1,813 (50.5%) | 1,776 (49.5%) |
Sales and Office Occupations
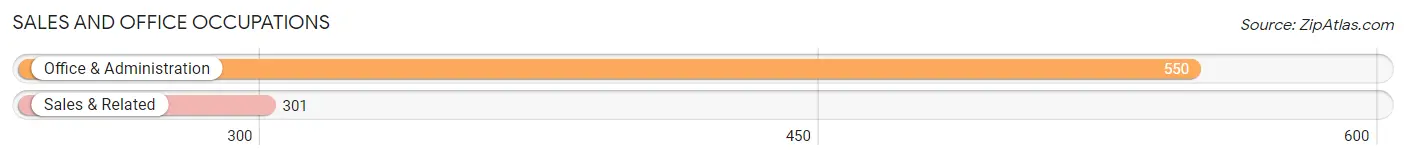
The most common Sales and Office occupations in Grove City borough are Office & Administration (550 | 15.3%), and Sales & Related (301 | 8.4%).
Sales and Office Occupations by Sex
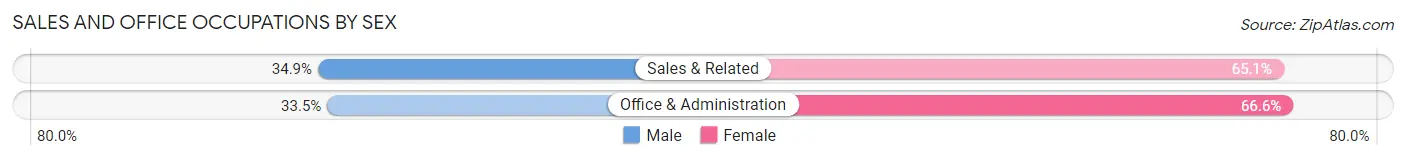
| Occupation | Male | Female |
| Sales & Related | 105 (34.9%) | 196 (65.1%) |
| Office & Administration | 184 (33.5%) | 366 (66.5%) |
| Total (Category) | 289 (34.0%) | 562 (66.0%) |
| Total (Overall) | 1,813 (50.5%) | 1,776 (49.5%) |
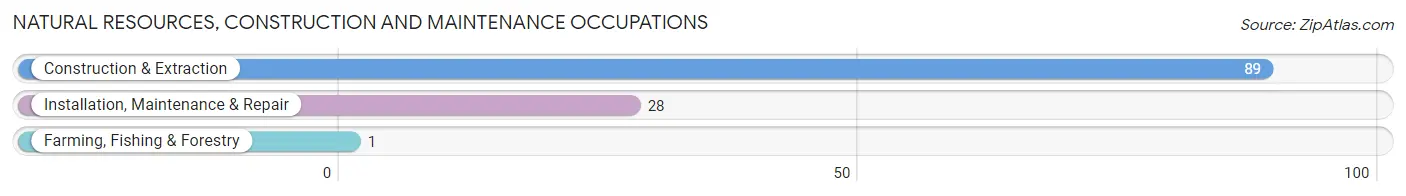
Natural Resources, Construction and Maintenance Occupations
The most common Natural Resources, Construction and Maintenance occupations in Grove City borough are Construction & Extraction (89 | 2.5%), Installation, Maintenance & Repair (28 | 0.8%), and Farming, Fishing & Forestry (1 | 0.0%).
Natural Resources, Construction and Maintenance Occupations by Sex
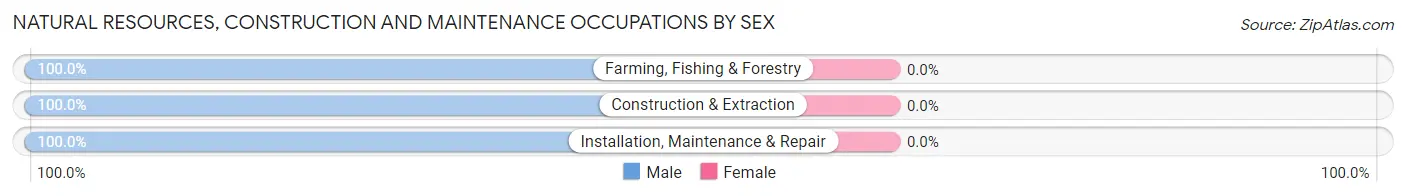
| Occupation | Male | Female |
| Farming, Fishing & Forestry | 1 (100.0%) | 0 (0.0%) |
| Construction & Extraction | 89 (100.0%) | 0 (0.0%) |
| Installation, Maintenance & Repair | 28 (100.0%) | 0 (0.0%) |
| Total (Category) | 118 (100.0%) | 0 (0.0%) |
| Total (Overall) | 1,813 (50.5%) | 1,776 (49.5%) |
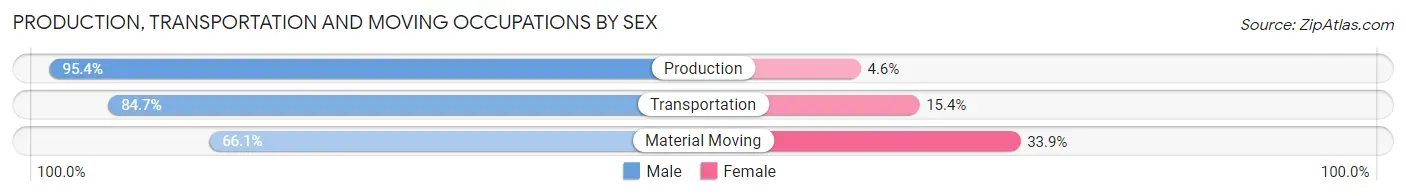
Production, Transportation and Moving Occupations
The most common Production, Transportation and Moving occupations in Grove City borough are Transportation (202 | 5.6%), Production (196 | 5.5%), and Material Moving (121 | 3.4%).
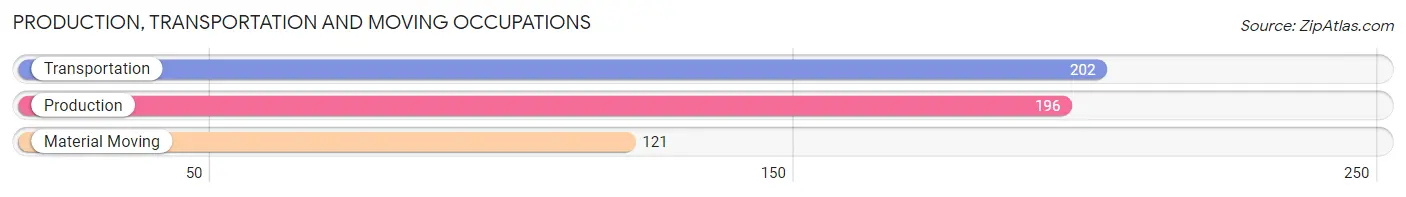
Production, Transportation and Moving Occupations by Sex
| Occupation | Male | Female |
| Production | 187 (95.4%) | 9 (4.6%) |
| Transportation | 171 (84.7%) | 31 (15.3%) |
| Material Moving | 80 (66.1%) | 41 (33.9%) |
| Total (Category) | 438 (84.4%) | 81 (15.6%) |
| Total (Overall) | 1,813 (50.5%) | 1,776 (49.5%) |
Employment Industries by Sex in Grove City borough
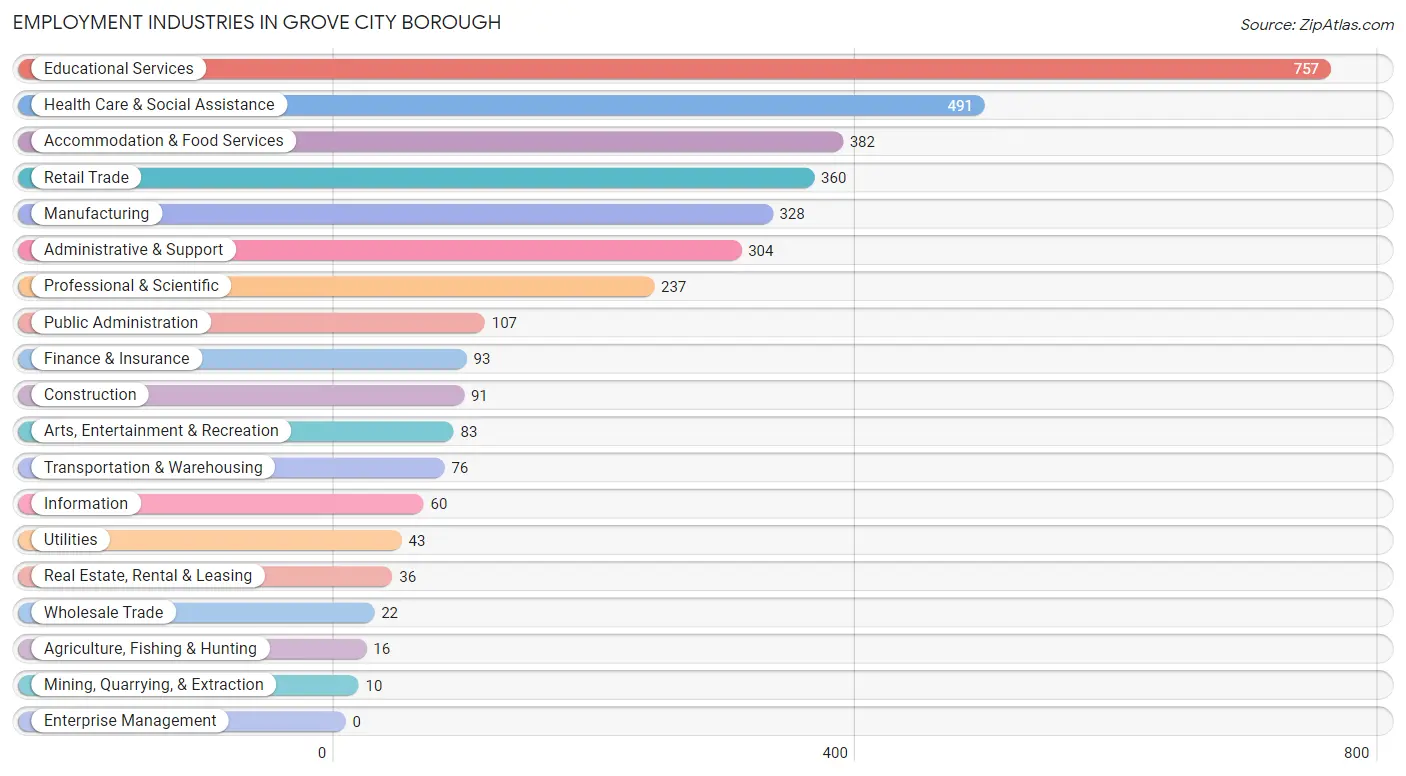
Employment Industries in Grove City borough
The major employment industries in Grove City borough include Educational Services (757 | 21.1%), Health Care & Social Assistance (491 | 13.7%), Accommodation & Food Services (382 | 10.6%), Retail Trade (360 | 10.0%), and Manufacturing (328 | 9.1%).
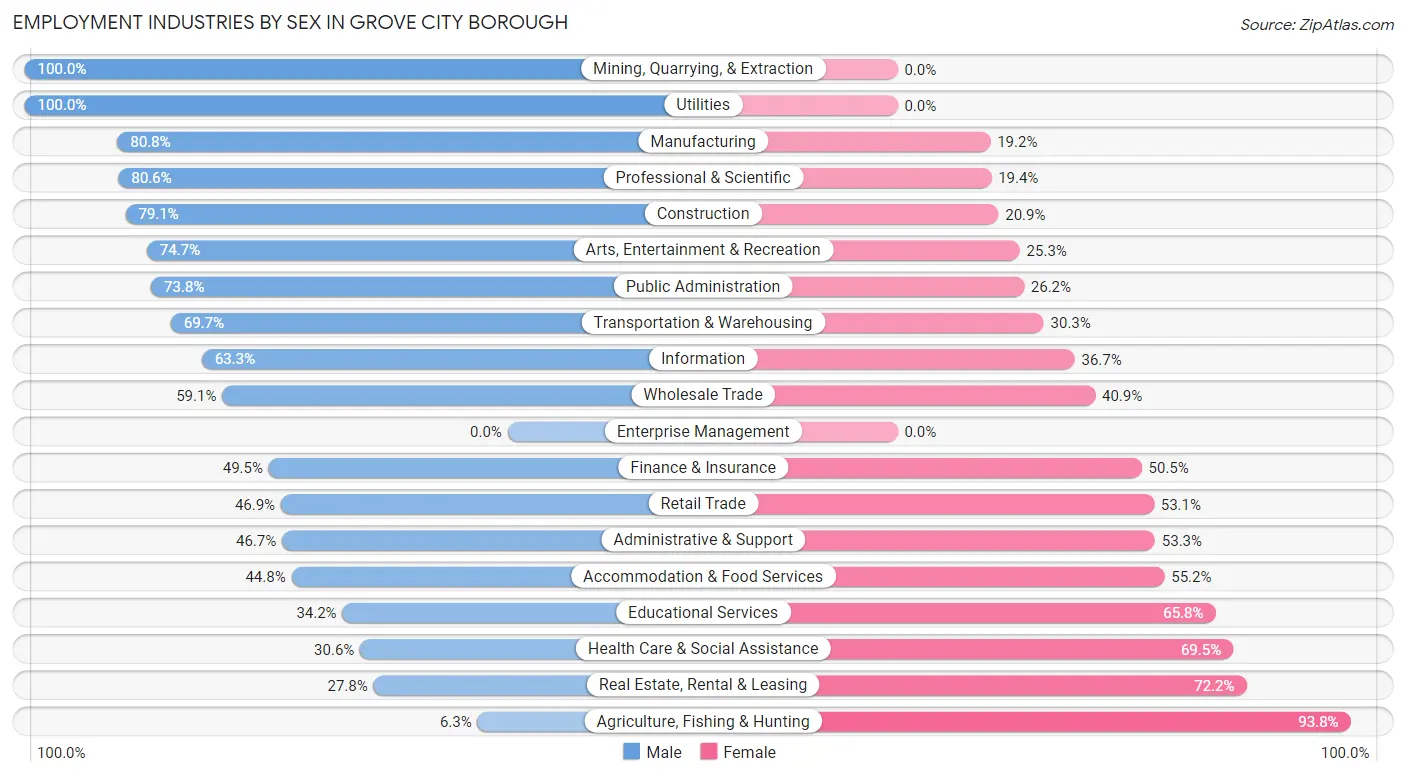
Employment Industries by Sex in Grove City borough
The Grove City borough industries that see more men than women are Mining, Quarrying, & Extraction (100.0%), Utilities (100.0%), and Manufacturing (80.8%), whereas the industries that tend to have a higher number of women are Agriculture, Fishing & Hunting (93.8%), Real Estate, Rental & Leasing (72.2%), and Health Care & Social Assistance (69.5%).
| Industry | Male | Female |
| Agriculture, Fishing & Hunting | 1 (6.2%) | 15 (93.8%) |
| Mining, Quarrying, & Extraction | 10 (100.0%) | 0 (0.0%) |
| Construction | 72 (79.1%) | 19 (20.9%) |
| Manufacturing | 265 (80.8%) | 63 (19.2%) |
| Wholesale Trade | 13 (59.1%) | 9 (40.9%) |
| Retail Trade | 169 (46.9%) | 191 (53.1%) |
| Transportation & Warehousing | 53 (69.7%) | 23 (30.3%) |
| Utilities | 43 (100.0%) | 0 (0.0%) |
| Information | 38 (63.3%) | 22 (36.7%) |
| Finance & Insurance | 46 (49.5%) | 47 (50.5%) |
| Real Estate, Rental & Leasing | 10 (27.8%) | 26 (72.2%) |
| Professional & Scientific | 191 (80.6%) | 46 (19.4%) |
| Enterprise Management | 0 (0.0%) | 0 (0.0%) |
| Administrative & Support | 142 (46.7%) | 162 (53.3%) |
| Educational Services | 259 (34.2%) | 498 (65.8%) |
| Health Care & Social Assistance | 150 (30.5%) | 341 (69.5%) |
| Arts, Entertainment & Recreation | 62 (74.7%) | 21 (25.3%) |
| Accommodation & Food Services | 171 (44.8%) | 211 (55.2%) |
| Public Administration | 79 (73.8%) | 28 (26.2%) |
| Total | 1,813 (50.5%) | 1,776 (49.5%) |
Education in Grove City borough
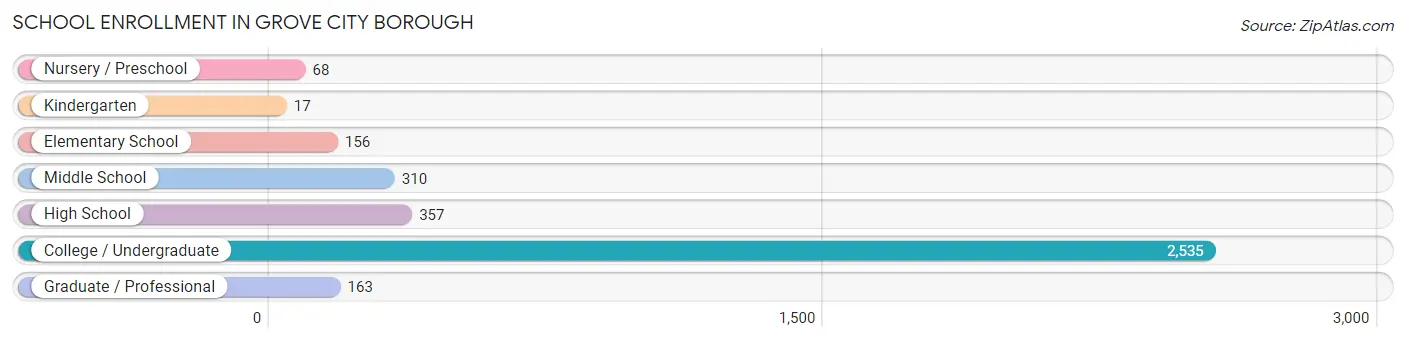
School Enrollment in Grove City borough
The most common levels of schooling among the 3,606 students in Grove City borough are college / undergraduate (2,535 | 70.3%), high school (357 | 9.9%), and middle school (310 | 8.6%).
| School Level | # Students | % Students |
| Nursery / Preschool | 68 | 1.9% |
| Kindergarten | 17 | 0.5% |
| Elementary School | 156 | 4.3% |
| Middle School | 310 | 8.6% |
| High School | 357 | 9.9% |
| College / Undergraduate | 2,535 | 70.3% |
| Graduate / Professional | 163 | 4.5% |
| Total | 3,606 | 100.0% |
School Enrollment by Age by Funding Source in Grove City borough
Out of a total of 3,606 students who are enrolled in schools in Grove City borough, 2,513 (69.7%) attend a private institution, while the remaining 1,093 (30.3%) are enrolled in public schools. The age group of 20 to 24 year olds has the highest likelihood of being enrolled in private schools, with 1,317 (90.0% in the age bracket) enrolled. Conversely, the age group of 3 to 4 year olds has the lowest likelihood of being enrolled in a private school, with 31 (100.0% in the age bracket) attending a public institution.
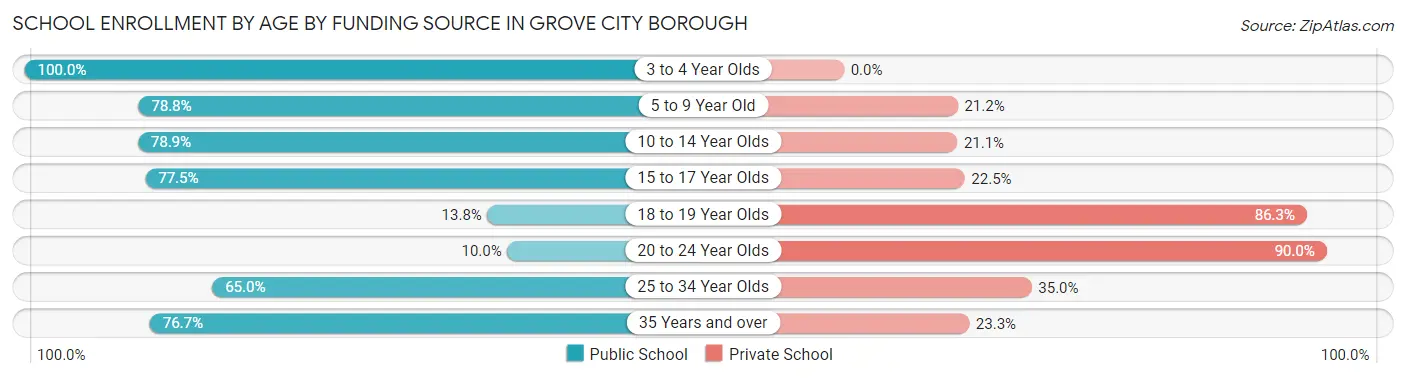
| Age Bracket | Public School | Private School |
| 3 to 4 Year Olds | 31 (100.0%) | 0 (0.0%) |
| 5 to 9 Year Old | 145 (78.8%) | 39 (21.2%) |
| 10 to 14 Year Olds | 288 (78.9%) | 77 (21.1%) |
| 15 to 17 Year Olds | 224 (77.5%) | 65 (22.5%) |
| 18 to 19 Year Olds | 154 (13.8%) | 966 (86.3%) |
| 20 to 24 Year Olds | 147 (10.0%) | 1,317 (90.0%) |
| 25 to 34 Year Olds | 80 (65.0%) | 43 (35.0%) |
| 35 Years and over | 23 (76.7%) | 7 (23.3%) |
| Total | 1,093 (30.3%) | 2,513 (69.7%) |
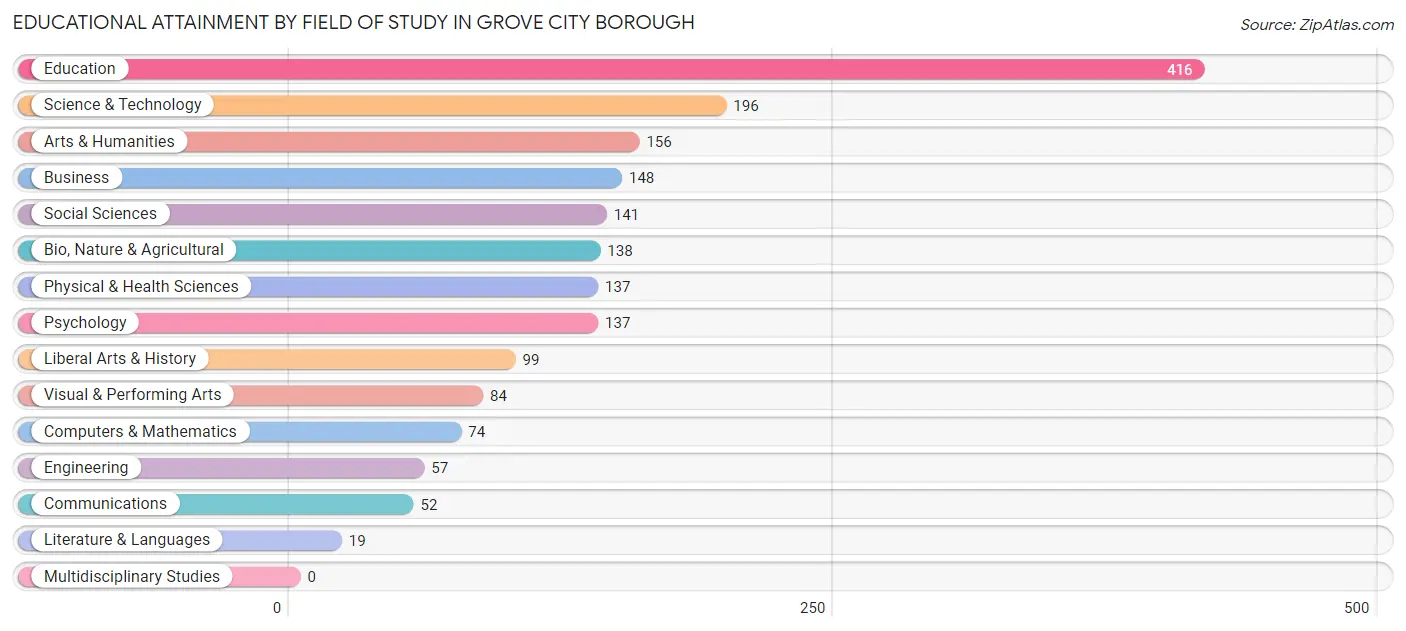
Educational Attainment by Field of Study in Grove City borough
Education (416 | 22.4%), science & technology (196 | 10.6%), arts & humanities (156 | 8.4%), business (148 | 8.0%), and social sciences (141 | 7.6%) are the most common fields of study among 1,854 individuals in Grove City borough who have obtained a bachelor's degree or higher.
| Field of Study | # Graduates | % Graduates |
| Computers & Mathematics | 74 | 4.0% |
| Bio, Nature & Agricultural | 138 | 7.4% |
| Physical & Health Sciences | 137 | 7.4% |
| Psychology | 137 | 7.4% |
| Social Sciences | 141 | 7.6% |
| Engineering | 57 | 3.1% |
| Multidisciplinary Studies | 0 | 0.0% |
| Science & Technology | 196 | 10.6% |
| Business | 148 | 8.0% |
| Education | 416 | 22.4% |
| Literature & Languages | 19 | 1.0% |
| Liberal Arts & History | 99 | 5.3% |
| Visual & Performing Arts | 84 | 4.5% |
| Communications | 52 | 2.8% |
| Arts & Humanities | 156 | 8.4% |
| Total | 1,854 | 100.0% |
Transportation & Commute in Grove City borough
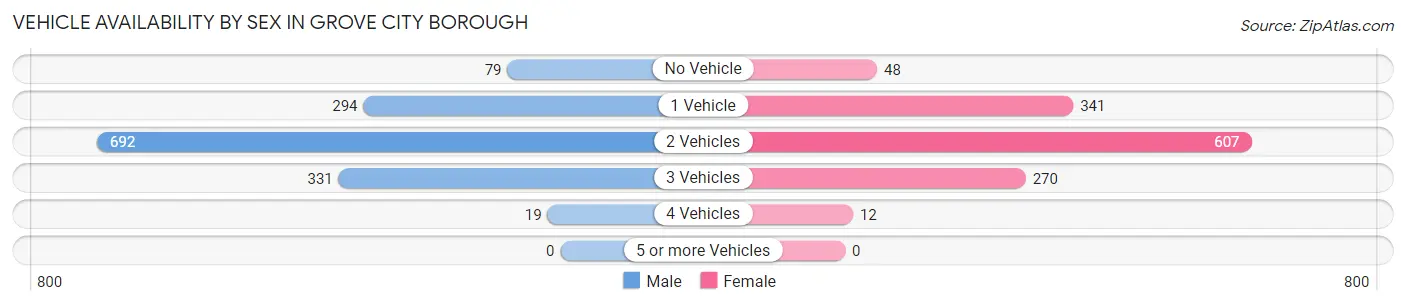
Vehicle Availability by Sex in Grove City borough
The most prevalent vehicle ownership categories in Grove City borough are males with 2 vehicles (692, accounting for 48.9%) and females with 2 vehicles (607, making up 54.1%).
| Vehicles Available | Male | Female |
| No Vehicle | 79 (5.6%) | 48 (3.8%) |
| 1 Vehicle | 294 (20.8%) | 341 (26.7%) |
| 2 Vehicles | 692 (48.9%) | 607 (47.5%) |
| 3 Vehicles | 331 (23.4%) | 270 (21.1%) |
| 4 Vehicles | 19 (1.3%) | 12 (0.9%) |
| 5 or more Vehicles | 0 (0.0%) | 0 (0.0%) |
| Total | 1,415 (100.0%) | 1,278 (100.0%) |
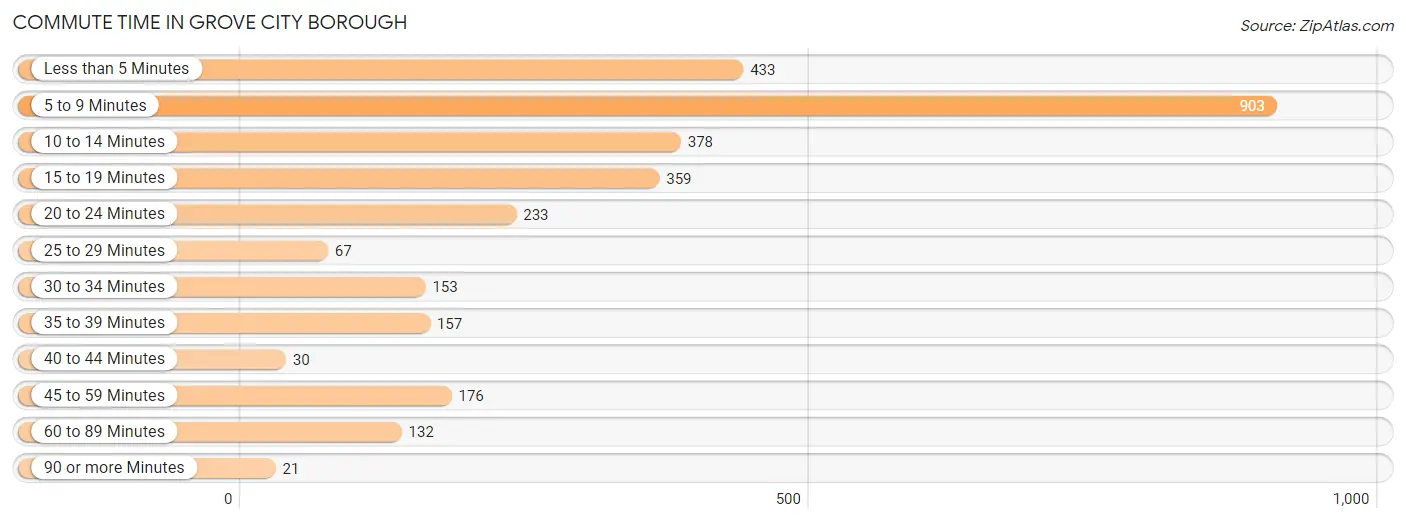
Commute Time in Grove City borough
The most frequently occuring commute durations in Grove City borough are 5 to 9 minutes (903 commuters, 29.7%), less than 5 minutes (433 commuters, 14.2%), and 10 to 14 minutes (378 commuters, 12.4%).
| Commute Time | # Commuters | % Commuters |
| Less than 5 Minutes | 433 | 14.2% |
| 5 to 9 Minutes | 903 | 29.7% |
| 10 to 14 Minutes | 378 | 12.4% |
| 15 to 19 Minutes | 359 | 11.8% |
| 20 to 24 Minutes | 233 | 7.7% |
| 25 to 29 Minutes | 67 | 2.2% |
| 30 to 34 Minutes | 153 | 5.0% |
| 35 to 39 Minutes | 157 | 5.2% |
| 40 to 44 Minutes | 30 | 1.0% |
| 45 to 59 Minutes | 176 | 5.8% |
| 60 to 89 Minutes | 132 | 4.3% |
| 90 or more Minutes | 21 | 0.7% |
Commute Time by Sex in Grove City borough
The most common commute times in Grove City borough are 5 to 9 minutes (472 commuters, 31.7%) for males and 5 to 9 minutes (431 commuters, 27.8%) for females.
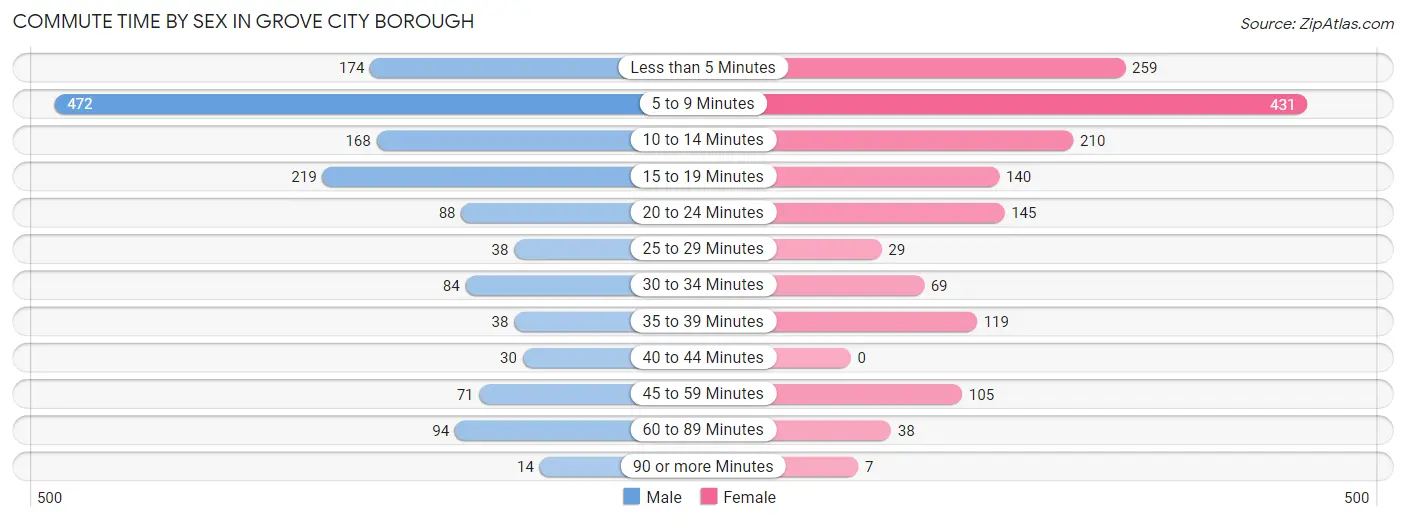
| Commute Time | Male | Female |
| Less than 5 Minutes | 174 (11.7%) | 259 (16.7%) |
| 5 to 9 Minutes | 472 (31.7%) | 431 (27.8%) |
| 10 to 14 Minutes | 168 (11.3%) | 210 (13.5%) |
| 15 to 19 Minutes | 219 (14.7%) | 140 (9.0%) |
| 20 to 24 Minutes | 88 (5.9%) | 145 (9.3%) |
| 25 to 29 Minutes | 38 (2.5%) | 29 (1.9%) |
| 30 to 34 Minutes | 84 (5.6%) | 69 (4.4%) |
| 35 to 39 Minutes | 38 (2.5%) | 119 (7.7%) |
| 40 to 44 Minutes | 30 (2.0%) | 0 (0.0%) |
| 45 to 59 Minutes | 71 (4.8%) | 105 (6.8%) |
| 60 to 89 Minutes | 94 (6.3%) | 38 (2.5%) |
| 90 or more Minutes | 14 (0.9%) | 7 (0.4%) |
Time of Departure to Work by Sex in Grove City borough
The most frequent times of departure to work in Grove City borough are 12:00 PM to 3:59 PM (266, 17.8%) for males and 7:00 AM to 7:29 AM (448, 28.9%) for females.
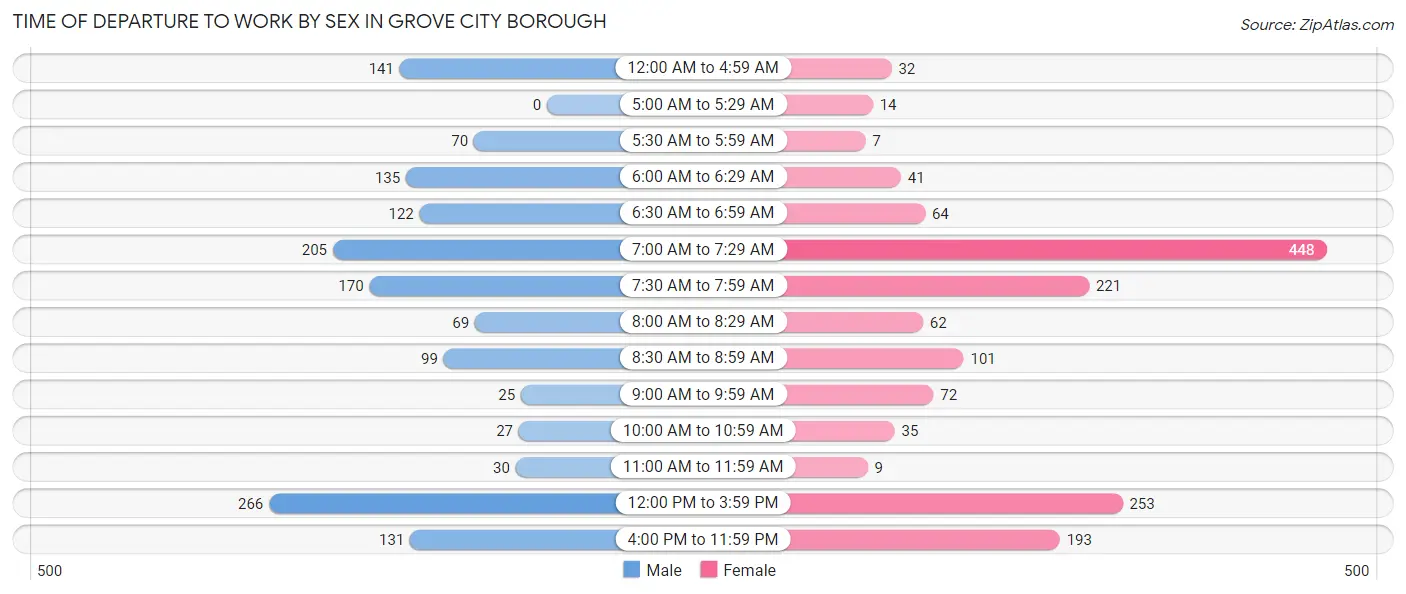
| Time of Departure | Male | Female |
| 12:00 AM to 4:59 AM | 141 (9.5%) | 32 (2.1%) |
| 5:00 AM to 5:29 AM | 0 (0.0%) | 14 (0.9%) |
| 5:30 AM to 5:59 AM | 70 (4.7%) | 7 (0.4%) |
| 6:00 AM to 6:29 AM | 135 (9.1%) | 41 (2.6%) |
| 6:30 AM to 6:59 AM | 122 (8.2%) | 64 (4.1%) |
| 7:00 AM to 7:29 AM | 205 (13.8%) | 448 (28.9%) |
| 7:30 AM to 7:59 AM | 170 (11.4%) | 221 (14.2%) |
| 8:00 AM to 8:29 AM | 69 (4.6%) | 62 (4.0%) |
| 8:30 AM to 8:59 AM | 99 (6.6%) | 101 (6.5%) |
| 9:00 AM to 9:59 AM | 25 (1.7%) | 72 (4.6%) |
| 10:00 AM to 10:59 AM | 27 (1.8%) | 35 (2.3%) |
| 11:00 AM to 11:59 AM | 30 (2.0%) | 9 (0.6%) |
| 12:00 PM to 3:59 PM | 266 (17.8%) | 253 (16.3%) |
| 4:00 PM to 11:59 PM | 131 (8.8%) | 193 (12.4%) |
| Total | 1,490 (100.0%) | 1,552 (100.0%) |
Housing Occupancy in Grove City borough
Occupancy by Ownership in Grove City borough
Of the total 2,520 dwellings in Grove City borough, owner-occupied units account for 1,348 (53.5%), while renter-occupied units make up 1,172 (46.5%).
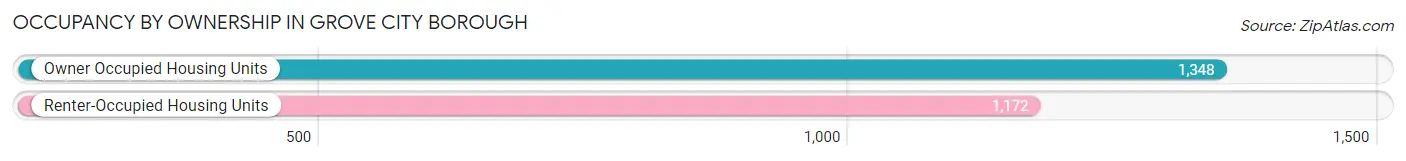
| Occupancy | # Housing Units | % Housing Units |
| Owner Occupied Housing Units | 1,348 | 53.5% |
| Renter-Occupied Housing Units | 1,172 | 46.5% |
| Total Occupied Housing Units | 2,520 | 100.0% |
Occupancy by Household Size in Grove City borough
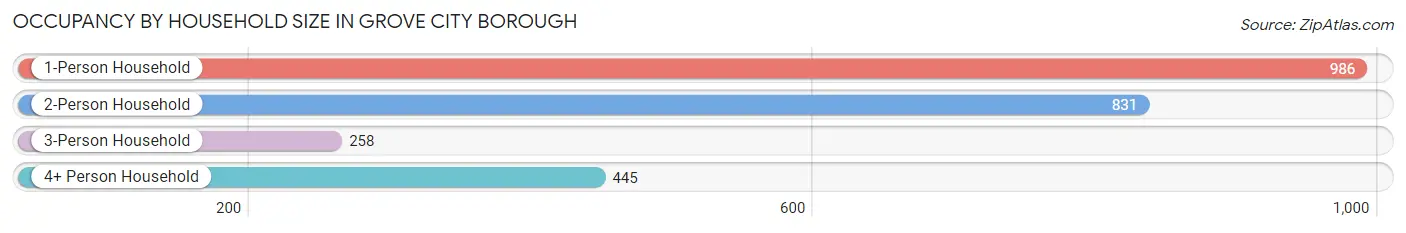
| Household Size | # Housing Units | % Housing Units |
| 1-Person Household | 986 | 39.1% |
| 2-Person Household | 831 | 33.0% |
| 3-Person Household | 258 | 10.2% |
| 4+ Person Household | 445 | 17.7% |
| Total Housing Units | 2,520 | 100.0% |
Occupancy by Ownership by Household Size in Grove City borough
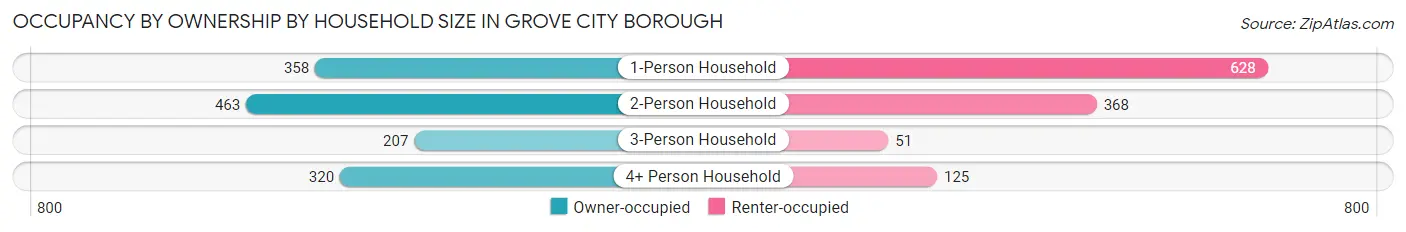
| Household Size | Owner-occupied | Renter-occupied |
| 1-Person Household | 358 (36.3%) | 628 (63.7%) |
| 2-Person Household | 463 (55.7%) | 368 (44.3%) |
| 3-Person Household | 207 (80.2%) | 51 (19.8%) |
| 4+ Person Household | 320 (71.9%) | 125 (28.1%) |
| Total Housing Units | 1,348 (53.5%) | 1,172 (46.5%) |
Occupancy by Educational Attainment in Grove City borough
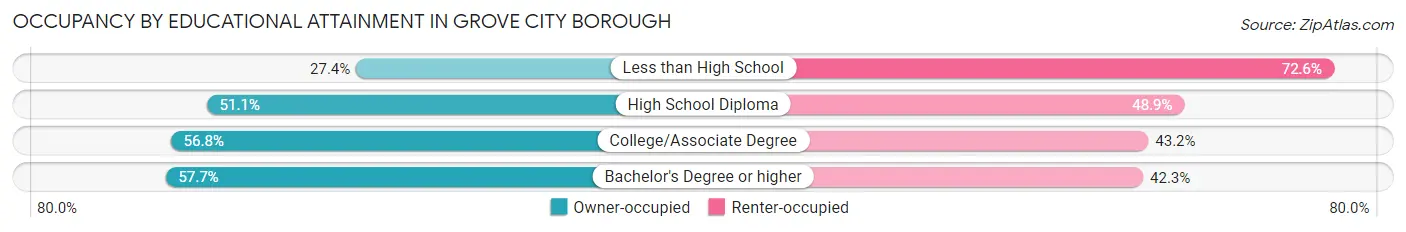
| Household Size | Owner-occupied | Renter-occupied |
| Less than High School | 51 (27.4%) | 135 (72.6%) |
| High School Diploma | 343 (51.1%) | 328 (48.9%) |
| College/Associate Degree | 337 (56.8%) | 256 (43.2%) |
| Bachelor's Degree or higher | 617 (57.7%) | 453 (42.3%) |
Occupancy by Age of Householder in Grove City borough
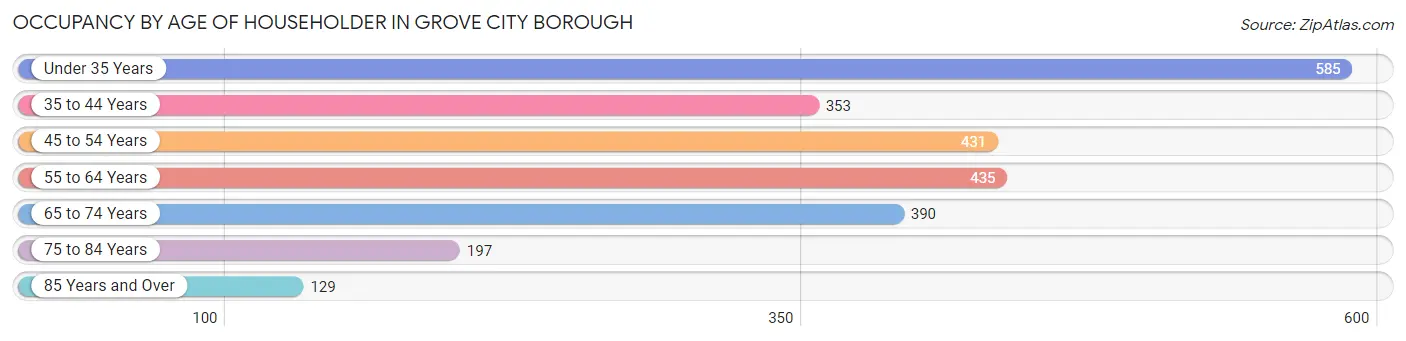
| Age Bracket | # Households | % Households |
| Under 35 Years | 585 | 23.2% |
| 35 to 44 Years | 353 | 14.0% |
| 45 to 54 Years | 431 | 17.1% |
| 55 to 64 Years | 435 | 17.3% |
| 65 to 74 Years | 390 | 15.5% |
| 75 to 84 Years | 197 | 7.8% |
| 85 Years and Over | 129 | 5.1% |
| Total | 2,520 | 100.0% |
Housing Finances in Grove City borough
Median Income by Occupancy in Grove City borough
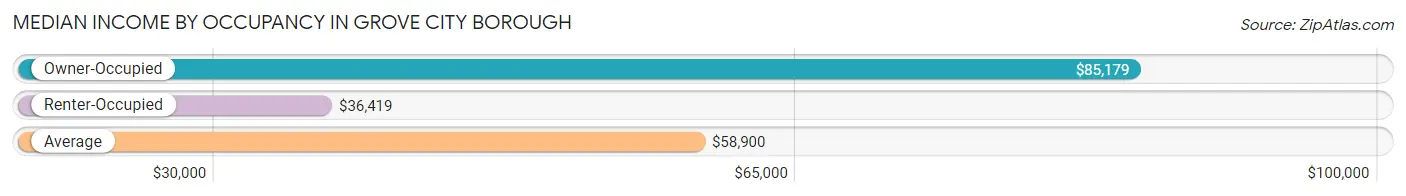
| Occupancy Type | # Households | Median Income |
| Owner-Occupied | 1,348 (53.5%) | $85,179 |
| Renter-Occupied | 1,172 (46.5%) | $36,419 |
| Average | 2,520 (100.0%) | $58,900 |
Occupancy by Householder Income Bracket in Grove City borough
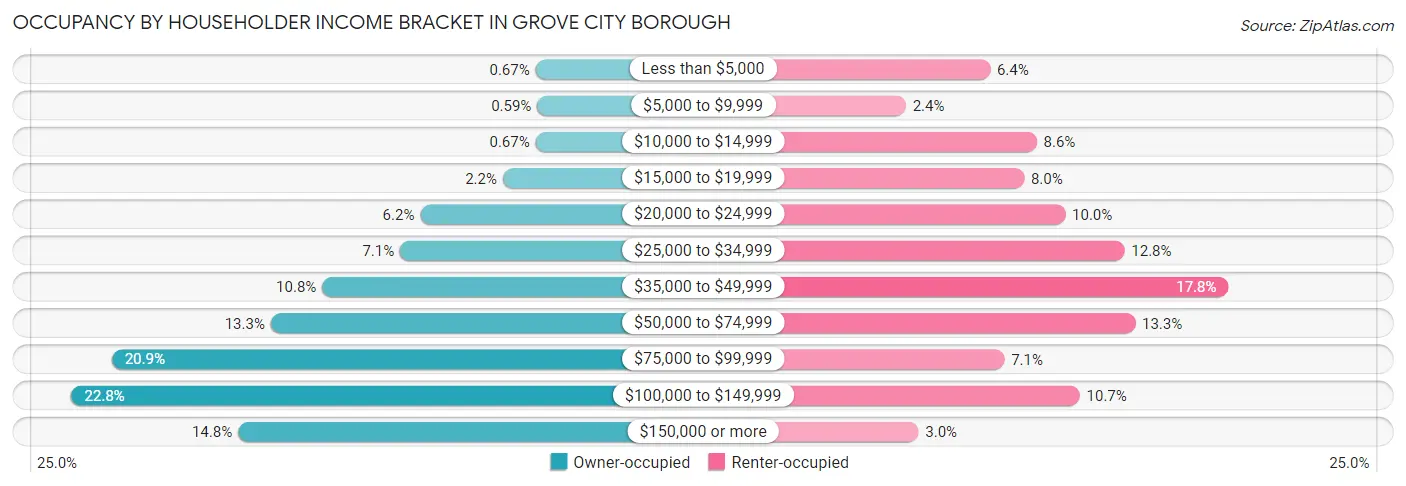
| Income Bracket | Owner-occupied | Renter-occupied |
| Less than $5,000 | 9 (0.7%) | 75 (6.4%) |
| $5,000 to $9,999 | 8 (0.6%) | 28 (2.4%) |
| $10,000 to $14,999 | 9 (0.7%) | 101 (8.6%) |
| $15,000 to $19,999 | 30 (2.2%) | 94 (8.0%) |
| $20,000 to $24,999 | 83 (6.2%) | 117 (10.0%) |
| $25,000 to $34,999 | 96 (7.1%) | 150 (12.8%) |
| $35,000 to $49,999 | 146 (10.8%) | 208 (17.7%) |
| $50,000 to $74,999 | 179 (13.3%) | 156 (13.3%) |
| $75,000 to $99,999 | 281 (20.8%) | 83 (7.1%) |
| $100,000 to $149,999 | 307 (22.8%) | 125 (10.7%) |
| $150,000 or more | 200 (14.8%) | 35 (3.0%) |
| Total | 1,348 (100.0%) | 1,172 (100.0%) |
Monthly Housing Cost Tiers in Grove City borough
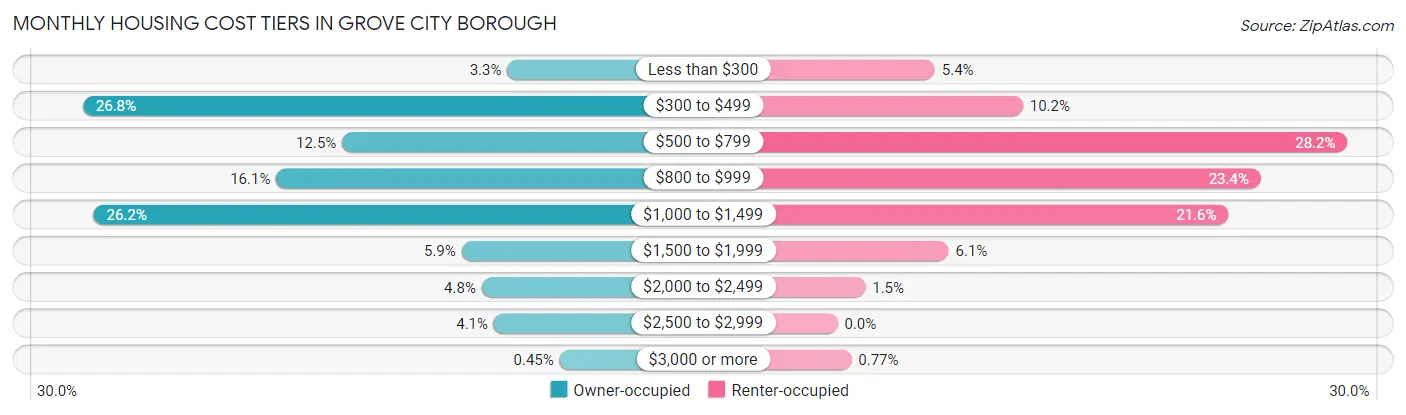
| Monthly Cost | Owner-occupied | Renter-occupied |
| Less than $300 | 45 (3.3%) | 63 (5.4%) |
| $300 to $499 | 361 (26.8%) | 120 (10.2%) |
| $500 to $799 | 168 (12.5%) | 330 (28.2%) |
| $800 to $999 | 217 (16.1%) | 274 (23.4%) |
| $1,000 to $1,499 | 353 (26.2%) | 253 (21.6%) |
| $1,500 to $1,999 | 79 (5.9%) | 72 (6.1%) |
| $2,000 to $2,499 | 64 (4.8%) | 18 (1.5%) |
| $2,500 to $2,999 | 55 (4.1%) | 0 (0.0%) |
| $3,000 or more | 6 (0.4%) | 9 (0.8%) |
| Total | 1,348 (100.0%) | 1,172 (100.0%) |
Physical Housing Characteristics in Grove City borough
Housing Structures in Grove City borough
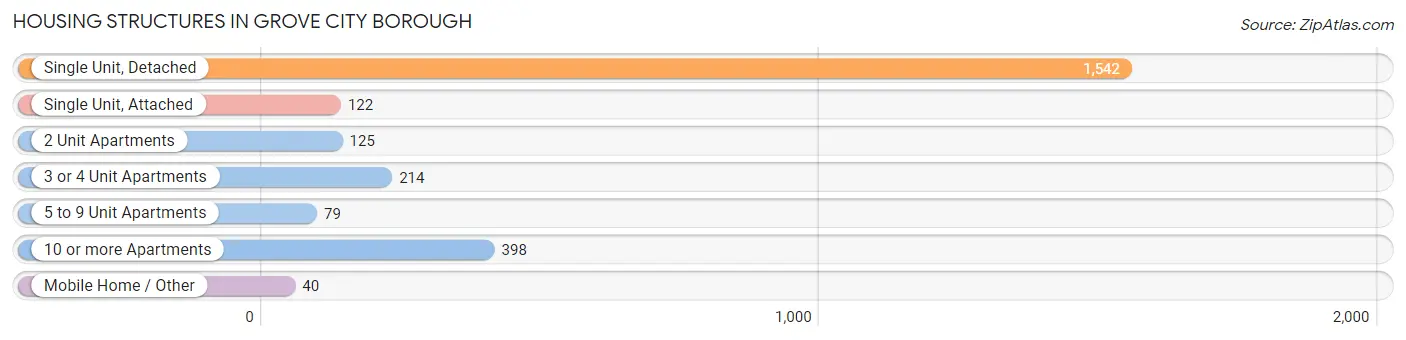
| Structure Type | # Housing Units | % Housing Units |
| Single Unit, Detached | 1,542 | 61.2% |
| Single Unit, Attached | 122 | 4.8% |
| 2 Unit Apartments | 125 | 5.0% |
| 3 or 4 Unit Apartments | 214 | 8.5% |
| 5 to 9 Unit Apartments | 79 | 3.1% |
| 10 or more Apartments | 398 | 15.8% |
| Mobile Home / Other | 40 | 1.6% |
| Total | 2,520 | 100.0% |
Housing Structures by Occupancy in Grove City borough
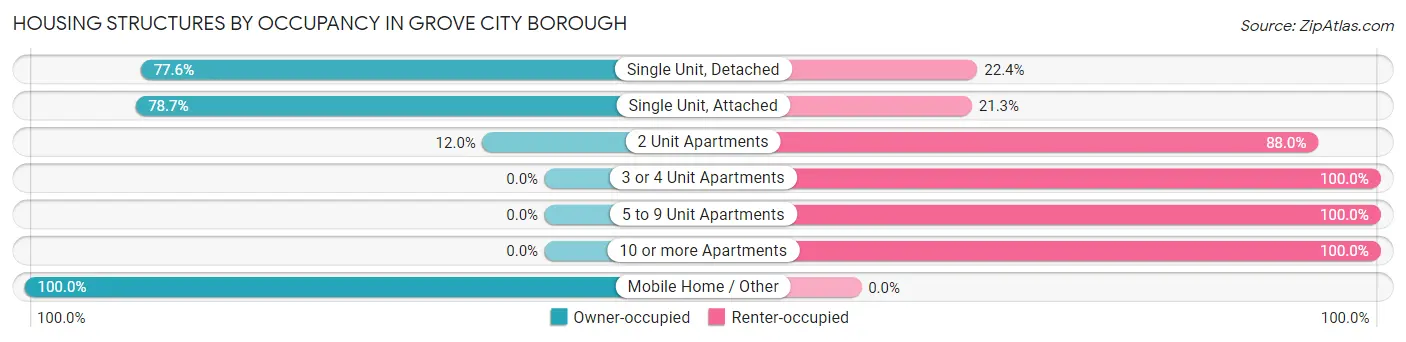
| Structure Type | Owner-occupied | Renter-occupied |
| Single Unit, Detached | 1,197 (77.6%) | 345 (22.4%) |
| Single Unit, Attached | 96 (78.7%) | 26 (21.3%) |
| 2 Unit Apartments | 15 (12.0%) | 110 (88.0%) |
| 3 or 4 Unit Apartments | 0 (0.0%) | 214 (100.0%) |
| 5 to 9 Unit Apartments | 0 (0.0%) | 79 (100.0%) |
| 10 or more Apartments | 0 (0.0%) | 398 (100.0%) |
| Mobile Home / Other | 40 (100.0%) | 0 (0.0%) |
| Total | 1,348 (53.5%) | 1,172 (46.5%) |
Housing Structures by Number of Rooms in Grove City borough
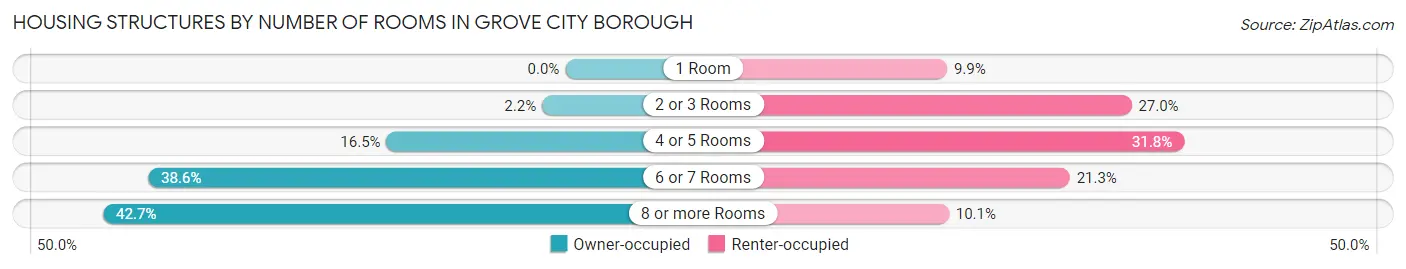
| Number of Rooms | Owner-occupied | Renter-occupied |
| 1 Room | 0 (0.0%) | 116 (9.9%) |
| 2 or 3 Rooms | 29 (2.1%) | 316 (27.0%) |
| 4 or 5 Rooms | 223 (16.5%) | 373 (31.8%) |
| 6 or 7 Rooms | 520 (38.6%) | 249 (21.2%) |
| 8 or more Rooms | 576 (42.7%) | 118 (10.1%) |
| Total | 1,348 (100.0%) | 1,172 (100.0%) |
Housing Structure by Heating Type in Grove City borough
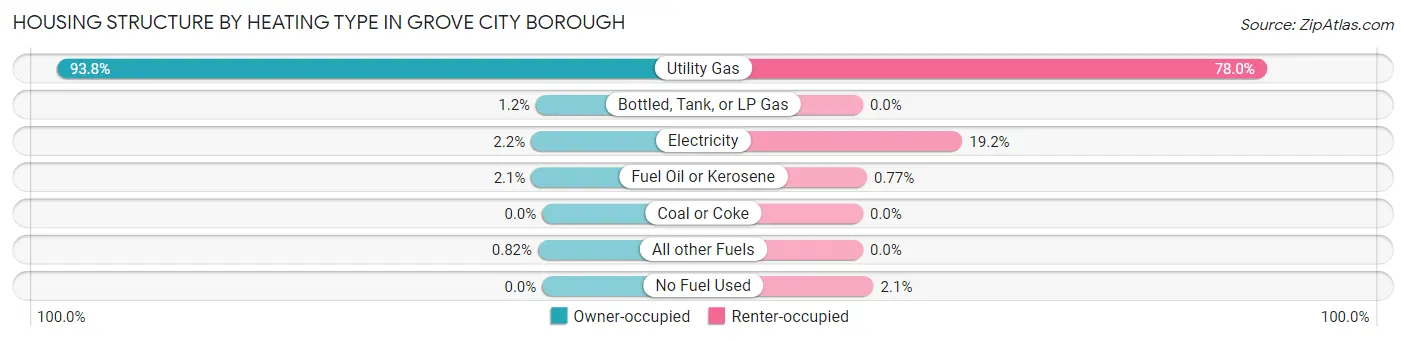
| Heating Type | Owner-occupied | Renter-occupied |
| Utility Gas | 1,264 (93.8%) | 914 (78.0%) |
| Bottled, Tank, or LP Gas | 16 (1.2%) | 0 (0.0%) |
| Electricity | 29 (2.1%) | 225 (19.2%) |
| Fuel Oil or Kerosene | 28 (2.1%) | 9 (0.8%) |
| Coal or Coke | 0 (0.0%) | 0 (0.0%) |
| All other Fuels | 11 (0.8%) | 0 (0.0%) |
| No Fuel Used | 0 (0.0%) | 24 (2.1%) |
| Total | 1,348 (100.0%) | 1,172 (100.0%) |
Household Vehicle Usage in Grove City borough
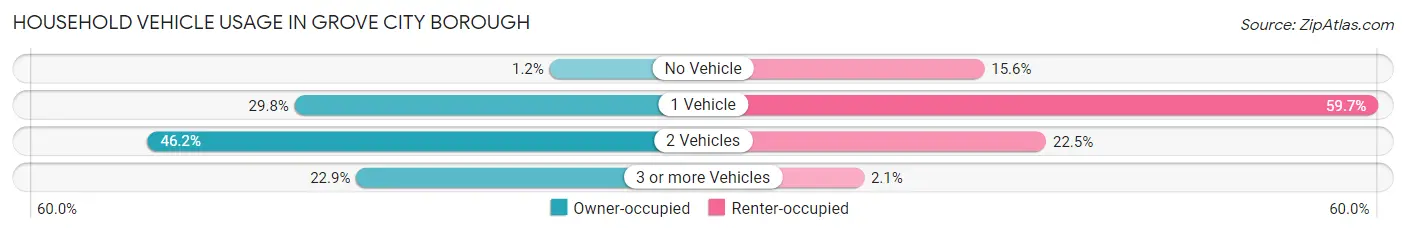
| Vehicles per Household | Owner-occupied | Renter-occupied |
| No Vehicle | 16 (1.2%) | 183 (15.6%) |
| 1 Vehicle | 401 (29.7%) | 700 (59.7%) |
| 2 Vehicles | 623 (46.2%) | 264 (22.5%) |
| 3 or more Vehicles | 308 (22.9%) | 25 (2.1%) |
| Total | 1,348 (100.0%) | 1,172 (100.0%) |
Real Estate & Mortgages in Grove City borough
Real Estate and Mortgage Overview in Grove City borough
| Characteristic | Without Mortgage | With Mortgage |
| Housing Units | 571 | 777 |
| Median Property Value | $154,000 | $158,400 |
| Median Household Income | $59,609 | $157 |
| Monthly Housing Costs | $417 | $6 |
| Real Estate Taxes | $1,352 | $11 |
Property Value by Mortgage Status in Grove City borough
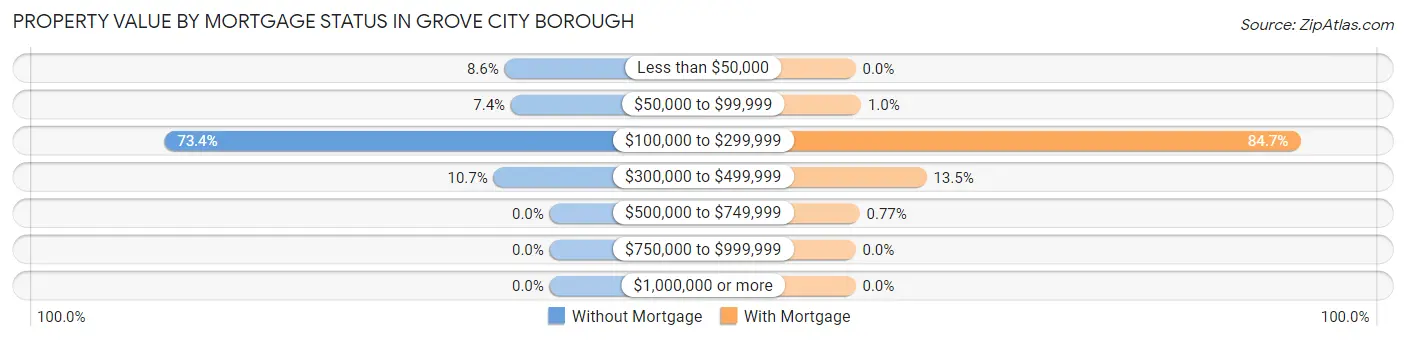
| Property Value | Without Mortgage | With Mortgage |
| Less than $50,000 | 49 (8.6%) | 0 (0.0%) |
| $50,000 to $99,999 | 42 (7.4%) | 8 (1.0%) |
| $100,000 to $299,999 | 419 (73.4%) | 658 (84.7%) |
| $300,000 to $499,999 | 61 (10.7%) | 105 (13.5%) |
| $500,000 to $749,999 | 0 (0.0%) | 6 (0.8%) |
| $750,000 to $999,999 | 0 (0.0%) | 0 (0.0%) |
| $1,000,000 or more | 0 (0.0%) | 0 (0.0%) |
| Total | 571 (100.0%) | 777 (100.0%) |
Household Income by Mortgage Status in Grove City borough
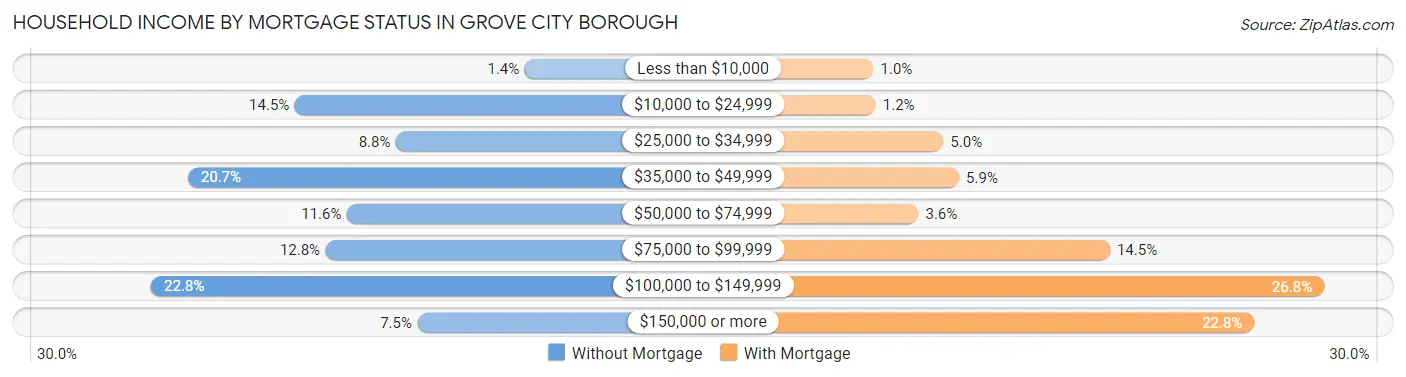
| Household Income | Without Mortgage | With Mortgage |
| Less than $10,000 | 8 (1.4%) | 8 (1.0%) |
| $10,000 to $24,999 | 83 (14.5%) | 9 (1.2%) |
| $25,000 to $34,999 | 50 (8.8%) | 39 (5.0%) |
| $35,000 to $49,999 | 118 (20.7%) | 46 (5.9%) |
| $50,000 to $74,999 | 66 (11.6%) | 28 (3.6%) |
| $75,000 to $99,999 | 73 (12.8%) | 113 (14.5%) |
| $100,000 to $149,999 | 130 (22.8%) | 208 (26.8%) |
| $150,000 or more | 43 (7.5%) | 177 (22.8%) |
| Total | 571 (100.0%) | 777 (100.0%) |
Property Value to Household Income Ratio in Grove City borough
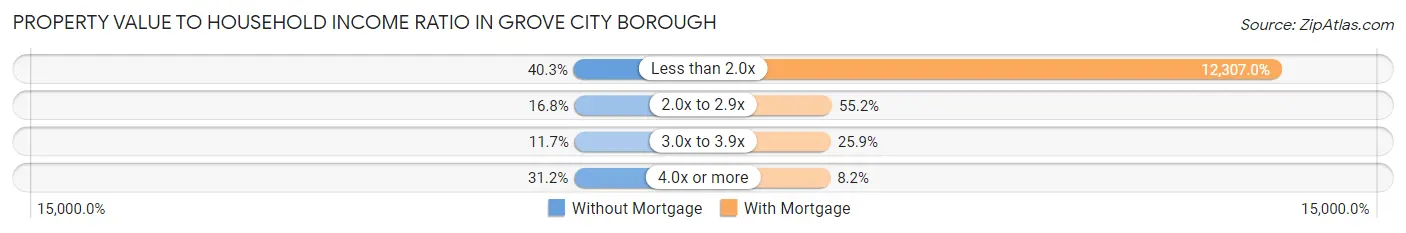
| Value-to-Income Ratio | Without Mortgage | With Mortgage |
| Less than 2.0x | 230 (40.3%) | 95,625 (12,307.0%) |
| 2.0x to 2.9x | 96 (16.8%) | 429 (55.2%) |
| 3.0x to 3.9x | 67 (11.7%) | 201 (25.9%) |
| 4.0x or more | 178 (31.2%) | 64 (8.2%) |
| Total | 571 (100.0%) | 777 (100.0%) |
Real Estate Taxes by Mortgage Status in Grove City borough
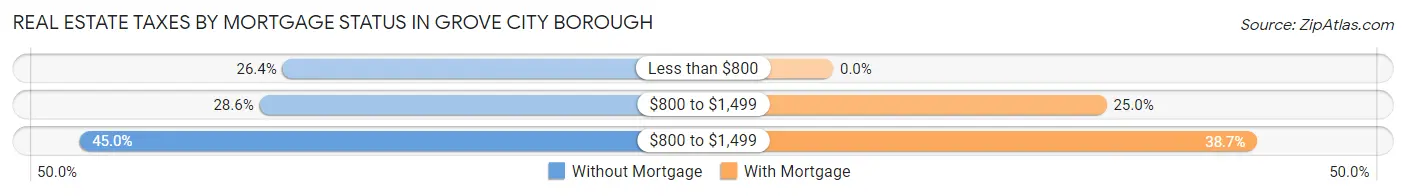
| Property Taxes | Without Mortgage | With Mortgage |
| Less than $800 | 151 (26.4%) | 0 (0.0%) |
| $800 to $1,499 | 163 (28.5%) | 194 (25.0%) |
| $800 to $1,499 | 257 (45.0%) | 301 (38.7%) |
| Total | 571 (100.0%) | 777 (100.0%) |
Health & Disability in Grove City borough
Health Insurance Coverage by Age in Grove City borough
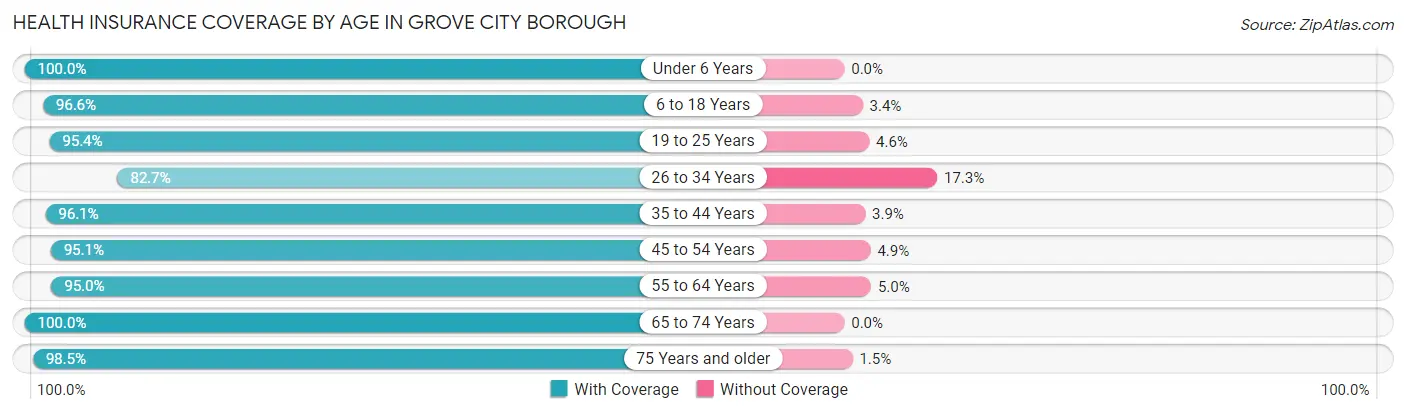
| Age Bracket | With Coverage | Without Coverage |
| Under 6 Years | 265 (100.0%) | 0 (0.0%) |
| 6 to 18 Years | 1,386 (96.6%) | 49 (3.4%) |
| 19 to 25 Years | 2,248 (95.4%) | 109 (4.6%) |
| 26 to 34 Years | 579 (82.7%) | 121 (17.3%) |
| 35 to 44 Years | 570 (96.1%) | 23 (3.9%) |
| 45 to 54 Years | 761 (95.1%) | 39 (4.9%) |
| 55 to 64 Years | 572 (95.0%) | 30 (5.0%) |
| 65 to 74 Years | 506 (100.0%) | 0 (0.0%) |
| 75 Years and older | 455 (98.5%) | 7 (1.5%) |
| Total | 7,342 (95.1%) | 378 (4.9%) |
Health Insurance Coverage by Citizenship Status in Grove City borough
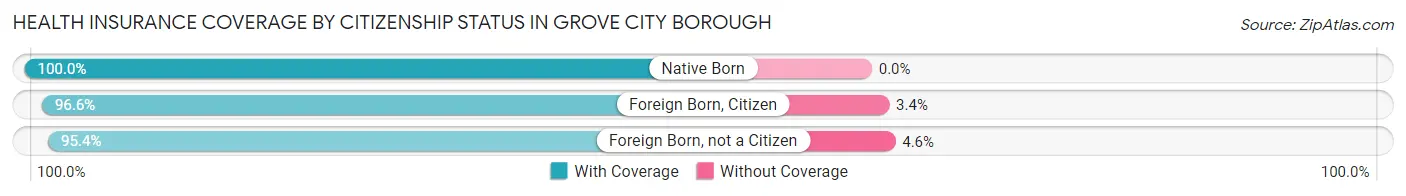
| Citizenship Status | With Coverage | Without Coverage |
| Native Born | 265 (100.0%) | 0 (0.0%) |
| Foreign Born, Citizen | 1,386 (96.6%) | 49 (3.4%) |
| Foreign Born, not a Citizen | 2,248 (95.4%) | 109 (4.6%) |
Health Insurance Coverage by Household Income in Grove City borough
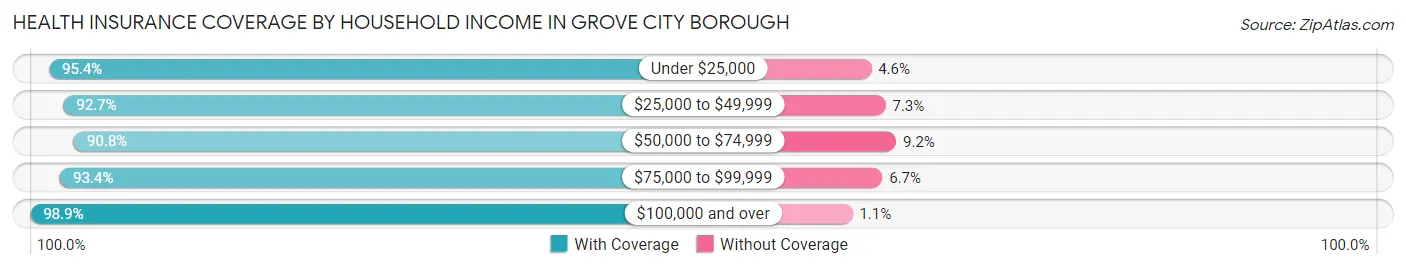
| Household Income | With Coverage | Without Coverage |
| Under $25,000 | 668 (95.4%) | 32 (4.6%) |
| $25,000 to $49,999 | 882 (92.7%) | 69 (7.3%) |
| $50,000 to $74,999 | 678 (90.8%) | 69 (9.2%) |
| $75,000 to $99,999 | 968 (93.3%) | 69 (6.7%) |
| $100,000 and over | 1,871 (98.9%) | 20 (1.1%) |
Public vs Private Health Insurance Coverage by Age in Grove City borough
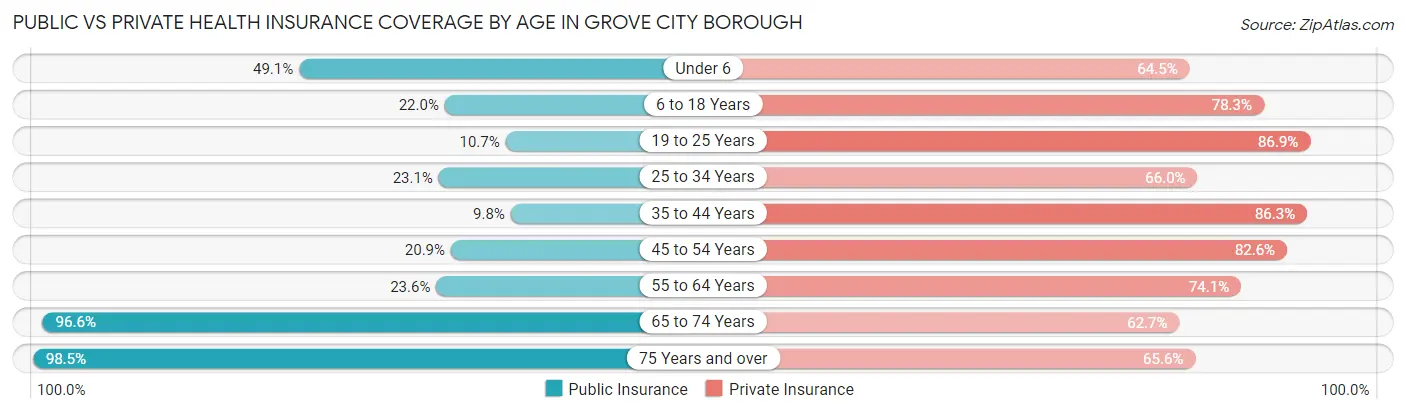
| Age Bracket | Public Insurance | Private Insurance |
| Under 6 | 130 (49.1%) | 171 (64.5%) |
| 6 to 18 Years | 316 (22.0%) | 1,124 (78.3%) |
| 19 to 25 Years | 253 (10.7%) | 2,049 (86.9%) |
| 25 to 34 Years | 162 (23.1%) | 462 (66.0%) |
| 35 to 44 Years | 58 (9.8%) | 512 (86.3%) |
| 45 to 54 Years | 167 (20.9%) | 661 (82.6%) |
| 55 to 64 Years | 142 (23.6%) | 446 (74.1%) |
| 65 to 74 Years | 489 (96.6%) | 317 (62.6%) |
| 75 Years and over | 455 (98.5%) | 303 (65.6%) |
| Total | 2,172 (28.1%) | 6,045 (78.3%) |
Disability Status by Sex by Age in Grove City borough
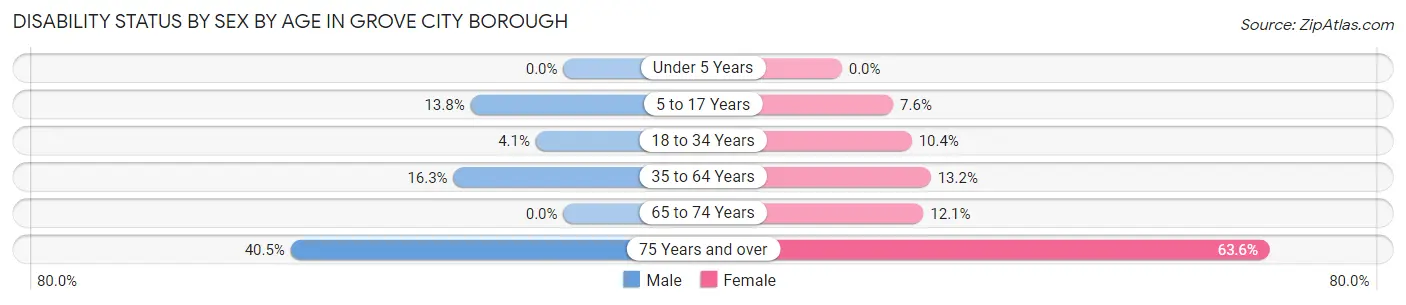
| Age Bracket | Male | Female |
| Under 5 Years | 0 (0.0%) | 0 (0.0%) |
| 5 to 17 Years | 63 (13.8%) | 29 (7.6%) |
| 18 to 34 Years | 81 (4.1%) | 178 (10.4%) |
| 35 to 64 Years | 155 (16.3%) | 138 (13.2%) |
| 65 to 74 Years | 0 (0.0%) | 47 (12.1%) |
| 75 Years and over | 66 (40.5%) | 190 (63.5%) |
Disability Class by Sex by Age in Grove City borough
Disability Class: Hearing Difficulty
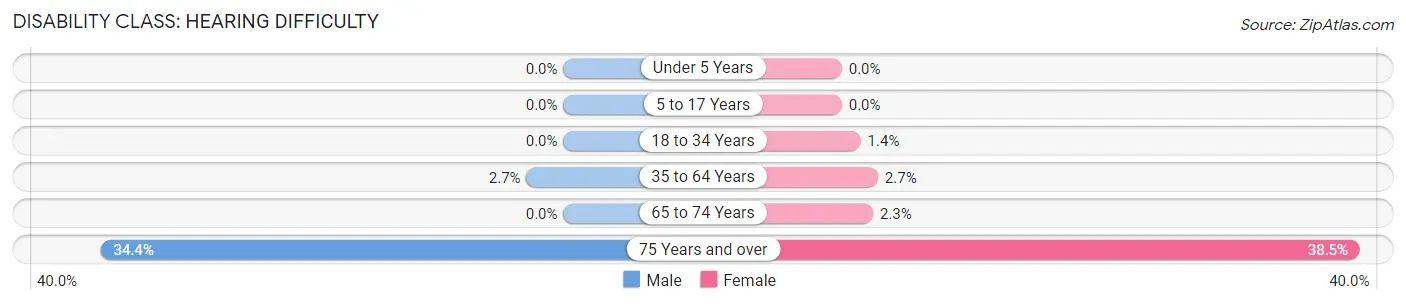
| Age Bracket | Male | Female |
| Under 5 Years | 0 (0.0%) | 0 (0.0%) |
| 5 to 17 Years | 0 (0.0%) | 0 (0.0%) |
| 18 to 34 Years | 0 (0.0%) | 24 (1.4%) |
| 35 to 64 Years | 26 (2.7%) | 28 (2.7%) |
| 65 to 74 Years | 0 (0.0%) | 9 (2.3%) |
| 75 Years and over | 56 (34.4%) | 115 (38.5%) |
Disability Class: Vision Difficulty
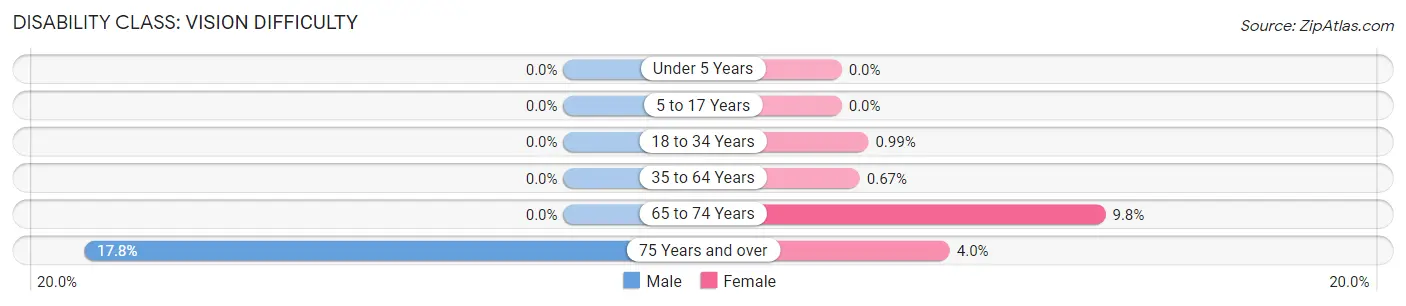
| Age Bracket | Male | Female |
| Under 5 Years | 0 (0.0%) | 0 (0.0%) |
| 5 to 17 Years | 0 (0.0%) | 0 (0.0%) |
| 18 to 34 Years | 0 (0.0%) | 17 (1.0%) |
| 35 to 64 Years | 0 (0.0%) | 7 (0.7%) |
| 65 to 74 Years | 0 (0.0%) | 38 (9.8%) |
| 75 Years and over | 29 (17.8%) | 12 (4.0%) |
Disability Class: Cognitive Difficulty
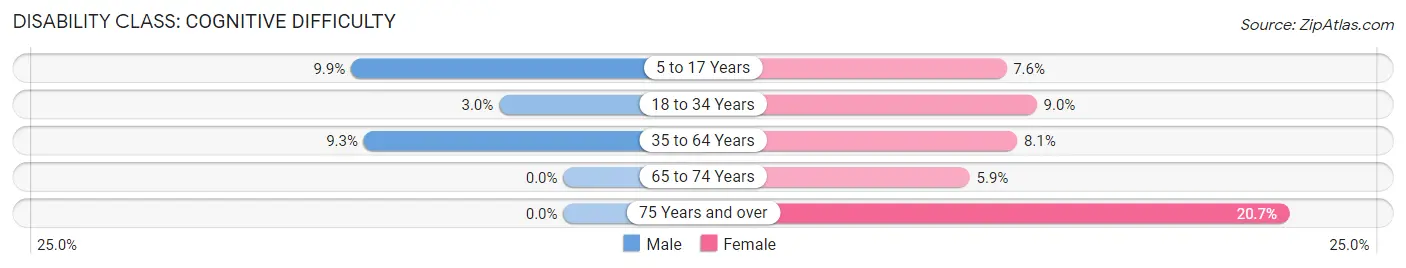
| Age Bracket | Male | Female |
| 5 to 17 Years | 45 (9.9%) | 29 (7.6%) |
| 18 to 34 Years | 59 (3.0%) | 155 (9.0%) |
| 35 to 64 Years | 88 (9.3%) | 85 (8.1%) |
| 65 to 74 Years | 0 (0.0%) | 23 (5.9%) |
| 75 Years and over | 0 (0.0%) | 62 (20.7%) |
Disability Class: Ambulatory Difficulty
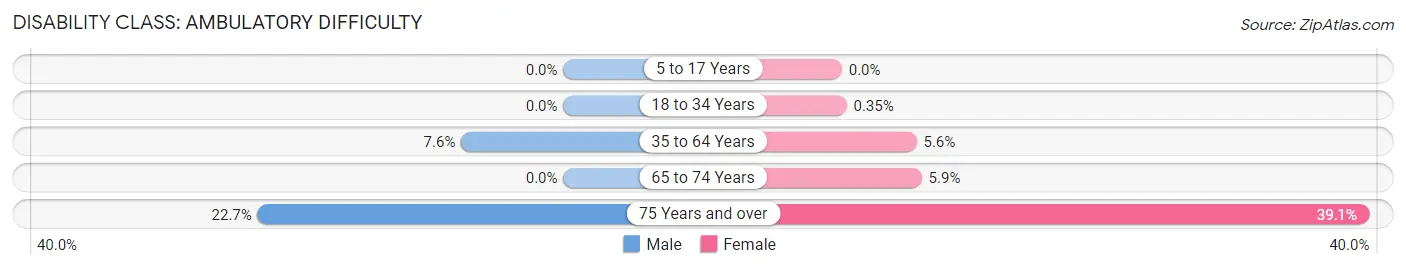
| Age Bracket | Male | Female |
| 5 to 17 Years | 0 (0.0%) | 0 (0.0%) |
| 18 to 34 Years | 0 (0.0%) | 6 (0.4%) |
| 35 to 64 Years | 72 (7.6%) | 58 (5.6%) |
| 65 to 74 Years | 0 (0.0%) | 23 (5.9%) |
| 75 Years and over | 37 (22.7%) | 117 (39.1%) |
Disability Class: Self-Care Difficulty
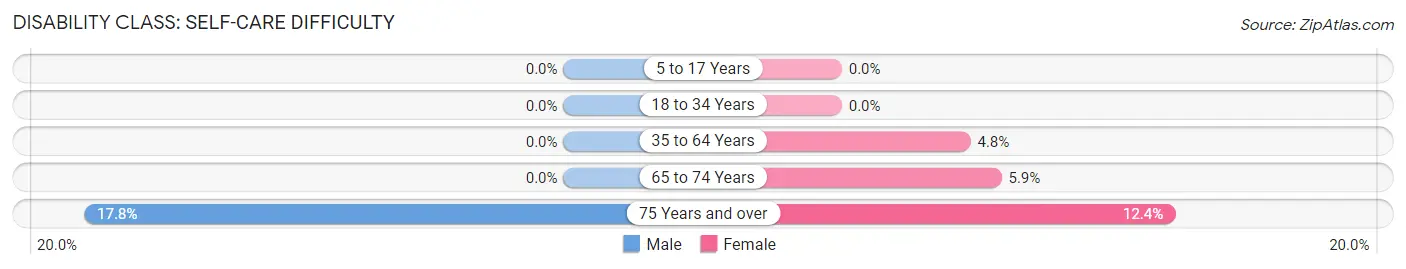
| Age Bracket | Male | Female |
| 5 to 17 Years | 0 (0.0%) | 0 (0.0%) |
| 18 to 34 Years | 0 (0.0%) | 0 (0.0%) |
| 35 to 64 Years | 0 (0.0%) | 50 (4.8%) |
| 65 to 74 Years | 0 (0.0%) | 23 (5.9%) |
| 75 Years and over | 29 (17.8%) | 37 (12.4%) |
Technology Access in Grove City borough
Computing Device Access in Grove City borough
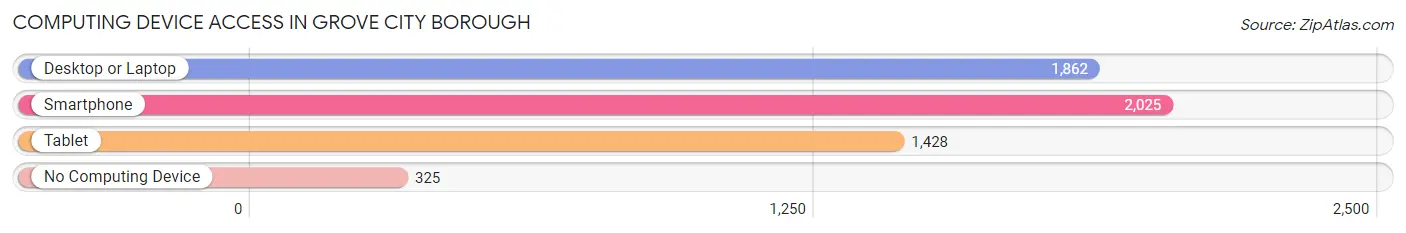
| Device Type | # Households | % Households |
| Desktop or Laptop | 1,862 | 73.9% |
| Smartphone | 2,025 | 80.4% |
| Tablet | 1,428 | 56.7% |
| No Computing Device | 325 | 12.9% |
| Total | 2,520 | 100.0% |
Internet Access in Grove City borough
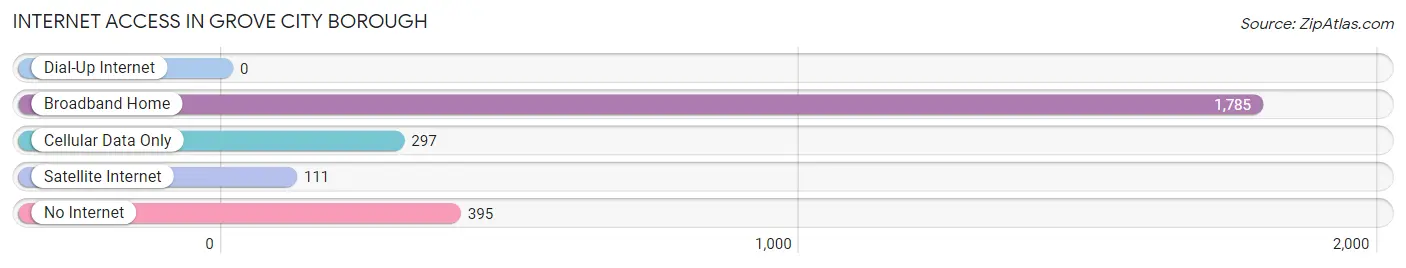
| Internet Type | # Households | % Households |
| Dial-Up Internet | 0 | 0.0% |
| Broadband Home | 1,785 | 70.8% |
| Cellular Data Only | 297 | 11.8% |
| Satellite Internet | 111 | 4.4% |
| No Internet | 395 | 15.7% |
| Total | 2,520 | 100.0% |
Grove City borough Summary
Grove City Borough is a small borough located in Mercer County, Pennsylvania. It is situated in the northwestern part of the state, approximately 60 miles north of Pittsburgh. The borough is home to a population of approximately 8,000 people, and is the county seat of Mercer County.
History
The area that is now Grove City Borough was first settled in the late 1700s by a group of settlers from New England. The settlers were attracted to the area due to its fertile soil and abundant natural resources. The first permanent settlement was established in 1802, and the town was officially incorporated as a borough in 1868.
The town was named after the grove of trees that surrounded the original settlement. The town quickly grew and prospered due to its location on the Shenango River, which provided a convenient transportation route for goods and services. The town was also home to several industries, including a sawmill, a gristmill, and a tannery.
In the late 1800s, the town began to experience a period of rapid growth and development. The railroad arrived in 1871, and the town was connected to the rest of the state by the Pennsylvania Railroad. This allowed for the transportation of goods and services to and from the town, and helped to spur further growth.
In the early 1900s, the town experienced a period of decline due to the Great Depression and the decline of the railroad industry. However, the town was able to rebound in the 1950s and 1960s, thanks to the development of the oil and gas industry in the area.
Geography
Grove City Borough is located in northwestern Pennsylvania, approximately 60 miles north of Pittsburgh. The borough is situated in the foothills of the Appalachian Mountains, and is surrounded by rolling hills and forests. The borough is located on the Shenango River, which provides a convenient transportation route for goods and services.
The borough has a total area of 2.2 square miles, all of which is land. The borough is located in a humid continental climate zone, with hot summers and cold winters. The average annual temperature is around 50 degrees Fahrenheit, and the average annual precipitation is around 40 inches.
Economy
The economy of Grove City Borough is largely based on the oil and gas industry. The borough is home to several oil and gas companies, including Chevron, Shell, and ExxonMobil. The borough is also home to several manufacturing companies, including a plastics manufacturer and a metal fabrication company.
The borough is also home to several retail stores, restaurants, and other businesses. The borough is home to a hospital, a library, and several schools. The borough is also home to several parks and recreational facilities, including a golf course and a swimming pool.
Demographics
As of the 2010 census, the population of Grove City Borough was 8,062. The racial makeup of the borough was 95.3% White, 1.2% African American, 0.3% Native American, 0.7% Asian, 0.1% Pacific Islander, 0.7% from other races, and 1.9% from two or more races. Hispanic or Latino of any race were 2.2% of the population.
The median household income in the borough was $41,945, and the median family income was $50,945. The per capita income in the borough was $20,945. About 8.3% of families and 10.2% of the population were below the poverty line, including 14.2% of those under age 18 and 6.2% of those age 65 or over.
Common Questions
What is Per Capita Income in Grove City borough?
Per Capita income in Grove City borough is $25,447.
What is the Median Family Income in Grove City borough?
Median Family Income in Grove City borough is $92,344.
What is the Median Household income in Grove City borough?
Median Household Income in Grove City borough is $58,900.
What is Income or Wage Gap in Grove City borough?
Income or Wage Gap in Grove City borough is 43.2%.
Women in Grove City borough earn 56.8 cents for every dollar earned by a man.
What is Inequality or Gini Index in Grove City borough?
Inequality or Gini Index in Grove City borough is 0.43.
What is the Total Population of Grove City borough?
Total Population of Grove City borough is 7,908.
What is the Total Male Population of Grove City borough?
Total Male Population of Grove City borough is 3,908.
What is the Total Female Population of Grove City borough?
Total Female Population of Grove City borough is 4,000.
What is the Ratio of Males per 100 Females in Grove City borough?
There are 97.70 Males per 100 Females in Grove City borough.
What is the Ratio of Females per 100 Males in Grove City borough?
There are 102.35 Females per 100 Males in Grove City borough.
What is the Median Population Age in Grove City borough?
Median Population Age in Grove City borough is 24.4 Years.
What is the Average Family Size in Grove City borough
Average Family Size in Grove City borough is 2.8 People.
What is the Average Household Size in Grove City borough
Average Household Size in Grove City borough is 2.1 People.
How Large is the Labor Force in Grove City borough?
There are 3,772 People in the Labor Forcein in Grove City borough.
What is the Percentage of People in the Labor Force in Grove City borough?
53.4% of People are in the Labor Force in Grove City borough.
What is the Unemployment Rate in Grove City borough?
Unemployment Rate in Grove City borough is 4.9%.