Franklin Park borough, PA Map & Demographics
Franklin Park borough Overview
$72,508
PER CAPITA INCOME
$180,067
AVG FAMILY INCOME
$158,052
AVG HOUSEHOLD INCOME
38.2%
WAGE / INCOME GAP [ % ]
61.8¢/ $1
WAGE / INCOME GAP [ $ ]
0.43
INEQUALITY / GINI INDEX
15,305
TOTAL POPULATION
7,685
MALE POPULATION
7,620
FEMALE POPULATION
100.85
MALES / 100 FEMALES
99.15
FEMALES / 100 MALES
41.1
MEDIAN AGE
3.2
AVG FAMILY SIZE
2.9
AVG HOUSEHOLD SIZE
8,324
LABOR FORCE [ PEOPLE ]
71.3%
PERCENT IN LABOR FORCE
4.3%
UNEMPLOYMENT RATE
Income in Franklin Park borough
Income Overview in Franklin Park borough
Per Capita Income in Franklin Park borough is $72,508, while median incomes of families and households are $180,067 and $158,052 respectively.
| Characteristic | Number | Measure |
| Per Capita Income | 15,305 | $72,508 |
| Median Family Income | 4,336 | $180,067 |
| Mean Family Income | 4,336 | $228,110 |
| Median Household Income | 5,358 | $158,052 |
| Mean Household Income | 5,358 | $204,954 |
| Income Deficit | 4,336 | $0 |
| Wage / Income Gap (%) | 15,305 | 38.18% |
| Wage / Income Gap ($) | 15,305 | 61.82¢ per $1 |
| Gini / Inequality Index | 15,305 | 0.43 |
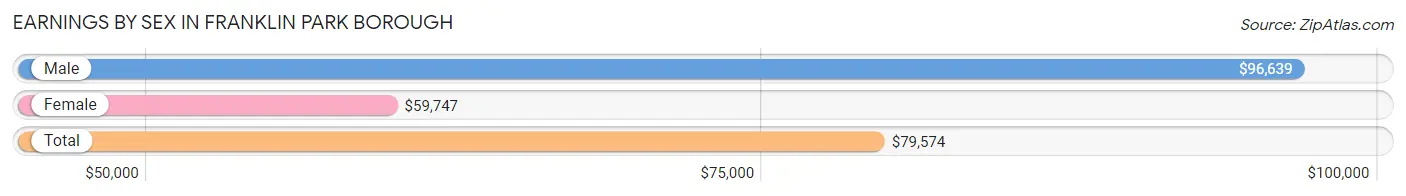
Earnings by Sex in Franklin Park borough
Average Earnings in Franklin Park borough are $79,574, $96,639 for men and $59,747 for women, a difference of 38.2%.
| Sex | Number | Average Earnings |
| Male | 4,833 (55.4%) | $96,639 |
| Female | 3,891 (44.6%) | $59,747 |
| Total | 8,724 (100.0%) | $79,574 |
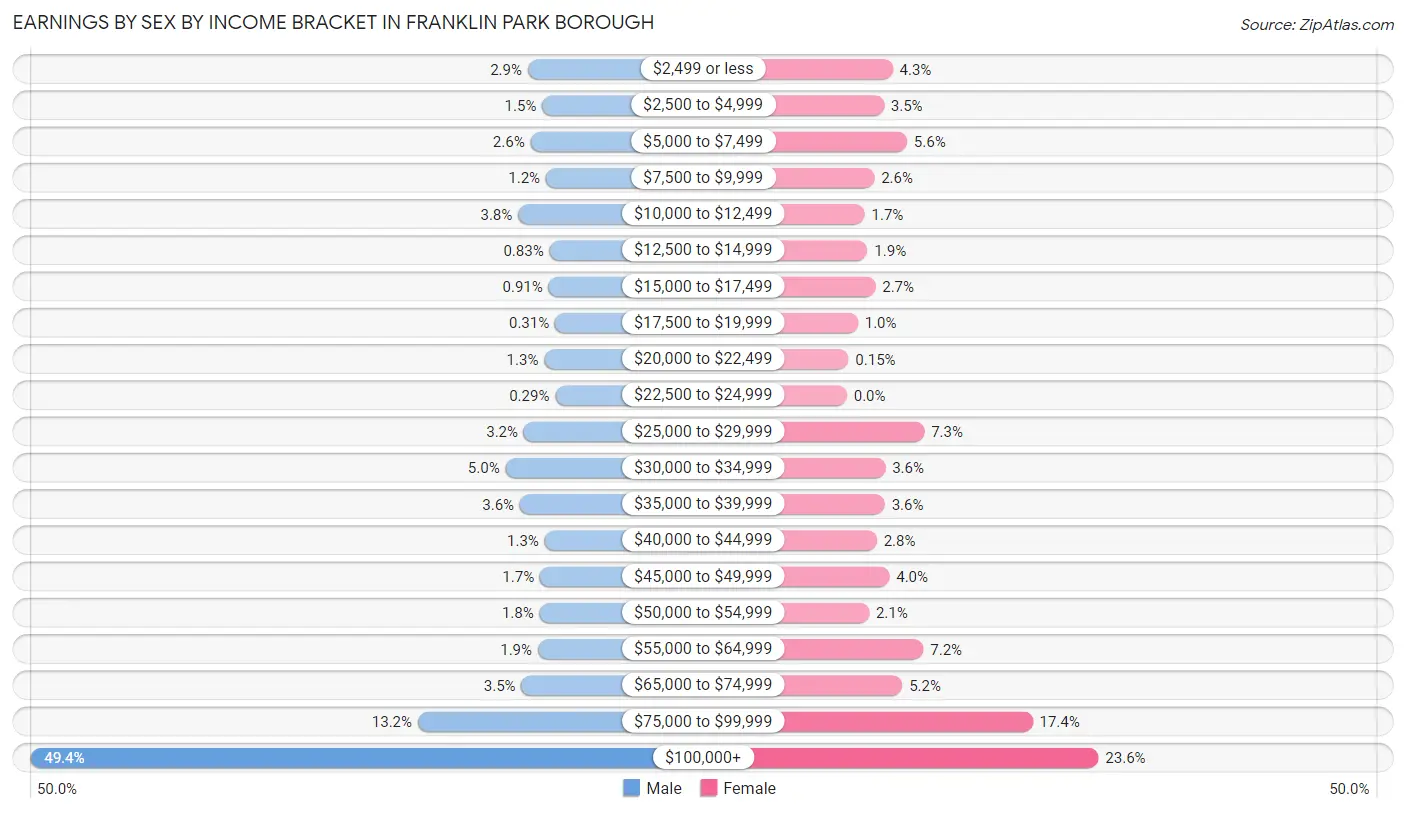
Earnings by Sex by Income Bracket in Franklin Park borough
The most common earnings brackets in Franklin Park borough are $100,000+ for men (2,386 | 49.4%) and $100,000+ for women (917 | 23.6%).
| Income | Male | Female |
| $2,499 or less | 138 (2.9%) | 167 (4.3%) |
| $2,500 to $4,999 | 73 (1.5%) | 135 (3.5%) |
| $5,000 to $7,499 | 126 (2.6%) | 219 (5.6%) |
| $7,500 to $9,999 | 56 (1.2%) | 100 (2.6%) |
| $10,000 to $12,499 | 182 (3.8%) | 65 (1.7%) |
| $12,500 to $14,999 | 40 (0.8%) | 75 (1.9%) |
| $15,000 to $17,499 | 44 (0.9%) | 104 (2.7%) |
| $17,500 to $19,999 | 15 (0.3%) | 40 (1.0%) |
| $20,000 to $22,499 | 64 (1.3%) | 6 (0.2%) |
| $22,500 to $24,999 | 14 (0.3%) | 0 (0.0%) |
| $25,000 to $29,999 | 156 (3.2%) | 282 (7.2%) |
| $30,000 to $34,999 | 239 (5.0%) | 140 (3.6%) |
| $35,000 to $39,999 | 174 (3.6%) | 138 (3.5%) |
| $40,000 to $44,999 | 62 (1.3%) | 109 (2.8%) |
| $45,000 to $49,999 | 83 (1.7%) | 155 (4.0%) |
| $50,000 to $54,999 | 85 (1.8%) | 81 (2.1%) |
| $55,000 to $64,999 | 93 (1.9%) | 279 (7.2%) |
| $65,000 to $74,999 | 167 (3.5%) | 202 (5.2%) |
| $75,000 to $99,999 | 636 (13.2%) | 677 (17.4%) |
| $100,000+ | 2,386 (49.4%) | 917 (23.6%) |
| Total | 4,833 (100.0%) | 3,891 (100.0%) |
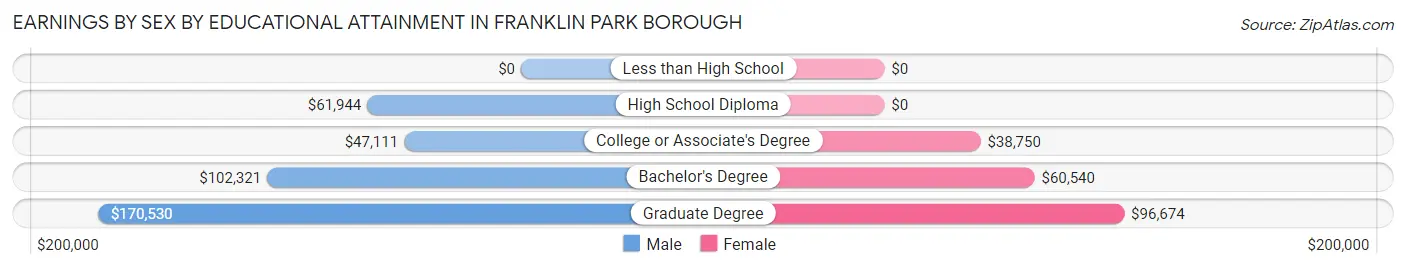
Earnings by Sex by Educational Attainment in Franklin Park borough
Average earnings in Franklin Park borough are $106,455 for men and $67,650 for women, a difference of 36.4%. Men with an educational attainment of graduate degree enjoy the highest average annual earnings of $170,530, while those with college or associate's degree education earn the least with $47,111. Women with an educational attainment of graduate degree earn the most with the average annual earnings of $96,674, while those with college or associate's degree education have the smallest earnings of $38,750.
| Educational Attainment | Male Income | Female Income |
| Less than High School | - | - |
| High School Diploma | $61,944 | $0 |
| College or Associate's Degree | $47,111 | $38,750 |
| Bachelor's Degree | $102,321 | $60,540 |
| Graduate Degree | $170,530 | $96,674 |
| Total | $106,455 | $67,650 |
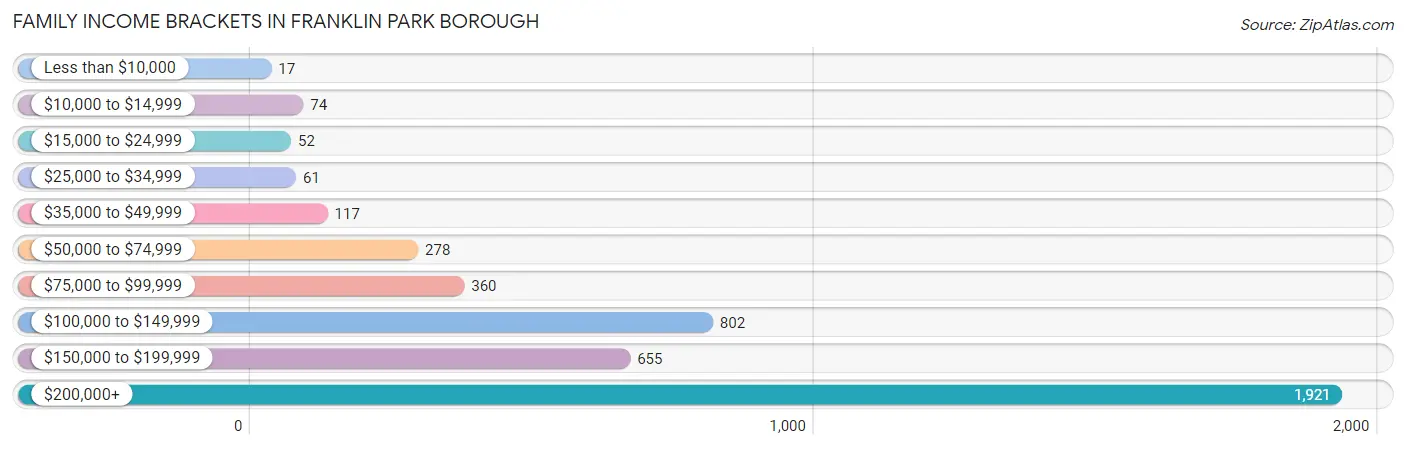
Family Income in Franklin Park borough
Family Income Brackets in Franklin Park borough
According to the Franklin Park borough family income data, there are 1,921 families falling into the $200,000+ income range, which is the most common income bracket and makes up 44.3% of all families. Conversely, the less than $10,000 income bracket is the least frequent group with only 17 families (0.4%) belonging to this category.
| Income Bracket | # Families | % Families |
| Less than $10,000 | 17 | 0.4% |
| $10,000 to $14,999 | 74 | 1.7% |
| $15,000 to $24,999 | 52 | 1.2% |
| $25,000 to $34,999 | 61 | 1.4% |
| $35,000 to $49,999 | 117 | 2.7% |
| $50,000 to $74,999 | 278 | 6.4% |
| $75,000 to $99,999 | 360 | 8.3% |
| $100,000 to $149,999 | 802 | 18.5% |
| $150,000 to $199,999 | 655 | 15.1% |
| $200,000+ | 1,921 | 44.3% |
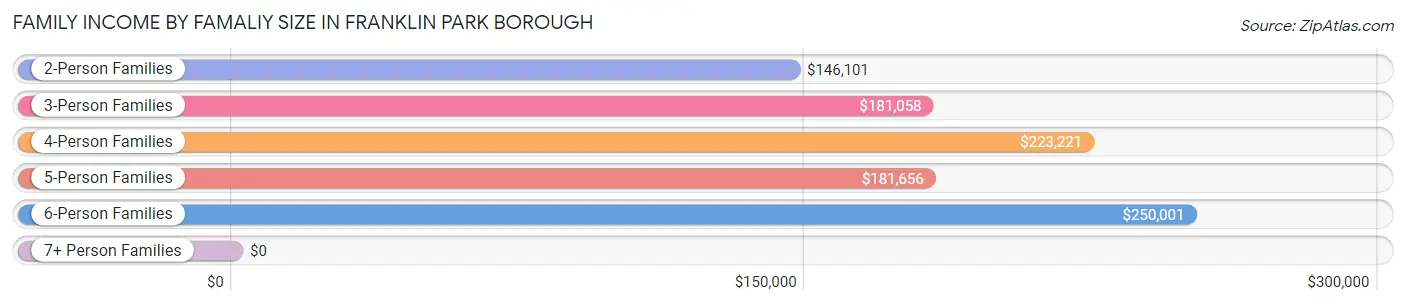
Family Income by Famaliy Size in Franklin Park borough
6-person families (103 | 2.4%) account for the highest median family income in Franklin Park borough with $250,001 per family, while 2-person families (1,753 | 40.4%) have the highest median income of $73,050 per family member.
| Income Bracket | # Families | Median Income |
| 2-Person Families | 1,753 (40.4%) | $146,101 |
| 3-Person Families | 927 (21.4%) | $181,058 |
| 4-Person Families | 1,217 (28.1%) | $223,221 |
| 5-Person Families | 297 (6.9%) | $181,656 |
| 6-Person Families | 103 (2.4%) | $250,001 |
| 7+ Person Families | 39 (0.9%) | $0 |
| Total | 4,336 (100.0%) | $180,067 |
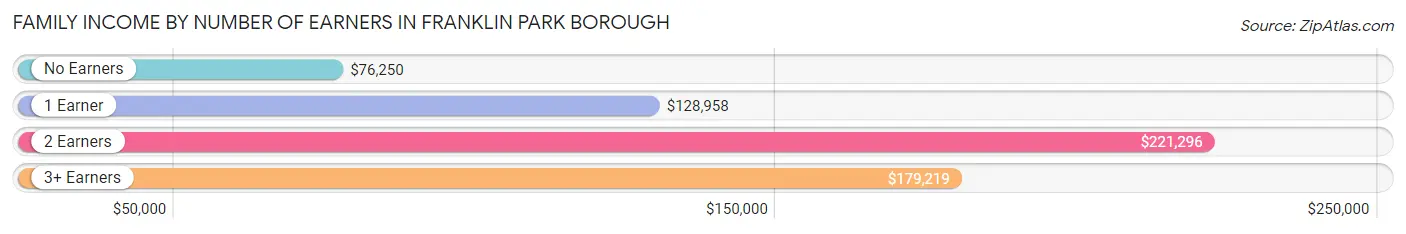
Family Income by Number of Earners in Franklin Park borough
The median family income in Franklin Park borough is $180,067, with families comprising 2 earners (2,494) having the highest median family income of $221,296, while families with no earners (417) have the lowest median family income of $76,250, accounting for 57.5% and 9.6% of families, respectively.
| Number of Earners | # Families | Median Income |
| No Earners | 417 (9.6%) | $76,250 |
| 1 Earner | 892 (20.6%) | $128,958 |
| 2 Earners | 2,494 (57.5%) | $221,296 |
| 3+ Earners | 533 (12.3%) | $179,219 |
| Total | 4,336 (100.0%) | $180,067 |
Household Income in Franklin Park borough
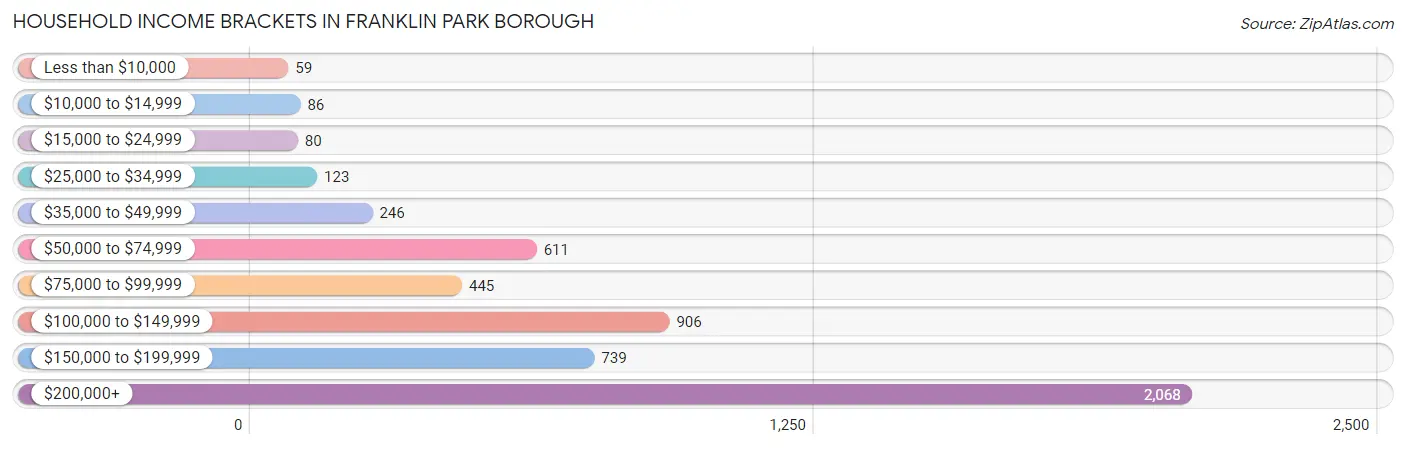
Household Income Brackets in Franklin Park borough
With 2,068 households falling in the category, the $200,000+ income range is the most frequent in Franklin Park borough, accounting for 38.6% of all households. In contrast, only 59 households (1.1%) fall into the less than $10,000 income bracket, making it the least populous group.
| Income Bracket | # Households | % Households |
| Less than $10,000 | 59 | 1.1% |
| $10,000 to $14,999 | 86 | 1.6% |
| $15,000 to $24,999 | 80 | 1.5% |
| $25,000 to $34,999 | 123 | 2.3% |
| $35,000 to $49,999 | 246 | 4.6% |
| $50,000 to $74,999 | 611 | 11.4% |
| $75,000 to $99,999 | 445 | 8.3% |
| $100,000 to $149,999 | 906 | 16.9% |
| $150,000 to $199,999 | 739 | 13.8% |
| $200,000+ | 2,068 | 38.6% |
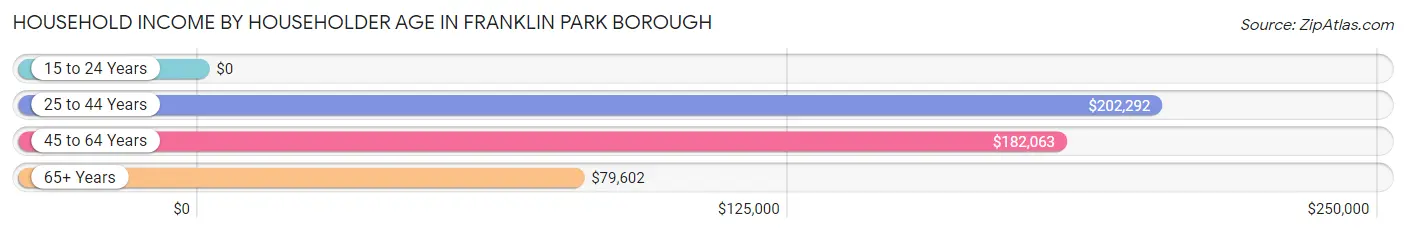
Household Income by Householder Age in Franklin Park borough
The median household income in Franklin Park borough is $158,052, with the highest median household income of $202,292 found in the 25 to 44 years age bracket for the primary householder. A total of 1,620 households (30.2%) fall into this category. Meanwhile, the 15 to 24 years age bracket for the primary householder has the lowest median household income of $0, with 11 households (0.2%) in this group.
| Income Bracket | # Households | Median Income |
| 15 to 24 Years | 11 (0.2%) | $0 |
| 25 to 44 Years | 1,620 (30.2%) | $202,292 |
| 45 to 64 Years | 2,360 (44.1%) | $182,063 |
| 65+ Years | 1,367 (25.5%) | $79,602 |
| Total | 5,358 (100.0%) | $158,052 |
Poverty in Franklin Park borough
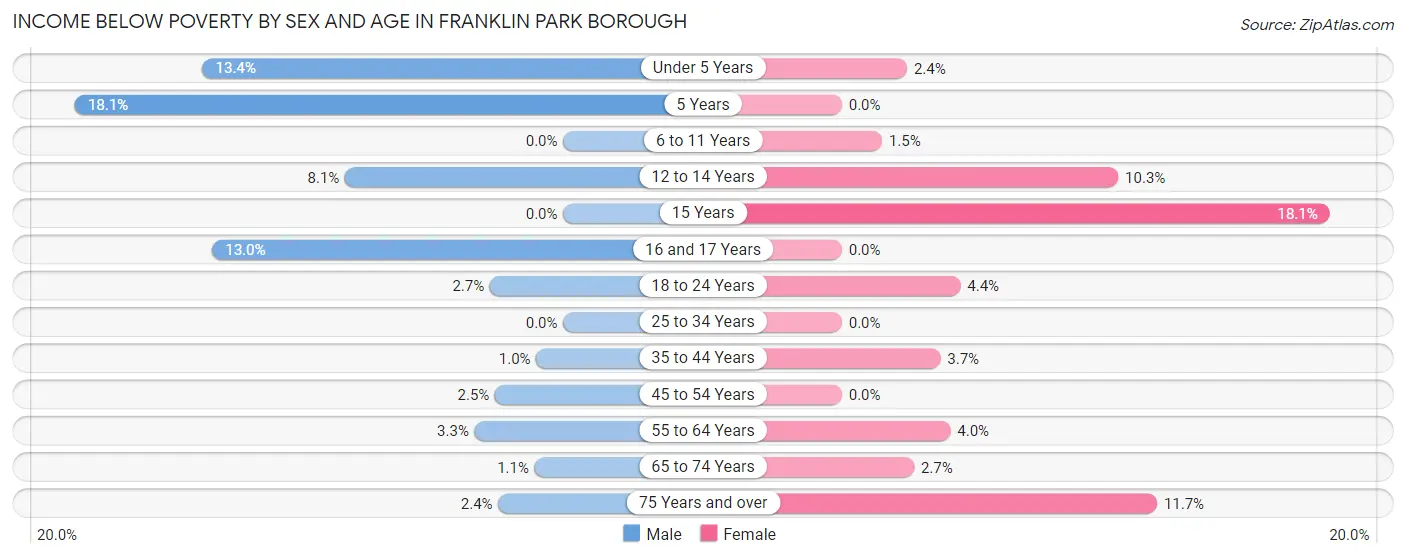
Income Below Poverty by Sex and Age in Franklin Park borough
With 3.4% poverty level for males and 3.2% for females among the residents of Franklin Park borough, 5 year old males and 15 year old females are the most vulnerable to poverty, with 31 males (18.1%) and 23 females (18.1%) in their respective age groups living below the poverty level.
| Age Bracket | Male | Female |
| Under 5 Years | 58 (13.4%) | 12 (2.4%) |
| 5 Years | 31 (18.1%) | 0 (0.0%) |
| 6 to 11 Years | 0 (0.0%) | 11 (1.5%) |
| 12 to 14 Years | 35 (8.1%) | 36 (10.3%) |
| 15 Years | 0 (0.0%) | 23 (18.1%) |
| 16 and 17 Years | 34 (13.0%) | 0 (0.0%) |
| 18 to 24 Years | 11 (2.7%) | 12 (4.4%) |
| 25 to 34 Years | 0 (0.0%) | 0 (0.0%) |
| 35 to 44 Years | 10 (1.0%) | 41 (3.7%) |
| 45 to 54 Years | 32 (2.5%) | 0 (0.0%) |
| 55 to 64 Years | 33 (3.3%) | 40 (4.0%) |
| 65 to 74 Years | 8 (1.1%) | 20 (2.7%) |
| 75 Years and over | 9 (2.4%) | 51 (11.7%) |
| Total | 261 (3.4%) | 246 (3.2%) |
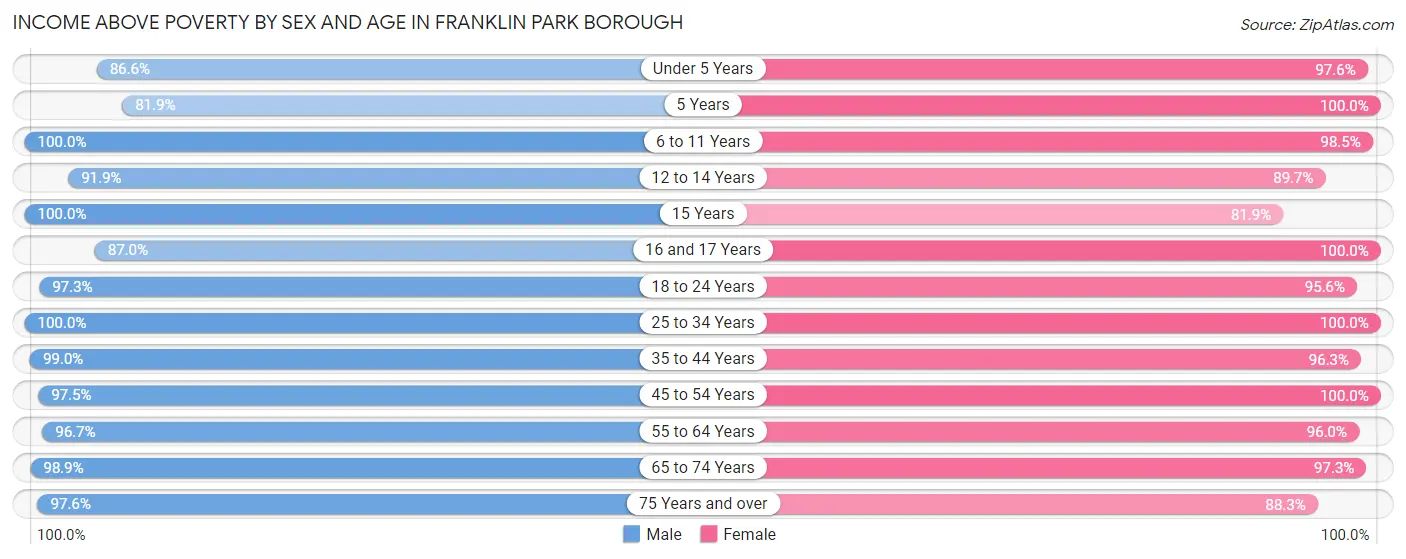
Income Above Poverty by Sex and Age in Franklin Park borough
According to the poverty statistics in Franklin Park borough, males aged 6 to 11 years and females aged 5 years are the age groups that are most secure financially, with 100.0% of males and 100.0% of females in these age groups living above the poverty line.
| Age Bracket | Male | Female |
| Under 5 Years | 375 (86.6%) | 484 (97.6%) |
| 5 Years | 140 (81.9%) | 115 (100.0%) |
| 6 to 11 Years | 563 (100.0%) | 728 (98.5%) |
| 12 to 14 Years | 397 (91.9%) | 315 (89.7%) |
| 15 Years | 126 (100.0%) | 104 (81.9%) |
| 16 and 17 Years | 227 (87.0%) | 294 (100.0%) |
| 18 to 24 Years | 394 (97.3%) | 261 (95.6%) |
| 25 to 34 Years | 853 (100.0%) | 738 (100.0%) |
| 35 to 44 Years | 991 (99.0%) | 1,078 (96.3%) |
| 45 to 54 Years | 1,231 (97.5%) | 1,165 (100.0%) |
| 55 to 64 Years | 970 (96.7%) | 953 (96.0%) |
| 65 to 74 Years | 744 (98.9%) | 725 (97.3%) |
| 75 Years and over | 364 (97.6%) | 385 (88.3%) |
| Total | 7,375 (96.6%) | 7,345 (96.8%) |
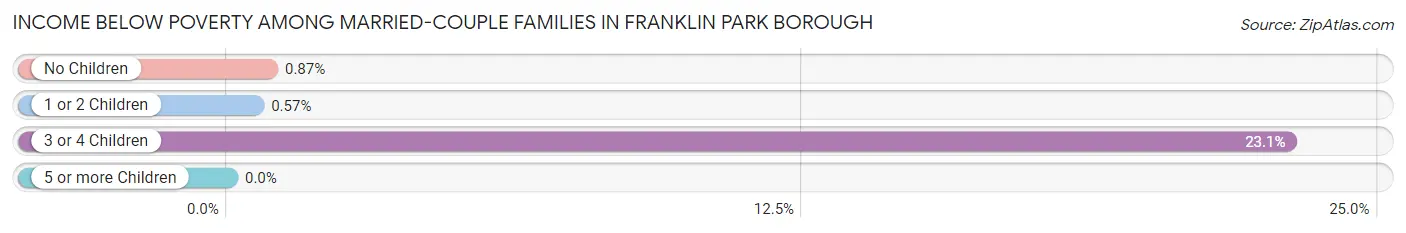
Income Below Poverty Among Married-Couple Families in Franklin Park borough
The poverty statistics for married-couple families in Franklin Park borough show that 2.3% or 92 of the total 4,013 families live below the poverty line. Families with 3 or 4 children have the highest poverty rate of 23.1%, comprising of 65 families. On the other hand, families with 5 or more children have the lowest poverty rate of 0.0%, which includes 0 families.
| Children | Above Poverty | Below Poverty |
| No Children | 1,944 (99.1%) | 17 (0.9%) |
| 1 or 2 Children | 1,732 (99.4%) | 10 (0.6%) |
| 3 or 4 Children | 217 (76.9%) | 65 (23.1%) |
| 5 or more Children | 28 (100.0%) | 0 (0.0%) |
| Total | 3,921 (97.7%) | 92 (2.3%) |
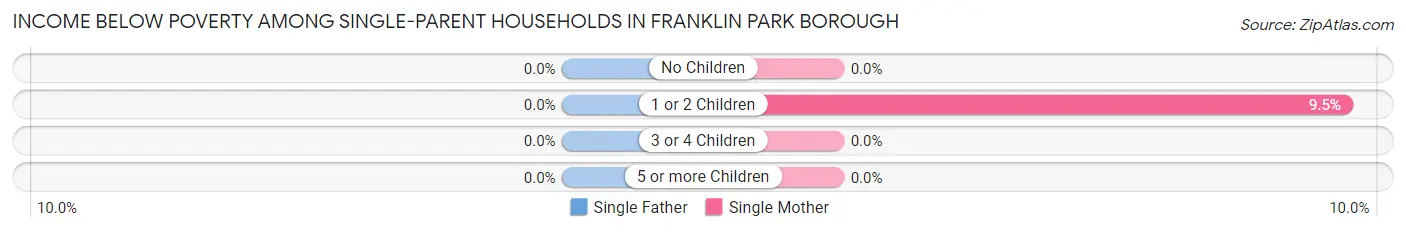
Income Below Poverty Among Single-Parent Households in Franklin Park borough
| Children | Single Father | Single Mother |
| No Children | 0 (0.0%) | 0 (0.0%) |
| 1 or 2 Children | 0 (0.0%) | 11 (9.5%) |
| 3 or 4 Children | 0 (0.0%) | 0 (0.0%) |
| 5 or more Children | 0 (0.0%) | 0 (0.0%) |
| Total | 0 (0.0%) | 11 (3.8%) |
Income Below Poverty Among Married-Couple vs Single-Parent Households in Franklin Park borough
The poverty data for Franklin Park borough shows that 92 of the married-couple family households (2.3%) and 11 of the single-parent households (3.4%) are living below the poverty level. Within the married-couple family households, those with 3 or 4 children have the highest poverty rate, with 65 households (23.1%) falling below the poverty line. Among the single-parent households, those with 1 or 2 children have the highest poverty rate, with 11 household (8.9%) living below poverty.
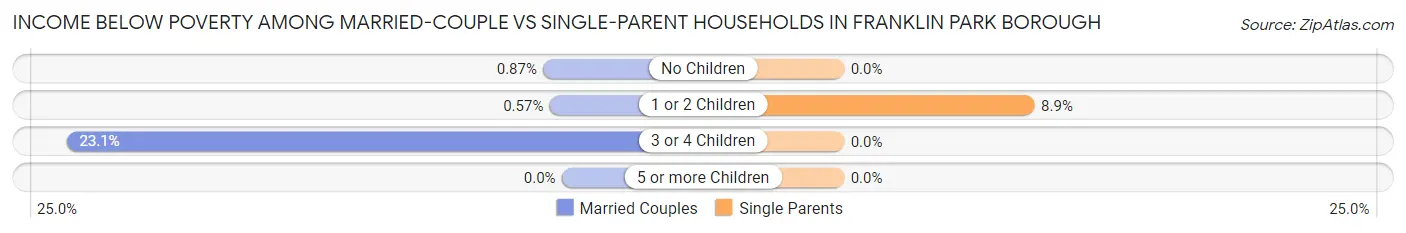
| Children | Married-Couple Families | Single-Parent Households |
| No Children | 17 (0.9%) | 0 (0.0%) |
| 1 or 2 Children | 10 (0.6%) | 11 (8.9%) |
| 3 or 4 Children | 65 (23.1%) | 0 (0.0%) |
| 5 or more Children | 0 (0.0%) | 0 (0.0%) |
| Total | 92 (2.3%) | 11 (3.4%) |
Race in Franklin Park borough
The most populous races in Franklin Park borough are White / Caucasian (11,949 | 78.1%), Asian (2,205 | 14.4%), and Black / African American (496 | 3.2%).
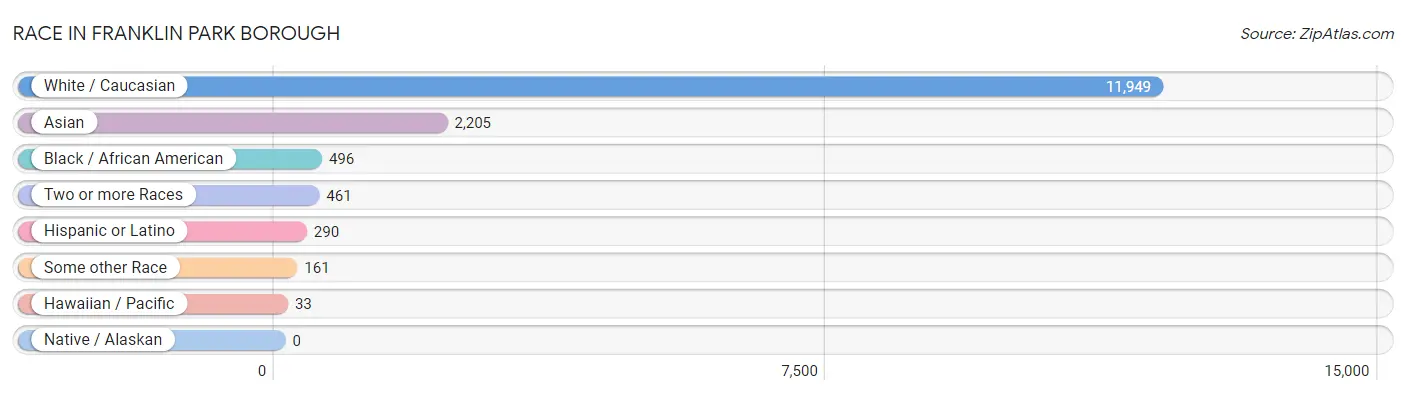
| Race | # Population | % Population |
| Asian | 2,205 | 14.4% |
| Black / African American | 496 | 3.2% |
| Hawaiian / Pacific | 33 | 0.2% |
| Hispanic or Latino | 290 | 1.9% |
| Native / Alaskan | 0 | 0.0% |
| White / Caucasian | 11,949 | 78.1% |
| Two or more Races | 461 | 3.0% |
| Some other Race | 161 | 1.1% |
| Total | 15,305 | 100.0% |
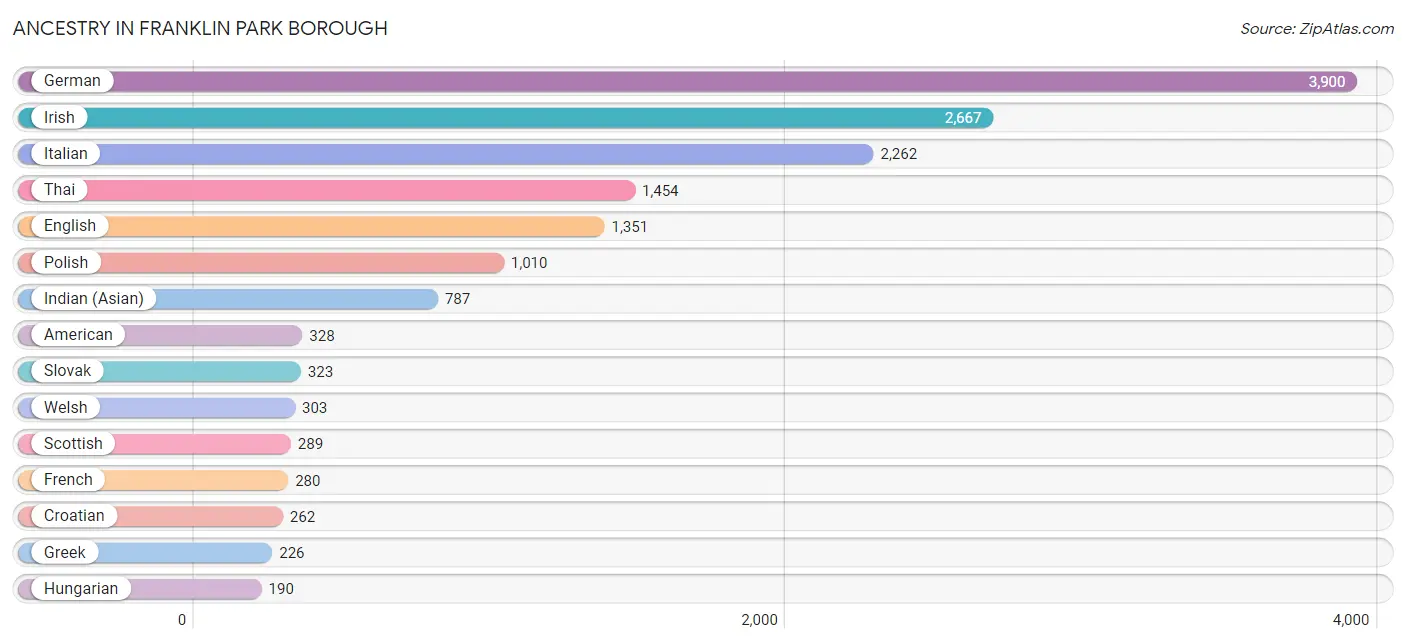
Ancestry in Franklin Park borough
The most populous ancestries reported in Franklin Park borough are German (3,900 | 25.5%), Irish (2,667 | 17.4%), Italian (2,262 | 14.8%), Thai (1,454 | 9.5%), and English (1,351 | 8.8%), together accounting for 76.0% of all Franklin Park borough residents.
| Ancestry | # Population | % Population |
| American | 328 | 2.1% |
| Arab | 40 | 0.3% |
| Armenian | 11 | 0.1% |
| Austrian | 77 | 0.5% |
| Barbadian | 18 | 0.1% |
| Belgian | 13 | 0.1% |
| Bhutanese | 28 | 0.2% |
| Bolivian | 39 | 0.3% |
| British | 114 | 0.7% |
| Bulgarian | 57 | 0.4% |
| Burmese | 47 | 0.3% |
| Colombian | 17 | 0.1% |
| Croatian | 262 | 1.7% |
| Czech | 61 | 0.4% |
| Czechoslovakian | 36 | 0.2% |
| Dutch | 119 | 0.8% |
| Eastern European | 17 | 0.1% |
| English | 1,351 | 8.8% |
| European | 187 | 1.2% |
| Filipino | 12 | 0.1% |
| Finnish | 25 | 0.2% |
| French | 280 | 1.8% |
| French Canadian | 26 | 0.2% |
| German | 3,900 | 25.5% |
| Greek | 226 | 1.5% |
| Hungarian | 190 | 1.2% |
| Indian (Asian) | 787 | 5.1% |
| Irish | 2,667 | 17.4% |
| Italian | 2,262 | 14.8% |
| Korean | 14 | 0.1% |
| Lebanese | 40 | 0.3% |
| Lithuanian | 31 | 0.2% |
| Maltese | 11 | 0.1% |
| Mexican | 73 | 0.5% |
| Norwegian | 65 | 0.4% |
| Pakistani | 14 | 0.1% |
| Pennsylvania German | 50 | 0.3% |
| Peruvian | 27 | 0.2% |
| Polish | 1,010 | 6.6% |
| Portuguese | 4 | 0.0% |
| Russian | 74 | 0.5% |
| Samoan | 33 | 0.2% |
| Scotch-Irish | 175 | 1.1% |
| Scottish | 289 | 1.9% |
| Slavic | 51 | 0.3% |
| Slovak | 323 | 2.1% |
| Slovene | 22 | 0.1% |
| South African | 35 | 0.2% |
| South American | 83 | 0.5% |
| Sri Lankan | 23 | 0.2% |
| Subsaharan African | 35 | 0.2% |
| Swedish | 117 | 0.8% |
| Swiss | 104 | 0.7% |
| Thai | 1,454 | 9.5% |
| Ukrainian | 91 | 0.6% |
| Welsh | 303 | 2.0% |
| Yugoslavian | 10 | 0.1% | View All 57 Rows |
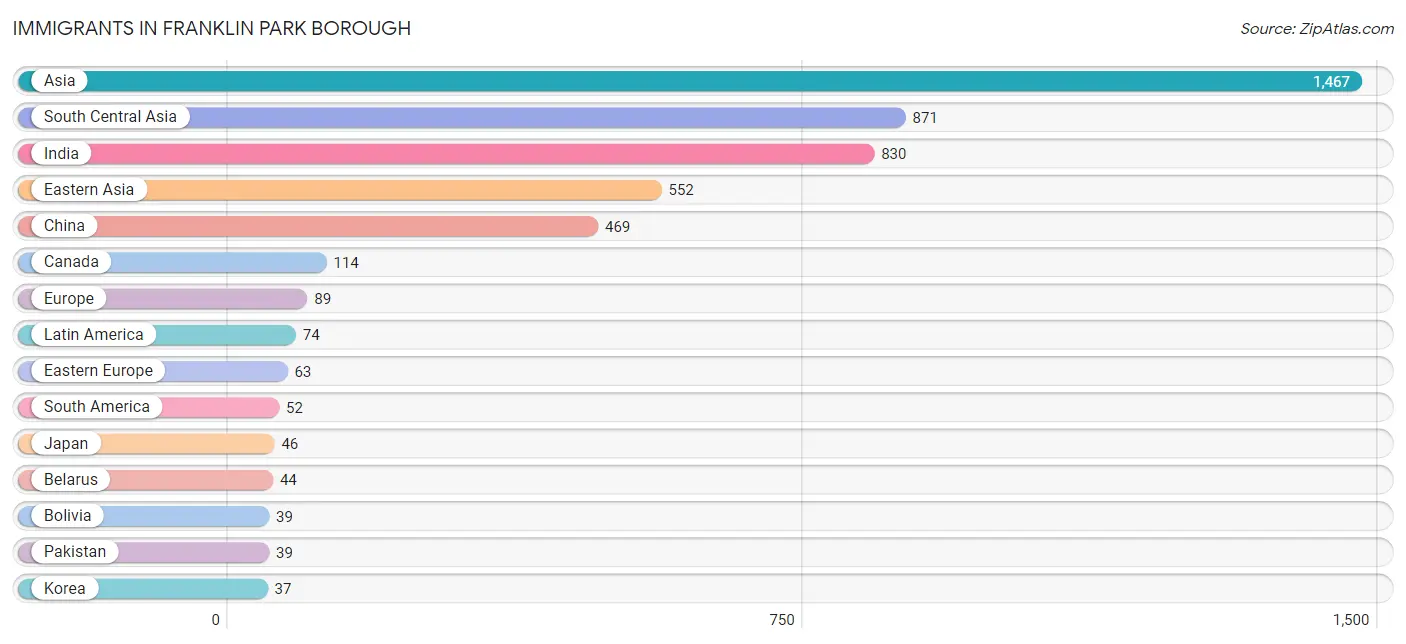
Immigrants in Franklin Park borough
The most numerous immigrant groups reported in Franklin Park borough came from Asia (1,467 | 9.6%), South Central Asia (871 | 5.7%), India (830 | 5.4%), Eastern Asia (552 | 3.6%), and China (469 | 3.1%), together accounting for 27.4% of all Franklin Park borough residents.
| Immigration Origin | # Population | % Population |
| Africa | 17 | 0.1% |
| Asia | 1,467 | 9.6% |
| Australia | 21 | 0.1% |
| Belarus | 44 | 0.3% |
| Bolivia | 39 | 0.3% |
| Bulgaria | 19 | 0.1% |
| Canada | 114 | 0.7% |
| Central America | 22 | 0.1% |
| China | 469 | 3.1% |
| Eastern Asia | 552 | 3.6% |
| Eastern Europe | 63 | 0.4% |
| Europe | 89 | 0.6% |
| Germany | 6 | 0.0% |
| India | 830 | 5.4% |
| Ireland | 20 | 0.1% |
| Japan | 46 | 0.3% |
| Korea | 37 | 0.2% |
| Latin America | 74 | 0.5% |
| Mexico | 22 | 0.1% |
| Northern Europe | 20 | 0.1% |
| Oceania | 21 | 0.1% |
| Pakistan | 39 | 0.3% |
| Peru | 13 | 0.1% |
| Philippines | 14 | 0.1% |
| South Africa | 17 | 0.1% |
| South America | 52 | 0.3% |
| South Central Asia | 871 | 5.7% |
| South Eastern Asia | 36 | 0.2% |
| Sri Lanka | 2 | 0.0% |
| Taiwan | 14 | 0.1% |
| Thailand | 14 | 0.1% |
| Vietnam | 8 | 0.1% |
| Western Asia | 8 | 0.1% |
| Western Europe | 6 | 0.0% | View All 34 Rows |
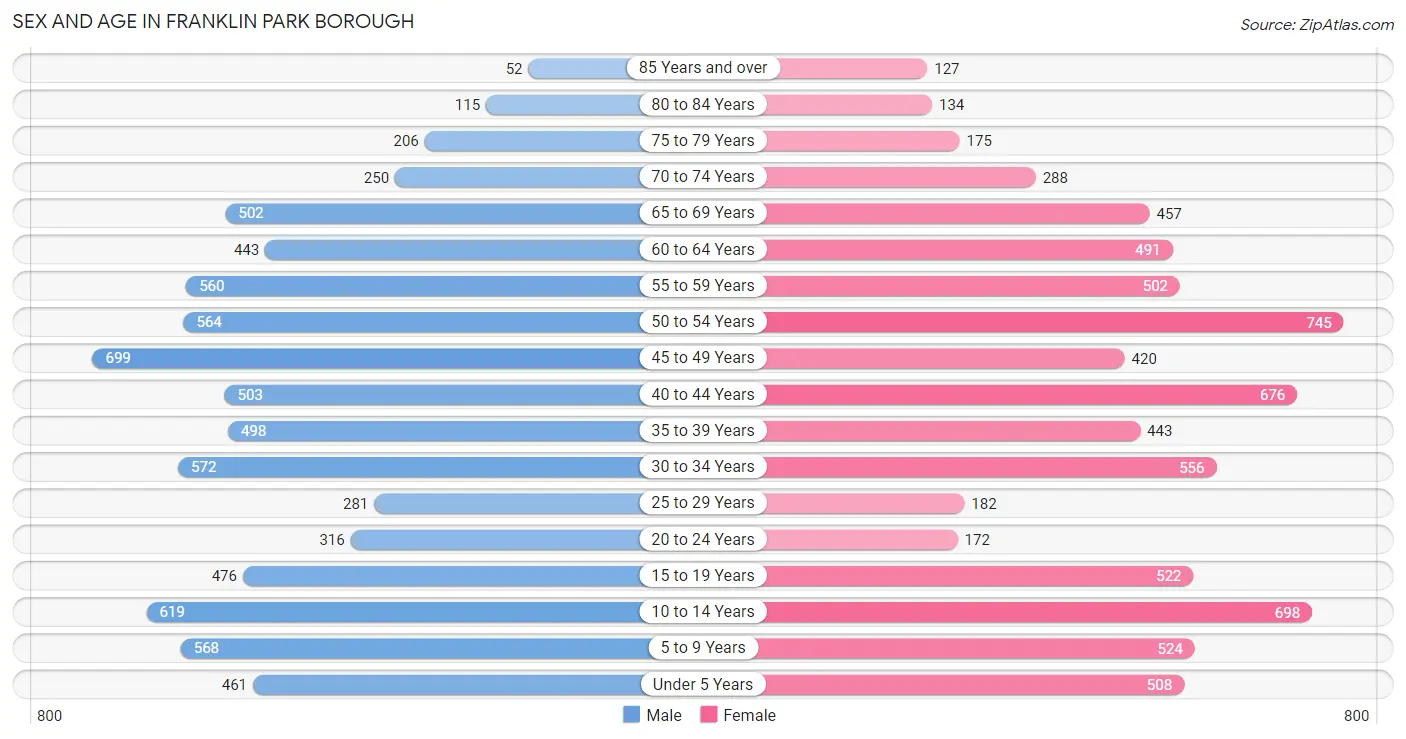
Sex and Age in Franklin Park borough
Sex and Age in Franklin Park borough
The most populous age groups in Franklin Park borough are 45 to 49 Years (699 | 9.1%) for men and 50 to 54 Years (745 | 9.8%) for women.
| Age Bracket | Male | Female |
| Under 5 Years | 461 (6.0%) | 508 (6.7%) |
| 5 to 9 Years | 568 (7.4%) | 524 (6.9%) |
| 10 to 14 Years | 619 (8.1%) | 698 (9.2%) |
| 15 to 19 Years | 476 (6.2%) | 522 (6.9%) |
| 20 to 24 Years | 316 (4.1%) | 172 (2.3%) |
| 25 to 29 Years | 281 (3.7%) | 182 (2.4%) |
| 30 to 34 Years | 572 (7.4%) | 556 (7.3%) |
| 35 to 39 Years | 498 (6.5%) | 443 (5.8%) |
| 40 to 44 Years | 503 (6.6%) | 676 (8.9%) |
| 45 to 49 Years | 699 (9.1%) | 420 (5.5%) |
| 50 to 54 Years | 564 (7.3%) | 745 (9.8%) |
| 55 to 59 Years | 560 (7.3%) | 502 (6.6%) |
| 60 to 64 Years | 443 (5.8%) | 491 (6.4%) |
| 65 to 69 Years | 502 (6.5%) | 457 (6.0%) |
| 70 to 74 Years | 250 (3.3%) | 288 (3.8%) |
| 75 to 79 Years | 206 (2.7%) | 175 (2.3%) |
| 80 to 84 Years | 115 (1.5%) | 134 (1.8%) |
| 85 Years and over | 52 (0.7%) | 127 (1.7%) |
| Total | 7,685 (100.0%) | 7,620 (100.0%) |
Families and Households in Franklin Park borough
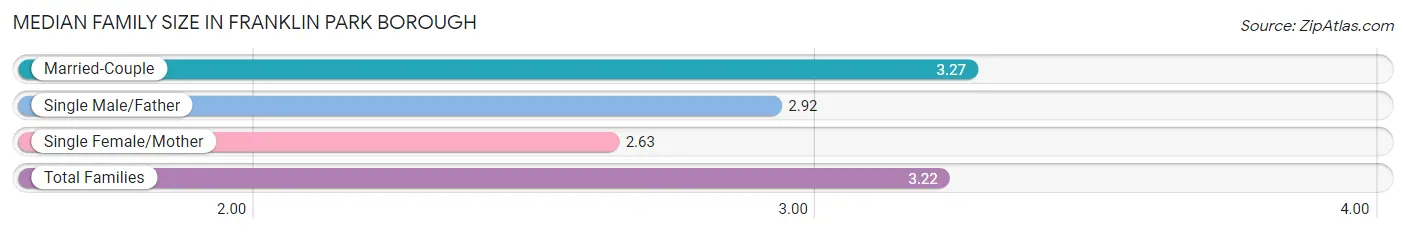
Median Family Size in Franklin Park borough
The median family size in Franklin Park borough is 3.22 persons per family, with married-couple families (4,013 | 92.5%) accounting for the largest median family size of 3.27 persons per family. On the other hand, single female/mother families (287 | 6.6%) represent the smallest median family size with 2.63 persons per family.
| Family Type | # Families | Family Size |
| Married-Couple | 4,013 (92.5%) | 3.27 |
| Single Male/Father | 36 (0.8%) | 2.92 |
| Single Female/Mother | 287 (6.6%) | 2.63 |
| Total Families | 4,336 (100.0%) | 3.22 |
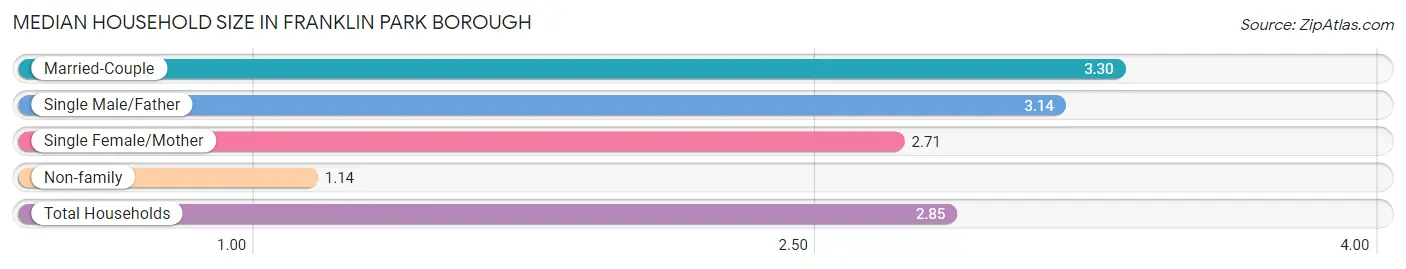
Median Household Size in Franklin Park borough
The median household size in Franklin Park borough is 2.85 persons per household, with married-couple households (4,013 | 74.9%) accounting for the largest median household size of 3.3 persons per household. non-family households (1,022 | 19.1%) represent the smallest median household size with 1.14 persons per household.
| Household Type | # Households | Household Size |
| Married-Couple | 4,013 (74.9%) | 3.30 |
| Single Male/Father | 36 (0.7%) | 3.14 |
| Single Female/Mother | 287 (5.4%) | 2.71 |
| Non-family | 1,022 (19.1%) | 1.14 |
| Total Households | 5,358 (100.0%) | 2.85 |
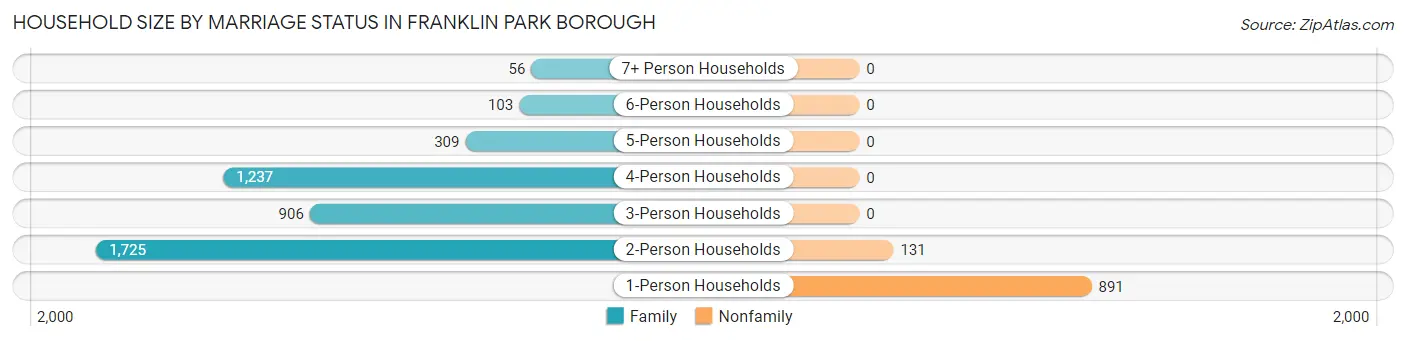
Household Size by Marriage Status in Franklin Park borough
Out of a total of 5,358 households in Franklin Park borough, 4,336 (80.9%) are family households, while 1,022 (19.1%) are nonfamily households. The most numerous type of family households are 2-person households, comprising 1,725, and the most common type of nonfamily households are 1-person households, comprising 891.
| Household Size | Family Households | Nonfamily Households |
| 1-Person Households | - | 891 (16.6%) |
| 2-Person Households | 1,725 (32.2%) | 131 (2.4%) |
| 3-Person Households | 906 (16.9%) | 0 (0.0%) |
| 4-Person Households | 1,237 (23.1%) | 0 (0.0%) |
| 5-Person Households | 309 (5.8%) | 0 (0.0%) |
| 6-Person Households | 103 (1.9%) | 0 (0.0%) |
| 7+ Person Households | 56 (1.1%) | 0 (0.0%) |
| Total | 4,336 (80.9%) | 1,022 (19.1%) |
Female Fertility in Franklin Park borough
Fertility by Age in Franklin Park borough
Average fertility rate in Franklin Park borough is 49.0 births per 1,000 women. Women in the age bracket of 20 to 34 years have the highest fertility rate with 123.0 births per 1,000 women. Women in the age bracket of 20 to 34 years acount for 73.7% of all women with births.
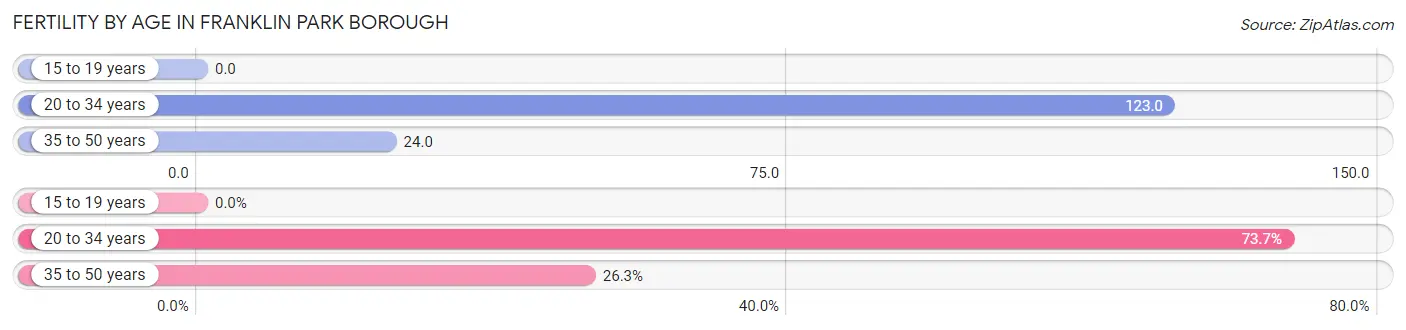
| Age Bracket | Women with Births | Births / 1,000 Women |
| 15 to 19 years | 0 (0.0%) | 0.0 |
| 20 to 34 years | 112 (73.7%) | 123.0 |
| 35 to 50 years | 40 (26.3%) | 24.0 |
| Total | 152 (100.0%) | 49.0 |
Fertility by Age by Marriage Status in Franklin Park borough
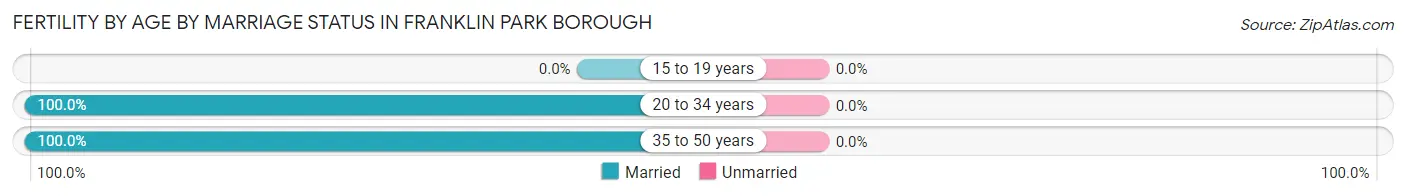
| Age Bracket | Married | Unmarried |
| 15 to 19 years | 0 (0.0%) | 0 (0.0%) |
| 20 to 34 years | 112 (100.0%) | 0 (0.0%) |
| 35 to 50 years | 40 (100.0%) | 0 (0.0%) |
| Total | 152 (100.0%) | 0 (0.0%) |
Fertility by Education in Franklin Park borough
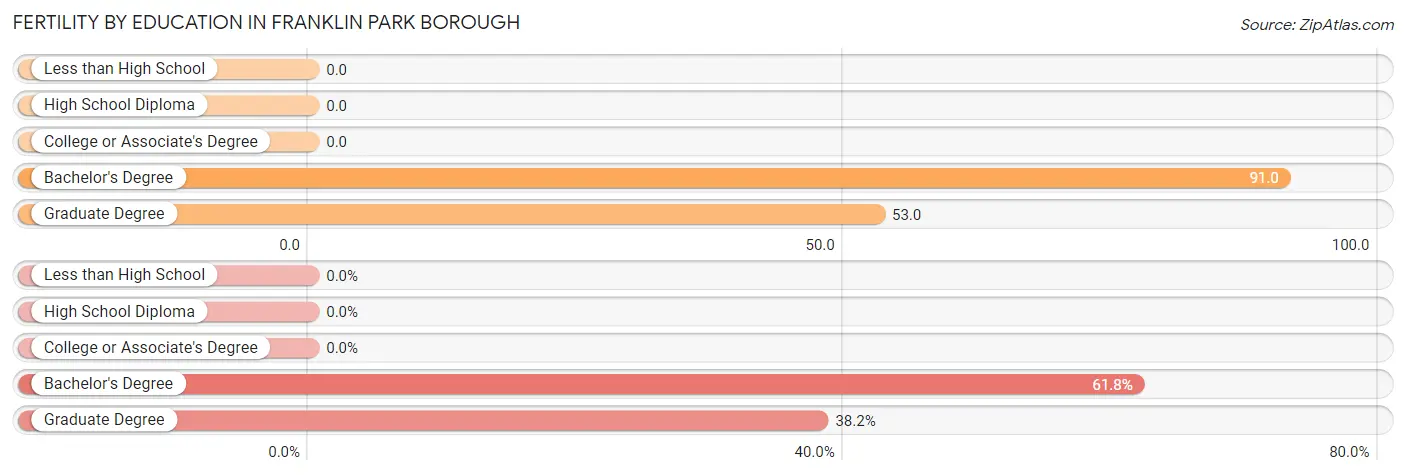
| Educational Attainment | Women with Births | Births / 1,000 Women |
| Less than High School | 0 (0.0%) | 0.0 |
| High School Diploma | 0 (0.0%) | 0.0 |
| College or Associate's Degree | 0 (0.0%) | 0.0 |
| Bachelor's Degree | 94 (61.8%) | 91.0 |
| Graduate Degree | 58 (38.2%) | 53.0 |
| Total | 152 (100.0%) | 49.0 |
Fertility by Education by Marriage Status in Franklin Park borough
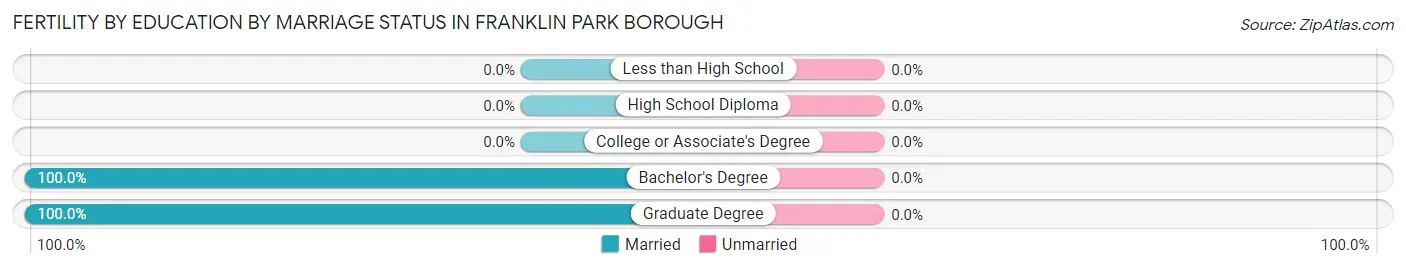
| Educational Attainment | Married | Unmarried |
| Less than High School | 0 (0.0%) | 0 (0.0%) |
| High School Diploma | 0 (0.0%) | 0 (0.0%) |
| College or Associate's Degree | 0 (0.0%) | 0 (0.0%) |
| Bachelor's Degree | 94 (100.0%) | 0 (0.0%) |
| Graduate Degree | 58 (100.0%) | 0 (0.0%) |
| Total | 152 (100.0%) | 0 (0.0%) |
Employment Characteristics in Franklin Park borough
Employment by Class of Employer in Franklin Park borough
Among the 7,948 employed individuals in Franklin Park borough, private company employees (4,870 | 61.3%), not-for-profit organizations (1,513 | 19.0%), and self-employed (incorporated) (440 | 5.5%) make up the most common classes of employment.
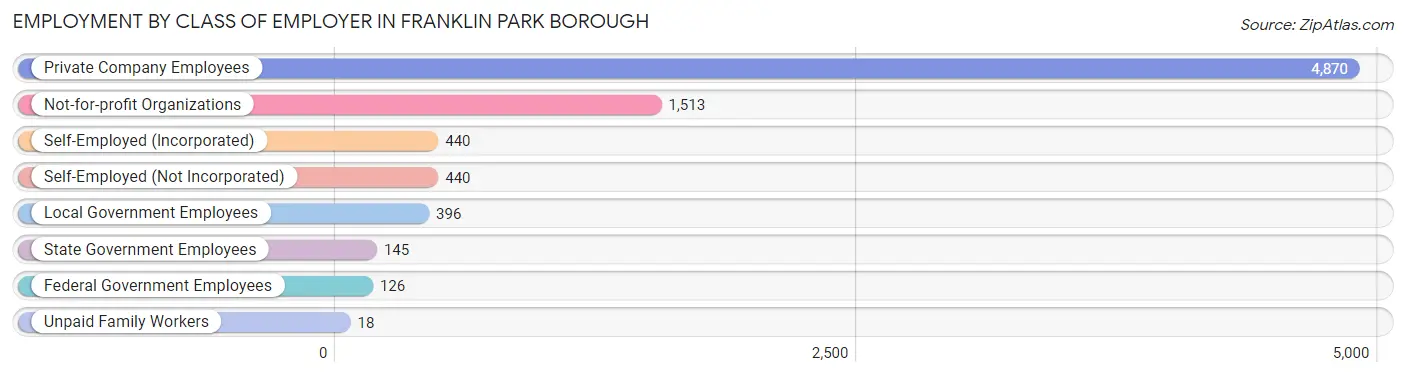
| Employer Class | # Employees | % Employees |
| Private Company Employees | 4,870 | 61.3% |
| Self-Employed (Incorporated) | 440 | 5.5% |
| Self-Employed (Not Incorporated) | 440 | 5.5% |
| Not-for-profit Organizations | 1,513 | 19.0% |
| Local Government Employees | 396 | 5.0% |
| State Government Employees | 145 | 1.8% |
| Federal Government Employees | 126 | 1.6% |
| Unpaid Family Workers | 18 | 0.2% |
| Total | 7,948 | 100.0% |
Employment Status by Age in Franklin Park borough
According to the labor force statistics for Franklin Park borough, out of the total population over 16 years of age (11,674), 71.3% or 8,324 individuals are in the labor force, with 4.3% or 358 of them unemployed. The age group with the highest labor force participation rate is 30 to 34 years, with 95.1% or 1,073 individuals in the labor force. Within the labor force, the 30 to 34 years age range has the highest percentage of unemployed individuals, with 14.5% or 156 of them being unemployed.
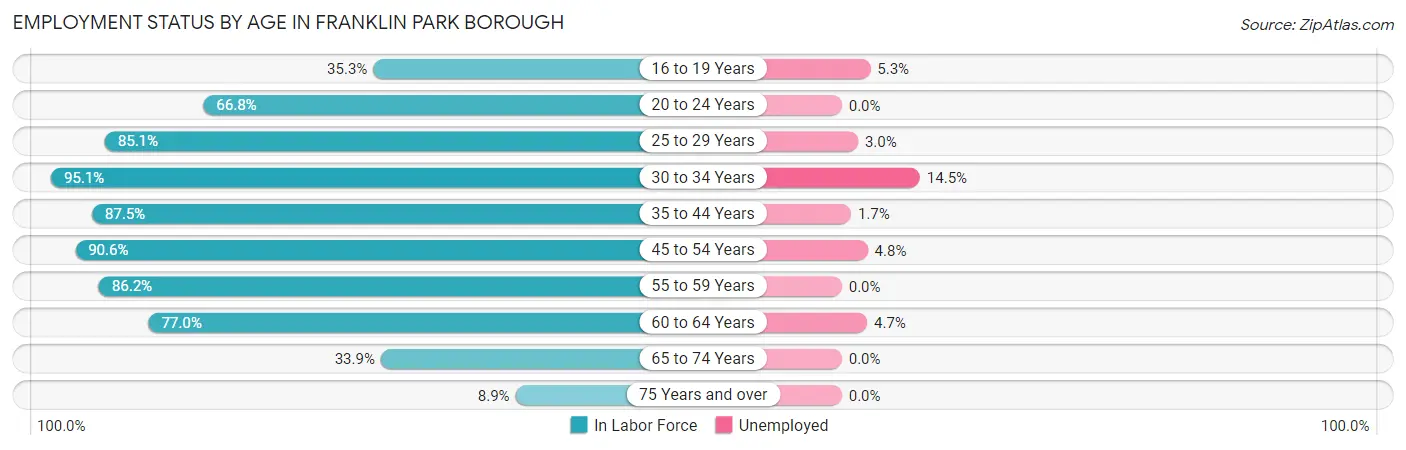
| Age Bracket | In Labor Force | Unemployed |
| 16 to 19 Years | 263 (35.3%) | 14 (5.3%) |
| 20 to 24 Years | 326 (66.8%) | 0 (0.0%) |
| 25 to 29 Years | 394 (85.1%) | 12 (3.0%) |
| 30 to 34 Years | 1,073 (95.1%) | 156 (14.5%) |
| 35 to 44 Years | 1,855 (87.5%) | 32 (1.7%) |
| 45 to 54 Years | 2,200 (90.6%) | 106 (4.8%) |
| 55 to 59 Years | 915 (86.2%) | 0 (0.0%) |
| 60 to 64 Years | 719 (77.0%) | 34 (4.7%) |
| 65 to 74 Years | 507 (33.9%) | 0 (0.0%) |
| 75 Years and over | 72 (8.9%) | 0 (0.0%) |
| Total | 8,324 (71.3%) | 358 (4.3%) |
Employment Status by Educational Attainment in Franklin Park borough
According to labor force statistics for Franklin Park borough, 88.0% of individuals (7,159) out of the total population between 25 and 64 years of age (8,135) are in the labor force, with 4.8% or 344 of them being unemployed. The group with the highest labor force participation rate are those with the educational attainment of less than high school, with 100.0% or 26 individuals in the labor force. Within the labor force, individuals with college / associate degree education have the highest percentage of unemployment, with 11.5% or 132 of them being unemployed.
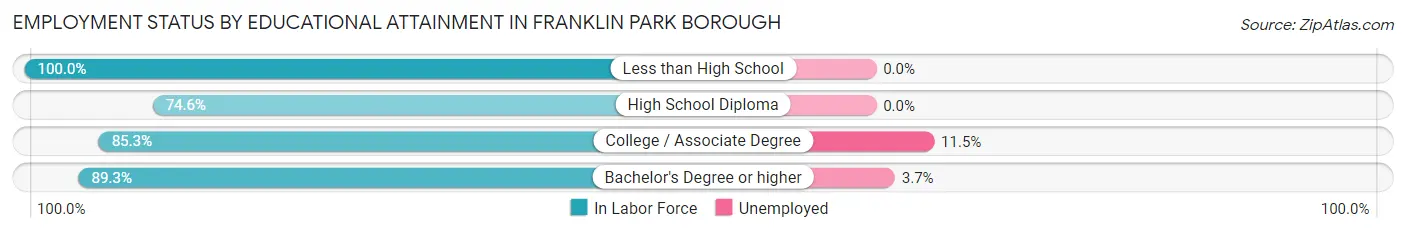
| Educational Attainment | In Labor Force | Unemployed |
| Less than High School | 26 (100.0%) | 0 (0.0%) |
| High School Diploma | 282 (74.6%) | 0 (0.0%) |
| College / Associate Degree | 1,146 (85.3%) | 155 (11.5%) |
| Bachelor's Degree or higher | 5,704 (89.3%) | 236 (3.7%) |
| Total | 7,159 (88.0%) | 390 (4.8%) |
Employment Occupations by Sex in Franklin Park borough
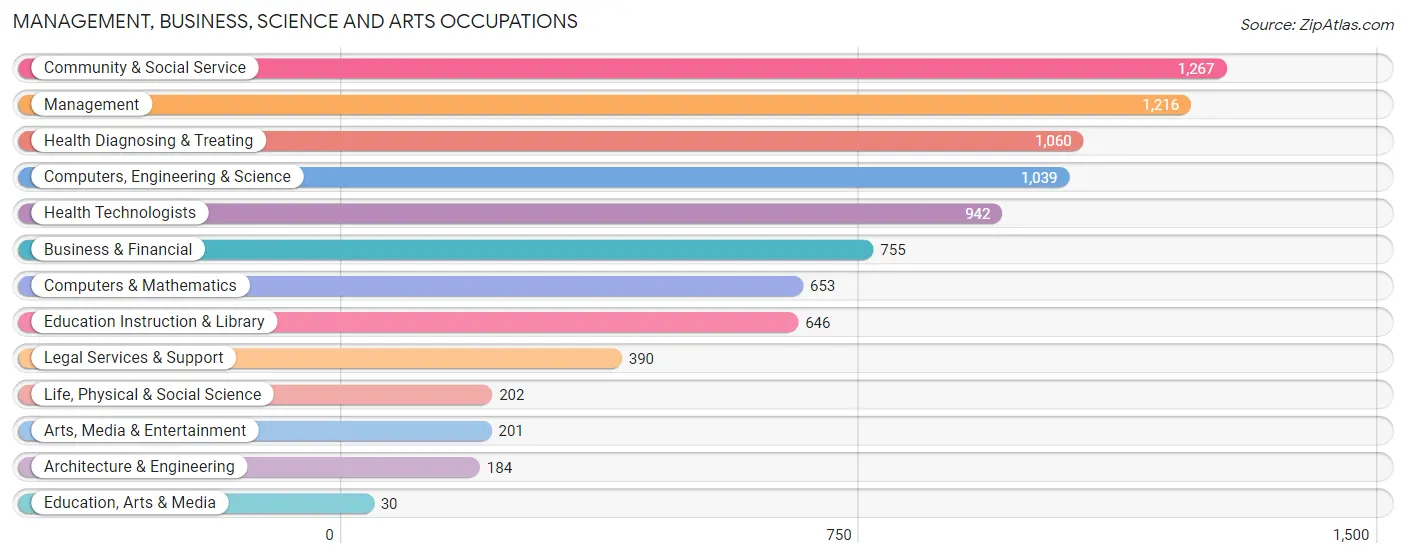
Management, Business, Science and Arts Occupations
The most common Management, Business, Science and Arts occupations in Franklin Park borough are Community & Social Service (1,267 | 15.9%), Management (1,216 | 15.3%), Health Diagnosing & Treating (1,060 | 13.3%), Computers, Engineering & Science (1,039 | 13.1%), and Health Technologists (942 | 11.8%).
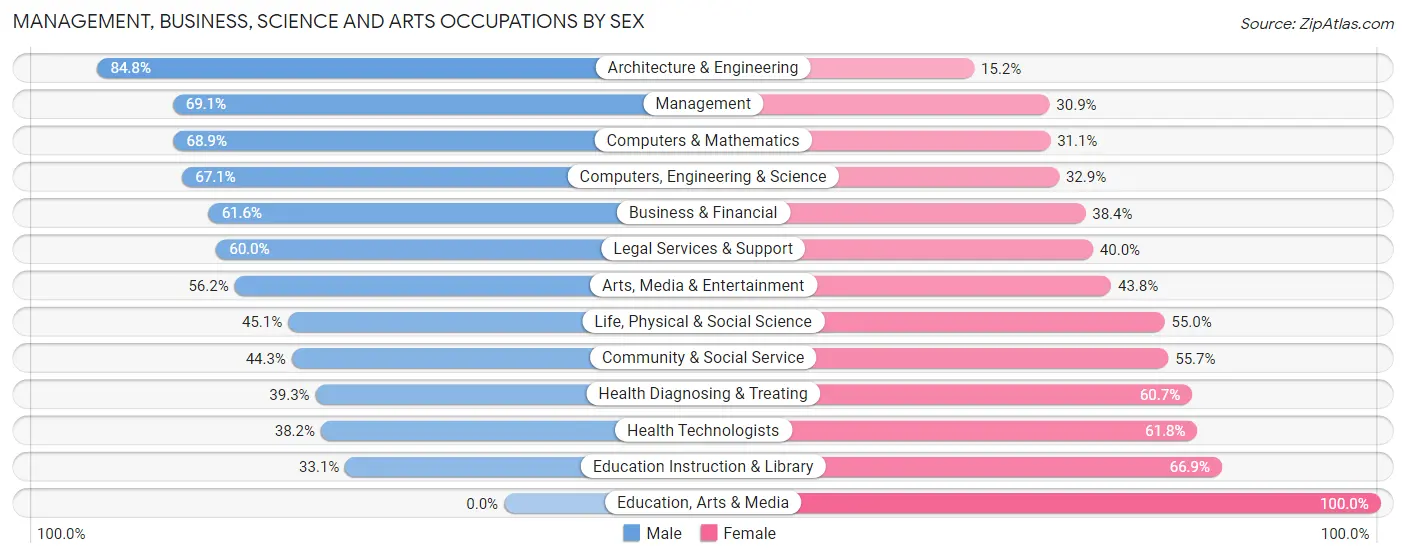
Management, Business, Science and Arts Occupations by Sex
Within the Management, Business, Science and Arts occupations in Franklin Park borough, the most male-oriented occupations are Architecture & Engineering (84.8%), Management (69.1%), and Computers & Mathematics (68.9%), while the most female-oriented occupations are Education, Arts & Media (100.0%), Education Instruction & Library (66.9%), and Health Technologists (61.8%).
| Occupation | Male | Female |
| Management | 840 (69.1%) | 376 (30.9%) |
| Business & Financial | 465 (61.6%) | 290 (38.4%) |
| Computers, Engineering & Science | 697 (67.1%) | 342 (32.9%) |
| Computers & Mathematics | 450 (68.9%) | 203 (31.1%) |
| Architecture & Engineering | 156 (84.8%) | 28 (15.2%) |
| Life, Physical & Social Science | 91 (45.1%) | 111 (54.9%) |
| Community & Social Service | 561 (44.3%) | 706 (55.7%) |
| Education, Arts & Media | 0 (0.0%) | 30 (100.0%) |
| Legal Services & Support | 234 (60.0%) | 156 (40.0%) |
| Education Instruction & Library | 214 (33.1%) | 432 (66.9%) |
| Arts, Media & Entertainment | 113 (56.2%) | 88 (43.8%) |
| Health Diagnosing & Treating | 417 (39.3%) | 643 (60.7%) |
| Health Technologists | 360 (38.2%) | 582 (61.8%) |
| Total (Category) | 2,980 (55.8%) | 2,357 (44.2%) |
| Total (Overall) | 4,447 (55.8%) | 3,517 (44.2%) |
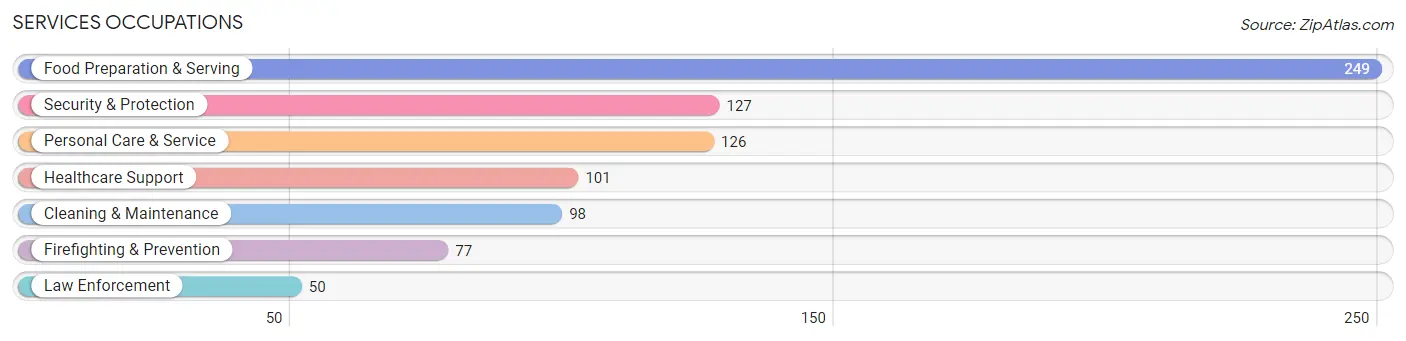
Services Occupations
The most common Services occupations in Franklin Park borough are Food Preparation & Serving (249 | 3.1%), Security & Protection (127 | 1.6%), Personal Care & Service (126 | 1.6%), Healthcare Support (101 | 1.3%), and Cleaning & Maintenance (98 | 1.2%).
Services Occupations by Sex
Within the Services occupations in Franklin Park borough, the most male-oriented occupations are Cleaning & Maintenance (92.9%), Law Enforcement (76.0%), and Security & Protection (64.6%), while the most female-oriented occupations are Personal Care & Service (78.6%), Healthcare Support (66.3%), and Firefighting & Prevention (42.9%).
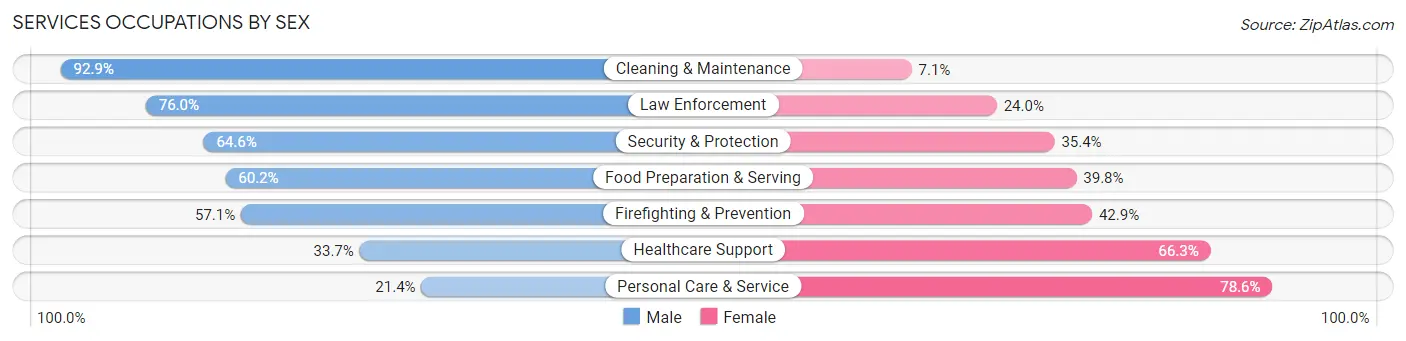
| Occupation | Male | Female |
| Healthcare Support | 34 (33.7%) | 67 (66.3%) |
| Security & Protection | 82 (64.6%) | 45 (35.4%) |
| Firefighting & Prevention | 44 (57.1%) | 33 (42.9%) |
| Law Enforcement | 38 (76.0%) | 12 (24.0%) |
| Food Preparation & Serving | 150 (60.2%) | 99 (39.8%) |
| Cleaning & Maintenance | 91 (92.9%) | 7 (7.1%) |
| Personal Care & Service | 27 (21.4%) | 99 (78.6%) |
| Total (Category) | 384 (54.8%) | 317 (45.2%) |
| Total (Overall) | 4,447 (55.8%) | 3,517 (44.2%) |
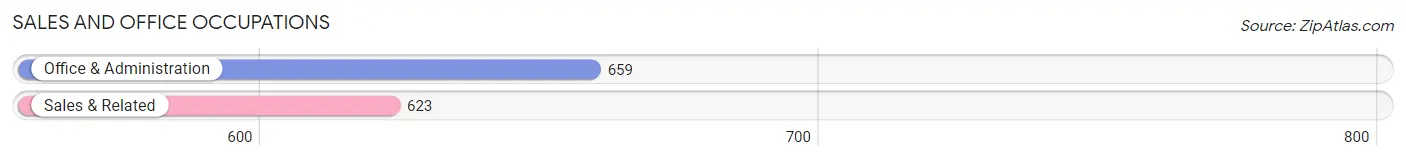
Sales and Office Occupations
The most common Sales and Office occupations in Franklin Park borough are Office & Administration (659 | 8.3%), and Sales & Related (623 | 7.8%).
Sales and Office Occupations by Sex
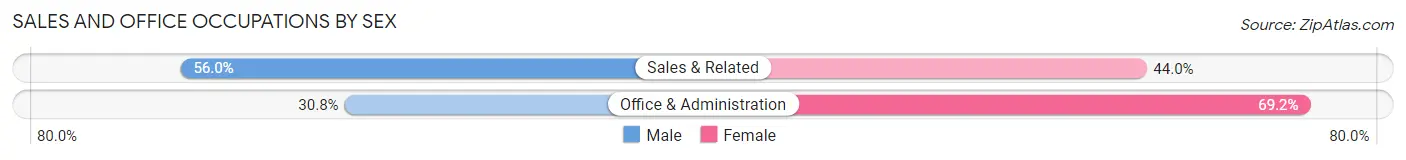
| Occupation | Male | Female |
| Sales & Related | 349 (56.0%) | 274 (44.0%) |
| Office & Administration | 203 (30.8%) | 456 (69.2%) |
| Total (Category) | 552 (43.1%) | 730 (56.9%) |
| Total (Overall) | 4,447 (55.8%) | 3,517 (44.2%) |
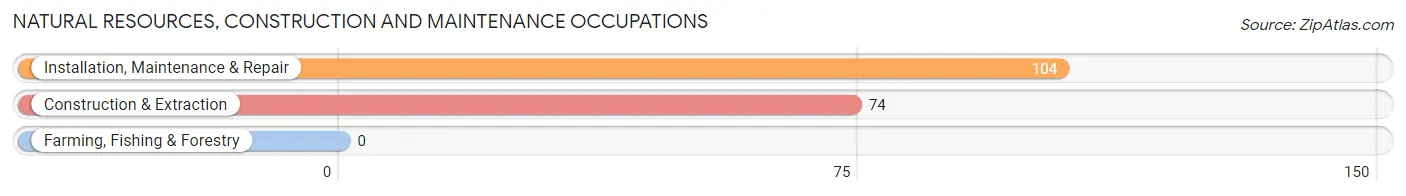
Natural Resources, Construction and Maintenance Occupations
The most common Natural Resources, Construction and Maintenance occupations in Franklin Park borough are Installation, Maintenance & Repair (104 | 1.3%), and Construction & Extraction (74 | 0.9%).
Natural Resources, Construction and Maintenance Occupations by Sex
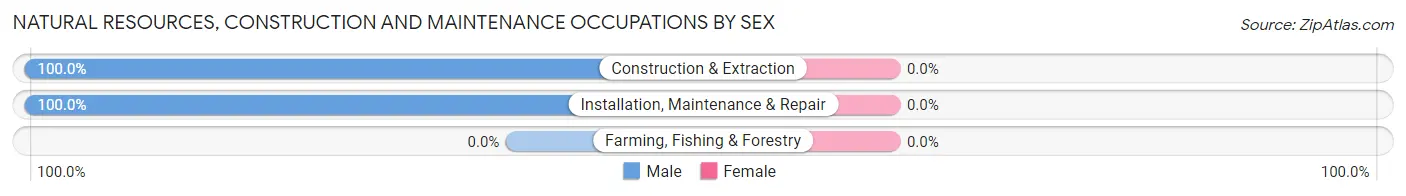
| Occupation | Male | Female |
| Farming, Fishing & Forestry | 0 (0.0%) | 0 (0.0%) |
| Construction & Extraction | 74 (100.0%) | 0 (0.0%) |
| Installation, Maintenance & Repair | 104 (100.0%) | 0 (0.0%) |
| Total (Category) | 178 (100.0%) | 0 (0.0%) |
| Total (Overall) | 4,447 (55.8%) | 3,517 (44.2%) |
Production, Transportation and Moving Occupations
The most common Production, Transportation and Moving occupations in Franklin Park borough are Production (216 | 2.7%), Material Moving (132 | 1.7%), and Transportation (118 | 1.5%).
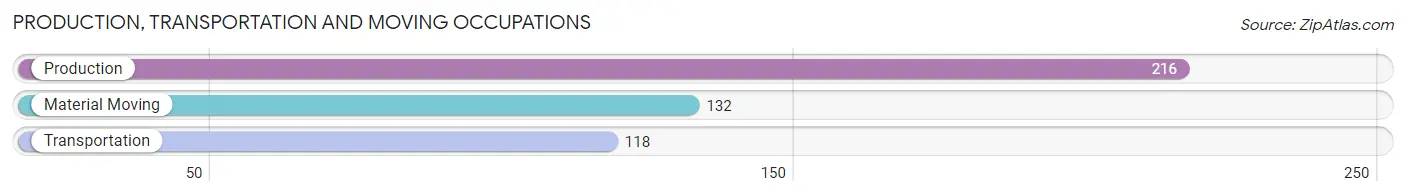
Production, Transportation and Moving Occupations by Sex
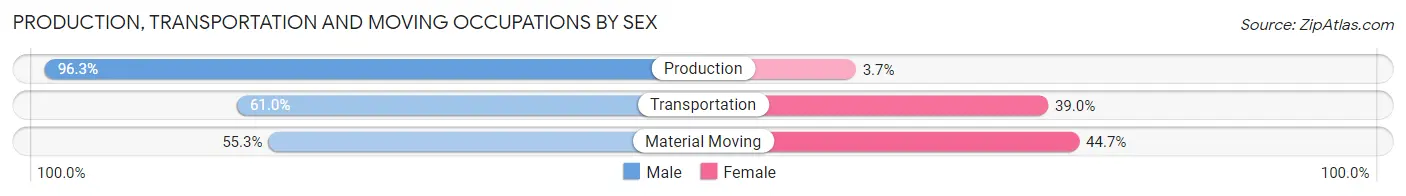
| Occupation | Male | Female |
| Production | 208 (96.3%) | 8 (3.7%) |
| Transportation | 72 (61.0%) | 46 (39.0%) |
| Material Moving | 73 (55.3%) | 59 (44.7%) |
| Total (Category) | 353 (75.7%) | 113 (24.2%) |
| Total (Overall) | 4,447 (55.8%) | 3,517 (44.2%) |
Employment Industries by Sex in Franklin Park borough
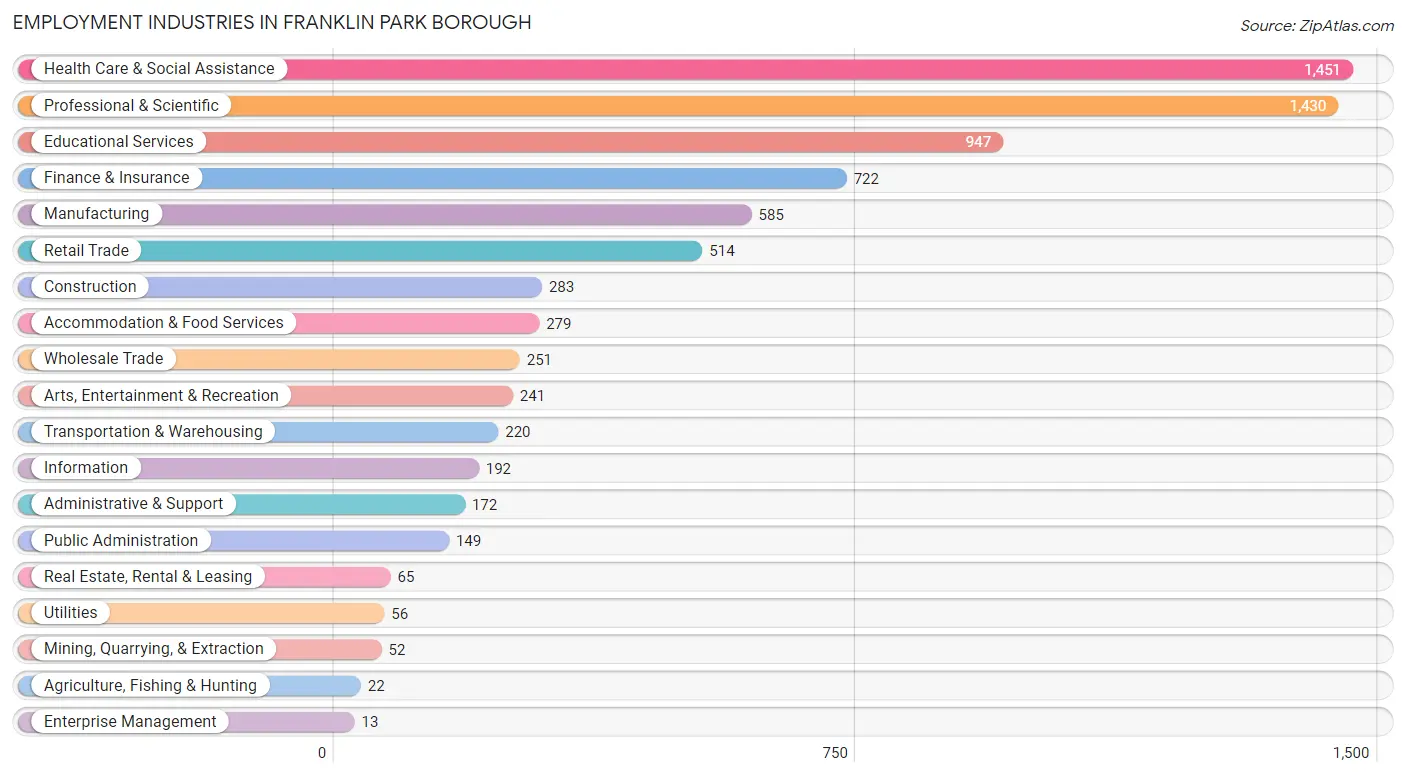
Employment Industries in Franklin Park borough
The major employment industries in Franklin Park borough include Health Care & Social Assistance (1,451 | 18.2%), Professional & Scientific (1,430 | 18.0%), Educational Services (947 | 11.9%), Finance & Insurance (722 | 9.1%), and Manufacturing (585 | 7.3%).
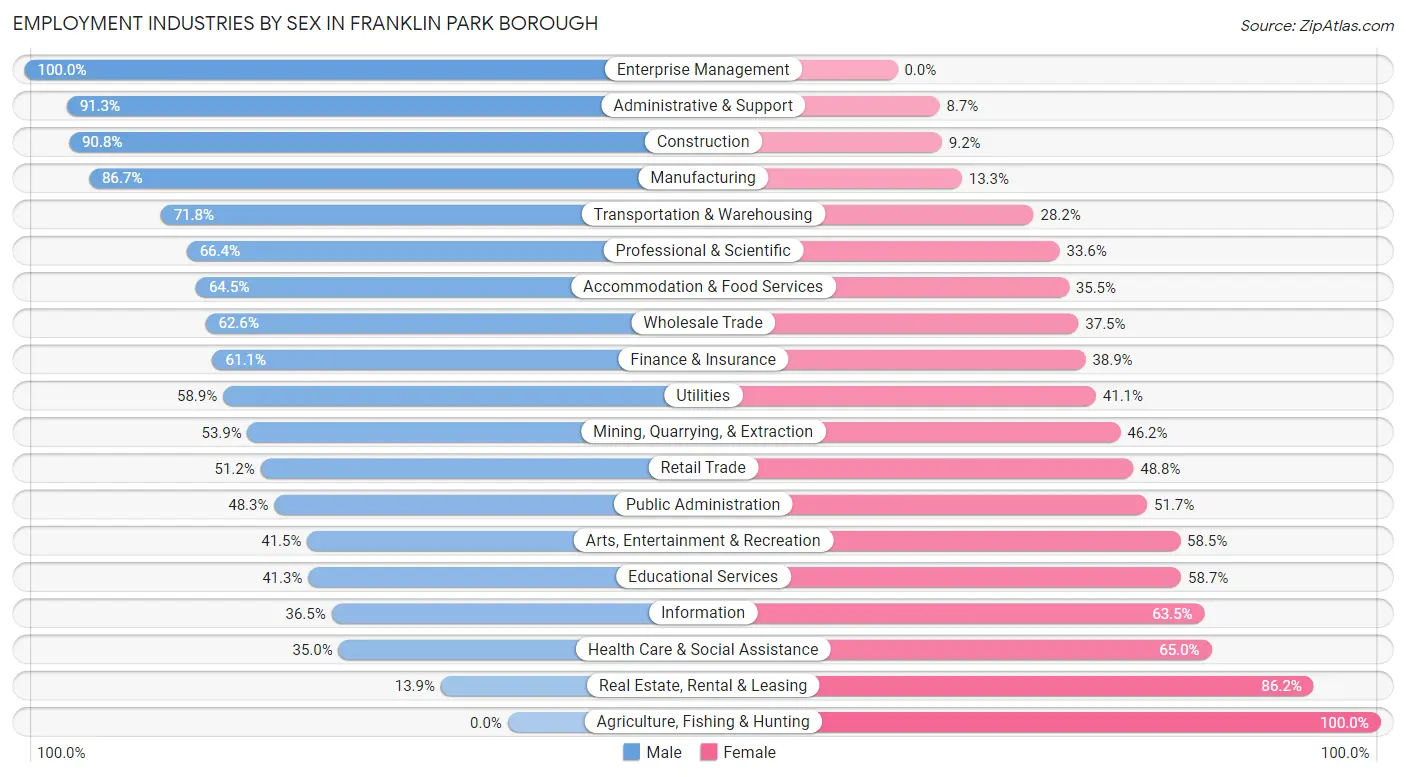
Employment Industries by Sex in Franklin Park borough
The Franklin Park borough industries that see more men than women are Enterprise Management (100.0%), Administrative & Support (91.3%), and Construction (90.8%), whereas the industries that tend to have a higher number of women are Agriculture, Fishing & Hunting (100.0%), Real Estate, Rental & Leasing (86.2%), and Health Care & Social Assistance (65.0%).
| Industry | Male | Female |
| Agriculture, Fishing & Hunting | 0 (0.0%) | 22 (100.0%) |
| Mining, Quarrying, & Extraction | 28 (53.8%) | 24 (46.2%) |
| Construction | 257 (90.8%) | 26 (9.2%) |
| Manufacturing | 507 (86.7%) | 78 (13.3%) |
| Wholesale Trade | 157 (62.5%) | 94 (37.4%) |
| Retail Trade | 263 (51.2%) | 251 (48.8%) |
| Transportation & Warehousing | 158 (71.8%) | 62 (28.2%) |
| Utilities | 33 (58.9%) | 23 (41.1%) |
| Information | 70 (36.5%) | 122 (63.5%) |
| Finance & Insurance | 441 (61.1%) | 281 (38.9%) |
| Real Estate, Rental & Leasing | 9 (13.9%) | 56 (86.2%) |
| Professional & Scientific | 950 (66.4%) | 480 (33.6%) |
| Enterprise Management | 13 (100.0%) | 0 (0.0%) |
| Administrative & Support | 157 (91.3%) | 15 (8.7%) |
| Educational Services | 391 (41.3%) | 556 (58.7%) |
| Health Care & Social Assistance | 508 (35.0%) | 943 (65.0%) |
| Arts, Entertainment & Recreation | 100 (41.5%) | 141 (58.5%) |
| Accommodation & Food Services | 180 (64.5%) | 99 (35.5%) |
| Public Administration | 72 (48.3%) | 77 (51.7%) |
| Total | 4,447 (55.8%) | 3,517 (44.2%) |
Education in Franklin Park borough
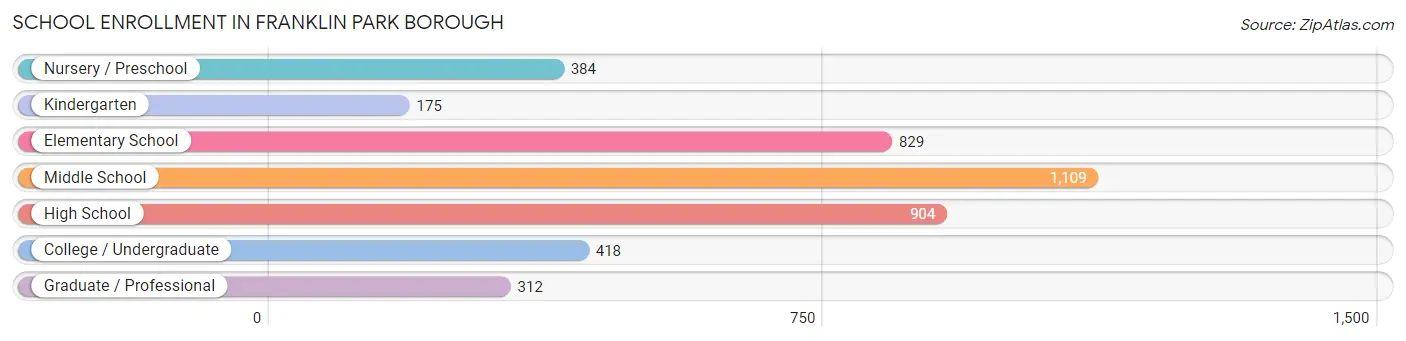
School Enrollment in Franklin Park borough
The most common levels of schooling among the 4,131 students in Franklin Park borough are middle school (1,109 | 26.9%), high school (904 | 21.9%), and elementary school (829 | 20.1%).
| School Level | # Students | % Students |
| Nursery / Preschool | 384 | 9.3% |
| Kindergarten | 175 | 4.2% |
| Elementary School | 829 | 20.1% |
| Middle School | 1,109 | 26.9% |
| High School | 904 | 21.9% |
| College / Undergraduate | 418 | 10.1% |
| Graduate / Professional | 312 | 7.5% |
| Total | 4,131 | 100.0% |
School Enrollment by Age by Funding Source in Franklin Park borough
Out of a total of 4,131 students who are enrolled in schools in Franklin Park borough, 1,153 (27.9%) attend a private institution, while the remaining 2,978 (72.1%) are enrolled in public schools. The age group of 3 to 4 year olds has the highest likelihood of being enrolled in private schools, with 214 (89.9% in the age bracket) enrolled. Conversely, the age group of 10 to 14 year olds has the lowest likelihood of being enrolled in a private school, with 1,169 (92.0% in the age bracket) attending a public institution.
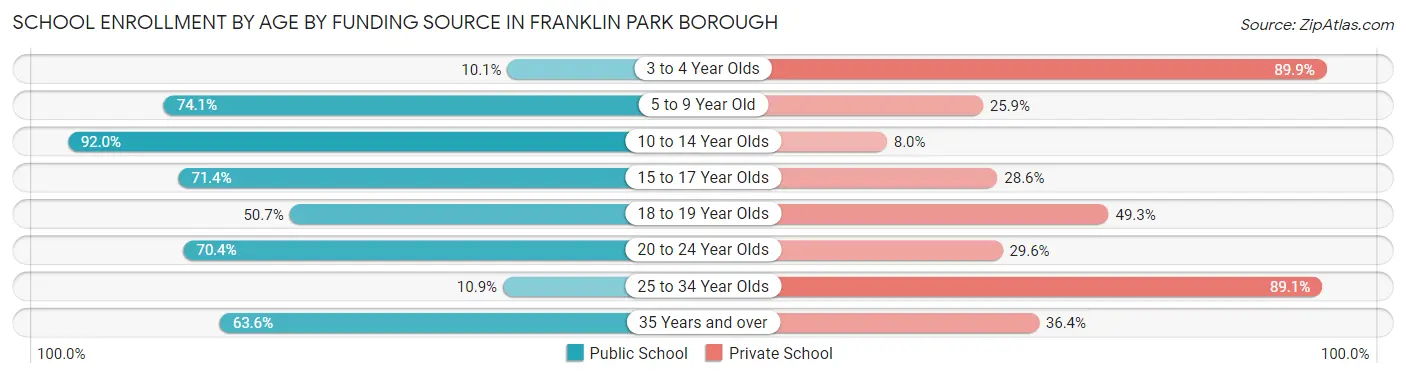
| Age Bracket | Public School | Private School |
| 3 to 4 Year Olds | 24 (10.1%) | 214 (89.9%) |
| 5 to 9 Year Old | 780 (74.1%) | 273 (25.9%) |
| 10 to 14 Year Olds | 1,169 (92.0%) | 102 (8.0%) |
| 15 to 17 Year Olds | 561 (71.4%) | 225 (28.6%) |
| 18 to 19 Year Olds | 77 (50.7%) | 75 (49.3%) |
| 20 to 24 Year Olds | 243 (70.4%) | 102 (29.6%) |
| 25 to 34 Year Olds | 12 (10.9%) | 98 (89.1%) |
| 35 Years and over | 112 (63.6%) | 64 (36.4%) |
| Total | 2,978 (72.1%) | 1,153 (27.9%) |
Educational Attainment by Field of Study in Franklin Park borough
Business (2,031 | 24.5%), engineering (1,076 | 13.0%), science & technology (740 | 8.9%), social sciences (710 | 8.6%), and education (617 | 7.4%) are the most common fields of study among 8,302 individuals in Franklin Park borough who have obtained a bachelor's degree or higher.
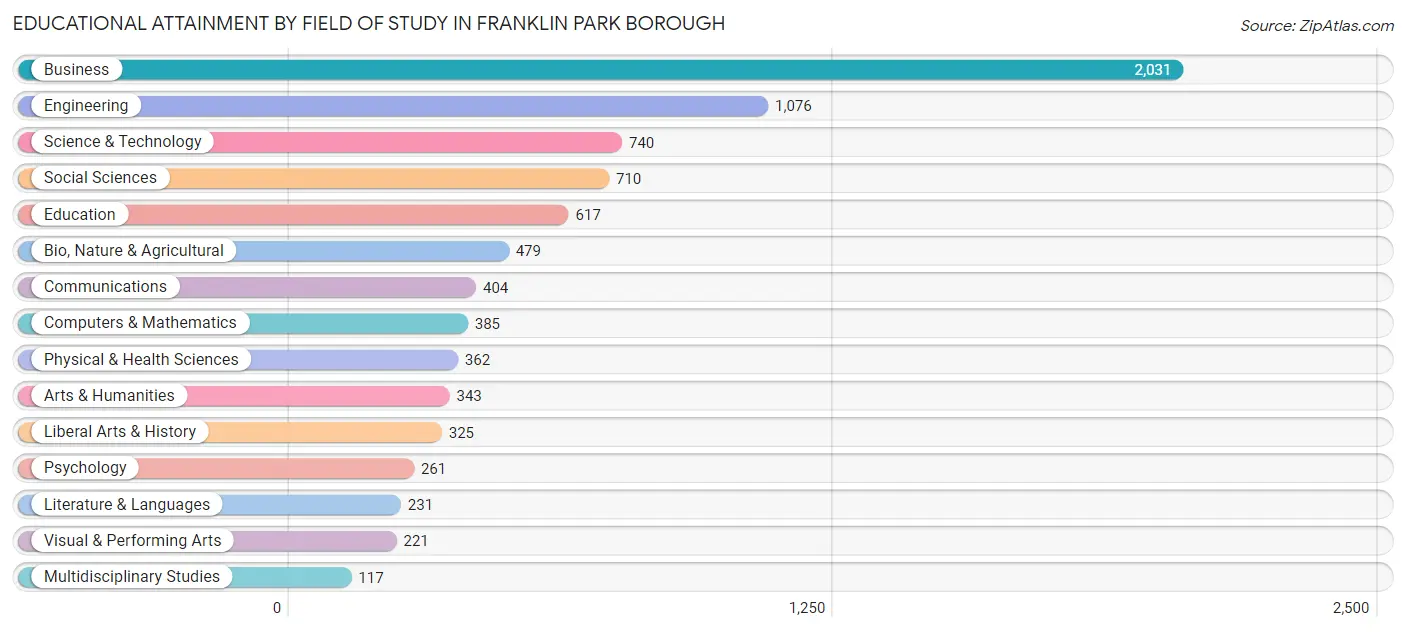
| Field of Study | # Graduates | % Graduates |
| Computers & Mathematics | 385 | 4.6% |
| Bio, Nature & Agricultural | 479 | 5.8% |
| Physical & Health Sciences | 362 | 4.4% |
| Psychology | 261 | 3.1% |
| Social Sciences | 710 | 8.6% |
| Engineering | 1,076 | 13.0% |
| Multidisciplinary Studies | 117 | 1.4% |
| Science & Technology | 740 | 8.9% |
| Business | 2,031 | 24.5% |
| Education | 617 | 7.4% |
| Literature & Languages | 231 | 2.8% |
| Liberal Arts & History | 325 | 3.9% |
| Visual & Performing Arts | 221 | 2.7% |
| Communications | 404 | 4.9% |
| Arts & Humanities | 343 | 4.1% |
| Total | 8,302 | 100.0% |
Transportation & Commute in Franklin Park borough
Vehicle Availability by Sex in Franklin Park borough
The most prevalent vehicle ownership categories in Franklin Park borough are males with 2 vehicles (2,316, accounting for 52.1%) and females with 2 vehicles (1,787, making up 66.1%).
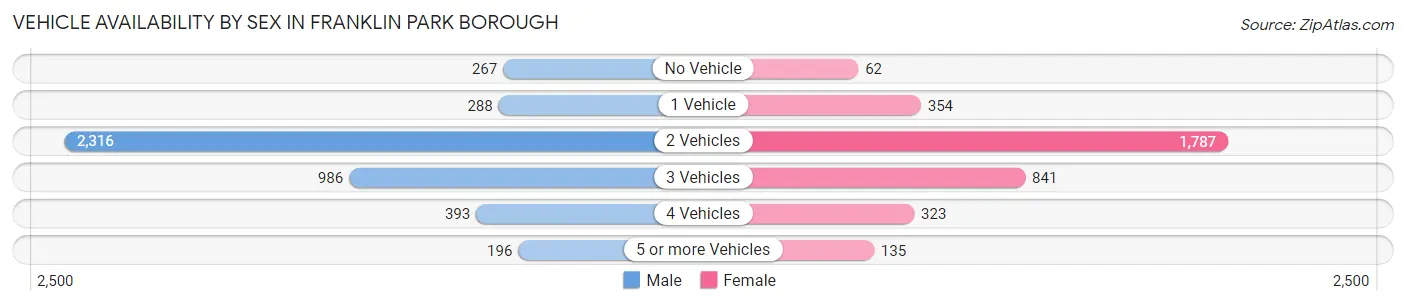
| Vehicles Available | Male | Female |
| No Vehicle | 267 (6.0%) | 62 (1.8%) |
| 1 Vehicle | 288 (6.5%) | 354 (10.1%) |
| 2 Vehicles | 2,316 (52.1%) | 1,787 (51.0%) |
| 3 Vehicles | 986 (22.2%) | 841 (24.0%) |
| 4 Vehicles | 393 (8.8%) | 323 (9.2%) |
| 5 or more Vehicles | 196 (4.4%) | 135 (3.8%) |
| Total | 4,446 (100.0%) | 3,502 (100.0%) |
Commute Time in Franklin Park borough
The most frequently occuring commute durations in Franklin Park borough are 30 to 34 minutes (1,345 commuters, 20.9%), 15 to 19 minutes (1,022 commuters, 15.9%), and 20 to 24 minutes (953 commuters, 14.8%).
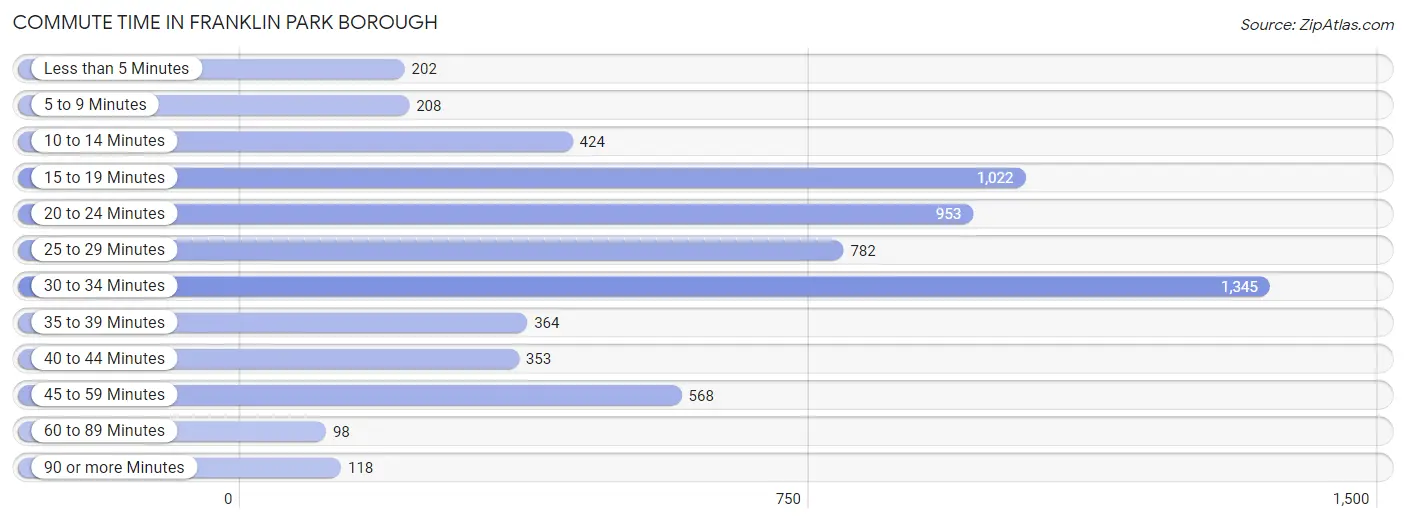
| Commute Time | # Commuters | % Commuters |
| Less than 5 Minutes | 202 | 3.1% |
| 5 to 9 Minutes | 208 | 3.2% |
| 10 to 14 Minutes | 424 | 6.6% |
| 15 to 19 Minutes | 1,022 | 15.9% |
| 20 to 24 Minutes | 953 | 14.8% |
| 25 to 29 Minutes | 782 | 12.1% |
| 30 to 34 Minutes | 1,345 | 20.9% |
| 35 to 39 Minutes | 364 | 5.7% |
| 40 to 44 Minutes | 353 | 5.5% |
| 45 to 59 Minutes | 568 | 8.8% |
| 60 to 89 Minutes | 98 | 1.5% |
| 90 or more Minutes | 118 | 1.8% |
Commute Time by Sex in Franklin Park borough
The most common commute times in Franklin Park borough are 30 to 34 minutes (841 commuters, 22.8%) for males and 30 to 34 minutes (504 commuters, 18.3%) for females.
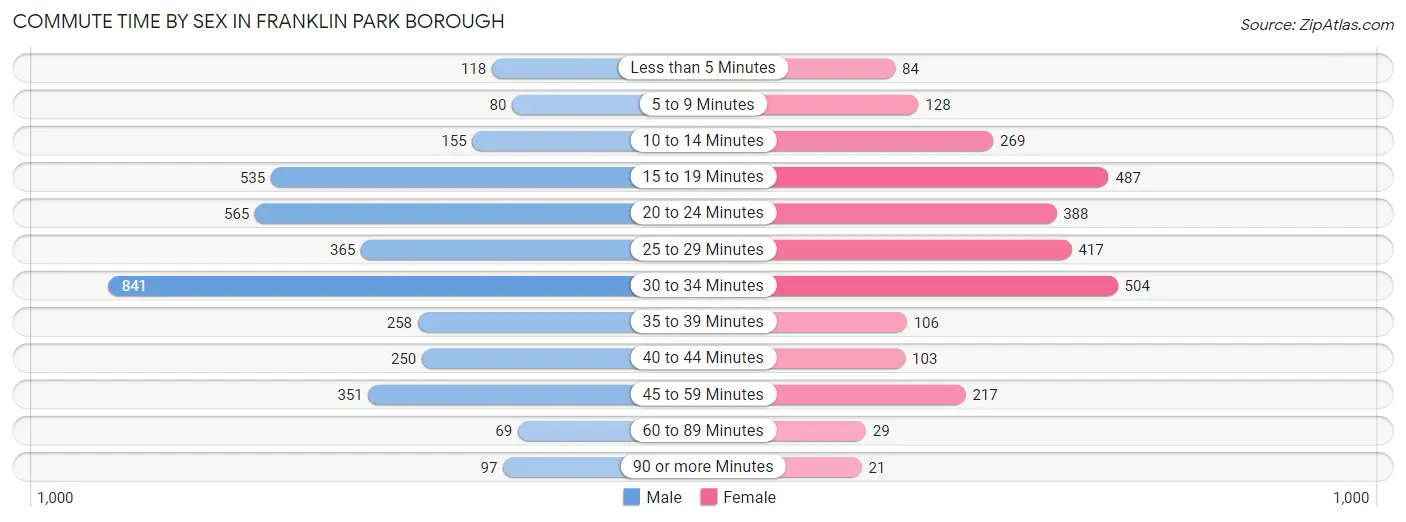
| Commute Time | Male | Female |
| Less than 5 Minutes | 118 (3.2%) | 84 (3.0%) |
| 5 to 9 Minutes | 80 (2.2%) | 128 (4.6%) |
| 10 to 14 Minutes | 155 (4.2%) | 269 (9.8%) |
| 15 to 19 Minutes | 535 (14.5%) | 487 (17.7%) |
| 20 to 24 Minutes | 565 (15.3%) | 388 (14.1%) |
| 25 to 29 Minutes | 365 (9.9%) | 417 (15.1%) |
| 30 to 34 Minutes | 841 (22.8%) | 504 (18.3%) |
| 35 to 39 Minutes | 258 (7.0%) | 106 (3.8%) |
| 40 to 44 Minutes | 250 (6.8%) | 103 (3.7%) |
| 45 to 59 Minutes | 351 (9.5%) | 217 (7.9%) |
| 60 to 89 Minutes | 69 (1.9%) | 29 (1.1%) |
| 90 or more Minutes | 97 (2.6%) | 21 (0.8%) |
Time of Departure to Work by Sex in Franklin Park borough
The most frequent times of departure to work in Franklin Park borough are 6:30 AM to 6:59 AM (613, 16.6%) for males and 7:30 AM to 7:59 AM (403, 14.6%) for females.
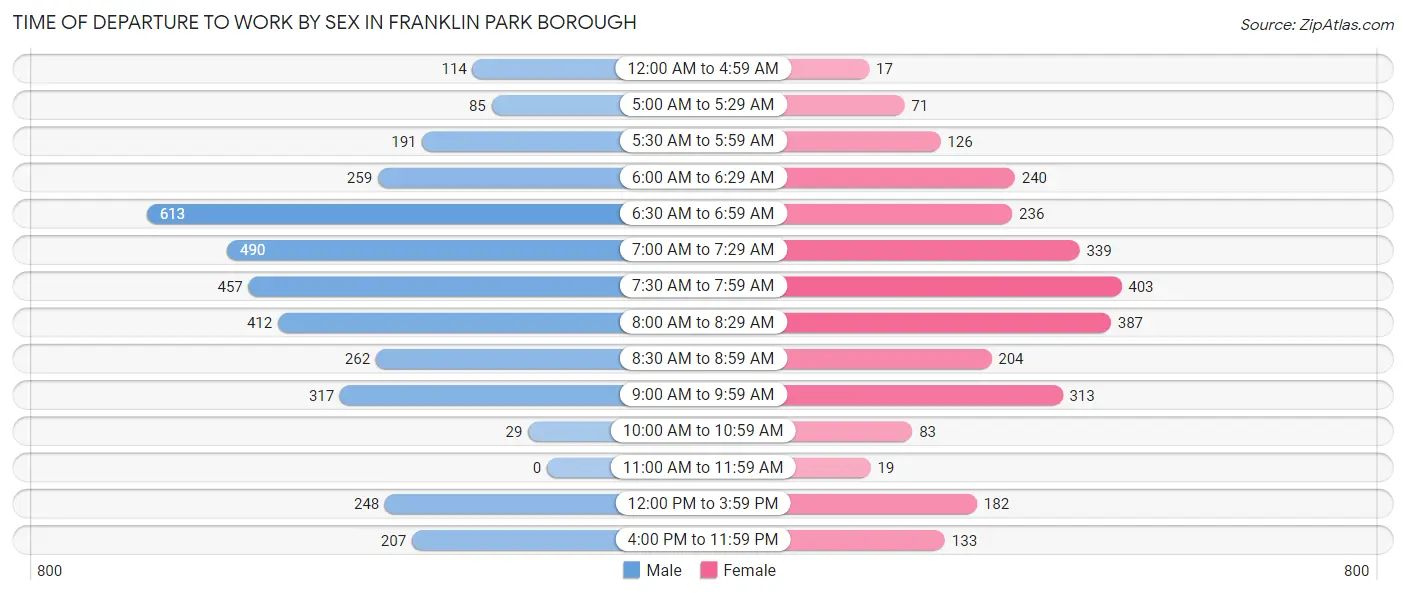
| Time of Departure | Male | Female |
| 12:00 AM to 4:59 AM | 114 (3.1%) | 17 (0.6%) |
| 5:00 AM to 5:29 AM | 85 (2.3%) | 71 (2.6%) |
| 5:30 AM to 5:59 AM | 191 (5.2%) | 126 (4.6%) |
| 6:00 AM to 6:29 AM | 259 (7.0%) | 240 (8.7%) |
| 6:30 AM to 6:59 AM | 613 (16.6%) | 236 (8.6%) |
| 7:00 AM to 7:29 AM | 490 (13.3%) | 339 (12.3%) |
| 7:30 AM to 7:59 AM | 457 (12.4%) | 403 (14.6%) |
| 8:00 AM to 8:29 AM | 412 (11.2%) | 387 (14.1%) |
| 8:30 AM to 8:59 AM | 262 (7.1%) | 204 (7.4%) |
| 9:00 AM to 9:59 AM | 317 (8.6%) | 313 (11.4%) |
| 10:00 AM to 10:59 AM | 29 (0.8%) | 83 (3.0%) |
| 11:00 AM to 11:59 AM | 0 (0.0%) | 19 (0.7%) |
| 12:00 PM to 3:59 PM | 248 (6.7%) | 182 (6.6%) |
| 4:00 PM to 11:59 PM | 207 (5.6%) | 133 (4.8%) |
| Total | 3,684 (100.0%) | 2,753 (100.0%) |
Housing Occupancy in Franklin Park borough
Occupancy by Ownership in Franklin Park borough
Of the total 5,358 dwellings in Franklin Park borough, owner-occupied units account for 4,924 (91.9%), while renter-occupied units make up 434 (8.1%).
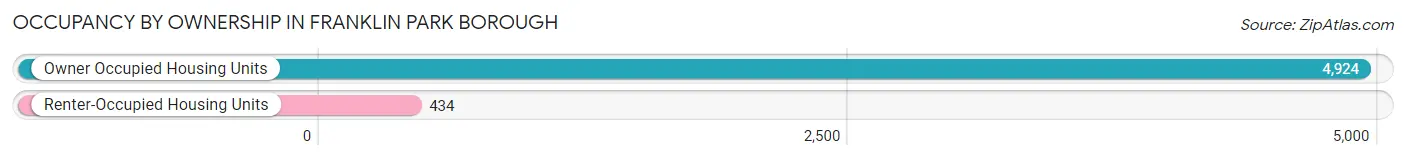
| Occupancy | # Housing Units | % Housing Units |
| Owner Occupied Housing Units | 4,924 | 91.9% |
| Renter-Occupied Housing Units | 434 | 8.1% |
| Total Occupied Housing Units | 5,358 | 100.0% |
Occupancy by Household Size in Franklin Park borough
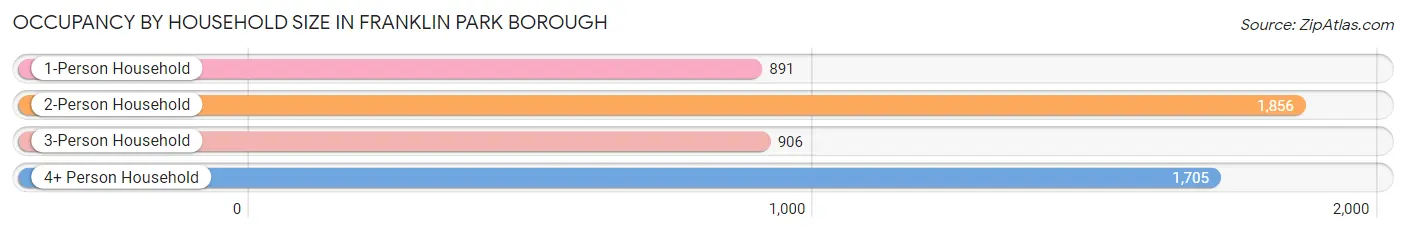
| Household Size | # Housing Units | % Housing Units |
| 1-Person Household | 891 | 16.6% |
| 2-Person Household | 1,856 | 34.6% |
| 3-Person Household | 906 | 16.9% |
| 4+ Person Household | 1,705 | 31.8% |
| Total Housing Units | 5,358 | 100.0% |
Occupancy by Ownership by Household Size in Franklin Park borough
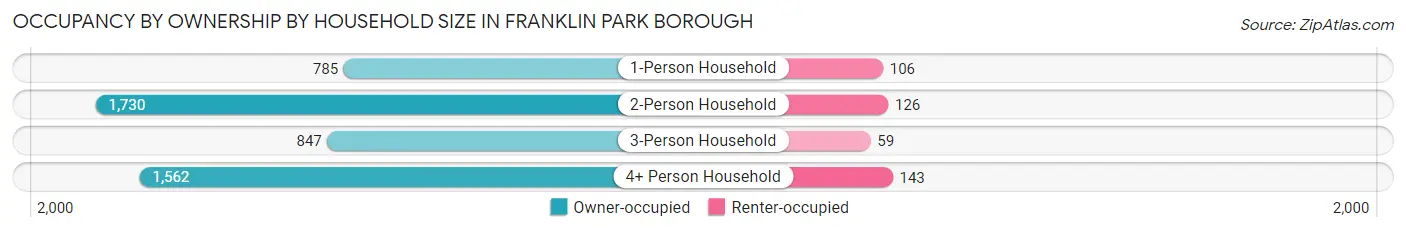
| Household Size | Owner-occupied | Renter-occupied |
| 1-Person Household | 785 (88.1%) | 106 (11.9%) |
| 2-Person Household | 1,730 (93.2%) | 126 (6.8%) |
| 3-Person Household | 847 (93.5%) | 59 (6.5%) |
| 4+ Person Household | 1,562 (91.6%) | 143 (8.4%) |
| Total Housing Units | 4,924 (91.9%) | 434 (8.1%) |
Occupancy by Educational Attainment in Franklin Park borough
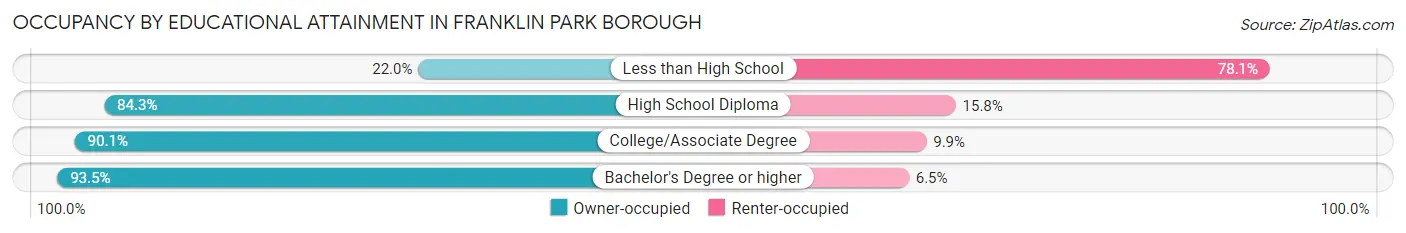
| Household Size | Owner-occupied | Renter-occupied |
| Less than High School | 9 (22.0%) | 32 (78.0%) |
| High School Diploma | 230 (84.3%) | 43 (15.8%) |
| College/Associate Degree | 853 (90.1%) | 94 (9.9%) |
| Bachelor's Degree or higher | 3,832 (93.5%) | 265 (6.5%) |
Occupancy by Age of Householder in Franklin Park borough
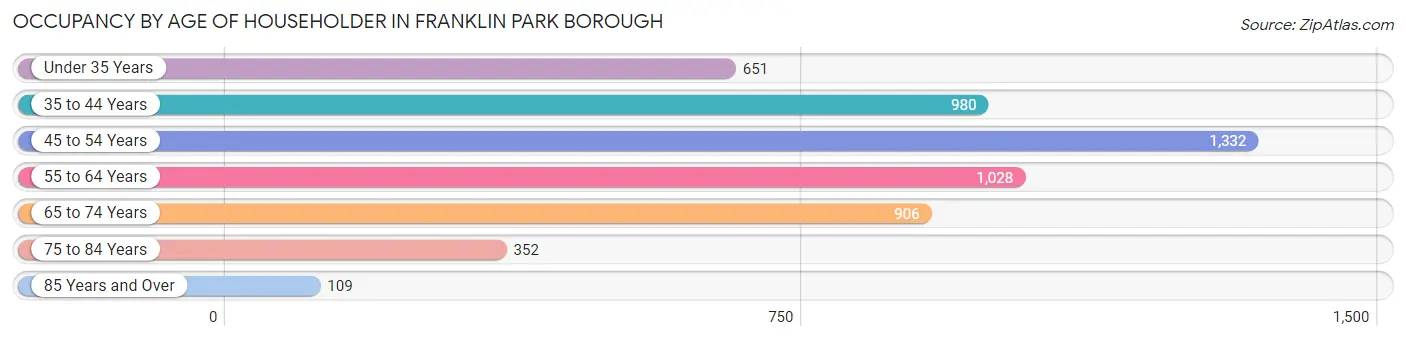
| Age Bracket | # Households | % Households |
| Under 35 Years | 651 | 12.1% |
| 35 to 44 Years | 980 | 18.3% |
| 45 to 54 Years | 1,332 | 24.9% |
| 55 to 64 Years | 1,028 | 19.2% |
| 65 to 74 Years | 906 | 16.9% |
| 75 to 84 Years | 352 | 6.6% |
| 85 Years and Over | 109 | 2.0% |
| Total | 5,358 | 100.0% |
Housing Finances in Franklin Park borough
Median Income by Occupancy in Franklin Park borough
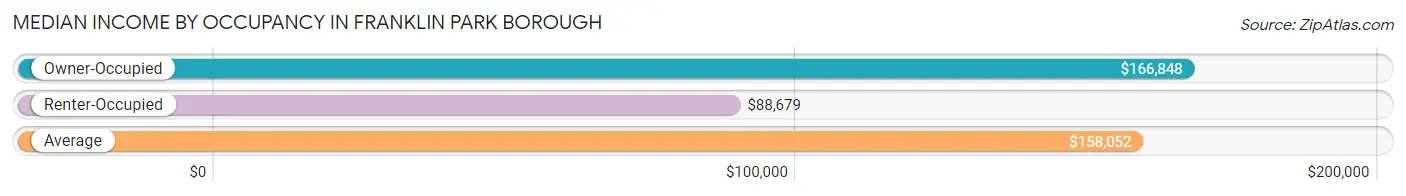
| Occupancy Type | # Households | Median Income |
| Owner-Occupied | 4,924 (91.9%) | $166,848 |
| Renter-Occupied | 434 (8.1%) | $88,679 |
| Average | 5,358 (100.0%) | $158,052 |
Occupancy by Householder Income Bracket in Franklin Park borough
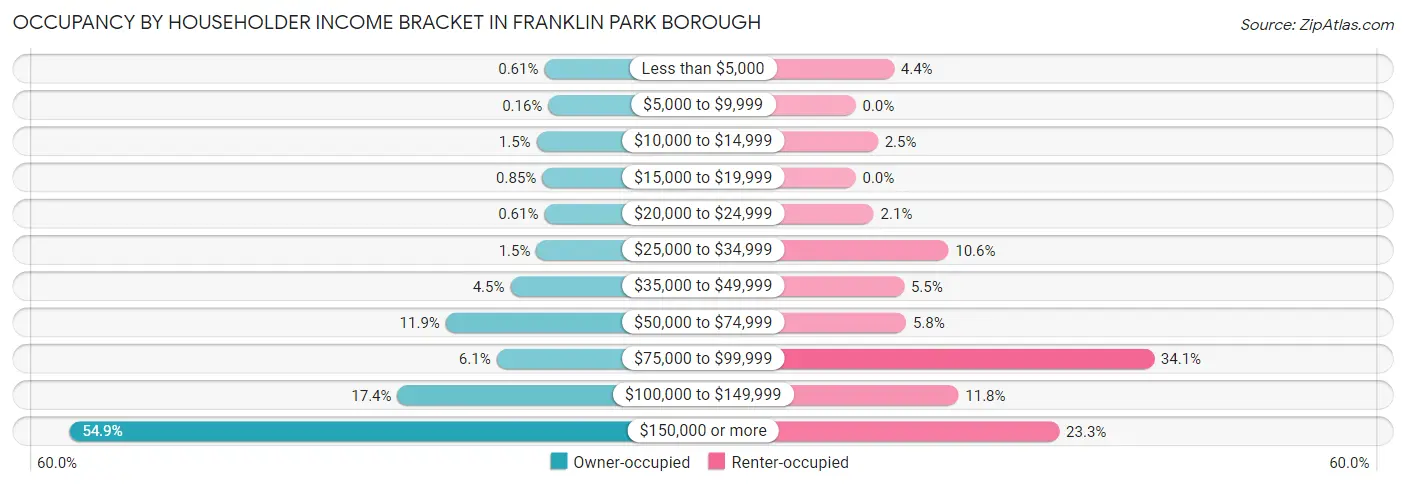
| Income Bracket | Owner-occupied | Renter-occupied |
| Less than $5,000 | 30 (0.6%) | 19 (4.4%) |
| $5,000 to $9,999 | 8 (0.2%) | 0 (0.0%) |
| $10,000 to $14,999 | 74 (1.5%) | 11 (2.5%) |
| $15,000 to $19,999 | 42 (0.9%) | 0 (0.0%) |
| $20,000 to $24,999 | 30 (0.6%) | 9 (2.1%) |
| $25,000 to $34,999 | 75 (1.5%) | 46 (10.6%) |
| $35,000 to $49,999 | 221 (4.5%) | 24 (5.5%) |
| $50,000 to $74,999 | 585 (11.9%) | 25 (5.8%) |
| $75,000 to $99,999 | 299 (6.1%) | 148 (34.1%) |
| $100,000 to $149,999 | 857 (17.4%) | 51 (11.7%) |
| $150,000 or more | 2,703 (54.9%) | 101 (23.3%) |
| Total | 4,924 (100.0%) | 434 (100.0%) |
Monthly Housing Cost Tiers in Franklin Park borough
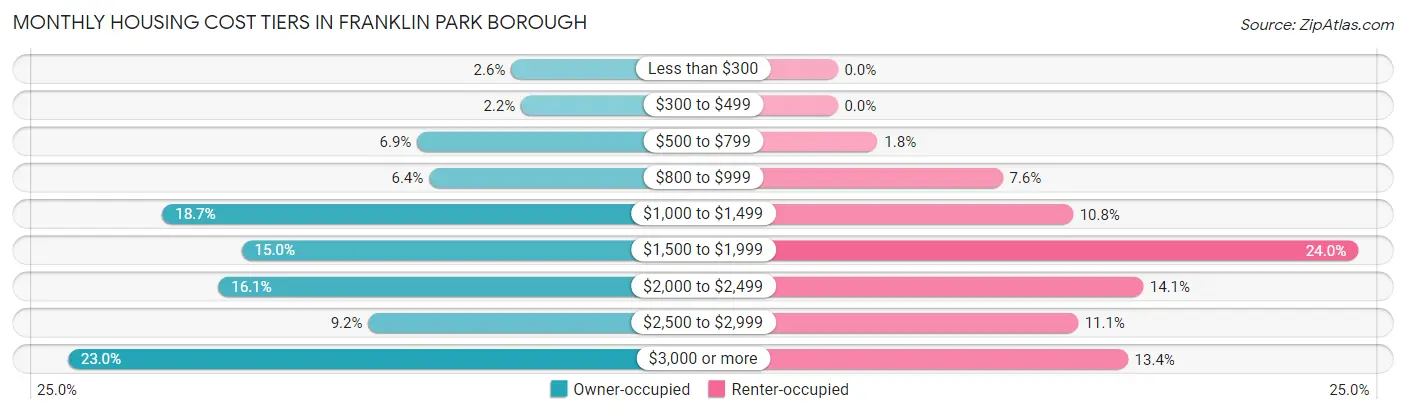
| Monthly Cost | Owner-occupied | Renter-occupied |
| Less than $300 | 128 (2.6%) | 0 (0.0%) |
| $300 to $499 | 106 (2.1%) | 0 (0.0%) |
| $500 to $799 | 341 (6.9%) | 8 (1.8%) |
| $800 to $999 | 314 (6.4%) | 33 (7.6%) |
| $1,000 to $1,499 | 919 (18.7%) | 47 (10.8%) |
| $1,500 to $1,999 | 739 (15.0%) | 104 (24.0%) |
| $2,000 to $2,499 | 792 (16.1%) | 61 (14.1%) |
| $2,500 to $2,999 | 452 (9.2%) | 48 (11.1%) |
| $3,000 or more | 1,133 (23.0%) | 58 (13.4%) |
| Total | 4,924 (100.0%) | 434 (100.0%) |
Physical Housing Characteristics in Franklin Park borough
Housing Structures in Franklin Park borough
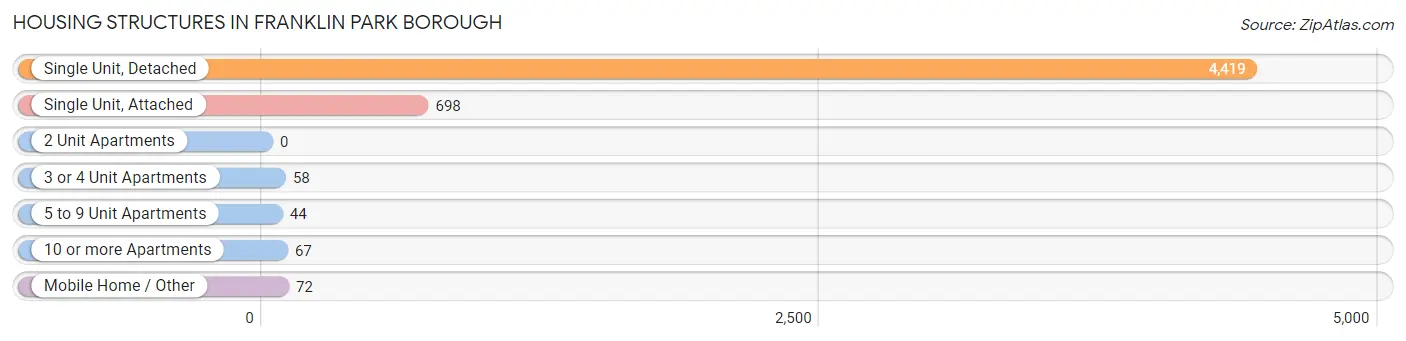
| Structure Type | # Housing Units | % Housing Units |
| Single Unit, Detached | 4,419 | 82.5% |
| Single Unit, Attached | 698 | 13.0% |
| 2 Unit Apartments | 0 | 0.0% |
| 3 or 4 Unit Apartments | 58 | 1.1% |
| 5 to 9 Unit Apartments | 44 | 0.8% |
| 10 or more Apartments | 67 | 1.3% |
| Mobile Home / Other | 72 | 1.3% |
| Total | 5,358 | 100.0% |
Housing Structures by Occupancy in Franklin Park borough
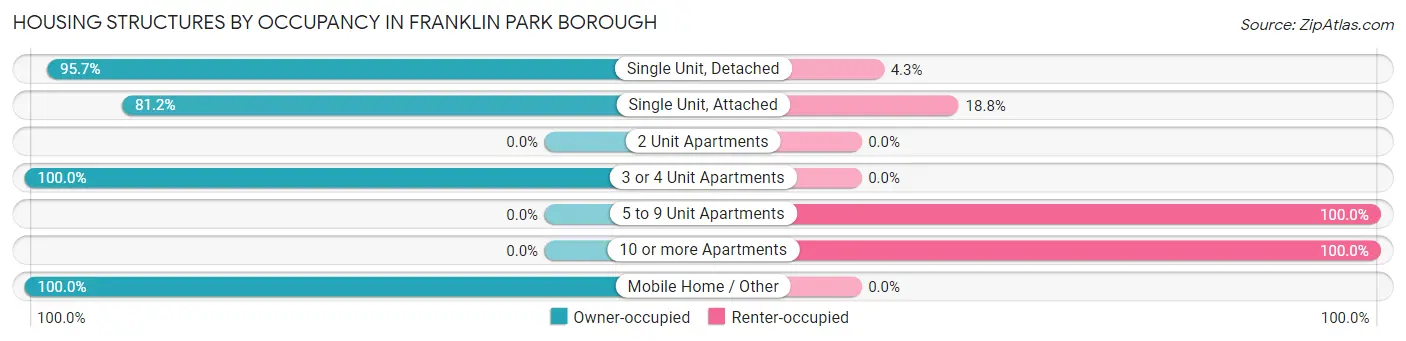
| Structure Type | Owner-occupied | Renter-occupied |
| Single Unit, Detached | 4,227 (95.7%) | 192 (4.3%) |
| Single Unit, Attached | 567 (81.2%) | 131 (18.8%) |
| 2 Unit Apartments | 0 (0.0%) | 0 (0.0%) |
| 3 or 4 Unit Apartments | 58 (100.0%) | 0 (0.0%) |
| 5 to 9 Unit Apartments | 0 (0.0%) | 44 (100.0%) |
| 10 or more Apartments | 0 (0.0%) | 67 (100.0%) |
| Mobile Home / Other | 72 (100.0%) | 0 (0.0%) |
| Total | 4,924 (91.9%) | 434 (8.1%) |
Housing Structures by Number of Rooms in Franklin Park borough
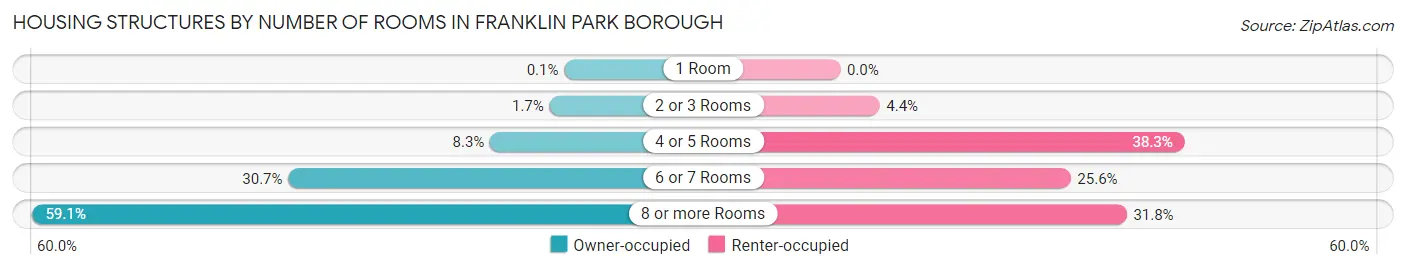
| Number of Rooms | Owner-occupied | Renter-occupied |
| 1 Room | 5 (0.1%) | 0 (0.0%) |
| 2 or 3 Rooms | 85 (1.7%) | 19 (4.4%) |
| 4 or 5 Rooms | 410 (8.3%) | 166 (38.3%) |
| 6 or 7 Rooms | 1,513 (30.7%) | 111 (25.6%) |
| 8 or more Rooms | 2,911 (59.1%) | 138 (31.8%) |
| Total | 4,924 (100.0%) | 434 (100.0%) |
Housing Structure by Heating Type in Franklin Park borough
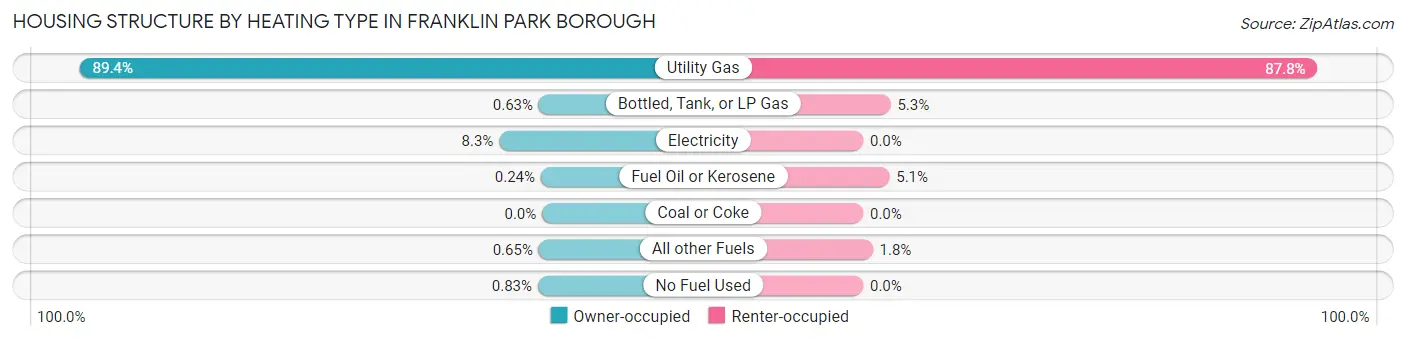
| Heating Type | Owner-occupied | Renter-occupied |
| Utility Gas | 4,400 (89.4%) | 381 (87.8%) |
| Bottled, Tank, or LP Gas | 31 (0.6%) | 23 (5.3%) |
| Electricity | 408 (8.3%) | 0 (0.0%) |
| Fuel Oil or Kerosene | 12 (0.2%) | 22 (5.1%) |
| Coal or Coke | 0 (0.0%) | 0 (0.0%) |
| All other Fuels | 32 (0.6%) | 8 (1.8%) |
| No Fuel Used | 41 (0.8%) | 0 (0.0%) |
| Total | 4,924 (100.0%) | 434 (100.0%) |
Household Vehicle Usage in Franklin Park borough
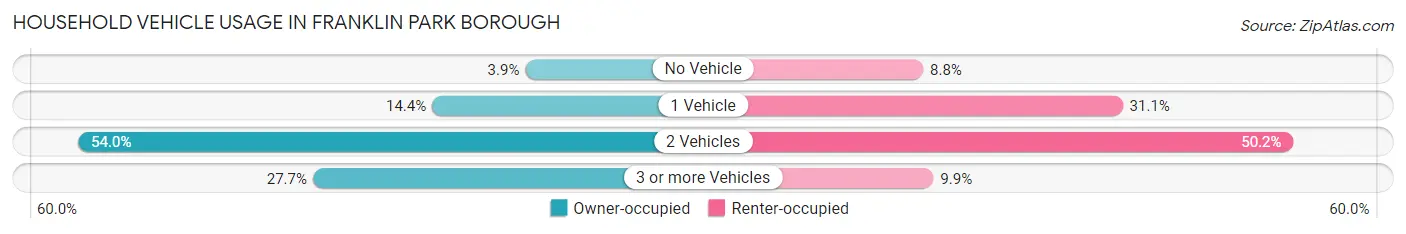
| Vehicles per Household | Owner-occupied | Renter-occupied |
| No Vehicle | 193 (3.9%) | 38 (8.8%) |
| 1 Vehicle | 707 (14.4%) | 135 (31.1%) |
| 2 Vehicles | 2,659 (54.0%) | 218 (50.2%) |
| 3 or more Vehicles | 1,365 (27.7%) | 43 (9.9%) |
| Total | 4,924 (100.0%) | 434 (100.0%) |
Real Estate & Mortgages in Franklin Park borough
Real Estate and Mortgage Overview in Franklin Park borough
| Characteristic | Without Mortgage | With Mortgage |
| Housing Units | 1,630 | 3,294 |
| Median Property Value | $433,300 | $437,700 |
| Median Household Income | $117,639 | $1,972 |
| Monthly Housing Costs | $1,005 | $1,127 |
| Real Estate Taxes | $6,665 | $35 |
Property Value by Mortgage Status in Franklin Park borough
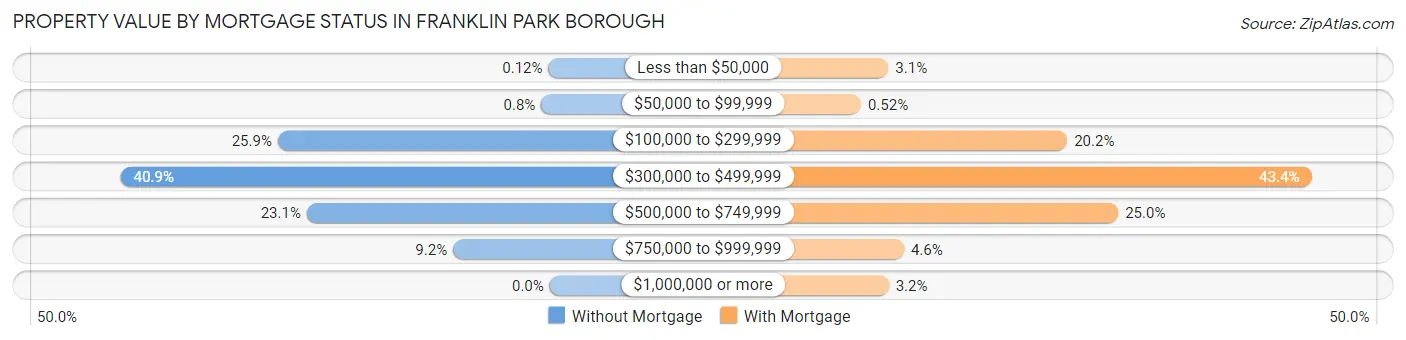
| Property Value | Without Mortgage | With Mortgage |
| Less than $50,000 | 2 (0.1%) | 103 (3.1%) |
| $50,000 to $99,999 | 13 (0.8%) | 17 (0.5%) |
| $100,000 to $299,999 | 422 (25.9%) | 664 (20.2%) |
| $300,000 to $499,999 | 666 (40.9%) | 1,430 (43.4%) |
| $500,000 to $749,999 | 377 (23.1%) | 824 (25.0%) |
| $750,000 to $999,999 | 150 (9.2%) | 152 (4.6%) |
| $1,000,000 or more | 0 (0.0%) | 104 (3.2%) |
| Total | 1,630 (100.0%) | 3,294 (100.0%) |
Household Income by Mortgage Status in Franklin Park borough
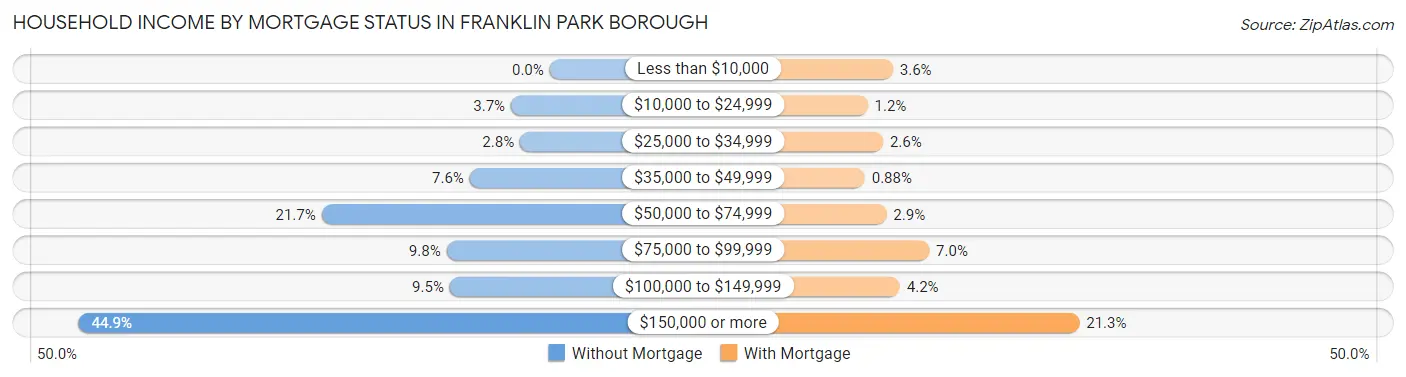
| Household Income | Without Mortgage | With Mortgage |
| Less than $10,000 | 0 (0.0%) | 117 (3.5%) |
| $10,000 to $24,999 | 60 (3.7%) | 38 (1.1%) |
| $25,000 to $34,999 | 46 (2.8%) | 86 (2.6%) |
| $35,000 to $49,999 | 124 (7.6%) | 29 (0.9%) |
| $50,000 to $74,999 | 354 (21.7%) | 97 (2.9%) |
| $75,000 to $99,999 | 160 (9.8%) | 231 (7.0%) |
| $100,000 to $149,999 | 155 (9.5%) | 139 (4.2%) |
| $150,000 or more | 731 (44.9%) | 702 (21.3%) |
| Total | 1,630 (100.0%) | 3,294 (100.0%) |
Property Value to Household Income Ratio in Franklin Park borough
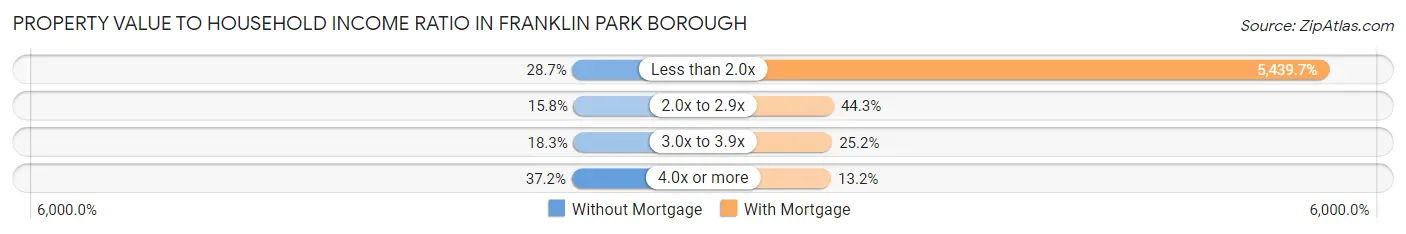
| Value-to-Income Ratio | Without Mortgage | With Mortgage |
| Less than 2.0x | 468 (28.7%) | 179,184 (5,439.7%) |
| 2.0x to 2.9x | 257 (15.8%) | 1,459 (44.3%) |
| 3.0x to 3.9x | 298 (18.3%) | 829 (25.2%) |
| 4.0x or more | 607 (37.2%) | 435 (13.2%) |
| Total | 1,630 (100.0%) | 3,294 (100.0%) |
Real Estate Taxes by Mortgage Status in Franklin Park borough
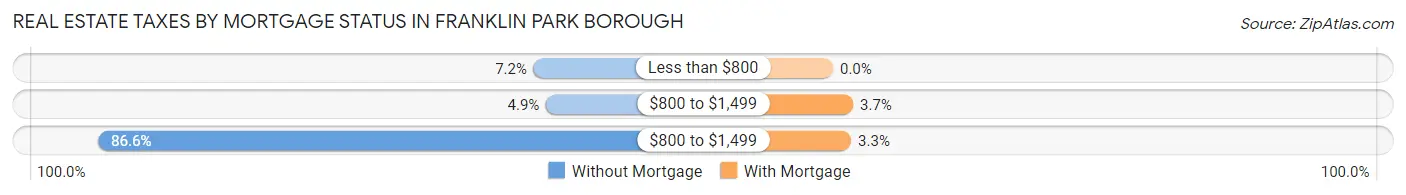
| Property Taxes | Without Mortgage | With Mortgage |
| Less than $800 | 117 (7.2%) | 0 (0.0%) |
| $800 to $1,499 | 80 (4.9%) | 121 (3.7%) |
| $800 to $1,499 | 1,411 (86.6%) | 109 (3.3%) |
| Total | 1,630 (100.0%) | 3,294 (100.0%) |
Health & Disability in Franklin Park borough
Health Insurance Coverage by Age in Franklin Park borough
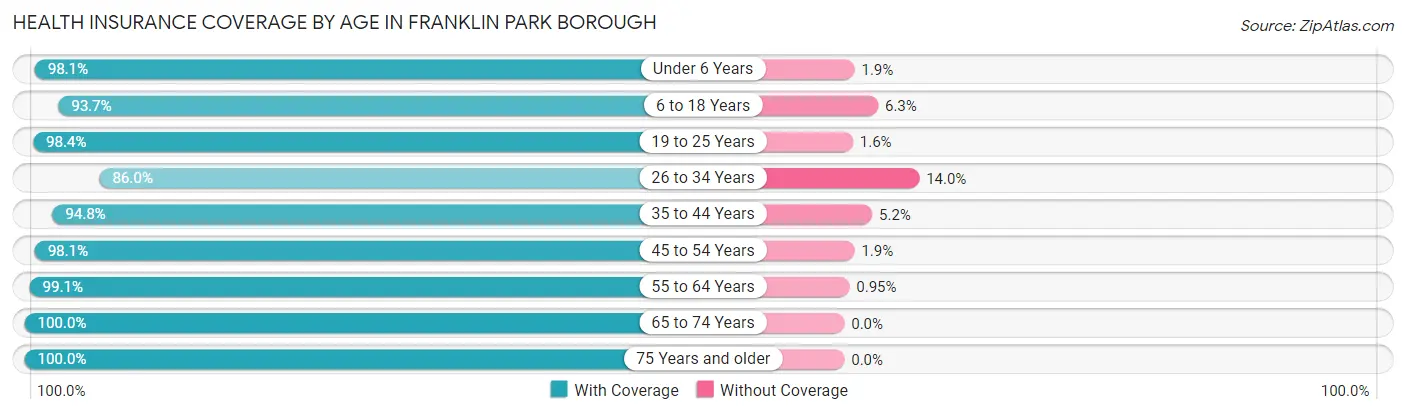
| Age Bracket | With Coverage | Without Coverage |
| Under 6 Years | 1,231 (98.1%) | 24 (1.9%) |
| 6 to 18 Years | 2,829 (93.7%) | 190 (6.3%) |
| 19 to 25 Years | 618 (98.4%) | 10 (1.6%) |
| 26 to 34 Years | 1,336 (86.0%) | 217 (14.0%) |
| 35 to 44 Years | 2,010 (94.8%) | 110 (5.2%) |
| 45 to 54 Years | 2,375 (98.1%) | 46 (1.9%) |
| 55 to 64 Years | 1,977 (99.1%) | 19 (0.9%) |
| 65 to 74 Years | 1,497 (100.0%) | 0 (0.0%) |
| 75 Years and older | 809 (100.0%) | 0 (0.0%) |
| Total | 14,682 (96.0%) | 616 (4.0%) |
Health Insurance Coverage by Citizenship Status in Franklin Park borough
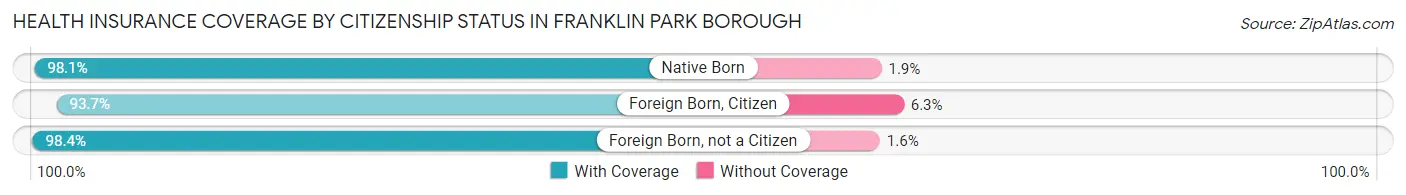
| Citizenship Status | With Coverage | Without Coverage |
| Native Born | 1,231 (98.1%) | 24 (1.9%) |
| Foreign Born, Citizen | 2,829 (93.7%) | 190 (6.3%) |
| Foreign Born, not a Citizen | 618 (98.4%) | 10 (1.6%) |
Health Insurance Coverage by Household Income in Franklin Park borough
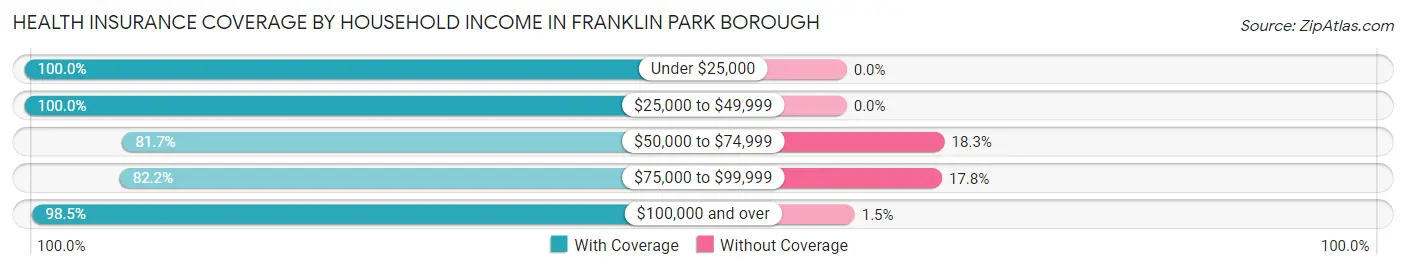
| Household Income | With Coverage | Without Coverage |
| Under $25,000 | 567 (100.0%) | 0 (0.0%) |
| $25,000 to $49,999 | 606 (100.0%) | 0 (0.0%) |
| $50,000 to $74,999 | 904 (81.7%) | 203 (18.3%) |
| $75,000 to $99,999 | 1,096 (82.2%) | 238 (17.8%) |
| $100,000 and over | 11,496 (98.5%) | 175 (1.5%) |
Public vs Private Health Insurance Coverage by Age in Franklin Park borough
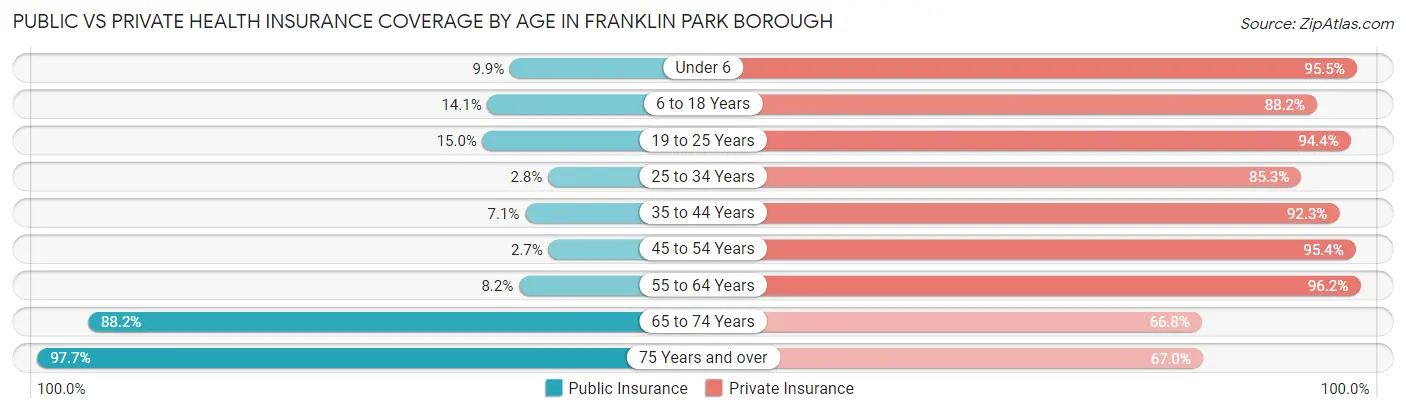
| Age Bracket | Public Insurance | Private Insurance |
| Under 6 | 124 (9.9%) | 1,199 (95.5%) |
| 6 to 18 Years | 425 (14.1%) | 2,662 (88.2%) |
| 19 to 25 Years | 94 (15.0%) | 593 (94.4%) |
| 25 to 34 Years | 44 (2.8%) | 1,324 (85.3%) |
| 35 to 44 Years | 150 (7.1%) | 1,957 (92.3%) |
| 45 to 54 Years | 66 (2.7%) | 2,309 (95.4%) |
| 55 to 64 Years | 164 (8.2%) | 1,920 (96.2%) |
| 65 to 74 Years | 1,321 (88.2%) | 1,000 (66.8%) |
| 75 Years and over | 790 (97.7%) | 542 (67.0%) |
| Total | 3,178 (20.8%) | 13,506 (88.3%) |
Disability Status by Sex by Age in Franklin Park borough
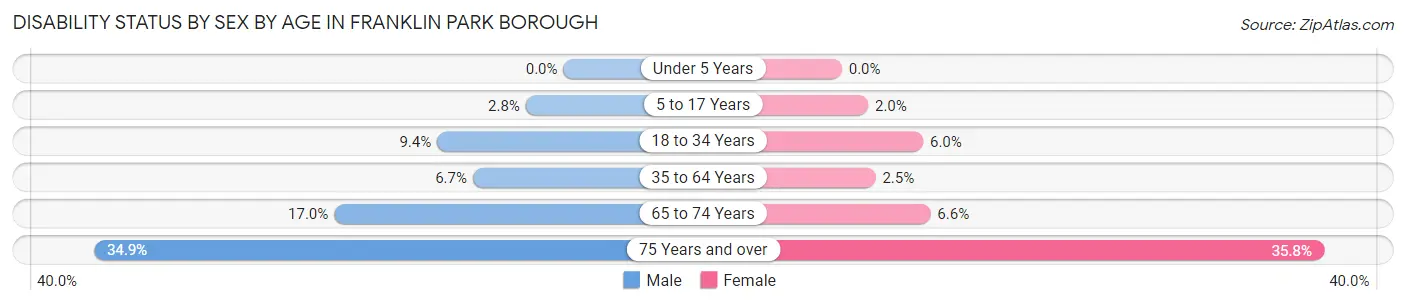
| Age Bracket | Male | Female |
| Under 5 Years | 0 (0.0%) | 0 (0.0%) |
| 5 to 17 Years | 44 (2.8%) | 32 (1.9%) |
| 18 to 34 Years | 118 (9.4%) | 61 (6.0%) |
| 35 to 64 Years | 219 (6.7%) | 82 (2.5%) |
| 65 to 74 Years | 128 (17.0%) | 49 (6.6%) |
| 75 Years and over | 130 (34.8%) | 156 (35.8%) |
Disability Class by Sex by Age in Franklin Park borough
Disability Class: Hearing Difficulty
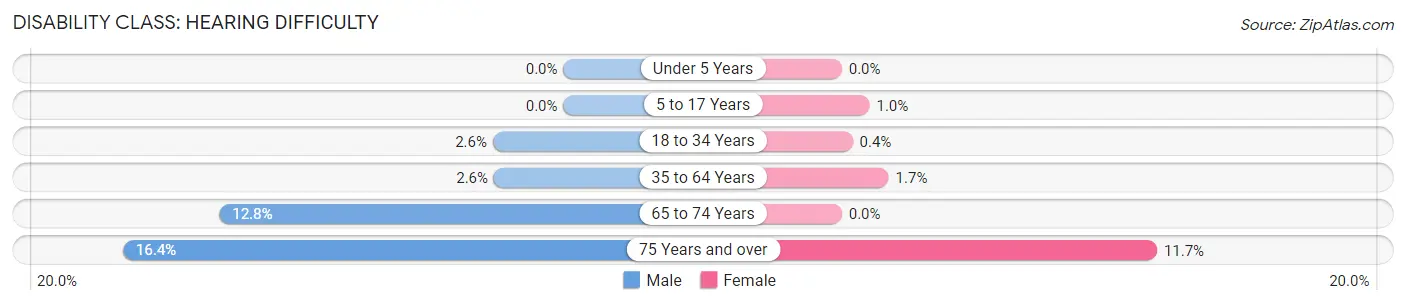
| Age Bracket | Male | Female |
| Under 5 Years | 0 (0.0%) | 0 (0.0%) |
| 5 to 17 Years | 0 (0.0%) | 17 (1.0%) |
| 18 to 34 Years | 33 (2.6%) | 4 (0.4%) |
| 35 to 64 Years | 84 (2.6%) | 57 (1.7%) |
| 65 to 74 Years | 96 (12.8%) | 0 (0.0%) |
| 75 Years and over | 61 (16.4%) | 51 (11.7%) |
Disability Class: Vision Difficulty
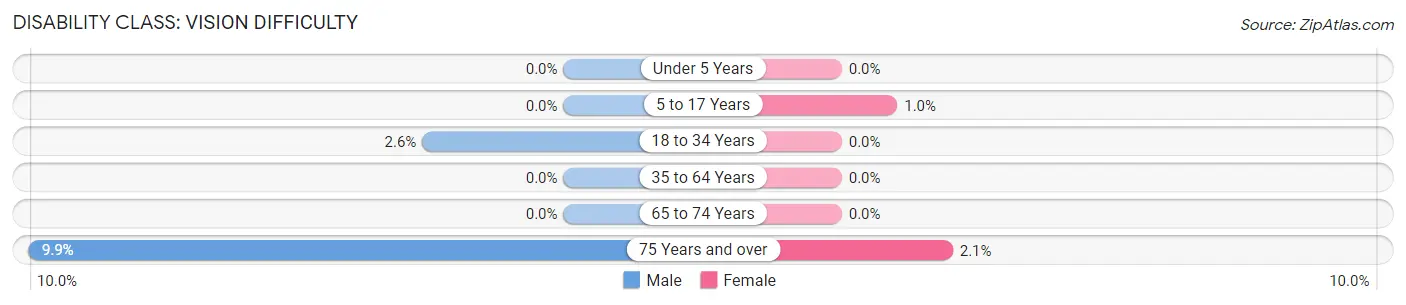
| Age Bracket | Male | Female |
| Under 5 Years | 0 (0.0%) | 0 (0.0%) |
| 5 to 17 Years | 0 (0.0%) | 17 (1.0%) |
| 18 to 34 Years | 33 (2.6%) | 0 (0.0%) |
| 35 to 64 Years | 0 (0.0%) | 0 (0.0%) |
| 65 to 74 Years | 0 (0.0%) | 0 (0.0%) |
| 75 Years and over | 37 (9.9%) | 9 (2.1%) |
Disability Class: Cognitive Difficulty
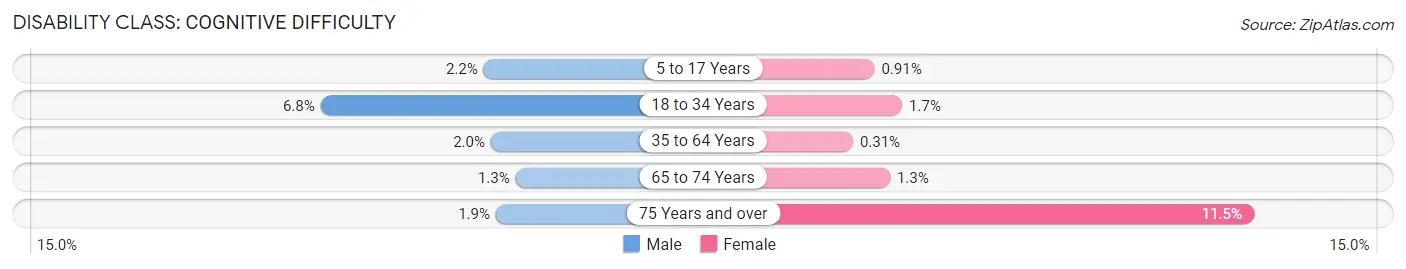
| Age Bracket | Male | Female |
| 5 to 17 Years | 35 (2.2%) | 15 (0.9%) |
| 18 to 34 Years | 85 (6.8%) | 17 (1.7%) |
| 35 to 64 Years | 66 (2.0%) | 10 (0.3%) |
| 65 to 74 Years | 10 (1.3%) | 10 (1.3%) |
| 75 Years and over | 7 (1.9%) | 50 (11.5%) |
Disability Class: Ambulatory Difficulty
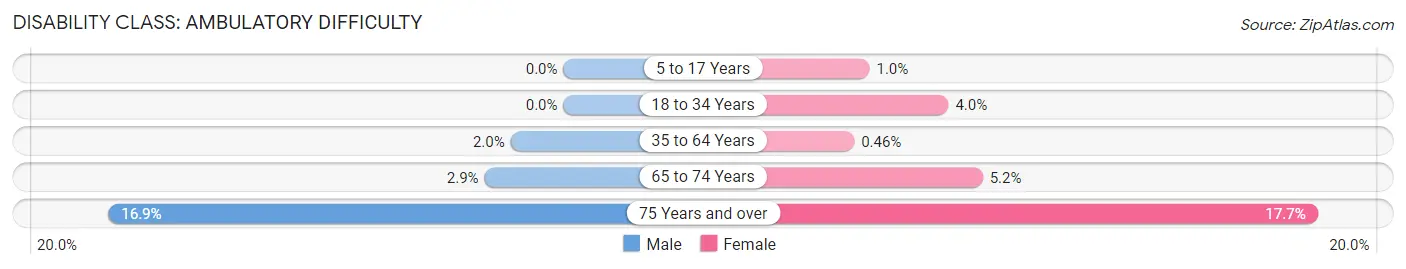
| Age Bracket | Male | Female |
| 5 to 17 Years | 0 (0.0%) | 17 (1.0%) |
| 18 to 34 Years | 0 (0.0%) | 40 (4.0%) |
| 35 to 64 Years | 64 (2.0%) | 15 (0.5%) |
| 65 to 74 Years | 22 (2.9%) | 39 (5.2%) |
| 75 Years and over | 63 (16.9%) | 77 (17.7%) |
Disability Class: Self-Care Difficulty
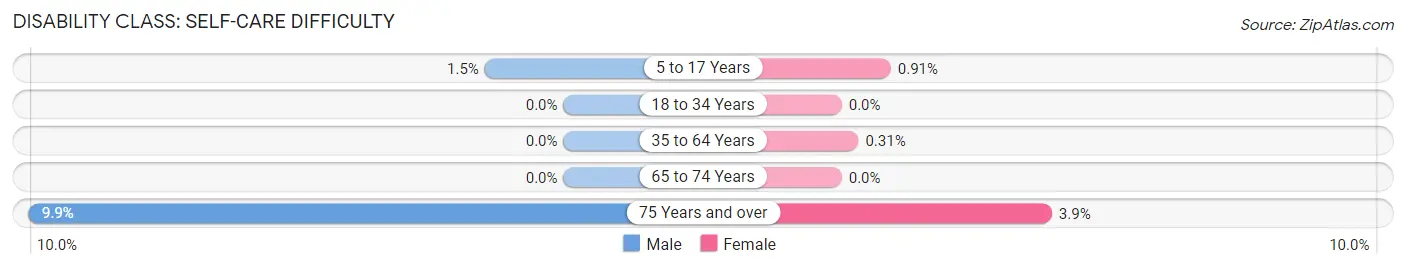
| Age Bracket | Male | Female |
| 5 to 17 Years | 23 (1.5%) | 15 (0.9%) |
| 18 to 34 Years | 0 (0.0%) | 0 (0.0%) |
| 35 to 64 Years | 0 (0.0%) | 10 (0.3%) |
| 65 to 74 Years | 0 (0.0%) | 0 (0.0%) |
| 75 Years and over | 37 (9.9%) | 17 (3.9%) |
Technology Access in Franklin Park borough
Computing Device Access in Franklin Park borough
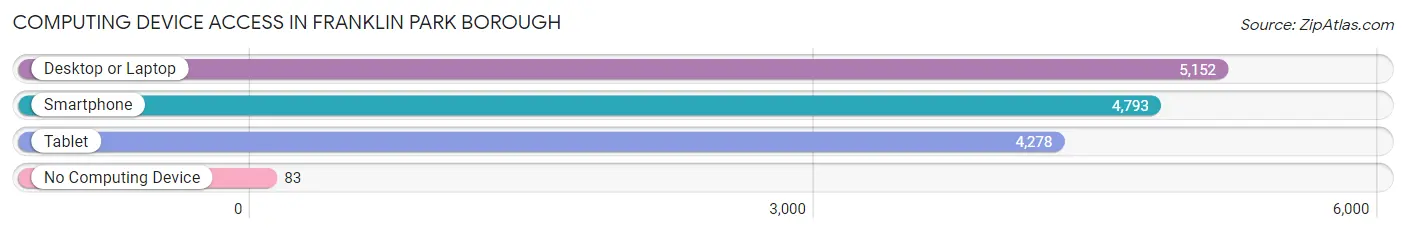
| Device Type | # Households | % Households |
| Desktop or Laptop | 5,152 | 96.2% |
| Smartphone | 4,793 | 89.5% |
| Tablet | 4,278 | 79.8% |
| No Computing Device | 83 | 1.5% |
| Total | 5,358 | 100.0% |
Internet Access in Franklin Park borough
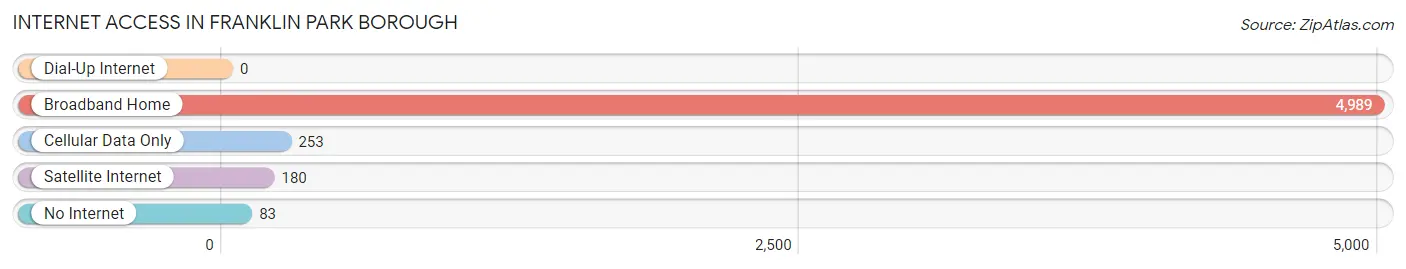
| Internet Type | # Households | % Households |
| Dial-Up Internet | 0 | 0.0% |
| Broadband Home | 4,989 | 93.1% |
| Cellular Data Only | 253 | 4.7% |
| Satellite Internet | 180 | 3.4% |
| No Internet | 83 | 1.5% |
| Total | 5,358 | 100.0% |
Franklin Park borough Summary
Franklin Park Borough is a small borough located in Allegheny County, Pennsylvania. It is situated approximately 10 miles north of Pittsburgh and is part of the Pittsburgh Metropolitan Statistical Area. The borough was incorporated in 1891 and is home to approximately 8,000 people.
History
The area that is now Franklin Park Borough was originally inhabited by the Lenape Native Americans. The first European settlers arrived in the area in the late 1700s and early 1800s. The area was originally known as Franklin Township, and was named after Benjamin Franklin. In 1891, the area was incorporated as the Borough of Franklin Park.
The borough was originally a rural farming community, but in the late 1800s and early 1900s, the area began to experience rapid growth and development. This was due to the construction of the Pennsylvania Railroad, which ran through the borough. The railroad brought new businesses and industries to the area, and the population began to grow.
In the early 1900s, the borough was home to several factories, including a steel mill, a glass factory, and a brickyard. The borough also had several stores, churches, and schools.
Geography
Franklin Park Borough is located in Allegheny County, Pennsylvania. It is situated approximately 10 miles north of Pittsburgh and is part of the Pittsburgh Metropolitan Statistical Area. The borough is bordered by McCandless Township to the north, Marshall Township to the east, Pine Township to the south, and Bradford Woods to the west.
The borough covers an area of 2.3 square miles and is located at an elevation of 1,000 feet. The terrain is mostly flat, with some rolling hills. The borough is located in the Allegheny Plateau region of Pennsylvania.
Economy
The economy of Franklin Park Borough is largely based on retail and services. The borough is home to several retail stores, restaurants, and other businesses. The borough also has several industrial parks, which are home to a variety of businesses, including manufacturing, distribution, and technology companies.
The borough is also home to several educational institutions, including the Community College of Allegheny County, La Roche College, and the University of Pittsburgh.
Demographics
As of the 2010 census, the population of Franklin Park Borough was 8,072. The racial makeup of the borough was 94.3% White, 2.2% African American, 0.3% Native American, 1.2% Asian, 0.1% Pacific Islander, 0.7% from other races, and 1.3% from two or more races. Hispanic or Latino of any race were 2.2% of the population.
The median household income in the borough was $50,945, and the median family income was $60,945. The per capita income was $25,945. About 4.3% of families and 5.7% of the population were below the poverty line.
The borough is served by the North Allegheny School District. The borough is also home to several private schools, including St. Sebastian's School and St. Ursula's Academy.
Common Questions
What is Per Capita Income in Franklin Park borough?
Per Capita income in Franklin Park borough is $72,508.
What is the Median Family Income in Franklin Park borough?
Median Family Income in Franklin Park borough is $180,067.
What is the Median Household income in Franklin Park borough?
Median Household Income in Franklin Park borough is $158,052.
What is Income or Wage Gap in Franklin Park borough?
Income or Wage Gap in Franklin Park borough is 38.2%.
Women in Franklin Park borough earn 61.8 cents for every dollar earned by a man.
What is Inequality or Gini Index in Franklin Park borough?
Inequality or Gini Index in Franklin Park borough is 0.43.
What is the Total Population of Franklin Park borough?
Total Population of Franklin Park borough is 15,305.
What is the Total Male Population of Franklin Park borough?
Total Male Population of Franklin Park borough is 7,685.
What is the Total Female Population of Franklin Park borough?
Total Female Population of Franklin Park borough is 7,620.
What is the Ratio of Males per 100 Females in Franklin Park borough?
There are 100.85 Males per 100 Females in Franklin Park borough.
What is the Ratio of Females per 100 Males in Franklin Park borough?
There are 99.15 Females per 100 Males in Franklin Park borough.
What is the Median Population Age in Franklin Park borough?
Median Population Age in Franklin Park borough is 41.1 Years.
What is the Average Family Size in Franklin Park borough
Average Family Size in Franklin Park borough is 3.2 People.
What is the Average Household Size in Franklin Park borough
Average Household Size in Franklin Park borough is 2.9 People.
How Large is the Labor Force in Franklin Park borough?
There are 8,324 People in the Labor Forcein in Franklin Park borough.
What is the Percentage of People in the Labor Force in Franklin Park borough?
71.3% of People are in the Labor Force in Franklin Park borough.
What is the Unemployment Rate in Franklin Park borough?
Unemployment Rate in Franklin Park borough is 4.3%.