Lyons borough, PA Map & Demographics
Lyons borough Overview
$32,887
PER CAPITA INCOME
$77,059
AVG FAMILY INCOME
$57,500
AVG HOUSEHOLD INCOME
5.6%
WAGE / INCOME GAP [ % ]
94.4¢/ $1
WAGE / INCOME GAP [ $ ]
0.27
INEQUALITY / GINI INDEX
517
TOTAL POPULATION
283
MALE POPULATION
234
FEMALE POPULATION
120.94
MALES / 100 FEMALES
82.69
FEMALES / 100 MALES
53.1
MEDIAN AGE
2.9
AVG FAMILY SIZE
2.0
AVG HOUSEHOLD SIZE
314
LABOR FORCE [ PEOPLE ]
63.1%
PERCENT IN LABOR FORCE
0.6%
UNEMPLOYMENT RATE
Income in Lyons borough
Income Overview in Lyons borough
Per Capita Income in Lyons borough is $32,887, while median incomes of families and households are $77,059 and $57,500 respectively.
| Characteristic | Number | Measure |
| Per Capita Income | 517 | $32,887 |
| Median Family Income | 130 | $77,059 |
| Mean Family Income | 130 | $86,728 |
| Median Household Income | 250 | $57,500 |
| Mean Household Income | 250 | $67,548 |
| Income Deficit | 130 | $0 |
| Wage / Income Gap (%) | 517 | 5.58% |
| Wage / Income Gap ($) | 517 | 94.42¢ per $1 |
| Gini / Inequality Index | 517 | 0.27 |
Earnings by Sex in Lyons borough
Average Earnings in Lyons borough are $38,580, $40,000 for men and $37,768 for women, a difference of 5.6%.
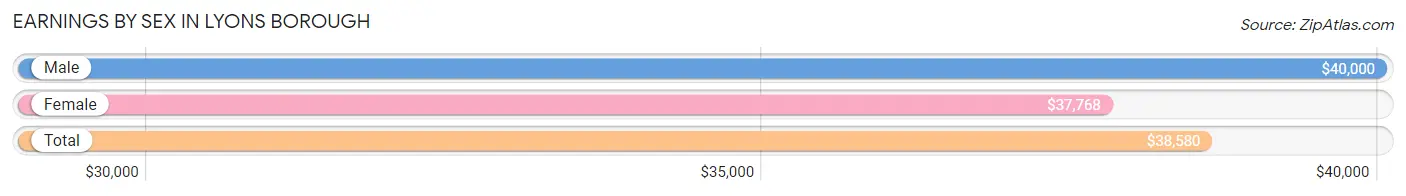
| Sex | Number | Average Earnings |
| Male | 210 (58.0%) | $40,000 |
| Female | 152 (42.0%) | $37,768 |
| Total | 362 (100.0%) | $38,580 |
Earnings by Sex by Income Bracket in Lyons borough
The most common earnings brackets in Lyons borough are $50,000 to $54,999 for men (66 | 31.4%) and $35,000 to $39,999 for women (48 | 31.6%).
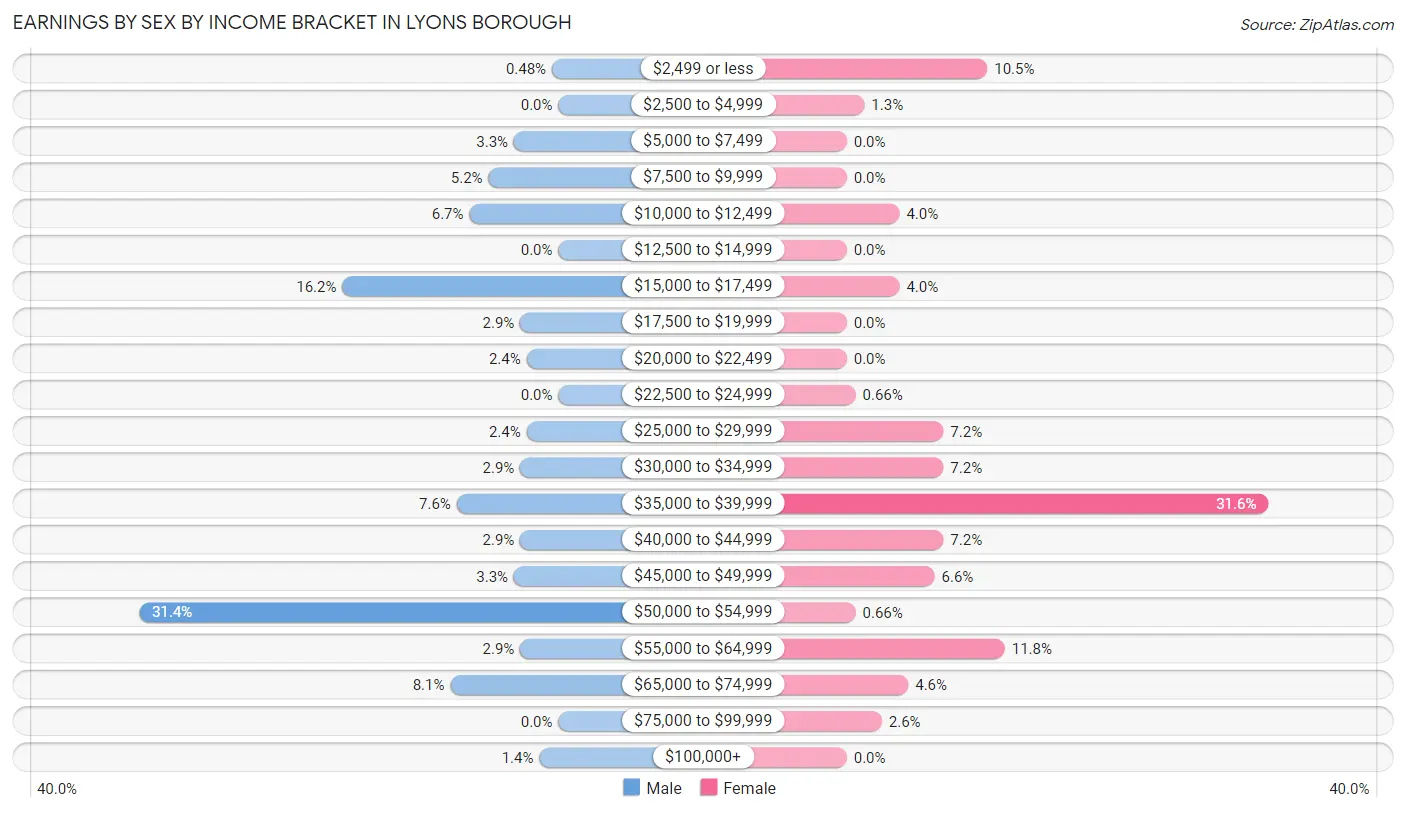
| Income | Male | Female |
| $2,499 or less | 1 (0.5%) | 16 (10.5%) |
| $2,500 to $4,999 | 0 (0.0%) | 2 (1.3%) |
| $5,000 to $7,499 | 7 (3.3%) | 0 (0.0%) |
| $7,500 to $9,999 | 11 (5.2%) | 0 (0.0%) |
| $10,000 to $12,499 | 14 (6.7%) | 6 (4.0%) |
| $12,500 to $14,999 | 0 (0.0%) | 0 (0.0%) |
| $15,000 to $17,499 | 34 (16.2%) | 6 (4.0%) |
| $17,500 to $19,999 | 6 (2.9%) | 0 (0.0%) |
| $20,000 to $22,499 | 5 (2.4%) | 0 (0.0%) |
| $22,500 to $24,999 | 0 (0.0%) | 1 (0.7%) |
| $25,000 to $29,999 | 5 (2.4%) | 11 (7.2%) |
| $30,000 to $34,999 | 6 (2.9%) | 11 (7.2%) |
| $35,000 to $39,999 | 16 (7.6%) | 48 (31.6%) |
| $40,000 to $44,999 | 6 (2.9%) | 11 (7.2%) |
| $45,000 to $49,999 | 7 (3.3%) | 10 (6.6%) |
| $50,000 to $54,999 | 66 (31.4%) | 1 (0.7%) |
| $55,000 to $64,999 | 6 (2.9%) | 18 (11.8%) |
| $65,000 to $74,999 | 17 (8.1%) | 7 (4.6%) |
| $75,000 to $99,999 | 0 (0.0%) | 4 (2.6%) |
| $100,000+ | 3 (1.4%) | 0 (0.0%) |
| Total | 210 (100.0%) | 152 (100.0%) |
Earnings by Sex by Educational Attainment in Lyons borough
Average earnings in Lyons borough are $50,275 for men and $38,616 for women, a difference of 23.2%. Men with an educational attainment of college or associate's degree enjoy the highest average annual earnings of $73,393, while those with bachelor's degree education earn the least with $37,813. Women with an educational attainment of bachelor's degree earn the most with the average annual earnings of $73,036, while those with college or associate's degree education have the smallest earnings of $36,912.
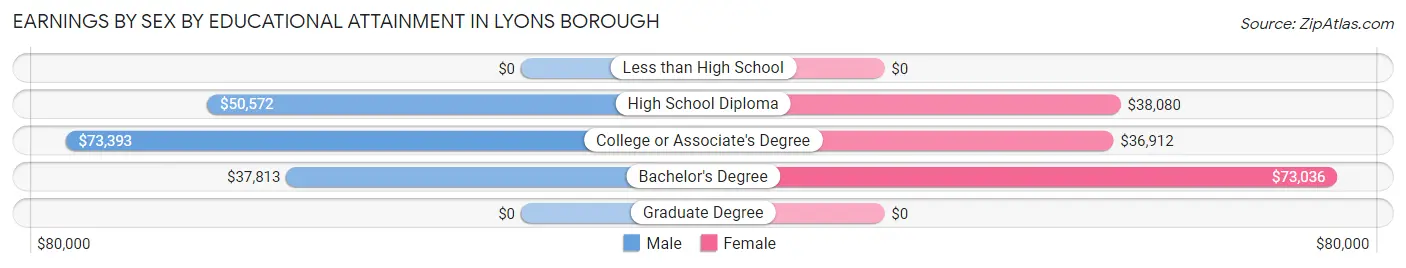
| Educational Attainment | Male Income | Female Income |
| Less than High School | - | - |
| High School Diploma | $50,572 | $38,080 |
| College or Associate's Degree | $73,393 | $36,912 |
| Bachelor's Degree | $37,813 | $73,036 |
| Graduate Degree | - | - |
| Total | $50,275 | $38,616 |
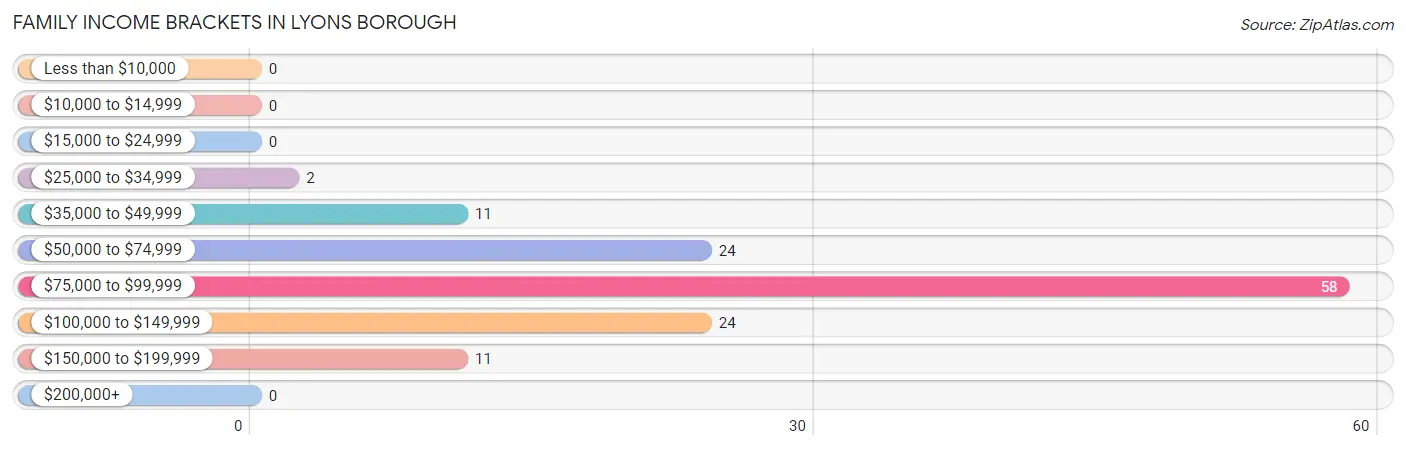
Family Income in Lyons borough
Family Income Brackets in Lyons borough
According to the Lyons borough family income data, there are 58 families falling into the $75,000 to $99,999 income range, which is the most common income bracket and makes up 44.6% of all families.
| Income Bracket | # Families | % Families |
| Less than $10,000 | 0 | 0.0% |
| $10,000 to $14,999 | 0 | 0.0% |
| $15,000 to $24,999 | 0 | 0.0% |
| $25,000 to $34,999 | 2 | 1.5% |
| $35,000 to $49,999 | 11 | 8.5% |
| $50,000 to $74,999 | 24 | 18.5% |
| $75,000 to $99,999 | 58 | 44.6% |
| $100,000 to $149,999 | 24 | 18.5% |
| $150,000 to $199,999 | 11 | 8.5% |
| $200,000+ | 0 | 0.0% |
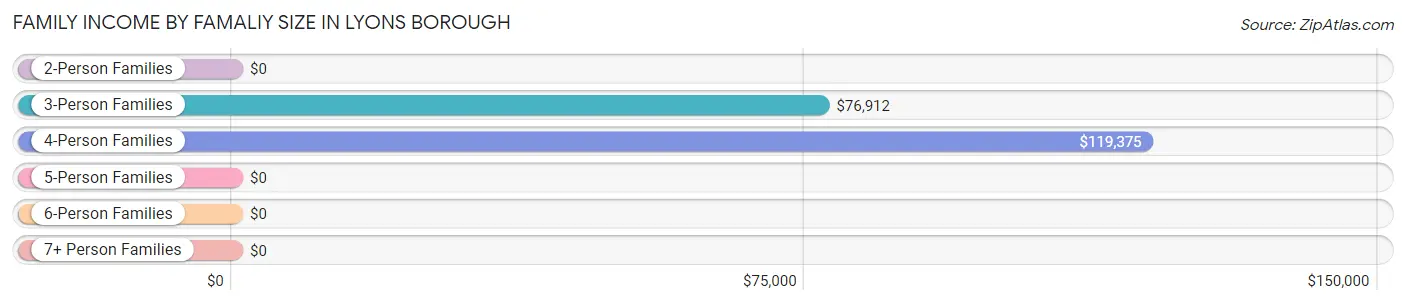
Family Income by Famaliy Size in Lyons borough
4-person families (18 | 13.9%) account for the highest median family income in Lyons borough with $119,375 per family, while 4-person families (18 | 13.9%) have the highest median income of $29,844 per family member.
| Income Bracket | # Families | Median Income |
| 2-Person Families | 38 (29.2%) | $0 |
| 3-Person Families | 74 (56.9%) | $76,912 |
| 4-Person Families | 18 (13.9%) | $119,375 |
| 5-Person Families | 0 (0.0%) | $0 |
| 6-Person Families | 0 (0.0%) | $0 |
| 7+ Person Families | 0 (0.0%) | $0 |
| Total | 130 (100.0%) | $77,059 |
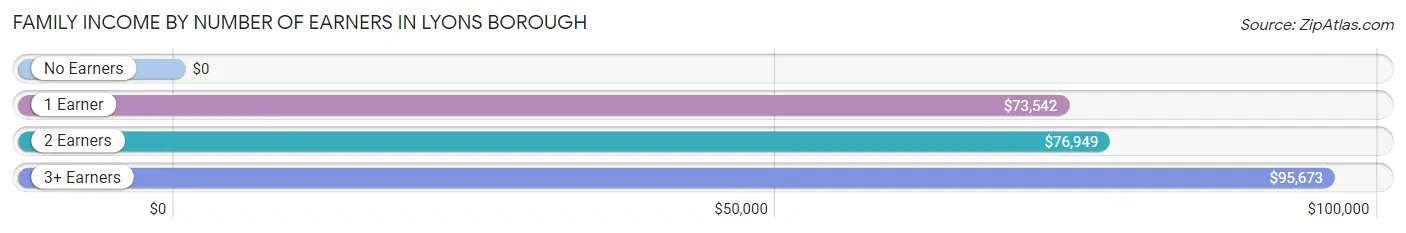
Family Income by Number of Earners in Lyons borough
| Number of Earners | # Families | Median Income |
| No Earners | 7 (5.4%) | $0 |
| 1 Earner | 21 (16.2%) | $73,542 |
| 2 Earners | 75 (57.7%) | $76,949 |
| 3+ Earners | 27 (20.8%) | $95,673 |
| Total | 130 (100.0%) | $77,059 |
Household Income in Lyons borough
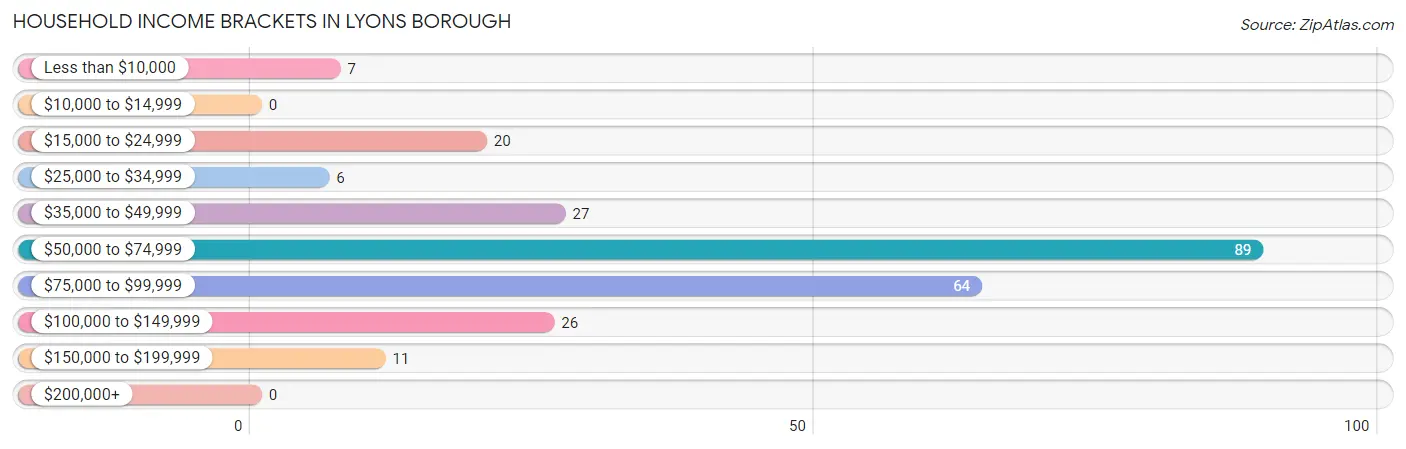
Household Income Brackets in Lyons borough
With 89 households falling in the category, the $50,000 to $74,999 income range is the most frequent in Lyons borough, accounting for 35.6% of all households.
| Income Bracket | # Households | % Households |
| Less than $10,000 | 7 | 2.8% |
| $10,000 to $14,999 | 0 | 0.0% |
| $15,000 to $24,999 | 20 | 8.0% |
| $25,000 to $34,999 | 6 | 2.4% |
| $35,000 to $49,999 | 27 | 10.8% |
| $50,000 to $74,999 | 89 | 35.6% |
| $75,000 to $99,999 | 64 | 25.6% |
| $100,000 to $149,999 | 26 | 10.4% |
| $150,000 to $199,999 | 11 | 4.4% |
| $200,000+ | 0 | 0.0% |
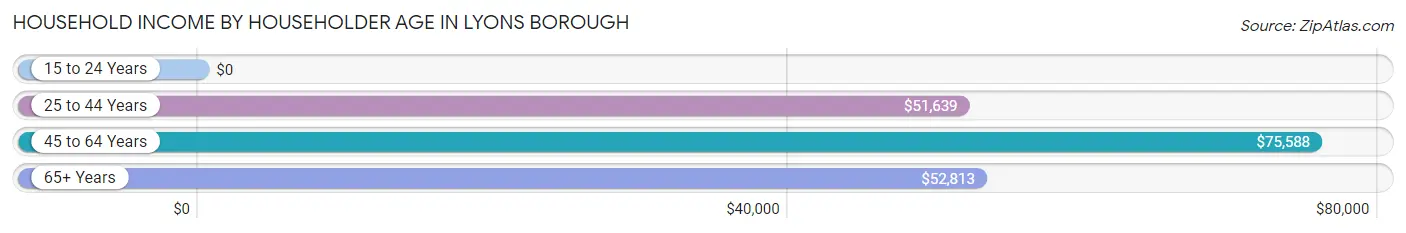
Household Income by Householder Age in Lyons borough
The median household income in Lyons borough is $57,500, with the highest median household income of $75,588 found in the 45 to 64 years age bracket for the primary householder. A total of 118 households (47.2%) fall into this category. Meanwhile, the 15 to 24 years age bracket for the primary householder has the lowest median household income of $0, with 2 households (0.8%) in this group.
| Income Bracket | # Households | Median Income |
| 15 to 24 Years | 2 (0.8%) | $0 |
| 25 to 44 Years | 69 (27.6%) | $51,639 |
| 45 to 64 Years | 118 (47.2%) | $75,588 |
| 65+ Years | 61 (24.4%) | $52,813 |
| Total | 250 (100.0%) | $57,500 |
Poverty in Lyons borough
Income Below Poverty by Sex and Age in Lyons borough
With 1.1% poverty level for males and 5.6% for females among the residents of Lyons borough, 25 to 34 year old males and 18 to 24 year old females are the most vulnerable to poverty, with 2 males (4.4%) and 6 females (20.7%) in their respective age groups living below the poverty level.
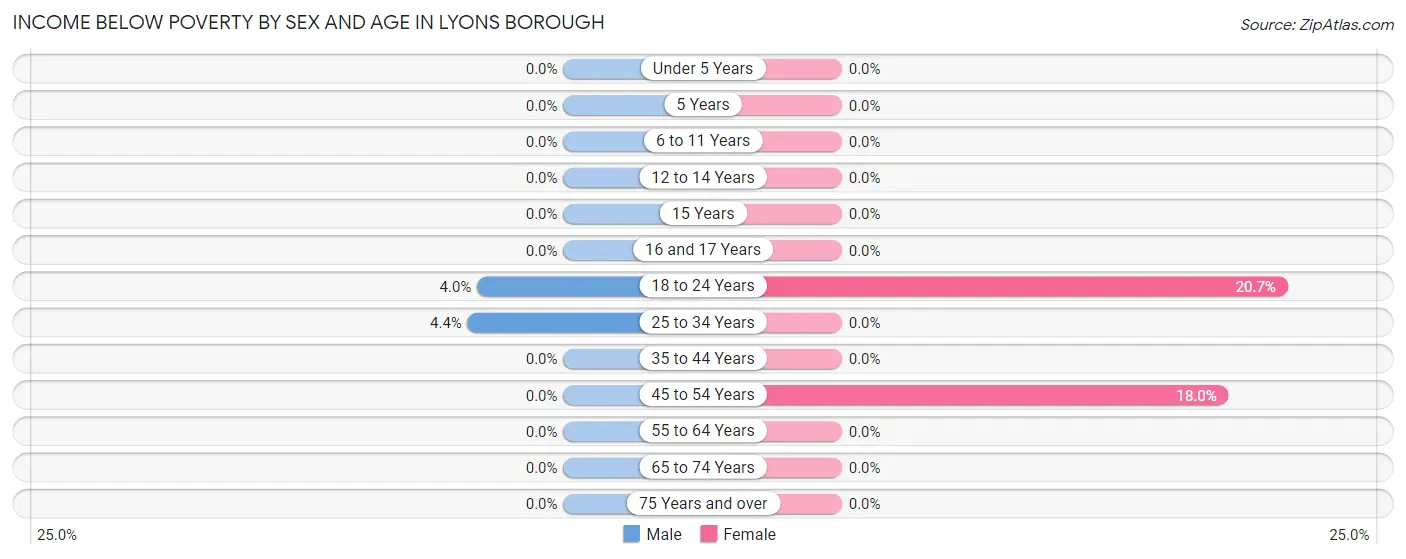
| Age Bracket | Male | Female |
| Under 5 Years | 0 (0.0%) | 0 (0.0%) |
| 5 Years | 0 (0.0%) | 0 (0.0%) |
| 6 to 11 Years | 0 (0.0%) | 0 (0.0%) |
| 12 to 14 Years | 0 (0.0%) | 0 (0.0%) |
| 15 Years | 0 (0.0%) | 0 (0.0%) |
| 16 and 17 Years | 0 (0.0%) | 0 (0.0%) |
| 18 to 24 Years | 1 (4.0%) | 6 (20.7%) |
| 25 to 34 Years | 2 (4.4%) | 0 (0.0%) |
| 35 to 44 Years | 0 (0.0%) | 0 (0.0%) |
| 45 to 54 Years | 0 (0.0%) | 7 (17.9%) |
| 55 to 64 Years | 0 (0.0%) | 0 (0.0%) |
| 65 to 74 Years | 0 (0.0%) | 0 (0.0%) |
| 75 Years and over | 0 (0.0%) | 0 (0.0%) |
| Total | 3 (1.1%) | 13 (5.6%) |
Income Above Poverty by Sex and Age in Lyons borough
According to the poverty statistics in Lyons borough, males aged 6 to 11 years and females aged 16 and 17 years are the age groups that are most secure financially, with 100.0% of males and 100.0% of females in these age groups living above the poverty line.
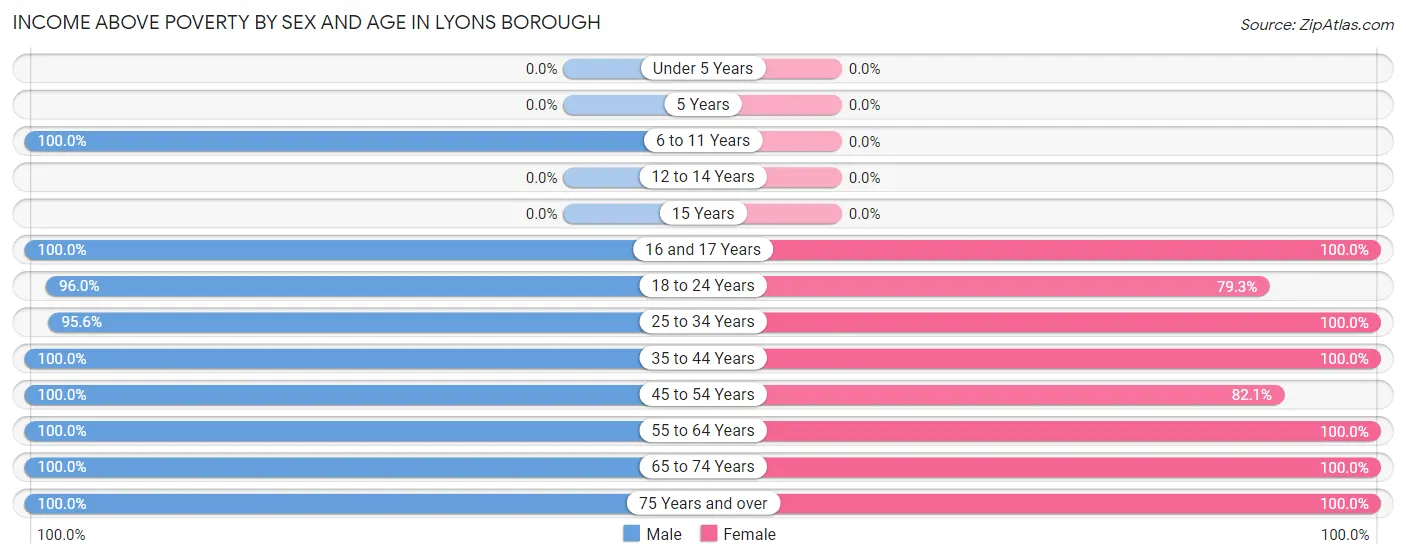
| Age Bracket | Male | Female |
| Under 5 Years | 0 (0.0%) | 0 (0.0%) |
| 5 Years | 0 (0.0%) | 0 (0.0%) |
| 6 to 11 Years | 19 (100.0%) | 0 (0.0%) |
| 12 to 14 Years | 0 (0.0%) | 0 (0.0%) |
| 15 Years | 0 (0.0%) | 0 (0.0%) |
| 16 and 17 Years | 14 (100.0%) | 7 (100.0%) |
| 18 to 24 Years | 24 (96.0%) | 23 (79.3%) |
| 25 to 34 Years | 43 (95.6%) | 6 (100.0%) |
| 35 to 44 Years | 41 (100.0%) | 25 (100.0%) |
| 45 to 54 Years | 32 (100.0%) | 32 (82.1%) |
| 55 to 64 Years | 65 (100.0%) | 62 (100.0%) |
| 65 to 74 Years | 18 (100.0%) | 53 (100.0%) |
| 75 Years and over | 24 (100.0%) | 13 (100.0%) |
| Total | 280 (98.9%) | 221 (94.4%) |
Income Below Poverty Among Married-Couple Families in Lyons borough
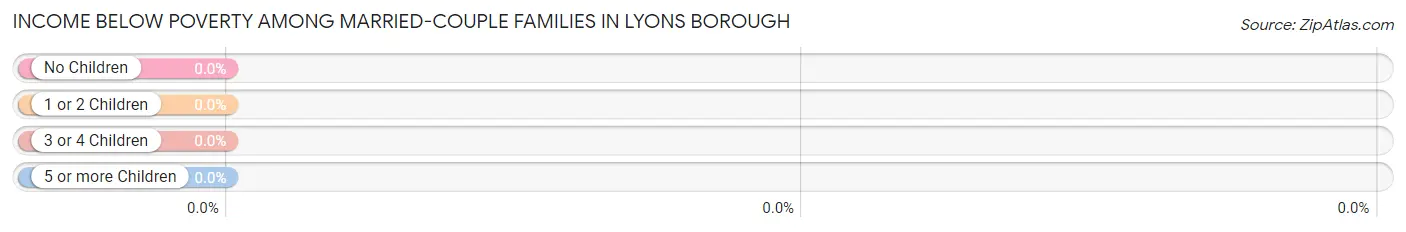
| Children | Above Poverty | Below Poverty |
| No Children | 80 (100.0%) | 0 (0.0%) |
| 1 or 2 Children | 19 (100.0%) | 0 (0.0%) |
| 3 or 4 Children | 0 (0.0%) | 0 (0.0%) |
| 5 or more Children | 0 (0.0%) | 0 (0.0%) |
| Total | 99 (100.0%) | 0 (0.0%) |
Income Below Poverty Among Single-Parent Households in Lyons borough
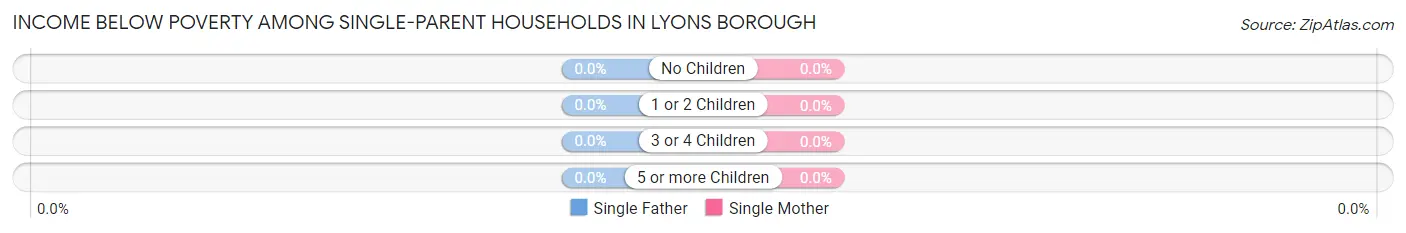
| Children | Single Father | Single Mother |
| No Children | 0 (0.0%) | 0 (0.0%) |
| 1 or 2 Children | 0 (0.0%) | 0 (0.0%) |
| 3 or 4 Children | 0 (0.0%) | 0 (0.0%) |
| 5 or more Children | 0 (0.0%) | 0 (0.0%) |
| Total | 0 (0.0%) | 0 (0.0%) |
Income Below Poverty Among Married-Couple vs Single-Parent Households in Lyons borough
| Children | Married-Couple Families | Single-Parent Households |
| No Children | 0 (0.0%) | 0 (0.0%) |
| 1 or 2 Children | 0 (0.0%) | 0 (0.0%) |
| 3 or 4 Children | 0 (0.0%) | 0 (0.0%) |
| 5 or more Children | 0 (0.0%) | 0 (0.0%) |
| Total | 0 (0.0%) | 0 (0.0%) |
Race in Lyons borough
The most populous races in Lyons borough are White / Caucasian (496 | 95.9%), Two or more Races (17 | 3.3%), and Hispanic or Latino (14 | 2.7%).
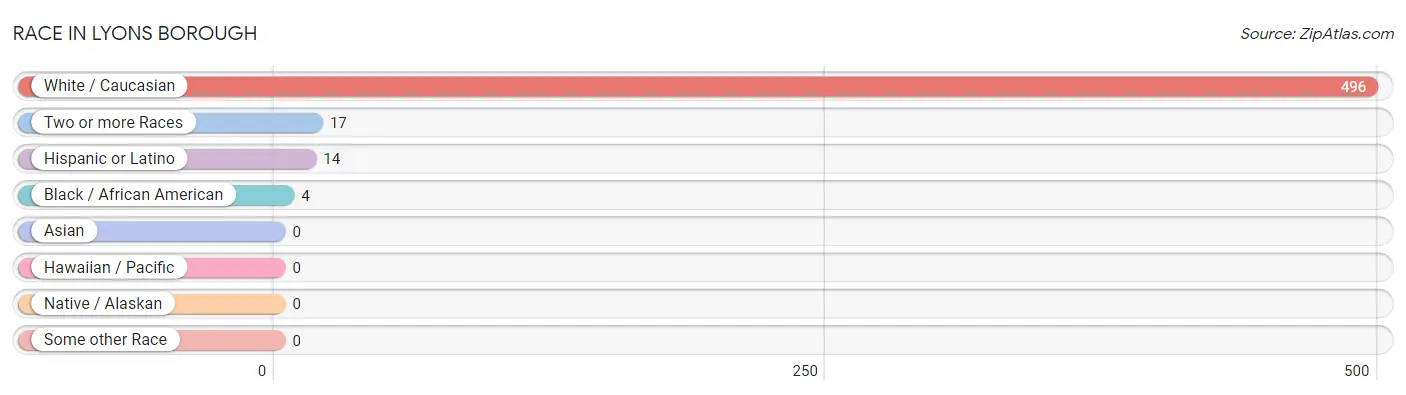
| Race | # Population | % Population |
| Asian | 0 | 0.0% |
| Black / African American | 4 | 0.8% |
| Hawaiian / Pacific | 0 | 0.0% |
| Hispanic or Latino | 14 | 2.7% |
| Native / Alaskan | 0 | 0.0% |
| White / Caucasian | 496 | 95.9% |
| Two or more Races | 17 | 3.3% |
| Some other Race | 0 | 0.0% |
| Total | 517 | 100.0% |
Ancestry in Lyons borough
The most populous ancestries reported in Lyons borough are German (237 | 45.8%), Pennsylvania German (101 | 19.5%), Polish (37 | 7.2%), English (28 | 5.4%), and American (21 | 4.1%), together accounting for 82.0% of all Lyons borough residents.
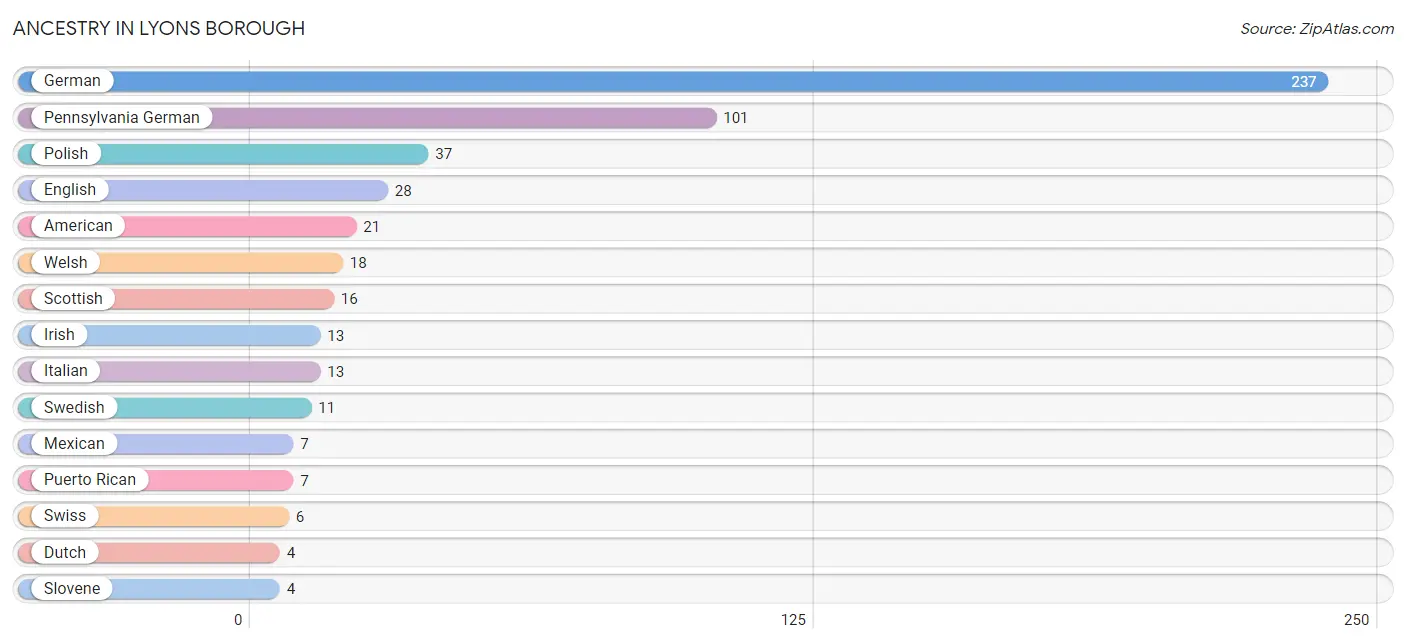
| Ancestry | # Population | % Population |
| American | 21 | 4.1% |
| Dutch | 4 | 0.8% |
| English | 28 | 5.4% |
| German | 237 | 45.8% |
| Irish | 13 | 2.5% |
| Italian | 13 | 2.5% |
| Mexican | 7 | 1.3% |
| Pennsylvania German | 101 | 19.5% |
| Polish | 37 | 7.2% |
| Puerto Rican | 7 | 1.3% |
| Scottish | 16 | 3.1% |
| Slovene | 4 | 0.8% |
| Swedish | 11 | 2.1% |
| Swiss | 6 | 1.2% |
| Welsh | 18 | 3.5% | View All 15 Rows |
Immigrants in Lyons borough

| Immigration Origin | # Population | % Population | View All 0 Rows |
Sex and Age in Lyons borough
Sex and Age in Lyons borough
The most populous age groups in Lyons borough are 40 to 44 Years (34 | 12.0%) for men and 60 to 64 Years (43 | 18.4%) for women.
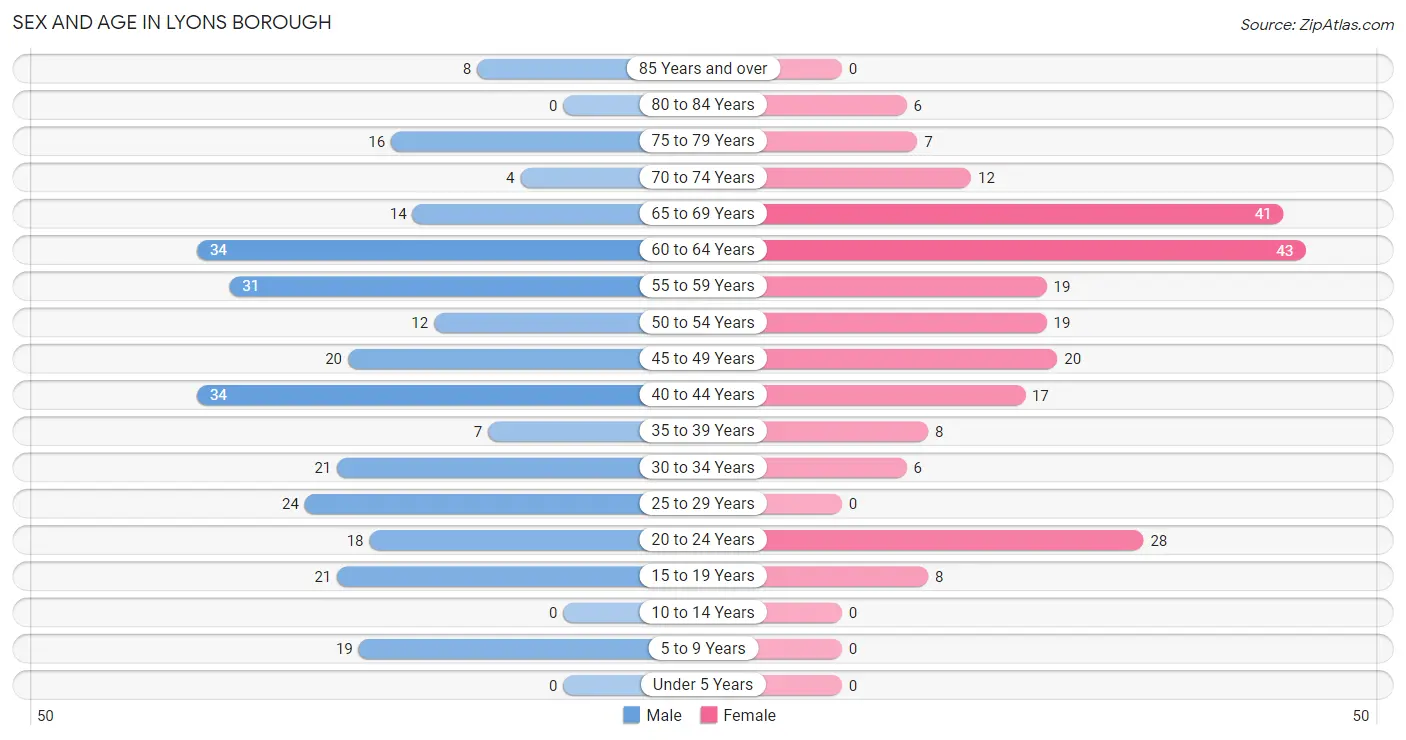
| Age Bracket | Male | Female |
| Under 5 Years | 0 (0.0%) | 0 (0.0%) |
| 5 to 9 Years | 19 (6.7%) | 0 (0.0%) |
| 10 to 14 Years | 0 (0.0%) | 0 (0.0%) |
| 15 to 19 Years | 21 (7.4%) | 8 (3.4%) |
| 20 to 24 Years | 18 (6.4%) | 28 (12.0%) |
| 25 to 29 Years | 24 (8.5%) | 0 (0.0%) |
| 30 to 34 Years | 21 (7.4%) | 6 (2.6%) |
| 35 to 39 Years | 7 (2.5%) | 8 (3.4%) |
| 40 to 44 Years | 34 (12.0%) | 17 (7.3%) |
| 45 to 49 Years | 20 (7.1%) | 20 (8.6%) |
| 50 to 54 Years | 12 (4.2%) | 19 (8.1%) |
| 55 to 59 Years | 31 (11.0%) | 19 (8.1%) |
| 60 to 64 Years | 34 (12.0%) | 43 (18.4%) |
| 65 to 69 Years | 14 (5.0%) | 41 (17.5%) |
| 70 to 74 Years | 4 (1.4%) | 12 (5.1%) |
| 75 to 79 Years | 16 (5.7%) | 7 (3.0%) |
| 80 to 84 Years | 0 (0.0%) | 6 (2.6%) |
| 85 Years and over | 8 (2.8%) | 0 (0.0%) |
| Total | 283 (100.0%) | 234 (100.0%) |
Families and Households in Lyons borough
Median Family Size in Lyons borough
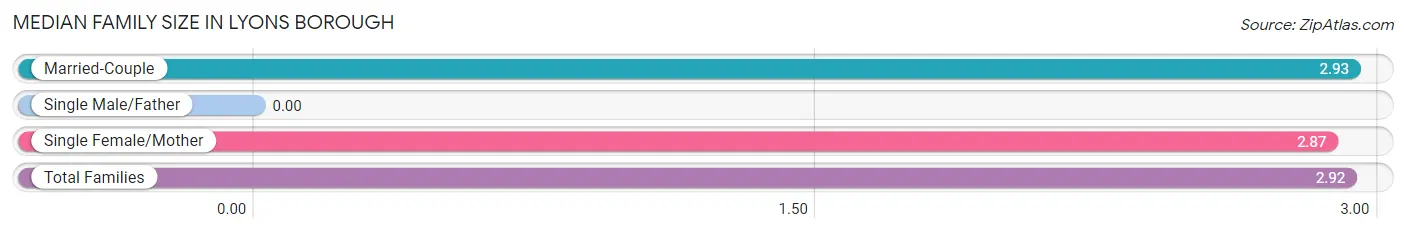
| Family Type | # Families | Family Size |
| Married-Couple | 99 (76.1%) | 2.93 |
| Single Male/Father | 0 (0.0%) | - |
| Single Female/Mother | 31 (23.8%) | 2.87 |
| Total Families | 130 (100.0%) | 2.92 |
Median Household Size in Lyons borough
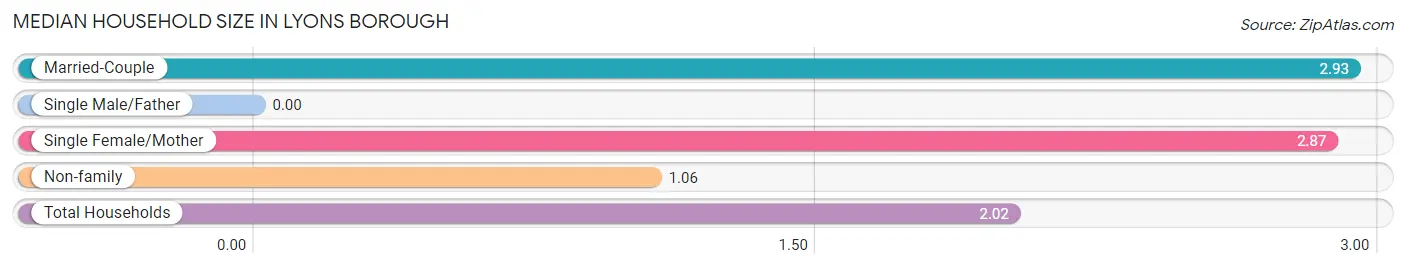
| Household Type | # Households | Household Size |
| Married-Couple | 99 (39.6%) | 2.93 |
| Single Male/Father | 0 (0.0%) | - |
| Single Female/Mother | 31 (12.4%) | 2.87 |
| Non-family | 120 (48.0%) | 1.06 |
| Total Households | 250 (100.0%) | 2.02 |
Household Size by Marriage Status in Lyons borough
Out of a total of 250 households in Lyons borough, 130 (52.0%) are family households, while 120 (48.0%) are nonfamily households. The most numerous type of family households are 3-person households, comprising 74, and the most common type of nonfamily households are 1-person households, comprising 112.
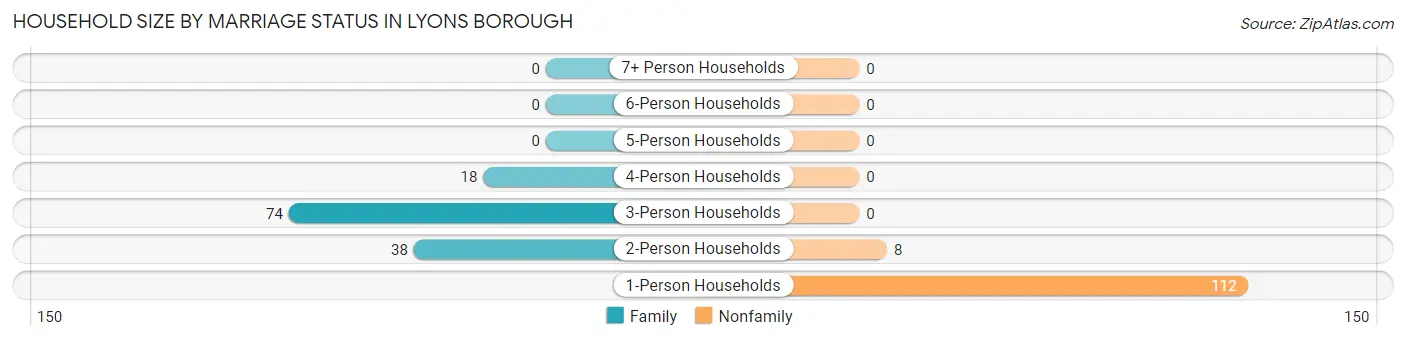
| Household Size | Family Households | Nonfamily Households |
| 1-Person Households | - | 112 (44.8%) |
| 2-Person Households | 38 (15.2%) | 8 (3.2%) |
| 3-Person Households | 74 (29.6%) | 0 (0.0%) |
| 4-Person Households | 18 (7.2%) | 0 (0.0%) |
| 5-Person Households | 0 (0.0%) | 0 (0.0%) |
| 6-Person Households | 0 (0.0%) | 0 (0.0%) |
| 7+ Person Households | 0 (0.0%) | 0 (0.0%) |
| Total | 130 (52.0%) | 120 (48.0%) |
Female Fertility in Lyons borough
Fertility by Age in Lyons borough
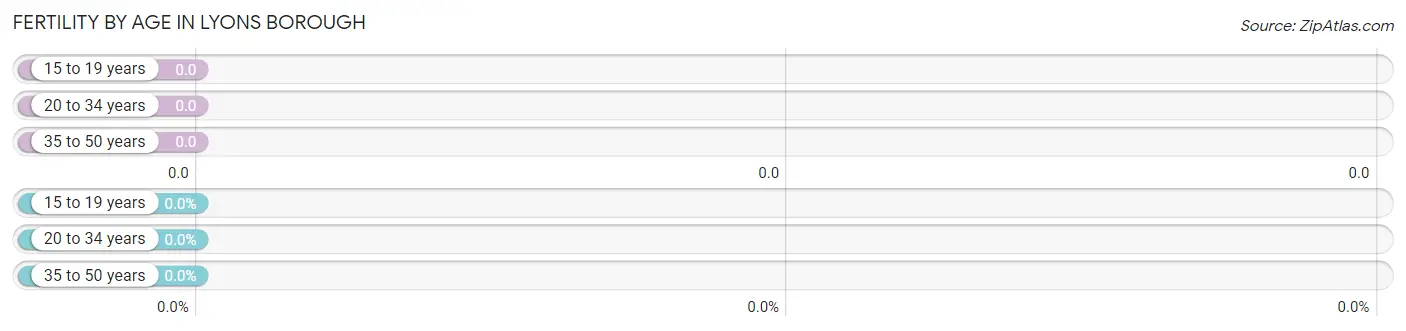
| Age Bracket | Women with Births | Births / 1,000 Women |
| 15 to 19 years | 0 (0.0%) | 0.0 |
| 20 to 34 years | 0 (0.0%) | 0.0 |
| 35 to 50 years | 0 (0.0%) | 0.0 |
| Total | 0 (0.0%) | 0.0 |
Fertility by Age by Marriage Status in Lyons borough
| Age Bracket | Married | Unmarried |
| 15 to 19 years | 0 (0.0%) | 0 (0.0%) |
| 20 to 34 years | 0 (0.0%) | 0 (0.0%) |
| 35 to 50 years | 0 (0.0%) | 0 (0.0%) |
| Total | 0 (0.0%) | 0 (0.0%) |
Fertility by Education in Lyons borough
| Educational Attainment | Women with Births | Births / 1,000 Women |
| Less than High School | 0 (0.0%) | 0.0 |
| High School Diploma | 0 (0.0%) | 0.0 |
| College or Associate's Degree | 0 (0.0%) | 0.0 |
| Bachelor's Degree | 0 (0.0%) | 0.0 |
| Graduate Degree | 0 (0.0%) | 0.0 |
| Total | 0 (0.0%) | 0.0 |
Fertility by Education by Marriage Status in Lyons borough
| Educational Attainment | Married | Unmarried |
| Less than High School | 0 (0.0%) | 0 (0.0%) |
| High School Diploma | 0 (0.0%) | 0 (0.0%) |
| College or Associate's Degree | 0 (0.0%) | 0 (0.0%) |
| Bachelor's Degree | 0 (0.0%) | 0 (0.0%) |
| Graduate Degree | 0 (0.0%) | 0 (0.0%) |
| Total | 0 (0.0%) | 0 (0.0%) |
Employment Characteristics in Lyons borough
Employment by Class of Employer in Lyons borough
Among the 307 employed individuals in Lyons borough, private company employees (262 | 85.3%), not-for-profit organizations (17 | 5.5%), and local government employees (13 | 4.2%) make up the most common classes of employment.
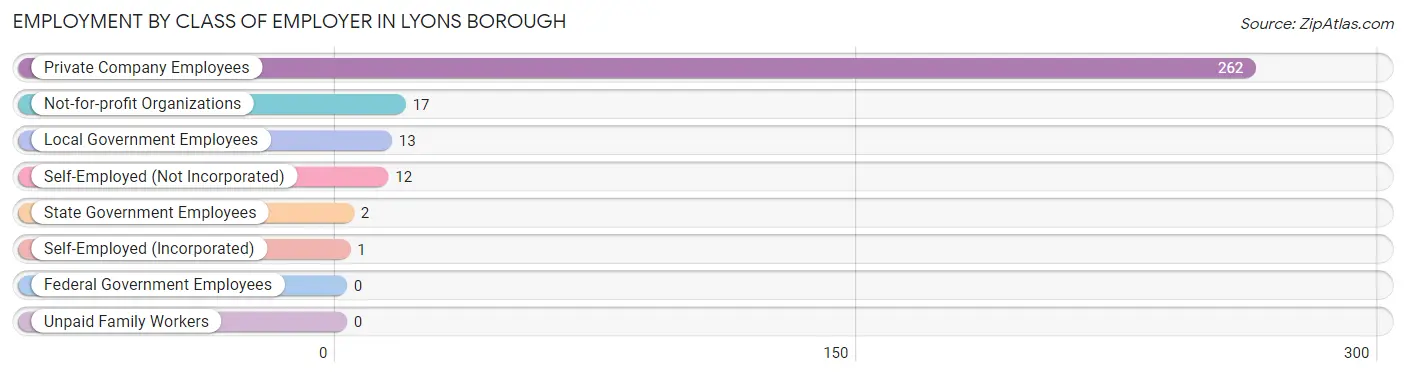
| Employer Class | # Employees | % Employees |
| Private Company Employees | 262 | 85.3% |
| Self-Employed (Incorporated) | 1 | 0.3% |
| Self-Employed (Not Incorporated) | 12 | 3.9% |
| Not-for-profit Organizations | 17 | 5.5% |
| Local Government Employees | 13 | 4.2% |
| State Government Employees | 2 | 0.6% |
| Federal Government Employees | 0 | 0.0% |
| Unpaid Family Workers | 0 | 0.0% |
| Total | 307 | 100.0% |
Employment Status by Age in Lyons borough
According to the labor force statistics for Lyons borough, out of the total population over 16 years of age (498), 63.1% or 314 individuals are in the labor force, with 0.6% or 2 of them unemployed. The age group with the highest labor force participation rate is 35 to 44 years, with 100.0% or 66 individuals in the labor force. Within the labor force, the 20 to 24 years age range has the highest percentage of unemployed individuals, with 2.4% or 1 of them being unemployed.
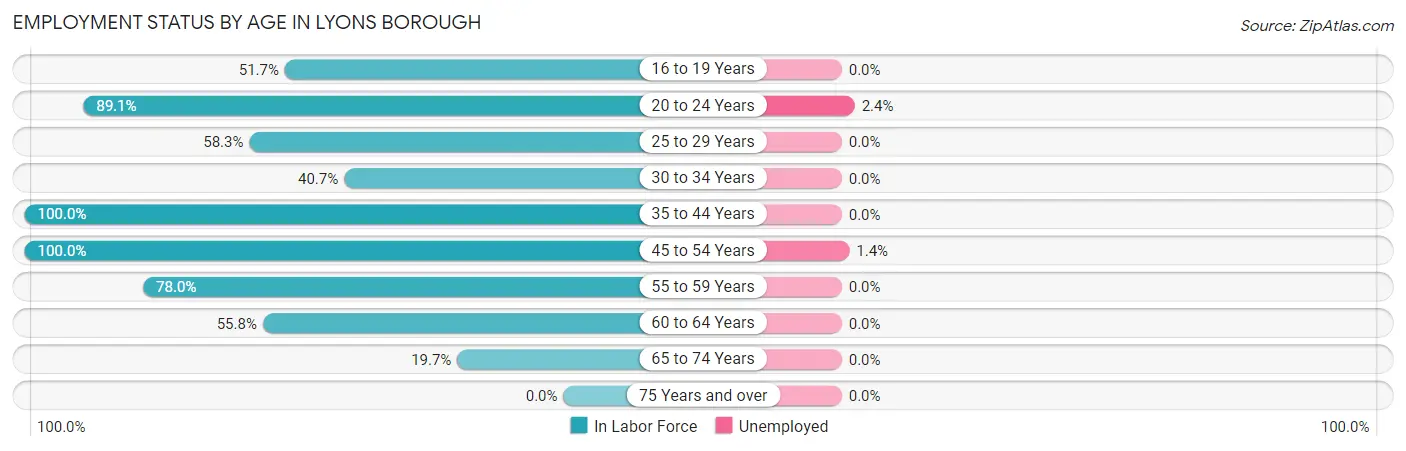
| Age Bracket | In Labor Force | Unemployed |
| 16 to 19 Years | 15 (51.7%) | 0 (0.0%) |
| 20 to 24 Years | 41 (89.1%) | 1 (2.4%) |
| 25 to 29 Years | 14 (58.3%) | 0 (0.0%) |
| 30 to 34 Years | 11 (40.7%) | 0 (0.0%) |
| 35 to 44 Years | 66 (100.0%) | 0 (0.0%) |
| 45 to 54 Years | 71 (100.0%) | 1 (1.4%) |
| 55 to 59 Years | 39 (78.0%) | 0 (0.0%) |
| 60 to 64 Years | 43 (55.8%) | 0 (0.0%) |
| 65 to 74 Years | 14 (19.7%) | 0 (0.0%) |
| 75 Years and over | 0 (0.0%) | 0 (0.0%) |
| Total | 314 (63.1%) | 2 (0.6%) |
Employment Status by Educational Attainment in Lyons borough
According to labor force statistics for Lyons borough, 77.5% of individuals (244) out of the total population between 25 and 64 years of age (315) are in the labor force, with 0.4% or 1 of them being unemployed. The group with the highest labor force participation rate are those with the educational attainment of college / associate degree, with 100.0% or 63 individuals in the labor force. Within the labor force, individuals with bachelor's degree or higher education have the highest percentage of unemployment, with 2.5% or 1 of them being unemployed.
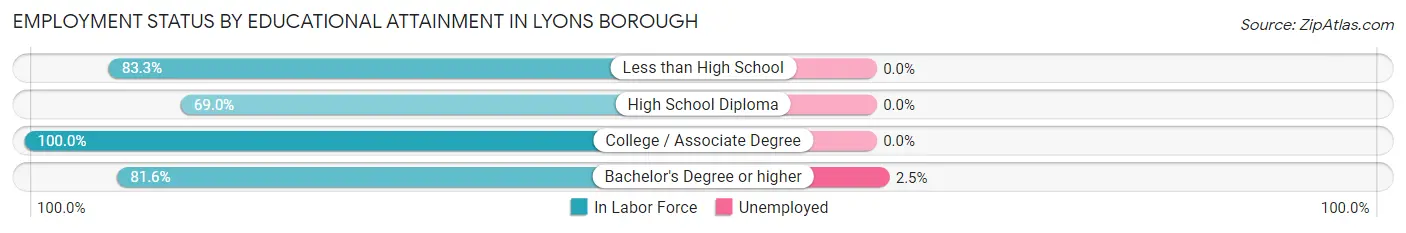
| Educational Attainment | In Labor Force | Unemployed |
| Less than High School | 5 (83.3%) | 0 (0.0%) |
| High School Diploma | 136 (69.0%) | 0 (0.0%) |
| College / Associate Degree | 63 (100.0%) | 0 (0.0%) |
| Bachelor's Degree or higher | 40 (81.6%) | 1 (2.5%) |
| Total | 244 (77.5%) | 1 (0.4%) |
Employment Occupations by Sex in Lyons borough
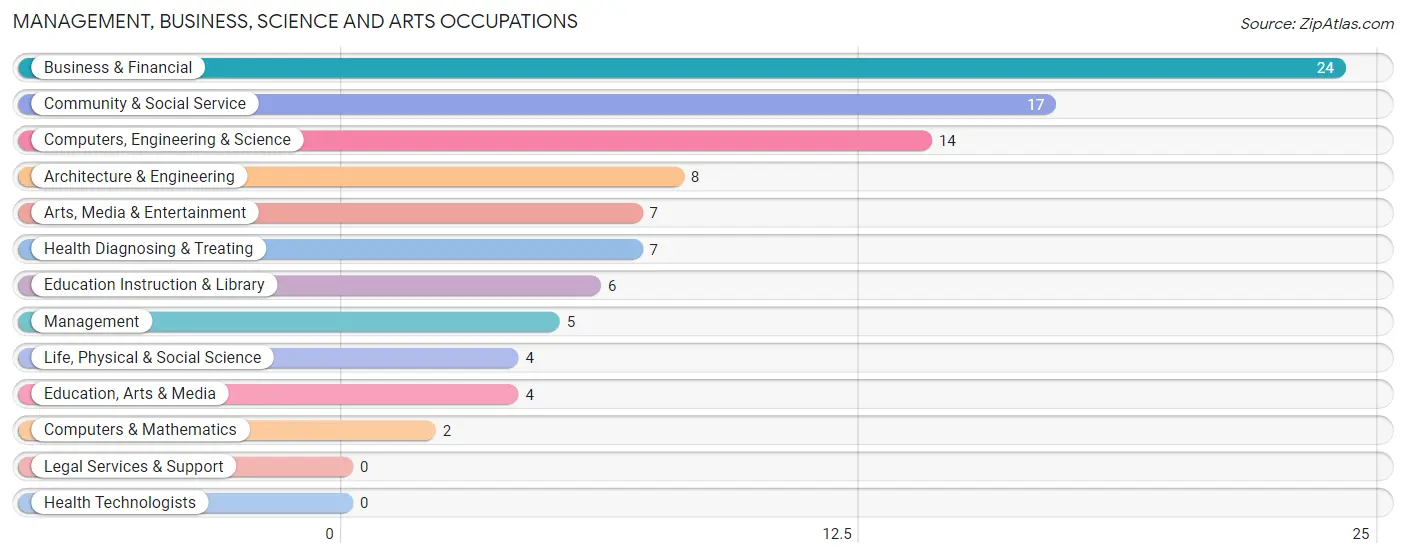
Management, Business, Science and Arts Occupations
The most common Management, Business, Science and Arts occupations in Lyons borough are Business & Financial (24 | 7.7%), Community & Social Service (17 | 5.4%), Computers, Engineering & Science (14 | 4.5%), Architecture & Engineering (8 | 2.6%), and Arts, Media & Entertainment (7 | 2.2%).
Management, Business, Science and Arts Occupations by Sex
Within the Management, Business, Science and Arts occupations in Lyons borough, the most male-oriented occupations are Management (100.0%), Computers & Mathematics (100.0%), and Architecture & Engineering (100.0%), while the most female-oriented occupations are Business & Financial (100.0%), Life, Physical & Social Science (100.0%), and Education, Arts & Media (100.0%).
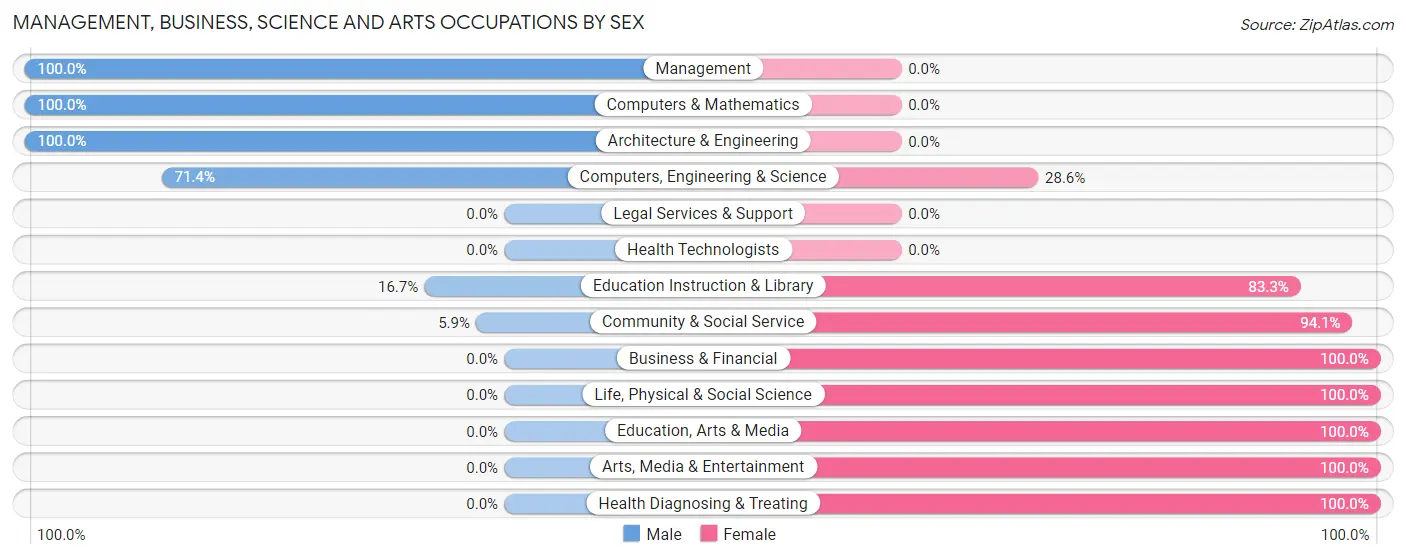
| Occupation | Male | Female |
| Management | 5 (100.0%) | 0 (0.0%) |
| Business & Financial | 0 (0.0%) | 24 (100.0%) |
| Computers, Engineering & Science | 10 (71.4%) | 4 (28.6%) |
| Computers & Mathematics | 2 (100.0%) | 0 (0.0%) |
| Architecture & Engineering | 8 (100.0%) | 0 (0.0%) |
| Life, Physical & Social Science | 0 (0.0%) | 4 (100.0%) |
| Community & Social Service | 1 (5.9%) | 16 (94.1%) |
| Education, Arts & Media | 0 (0.0%) | 4 (100.0%) |
| Legal Services & Support | 0 (0.0%) | 0 (0.0%) |
| Education Instruction & Library | 1 (16.7%) | 5 (83.3%) |
| Arts, Media & Entertainment | 0 (0.0%) | 7 (100.0%) |
| Health Diagnosing & Treating | 0 (0.0%) | 7 (100.0%) |
| Health Technologists | 0 (0.0%) | 0 (0.0%) |
| Total (Category) | 16 (23.9%) | 51 (76.1%) |
| Total (Overall) | 162 (51.9%) | 150 (48.1%) |
Services Occupations
The most common Services occupations in Lyons borough are Food Preparation & Serving (21 | 6.7%), and Personal Care & Service (6 | 1.9%).
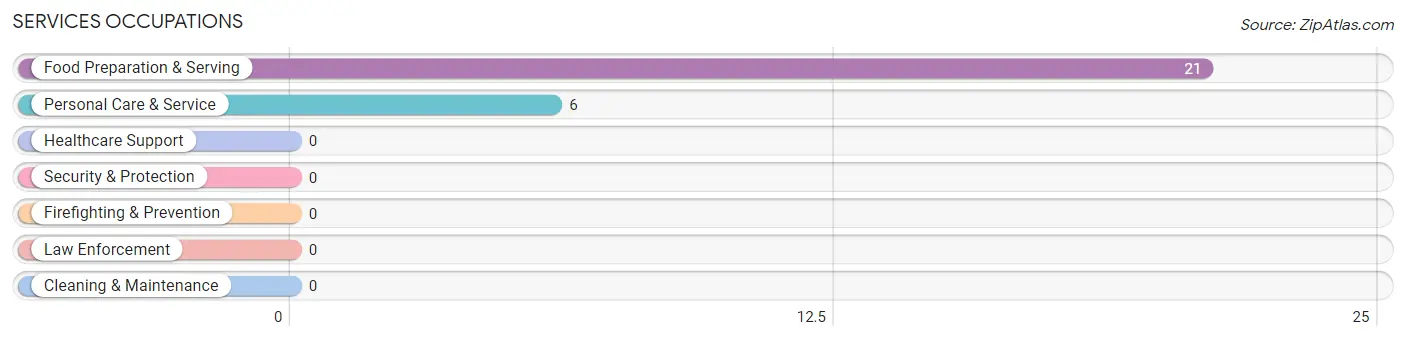
Services Occupations by Sex
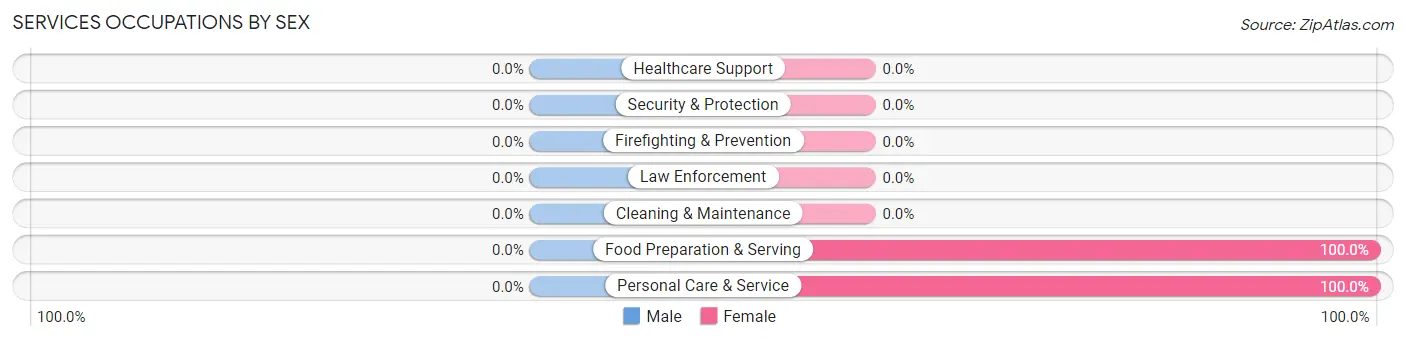
| Occupation | Male | Female |
| Healthcare Support | 0 (0.0%) | 0 (0.0%) |
| Security & Protection | 0 (0.0%) | 0 (0.0%) |
| Firefighting & Prevention | 0 (0.0%) | 0 (0.0%) |
| Law Enforcement | 0 (0.0%) | 0 (0.0%) |
| Food Preparation & Serving | 0 (0.0%) | 21 (100.0%) |
| Cleaning & Maintenance | 0 (0.0%) | 0 (0.0%) |
| Personal Care & Service | 0 (0.0%) | 6 (100.0%) |
| Total (Category) | 0 (0.0%) | 27 (100.0%) |
| Total (Overall) | 162 (51.9%) | 150 (48.1%) |
Sales and Office Occupations
The most common Sales and Office occupations in Lyons borough are Office & Administration (65 | 20.8%), and Sales & Related (50 | 16.0%).
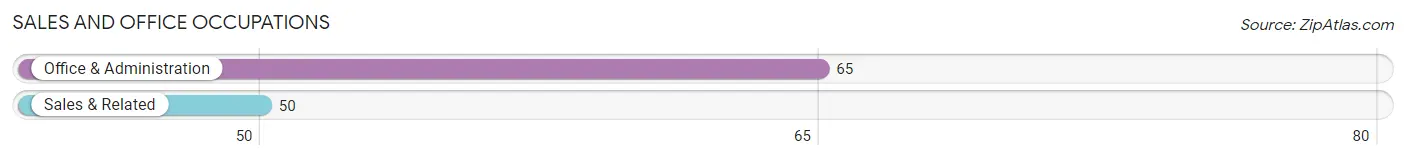
Sales and Office Occupations by Sex
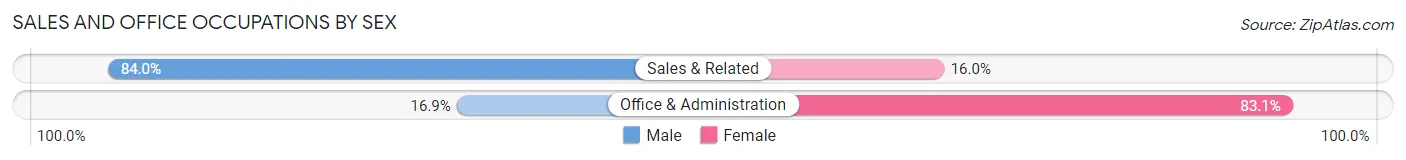
| Occupation | Male | Female |
| Sales & Related | 42 (84.0%) | 8 (16.0%) |
| Office & Administration | 11 (16.9%) | 54 (83.1%) |
| Total (Category) | 53 (46.1%) | 62 (53.9%) |
| Total (Overall) | 162 (51.9%) | 150 (48.1%) |
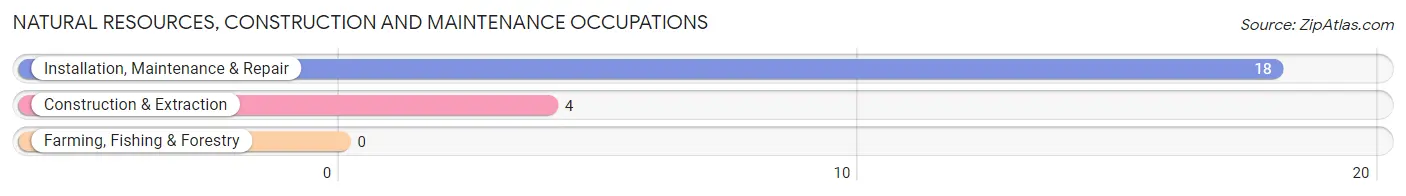
Natural Resources, Construction and Maintenance Occupations
The most common Natural Resources, Construction and Maintenance occupations in Lyons borough are Installation, Maintenance & Repair (18 | 5.8%), and Construction & Extraction (4 | 1.3%).
Natural Resources, Construction and Maintenance Occupations by Sex
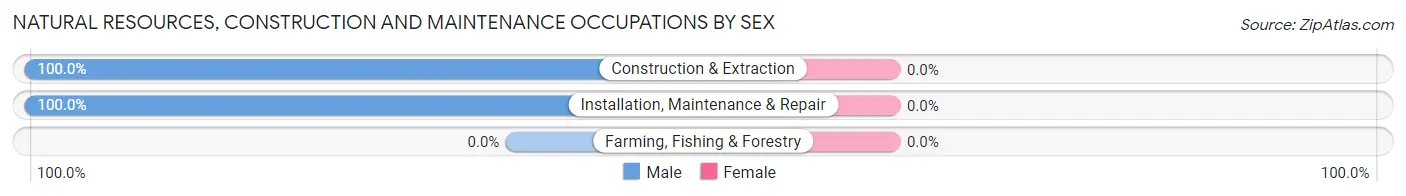
| Occupation | Male | Female |
| Farming, Fishing & Forestry | 0 (0.0%) | 0 (0.0%) |
| Construction & Extraction | 4 (100.0%) | 0 (0.0%) |
| Installation, Maintenance & Repair | 18 (100.0%) | 0 (0.0%) |
| Total (Category) | 22 (100.0%) | 0 (0.0%) |
| Total (Overall) | 162 (51.9%) | 150 (48.1%) |
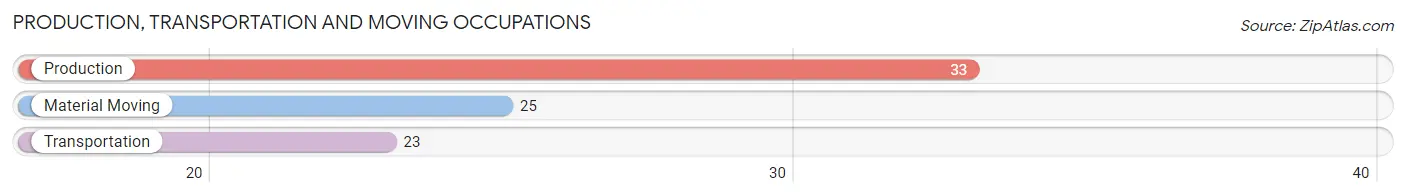
Production, Transportation and Moving Occupations
The most common Production, Transportation and Moving occupations in Lyons borough are Production (33 | 10.6%), Material Moving (25 | 8.0%), and Transportation (23 | 7.4%).
Production, Transportation and Moving Occupations by Sex
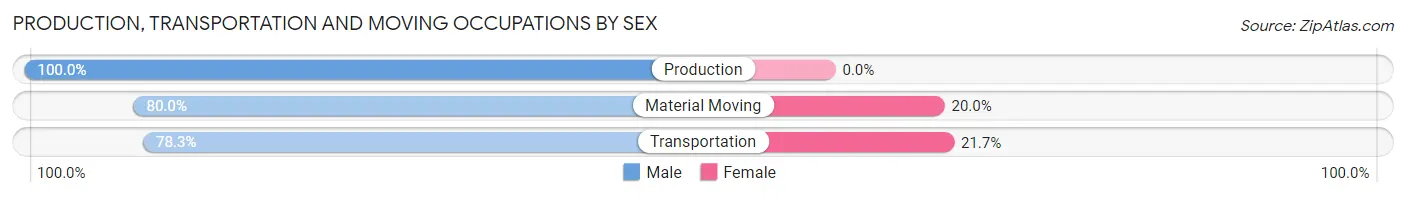
| Occupation | Male | Female |
| Production | 33 (100.0%) | 0 (0.0%) |
| Transportation | 18 (78.3%) | 5 (21.7%) |
| Material Moving | 20 (80.0%) | 5 (20.0%) |
| Total (Category) | 71 (87.6%) | 10 (12.3%) |
| Total (Overall) | 162 (51.9%) | 150 (48.1%) |
Employment Industries by Sex in Lyons borough
Employment Industries in Lyons borough
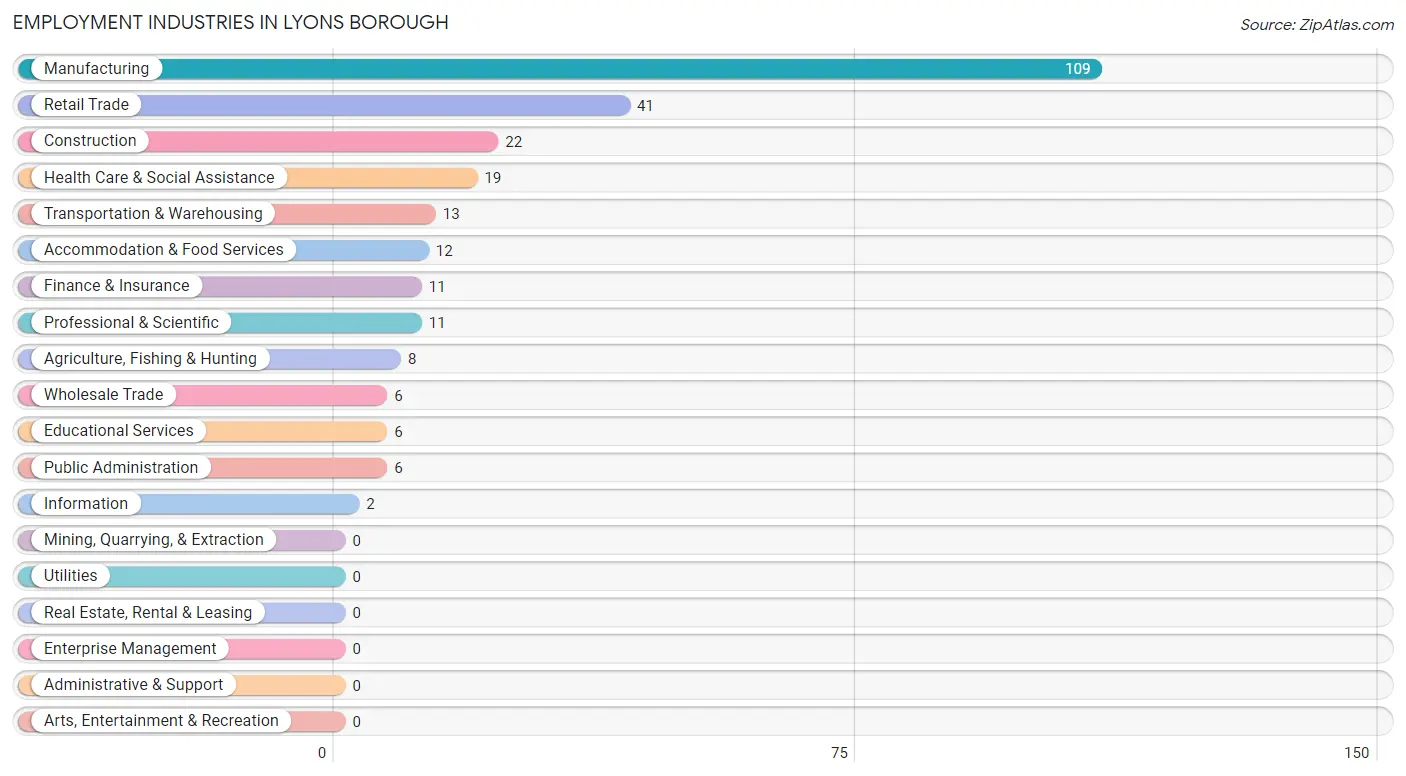
The major employment industries in Lyons borough include Manufacturing (109 | 34.9%), Retail Trade (41 | 13.1%), Construction (22 | 7.0%), Health Care & Social Assistance (19 | 6.1%), and Transportation & Warehousing (13 | 4.2%).
Employment Industries by Sex in Lyons borough
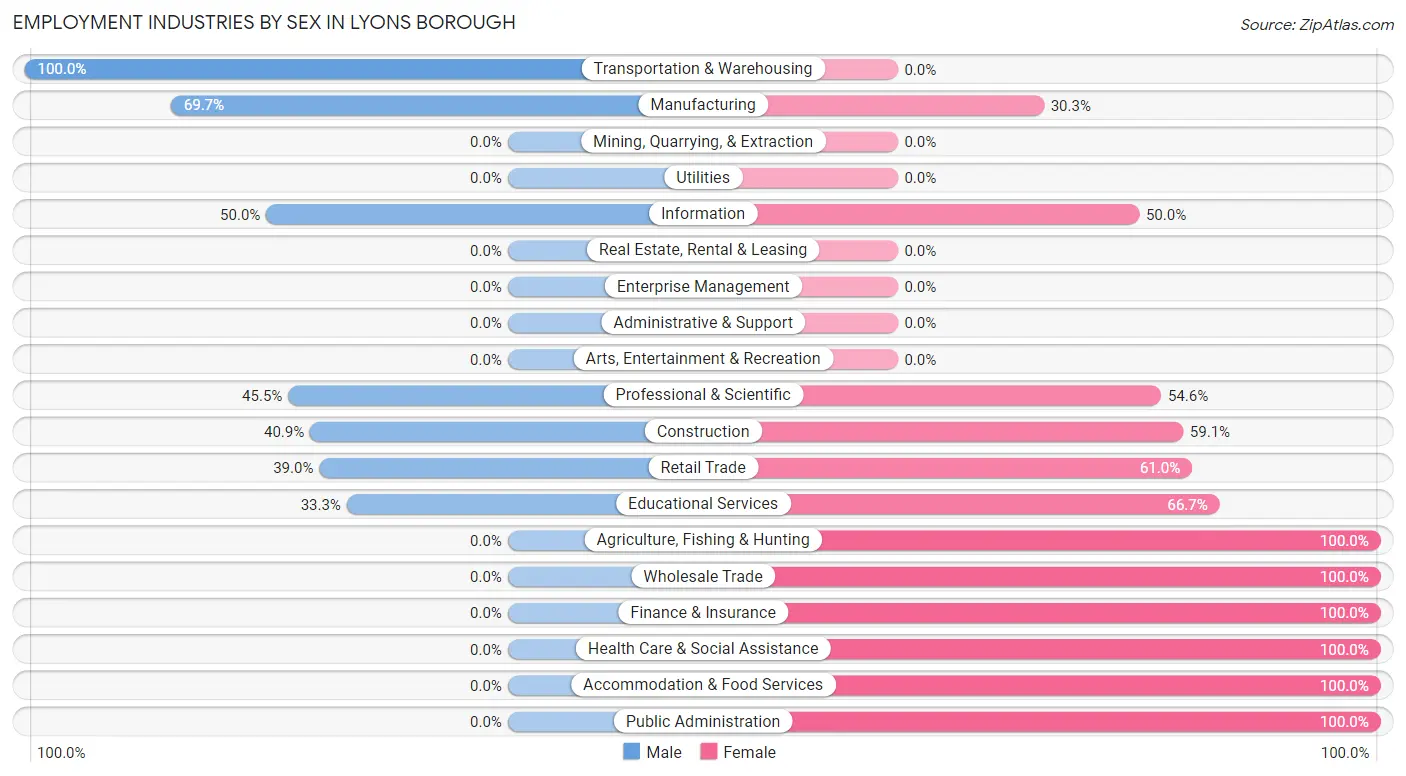
The Lyons borough industries that see more men than women are Transportation & Warehousing (100.0%), Manufacturing (69.7%), and Information (50.0%), whereas the industries that tend to have a higher number of women are Agriculture, Fishing & Hunting (100.0%), Wholesale Trade (100.0%), and Finance & Insurance (100.0%).
| Industry | Male | Female |
| Agriculture, Fishing & Hunting | 0 (0.0%) | 8 (100.0%) |
| Mining, Quarrying, & Extraction | 0 (0.0%) | 0 (0.0%) |
| Construction | 9 (40.9%) | 13 (59.1%) |
| Manufacturing | 76 (69.7%) | 33 (30.3%) |
| Wholesale Trade | 0 (0.0%) | 6 (100.0%) |
| Retail Trade | 16 (39.0%) | 25 (61.0%) |
| Transportation & Warehousing | 13 (100.0%) | 0 (0.0%) |
| Utilities | 0 (0.0%) | 0 (0.0%) |
| Information | 1 (50.0%) | 1 (50.0%) |
| Finance & Insurance | 0 (0.0%) | 11 (100.0%) |
| Real Estate, Rental & Leasing | 0 (0.0%) | 0 (0.0%) |
| Professional & Scientific | 5 (45.5%) | 6 (54.5%) |
| Enterprise Management | 0 (0.0%) | 0 (0.0%) |
| Administrative & Support | 0 (0.0%) | 0 (0.0%) |
| Educational Services | 2 (33.3%) | 4 (66.7%) |
| Health Care & Social Assistance | 0 (0.0%) | 19 (100.0%) |
| Arts, Entertainment & Recreation | 0 (0.0%) | 0 (0.0%) |
| Accommodation & Food Services | 0 (0.0%) | 12 (100.0%) |
| Public Administration | 0 (0.0%) | 6 (100.0%) |
| Total | 162 (51.9%) | 150 (48.1%) |
Education in Lyons borough
School Enrollment in Lyons borough
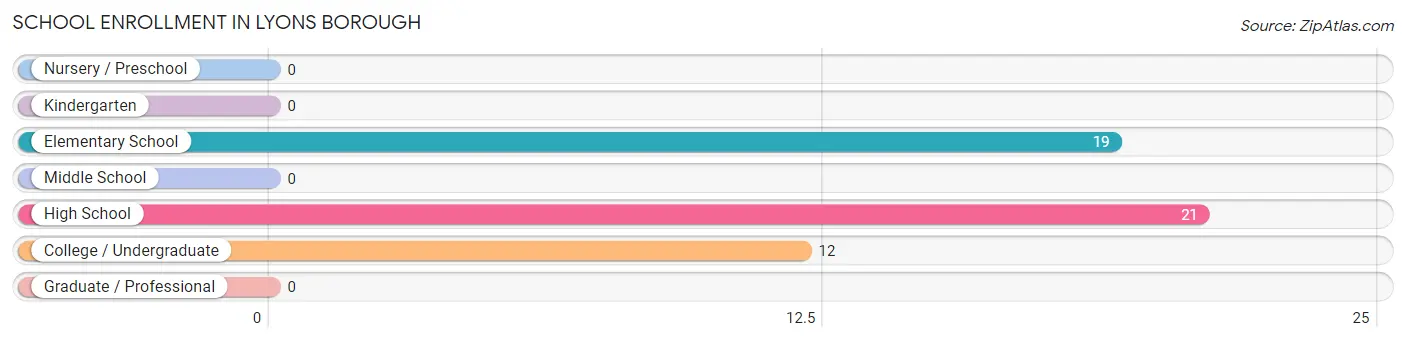
The most common levels of schooling among the 52 students in Lyons borough are high school (21 | 40.4%), elementary school (19 | 36.5%), and college / undergraduate (12 | 23.1%).
| School Level | # Students | % Students |
| Nursery / Preschool | 0 | 0.0% |
| Kindergarten | 0 | 0.0% |
| Elementary School | 19 | 36.5% |
| Middle School | 0 | 0.0% |
| High School | 21 | 40.4% |
| College / Undergraduate | 12 | 23.1% |
| Graduate / Professional | 0 | 0.0% |
| Total | 52 | 100.0% |
School Enrollment by Age by Funding Source in Lyons borough
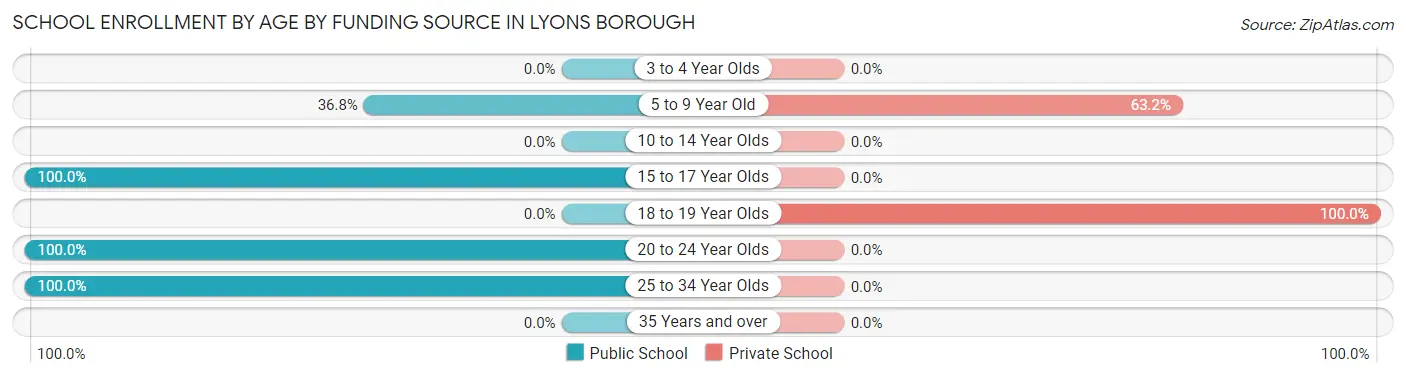
Out of a total of 52 students who are enrolled in schools in Lyons borough, 19 (36.5%) attend a private institution, while the remaining 33 (63.5%) are enrolled in public schools. The age group of 18 to 19 year olds has the highest likelihood of being enrolled in private schools, with 7 (100.0% in the age bracket) enrolled. Conversely, the age group of 15 to 17 year olds has the lowest likelihood of being enrolled in a private school, with 21 (100.0% in the age bracket) attending a public institution.
| Age Bracket | Public School | Private School |
| 3 to 4 Year Olds | 0 (0.0%) | 0 (0.0%) |
| 5 to 9 Year Old | 7 (36.8%) | 12 (63.2%) |
| 10 to 14 Year Olds | 0 (0.0%) | 0 (0.0%) |
| 15 to 17 Year Olds | 21 (100.0%) | 0 (0.0%) |
| 18 to 19 Year Olds | 0 (0.0%) | 7 (100.0%) |
| 20 to 24 Year Olds | 4 (100.0%) | 0 (0.0%) |
| 25 to 34 Year Olds | 1 (100.0%) | 0 (0.0%) |
| 35 Years and over | 0 (0.0%) | 0 (0.0%) |
| Total | 33 (63.5%) | 19 (36.5%) |
Educational Attainment by Field of Study in Lyons borough
Science & technology (22 | 24.4%), education (21 | 23.3%), social sciences (10 | 11.1%), liberal arts & history (10 | 11.1%), and visual & performing arts (10 | 11.1%) are the most common fields of study among 90 individuals in Lyons borough who have obtained a bachelor's degree or higher.
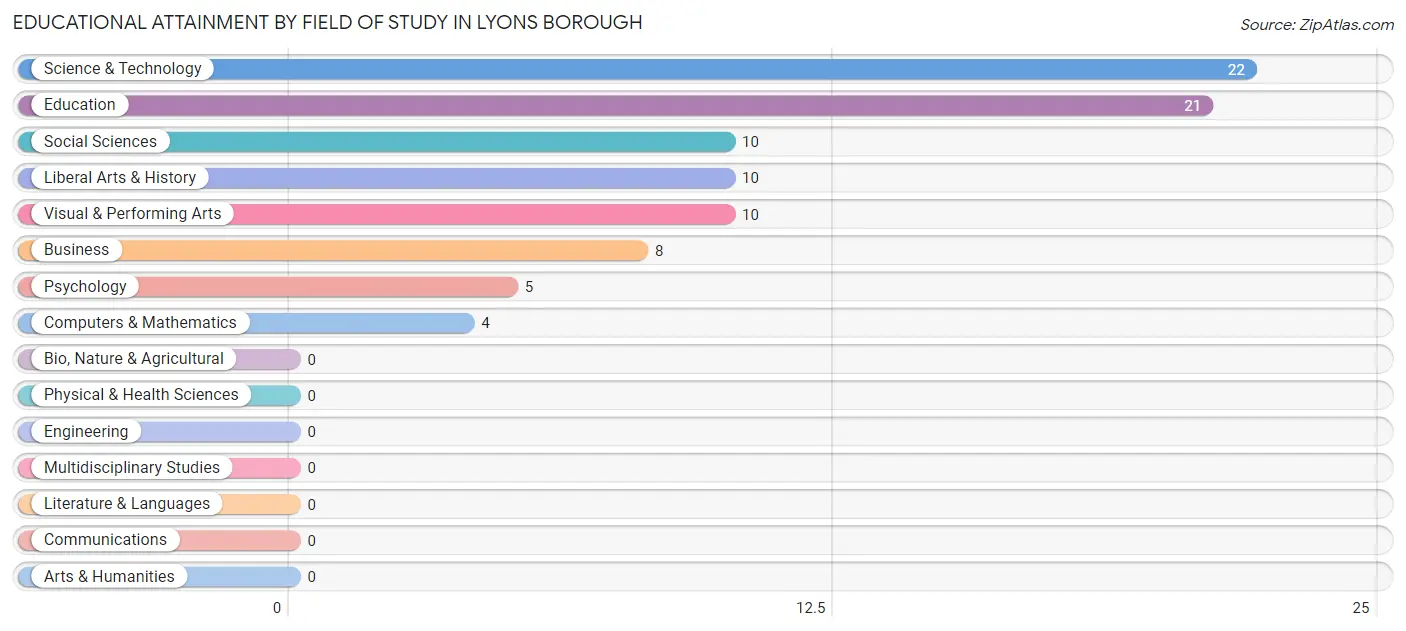
| Field of Study | # Graduates | % Graduates |
| Computers & Mathematics | 4 | 4.4% |
| Bio, Nature & Agricultural | 0 | 0.0% |
| Physical & Health Sciences | 0 | 0.0% |
| Psychology | 5 | 5.6% |
| Social Sciences | 10 | 11.1% |
| Engineering | 0 | 0.0% |
| Multidisciplinary Studies | 0 | 0.0% |
| Science & Technology | 22 | 24.4% |
| Business | 8 | 8.9% |
| Education | 21 | 23.3% |
| Literature & Languages | 0 | 0.0% |
| Liberal Arts & History | 10 | 11.1% |
| Visual & Performing Arts | 10 | 11.1% |
| Communications | 0 | 0.0% |
| Arts & Humanities | 0 | 0.0% |
| Total | 90 | 100.0% |
Transportation & Commute in Lyons borough
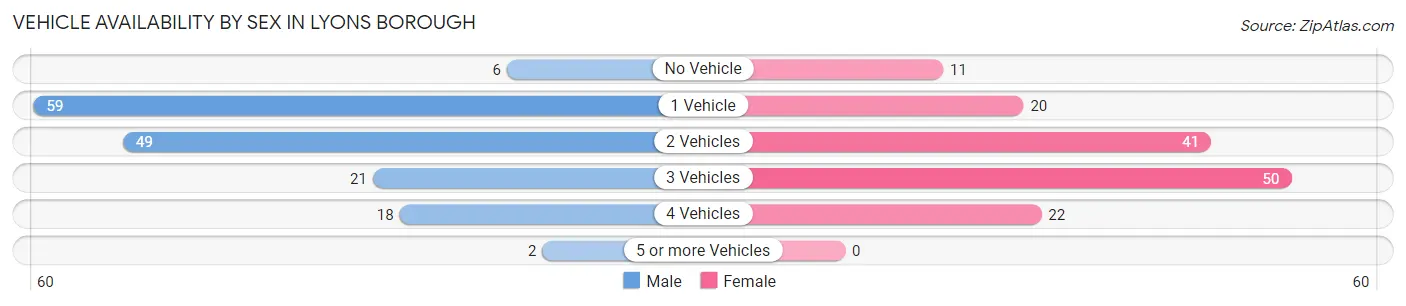
Vehicle Availability by Sex in Lyons borough
The most prevalent vehicle ownership categories in Lyons borough are males with 1 vehicle (59, accounting for 38.1%) and females with 1 vehicle (20, making up 41.0%).
| Vehicles Available | Male | Female |
| No Vehicle | 6 (3.9%) | 11 (7.6%) |
| 1 Vehicle | 59 (38.1%) | 20 (13.9%) |
| 2 Vehicles | 49 (31.6%) | 41 (28.5%) |
| 3 Vehicles | 21 (13.6%) | 50 (34.7%) |
| 4 Vehicles | 18 (11.6%) | 22 (15.3%) |
| 5 or more Vehicles | 2 (1.3%) | 0 (0.0%) |
| Total | 155 (100.0%) | 144 (100.0%) |
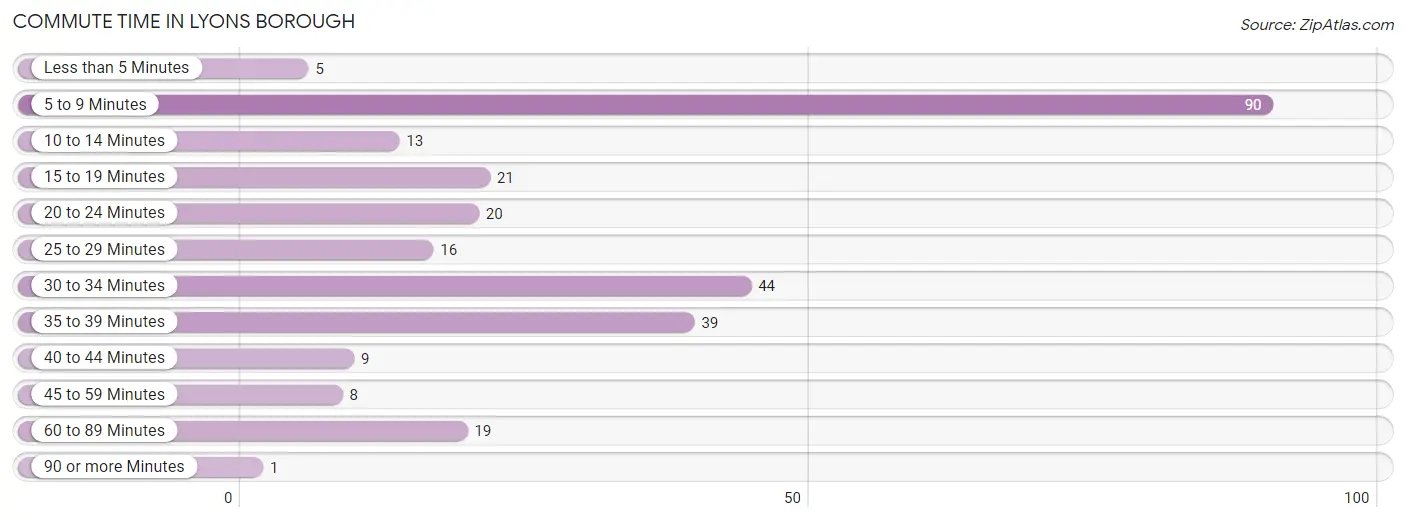
Commute Time in Lyons borough
The most frequently occuring commute durations in Lyons borough are 5 to 9 minutes (90 commuters, 31.6%), 30 to 34 minutes (44 commuters, 15.4%), and 35 to 39 minutes (39 commuters, 13.7%).
| Commute Time | # Commuters | % Commuters |
| Less than 5 Minutes | 5 | 1.8% |
| 5 to 9 Minutes | 90 | 31.6% |
| 10 to 14 Minutes | 13 | 4.6% |
| 15 to 19 Minutes | 21 | 7.4% |
| 20 to 24 Minutes | 20 | 7.0% |
| 25 to 29 Minutes | 16 | 5.6% |
| 30 to 34 Minutes | 44 | 15.4% |
| 35 to 39 Minutes | 39 | 13.7% |
| 40 to 44 Minutes | 9 | 3.2% |
| 45 to 59 Minutes | 8 | 2.8% |
| 60 to 89 Minutes | 19 | 6.7% |
| 90 or more Minutes | 1 | 0.4% |
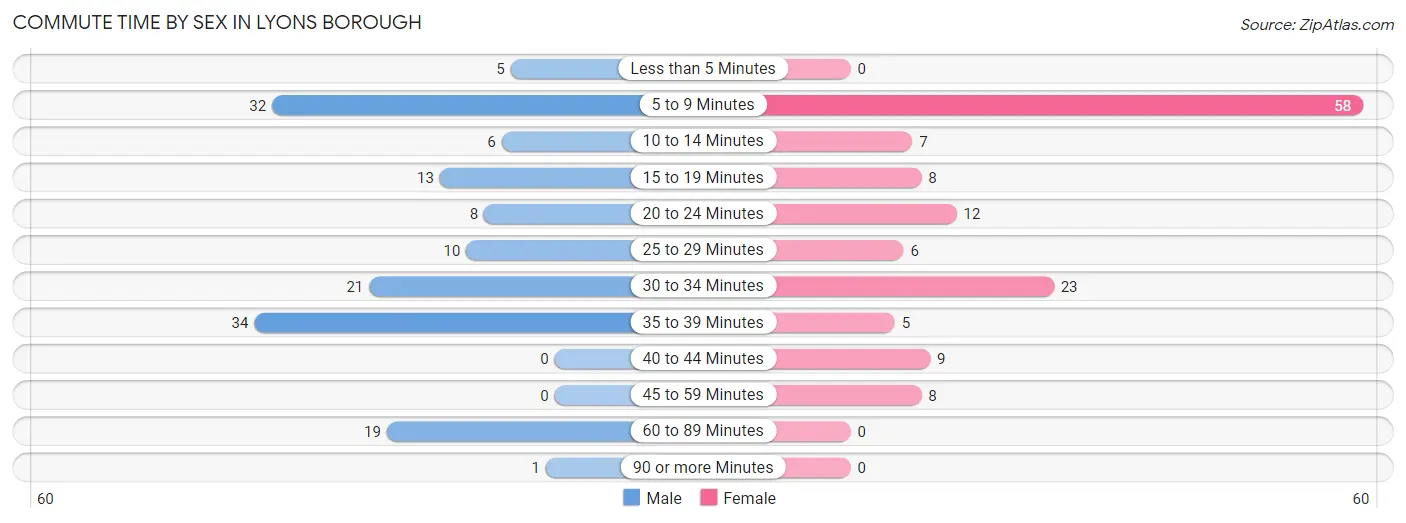
Commute Time by Sex in Lyons borough
The most common commute times in Lyons borough are 35 to 39 minutes (34 commuters, 22.8%) for males and 5 to 9 minutes (58 commuters, 42.6%) for females.
| Commute Time | Male | Female |
| Less than 5 Minutes | 5 (3.4%) | 0 (0.0%) |
| 5 to 9 Minutes | 32 (21.5%) | 58 (42.6%) |
| 10 to 14 Minutes | 6 (4.0%) | 7 (5.1%) |
| 15 to 19 Minutes | 13 (8.7%) | 8 (5.9%) |
| 20 to 24 Minutes | 8 (5.4%) | 12 (8.8%) |
| 25 to 29 Minutes | 10 (6.7%) | 6 (4.4%) |
| 30 to 34 Minutes | 21 (14.1%) | 23 (16.9%) |
| 35 to 39 Minutes | 34 (22.8%) | 5 (3.7%) |
| 40 to 44 Minutes | 0 (0.0%) | 9 (6.6%) |
| 45 to 59 Minutes | 0 (0.0%) | 8 (5.9%) |
| 60 to 89 Minutes | 19 (12.8%) | 0 (0.0%) |
| 90 or more Minutes | 1 (0.7%) | 0 (0.0%) |
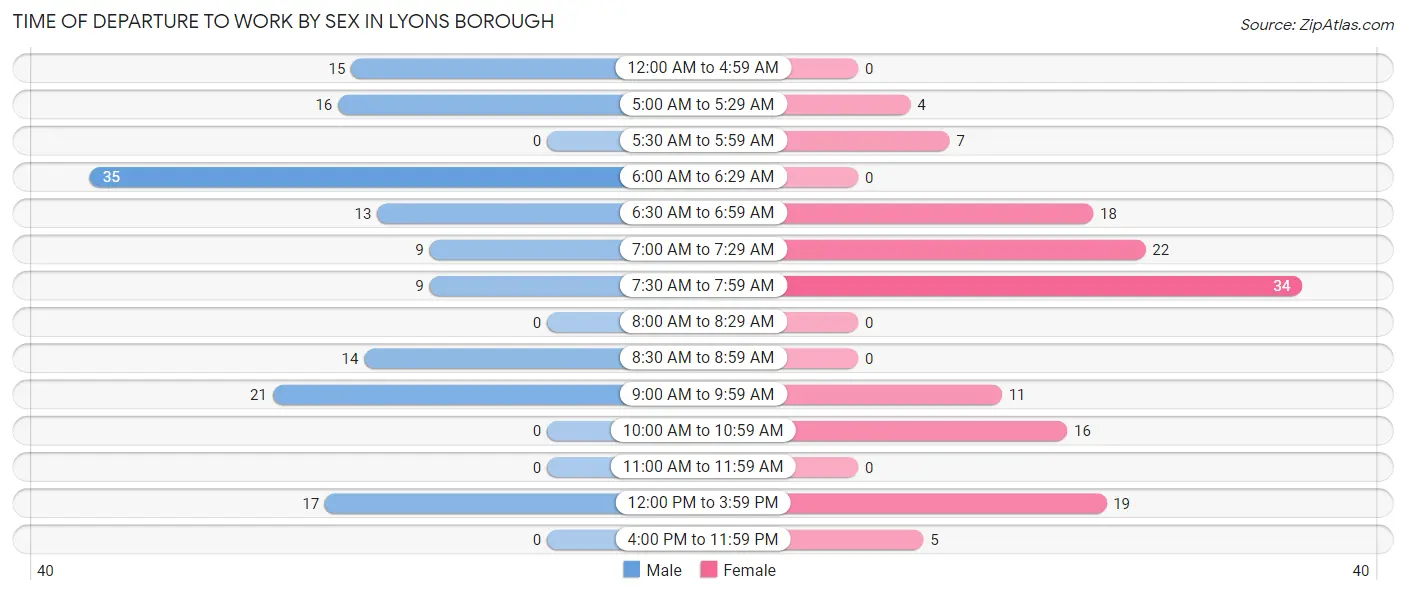
Time of Departure to Work by Sex in Lyons borough
The most frequent times of departure to work in Lyons borough are 6:00 AM to 6:29 AM (35, 23.5%) for males and 7:30 AM to 7:59 AM (34, 25.0%) for females.
| Time of Departure | Male | Female |
| 12:00 AM to 4:59 AM | 15 (10.1%) | 0 (0.0%) |
| 5:00 AM to 5:29 AM | 16 (10.7%) | 4 (2.9%) |
| 5:30 AM to 5:59 AM | 0 (0.0%) | 7 (5.1%) |
| 6:00 AM to 6:29 AM | 35 (23.5%) | 0 (0.0%) |
| 6:30 AM to 6:59 AM | 13 (8.7%) | 18 (13.2%) |
| 7:00 AM to 7:29 AM | 9 (6.0%) | 22 (16.2%) |
| 7:30 AM to 7:59 AM | 9 (6.0%) | 34 (25.0%) |
| 8:00 AM to 8:29 AM | 0 (0.0%) | 0 (0.0%) |
| 8:30 AM to 8:59 AM | 14 (9.4%) | 0 (0.0%) |
| 9:00 AM to 9:59 AM | 21 (14.1%) | 11 (8.1%) |
| 10:00 AM to 10:59 AM | 0 (0.0%) | 16 (11.8%) |
| 11:00 AM to 11:59 AM | 0 (0.0%) | 0 (0.0%) |
| 12:00 PM to 3:59 PM | 17 (11.4%) | 19 (14.0%) |
| 4:00 PM to 11:59 PM | 0 (0.0%) | 5 (3.7%) |
| Total | 149 (100.0%) | 136 (100.0%) |
Housing Occupancy in Lyons borough
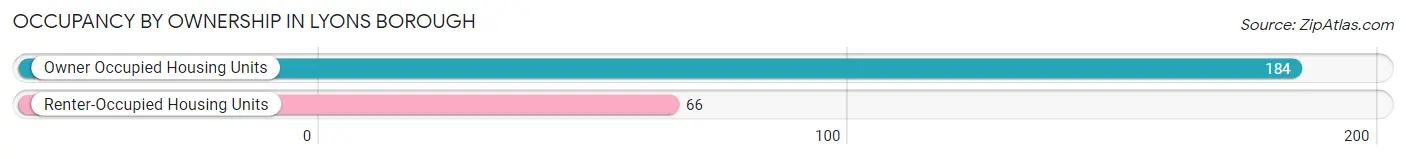
Occupancy by Ownership in Lyons borough
Of the total 250 dwellings in Lyons borough, owner-occupied units account for 184 (73.6%), while renter-occupied units make up 66 (26.4%).
| Occupancy | # Housing Units | % Housing Units |
| Owner Occupied Housing Units | 184 | 73.6% |
| Renter-Occupied Housing Units | 66 | 26.4% |
| Total Occupied Housing Units | 250 | 100.0% |
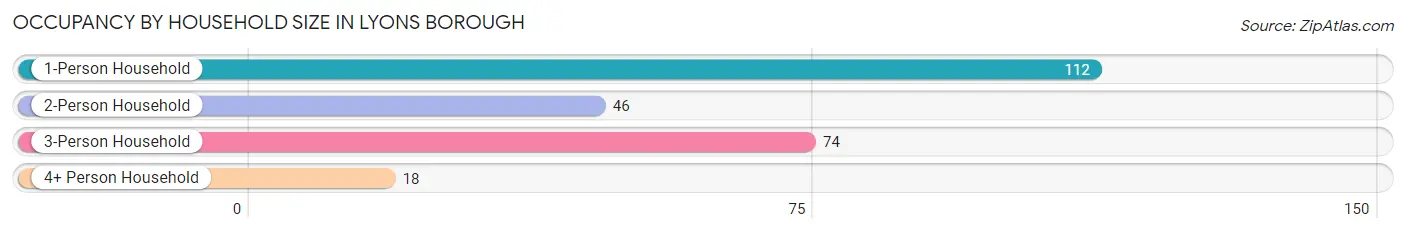
Occupancy by Household Size in Lyons borough
| Household Size | # Housing Units | % Housing Units |
| 1-Person Household | 112 | 44.8% |
| 2-Person Household | 46 | 18.4% |
| 3-Person Household | 74 | 29.6% |
| 4+ Person Household | 18 | 7.2% |
| Total Housing Units | 250 | 100.0% |
Occupancy by Ownership by Household Size in Lyons borough
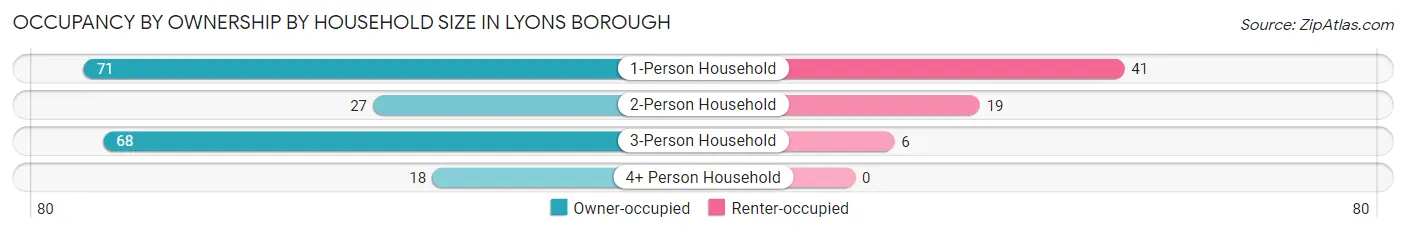
| Household Size | Owner-occupied | Renter-occupied |
| 1-Person Household | 71 (63.4%) | 41 (36.6%) |
| 2-Person Household | 27 (58.7%) | 19 (41.3%) |
| 3-Person Household | 68 (91.9%) | 6 (8.1%) |
| 4+ Person Household | 18 (100.0%) | 0 (0.0%) |
| Total Housing Units | 184 (73.6%) | 66 (26.4%) |
Occupancy by Educational Attainment in Lyons borough
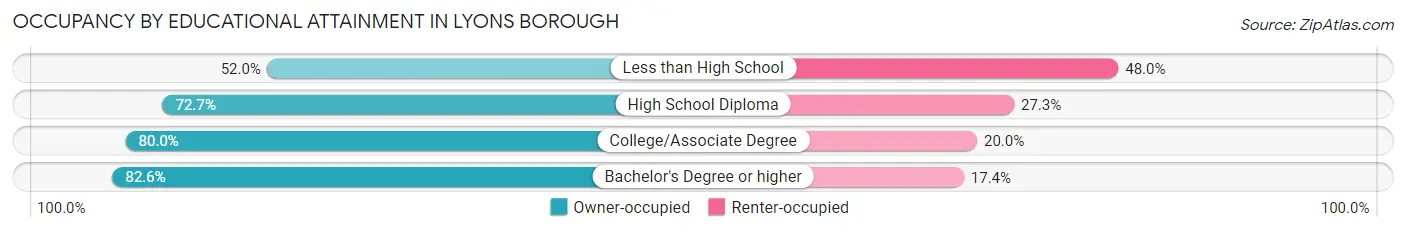
| Household Size | Owner-occupied | Renter-occupied |
| Less than High School | 13 (52.0%) | 12 (48.0%) |
| High School Diploma | 101 (72.7%) | 38 (27.3%) |
| College/Associate Degree | 32 (80.0%) | 8 (20.0%) |
| Bachelor's Degree or higher | 38 (82.6%) | 8 (17.4%) |
Occupancy by Age of Householder in Lyons borough
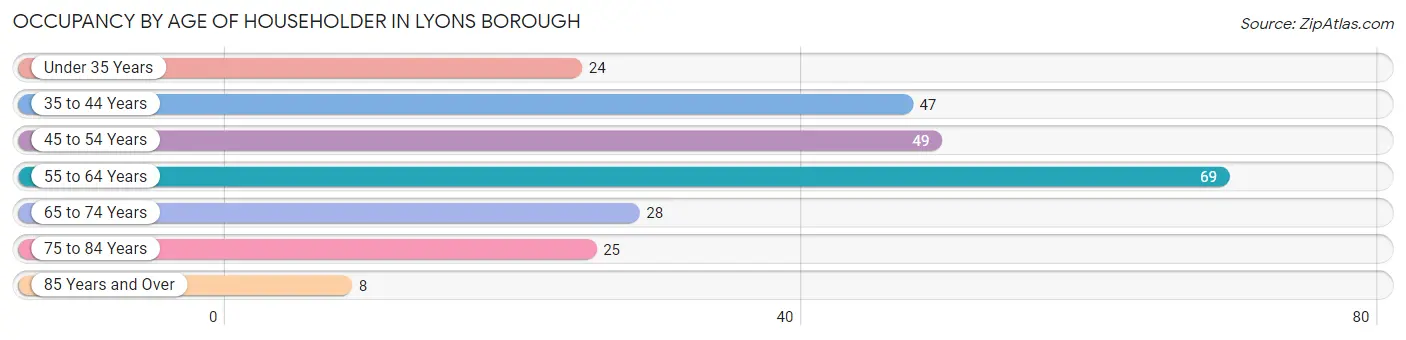
| Age Bracket | # Households | % Households |
| Under 35 Years | 24 | 9.6% |
| 35 to 44 Years | 47 | 18.8% |
| 45 to 54 Years | 49 | 19.6% |
| 55 to 64 Years | 69 | 27.6% |
| 65 to 74 Years | 28 | 11.2% |
| 75 to 84 Years | 25 | 10.0% |
| 85 Years and Over | 8 | 3.2% |
| Total | 250 | 100.0% |
Housing Finances in Lyons borough
Median Income by Occupancy in Lyons borough
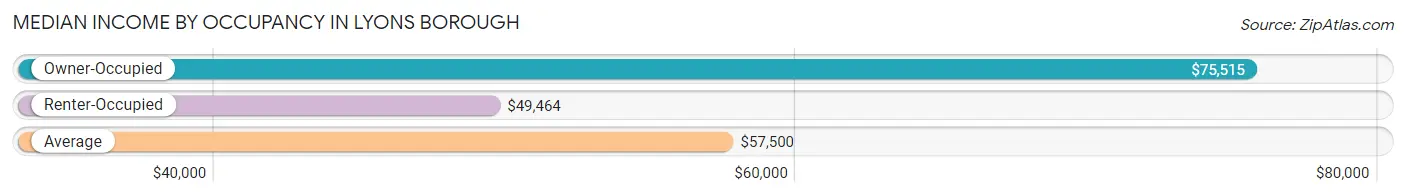
| Occupancy Type | # Households | Median Income |
| Owner-Occupied | 184 (73.6%) | $75,515 |
| Renter-Occupied | 66 (26.4%) | $49,464 |
| Average | 250 (100.0%) | $57,500 |
Occupancy by Householder Income Bracket in Lyons borough
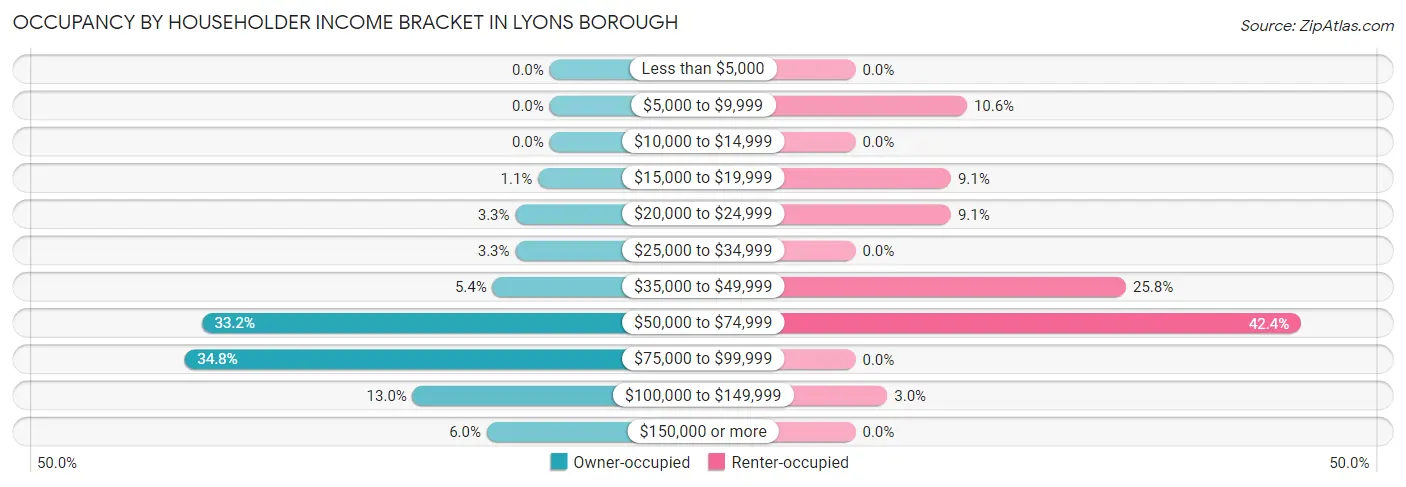
| Income Bracket | Owner-occupied | Renter-occupied |
| Less than $5,000 | 0 (0.0%) | 0 (0.0%) |
| $5,000 to $9,999 | 0 (0.0%) | 7 (10.6%) |
| $10,000 to $14,999 | 0 (0.0%) | 0 (0.0%) |
| $15,000 to $19,999 | 2 (1.1%) | 6 (9.1%) |
| $20,000 to $24,999 | 6 (3.3%) | 6 (9.1%) |
| $25,000 to $34,999 | 6 (3.3%) | 0 (0.0%) |
| $35,000 to $49,999 | 10 (5.4%) | 17 (25.8%) |
| $50,000 to $74,999 | 61 (33.2%) | 28 (42.4%) |
| $75,000 to $99,999 | 64 (34.8%) | 0 (0.0%) |
| $100,000 to $149,999 | 24 (13.0%) | 2 (3.0%) |
| $150,000 or more | 11 (6.0%) | 0 (0.0%) |
| Total | 184 (100.0%) | 66 (100.0%) |
Monthly Housing Cost Tiers in Lyons borough
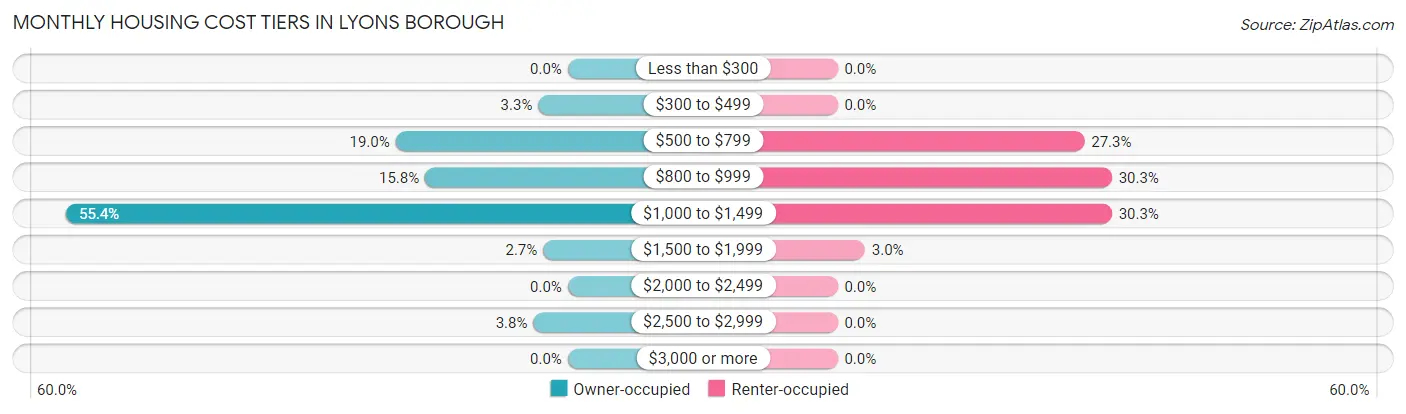
| Monthly Cost | Owner-occupied | Renter-occupied |
| Less than $300 | 0 (0.0%) | 0 (0.0%) |
| $300 to $499 | 6 (3.3%) | 0 (0.0%) |
| $500 to $799 | 35 (19.0%) | 18 (27.3%) |
| $800 to $999 | 29 (15.8%) | 20 (30.3%) |
| $1,000 to $1,499 | 102 (55.4%) | 20 (30.3%) |
| $1,500 to $1,999 | 5 (2.7%) | 2 (3.0%) |
| $2,000 to $2,499 | 0 (0.0%) | 0 (0.0%) |
| $2,500 to $2,999 | 7 (3.8%) | 0 (0.0%) |
| $3,000 or more | 0 (0.0%) | 0 (0.0%) |
| Total | 184 (100.0%) | 66 (100.0%) |
Physical Housing Characteristics in Lyons borough
Housing Structures in Lyons borough
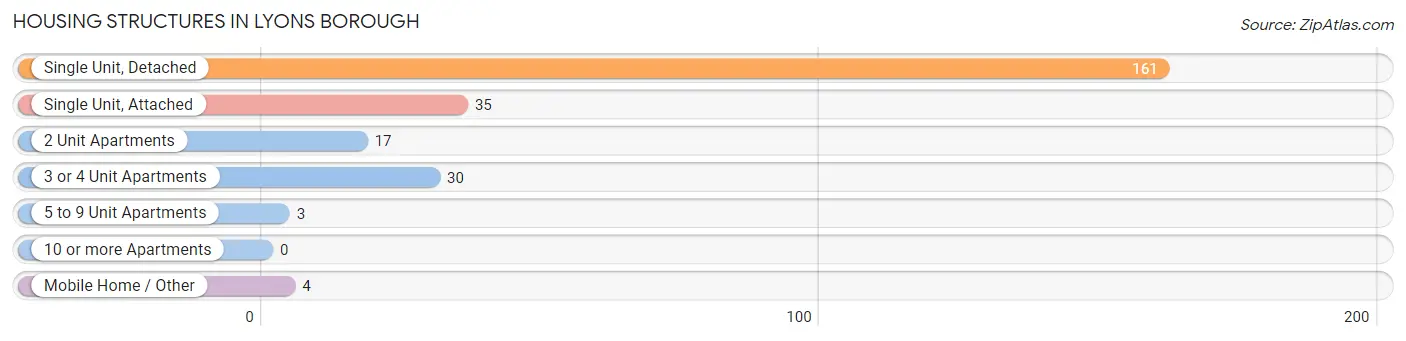
| Structure Type | # Housing Units | % Housing Units |
| Single Unit, Detached | 161 | 64.4% |
| Single Unit, Attached | 35 | 14.0% |
| 2 Unit Apartments | 17 | 6.8% |
| 3 or 4 Unit Apartments | 30 | 12.0% |
| 5 to 9 Unit Apartments | 3 | 1.2% |
| 10 or more Apartments | 0 | 0.0% |
| Mobile Home / Other | 4 | 1.6% |
| Total | 250 | 100.0% |
Housing Structures by Occupancy in Lyons borough
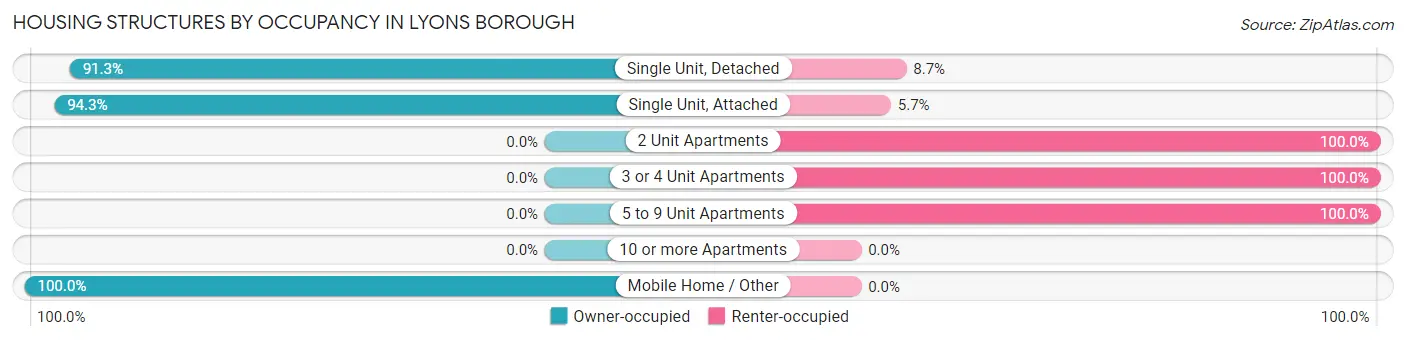
| Structure Type | Owner-occupied | Renter-occupied |
| Single Unit, Detached | 147 (91.3%) | 14 (8.7%) |
| Single Unit, Attached | 33 (94.3%) | 2 (5.7%) |
| 2 Unit Apartments | 0 (0.0%) | 17 (100.0%) |
| 3 or 4 Unit Apartments | 0 (0.0%) | 30 (100.0%) |
| 5 to 9 Unit Apartments | 0 (0.0%) | 3 (100.0%) |
| 10 or more Apartments | 0 (0.0%) | 0 (0.0%) |
| Mobile Home / Other | 4 (100.0%) | 0 (0.0%) |
| Total | 184 (73.6%) | 66 (26.4%) |
Housing Structures by Number of Rooms in Lyons borough
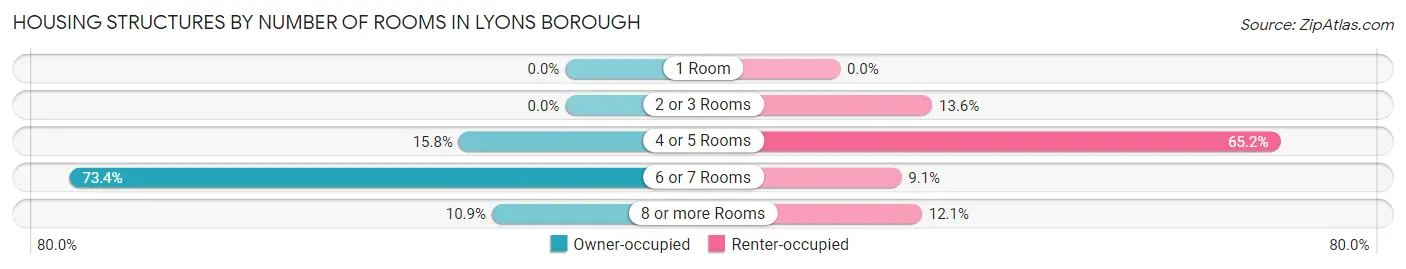
| Number of Rooms | Owner-occupied | Renter-occupied |
| 1 Room | 0 (0.0%) | 0 (0.0%) |
| 2 or 3 Rooms | 0 (0.0%) | 9 (13.6%) |
| 4 or 5 Rooms | 29 (15.8%) | 43 (65.1%) |
| 6 or 7 Rooms | 135 (73.4%) | 6 (9.1%) |
| 8 or more Rooms | 20 (10.9%) | 8 (12.1%) |
| Total | 184 (100.0%) | 66 (100.0%) |
Housing Structure by Heating Type in Lyons borough
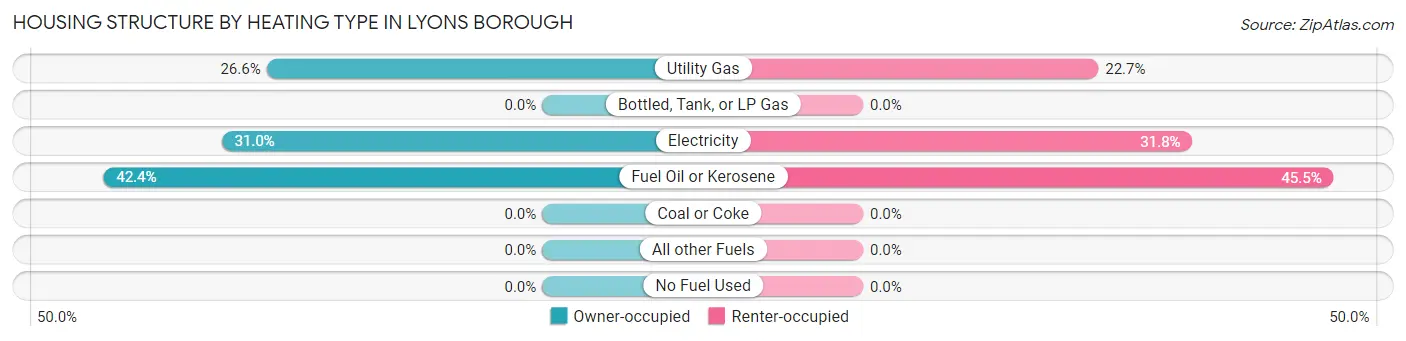
| Heating Type | Owner-occupied | Renter-occupied |
| Utility Gas | 49 (26.6%) | 15 (22.7%) |
| Bottled, Tank, or LP Gas | 0 (0.0%) | 0 (0.0%) |
| Electricity | 57 (31.0%) | 21 (31.8%) |
| Fuel Oil or Kerosene | 78 (42.4%) | 30 (45.5%) |
| Coal or Coke | 0 (0.0%) | 0 (0.0%) |
| All other Fuels | 0 (0.0%) | 0 (0.0%) |
| No Fuel Used | 0 (0.0%) | 0 (0.0%) |
| Total | 184 (100.0%) | 66 (100.0%) |
Household Vehicle Usage in Lyons borough
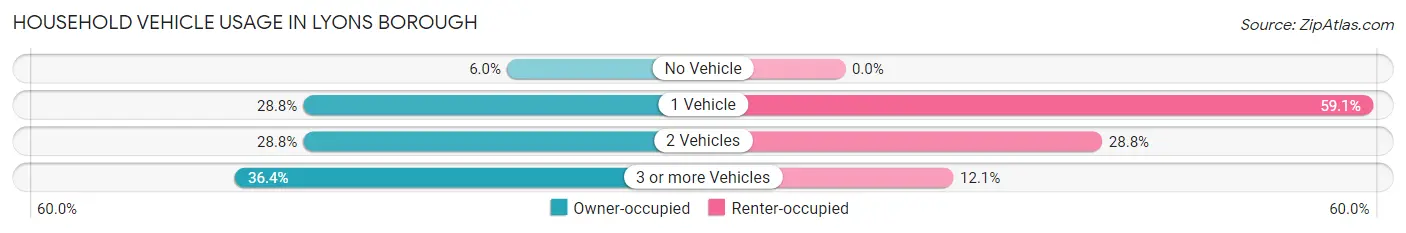
| Vehicles per Household | Owner-occupied | Renter-occupied |
| No Vehicle | 11 (6.0%) | 0 (0.0%) |
| 1 Vehicle | 53 (28.8%) | 39 (59.1%) |
| 2 Vehicles | 53 (28.8%) | 19 (28.8%) |
| 3 or more Vehicles | 67 (36.4%) | 8 (12.1%) |
| Total | 184 (100.0%) | 66 (100.0%) |
Real Estate & Mortgages in Lyons borough
Real Estate and Mortgage Overview in Lyons borough
| Characteristic | Without Mortgage | With Mortgage |
| Housing Units | 38 | 146 |
| Median Property Value | $132,800 | $168,100 |
| Median Household Income | - | - |
| Monthly Housing Costs | $700 | $0 |
| Real Estate Taxes | $3,375 | $0 |
Property Value by Mortgage Status in Lyons borough
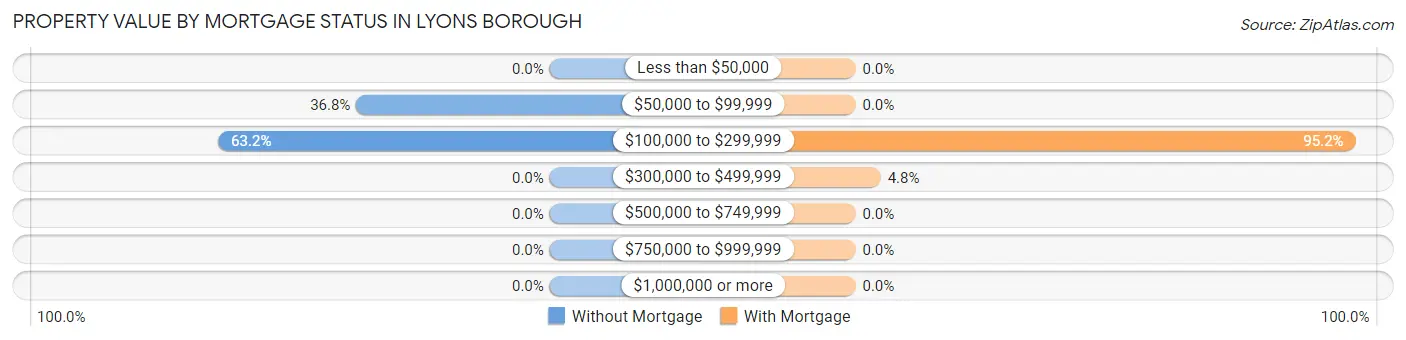
| Property Value | Without Mortgage | With Mortgage |
| Less than $50,000 | 0 (0.0%) | 0 (0.0%) |
| $50,000 to $99,999 | 14 (36.8%) | 0 (0.0%) |
| $100,000 to $299,999 | 24 (63.2%) | 139 (95.2%) |
| $300,000 to $499,999 | 0 (0.0%) | 7 (4.8%) |
| $500,000 to $749,999 | 0 (0.0%) | 0 (0.0%) |
| $750,000 to $999,999 | 0 (0.0%) | 0 (0.0%) |
| $1,000,000 or more | 0 (0.0%) | 0 (0.0%) |
| Total | 38 (100.0%) | 146 (100.0%) |
Household Income by Mortgage Status in Lyons borough
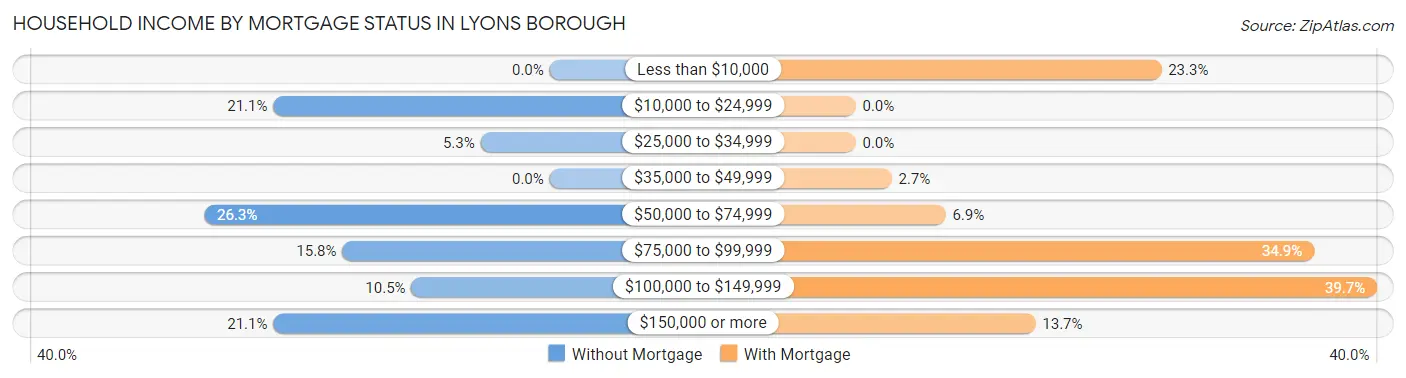
| Household Income | Without Mortgage | With Mortgage |
| Less than $10,000 | 0 (0.0%) | 34 (23.3%) |
| $10,000 to $24,999 | 8 (21.0%) | 0 (0.0%) |
| $25,000 to $34,999 | 2 (5.3%) | 0 (0.0%) |
| $35,000 to $49,999 | 0 (0.0%) | 4 (2.7%) |
| $50,000 to $74,999 | 10 (26.3%) | 10 (6.9%) |
| $75,000 to $99,999 | 6 (15.8%) | 51 (34.9%) |
| $100,000 to $149,999 | 4 (10.5%) | 58 (39.7%) |
| $150,000 or more | 8 (21.0%) | 20 (13.7%) |
| Total | 38 (100.0%) | 146 (100.0%) |
Property Value to Household Income Ratio in Lyons borough
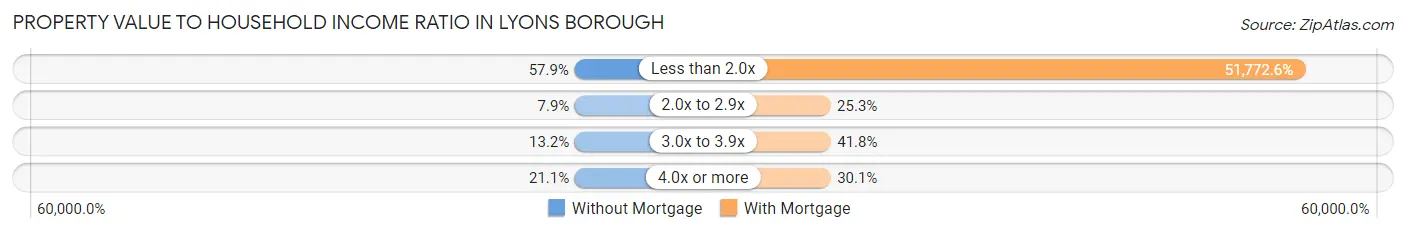
| Value-to-Income Ratio | Without Mortgage | With Mortgage |
| Less than 2.0x | 22 (57.9%) | 75,588 (51,772.6%) |
| 2.0x to 2.9x | 3 (7.9%) | 37 (25.3%) |
| 3.0x to 3.9x | 5 (13.2%) | 61 (41.8%) |
| 4.0x or more | 8 (21.0%) | 44 (30.1%) |
| Total | 38 (100.0%) | 146 (100.0%) |
Real Estate Taxes by Mortgage Status in Lyons borough
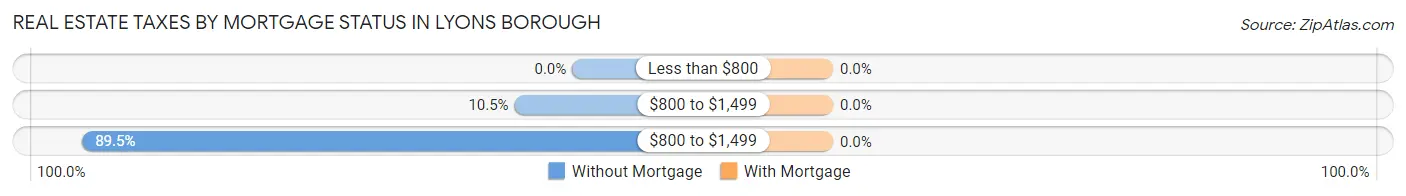
| Property Taxes | Without Mortgage | With Mortgage |
| Less than $800 | 0 (0.0%) | 0 (0.0%) |
| $800 to $1,499 | 4 (10.5%) | 0 (0.0%) |
| $800 to $1,499 | 34 (89.5%) | 0 (0.0%) |
| Total | 38 (100.0%) | 146 (100.0%) |
Health & Disability in Lyons borough
Health Insurance Coverage by Age in Lyons borough
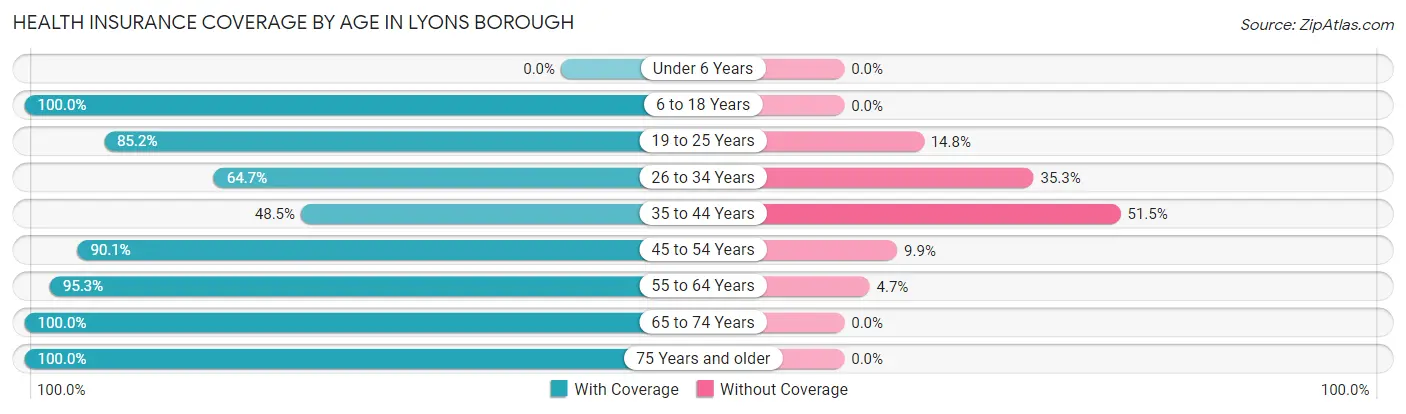
| Age Bracket | With Coverage | Without Coverage |
| Under 6 Years | 0 (0.0%) | 0 (0.0%) |
| 6 to 18 Years | 40 (100.0%) | 0 (0.0%) |
| 19 to 25 Years | 46 (85.2%) | 8 (14.8%) |
| 26 to 34 Years | 33 (64.7%) | 18 (35.3%) |
| 35 to 44 Years | 32 (48.5%) | 34 (51.5%) |
| 45 to 54 Years | 64 (90.1%) | 7 (9.9%) |
| 55 to 64 Years | 121 (95.3%) | 6 (4.7%) |
| 65 to 74 Years | 71 (100.0%) | 0 (0.0%) |
| 75 Years and older | 37 (100.0%) | 0 (0.0%) |
| Total | 444 (85.9%) | 73 (14.1%) |
Health Insurance Coverage by Citizenship Status in Lyons borough
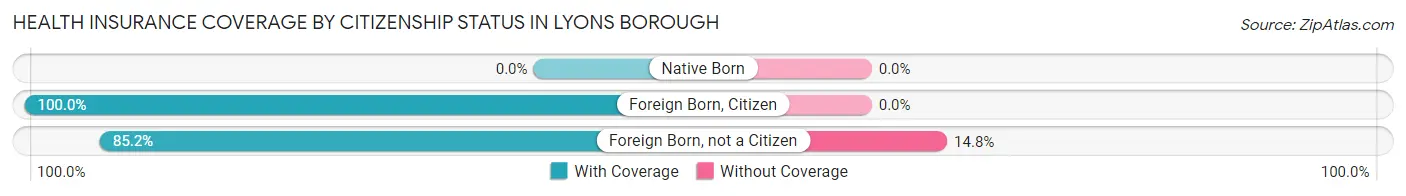
| Citizenship Status | With Coverage | Without Coverage |
| Native Born | 0 (0.0%) | 0 (0.0%) |
| Foreign Born, Citizen | 40 (100.0%) | 0 (0.0%) |
| Foreign Born, not a Citizen | 46 (85.2%) | 8 (14.8%) |
Health Insurance Coverage by Household Income in Lyons borough
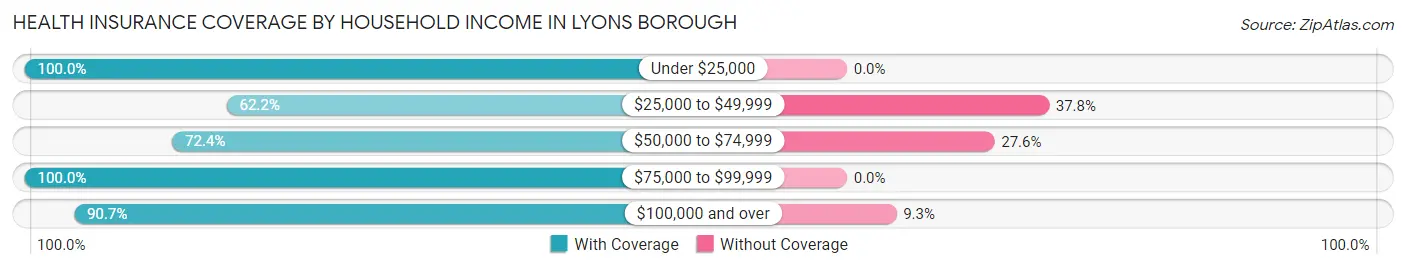
| Household Income | With Coverage | Without Coverage |
| Under $25,000 | 27 (100.0%) | 0 (0.0%) |
| $25,000 to $49,999 | 46 (62.2%) | 28 (37.8%) |
| $50,000 to $74,999 | 89 (72.4%) | 34 (27.6%) |
| $75,000 to $99,999 | 174 (100.0%) | 0 (0.0%) |
| $100,000 and over | 98 (90.7%) | 10 (9.3%) |
Public vs Private Health Insurance Coverage by Age in Lyons borough
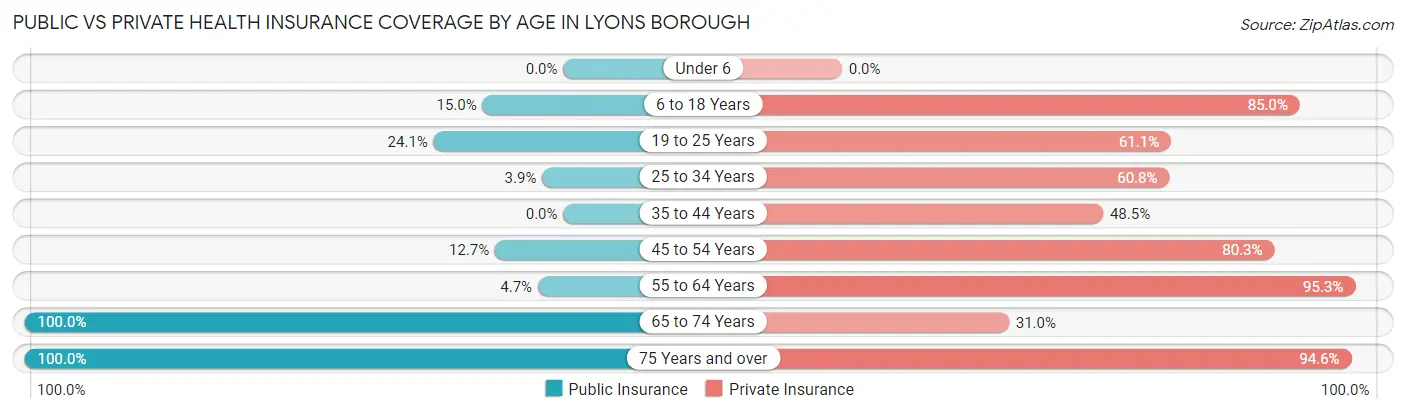
| Age Bracket | Public Insurance | Private Insurance |
| Under 6 | 0 (0.0%) | 0 (0.0%) |
| 6 to 18 Years | 6 (15.0%) | 34 (85.0%) |
| 19 to 25 Years | 13 (24.1%) | 33 (61.1%) |
| 25 to 34 Years | 2 (3.9%) | 31 (60.8%) |
| 35 to 44 Years | 0 (0.0%) | 32 (48.5%) |
| 45 to 54 Years | 9 (12.7%) | 57 (80.3%) |
| 55 to 64 Years | 6 (4.7%) | 121 (95.3%) |
| 65 to 74 Years | 71 (100.0%) | 22 (31.0%) |
| 75 Years and over | 37 (100.0%) | 35 (94.6%) |
| Total | 144 (27.9%) | 365 (70.6%) |
Disability Status by Sex by Age in Lyons borough
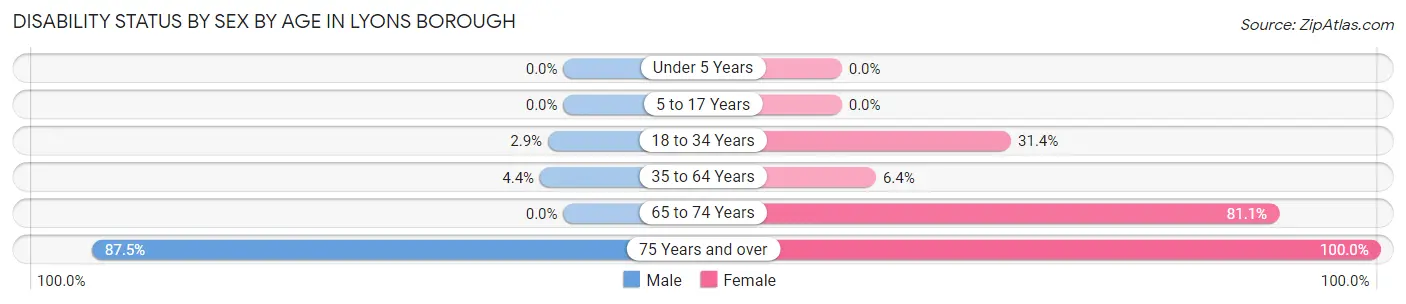
| Age Bracket | Male | Female |
| Under 5 Years | 0 (0.0%) | 0 (0.0%) |
| 5 to 17 Years | 0 (0.0%) | 0 (0.0%) |
| 18 to 34 Years | 2 (2.9%) | 11 (31.4%) |
| 35 to 64 Years | 6 (4.3%) | 8 (6.4%) |
| 65 to 74 Years | 0 (0.0%) | 43 (81.1%) |
| 75 Years and over | 21 (87.5%) | 13 (100.0%) |
Disability Class by Sex by Age in Lyons borough
Disability Class: Hearing Difficulty
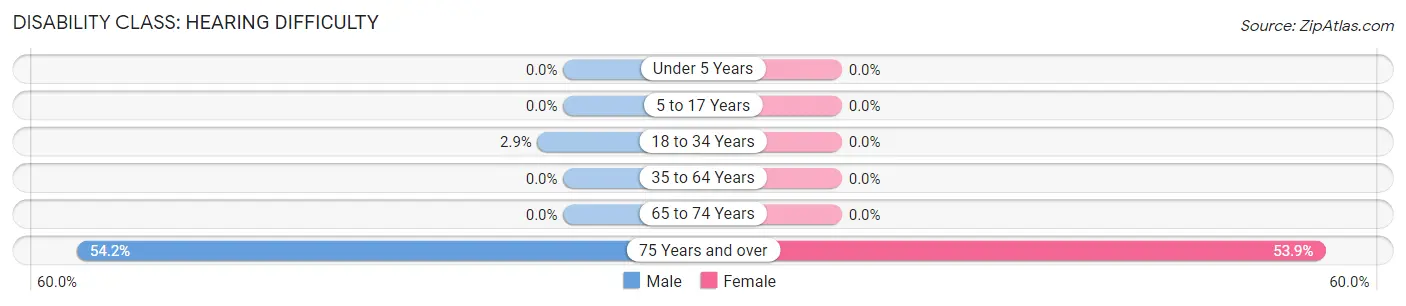
| Age Bracket | Male | Female |
| Under 5 Years | 0 (0.0%) | 0 (0.0%) |
| 5 to 17 Years | 0 (0.0%) | 0 (0.0%) |
| 18 to 34 Years | 2 (2.9%) | 0 (0.0%) |
| 35 to 64 Years | 0 (0.0%) | 0 (0.0%) |
| 65 to 74 Years | 0 (0.0%) | 0 (0.0%) |
| 75 Years and over | 13 (54.2%) | 7 (53.8%) |
Disability Class: Vision Difficulty
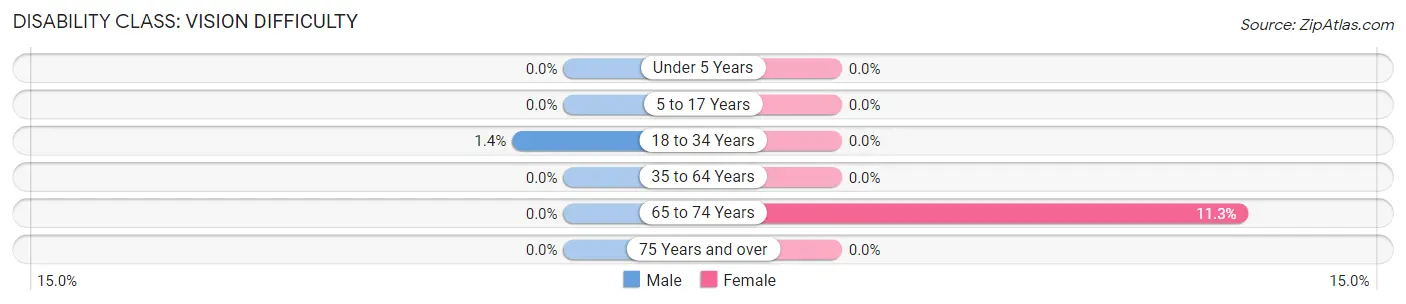
| Age Bracket | Male | Female |
| Under 5 Years | 0 (0.0%) | 0 (0.0%) |
| 5 to 17 Years | 0 (0.0%) | 0 (0.0%) |
| 18 to 34 Years | 1 (1.4%) | 0 (0.0%) |
| 35 to 64 Years | 0 (0.0%) | 0 (0.0%) |
| 65 to 74 Years | 0 (0.0%) | 6 (11.3%) |
| 75 Years and over | 0 (0.0%) | 0 (0.0%) |
Disability Class: Cognitive Difficulty
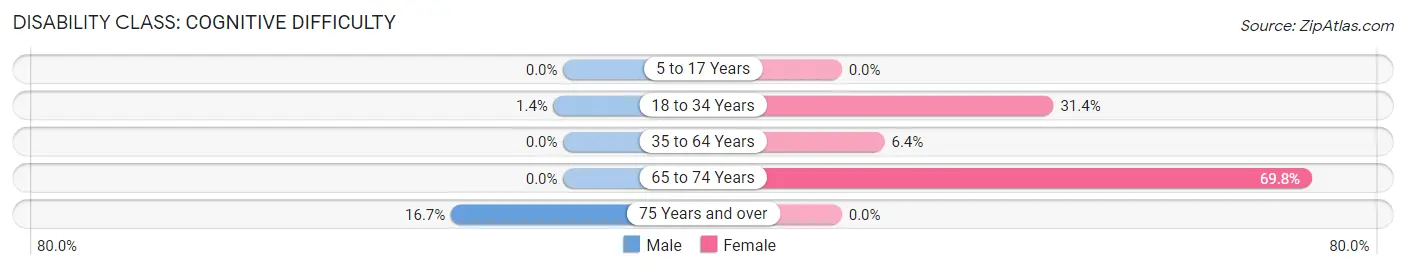
| Age Bracket | Male | Female |
| 5 to 17 Years | 0 (0.0%) | 0 (0.0%) |
| 18 to 34 Years | 1 (1.4%) | 11 (31.4%) |
| 35 to 64 Years | 0 (0.0%) | 8 (6.4%) |
| 65 to 74 Years | 0 (0.0%) | 37 (69.8%) |
| 75 Years and over | 4 (16.7%) | 0 (0.0%) |
Disability Class: Ambulatory Difficulty
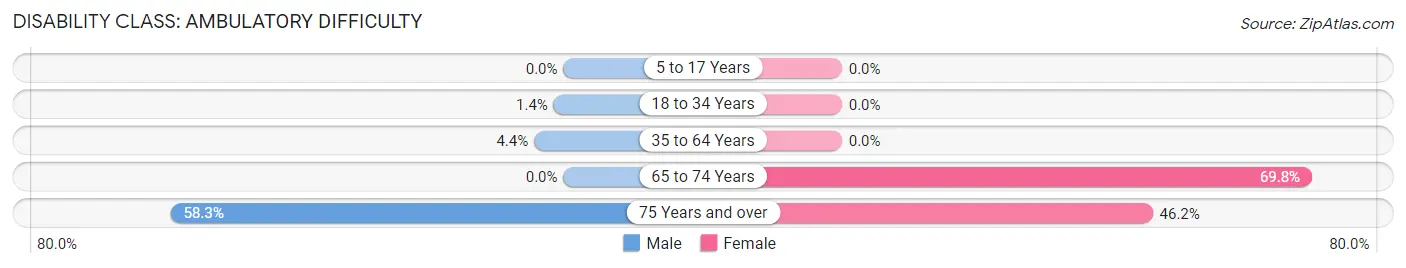
| Age Bracket | Male | Female |
| 5 to 17 Years | 0 (0.0%) | 0 (0.0%) |
| 18 to 34 Years | 1 (1.4%) | 0 (0.0%) |
| 35 to 64 Years | 6 (4.3%) | 0 (0.0%) |
| 65 to 74 Years | 0 (0.0%) | 37 (69.8%) |
| 75 Years and over | 14 (58.3%) | 6 (46.2%) |
Disability Class: Self-Care Difficulty
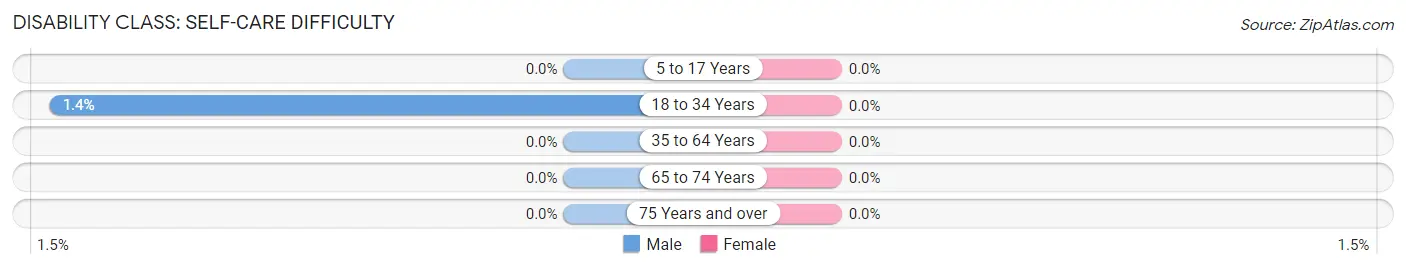
| Age Bracket | Male | Female |
| 5 to 17 Years | 0 (0.0%) | 0 (0.0%) |
| 18 to 34 Years | 1 (1.4%) | 0 (0.0%) |
| 35 to 64 Years | 0 (0.0%) | 0 (0.0%) |
| 65 to 74 Years | 0 (0.0%) | 0 (0.0%) |
| 75 Years and over | 0 (0.0%) | 0 (0.0%) |
Technology Access in Lyons borough
Computing Device Access in Lyons borough
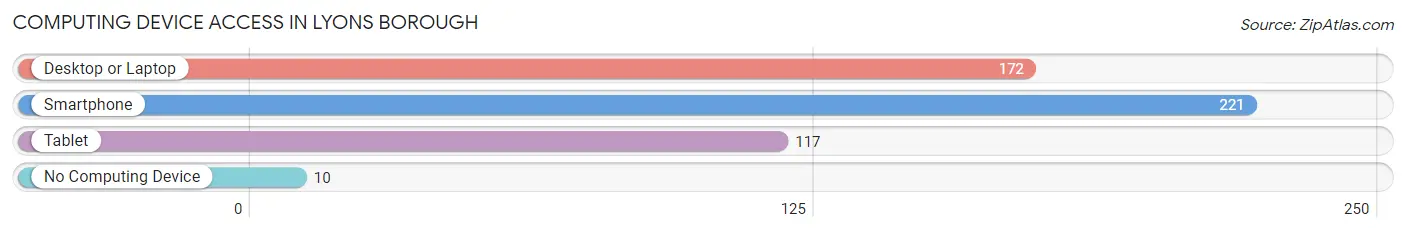
| Device Type | # Households | % Households |
| Desktop or Laptop | 172 | 68.8% |
| Smartphone | 221 | 88.4% |
| Tablet | 117 | 46.8% |
| No Computing Device | 10 | 4.0% |
| Total | 250 | 100.0% |
Internet Access in Lyons borough
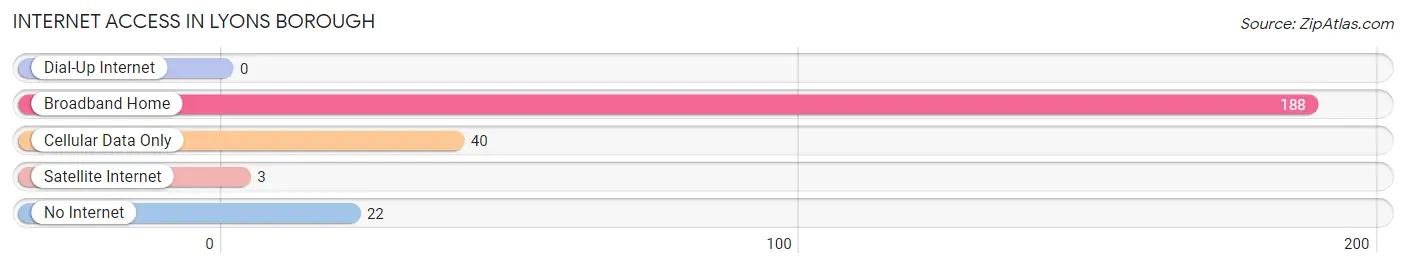
| Internet Type | # Households | % Households |
| Dial-Up Internet | 0 | 0.0% |
| Broadband Home | 188 | 75.2% |
| Cellular Data Only | 40 | 16.0% |
| Satellite Internet | 3 | 1.2% |
| No Internet | 22 | 8.8% |
| Total | 250 | 100.0% |
Lyons borough Summary
Lyons Borough is a small borough located in the state of Pennsylvania in the United States. It is located in the northwest corner of Bradford County and is part of the Towanda, Pennsylvania Micropolitan Statistical Area. The population of Lyons Borough was 1,093 at the 2010 census.
History
The area that is now Lyons Borough was first settled in the late 1700s by settlers from Connecticut. The first settler was a man named John Lyons, who gave the area its name. The area was originally part of Wysox Township, but was incorporated as a borough in 1876.
The borough was an important stop on the Lehigh Valley Railroad, which ran through the area from 1872 to 1972. The railroad was an important part of the local economy, as it allowed for the transportation of goods and people to and from the area.
Geography
Lyons Borough is located at 41°45'25" North, 76°25'45" West (41.756944, -76.429167). It is situated in the northwest corner of Bradford County, and is bordered by Wysox Township to the north, Monroe Township to the east, and South Creek Township to the south and west.
The borough has a total area of 0.7 square miles, all of which is land. The borough is located in the Susquehanna River Valley, and is surrounded by rolling hills and forests.
Economy
The economy of Lyons Borough is largely based on agriculture and tourism. The area is home to several farms, which produce a variety of crops, including corn, soybeans, hay, and wheat. The borough is also home to several small businesses, including a grocery store, a hardware store, and a restaurant.
The borough is also a popular tourist destination, as it is located near several state parks and recreational areas. The nearby Wyalusing State Park is a popular destination for camping, hiking, and fishing. The borough is also home to several historic sites, including the Lyons Covered Bridge, which was built in 1876.
Demographics
As of the 2010 census, the population of Lyons Borough was 1,093. The racial makeup of the borough was 97.2% White, 0.7% African American, 0.2% Native American, 0.2% Asian, 0.1% from other races, and 1.7% from two or more races. Hispanic or Latino of any race were 0.7% of the population.
The median income for a household in the borough was $37,500, and the median income for a family was $45,000. The per capita income for the borough was $17,845. About 11.2% of families and 14.2% of the population were below the poverty line, including 18.2% of those under age 18 and 8.3% of those age 65 or over.
Common Questions
What is Per Capita Income in Lyons borough?
Per Capita income in Lyons borough is $32,887.
What is the Median Family Income in Lyons borough?
Median Family Income in Lyons borough is $77,059.
What is the Median Household income in Lyons borough?
Median Household Income in Lyons borough is $57,500.
What is Income or Wage Gap in Lyons borough?
Income or Wage Gap in Lyons borough is 5.6%.
Women in Lyons borough earn 94.4 cents for every dollar earned by a man.
What is Inequality or Gini Index in Lyons borough?
Inequality or Gini Index in Lyons borough is 0.27.
What is the Total Population of Lyons borough?
Total Population of Lyons borough is 517.
What is the Total Male Population of Lyons borough?
Total Male Population of Lyons borough is 283.
What is the Total Female Population of Lyons borough?
Total Female Population of Lyons borough is 234.
What is the Ratio of Males per 100 Females in Lyons borough?
There are 120.94 Males per 100 Females in Lyons borough.
What is the Ratio of Females per 100 Males in Lyons borough?
There are 82.69 Females per 100 Males in Lyons borough.
What is the Median Population Age in Lyons borough?
Median Population Age in Lyons borough is 53.1 Years.
What is the Average Family Size in Lyons borough
Average Family Size in Lyons borough is 2.9 People.
What is the Average Household Size in Lyons borough
Average Household Size in Lyons borough is 2.0 People.
How Large is the Labor Force in Lyons borough?
There are 314 People in the Labor Forcein in Lyons borough.
What is the Percentage of People in the Labor Force in Lyons borough?
63.1% of People are in the Labor Force in Lyons borough.
What is the Unemployment Rate in Lyons borough?
Unemployment Rate in Lyons borough is 0.6%.