Swissvale borough, PA Map & Demographics
Swissvale borough Overview
$37,266
PER CAPITA INCOME
$78,359
AVG FAMILY INCOME
$56,594
AVG HOUSEHOLD INCOME
6.3%
WAGE / INCOME GAP [ % ]
93.7¢/ $1
WAGE / INCOME GAP [ $ ]
0.46
INEQUALITY / GINI INDEX
8,588
TOTAL POPULATION
4,411
MALE POPULATION
4,177
FEMALE POPULATION
105.60
MALES / 100 FEMALES
94.70
FEMALES / 100 MALES
37.1
MEDIAN AGE
3.0
AVG FAMILY SIZE
1.9
AVG HOUSEHOLD SIZE
5,401
LABOR FORCE [ PEOPLE ]
74.1%
PERCENT IN LABOR FORCE
6.6%
UNEMPLOYMENT RATE
Income in Swissvale borough
Income Overview in Swissvale borough
Per Capita Income in Swissvale borough is $37,266, while median incomes of families and households are $78,359 and $56,594 respectively.
| Characteristic | Number | Measure |
| Per Capita Income | 8,588 | $37,266 |
| Median Family Income | 1,679 | $78,359 |
| Mean Family Income | 1,679 | $100,083 |
| Median Household Income | 4,393 | $56,594 |
| Mean Household Income | 4,393 | $72,101 |
| Income Deficit | 1,679 | $0 |
| Wage / Income Gap (%) | 8,588 | 6.25% |
| Wage / Income Gap ($) | 8,588 | 93.75¢ per $1 |
| Gini / Inequality Index | 8,588 | 0.46 |
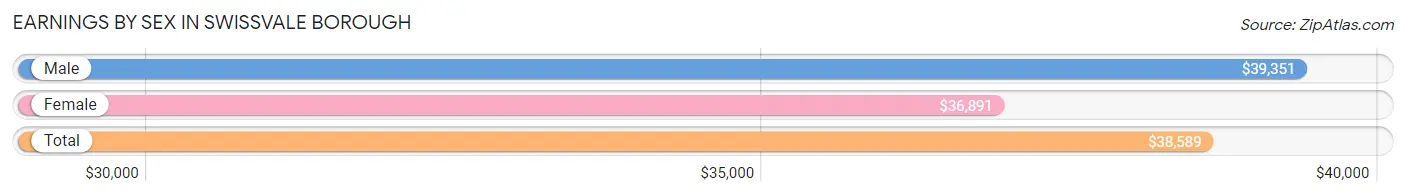
Earnings by Sex in Swissvale borough
Average Earnings in Swissvale borough are $38,589, $39,351 for men and $36,891 for women, a difference of 6.2%.
| Sex | Number | Average Earnings |
| Male | 2,840 (51.2%) | $39,351 |
| Female | 2,701 (48.7%) | $36,891 |
| Total | 5,541 (100.0%) | $38,589 |
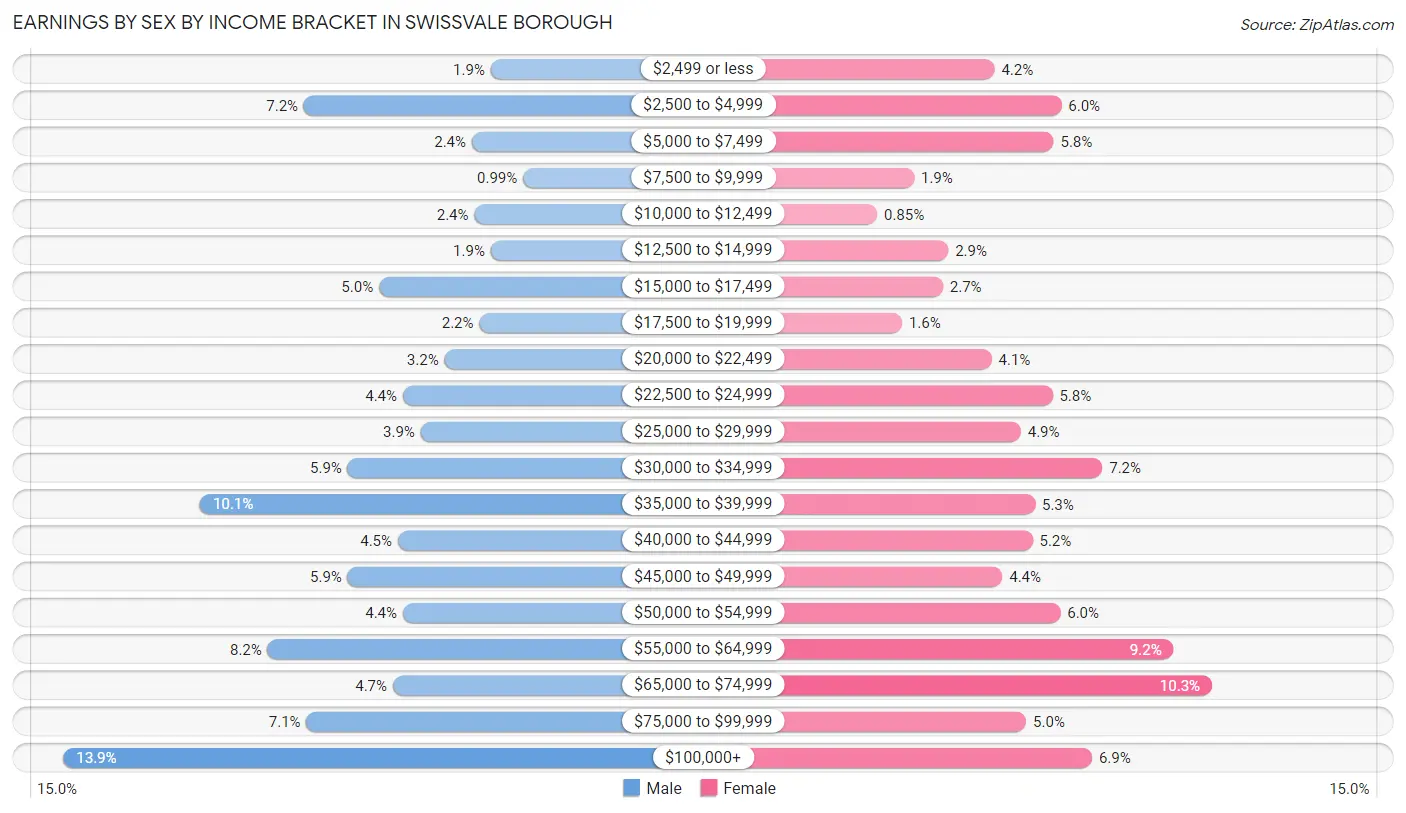
Earnings by Sex by Income Bracket in Swissvale borough
The most common earnings brackets in Swissvale borough are $100,000+ for men (395 | 13.9%) and $65,000 to $74,999 for women (277 | 10.3%).
| Income | Male | Female |
| $2,499 or less | 54 (1.9%) | 112 (4.2%) |
| $2,500 to $4,999 | 203 (7.1%) | 163 (6.0%) |
| $5,000 to $7,499 | 69 (2.4%) | 157 (5.8%) |
| $7,500 to $9,999 | 28 (1.0%) | 51 (1.9%) |
| $10,000 to $12,499 | 67 (2.4%) | 23 (0.9%) |
| $12,500 to $14,999 | 54 (1.9%) | 77 (2.9%) |
| $15,000 to $17,499 | 143 (5.0%) | 73 (2.7%) |
| $17,500 to $19,999 | 63 (2.2%) | 42 (1.5%) |
| $20,000 to $22,499 | 91 (3.2%) | 110 (4.1%) |
| $22,500 to $24,999 | 124 (4.4%) | 156 (5.8%) |
| $25,000 to $29,999 | 110 (3.9%) | 132 (4.9%) |
| $30,000 to $34,999 | 168 (5.9%) | 194 (7.2%) |
| $35,000 to $39,999 | 286 (10.1%) | 143 (5.3%) |
| $40,000 to $44,999 | 128 (4.5%) | 141 (5.2%) |
| $45,000 to $49,999 | 168 (5.9%) | 118 (4.4%) |
| $50,000 to $54,999 | 124 (4.4%) | 162 (6.0%) |
| $55,000 to $64,999 | 232 (8.2%) | 248 (9.2%) |
| $65,000 to $74,999 | 132 (4.6%) | 277 (10.3%) |
| $75,000 to $99,999 | 201 (7.1%) | 136 (5.0%) |
| $100,000+ | 395 (13.9%) | 186 (6.9%) |
| Total | 2,840 (100.0%) | 2,701 (100.0%) |
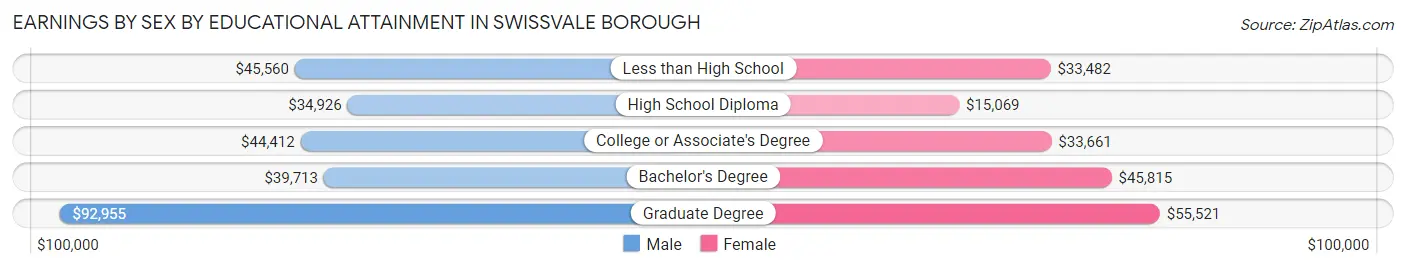
Earnings by Sex by Educational Attainment in Swissvale borough
Average earnings in Swissvale borough are $45,417 for men and $42,758 for women, a difference of 5.9%. Men with an educational attainment of graduate degree enjoy the highest average annual earnings of $92,955, while those with high school diploma education earn the least with $34,926. Women with an educational attainment of graduate degree earn the most with the average annual earnings of $55,521, while those with high school diploma education have the smallest earnings of $15,069.
| Educational Attainment | Male Income | Female Income |
| Less than High School | $45,560 | $33,482 |
| High School Diploma | $34,926 | $15,069 |
| College or Associate's Degree | $44,412 | $33,661 |
| Bachelor's Degree | $39,713 | $45,815 |
| Graduate Degree | $92,955 | $55,521 |
| Total | $45,417 | $42,758 |
Family Income in Swissvale borough
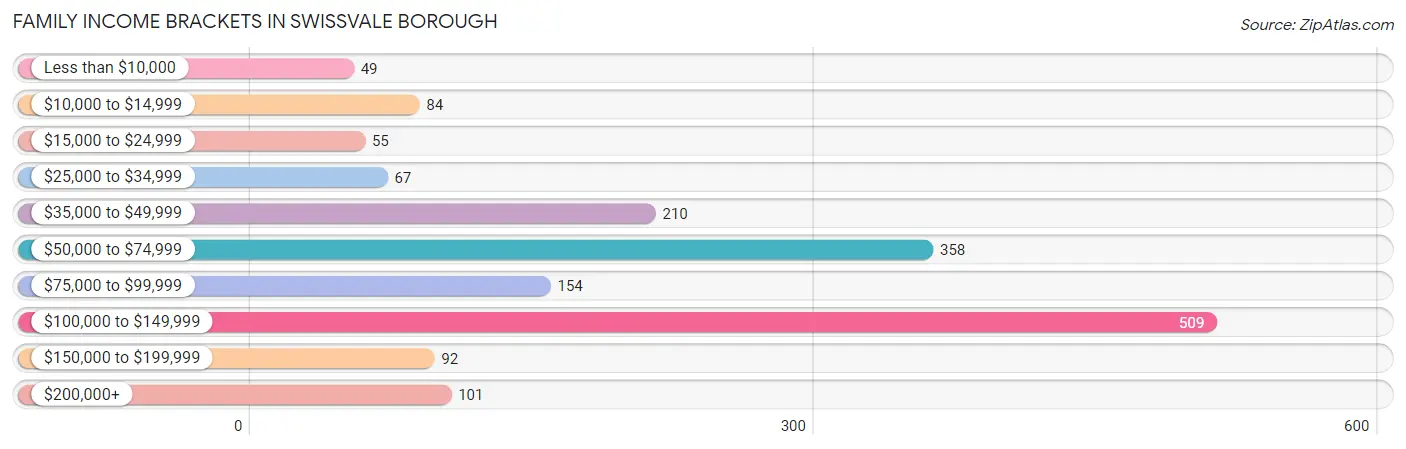
Family Income Brackets in Swissvale borough
According to the Swissvale borough family income data, there are 509 families falling into the $100,000 to $149,999 income range, which is the most common income bracket and makes up 30.3% of all families. Conversely, the less than $10,000 income bracket is the least frequent group with only 49 families (2.9%) belonging to this category.
| Income Bracket | # Families | % Families |
| Less than $10,000 | 49 | 2.9% |
| $10,000 to $14,999 | 84 | 5.0% |
| $15,000 to $24,999 | 55 | 3.3% |
| $25,000 to $34,999 | 67 | 4.0% |
| $35,000 to $49,999 | 210 | 12.5% |
| $50,000 to $74,999 | 358 | 21.3% |
| $75,000 to $99,999 | 154 | 9.2% |
| $100,000 to $149,999 | 509 | 30.3% |
| $150,000 to $199,999 | 92 | 5.5% |
| $200,000+ | 101 | 6.0% |
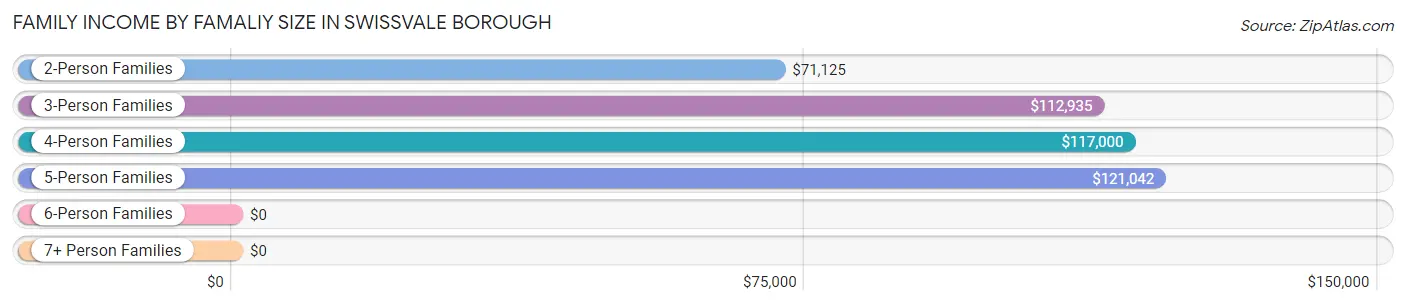
Family Income by Famaliy Size in Swissvale borough
5-person families (98 | 5.8%) account for the highest median family income in Swissvale borough with $121,042 per family, while 3-person families (314 | 18.7%) have the highest median income of $37,645 per family member.
| Income Bracket | # Families | Median Income |
| 2-Person Families | 985 (58.7%) | $71,125 |
| 3-Person Families | 314 (18.7%) | $112,935 |
| 4-Person Families | 170 (10.1%) | $117,000 |
| 5-Person Families | 98 (5.8%) | $121,042 |
| 6-Person Families | 7 (0.4%) | $0 |
| 7+ Person Families | 105 (6.2%) | $0 |
| Total | 1,679 (100.0%) | $78,359 |
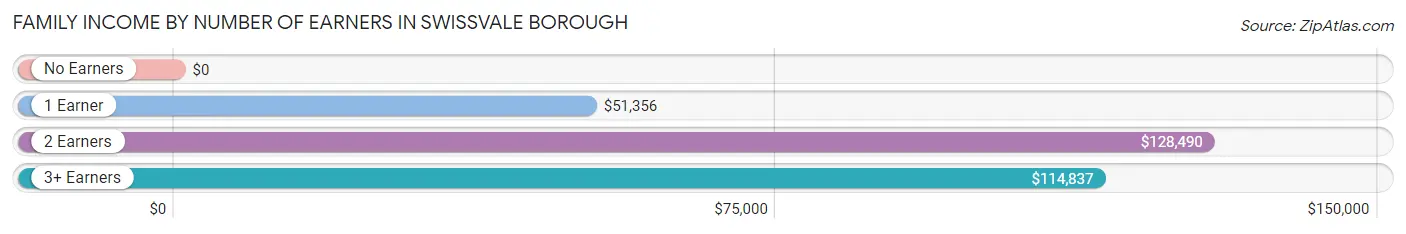
Family Income by Number of Earners in Swissvale borough
| Number of Earners | # Families | Median Income |
| No Earners | 181 (10.8%) | $0 |
| 1 Earner | 616 (36.7%) | $51,356 |
| 2 Earners | 641 (38.2%) | $128,490 |
| 3+ Earners | 241 (14.3%) | $114,837 |
| Total | 1,679 (100.0%) | $78,359 |
Household Income in Swissvale borough
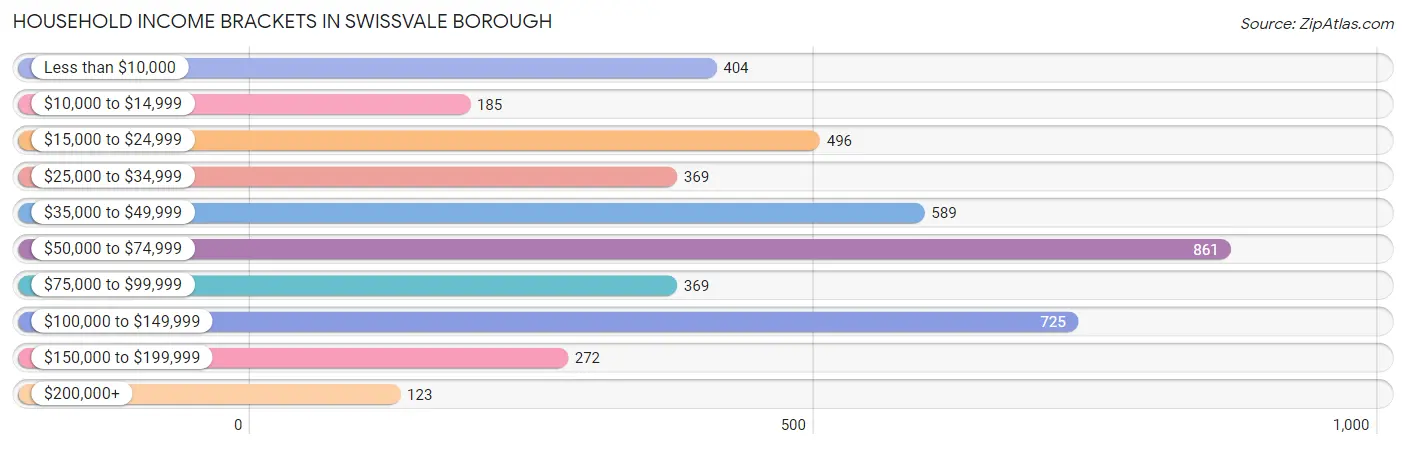
Household Income Brackets in Swissvale borough
With 861 households falling in the category, the $50,000 to $74,999 income range is the most frequent in Swissvale borough, accounting for 19.6% of all households. In contrast, only 123 households (2.8%) fall into the $200,000+ income bracket, making it the least populous group.
| Income Bracket | # Households | % Households |
| Less than $10,000 | 404 | 9.2% |
| $10,000 to $14,999 | 185 | 4.2% |
| $15,000 to $24,999 | 496 | 11.3% |
| $25,000 to $34,999 | 369 | 8.4% |
| $35,000 to $49,999 | 589 | 13.4% |
| $50,000 to $74,999 | 861 | 19.6% |
| $75,000 to $99,999 | 369 | 8.4% |
| $100,000 to $149,999 | 725 | 16.5% |
| $150,000 to $199,999 | 272 | 6.2% |
| $200,000+ | 123 | 2.8% |
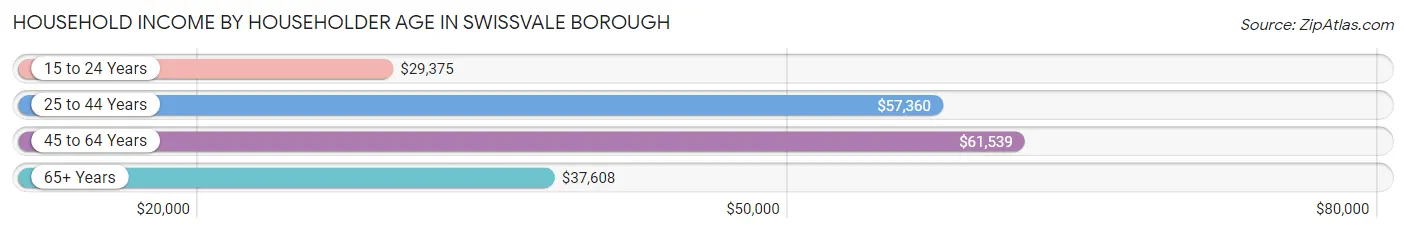
Household Income by Householder Age in Swissvale borough
The median household income in Swissvale borough is $56,594, with the highest median household income of $61,539 found in the 45 to 64 years age bracket for the primary householder. A total of 1,405 households (32.0%) fall into this category. Meanwhile, the 15 to 24 years age bracket for the primary householder has the lowest median household income of $29,375, with 80 households (1.8%) in this group.
| Income Bracket | # Households | Median Income |
| 15 to 24 Years | 80 (1.8%) | $29,375 |
| 25 to 44 Years | 1,827 (41.6%) | $57,360 |
| 45 to 64 Years | 1,405 (32.0%) | $61,539 |
| 65+ Years | 1,081 (24.6%) | $37,608 |
| Total | 4,393 (100.0%) | $56,594 |
Poverty in Swissvale borough
Income Below Poverty by Sex and Age in Swissvale borough
With 17.6% poverty level for males and 14.4% for females among the residents of Swissvale borough, under 5 year old males and 15 year old females are the most vulnerable to poverty, with 131 males (63.0%) and 51 females (68.0%) in their respective age groups living below the poverty level.
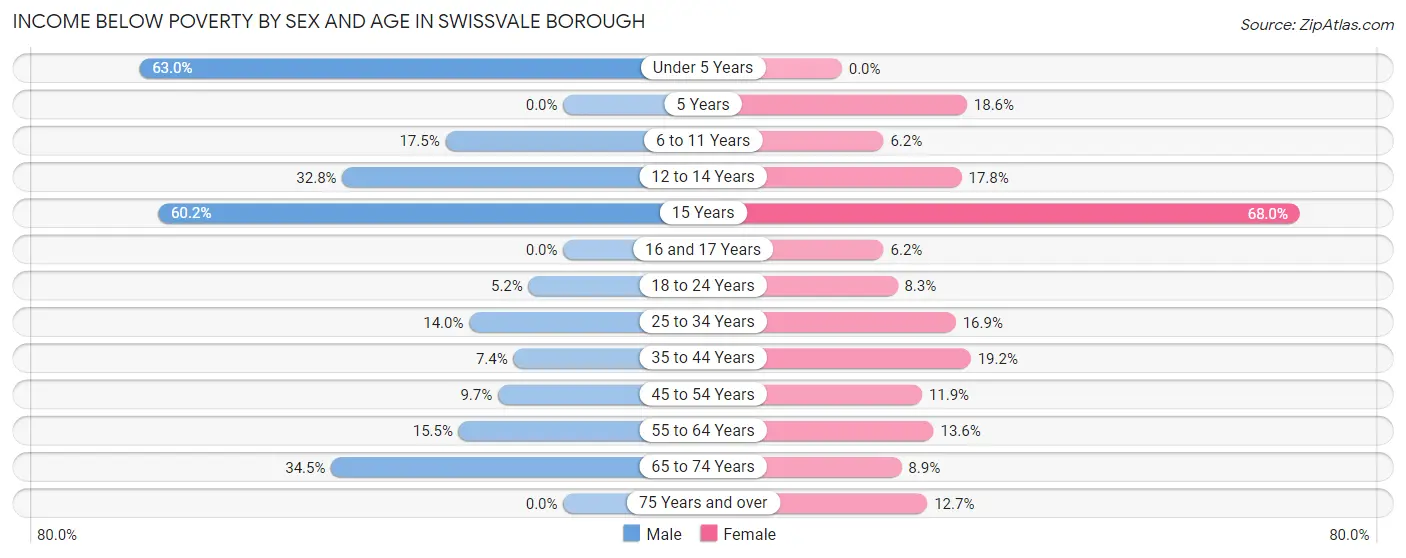
| Age Bracket | Male | Female |
| Under 5 Years | 131 (63.0%) | 0 (0.0%) |
| 5 Years | 0 (0.0%) | 13 (18.6%) |
| 6 to 11 Years | 63 (17.5%) | 7 (6.2%) |
| 12 to 14 Years | 63 (32.8%) | 16 (17.8%) |
| 15 Years | 65 (60.2%) | 51 (68.0%) |
| 16 and 17 Years | 0 (0.0%) | 9 (6.2%) |
| 18 to 24 Years | 23 (5.2%) | 20 (8.3%) |
| 25 to 34 Years | 131 (14.0%) | 123 (16.9%) |
| 35 to 44 Years | 39 (7.4%) | 140 (19.2%) |
| 45 to 54 Years | 51 (9.7%) | 70 (11.9%) |
| 55 to 64 Years | 63 (15.5%) | 73 (13.6%) |
| 65 to 74 Years | 143 (34.5%) | 47 (8.8%) |
| 75 Years and over | 0 (0.0%) | 34 (12.7%) |
| Total | 772 (17.6%) | 603 (14.4%) |
Income Above Poverty by Sex and Age in Swissvale borough
According to the poverty statistics in Swissvale borough, males aged 5 years and females aged under 5 years are the age groups that are most secure financially, with 100.0% of males and 100.0% of females in these age groups living above the poverty line.
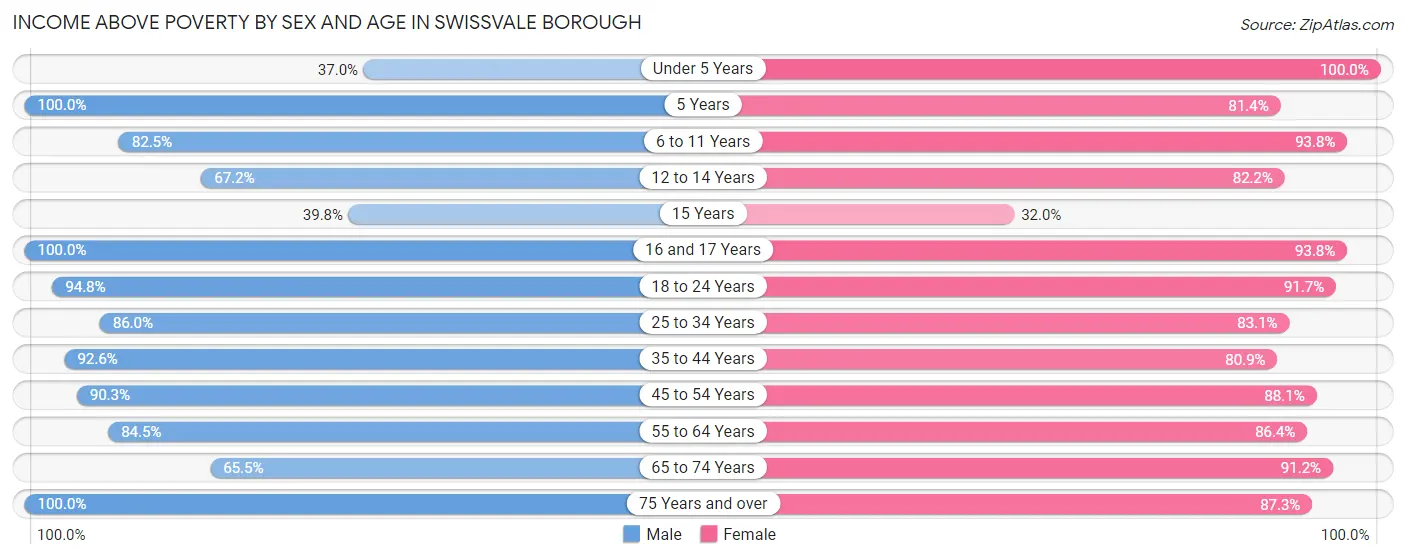
| Age Bracket | Male | Female |
| Under 5 Years | 77 (37.0%) | 61 (100.0%) |
| 5 Years | 7 (100.0%) | 57 (81.4%) |
| 6 to 11 Years | 297 (82.5%) | 106 (93.8%) |
| 12 to 14 Years | 129 (67.2%) | 74 (82.2%) |
| 15 Years | 43 (39.8%) | 24 (32.0%) |
| 16 and 17 Years | 32 (100.0%) | 136 (93.8%) |
| 18 to 24 Years | 423 (94.8%) | 222 (91.7%) |
| 25 to 34 Years | 807 (86.0%) | 604 (83.1%) |
| 35 to 44 Years | 488 (92.6%) | 591 (80.8%) |
| 45 to 54 Years | 475 (90.3%) | 518 (88.1%) |
| 55 to 64 Years | 343 (84.5%) | 463 (86.4%) |
| 65 to 74 Years | 272 (65.5%) | 484 (91.1%) |
| 75 Years and over | 231 (100.0%) | 234 (87.3%) |
| Total | 3,624 (82.4%) | 3,574 (85.6%) |
Income Below Poverty Among Married-Couple Families in Swissvale borough
The poverty statistics for married-couple families in Swissvale borough show that 1.8% or 18 of the total 1,013 families live below the poverty line. Families with no children have the highest poverty rate of 2.5%, comprising of 18 families. On the other hand, families with 1 or 2 children have the lowest poverty rate of 0.0%, which includes 0 families.
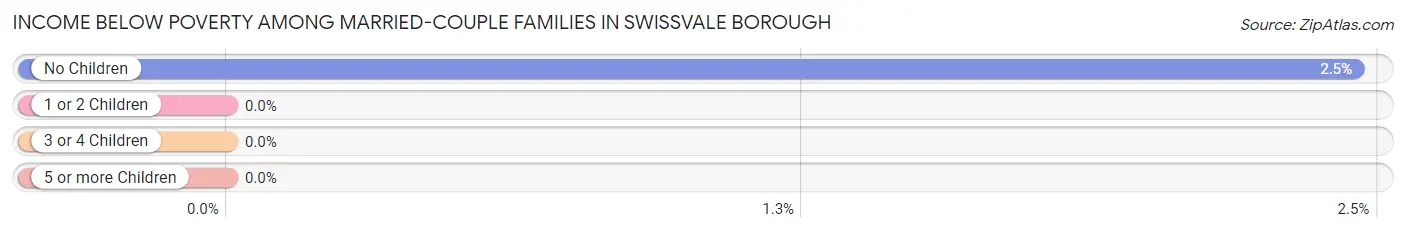
| Children | Above Poverty | Below Poverty |
| No Children | 718 (97.6%) | 18 (2.5%) |
| 1 or 2 Children | 205 (100.0%) | 0 (0.0%) |
| 3 or 4 Children | 61 (100.0%) | 0 (0.0%) |
| 5 or more Children | 11 (100.0%) | 0 (0.0%) |
| Total | 995 (98.2%) | 18 (1.8%) |
Income Below Poverty Among Single-Parent Households in Swissvale borough
According to the poverty data in Swissvale borough, 6.3% or 16 single-father households and 29.5% or 122 single-mother households are living below the poverty line. Among single-father households, those with no children have the highest poverty rate, with 16 households (18.0%) experiencing poverty. Likewise, among single-mother households, those with 5 or more children have the highest poverty rate, with 61 households (100.0%) falling below the poverty line.
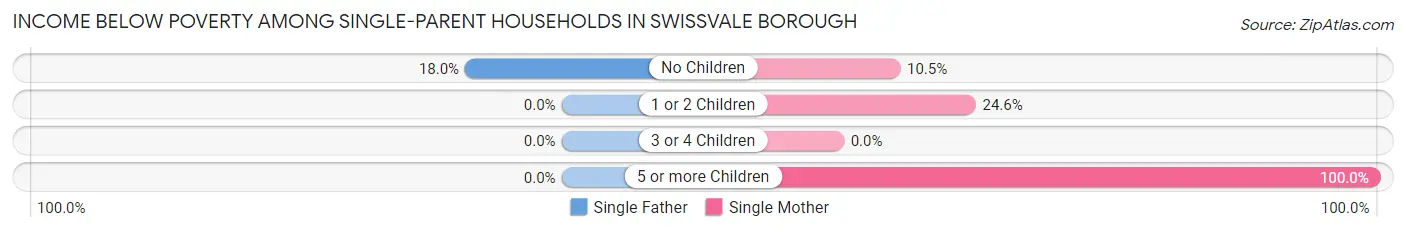
| Children | Single Father | Single Mother |
| No Children | 16 (18.0%) | 19 (10.5%) |
| 1 or 2 Children | 0 (0.0%) | 42 (24.6%) |
| 3 or 4 Children | 0 (0.0%) | 0 (0.0%) |
| 5 or more Children | 0 (0.0%) | 61 (100.0%) |
| Total | 16 (6.3%) | 122 (29.5%) |
Income Below Poverty Among Married-Couple vs Single-Parent Households in Swissvale borough
The poverty data for Swissvale borough shows that 18 of the married-couple family households (1.8%) and 138 of the single-parent households (20.7%) are living below the poverty level. Within the married-couple family households, those with no children have the highest poverty rate, with 18 households (2.5%) falling below the poverty line. Among the single-parent households, those with 5 or more children have the highest poverty rate, with 61 household (100.0%) living below poverty.
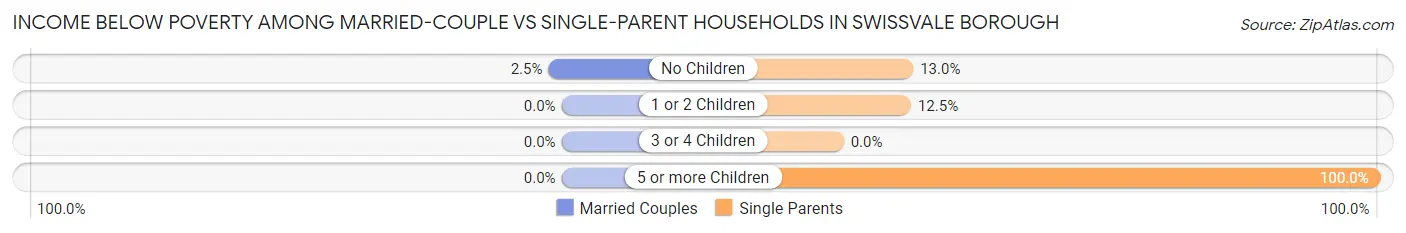
| Children | Married-Couple Families | Single-Parent Households |
| No Children | 18 (2.5%) | 35 (13.0%) |
| 1 or 2 Children | 0 (0.0%) | 42 (12.5%) |
| 3 or 4 Children | 0 (0.0%) | 0 (0.0%) |
| 5 or more Children | 0 (0.0%) | 61 (100.0%) |
| Total | 18 (1.8%) | 138 (20.7%) |
Race in Swissvale borough
The most populous races in Swissvale borough are White / Caucasian (4,962 | 57.8%), Black / African American (2,707 | 31.5%), and Two or more Races (488 | 5.7%).
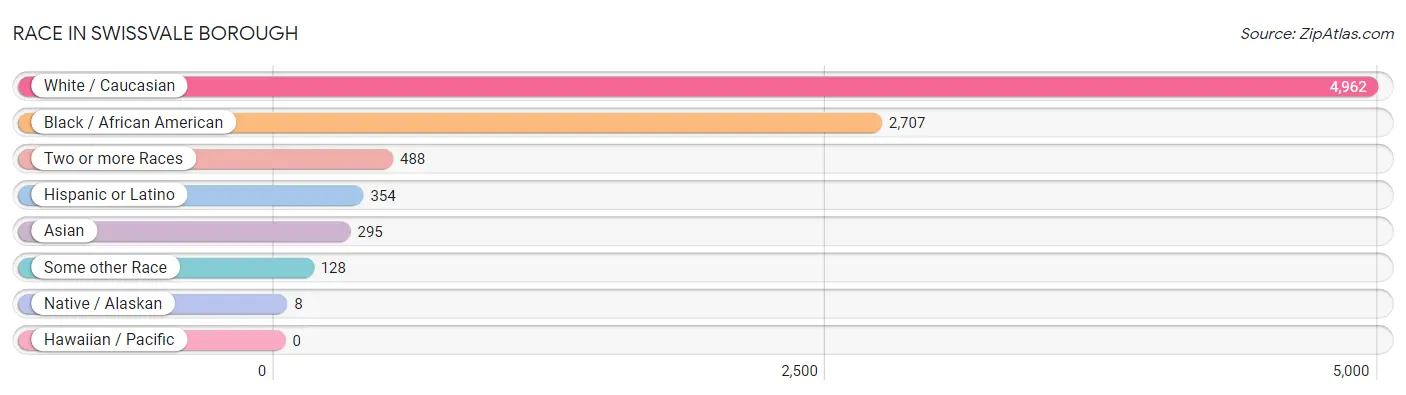
| Race | # Population | % Population |
| Asian | 295 | 3.4% |
| Black / African American | 2,707 | 31.5% |
| Hawaiian / Pacific | 0 | 0.0% |
| Hispanic or Latino | 354 | 4.1% |
| Native / Alaskan | 8 | 0.1% |
| White / Caucasian | 4,962 | 57.8% |
| Two or more Races | 488 | 5.7% |
| Some other Race | 128 | 1.5% |
| Total | 8,588 | 100.0% |
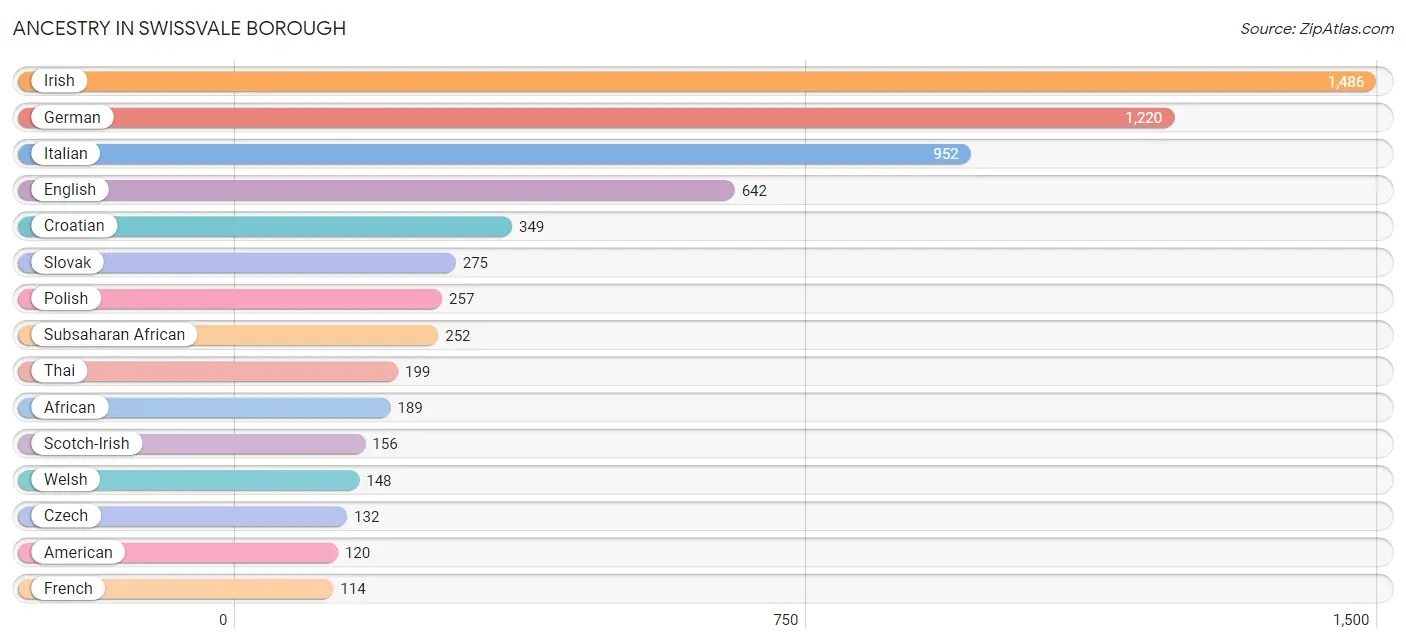
Ancestry in Swissvale borough
The most populous ancestries reported in Swissvale borough are Irish (1,486 | 17.3%), German (1,220 | 14.2%), Italian (952 | 11.1%), English (642 | 7.5%), and Croatian (349 | 4.1%), together accounting for 54.1% of all Swissvale borough residents.
| Ancestry | # Population | % Population |
| African | 189 | 2.2% |
| American | 120 | 1.4% |
| Arab | 61 | 0.7% |
| Austrian | 47 | 0.5% |
| Bermudan | 30 | 0.4% |
| Bhutanese | 9 | 0.1% |
| Blackfeet | 7 | 0.1% |
| Brazilian | 9 | 0.1% |
| British | 7 | 0.1% |
| Bulgarian | 15 | 0.2% |
| Canadian | 19 | 0.2% |
| Carpatho Rusyn | 7 | 0.1% |
| Central American | 53 | 0.6% |
| Cherokee | 37 | 0.4% |
| Colombian | 37 | 0.4% |
| Croatian | 349 | 4.1% |
| Cuban | 26 | 0.3% |
| Czech | 132 | 1.5% |
| Danish | 48 | 0.6% |
| Dominican | 11 | 0.1% |
| Dutch | 70 | 0.8% |
| Eastern European | 17 | 0.2% |
| English | 642 | 7.5% |
| Ethiopian | 10 | 0.1% |
| European | 53 | 0.6% |
| Filipino | 13 | 0.2% |
| French | 114 | 1.3% |
| French Canadian | 3 | 0.0% |
| German | 1,220 | 14.2% |
| Greek | 21 | 0.2% |
| Guatemalan | 24 | 0.3% |
| Haitian | 5 | 0.1% |
| Honduran | 29 | 0.3% |
| Hungarian | 38 | 0.4% |
| Indian (Asian) | 87 | 1.0% |
| Irish | 1,486 | 17.3% |
| Israeli | 10 | 0.1% |
| Italian | 952 | 11.1% |
| Korean | 52 | 0.6% |
| Lithuanian | 35 | 0.4% |
| Mexican | 82 | 0.9% |
| Norwegian | 18 | 0.2% |
| Pennsylvania German | 31 | 0.4% |
| Polish | 257 | 3.0% |
| Puerto Rican | 38 | 0.4% |
| Romanian | 39 | 0.4% |
| Russian | 42 | 0.5% |
| Scotch-Irish | 156 | 1.8% |
| Scottish | 111 | 1.3% |
| Slavic | 9 | 0.1% |
| Slovak | 275 | 3.2% |
| Slovene | 25 | 0.3% |
| South American | 37 | 0.4% |
| Spanish | 90 | 1.1% |
| Subsaharan African | 252 | 2.9% |
| Sudanese | 37 | 0.4% |
| Swedish | 46 | 0.5% |
| Swiss | 49 | 0.6% |
| Syrian | 17 | 0.2% |
| Thai | 199 | 2.3% |
| Trinidadian and Tobagonian | 7 | 0.1% |
| Turkish | 87 | 1.0% |
| Ukrainian | 20 | 0.2% |
| Welsh | 148 | 1.7% | View All 64 Rows |
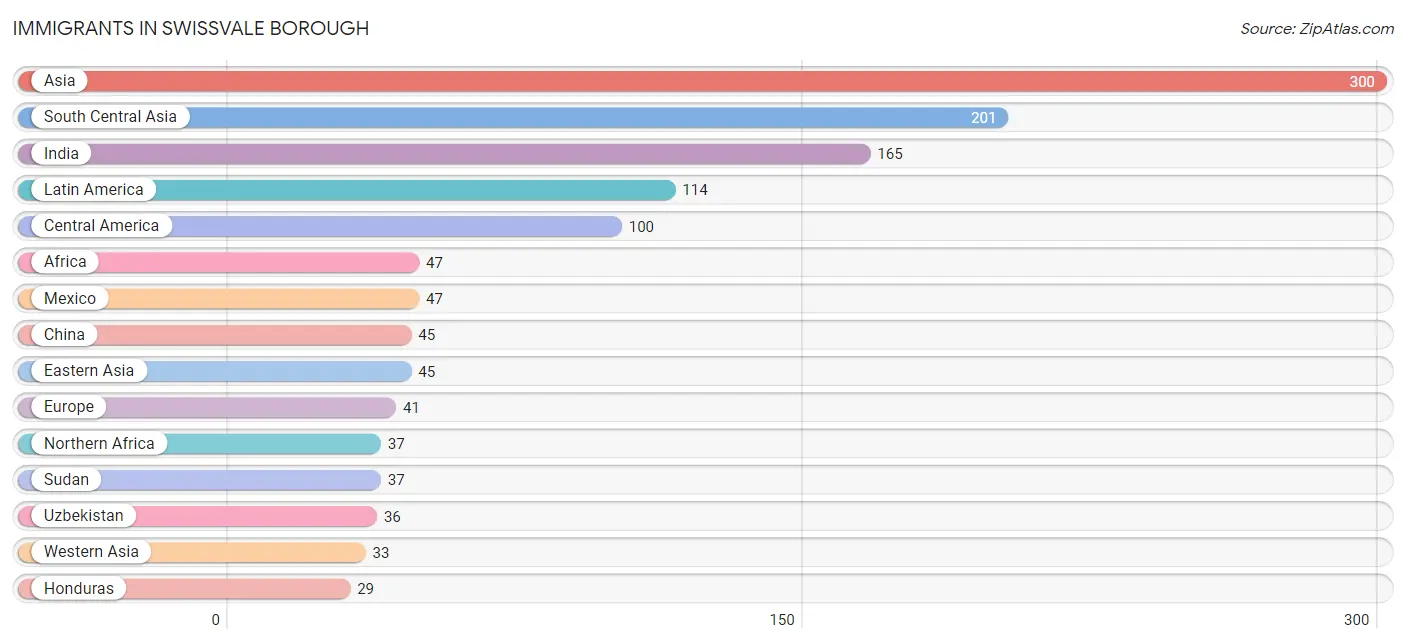
Immigrants in Swissvale borough
The most numerous immigrant groups reported in Swissvale borough came from Asia (300 | 3.5%), South Central Asia (201 | 2.3%), India (165 | 1.9%), Latin America (114 | 1.3%), and Central America (100 | 1.2%), together accounting for 10.2% of all Swissvale borough residents.
| Immigration Origin | # Population | % Population |
| Africa | 47 | 0.5% |
| Asia | 300 | 3.5% |
| Brazil | 9 | 0.1% |
| Bulgaria | 15 | 0.2% |
| Canada | 11 | 0.1% |
| Caribbean | 5 | 0.1% |
| Central America | 100 | 1.2% |
| China | 45 | 0.5% |
| Eastern Africa | 6 | 0.1% |
| Eastern Asia | 45 | 0.5% |
| Eastern Europe | 22 | 0.3% |
| Europe | 41 | 0.5% |
| Greece | 8 | 0.1% |
| Guatemala | 24 | 0.3% |
| Honduras | 29 | 0.3% |
| Hungary | 1 | 0.0% |
| India | 165 | 1.9% |
| Jamaica | 5 | 0.1% |
| Jordan | 16 | 0.2% |
| Kenya | 6 | 0.1% |
| Latin America | 114 | 1.3% |
| Mexico | 47 | 0.5% |
| Nigeria | 4 | 0.1% |
| Northern Africa | 37 | 0.4% |
| Philippines | 21 | 0.2% |
| Poland | 1 | 0.0% |
| Romania | 5 | 0.1% |
| South America | 9 | 0.1% |
| South Central Asia | 201 | 2.3% |
| South Eastern Asia | 21 | 0.2% |
| Southern Europe | 8 | 0.1% |
| Sudan | 37 | 0.4% |
| Switzerland | 11 | 0.1% |
| Taiwan | 13 | 0.2% |
| Turkey | 17 | 0.2% |
| Uzbekistan | 36 | 0.4% |
| Western Africa | 4 | 0.1% |
| Western Asia | 33 | 0.4% |
| Western Europe | 11 | 0.1% | View All 39 Rows |
Sex and Age in Swissvale borough
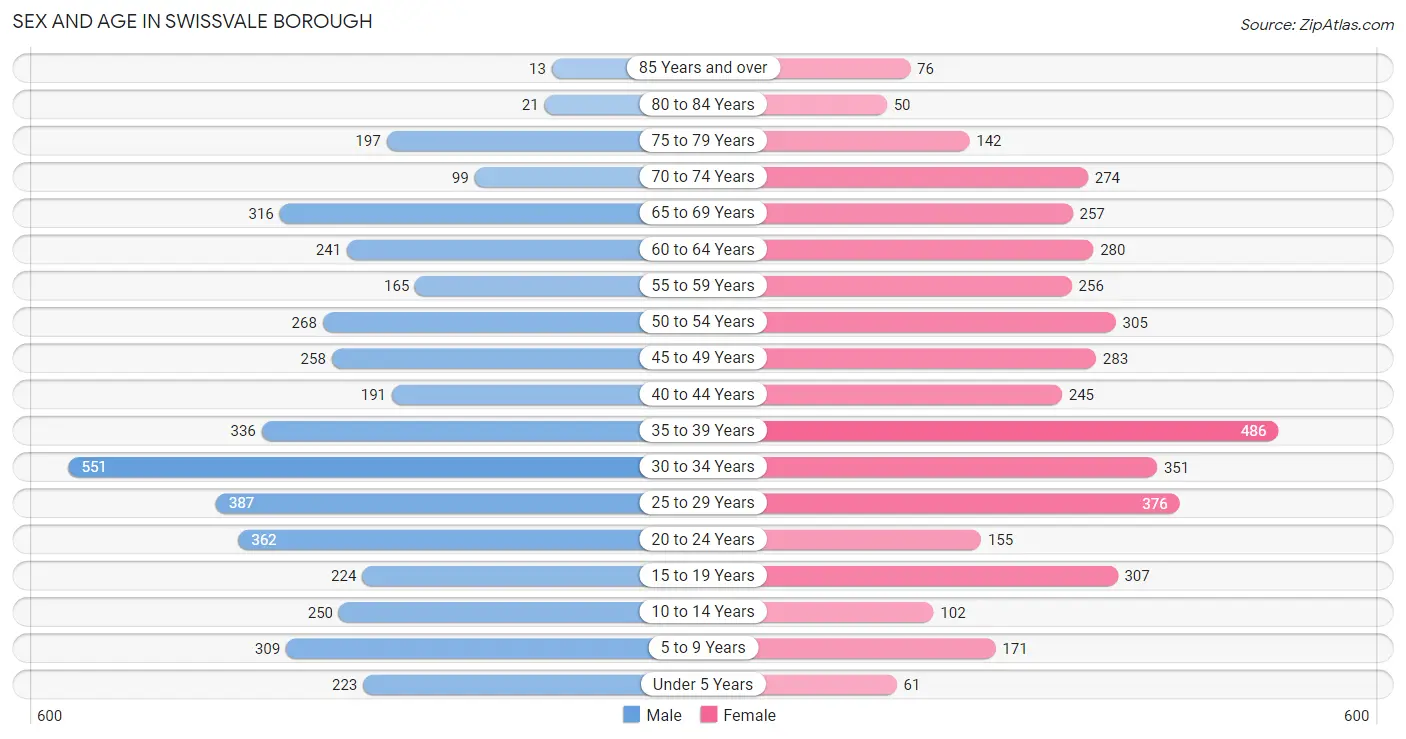
Sex and Age in Swissvale borough
The most populous age groups in Swissvale borough are 30 to 34 Years (551 | 12.5%) for men and 35 to 39 Years (486 | 11.6%) for women.
| Age Bracket | Male | Female |
| Under 5 Years | 223 (5.1%) | 61 (1.5%) |
| 5 to 9 Years | 309 (7.0%) | 171 (4.1%) |
| 10 to 14 Years | 250 (5.7%) | 102 (2.4%) |
| 15 to 19 Years | 224 (5.1%) | 307 (7.3%) |
| 20 to 24 Years | 362 (8.2%) | 155 (3.7%) |
| 25 to 29 Years | 387 (8.8%) | 376 (9.0%) |
| 30 to 34 Years | 551 (12.5%) | 351 (8.4%) |
| 35 to 39 Years | 336 (7.6%) | 486 (11.6%) |
| 40 to 44 Years | 191 (4.3%) | 245 (5.9%) |
| 45 to 49 Years | 258 (5.9%) | 283 (6.8%) |
| 50 to 54 Years | 268 (6.1%) | 305 (7.3%) |
| 55 to 59 Years | 165 (3.7%) | 256 (6.1%) |
| 60 to 64 Years | 241 (5.5%) | 280 (6.7%) |
| 65 to 69 Years | 316 (7.2%) | 257 (6.1%) |
| 70 to 74 Years | 99 (2.2%) | 274 (6.6%) |
| 75 to 79 Years | 197 (4.5%) | 142 (3.4%) |
| 80 to 84 Years | 21 (0.5%) | 50 (1.2%) |
| 85 Years and over | 13 (0.3%) | 76 (1.8%) |
| Total | 4,411 (100.0%) | 4,177 (100.0%) |
Families and Households in Swissvale borough
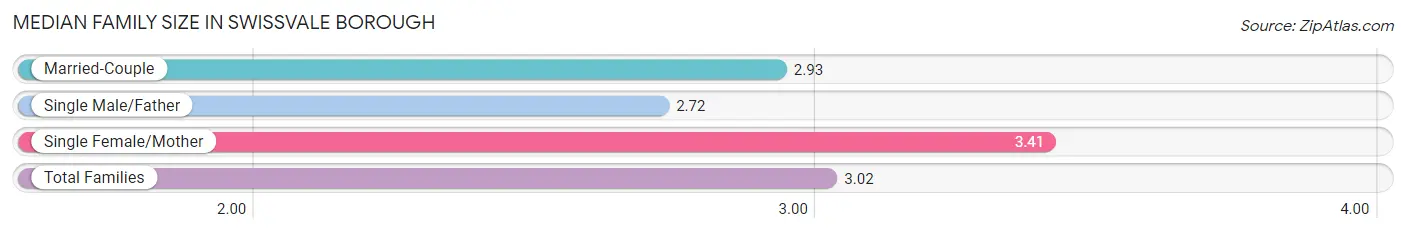
Median Family Size in Swissvale borough
The median family size in Swissvale borough is 3.02 persons per family, with single female/mother families (413 | 24.6%) accounting for the largest median family size of 3.41 persons per family. On the other hand, single male/father families (253 | 15.1%) represent the smallest median family size with 2.72 persons per family.
| Family Type | # Families | Family Size |
| Married-Couple | 1,013 (60.3%) | 2.93 |
| Single Male/Father | 253 (15.1%) | 2.72 |
| Single Female/Mother | 413 (24.6%) | 3.41 |
| Total Families | 1,679 (100.0%) | 3.02 |
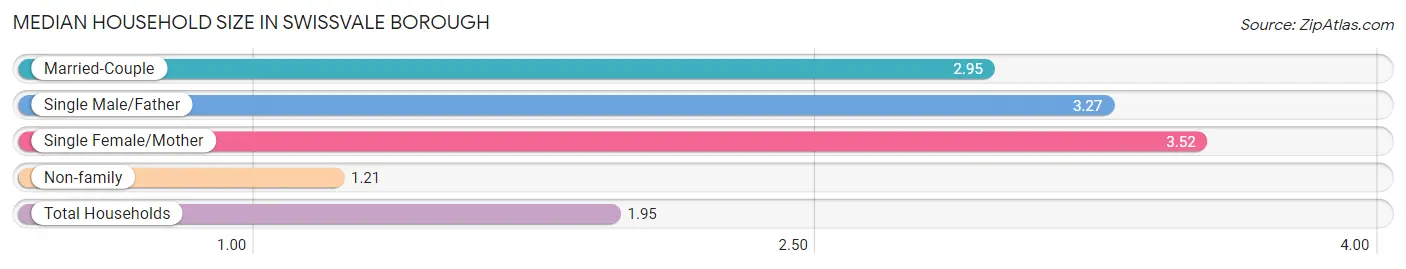
Median Household Size in Swissvale borough
The median household size in Swissvale borough is 1.95 persons per household, with single female/mother households (413 | 9.4%) accounting for the largest median household size of 3.52 persons per household. non-family households (2,714 | 61.8%) represent the smallest median household size with 1.21 persons per household.
| Household Type | # Households | Household Size |
| Married-Couple | 1,013 (23.1%) | 2.95 |
| Single Male/Father | 253 (5.8%) | 3.27 |
| Single Female/Mother | 413 (9.4%) | 3.52 |
| Non-family | 2,714 (61.8%) | 1.21 |
| Total Households | 4,393 (100.0%) | 1.95 |
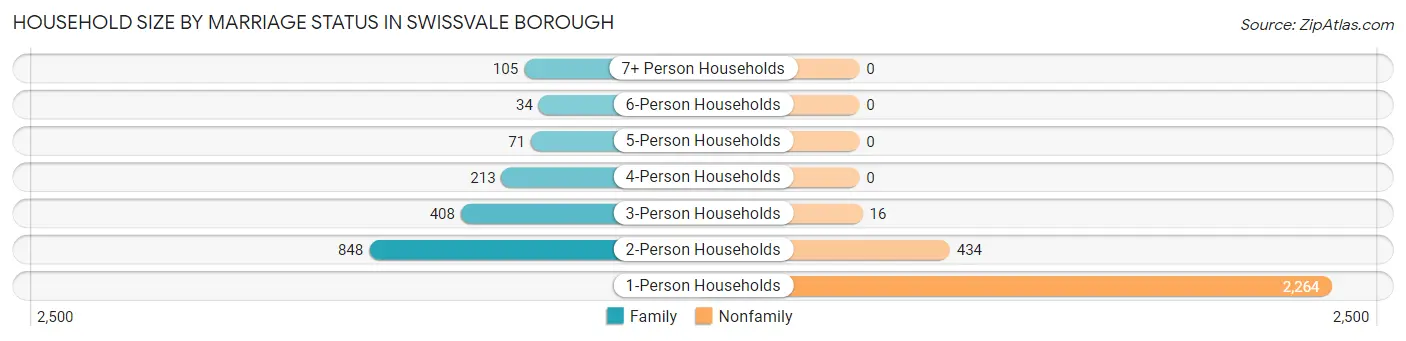
Household Size by Marriage Status in Swissvale borough
Out of a total of 4,393 households in Swissvale borough, 1,679 (38.2%) are family households, while 2,714 (61.8%) are nonfamily households. The most numerous type of family households are 2-person households, comprising 848, and the most common type of nonfamily households are 1-person households, comprising 2,264.
| Household Size | Family Households | Nonfamily Households |
| 1-Person Households | - | 2,264 (51.5%) |
| 2-Person Households | 848 (19.3%) | 434 (9.9%) |
| 3-Person Households | 408 (9.3%) | 16 (0.4%) |
| 4-Person Households | 213 (4.9%) | 0 (0.0%) |
| 5-Person Households | 71 (1.6%) | 0 (0.0%) |
| 6-Person Households | 34 (0.8%) | 0 (0.0%) |
| 7+ Person Households | 105 (2.4%) | 0 (0.0%) |
| Total | 1,679 (38.2%) | 2,714 (61.8%) |
Female Fertility in Swissvale borough
Fertility by Age in Swissvale borough
Average fertility rate in Swissvale borough is 37.0 births per 1,000 women. Women in the age bracket of 20 to 34 years have the highest fertility rate with 84.0 births per 1,000 women. Women in the age bracket of 20 to 34 years acount for 86.1% of all women with births.
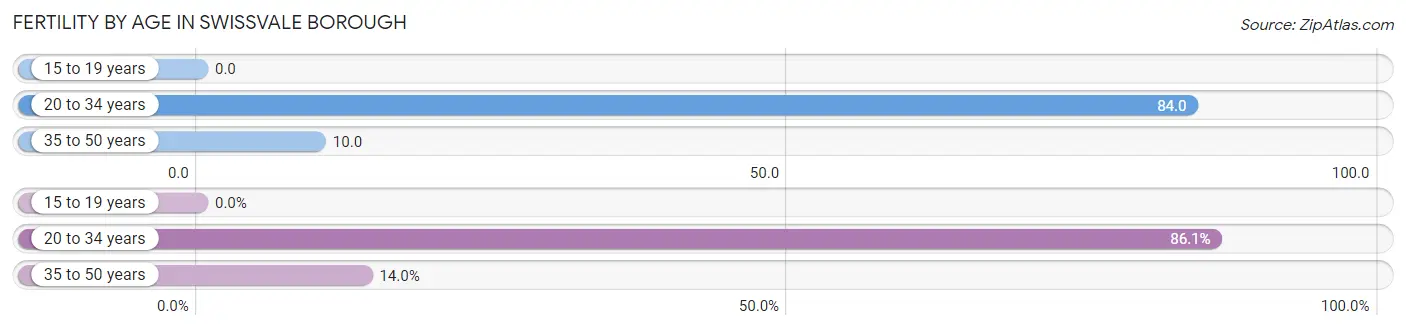
| Age Bracket | Women with Births | Births / 1,000 Women |
| 15 to 19 years | 0 (0.0%) | 0.0 |
| 20 to 34 years | 74 (86.1%) | 84.0 |
| 35 to 50 years | 12 (14.0%) | 10.0 |
| Total | 86 (100.0%) | 37.0 |
Fertility by Age by Marriage Status in Swissvale borough
29.1% of women with births (86) in Swissvale borough are married. The highest percentage of unmarried women with births falls into 20 to 34 years age bracket with 82.4% of them unmarried at the time of birth, while the lowest percentage of unmarried women with births belong to 35 to 50 years age bracket with 0.0% of them unmarried.
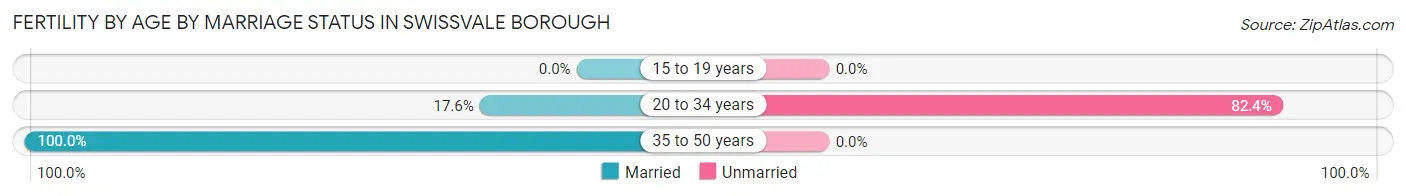
| Age Bracket | Married | Unmarried |
| 15 to 19 years | 0 (0.0%) | 0 (0.0%) |
| 20 to 34 years | 13 (17.6%) | 61 (82.4%) |
| 35 to 50 years | 12 (100.0%) | 0 (0.0%) |
| Total | 25 (29.1%) | 61 (70.9%) |
Fertility by Education in Swissvale borough
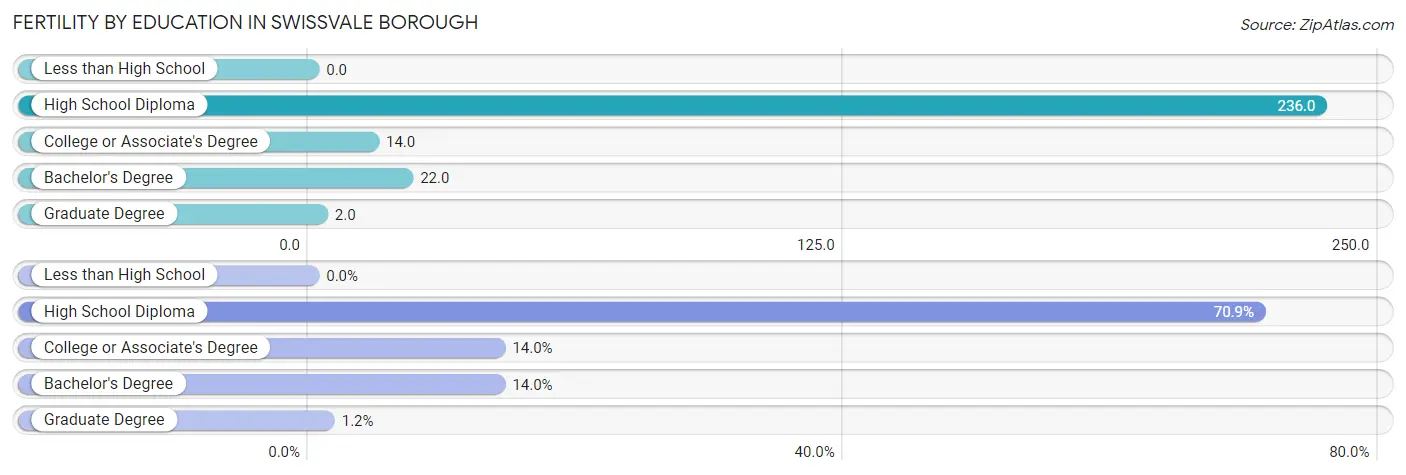
| Educational Attainment | Women with Births | Births / 1,000 Women |
| Less than High School | 0 (0.0%) | 0.0 |
| High School Diploma | 61 (70.9%) | 236.0 |
| College or Associate's Degree | 12 (14.0%) | 14.0 |
| Bachelor's Degree | 12 (14.0%) | 22.0 |
| Graduate Degree | 1 (1.2%) | 2.0 |
| Total | 86 (100.0%) | 37.0 |
Fertility by Education by Marriage Status in Swissvale borough
70.9% of women with births in Swissvale borough are unmarried. Women with the educational attainment of college or associate's degree are most likely to be married with 100.0% of them married at childbirth, while women with the educational attainment of high school diploma are least likely to be married with 100.0% of them unmarried at childbirth.
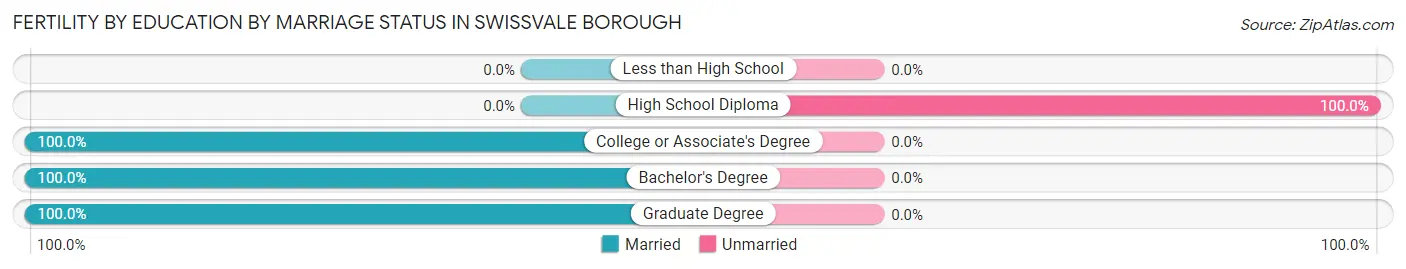
| Educational Attainment | Married | Unmarried |
| Less than High School | 0 (0.0%) | 0 (0.0%) |
| High School Diploma | 0 (0.0%) | 61 (100.0%) |
| College or Associate's Degree | 12 (100.0%) | 0 (0.0%) |
| Bachelor's Degree | 12 (100.0%) | 0 (0.0%) |
| Graduate Degree | 1 (100.0%) | 0 (0.0%) |
| Total | 25 (29.1%) | 61 (70.9%) |
Employment Characteristics in Swissvale borough
Employment by Class of Employer in Swissvale borough
Among the 4,851 employed individuals in Swissvale borough, private company employees (2,930 | 60.4%), not-for-profit organizations (1,110 | 22.9%), and self-employed (not incorporated) (352 | 7.3%) make up the most common classes of employment.
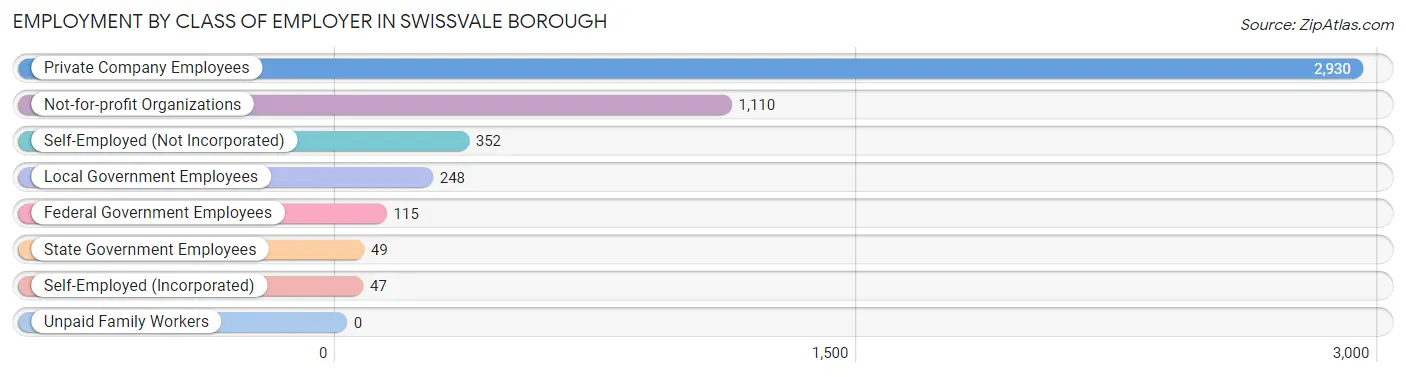
| Employer Class | # Employees | % Employees |
| Private Company Employees | 2,930 | 60.4% |
| Self-Employed (Incorporated) | 47 | 1.0% |
| Self-Employed (Not Incorporated) | 352 | 7.3% |
| Not-for-profit Organizations | 1,110 | 22.9% |
| Local Government Employees | 248 | 5.1% |
| State Government Employees | 49 | 1.0% |
| Federal Government Employees | 115 | 2.4% |
| Unpaid Family Workers | 0 | 0.0% |
| Total | 4,851 | 100.0% |
Employment Status by Age in Swissvale borough
According to the labor force statistics for Swissvale borough, out of the total population over 16 years of age (7,289), 74.1% or 5,401 individuals are in the labor force, with 6.6% or 356 of them unemployed. The age group with the highest labor force participation rate is 25 to 29 years, with 95.8% or 731 individuals in the labor force. Within the labor force, the 55 to 59 years age range has the highest percentage of unemployed individuals, with 20.1% or 59 of them being unemployed.
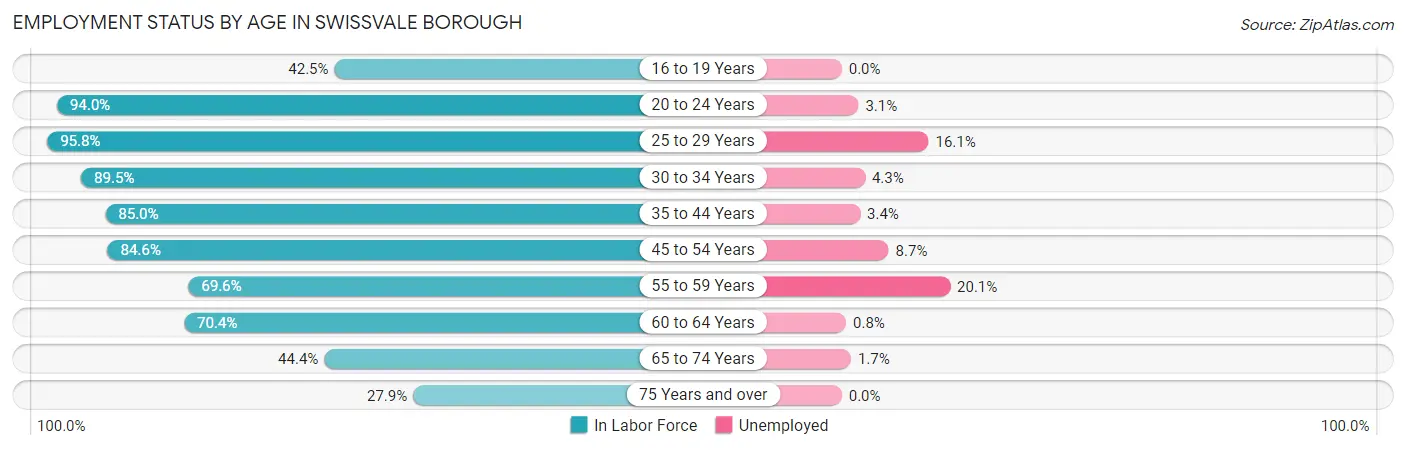
| Age Bracket | In Labor Force | Unemployed |
| 16 to 19 Years | 148 (42.5%) | 0 (0.0%) |
| 20 to 24 Years | 486 (94.0%) | 15 (3.1%) |
| 25 to 29 Years | 731 (95.8%) | 118 (16.1%) |
| 30 to 34 Years | 807 (89.5%) | 35 (4.3%) |
| 35 to 44 Years | 1,069 (85.0%) | 36 (3.4%) |
| 45 to 54 Years | 942 (84.6%) | 82 (8.7%) |
| 55 to 59 Years | 293 (69.6%) | 59 (20.1%) |
| 60 to 64 Years | 367 (70.4%) | 3 (0.8%) |
| 65 to 74 Years | 420 (44.4%) | 7 (1.7%) |
| 75 Years and over | 139 (27.9%) | 0 (0.0%) |
| Total | 5,401 (74.1%) | 356 (6.6%) |
Employment Status by Educational Attainment in Swissvale borough
According to labor force statistics for Swissvale borough, 84.6% of individuals (4,212) out of the total population between 25 and 64 years of age (4,979) are in the labor force, with 7.9% or 333 of them being unemployed. The group with the highest labor force participation rate are those with the educational attainment of bachelor's degree or higher, with 90.3% or 1,919 individuals in the labor force. Within the labor force, individuals with high school diploma education have the highest percentage of unemployment, with 18.3% or 150 of them being unemployed.
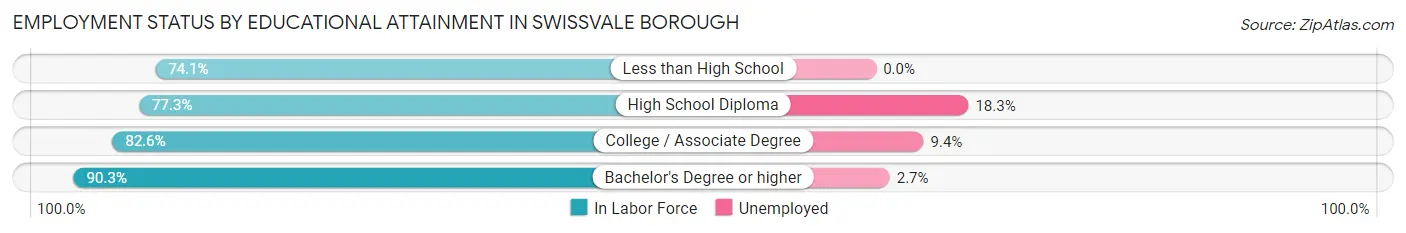
| Educational Attainment | In Labor Force | Unemployed |
| Less than High School | 83 (74.1%) | 0 (0.0%) |
| High School Diploma | 818 (77.3%) | 194 (18.3%) |
| College / Associate Degree | 1,391 (82.6%) | 158 (9.4%) |
| Bachelor's Degree or higher | 1,919 (90.3%) | 57 (2.7%) |
| Total | 4,212 (84.6%) | 393 (7.9%) |
Employment Occupations by Sex in Swissvale borough
Management, Business, Science and Arts Occupations
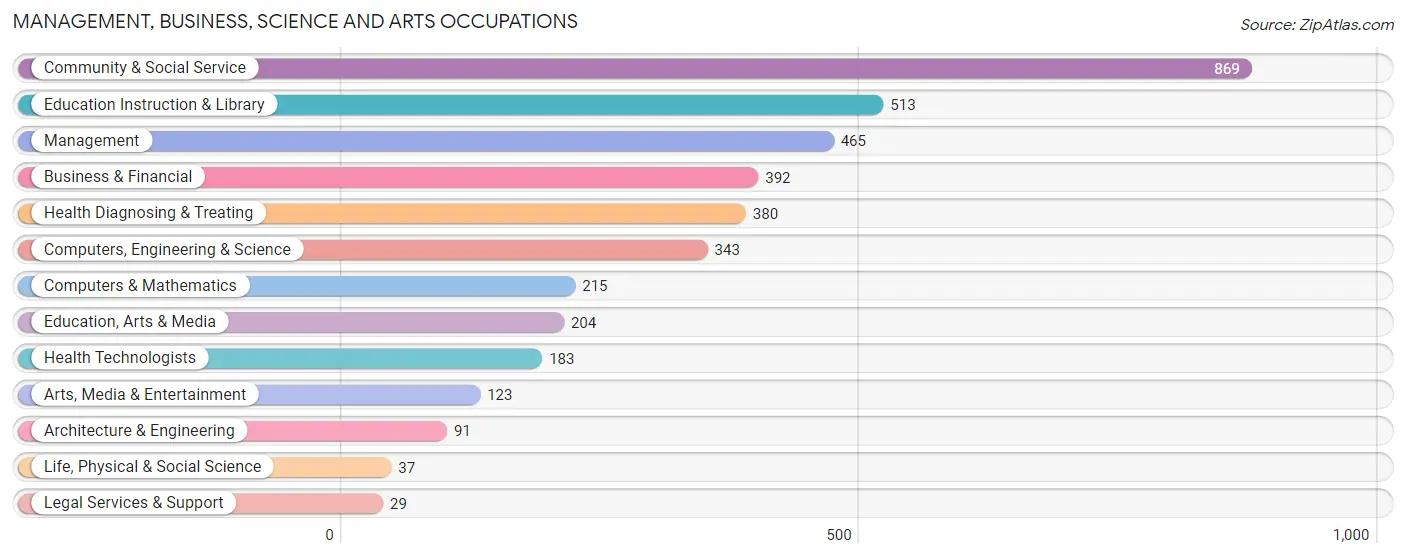
The most common Management, Business, Science and Arts occupations in Swissvale borough are Community & Social Service (869 | 17.2%), Education Instruction & Library (513 | 10.2%), Management (465 | 9.2%), Business & Financial (392 | 7.8%), and Health Diagnosing & Treating (380 | 7.5%).
Management, Business, Science and Arts Occupations by Sex
Within the Management, Business, Science and Arts occupations in Swissvale borough, the most male-oriented occupations are Life, Physical & Social Science (97.3%), Architecture & Engineering (92.3%), and Computers, Engineering & Science (80.5%), while the most female-oriented occupations are Education Instruction & Library (78.4%), Health Diagnosing & Treating (72.6%), and Community & Social Service (69.9%).
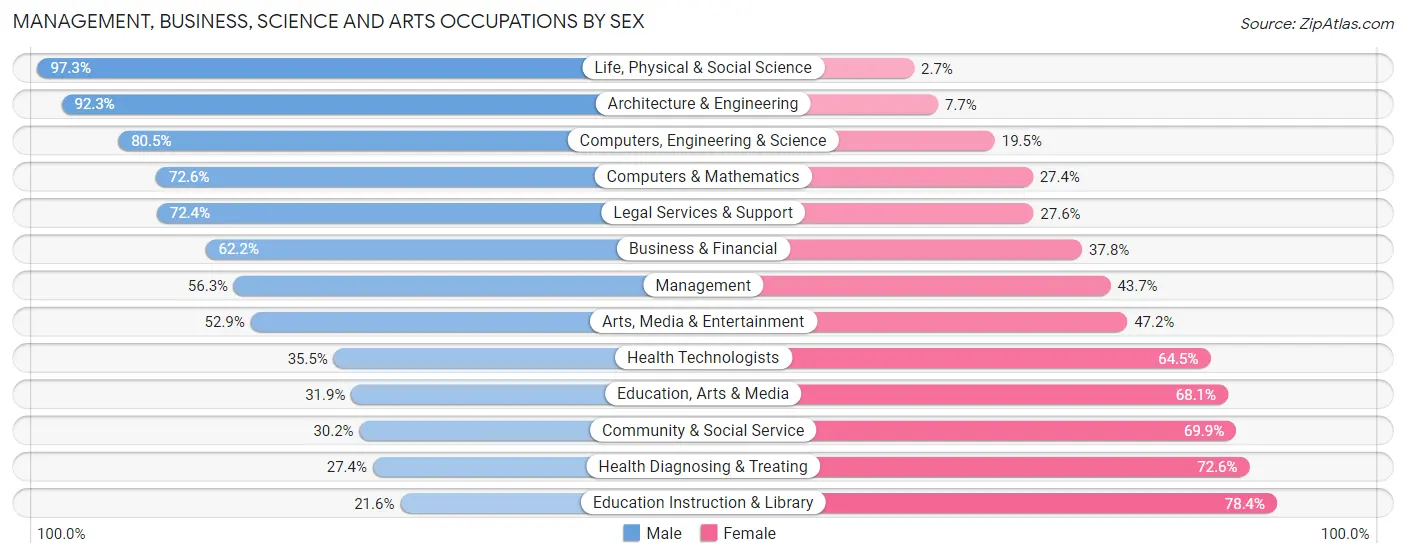
| Occupation | Male | Female |
| Management | 262 (56.3%) | 203 (43.7%) |
| Business & Financial | 244 (62.2%) | 148 (37.8%) |
| Computers, Engineering & Science | 276 (80.5%) | 67 (19.5%) |
| Computers & Mathematics | 156 (72.6%) | 59 (27.4%) |
| Architecture & Engineering | 84 (92.3%) | 7 (7.7%) |
| Life, Physical & Social Science | 36 (97.3%) | 1 (2.7%) |
| Community & Social Service | 262 (30.1%) | 607 (69.9%) |
| Education, Arts & Media | 65 (31.9%) | 139 (68.1%) |
| Legal Services & Support | 21 (72.4%) | 8 (27.6%) |
| Education Instruction & Library | 111 (21.6%) | 402 (78.4%) |
| Arts, Media & Entertainment | 65 (52.8%) | 58 (47.1%) |
| Health Diagnosing & Treating | 104 (27.4%) | 276 (72.6%) |
| Health Technologists | 65 (35.5%) | 118 (64.5%) |
| Total (Category) | 1,148 (46.9%) | 1,301 (53.1%) |
| Total (Overall) | 2,560 (50.7%) | 2,488 (49.3%) |
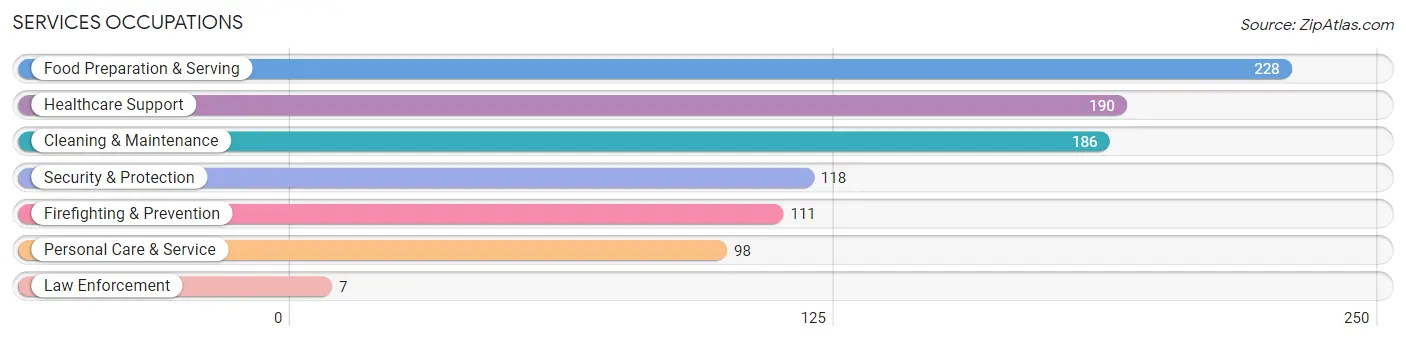
Services Occupations
The most common Services occupations in Swissvale borough are Food Preparation & Serving (228 | 4.5%), Healthcare Support (190 | 3.8%), Cleaning & Maintenance (186 | 3.7%), Security & Protection (118 | 2.3%), and Firefighting & Prevention (111 | 2.2%).
Services Occupations by Sex
Within the Services occupations in Swissvale borough, the most male-oriented occupations are Law Enforcement (100.0%), Cleaning & Maintenance (56.5%), and Security & Protection (54.2%), while the most female-oriented occupations are Healthcare Support (90.5%), Personal Care & Service (89.8%), and Firefighting & Prevention (48.6%).
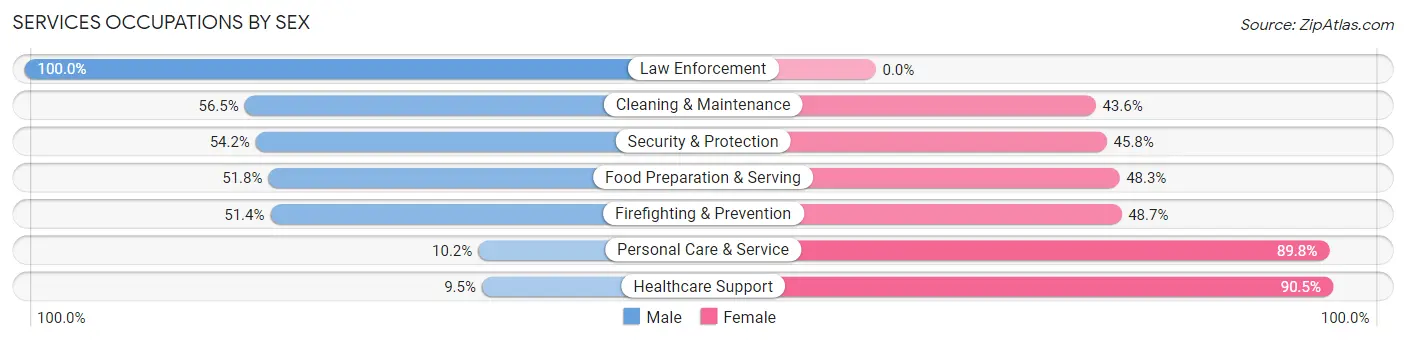
| Occupation | Male | Female |
| Healthcare Support | 18 (9.5%) | 172 (90.5%) |
| Security & Protection | 64 (54.2%) | 54 (45.8%) |
| Firefighting & Prevention | 57 (51.3%) | 54 (48.6%) |
| Law Enforcement | 7 (100.0%) | 0 (0.0%) |
| Food Preparation & Serving | 118 (51.7%) | 110 (48.2%) |
| Cleaning & Maintenance | 105 (56.5%) | 81 (43.5%) |
| Personal Care & Service | 10 (10.2%) | 88 (89.8%) |
| Total (Category) | 315 (38.4%) | 505 (61.6%) |
| Total (Overall) | 2,560 (50.7%) | 2,488 (49.3%) |
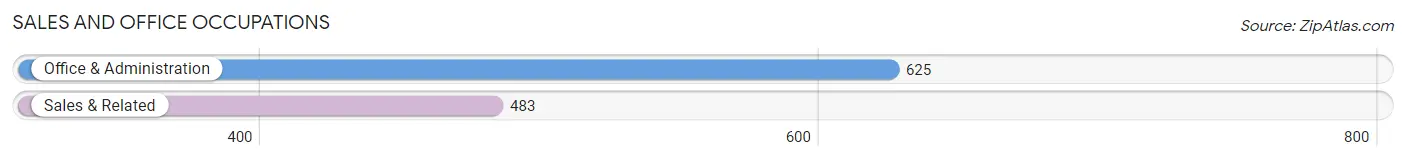
Sales and Office Occupations
The most common Sales and Office occupations in Swissvale borough are Office & Administration (625 | 12.4%), and Sales & Related (483 | 9.6%).
Sales and Office Occupations by Sex
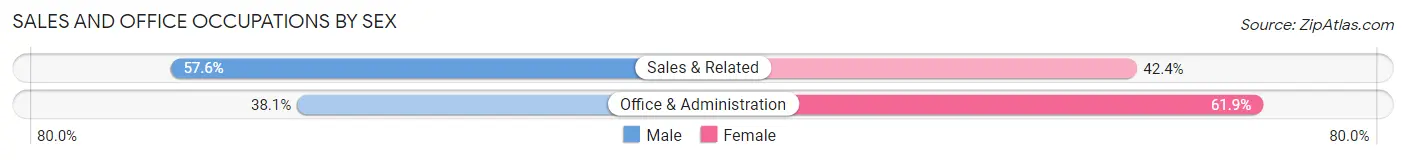
| Occupation | Male | Female |
| Sales & Related | 278 (57.6%) | 205 (42.4%) |
| Office & Administration | 238 (38.1%) | 387 (61.9%) |
| Total (Category) | 516 (46.6%) | 592 (53.4%) |
| Total (Overall) | 2,560 (50.7%) | 2,488 (49.3%) |
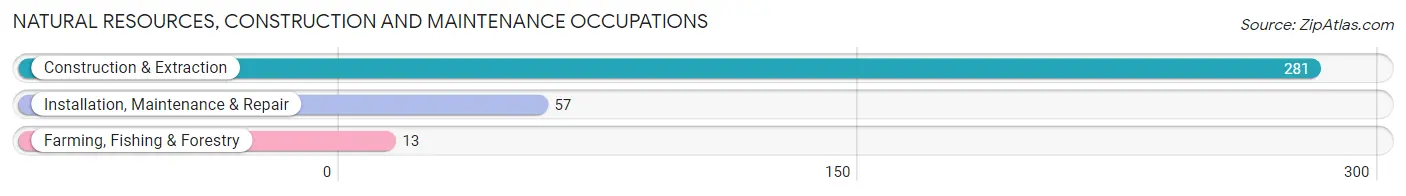
Natural Resources, Construction and Maintenance Occupations
The most common Natural Resources, Construction and Maintenance occupations in Swissvale borough are Construction & Extraction (281 | 5.6%), Installation, Maintenance & Repair (57 | 1.1%), and Farming, Fishing & Forestry (13 | 0.3%).
Natural Resources, Construction and Maintenance Occupations by Sex
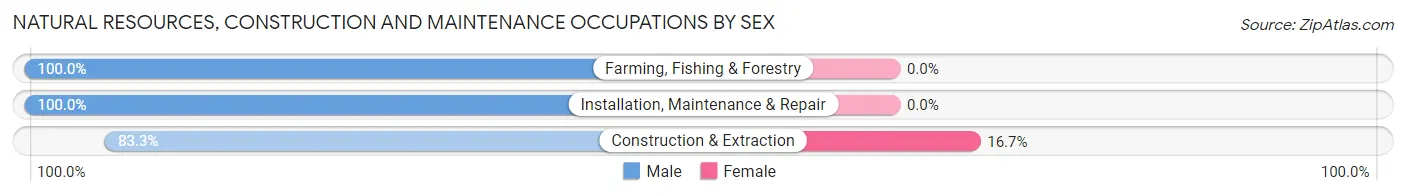
| Occupation | Male | Female |
| Farming, Fishing & Forestry | 13 (100.0%) | 0 (0.0%) |
| Construction & Extraction | 234 (83.3%) | 47 (16.7%) |
| Installation, Maintenance & Repair | 57 (100.0%) | 0 (0.0%) |
| Total (Category) | 304 (86.6%) | 47 (13.4%) |
| Total (Overall) | 2,560 (50.7%) | 2,488 (49.3%) |
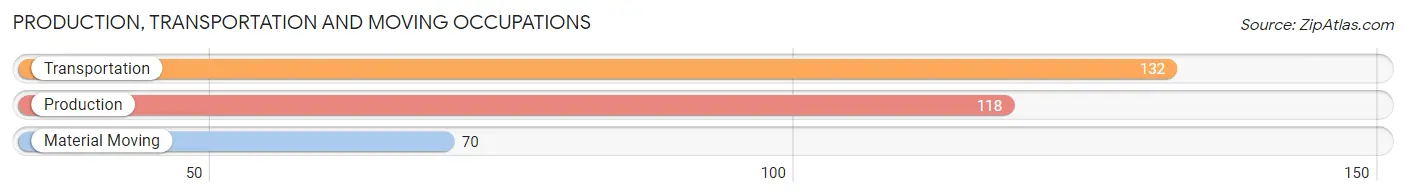
Production, Transportation and Moving Occupations
The most common Production, Transportation and Moving occupations in Swissvale borough are Transportation (132 | 2.6%), Production (118 | 2.3%), and Material Moving (70 | 1.4%).
Production, Transportation and Moving Occupations by Sex
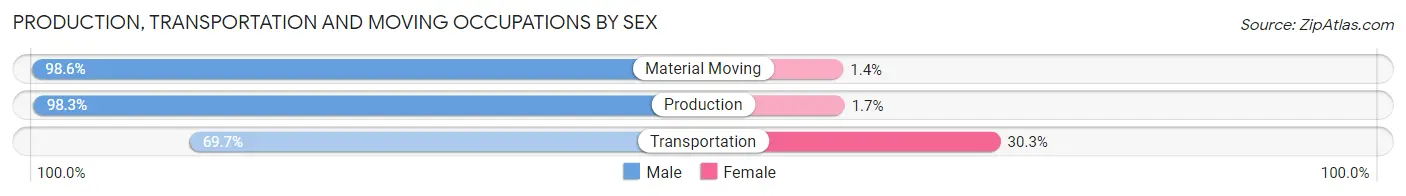
| Occupation | Male | Female |
| Production | 116 (98.3%) | 2 (1.7%) |
| Transportation | 92 (69.7%) | 40 (30.3%) |
| Material Moving | 69 (98.6%) | 1 (1.4%) |
| Total (Category) | 277 (86.6%) | 43 (13.4%) |
| Total (Overall) | 2,560 (50.7%) | 2,488 (49.3%) |
Employment Industries by Sex in Swissvale borough
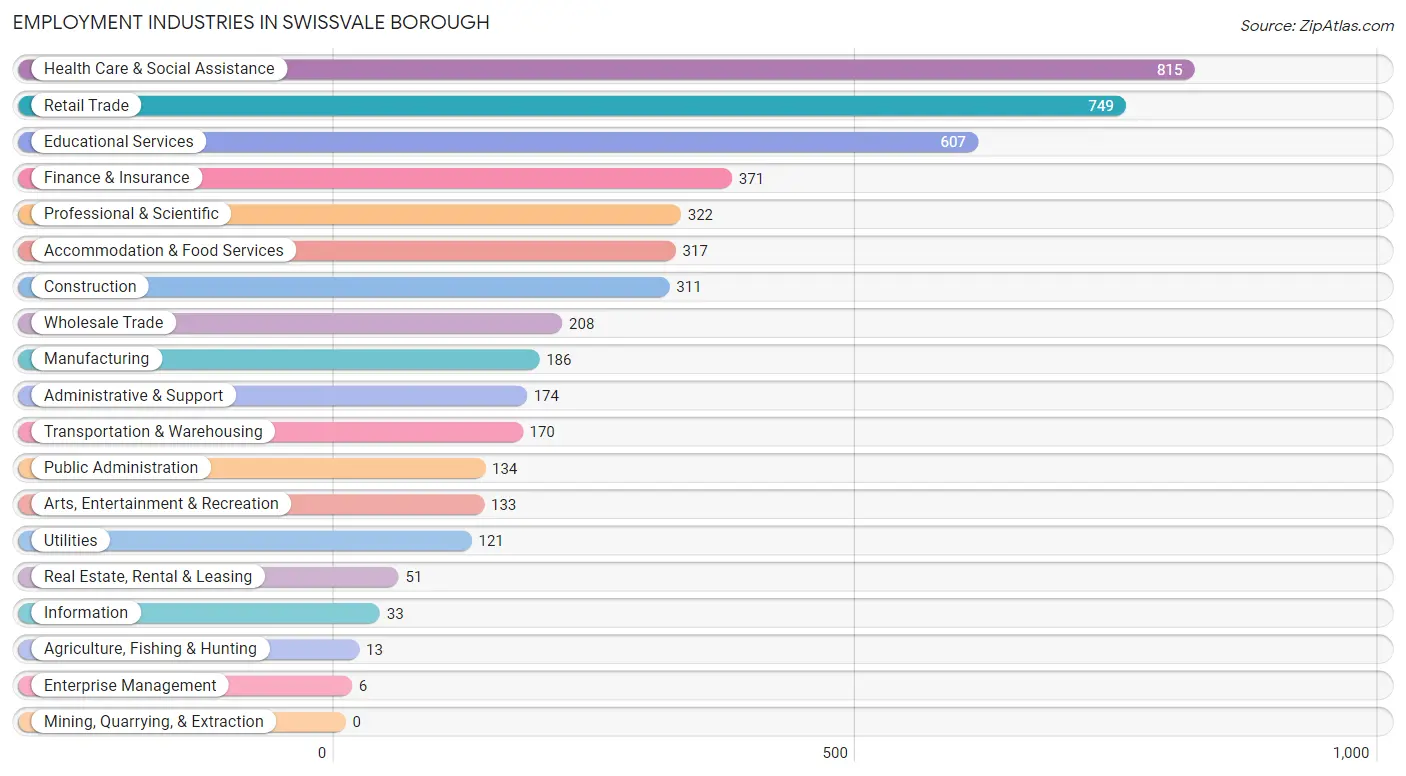
Employment Industries in Swissvale borough
The major employment industries in Swissvale borough include Health Care & Social Assistance (815 | 16.2%), Retail Trade (749 | 14.8%), Educational Services (607 | 12.0%), Finance & Insurance (371 | 7.3%), and Professional & Scientific (322 | 6.4%).
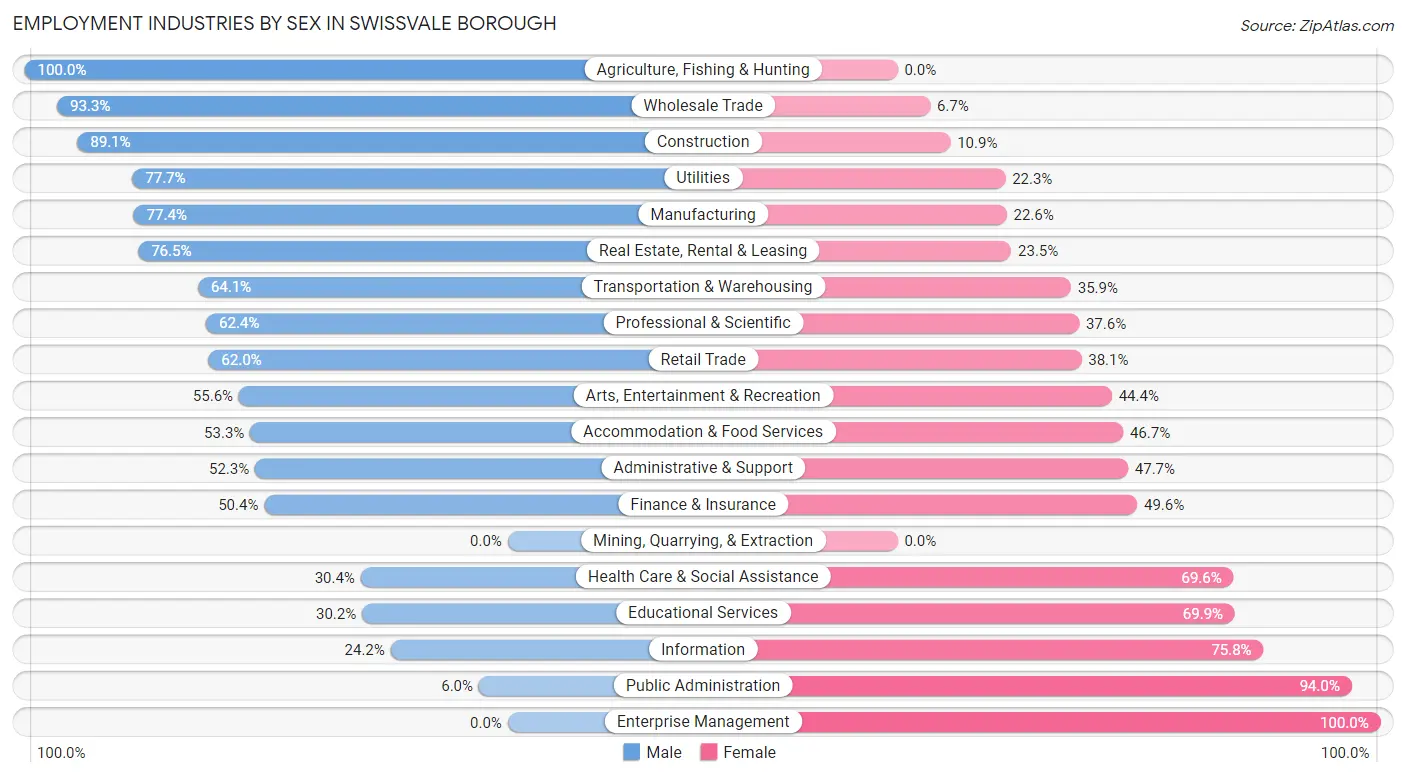
Employment Industries by Sex in Swissvale borough
The Swissvale borough industries that see more men than women are Agriculture, Fishing & Hunting (100.0%), Wholesale Trade (93.3%), and Construction (89.1%), whereas the industries that tend to have a higher number of women are Enterprise Management (100.0%), Public Administration (94.0%), and Information (75.8%).
| Industry | Male | Female |
| Agriculture, Fishing & Hunting | 13 (100.0%) | 0 (0.0%) |
| Mining, Quarrying, & Extraction | 0 (0.0%) | 0 (0.0%) |
| Construction | 277 (89.1%) | 34 (10.9%) |
| Manufacturing | 144 (77.4%) | 42 (22.6%) |
| Wholesale Trade | 194 (93.3%) | 14 (6.7%) |
| Retail Trade | 464 (62.0%) | 285 (38.1%) |
| Transportation & Warehousing | 109 (64.1%) | 61 (35.9%) |
| Utilities | 94 (77.7%) | 27 (22.3%) |
| Information | 8 (24.2%) | 25 (75.8%) |
| Finance & Insurance | 187 (50.4%) | 184 (49.6%) |
| Real Estate, Rental & Leasing | 39 (76.5%) | 12 (23.5%) |
| Professional & Scientific | 201 (62.4%) | 121 (37.6%) |
| Enterprise Management | 0 (0.0%) | 6 (100.0%) |
| Administrative & Support | 91 (52.3%) | 83 (47.7%) |
| Educational Services | 183 (30.1%) | 424 (69.9%) |
| Health Care & Social Assistance | 248 (30.4%) | 567 (69.6%) |
| Arts, Entertainment & Recreation | 74 (55.6%) | 59 (44.4%) |
| Accommodation & Food Services | 169 (53.3%) | 148 (46.7%) |
| Public Administration | 8 (6.0%) | 126 (94.0%) |
| Total | 2,560 (50.7%) | 2,488 (49.3%) |
Education in Swissvale borough
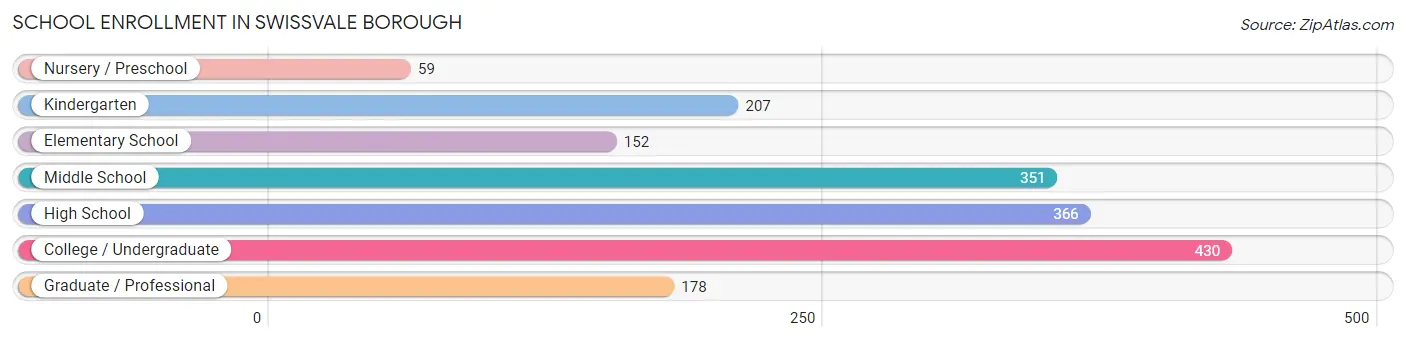
School Enrollment in Swissvale borough
The most common levels of schooling among the 1,743 students in Swissvale borough are college / undergraduate (430 | 24.7%), high school (366 | 21.0%), and middle school (351 | 20.1%).
| School Level | # Students | % Students |
| Nursery / Preschool | 59 | 3.4% |
| Kindergarten | 207 | 11.9% |
| Elementary School | 152 | 8.7% |
| Middle School | 351 | 20.1% |
| High School | 366 | 21.0% |
| College / Undergraduate | 430 | 24.7% |
| Graduate / Professional | 178 | 10.2% |
| Total | 1,743 | 100.0% |
School Enrollment by Age by Funding Source in Swissvale borough
Out of a total of 1,743 students who are enrolled in schools in Swissvale borough, 462 (26.5%) attend a private institution, while the remaining 1,281 (73.5%) are enrolled in public schools. The age group of 3 to 4 year olds has the highest likelihood of being enrolled in private schools, with 40 (67.8% in the age bracket) enrolled. Conversely, the age group of 20 to 24 year olds has the lowest likelihood of being enrolled in a private school, with 144 (85.7% in the age bracket) attending a public institution.
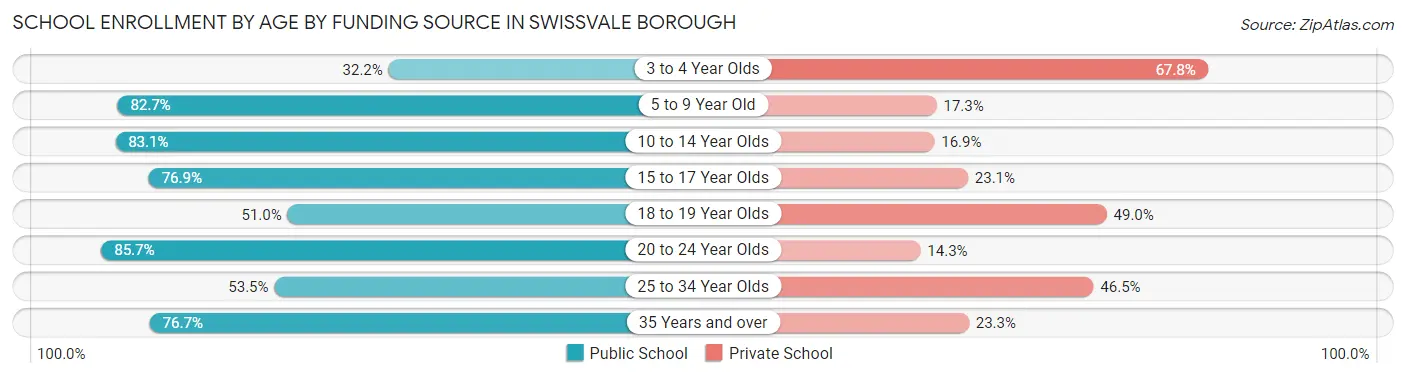
| Age Bracket | Public School | Private School |
| 3 to 4 Year Olds | 19 (32.2%) | 40 (67.8%) |
| 5 to 9 Year Old | 349 (82.7%) | 73 (17.3%) |
| 10 to 14 Year Olds | 266 (83.1%) | 54 (16.9%) |
| 15 to 17 Year Olds | 226 (76.9%) | 68 (23.1%) |
| 18 to 19 Year Olds | 75 (51.0%) | 72 (49.0%) |
| 20 to 24 Year Olds | 144 (85.7%) | 24 (14.3%) |
| 25 to 34 Year Olds | 123 (53.5%) | 107 (46.5%) |
| 35 Years and over | 79 (76.7%) | 24 (23.3%) |
| Total | 1,281 (73.5%) | 462 (26.5%) |
Educational Attainment by Field of Study in Swissvale borough
Business (424 | 14.6%), literature & languages (304 | 10.5%), social sciences (296 | 10.2%), education (282 | 9.7%), and psychology (269 | 9.3%) are the most common fields of study among 2,902 individuals in Swissvale borough who have obtained a bachelor's degree or higher.
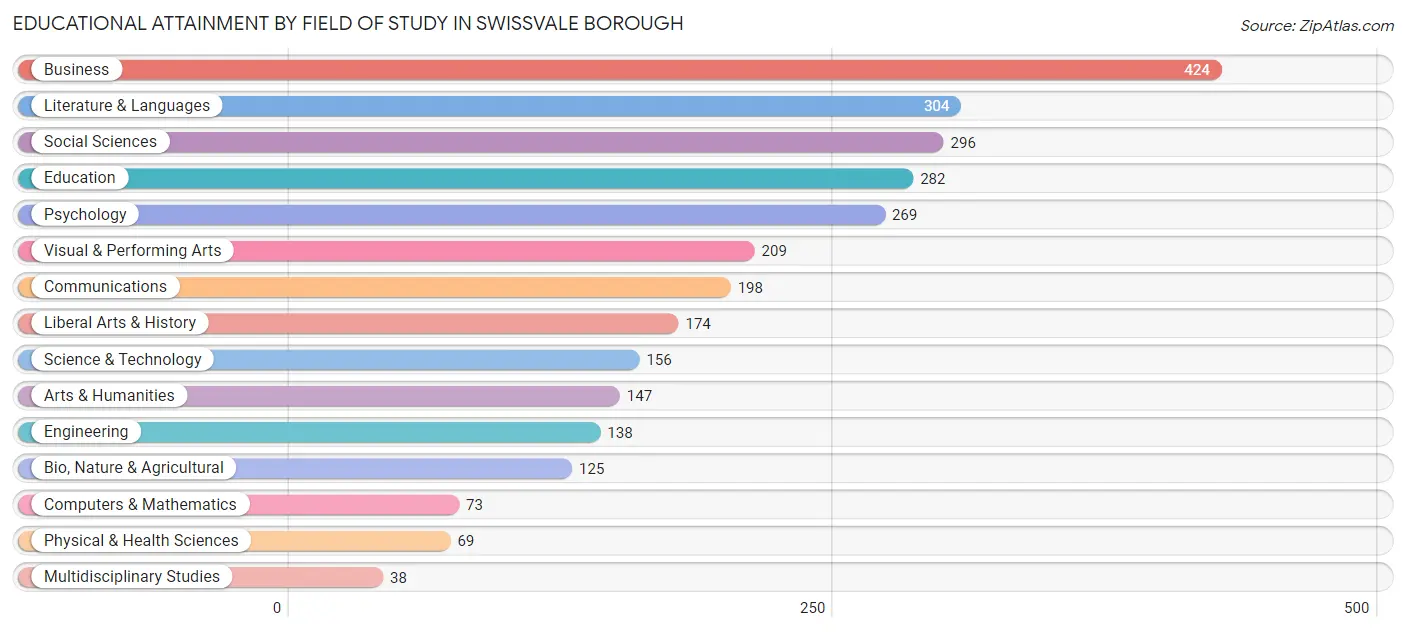
| Field of Study | # Graduates | % Graduates |
| Computers & Mathematics | 73 | 2.5% |
| Bio, Nature & Agricultural | 125 | 4.3% |
| Physical & Health Sciences | 69 | 2.4% |
| Psychology | 269 | 9.3% |
| Social Sciences | 296 | 10.2% |
| Engineering | 138 | 4.8% |
| Multidisciplinary Studies | 38 | 1.3% |
| Science & Technology | 156 | 5.4% |
| Business | 424 | 14.6% |
| Education | 282 | 9.7% |
| Literature & Languages | 304 | 10.5% |
| Liberal Arts & History | 174 | 6.0% |
| Visual & Performing Arts | 209 | 7.2% |
| Communications | 198 | 6.8% |
| Arts & Humanities | 147 | 5.1% |
| Total | 2,902 | 100.0% |
Transportation & Commute in Swissvale borough
Vehicle Availability by Sex in Swissvale borough
The most prevalent vehicle ownership categories in Swissvale borough are males with 1 vehicle (1,094, accounting for 43.4%) and females with 1 vehicle (1,084, making up 46.9%).
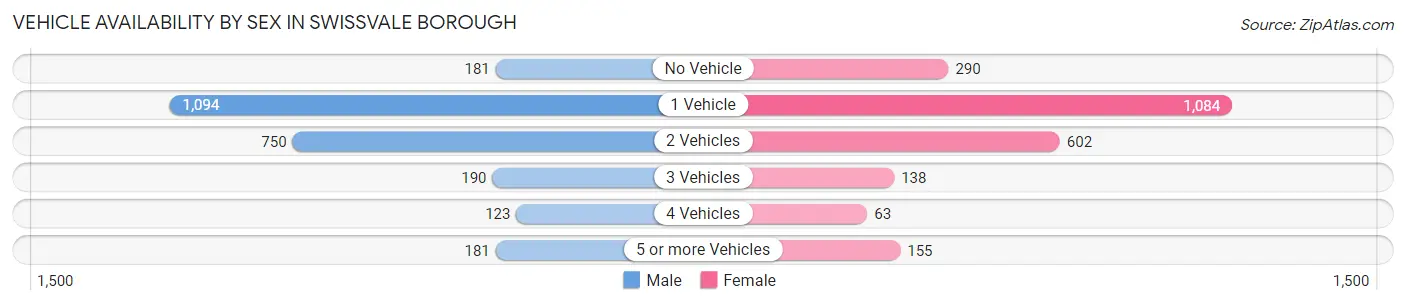
| Vehicles Available | Male | Female |
| No Vehicle | 181 (7.2%) | 290 (12.4%) |
| 1 Vehicle | 1,094 (43.4%) | 1,084 (46.5%) |
| 2 Vehicles | 750 (29.8%) | 602 (25.8%) |
| 3 Vehicles | 190 (7.5%) | 138 (5.9%) |
| 4 Vehicles | 123 (4.9%) | 63 (2.7%) |
| 5 or more Vehicles | 181 (7.2%) | 155 (6.7%) |
| Total | 2,519 (100.0%) | 2,332 (100.0%) |
Commute Time in Swissvale borough
The most frequently occuring commute durations in Swissvale borough are 20 to 24 minutes (671 commuters, 16.9%), 30 to 34 minutes (669 commuters, 16.9%), and 15 to 19 minutes (594 commuters, 15.0%).
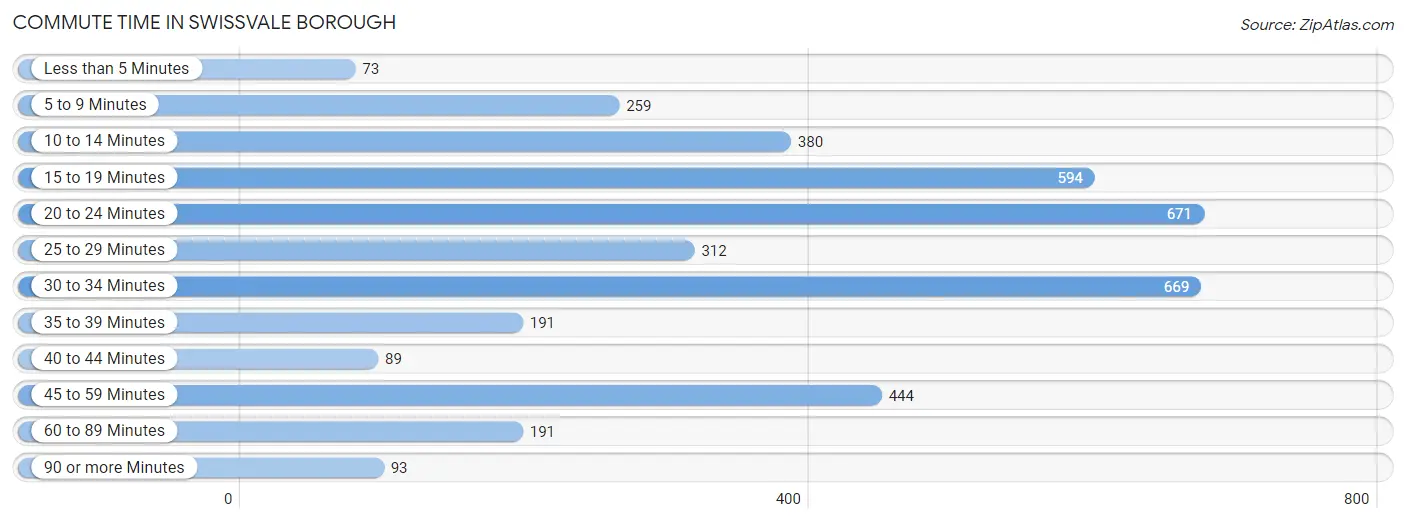
| Commute Time | # Commuters | % Commuters |
| Less than 5 Minutes | 73 | 1.8% |
| 5 to 9 Minutes | 259 | 6.5% |
| 10 to 14 Minutes | 380 | 9.6% |
| 15 to 19 Minutes | 594 | 15.0% |
| 20 to 24 Minutes | 671 | 16.9% |
| 25 to 29 Minutes | 312 | 7.9% |
| 30 to 34 Minutes | 669 | 16.9% |
| 35 to 39 Minutes | 191 | 4.8% |
| 40 to 44 Minutes | 89 | 2.2% |
| 45 to 59 Minutes | 444 | 11.2% |
| 60 to 89 Minutes | 191 | 4.8% |
| 90 or more Minutes | 93 | 2.3% |
Commute Time by Sex in Swissvale borough
The most common commute times in Swissvale borough are 30 to 34 minutes (395 commuters, 19.0%) for males and 20 to 24 minutes (312 commuters, 16.5%) for females.
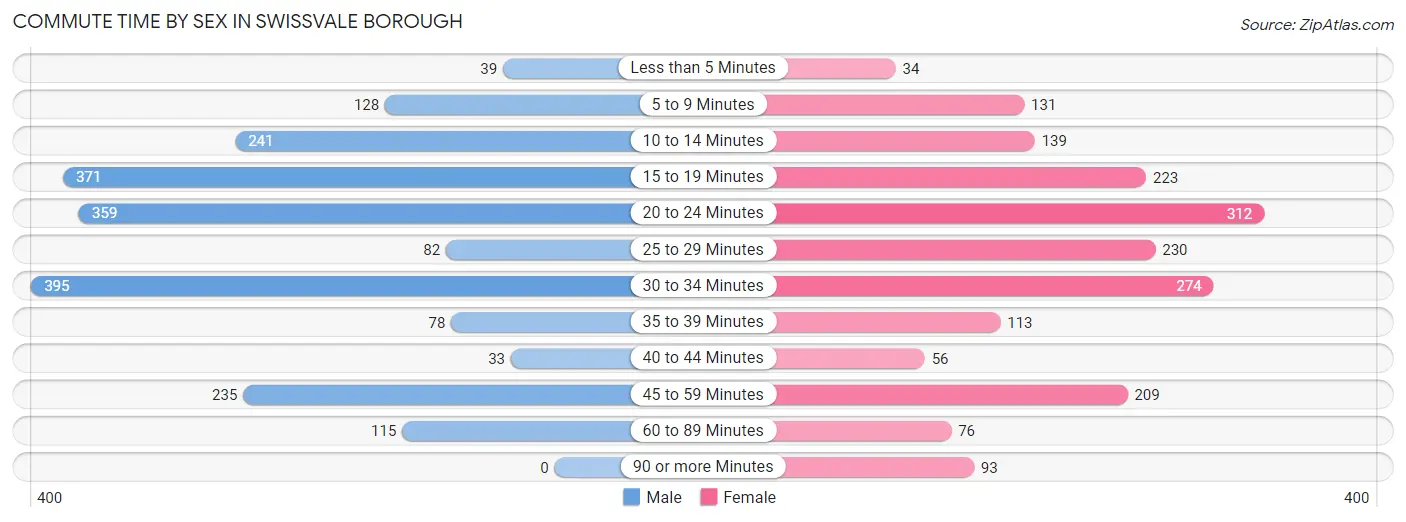
| Commute Time | Male | Female |
| Less than 5 Minutes | 39 (1.9%) | 34 (1.8%) |
| 5 to 9 Minutes | 128 (6.2%) | 131 (6.9%) |
| 10 to 14 Minutes | 241 (11.6%) | 139 (7.3%) |
| 15 to 19 Minutes | 371 (17.9%) | 223 (11.8%) |
| 20 to 24 Minutes | 359 (17.3%) | 312 (16.5%) |
| 25 to 29 Minutes | 82 (4.0%) | 230 (12.2%) |
| 30 to 34 Minutes | 395 (19.0%) | 274 (14.5%) |
| 35 to 39 Minutes | 78 (3.8%) | 113 (6.0%) |
| 40 to 44 Minutes | 33 (1.6%) | 56 (3.0%) |
| 45 to 59 Minutes | 235 (11.3%) | 209 (11.1%) |
| 60 to 89 Minutes | 115 (5.5%) | 76 (4.0%) |
| 90 or more Minutes | 0 (0.0%) | 93 (4.9%) |
Time of Departure to Work by Sex in Swissvale borough
The most frequent times of departure to work in Swissvale borough are 8:00 AM to 8:29 AM (316, 15.2%) for males and 8:00 AM to 8:29 AM (328, 17.3%) for females.
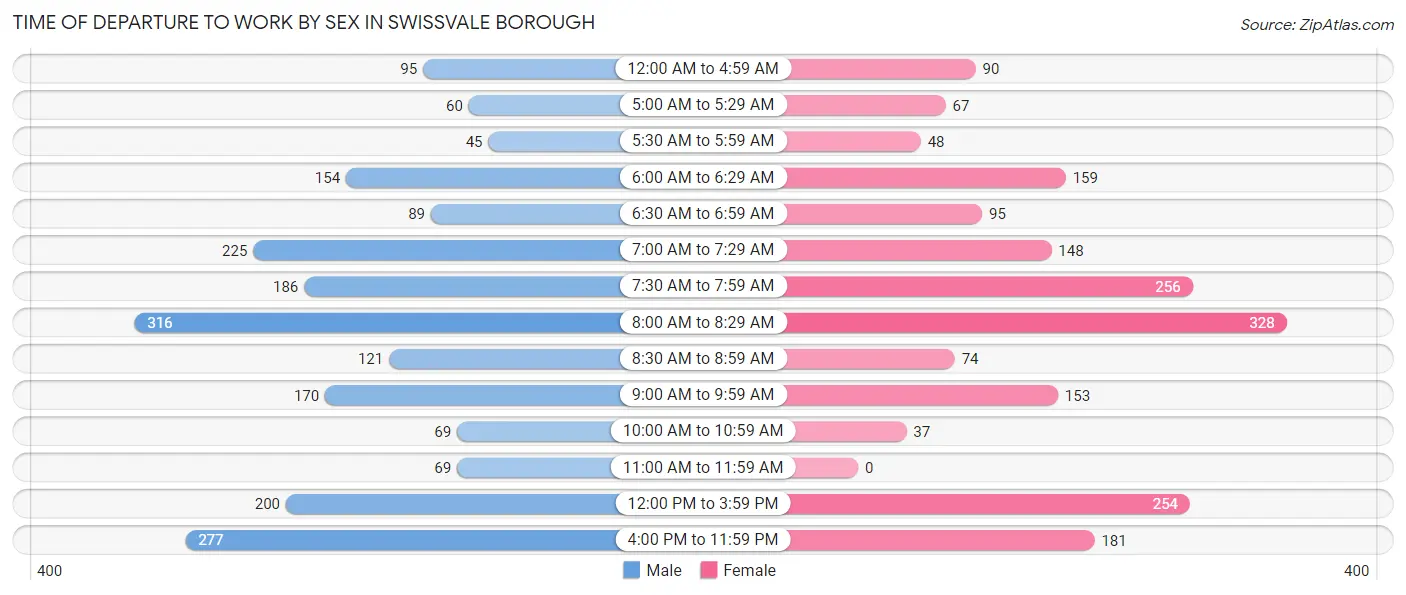
| Time of Departure | Male | Female |
| 12:00 AM to 4:59 AM | 95 (4.6%) | 90 (4.8%) |
| 5:00 AM to 5:29 AM | 60 (2.9%) | 67 (3.5%) |
| 5:30 AM to 5:59 AM | 45 (2.2%) | 48 (2.5%) |
| 6:00 AM to 6:29 AM | 154 (7.4%) | 159 (8.4%) |
| 6:30 AM to 6:59 AM | 89 (4.3%) | 95 (5.0%) |
| 7:00 AM to 7:29 AM | 225 (10.8%) | 148 (7.8%) |
| 7:30 AM to 7:59 AM | 186 (9.0%) | 256 (13.5%) |
| 8:00 AM to 8:29 AM | 316 (15.2%) | 328 (17.3%) |
| 8:30 AM to 8:59 AM | 121 (5.8%) | 74 (3.9%) |
| 9:00 AM to 9:59 AM | 170 (8.2%) | 153 (8.1%) |
| 10:00 AM to 10:59 AM | 69 (3.3%) | 37 (2.0%) |
| 11:00 AM to 11:59 AM | 69 (3.3%) | 0 (0.0%) |
| 12:00 PM to 3:59 PM | 200 (9.6%) | 254 (13.4%) |
| 4:00 PM to 11:59 PM | 277 (13.3%) | 181 (9.6%) |
| Total | 2,076 (100.0%) | 1,890 (100.0%) |
Housing Occupancy in Swissvale borough
Occupancy by Ownership in Swissvale borough
Of the total 4,393 dwellings in Swissvale borough, owner-occupied units account for 2,121 (48.3%), while renter-occupied units make up 2,272 (51.7%).
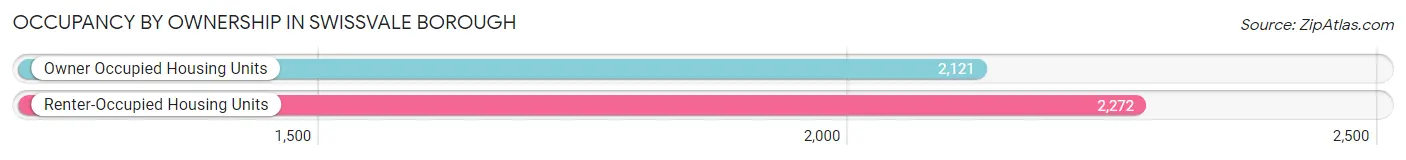
| Occupancy | # Housing Units | % Housing Units |
| Owner Occupied Housing Units | 2,121 | 48.3% |
| Renter-Occupied Housing Units | 2,272 | 51.7% |
| Total Occupied Housing Units | 4,393 | 100.0% |
Occupancy by Household Size in Swissvale borough
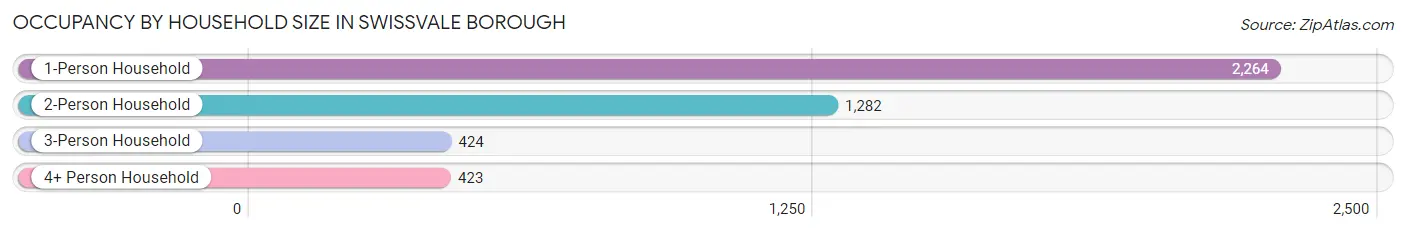
| Household Size | # Housing Units | % Housing Units |
| 1-Person Household | 2,264 | 51.5% |
| 2-Person Household | 1,282 | 29.2% |
| 3-Person Household | 424 | 9.7% |
| 4+ Person Household | 423 | 9.6% |
| Total Housing Units | 4,393 | 100.0% |
Occupancy by Ownership by Household Size in Swissvale borough
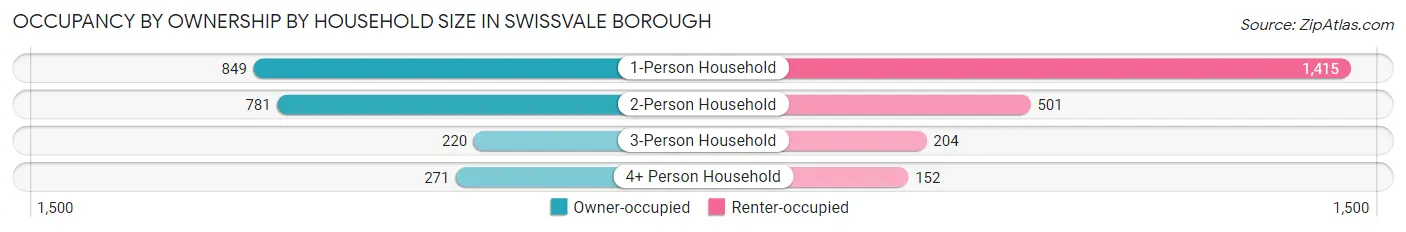
| Household Size | Owner-occupied | Renter-occupied |
| 1-Person Household | 849 (37.5%) | 1,415 (62.5%) |
| 2-Person Household | 781 (60.9%) | 501 (39.1%) |
| 3-Person Household | 220 (51.9%) | 204 (48.1%) |
| 4+ Person Household | 271 (64.1%) | 152 (35.9%) |
| Total Housing Units | 2,121 (48.3%) | 2,272 (51.7%) |
Occupancy by Educational Attainment in Swissvale borough
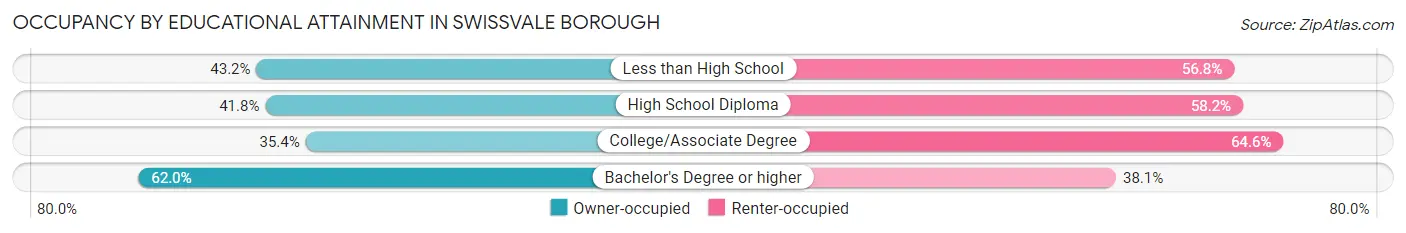
| Household Size | Owner-occupied | Renter-occupied |
| Less than High School | 32 (43.2%) | 42 (56.8%) |
| High School Diploma | 330 (41.8%) | 459 (58.2%) |
| College/Associate Degree | 572 (35.4%) | 1,042 (64.6%) |
| Bachelor's Degree or higher | 1,187 (62.0%) | 729 (38.1%) |
Occupancy by Age of Householder in Swissvale borough
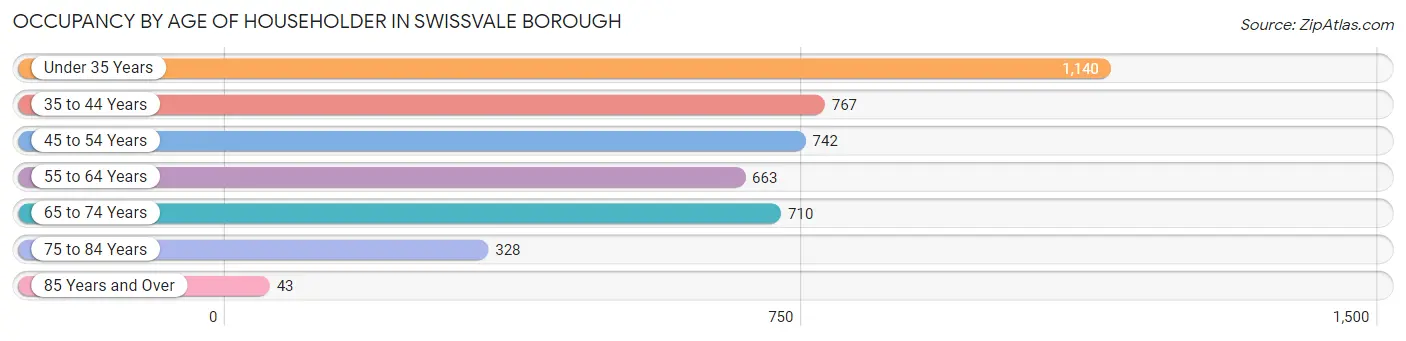
| Age Bracket | # Households | % Households |
| Under 35 Years | 1,140 | 26.0% |
| 35 to 44 Years | 767 | 17.5% |
| 45 to 54 Years | 742 | 16.9% |
| 55 to 64 Years | 663 | 15.1% |
| 65 to 74 Years | 710 | 16.2% |
| 75 to 84 Years | 328 | 7.5% |
| 85 Years and Over | 43 | 1.0% |
| Total | 4,393 | 100.0% |
Housing Finances in Swissvale borough
Median Income by Occupancy in Swissvale borough
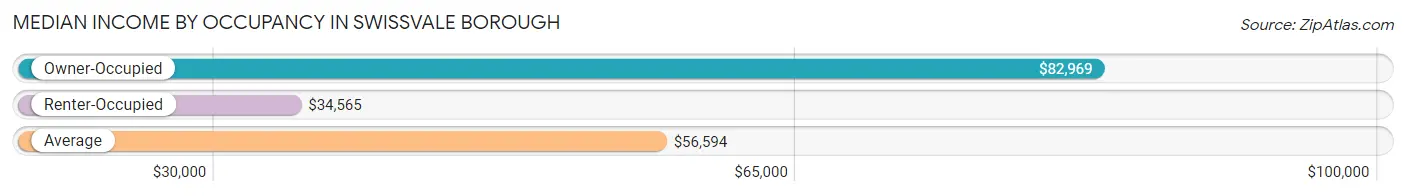
| Occupancy Type | # Households | Median Income |
| Owner-Occupied | 2,121 (48.3%) | $82,969 |
| Renter-Occupied | 2,272 (51.7%) | $34,565 |
| Average | 4,393 (100.0%) | $56,594 |
Occupancy by Householder Income Bracket in Swissvale borough
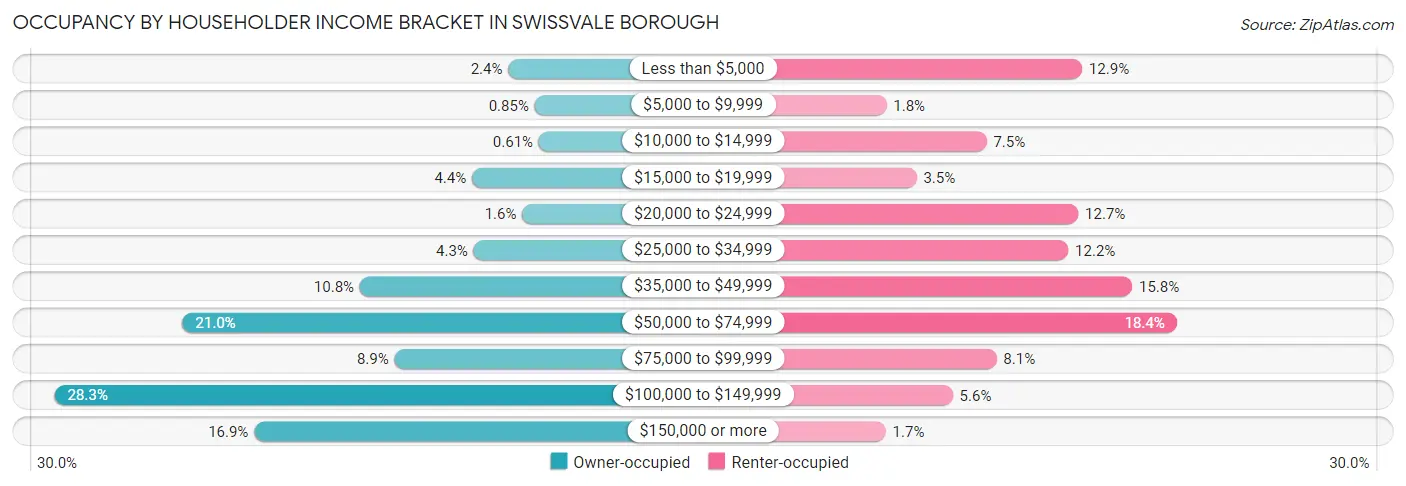
| Income Bracket | Owner-occupied | Renter-occupied |
| Less than $5,000 | 50 (2.4%) | 294 (12.9%) |
| $5,000 to $9,999 | 18 (0.9%) | 40 (1.8%) |
| $10,000 to $14,999 | 13 (0.6%) | 170 (7.5%) |
| $15,000 to $19,999 | 94 (4.4%) | 79 (3.5%) |
| $20,000 to $24,999 | 33 (1.6%) | 289 (12.7%) |
| $25,000 to $34,999 | 92 (4.3%) | 276 (12.1%) |
| $35,000 to $49,999 | 230 (10.8%) | 359 (15.8%) |
| $50,000 to $74,999 | 445 (21.0%) | 417 (18.3%) |
| $75,000 to $99,999 | 188 (8.9%) | 183 (8.1%) |
| $100,000 to $149,999 | 600 (28.3%) | 126 (5.6%) |
| $150,000 or more | 358 (16.9%) | 39 (1.7%) |
| Total | 2,121 (100.0%) | 2,272 (100.0%) |
Monthly Housing Cost Tiers in Swissvale borough
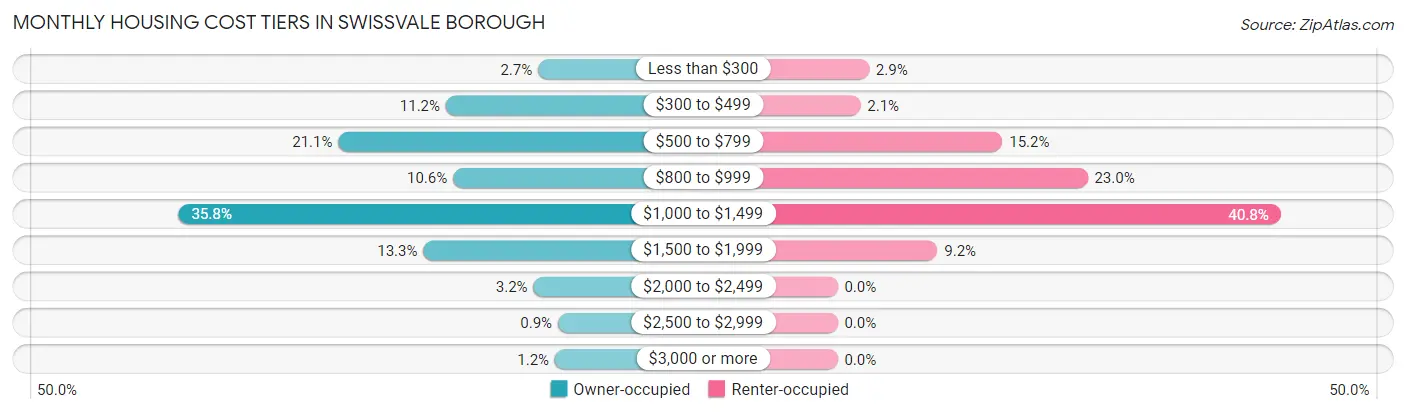
| Monthly Cost | Owner-occupied | Renter-occupied |
| Less than $300 | 58 (2.7%) | 66 (2.9%) |
| $300 to $499 | 238 (11.2%) | 48 (2.1%) |
| $500 to $799 | 448 (21.1%) | 345 (15.2%) |
| $800 to $999 | 224 (10.6%) | 523 (23.0%) |
| $1,000 to $1,499 | 760 (35.8%) | 927 (40.8%) |
| $1,500 to $1,999 | 282 (13.3%) | 209 (9.2%) |
| $2,000 to $2,499 | 67 (3.2%) | 0 (0.0%) |
| $2,500 to $2,999 | 19 (0.9%) | 0 (0.0%) |
| $3,000 or more | 25 (1.2%) | 0 (0.0%) |
| Total | 2,121 (100.0%) | 2,272 (100.0%) |
Physical Housing Characteristics in Swissvale borough
Housing Structures in Swissvale borough
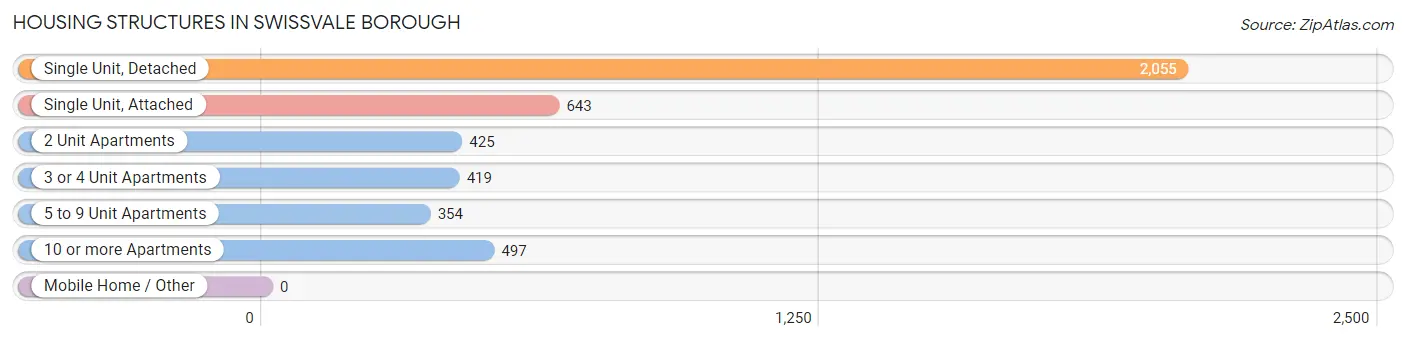
| Structure Type | # Housing Units | % Housing Units |
| Single Unit, Detached | 2,055 | 46.8% |
| Single Unit, Attached | 643 | 14.6% |
| 2 Unit Apartments | 425 | 9.7% |
| 3 or 4 Unit Apartments | 419 | 9.5% |
| 5 to 9 Unit Apartments | 354 | 8.1% |
| 10 or more Apartments | 497 | 11.3% |
| Mobile Home / Other | 0 | 0.0% |
| Total | 4,393 | 100.0% |
Housing Structures by Occupancy in Swissvale borough
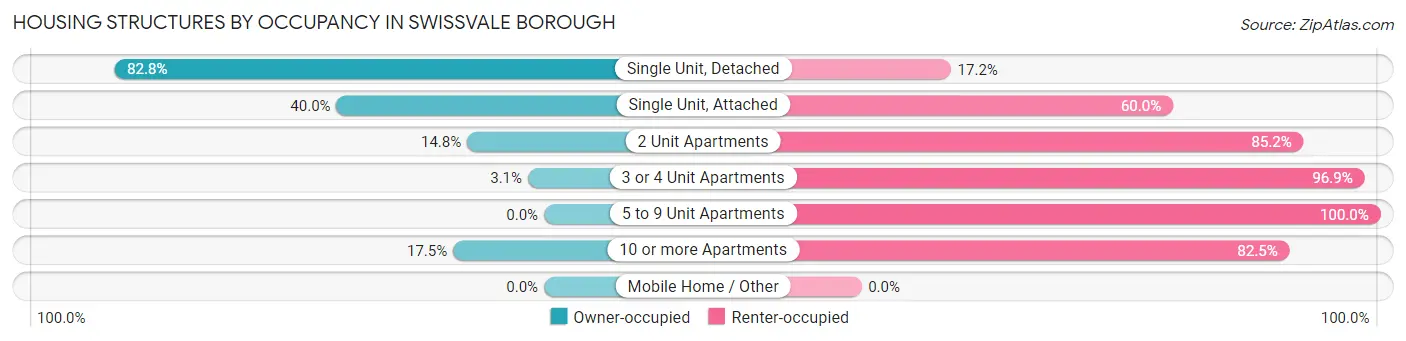
| Structure Type | Owner-occupied | Renter-occupied |
| Single Unit, Detached | 1,701 (82.8%) | 354 (17.2%) |
| Single Unit, Attached | 257 (40.0%) | 386 (60.0%) |
| 2 Unit Apartments | 63 (14.8%) | 362 (85.2%) |
| 3 or 4 Unit Apartments | 13 (3.1%) | 406 (96.9%) |
| 5 to 9 Unit Apartments | 0 (0.0%) | 354 (100.0%) |
| 10 or more Apartments | 87 (17.5%) | 410 (82.5%) |
| Mobile Home / Other | 0 (0.0%) | 0 (0.0%) |
| Total | 2,121 (48.3%) | 2,272 (51.7%) |
Housing Structures by Number of Rooms in Swissvale borough
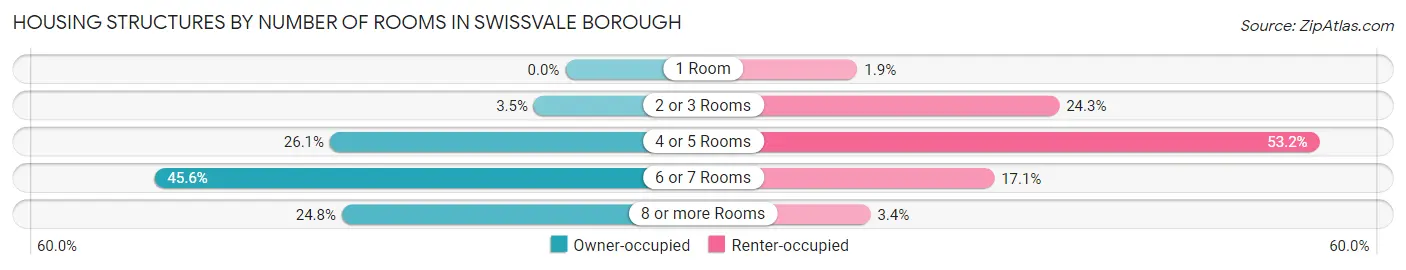
| Number of Rooms | Owner-occupied | Renter-occupied |
| 1 Room | 0 (0.0%) | 44 (1.9%) |
| 2 or 3 Rooms | 74 (3.5%) | 553 (24.3%) |
| 4 or 5 Rooms | 554 (26.1%) | 1,209 (53.2%) |
| 6 or 7 Rooms | 967 (45.6%) | 389 (17.1%) |
| 8 or more Rooms | 526 (24.8%) | 77 (3.4%) |
| Total | 2,121 (100.0%) | 2,272 (100.0%) |
Housing Structure by Heating Type in Swissvale borough
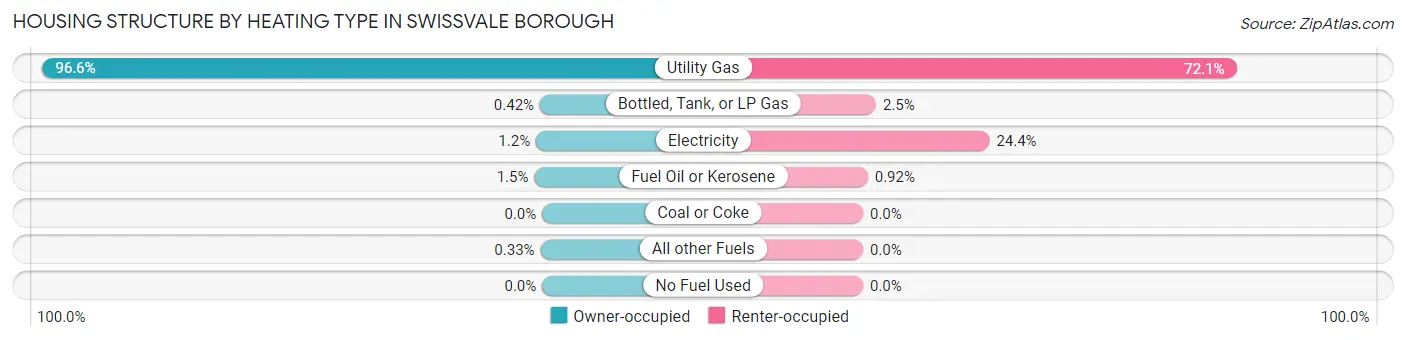
| Heating Type | Owner-occupied | Renter-occupied |
| Utility Gas | 2,048 (96.6%) | 1,639 (72.1%) |
| Bottled, Tank, or LP Gas | 9 (0.4%) | 57 (2.5%) |
| Electricity | 25 (1.2%) | 555 (24.4%) |
| Fuel Oil or Kerosene | 32 (1.5%) | 21 (0.9%) |
| Coal or Coke | 0 (0.0%) | 0 (0.0%) |
| All other Fuels | 7 (0.3%) | 0 (0.0%) |
| No Fuel Used | 0 (0.0%) | 0 (0.0%) |
| Total | 2,121 (100.0%) | 2,272 (100.0%) |
Household Vehicle Usage in Swissvale borough
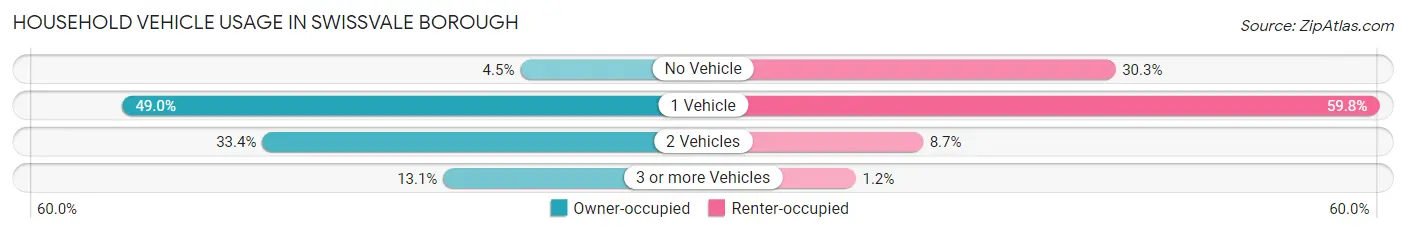
| Vehicles per Household | Owner-occupied | Renter-occupied |
| No Vehicle | 95 (4.5%) | 688 (30.3%) |
| 1 Vehicle | 1,040 (49.0%) | 1,359 (59.8%) |
| 2 Vehicles | 708 (33.4%) | 198 (8.7%) |
| 3 or more Vehicles | 278 (13.1%) | 27 (1.2%) |
| Total | 2,121 (100.0%) | 2,272 (100.0%) |
Real Estate & Mortgages in Swissvale borough
Real Estate and Mortgage Overview in Swissvale borough
| Characteristic | Without Mortgage | With Mortgage |
| Housing Units | 710 | 1,411 |
| Median Property Value | $148,600 | $138,900 |
| Median Household Income | $62,708 | $287 |
| Monthly Housing Costs | $568 | $25 |
| Real Estate Taxes | $2,447 | $0 |
Property Value by Mortgage Status in Swissvale borough
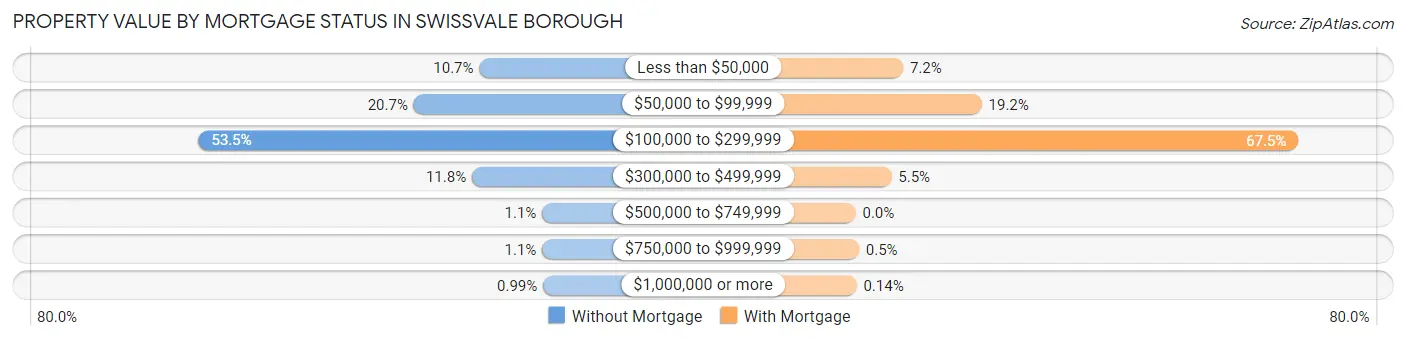
| Property Value | Without Mortgage | With Mortgage |
| Less than $50,000 | 76 (10.7%) | 102 (7.2%) |
| $50,000 to $99,999 | 147 (20.7%) | 271 (19.2%) |
| $100,000 to $299,999 | 380 (53.5%) | 952 (67.5%) |
| $300,000 to $499,999 | 84 (11.8%) | 77 (5.5%) |
| $500,000 to $749,999 | 8 (1.1%) | 0 (0.0%) |
| $750,000 to $999,999 | 8 (1.1%) | 7 (0.5%) |
| $1,000,000 or more | 7 (1.0%) | 2 (0.1%) |
| Total | 710 (100.0%) | 1,411 (100.0%) |
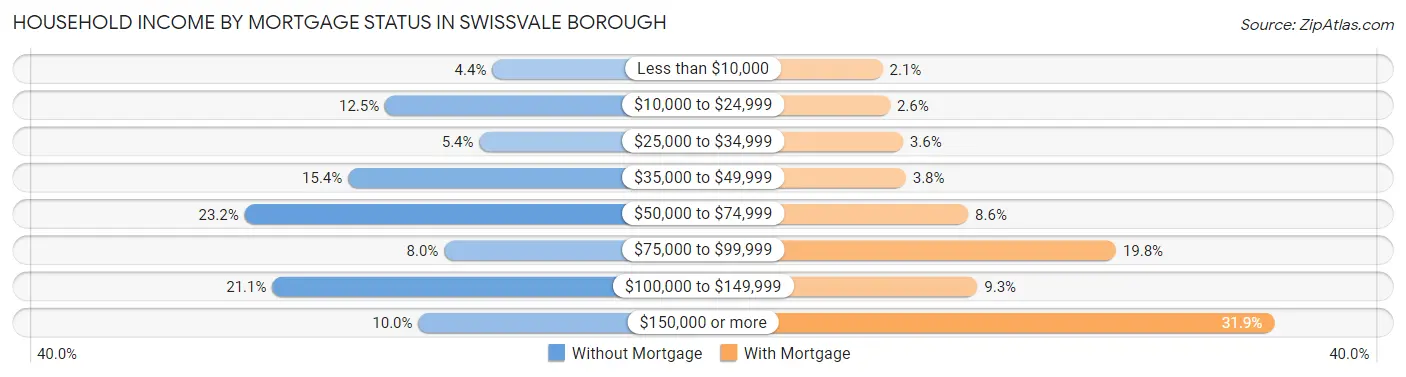
Household Income by Mortgage Status in Swissvale borough
| Household Income | Without Mortgage | With Mortgage |
| Less than $10,000 | 31 (4.4%) | 29 (2.1%) |
| $10,000 to $24,999 | 89 (12.5%) | 37 (2.6%) |
| $25,000 to $34,999 | 38 (5.3%) | 51 (3.6%) |
| $35,000 to $49,999 | 109 (15.3%) | 54 (3.8%) |
| $50,000 to $74,999 | 165 (23.2%) | 121 (8.6%) |
| $75,000 to $99,999 | 57 (8.0%) | 280 (19.8%) |
| $100,000 to $149,999 | 150 (21.1%) | 131 (9.3%) |
| $150,000 or more | 71 (10.0%) | 450 (31.9%) |
| Total | 710 (100.0%) | 1,411 (100.0%) |
Property Value to Household Income Ratio in Swissvale borough
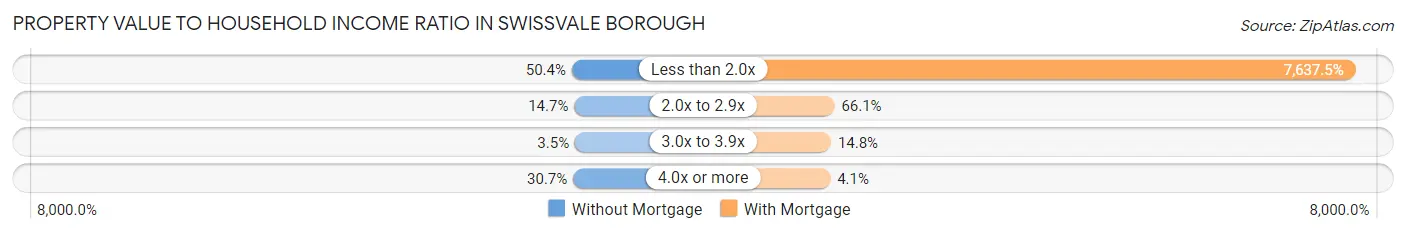
| Value-to-Income Ratio | Without Mortgage | With Mortgage |
| Less than 2.0x | 358 (50.4%) | 107,765 (7,637.5%) |
| 2.0x to 2.9x | 104 (14.6%) | 932 (66.0%) |
| 3.0x to 3.9x | 25 (3.5%) | 209 (14.8%) |
| 4.0x or more | 218 (30.7%) | 58 (4.1%) |
| Total | 710 (100.0%) | 1,411 (100.0%) |
Real Estate Taxes by Mortgage Status in Swissvale borough
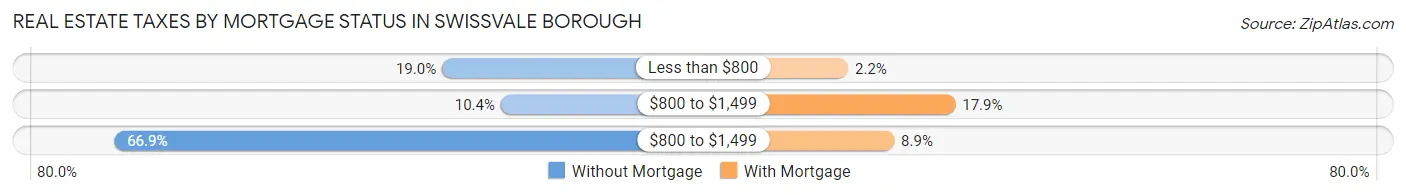
| Property Taxes | Without Mortgage | With Mortgage |
| Less than $800 | 135 (19.0%) | 31 (2.2%) |
| $800 to $1,499 | 74 (10.4%) | 252 (17.9%) |
| $800 to $1,499 | 475 (66.9%) | 126 (8.9%) |
| Total | 710 (100.0%) | 1,411 (100.0%) |
Health & Disability in Swissvale borough
Health Insurance Coverage by Age in Swissvale borough
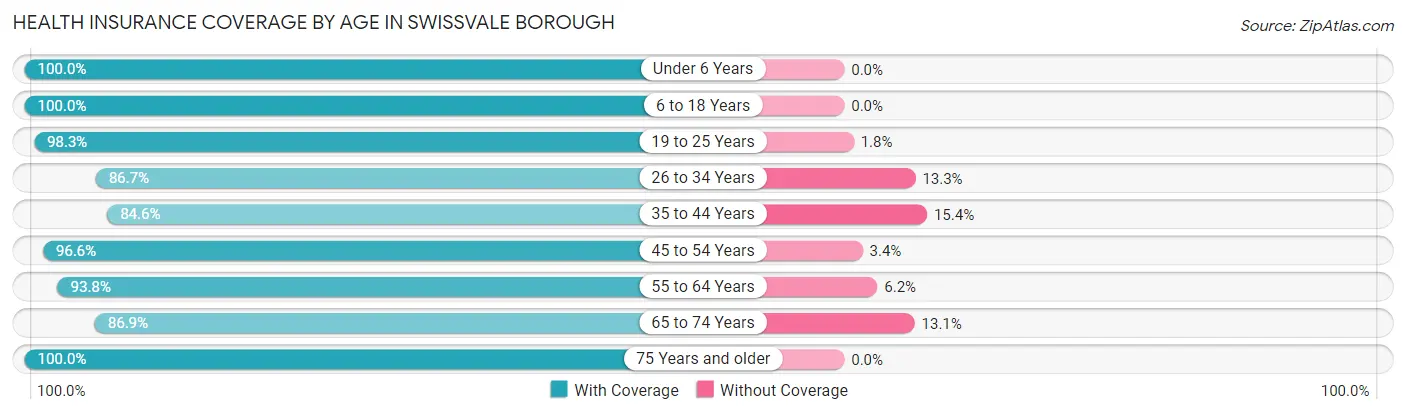
| Age Bracket | With Coverage | Without Coverage |
| Under 6 Years | 361 (100.0%) | 0 (0.0%) |
| 6 to 18 Years | 1,206 (100.0%) | 0 (0.0%) |
| 19 to 25 Years | 675 (98.3%) | 12 (1.8%) |
| 26 to 34 Years | 1,366 (86.7%) | 209 (13.3%) |
| 35 to 44 Years | 1,064 (84.6%) | 194 (15.4%) |
| 45 to 54 Years | 1,076 (96.6%) | 38 (3.4%) |
| 55 to 64 Years | 884 (93.8%) | 58 (6.2%) |
| 65 to 74 Years | 822 (86.9%) | 124 (13.1%) |
| 75 Years and older | 499 (100.0%) | 0 (0.0%) |
| Total | 7,953 (92.6%) | 635 (7.4%) |
Health Insurance Coverage by Citizenship Status in Swissvale borough
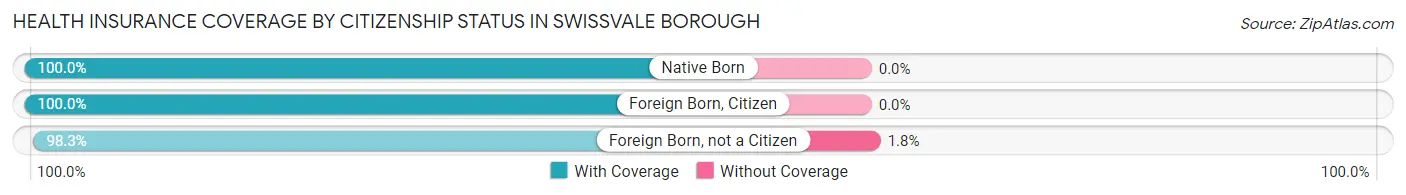
| Citizenship Status | With Coverage | Without Coverage |
| Native Born | 361 (100.0%) | 0 (0.0%) |
| Foreign Born, Citizen | 1,206 (100.0%) | 0 (0.0%) |
| Foreign Born, not a Citizen | 675 (98.3%) | 12 (1.8%) |
Health Insurance Coverage by Household Income in Swissvale borough
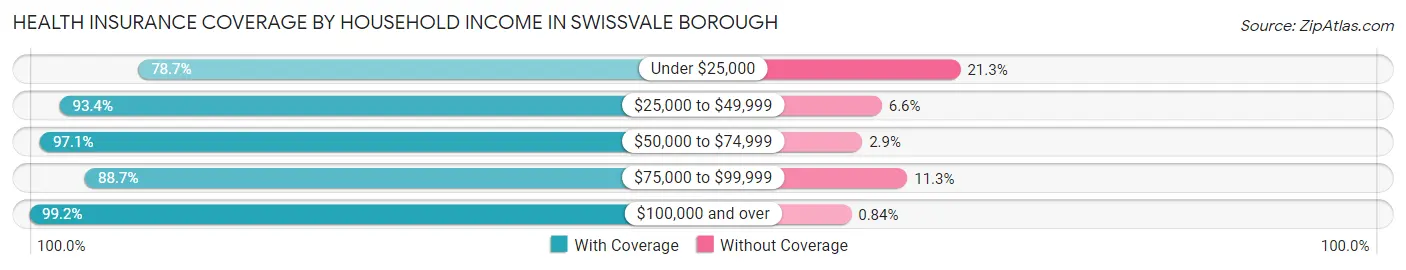
| Household Income | With Coverage | Without Coverage |
| Under $25,000 | 1,308 (78.7%) | 354 (21.3%) |
| $25,000 to $49,999 | 1,439 (93.4%) | 101 (6.6%) |
| $50,000 to $74,999 | 1,678 (97.1%) | 50 (2.9%) |
| $75,000 to $99,999 | 790 (88.7%) | 101 (11.3%) |
| $100,000 and over | 2,704 (99.2%) | 23 (0.8%) |
Public vs Private Health Insurance Coverage by Age in Swissvale borough
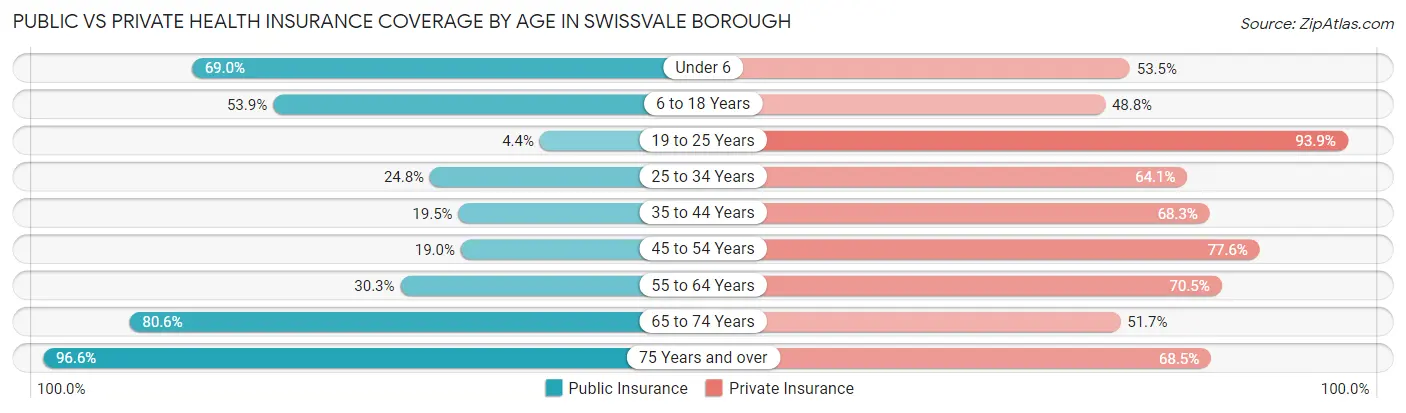
| Age Bracket | Public Insurance | Private Insurance |
| Under 6 | 249 (69.0%) | 193 (53.5%) |
| 6 to 18 Years | 650 (53.9%) | 589 (48.8%) |
| 19 to 25 Years | 30 (4.4%) | 645 (93.9%) |
| 25 to 34 Years | 390 (24.8%) | 1,010 (64.1%) |
| 35 to 44 Years | 245 (19.5%) | 859 (68.3%) |
| 45 to 54 Years | 212 (19.0%) | 864 (77.6%) |
| 55 to 64 Years | 285 (30.2%) | 664 (70.5%) |
| 65 to 74 Years | 762 (80.5%) | 489 (51.7%) |
| 75 Years and over | 482 (96.6%) | 342 (68.5%) |
| Total | 3,305 (38.5%) | 5,655 (65.8%) |
Disability Status by Sex by Age in Swissvale borough
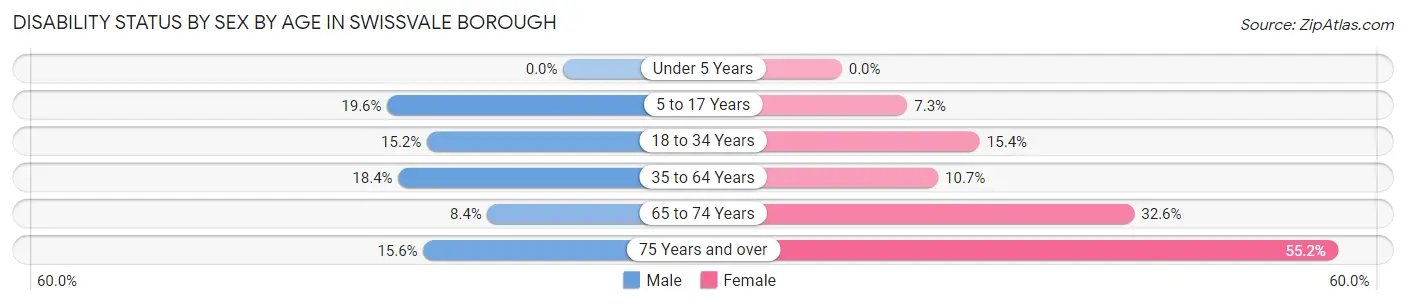
| Age Bracket | Male | Female |
| Under 5 Years | 0 (0.0%) | 0 (0.0%) |
| 5 to 17 Years | 137 (19.6%) | 36 (7.3%) |
| 18 to 34 Years | 210 (15.2%) | 149 (15.4%) |
| 35 to 64 Years | 268 (18.4%) | 199 (10.7%) |
| 65 to 74 Years | 35 (8.4%) | 173 (32.6%) |
| 75 Years and over | 36 (15.6%) | 148 (55.2%) |
Disability Class by Sex by Age in Swissvale borough
Disability Class: Hearing Difficulty
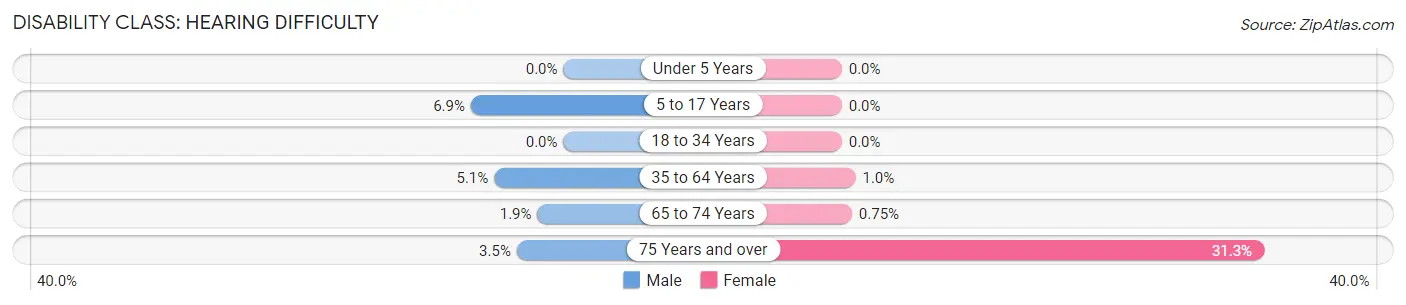
| Age Bracket | Male | Female |
| Under 5 Years | 0 (0.0%) | 0 (0.0%) |
| 5 to 17 Years | 48 (6.9%) | 0 (0.0%) |
| 18 to 34 Years | 0 (0.0%) | 0 (0.0%) |
| 35 to 64 Years | 75 (5.1%) | 19 (1.0%) |
| 65 to 74 Years | 8 (1.9%) | 4 (0.7%) |
| 75 Years and over | 8 (3.5%) | 84 (31.3%) |
Disability Class: Vision Difficulty
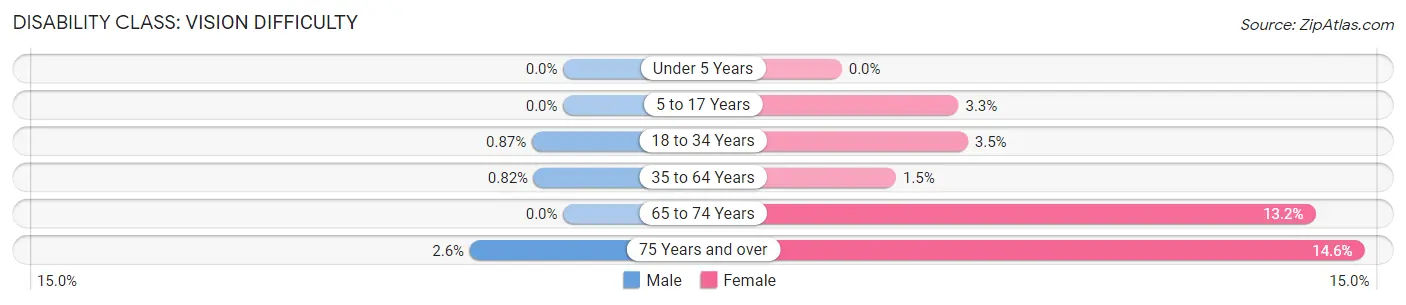
| Age Bracket | Male | Female |
| Under 5 Years | 0 (0.0%) | 0 (0.0%) |
| 5 to 17 Years | 0 (0.0%) | 16 (3.3%) |
| 18 to 34 Years | 12 (0.9%) | 34 (3.5%) |
| 35 to 64 Years | 12 (0.8%) | 28 (1.5%) |
| 65 to 74 Years | 0 (0.0%) | 70 (13.2%) |
| 75 Years and over | 6 (2.6%) | 39 (14.5%) |
Disability Class: Cognitive Difficulty
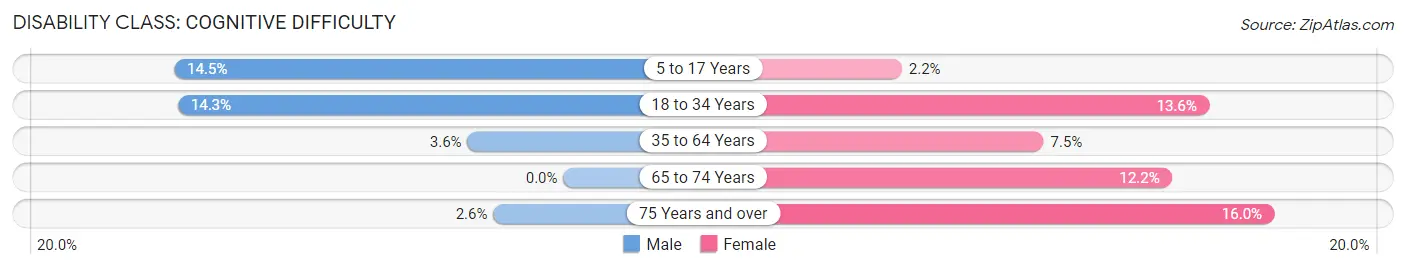
| Age Bracket | Male | Female |
| 5 to 17 Years | 101 (14.4%) | 11 (2.2%) |
| 18 to 34 Years | 198 (14.3%) | 132 (13.6%) |
| 35 to 64 Years | 52 (3.6%) | 139 (7.5%) |
| 65 to 74 Years | 0 (0.0%) | 65 (12.2%) |
| 75 Years and over | 6 (2.6%) | 43 (16.0%) |
Disability Class: Ambulatory Difficulty
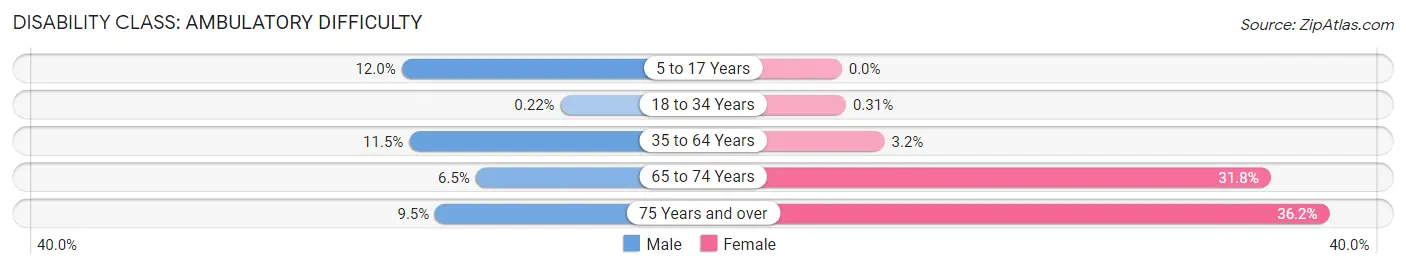
| Age Bracket | Male | Female |
| 5 to 17 Years | 84 (12.0%) | 0 (0.0%) |
| 18 to 34 Years | 3 (0.2%) | 3 (0.3%) |
| 35 to 64 Years | 167 (11.5%) | 59 (3.2%) |
| 65 to 74 Years | 27 (6.5%) | 169 (31.8%) |
| 75 Years and over | 22 (9.5%) | 97 (36.2%) |
Disability Class: Self-Care Difficulty
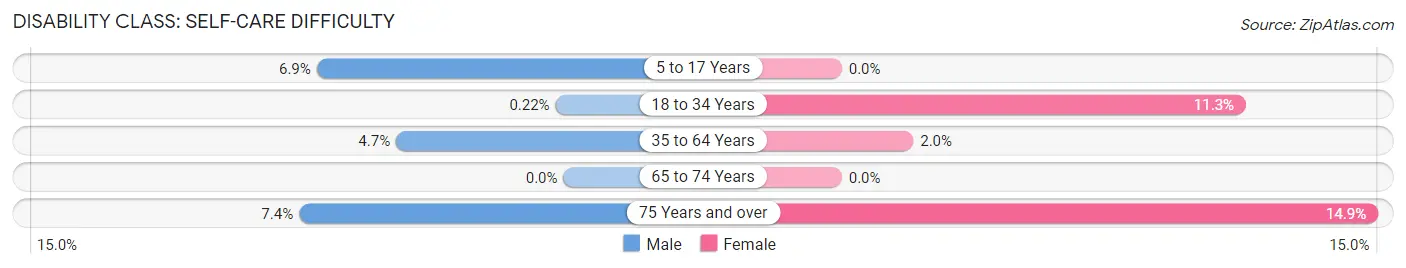
| Age Bracket | Male | Female |
| 5 to 17 Years | 48 (6.9%) | 0 (0.0%) |
| 18 to 34 Years | 3 (0.2%) | 109 (11.3%) |
| 35 to 64 Years | 68 (4.7%) | 37 (2.0%) |
| 65 to 74 Years | 0 (0.0%) | 0 (0.0%) |
| 75 Years and over | 17 (7.4%) | 40 (14.9%) |
Technology Access in Swissvale borough
Computing Device Access in Swissvale borough
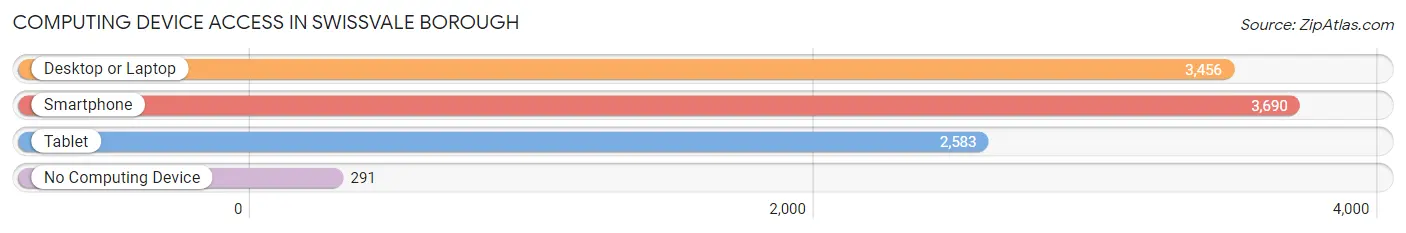
| Device Type | # Households | % Households |
| Desktop or Laptop | 3,456 | 78.7% |
| Smartphone | 3,690 | 84.0% |
| Tablet | 2,583 | 58.8% |
| No Computing Device | 291 | 6.6% |
| Total | 4,393 | 100.0% |
Internet Access in Swissvale borough
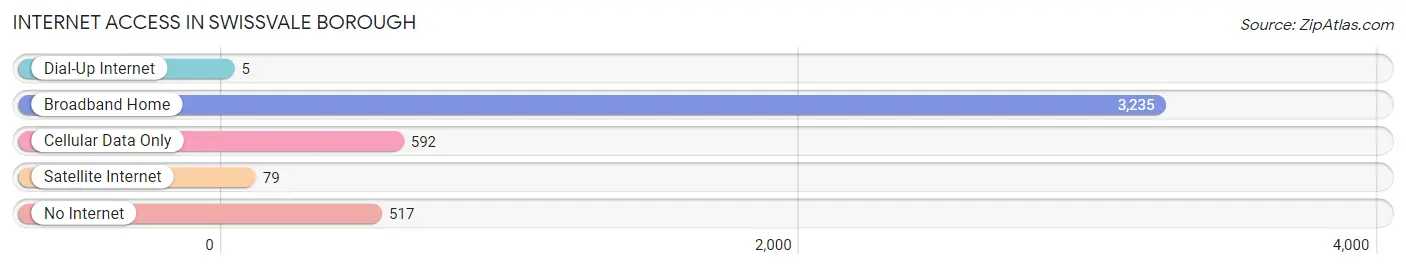
| Internet Type | # Households | % Households |
| Dial-Up Internet | 5 | 0.1% |
| Broadband Home | 3,235 | 73.6% |
| Cellular Data Only | 592 | 13.5% |
| Satellite Internet | 79 | 1.8% |
| No Internet | 517 | 11.8% |
| Total | 4,393 | 100.0% |
Swissvale borough Summary
Swissvale Borough is a borough located in Allegheny County, Pennsylvania, United States. It is a suburb of Pittsburgh, located approximately 8 miles (13 km) east of the city. The population was 8,981 at the 2010 census.
History
Swissvale was founded in 1842 by Swiss immigrants who named the area after their homeland. The borough was incorporated in 1867. The area was originally a farming community, but it quickly developed into a manufacturing center. The first industry in the area was a paper mill, which was established in 1845. Other industries soon followed, including a steel mill, a glass factory, and a brickyard.
The borough was home to several notable figures in the early 20th century, including the inventor of the modern automobile, Henry Ford, and the founder of the Ford Motor Company, William C. Durant.
Geography
Swissvale is located at 40°25'17" North, 79°53'45" West (40.4214, -79.8958). According to the United States Census Bureau, the borough has a total area of 1.3 square miles (3.4 km2), all of it land.
Economy
Swissvale is a primarily residential community, with a few small businesses located in the borough. The largest employer in the area is the University of Pittsburgh Medical Center, which has a hospital and several other facilities in the borough. Other employers include a variety of small businesses, such as restaurants, retail stores, and professional services.
Demographics
As of the census of 2000, there were 8,945 people, 3,845 households, and 2,323 families residing in the borough. The population density was 6,845.3 people per square mile (2,639.2/km2). There were 4,093 housing units at an average density of 3,093.3 per square mile (1,192.2/km2). The racial makeup of the borough was 79.2% White, 15.7% African American, 0.2% Native American, 1.7% Asian, 0.1% Pacific Islander, 1.2% from other races, and 1.9% from two or more races. Hispanic or Latino of any race were 2.7% of the population.
There were 3,845 households, out of which 24.2% had children under the age of 18 living with them, 41.2% were married couples living together, 14.2% had a female householder with no husband present, and 39.7% were non-families. 33.2% of all households were made up of individuals, and 13.2% had someone living alone who was 65 years of age or older. The average household size was 2.31 and the average family size was 2.95.
In the borough the population was spread out, with 20.7% under the age of 18, 8.2% from 18 to 24, 30.2% from 25 to 44, 22.7% from 45 to 64, and 18.2% who were 65 years of age or older. The median age was 39 years. For every 100 females, there were 87.2 males. For every 100 females age 18 and over, there were 83.3 males.
The median income for a household in the borough was $35,921, and the median income for a family was $45,945. Males had a median income of $35,921 versus $27,917 for females. The per capita income for the borough was $19,945. About 6.2% of families and 8.7% of the population were below the poverty line, including 11.2% of those under age 18 and 8.2% of those age 65 or over.
Common Questions
What is Per Capita Income in Swissvale borough?
Per Capita income in Swissvale borough is $37,266.
What is the Median Family Income in Swissvale borough?
Median Family Income in Swissvale borough is $78,359.
What is the Median Household income in Swissvale borough?
Median Household Income in Swissvale borough is $56,594.
What is Income or Wage Gap in Swissvale borough?
Income or Wage Gap in Swissvale borough is 6.3%.
Women in Swissvale borough earn 93.7 cents for every dollar earned by a man.
What is Inequality or Gini Index in Swissvale borough?
Inequality or Gini Index in Swissvale borough is 0.46.
What is the Total Population of Swissvale borough?
Total Population of Swissvale borough is 8,588.
What is the Total Male Population of Swissvale borough?
Total Male Population of Swissvale borough is 4,411.
What is the Total Female Population of Swissvale borough?
Total Female Population of Swissvale borough is 4,177.
What is the Ratio of Males per 100 Females in Swissvale borough?
There are 105.60 Males per 100 Females in Swissvale borough.
What is the Ratio of Females per 100 Males in Swissvale borough?
There are 94.70 Females per 100 Males in Swissvale borough.
What is the Median Population Age in Swissvale borough?
Median Population Age in Swissvale borough is 37.1 Years.
What is the Average Family Size in Swissvale borough
Average Family Size in Swissvale borough is 3.0 People.
What is the Average Household Size in Swissvale borough
Average Household Size in Swissvale borough is 1.9 People.
How Large is the Labor Force in Swissvale borough?
There are 5,401 People in the Labor Forcein in Swissvale borough.
What is the Percentage of People in the Labor Force in Swissvale borough?
74.1% of People are in the Labor Force in Swissvale borough.
What is the Unemployment Rate in Swissvale borough?
Unemployment Rate in Swissvale borough is 6.6%.