New Albany borough, PA Map & Demographics
New Albany borough Overview
$34,878
PER CAPITA INCOME
$46,875
AVG FAMILY INCOME
$67,222
AVG HOUSEHOLD INCOME
40.9%
WAGE / INCOME GAP [ % ]
59.1¢/ $1
WAGE / INCOME GAP [ $ ]
0.54
INEQUALITY / GINI INDEX
337
TOTAL POPULATION
170
MALE POPULATION
167
FEMALE POPULATION
101.80
MALES / 100 FEMALES
98.24
FEMALES / 100 MALES
28.7
MEDIAN AGE
3.3
AVG FAMILY SIZE
2.7
AVG HOUSEHOLD SIZE
162
LABOR FORCE [ PEOPLE ]
61.8%
PERCENT IN LABOR FORCE
4.9%
UNEMPLOYMENT RATE
Income in New Albany borough
Income Overview in New Albany borough
Per Capita Income in New Albany borough is $34,878, while median incomes of families and households are $46,875 and $67,222 respectively.
| Characteristic | Number | Measure |
| Per Capita Income | 337 | $34,878 |
| Median Family Income | 65 | $46,875 |
| Mean Family Income | 65 | $113,734 |
| Median Household Income | 124 | $67,222 |
| Mean Household Income | 124 | $104,044 |
| Income Deficit | 65 | $0 |
| Wage / Income Gap (%) | 337 | 40.88% |
| Wage / Income Gap ($) | 337 | 59.12¢ per $1 |
| Gini / Inequality Index | 337 | 0.54 |
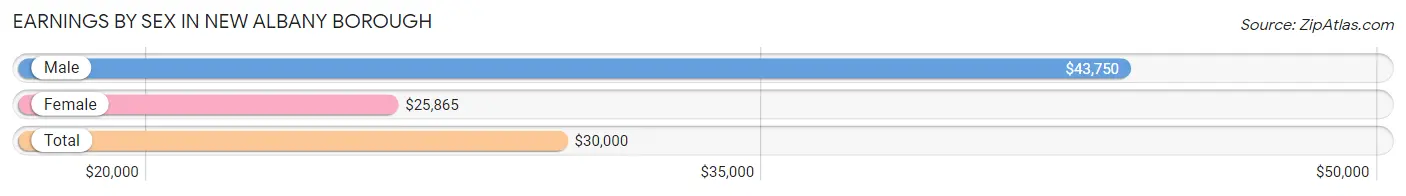
Earnings by Sex in New Albany borough
Average Earnings in New Albany borough are $30,000, $43,750 for men and $25,865 for women, a difference of 40.9%.
| Sex | Number | Average Earnings |
| Male | 95 (59.4%) | $43,750 |
| Female | 65 (40.6%) | $25,865 |
| Total | 160 (100.0%) | $30,000 |
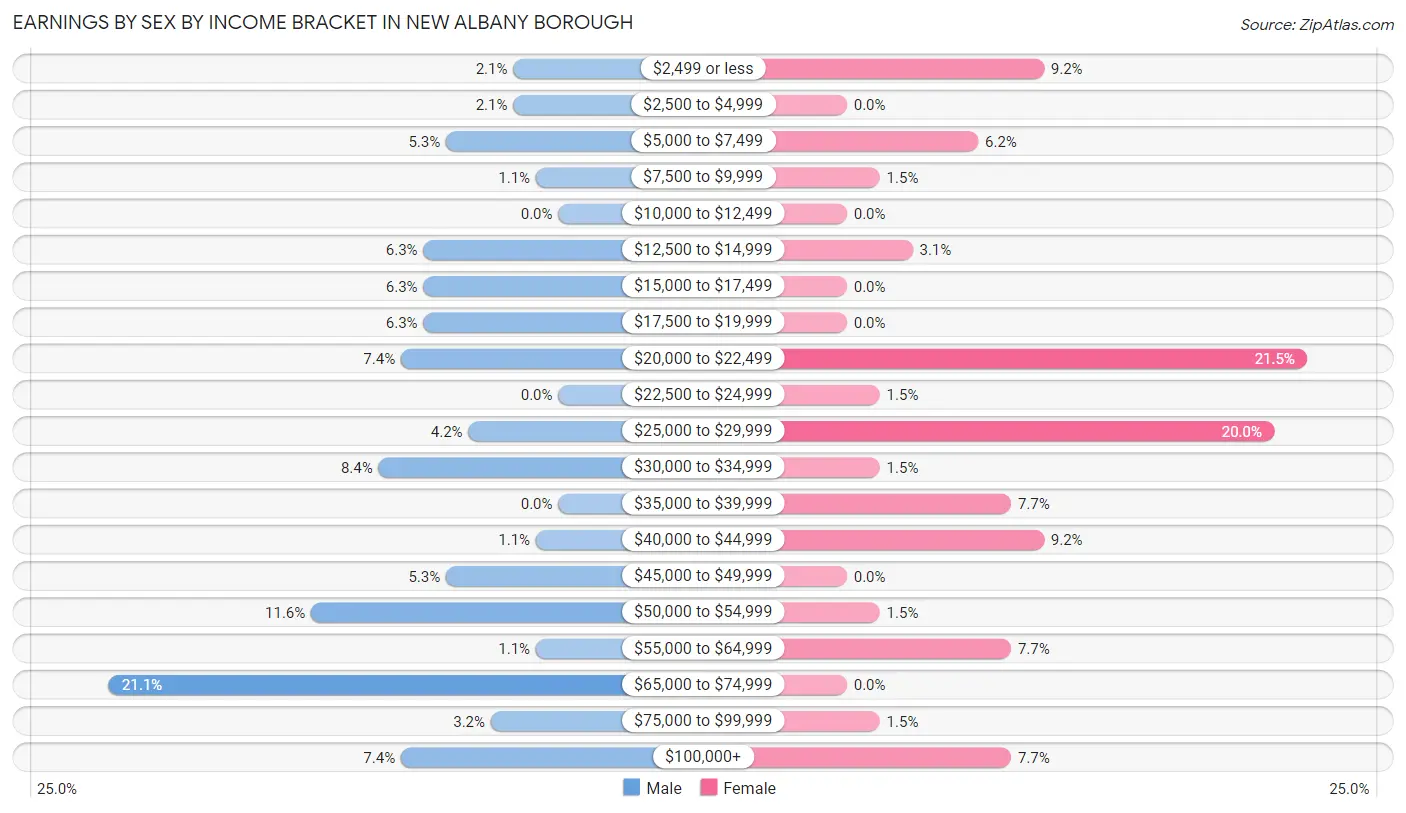
Earnings by Sex by Income Bracket in New Albany borough
The most common earnings brackets in New Albany borough are $65,000 to $74,999 for men (20 | 21.0%) and $20,000 to $22,499 for women (14 | 21.5%).
| Income | Male | Female |
| $2,499 or less | 2 (2.1%) | 6 (9.2%) |
| $2,500 to $4,999 | 2 (2.1%) | 0 (0.0%) |
| $5,000 to $7,499 | 5 (5.3%) | 4 (6.1%) |
| $7,500 to $9,999 | 1 (1.1%) | 1 (1.5%) |
| $10,000 to $12,499 | 0 (0.0%) | 0 (0.0%) |
| $12,500 to $14,999 | 6 (6.3%) | 2 (3.1%) |
| $15,000 to $17,499 | 6 (6.3%) | 0 (0.0%) |
| $17,500 to $19,999 | 6 (6.3%) | 0 (0.0%) |
| $20,000 to $22,499 | 7 (7.4%) | 14 (21.5%) |
| $22,500 to $24,999 | 0 (0.0%) | 1 (1.5%) |
| $25,000 to $29,999 | 4 (4.2%) | 13 (20.0%) |
| $30,000 to $34,999 | 8 (8.4%) | 1 (1.5%) |
| $35,000 to $39,999 | 0 (0.0%) | 5 (7.7%) |
| $40,000 to $44,999 | 1 (1.1%) | 6 (9.2%) |
| $45,000 to $49,999 | 5 (5.3%) | 0 (0.0%) |
| $50,000 to $54,999 | 11 (11.6%) | 1 (1.5%) |
| $55,000 to $64,999 | 1 (1.1%) | 5 (7.7%) |
| $65,000 to $74,999 | 20 (21.0%) | 0 (0.0%) |
| $75,000 to $99,999 | 3 (3.2%) | 1 (1.5%) |
| $100,000+ | 7 (7.4%) | 5 (7.7%) |
| Total | 95 (100.0%) | 65 (100.0%) |
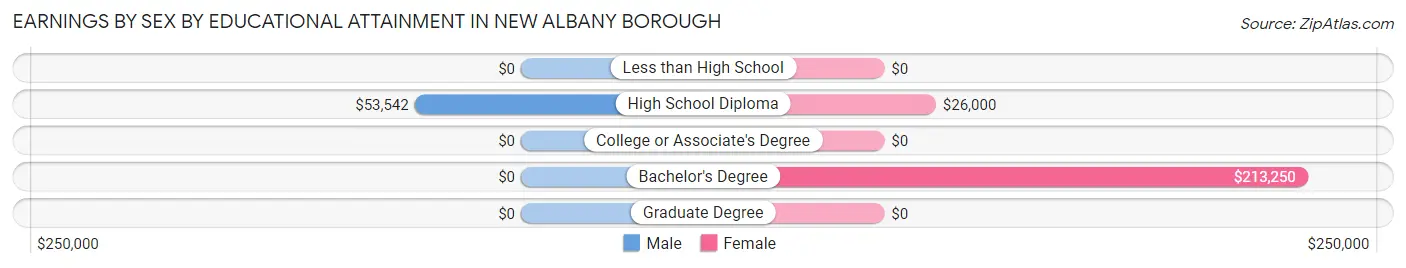
Earnings by Sex by Educational Attainment in New Albany borough
Average earnings in New Albany borough are $50,750 for men and $27,019 for women, a difference of 46.8%. Men with an educational attainment of high school diploma enjoy the highest average annual earnings of $53,542, while those with high school diploma education earn the least with $53,542. Women with an educational attainment of bachelor's degree earn the most with the average annual earnings of $213,250, while those with high school diploma education have the smallest earnings of $26,000.
| Educational Attainment | Male Income | Female Income |
| Less than High School | - | - |
| High School Diploma | $53,542 | $26,000 |
| College or Associate's Degree | - | - |
| Bachelor's Degree | - | - |
| Graduate Degree | - | - |
| Total | $50,750 | $27,019 |
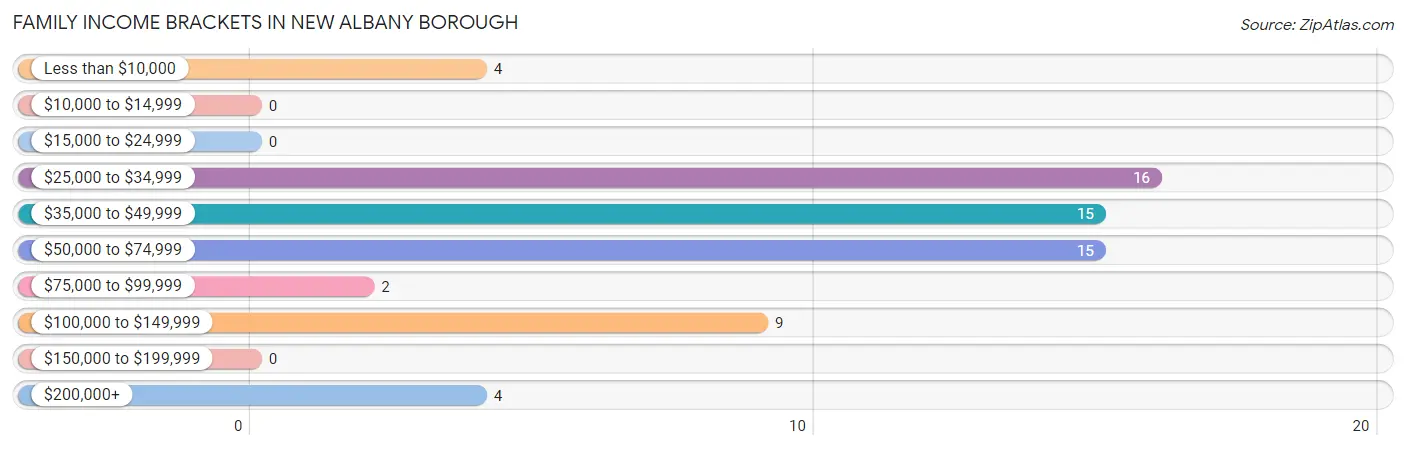
Family Income in New Albany borough
Family Income Brackets in New Albany borough
According to the New Albany borough family income data, there are 16 families falling into the $25,000 to $34,999 income range, which is the most common income bracket and makes up 24.6% of all families.
| Income Bracket | # Families | % Families |
| Less than $10,000 | 4 | 6.2% |
| $10,000 to $14,999 | 0 | 0.0% |
| $15,000 to $24,999 | 0 | 0.0% |
| $25,000 to $34,999 | 16 | 24.6% |
| $35,000 to $49,999 | 15 | 23.1% |
| $50,000 to $74,999 | 15 | 23.1% |
| $75,000 to $99,999 | 2 | 3.1% |
| $100,000 to $149,999 | 9 | 13.8% |
| $150,000 to $199,999 | 0 | 0.0% |
| $200,000+ | 4 | 6.2% |
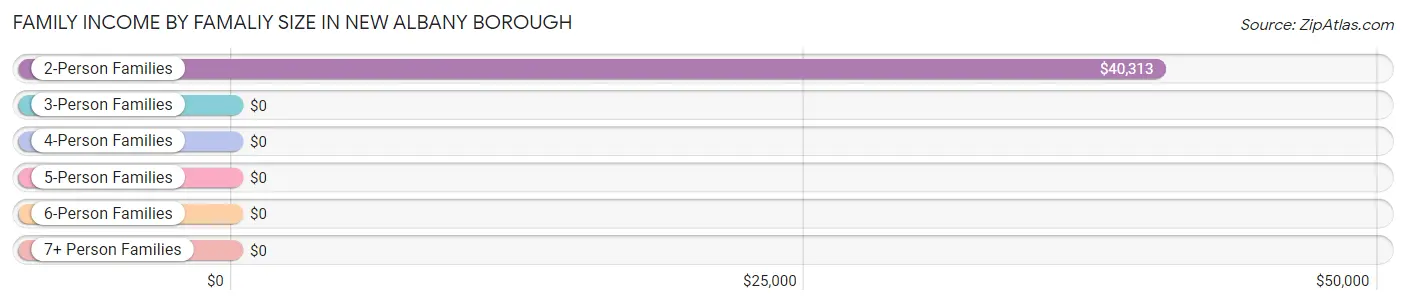
Family Income by Famaliy Size in New Albany borough
2-person families (25 | 38.5%) account for the highest median family income in New Albany borough with $40,313 per family, while 2-person families (25 | 38.5%) have the highest median income of $20,156 per family member.
| Income Bracket | # Families | Median Income |
| 2-Person Families | 25 (38.5%) | $40,313 |
| 3-Person Families | 6 (9.2%) | $0 |
| 4-Person Families | 17 (26.2%) | $0 |
| 5-Person Families | 6 (9.2%) | $0 |
| 6-Person Families | 11 (16.9%) | $0 |
| 7+ Person Families | 0 (0.0%) | $0 |
| Total | 65 (100.0%) | $46,875 |
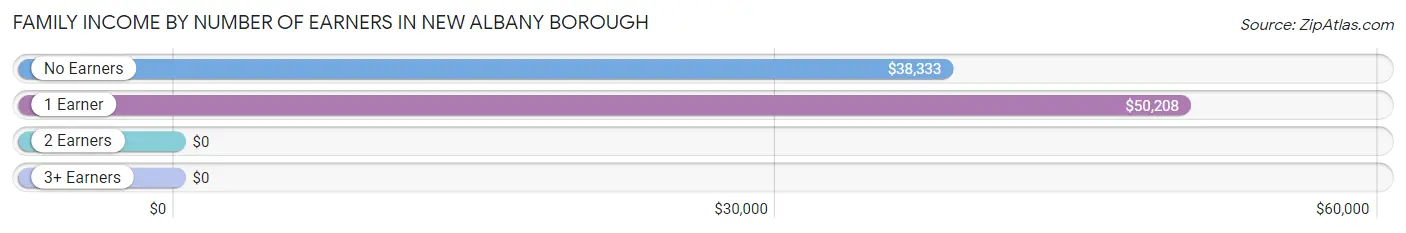
Family Income by Number of Earners in New Albany borough
| Number of Earners | # Families | Median Income |
| No Earners | 6 (9.2%) | $38,333 |
| 1 Earner | 37 (56.9%) | $50,208 |
| 2 Earners | 21 (32.3%) | $0 |
| 3+ Earners | 1 (1.5%) | $0 |
| Total | 65 (100.0%) | $46,875 |
Household Income in New Albany borough
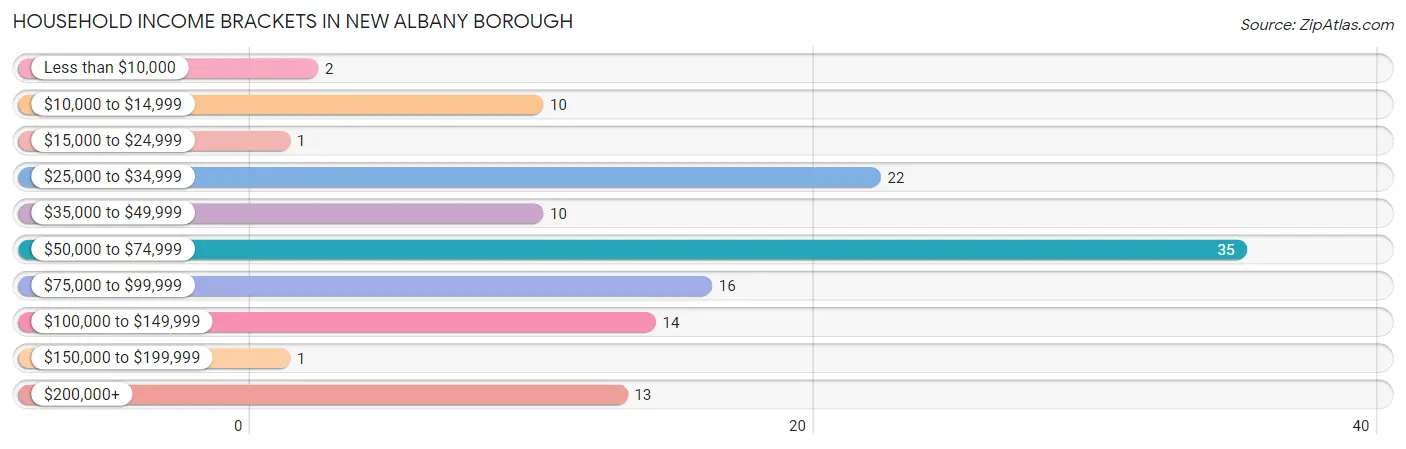
Household Income Brackets in New Albany borough
With 35 households falling in the category, the $50,000 to $74,999 income range is the most frequent in New Albany borough, accounting for 28.2% of all households. In contrast, only 1 households (0.8%) fall into the $15,000 to $24,999 income bracket, making it the least populous group.
| Income Bracket | # Households | % Households |
| Less than $10,000 | 2 | 1.6% |
| $10,000 to $14,999 | 10 | 8.1% |
| $15,000 to $24,999 | 1 | 0.8% |
| $25,000 to $34,999 | 22 | 17.7% |
| $35,000 to $49,999 | 10 | 8.1% |
| $50,000 to $74,999 | 35 | 28.2% |
| $75,000 to $99,999 | 16 | 12.9% |
| $100,000 to $149,999 | 14 | 11.3% |
| $150,000 to $199,999 | 1 | 0.8% |
| $200,000+ | 13 | 10.5% |
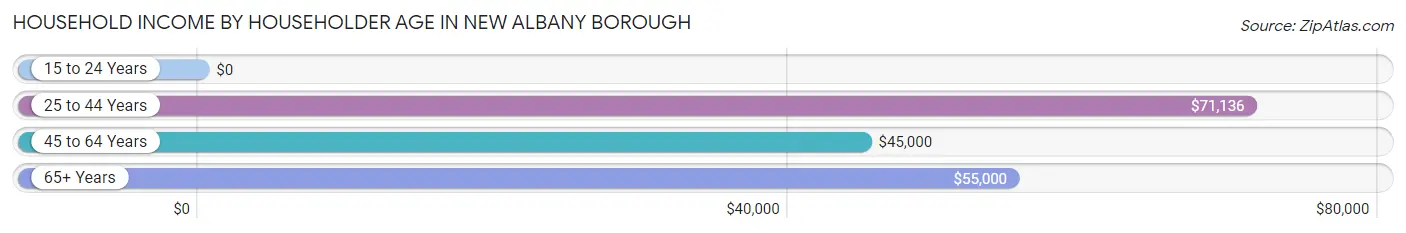
Household Income by Householder Age in New Albany borough
The median household income in New Albany borough is $67,222, with the highest median household income of $71,136 found in the 25 to 44 years age bracket for the primary householder. A total of 56 households (45.2%) fall into this category. Meanwhile, the 15 to 24 years age bracket for the primary householder has the lowest median household income of $0, with 4 households (3.2%) in this group.
| Income Bracket | # Households | Median Income |
| 15 to 24 Years | 4 (3.2%) | $0 |
| 25 to 44 Years | 56 (45.2%) | $71,136 |
| 45 to 64 Years | 44 (35.5%) | $45,000 |
| 65+ Years | 20 (16.1%) | $55,000 |
| Total | 124 (100.0%) | $67,222 |
Poverty in New Albany borough
Income Below Poverty by Sex and Age in New Albany borough
With 17.4% poverty level for males and 23.4% for females among the residents of New Albany borough, 16 and 17 year old males and under 5 year old females are the most vulnerable to poverty, with 6 males (60.0%) and 3 females (42.9%) in their respective age groups living below the poverty level.
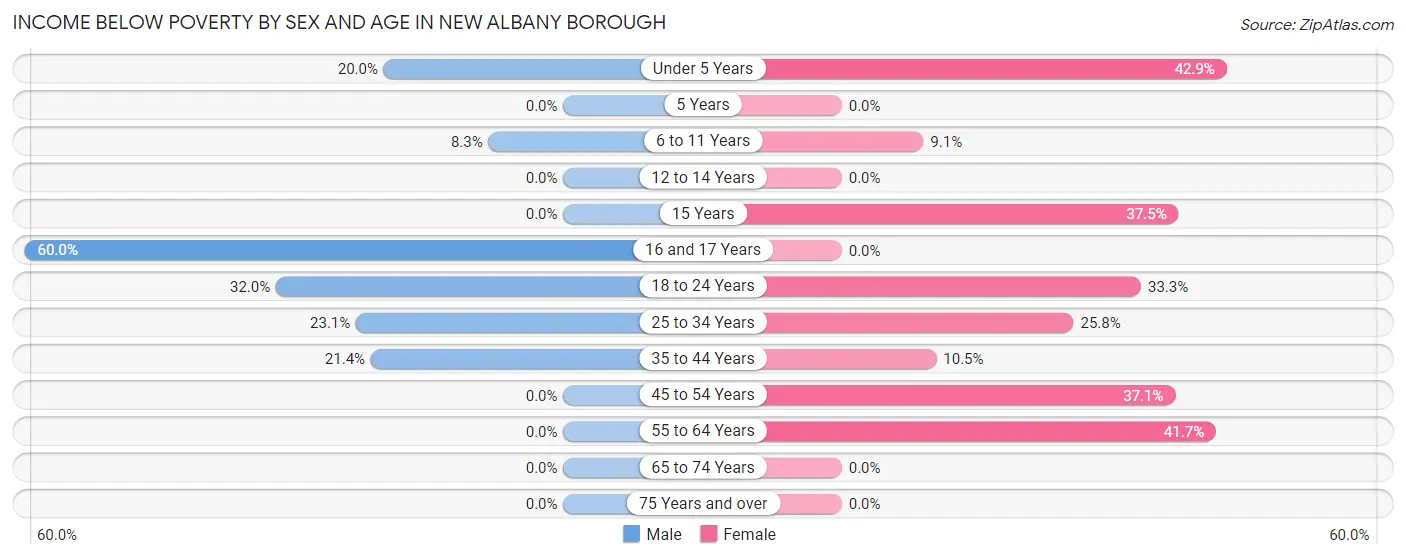
| Age Bracket | Male | Female |
| Under 5 Years | 1 (20.0%) | 3 (42.9%) |
| 5 Years | 0 (0.0%) | 0 (0.0%) |
| 6 to 11 Years | 2 (8.3%) | 1 (9.1%) |
| 12 to 14 Years | 0 (0.0%) | 0 (0.0%) |
| 15 Years | 0 (0.0%) | 3 (37.5%) |
| 16 and 17 Years | 6 (60.0%) | 0 (0.0%) |
| 18 to 24 Years | 8 (32.0%) | 4 (33.3%) |
| 25 to 34 Years | 6 (23.1%) | 8 (25.8%) |
| 35 to 44 Years | 6 (21.4%) | 2 (10.5%) |
| 45 to 54 Years | 0 (0.0%) | 13 (37.1%) |
| 55 to 64 Years | 0 (0.0%) | 5 (41.7%) |
| 65 to 74 Years | 0 (0.0%) | 0 (0.0%) |
| 75 Years and over | 0 (0.0%) | 0 (0.0%) |
| Total | 29 (17.4%) | 39 (23.4%) |
Income Above Poverty by Sex and Age in New Albany borough
According to the poverty statistics in New Albany borough, males aged 5 years and females aged 12 to 14 years are the age groups that are most secure financially, with 100.0% of males and 100.0% of females in these age groups living above the poverty line.
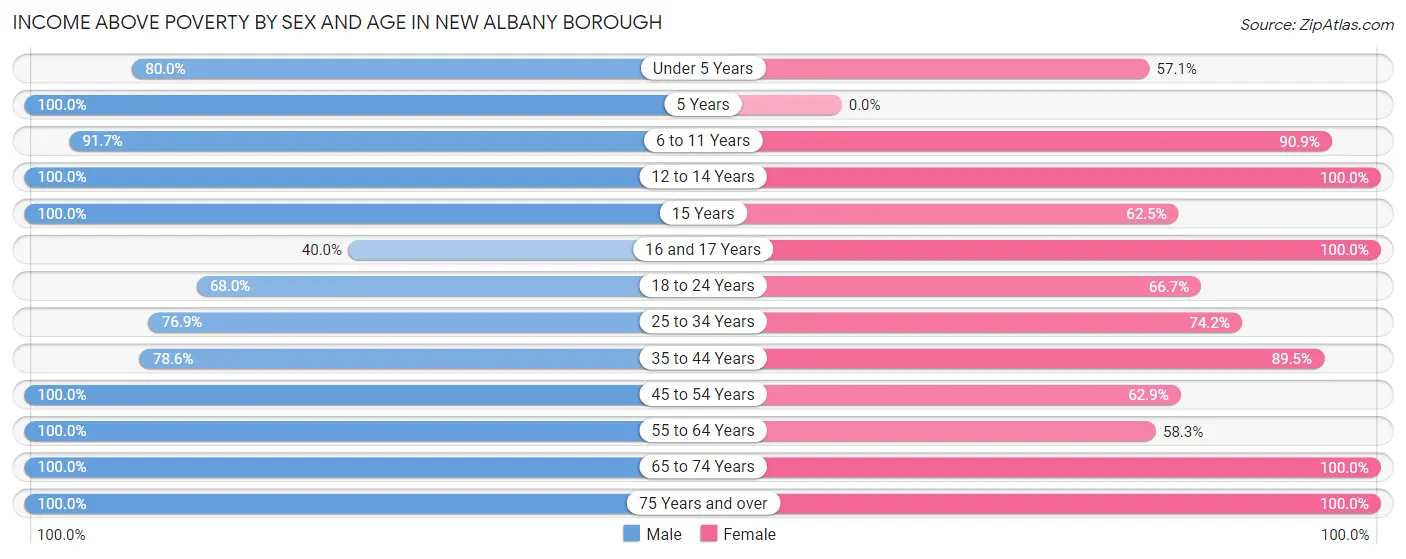
| Age Bracket | Male | Female |
| Under 5 Years | 4 (80.0%) | 4 (57.1%) |
| 5 Years | 4 (100.0%) | 0 (0.0%) |
| 6 to 11 Years | 22 (91.7%) | 10 (90.9%) |
| 12 to 14 Years | 3 (100.0%) | 9 (100.0%) |
| 15 Years | 1 (100.0%) | 5 (62.5%) |
| 16 and 17 Years | 4 (40.0%) | 8 (100.0%) |
| 18 to 24 Years | 17 (68.0%) | 8 (66.7%) |
| 25 to 34 Years | 20 (76.9%) | 23 (74.2%) |
| 35 to 44 Years | 22 (78.6%) | 17 (89.5%) |
| 45 to 54 Years | 19 (100.0%) | 22 (62.9%) |
| 55 to 64 Years | 8 (100.0%) | 7 (58.3%) |
| 65 to 74 Years | 12 (100.0%) | 13 (100.0%) |
| 75 Years and over | 2 (100.0%) | 2 (100.0%) |
| Total | 138 (82.6%) | 128 (76.6%) |
Income Below Poverty Among Married-Couple Families in New Albany borough
The poverty statistics for married-couple families in New Albany borough show that 5.4% or 2 of the total 37 families live below the poverty line. Families with 3 or 4 children have the highest poverty rate of 33.3%, comprising of 2 families. On the other hand, families with no children have the lowest poverty rate of 0.0%, which includes 0 families.
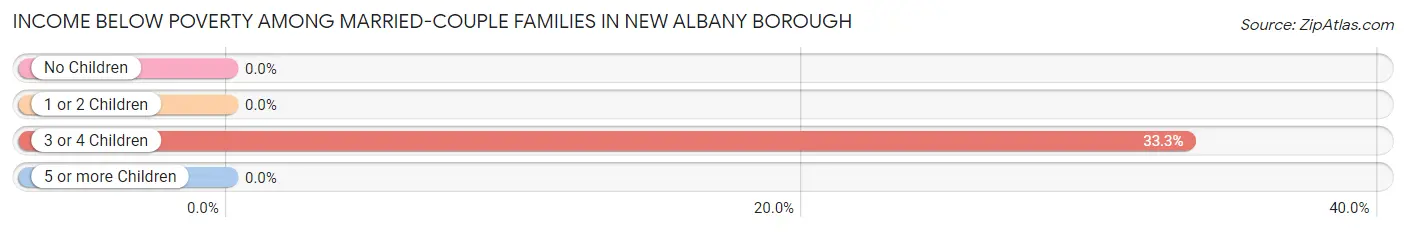
| Children | Above Poverty | Below Poverty |
| No Children | 13 (100.0%) | 0 (0.0%) |
| 1 or 2 Children | 18 (100.0%) | 0 (0.0%) |
| 3 or 4 Children | 4 (66.7%) | 2 (33.3%) |
| 5 or more Children | 0 (0.0%) | 0 (0.0%) |
| Total | 35 (94.6%) | 2 (5.4%) |
Income Below Poverty Among Single-Parent Households in New Albany borough
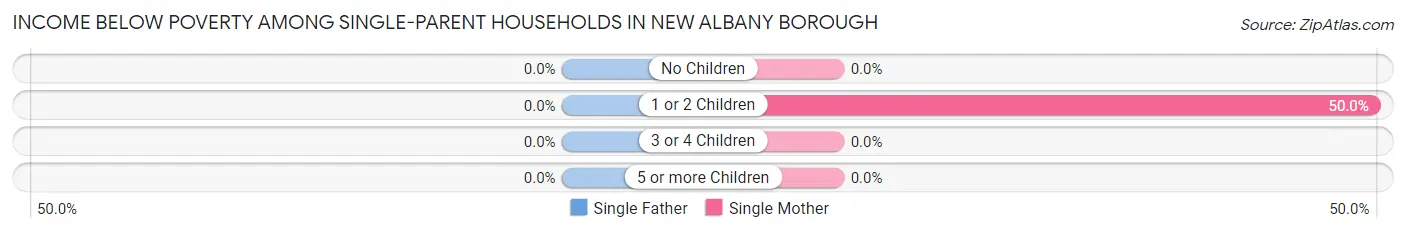
| Children | Single Father | Single Mother |
| No Children | 0 (0.0%) | 0 (0.0%) |
| 1 or 2 Children | 0 (0.0%) | 6 (50.0%) |
| 3 or 4 Children | 0 (0.0%) | 0 (0.0%) |
| 5 or more Children | 0 (0.0%) | 0 (0.0%) |
| Total | 0 (0.0%) | 6 (30.0%) |
Income Below Poverty Among Married-Couple vs Single-Parent Households in New Albany borough
The poverty data for New Albany borough shows that 2 of the married-couple family households (5.4%) and 6 of the single-parent households (21.4%) are living below the poverty level. Within the married-couple family households, those with 3 or 4 children have the highest poverty rate, with 2 households (33.3%) falling below the poverty line. Among the single-parent households, those with 1 or 2 children have the highest poverty rate, with 6 household (40.0%) living below poverty.
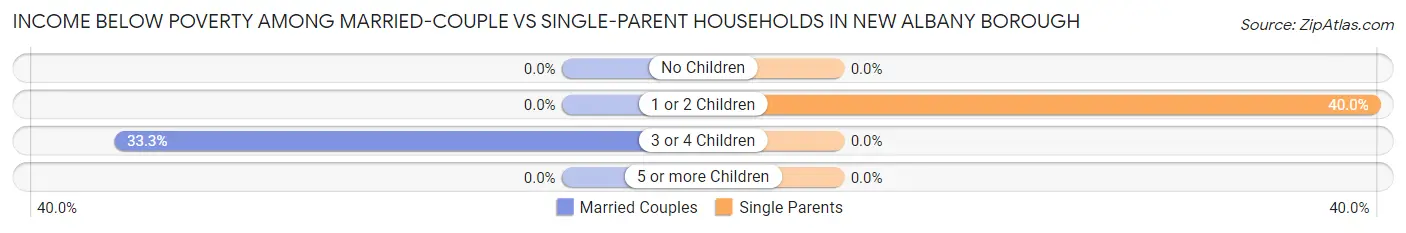
| Children | Married-Couple Families | Single-Parent Households |
| No Children | 0 (0.0%) | 0 (0.0%) |
| 1 or 2 Children | 0 (0.0%) | 6 (40.0%) |
| 3 or 4 Children | 2 (33.3%) | 0 (0.0%) |
| 5 or more Children | 0 (0.0%) | 0 (0.0%) |
| Total | 2 (5.4%) | 6 (21.4%) |
Race in New Albany borough
The most populous races in New Albany borough are White / Caucasian (322 | 95.6%), Two or more Races (14 | 4.2%), and Native / Alaskan (1 | 0.3%).
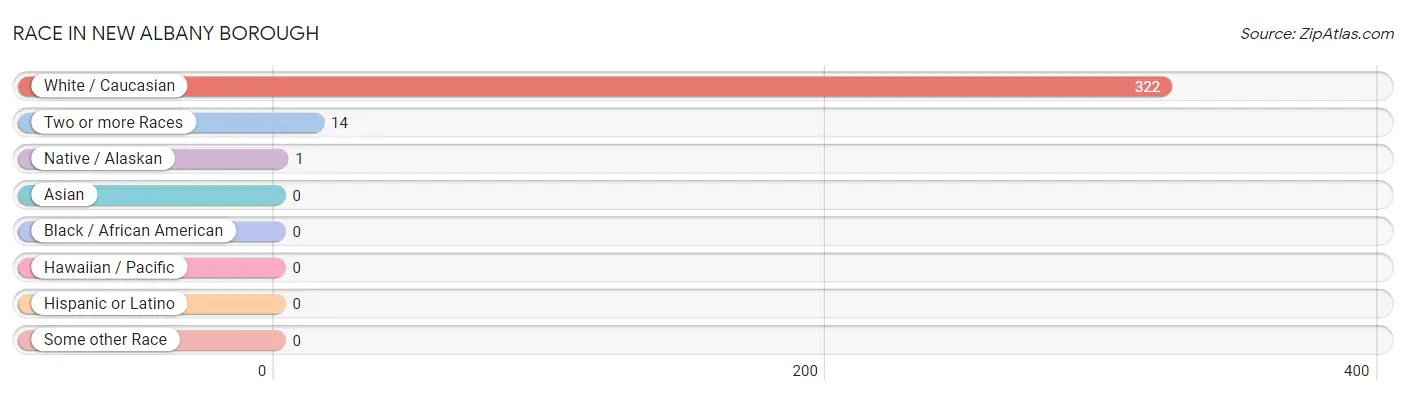
| Race | # Population | % Population |
| Asian | 0 | 0.0% |
| Black / African American | 0 | 0.0% |
| Hawaiian / Pacific | 0 | 0.0% |
| Hispanic or Latino | 0 | 0.0% |
| Native / Alaskan | 1 | 0.3% |
| White / Caucasian | 322 | 95.6% |
| Two or more Races | 14 | 4.2% |
| Some other Race | 0 | 0.0% |
| Total | 337 | 100.0% |
Ancestry in New Albany borough
The most populous ancestries reported in New Albany borough are Irish (49 | 14.5%), German (42 | 12.5%), English (26 | 7.7%), Italian (26 | 7.7%), and French (12 | 3.6%), together accounting for 46.0% of all New Albany borough residents.
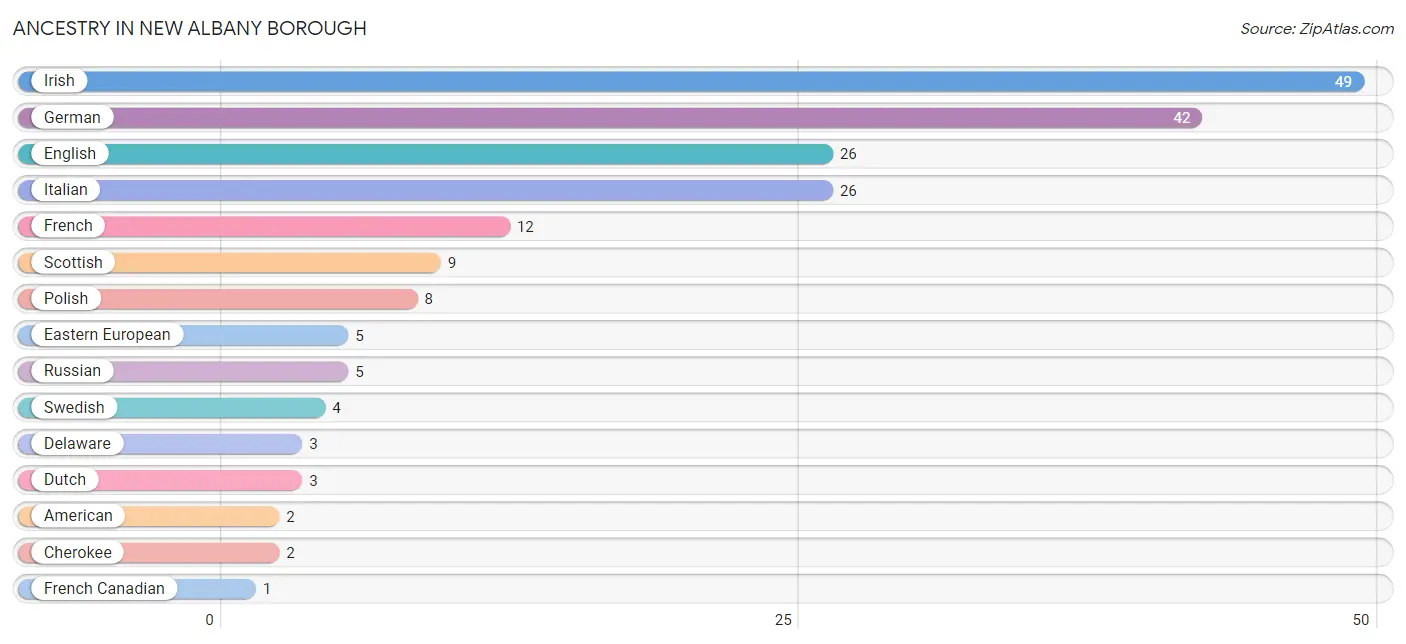
| Ancestry | # Population | % Population |
| American | 2 | 0.6% |
| Cherokee | 2 | 0.6% |
| Delaware | 3 | 0.9% |
| Dutch | 3 | 0.9% |
| Eastern European | 5 | 1.5% |
| English | 26 | 7.7% |
| French | 12 | 3.6% |
| French Canadian | 1 | 0.3% |
| German | 42 | 12.5% |
| Irish | 49 | 14.5% |
| Italian | 26 | 7.7% |
| Pennsylvania German | 1 | 0.3% |
| Polish | 8 | 2.4% |
| Russian | 5 | 1.5% |
| Scottish | 9 | 2.7% |
| Swedish | 4 | 1.2% | View All 16 Rows |
Immigrants in New Albany borough

| Immigration Origin | # Population | % Population | View All 0 Rows |
Sex and Age in New Albany borough
Sex and Age in New Albany borough
The most populous age groups in New Albany borough are 5 to 9 Years (22 | 12.9%) for men and 25 to 29 Years (25 | 15.0%) for women.
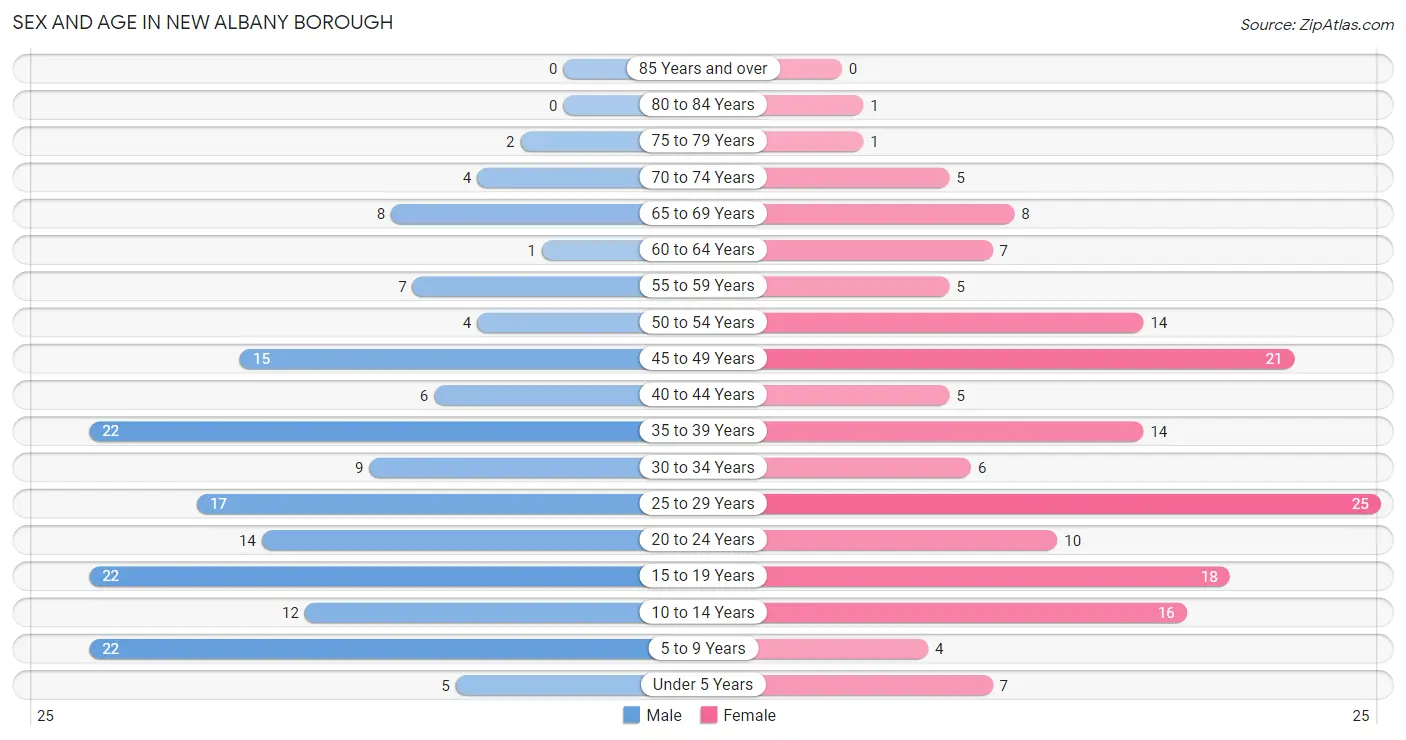
| Age Bracket | Male | Female |
| Under 5 Years | 5 (2.9%) | 7 (4.2%) |
| 5 to 9 Years | 22 (12.9%) | 4 (2.4%) |
| 10 to 14 Years | 12 (7.1%) | 16 (9.6%) |
| 15 to 19 Years | 22 (12.9%) | 18 (10.8%) |
| 20 to 24 Years | 14 (8.2%) | 10 (6.0%) |
| 25 to 29 Years | 17 (10.0%) | 25 (15.0%) |
| 30 to 34 Years | 9 (5.3%) | 6 (3.6%) |
| 35 to 39 Years | 22 (12.9%) | 14 (8.4%) |
| 40 to 44 Years | 6 (3.5%) | 5 (3.0%) |
| 45 to 49 Years | 15 (8.8%) | 21 (12.6%) |
| 50 to 54 Years | 4 (2.4%) | 14 (8.4%) |
| 55 to 59 Years | 7 (4.1%) | 5 (3.0%) |
| 60 to 64 Years | 1 (0.6%) | 7 (4.2%) |
| 65 to 69 Years | 8 (4.7%) | 8 (4.8%) |
| 70 to 74 Years | 4 (2.4%) | 5 (3.0%) |
| 75 to 79 Years | 2 (1.2%) | 1 (0.6%) |
| 80 to 84 Years | 0 (0.0%) | 1 (0.6%) |
| 85 Years and over | 0 (0.0%) | 0 (0.0%) |
| Total | 170 (100.0%) | 167 (100.0%) |
Families and Households in New Albany borough
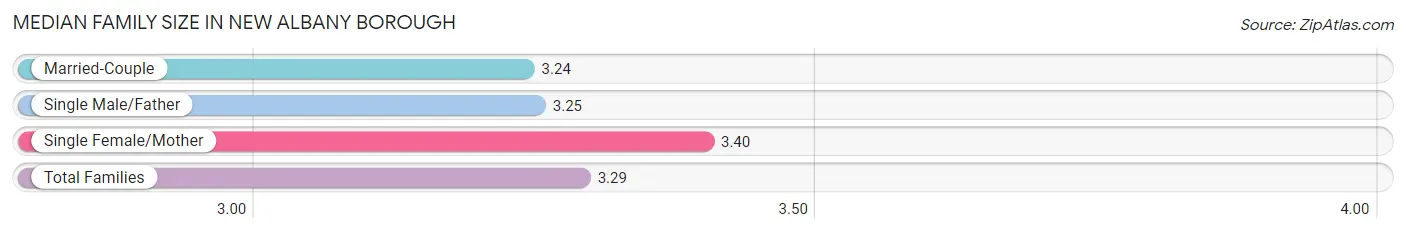
Median Family Size in New Albany borough
The median family size in New Albany borough is 3.29 persons per family, with single female/mother families (20 | 30.8%) accounting for the largest median family size of 3.4 persons per family. On the other hand, married-couple families (37 | 56.9%) represent the smallest median family size with 3.24 persons per family.
| Family Type | # Families | Family Size |
| Married-Couple | 37 (56.9%) | 3.24 |
| Single Male/Father | 8 (12.3%) | 3.25 |
| Single Female/Mother | 20 (30.8%) | 3.40 |
| Total Families | 65 (100.0%) | 3.29 |
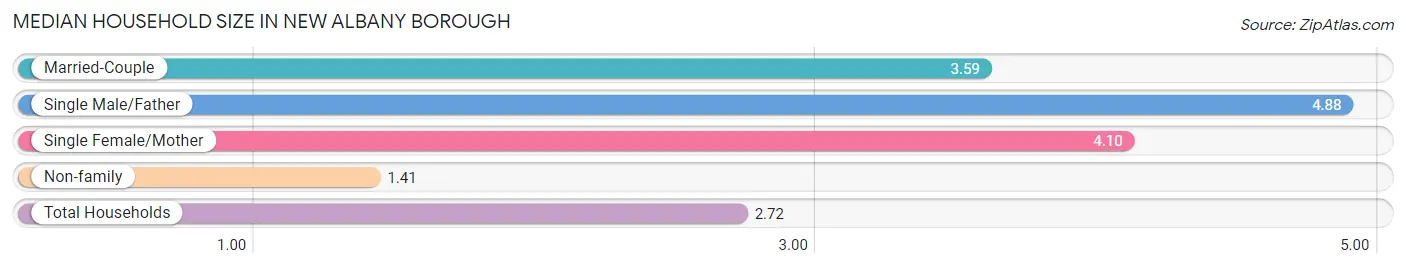
Median Household Size in New Albany borough
The median household size in New Albany borough is 2.72 persons per household, with single male/father households (8 | 6.5%) accounting for the largest median household size of 4.88 persons per household. non-family households (59 | 47.6%) represent the smallest median household size with 1.41 persons per household.
| Household Type | # Households | Household Size |
| Married-Couple | 37 (29.8%) | 3.59 |
| Single Male/Father | 8 (6.5%) | 4.88 |
| Single Female/Mother | 20 (16.1%) | 4.10 |
| Non-family | 59 (47.6%) | 1.41 |
| Total Households | 124 (100.0%) | 2.72 |
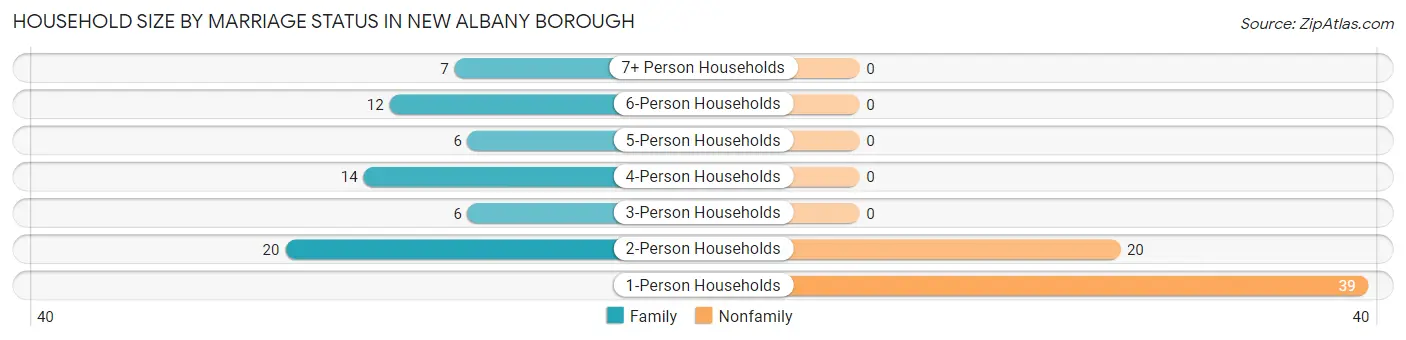
Household Size by Marriage Status in New Albany borough
Out of a total of 124 households in New Albany borough, 65 (52.4%) are family households, while 59 (47.6%) are nonfamily households. The most numerous type of family households are 2-person households, comprising 20, and the most common type of nonfamily households are 1-person households, comprising 39.
| Household Size | Family Households | Nonfamily Households |
| 1-Person Households | - | 39 (31.5%) |
| 2-Person Households | 20 (16.1%) | 20 (16.1%) |
| 3-Person Households | 6 (4.8%) | 0 (0.0%) |
| 4-Person Households | 14 (11.3%) | 0 (0.0%) |
| 5-Person Households | 6 (4.8%) | 0 (0.0%) |
| 6-Person Households | 12 (9.7%) | 0 (0.0%) |
| 7+ Person Households | 7 (5.7%) | 0 (0.0%) |
| Total | 65 (52.4%) | 59 (47.6%) |
Female Fertility in New Albany borough
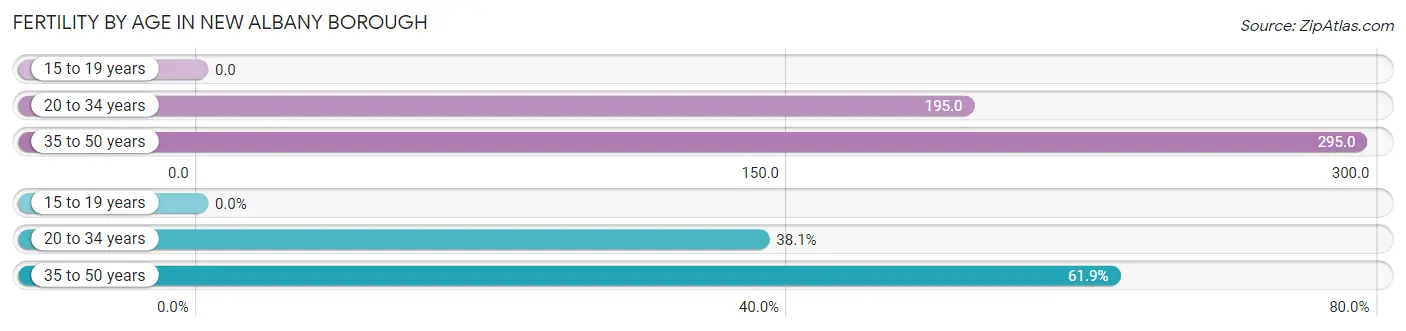
Fertility by Age in New Albany borough
Average fertility rate in New Albany borough is 204.0 births per 1,000 women. Women in the age bracket of 35 to 50 years have the highest fertility rate with 295.0 births per 1,000 women. Women in the age bracket of 35 to 50 years acount for 61.9% of all women with births.
| Age Bracket | Women with Births | Births / 1,000 Women |
| 15 to 19 years | 0 (0.0%) | 0.0 |
| 20 to 34 years | 8 (38.1%) | 195.0 |
| 35 to 50 years | 13 (61.9%) | 295.0 |
| Total | 21 (100.0%) | 204.0 |
Fertility by Age by Marriage Status in New Albany borough
28.6% of women with births (21) in New Albany borough are married. The highest percentage of unmarried women with births falls into 20 to 34 years age bracket with 75.0% of them unmarried at the time of birth, while the lowest percentage of unmarried women with births belong to 35 to 50 years age bracket with 69.2% of them unmarried.
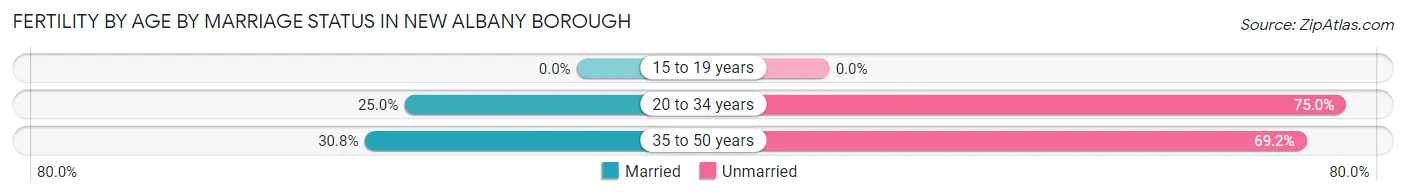
| Age Bracket | Married | Unmarried |
| 15 to 19 years | 0 (0.0%) | 0 (0.0%) |
| 20 to 34 years | 2 (25.0%) | 6 (75.0%) |
| 35 to 50 years | 4 (30.8%) | 9 (69.2%) |
| Total | 6 (28.6%) | 15 (71.4%) |
Fertility by Education in New Albany borough
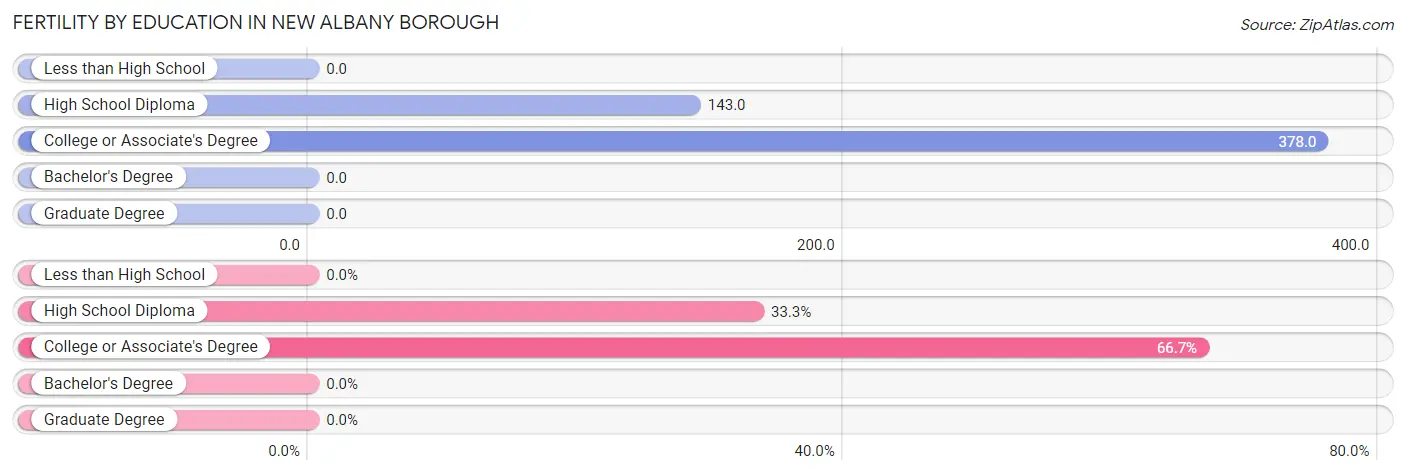
| Educational Attainment | Women with Births | Births / 1,000 Women |
| Less than High School | 0 (0.0%) | 0.0 |
| High School Diploma | 7 (33.3%) | 143.0 |
| College or Associate's Degree | 14 (66.7%) | 378.0 |
| Bachelor's Degree | 0 (0.0%) | 0.0 |
| Graduate Degree | 0 (0.0%) | 0.0 |
| Total | 21 (100.0%) | 204.0 |
Fertility by Education by Marriage Status in New Albany borough
71.4% of women with births in New Albany borough are unmarried. Women with the educational attainment of high school diploma are most likely to be married with 28.6% of them married at childbirth, while women with the educational attainment of high school diploma are least likely to be married with 71.4% of them unmarried at childbirth.
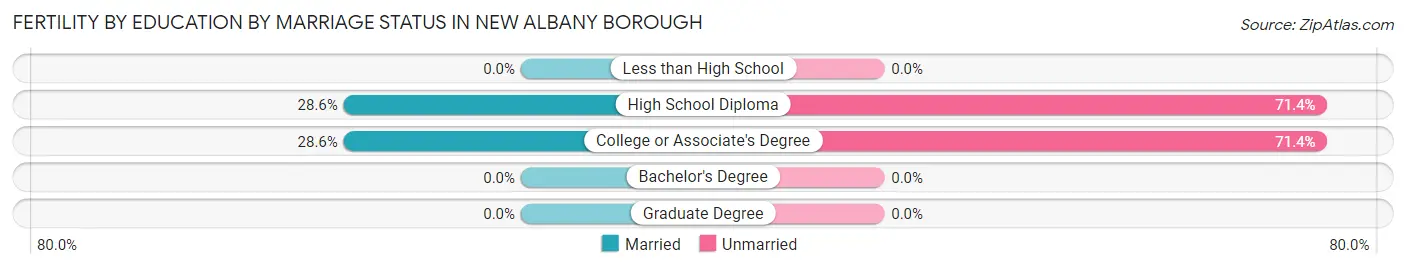
| Educational Attainment | Married | Unmarried |
| Less than High School | 0 (0.0%) | 0 (0.0%) |
| High School Diploma | 2 (28.6%) | 5 (71.4%) |
| College or Associate's Degree | 4 (28.6%) | 10 (71.4%) |
| Bachelor's Degree | 0 (0.0%) | 0 (0.0%) |
| Graduate Degree | 0 (0.0%) | 0 (0.0%) |
| Total | 6 (28.6%) | 15 (71.4%) |
Employment Characteristics in New Albany borough
Employment by Class of Employer in New Albany borough
Among the 154 employed individuals in New Albany borough, private company employees (120 | 77.9%), self-employed (not incorporated) (19 | 12.3%), and not-for-profit organizations (10 | 6.5%) make up the most common classes of employment.
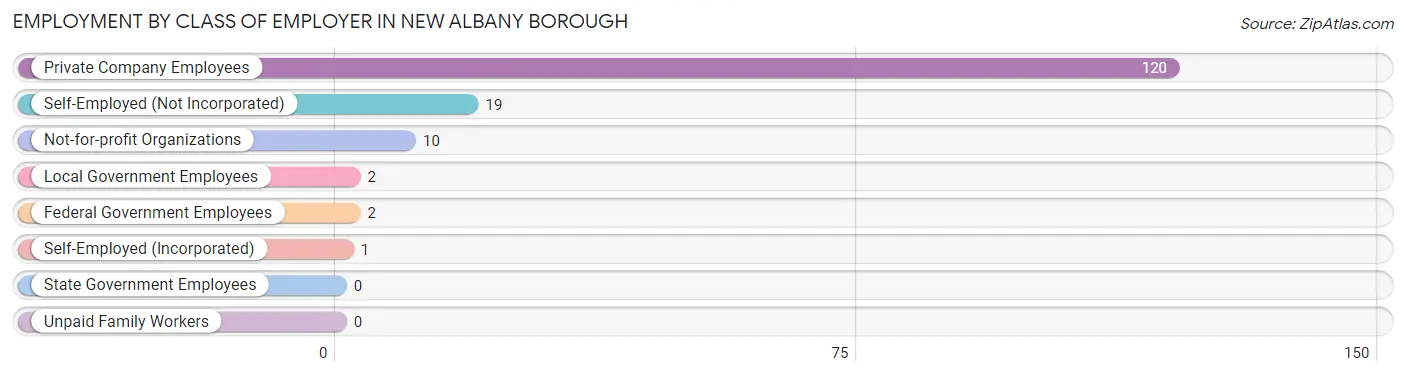
| Employer Class | # Employees | % Employees |
| Private Company Employees | 120 | 77.9% |
| Self-Employed (Incorporated) | 1 | 0.6% |
| Self-Employed (Not Incorporated) | 19 | 12.3% |
| Not-for-profit Organizations | 10 | 6.5% |
| Local Government Employees | 2 | 1.3% |
| State Government Employees | 0 | 0.0% |
| Federal Government Employees | 2 | 1.3% |
| Unpaid Family Workers | 0 | 0.0% |
| Total | 154 | 100.0% |
Employment Status by Age in New Albany borough
According to the labor force statistics for New Albany borough, out of the total population over 16 years of age (262), 61.8% or 162 individuals are in the labor force, with 4.9% or 8 of them unemployed. The age group with the highest labor force participation rate is 30 to 34 years, with 100.0% or 15 individuals in the labor force. Within the labor force, the 25 to 29 years age range has the highest percentage of unemployed individuals, with 20.7% or 6 of them being unemployed.
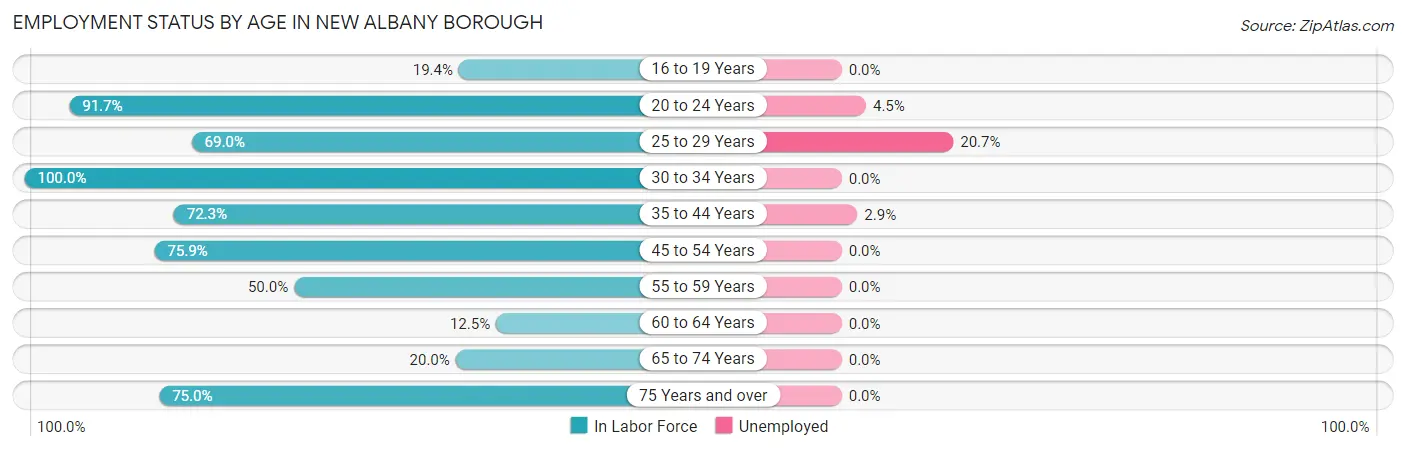
| Age Bracket | In Labor Force | Unemployed |
| 16 to 19 Years | 6 (19.4%) | 0 (0.0%) |
| 20 to 24 Years | 22 (91.7%) | 1 (4.5%) |
| 25 to 29 Years | 29 (69.0%) | 6 (20.7%) |
| 30 to 34 Years | 15 (100.0%) | 0 (0.0%) |
| 35 to 44 Years | 34 (72.3%) | 1 (2.9%) |
| 45 to 54 Years | 41 (75.9%) | 0 (0.0%) |
| 55 to 59 Years | 6 (50.0%) | 0 (0.0%) |
| 60 to 64 Years | 1 (12.5%) | 0 (0.0%) |
| 65 to 74 Years | 5 (20.0%) | 0 (0.0%) |
| 75 Years and over | 3 (75.0%) | 0 (0.0%) |
| Total | 162 (61.8%) | 8 (4.9%) |
Employment Status by Educational Attainment in New Albany borough
According to labor force statistics for New Albany borough, 70.8% of individuals (126) out of the total population between 25 and 64 years of age (178) are in the labor force, with 5.6% or 7 of them being unemployed. The group with the highest labor force participation rate are those with the educational attainment of bachelor's degree or higher, with 100.0% or 12 individuals in the labor force. Within the labor force, individuals with college / associate degree education have the highest percentage of unemployment, with 14.3% or 6 of them being unemployed.
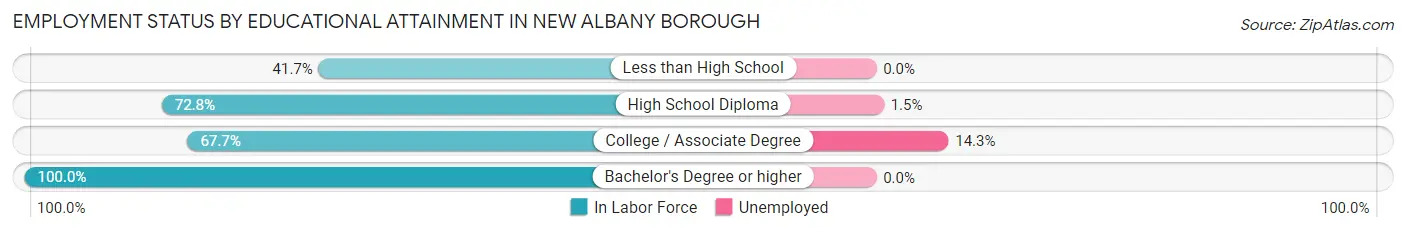
| Educational Attainment | In Labor Force | Unemployed |
| Less than High School | 5 (41.7%) | 0 (0.0%) |
| High School Diploma | 67 (72.8%) | 1 (1.5%) |
| College / Associate Degree | 42 (67.7%) | 9 (14.3%) |
| Bachelor's Degree or higher | 12 (100.0%) | 0 (0.0%) |
| Total | 126 (70.8%) | 10 (5.6%) |
Employment Occupations by Sex in New Albany borough
Management, Business, Science and Arts Occupations
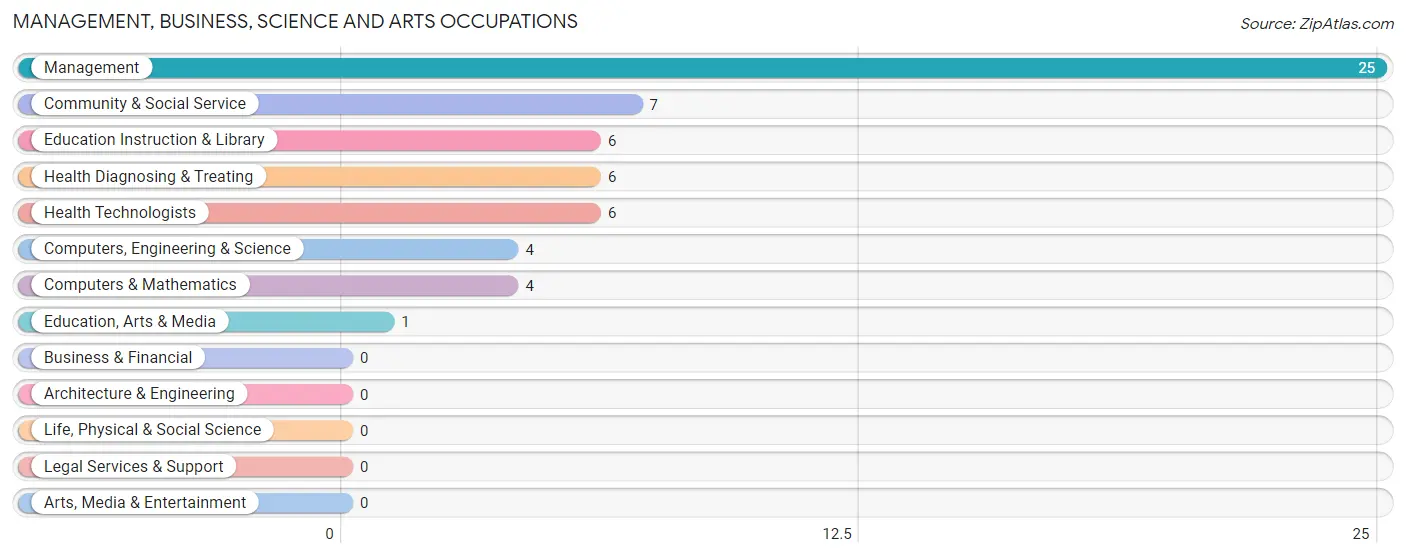
The most common Management, Business, Science and Arts occupations in New Albany borough are Management (25 | 16.2%), Community & Social Service (7 | 4.5%), Education Instruction & Library (6 | 3.9%), Health Diagnosing & Treating (6 | 3.9%), and Health Technologists (6 | 3.9%).
Management, Business, Science and Arts Occupations by Sex
Within the Management, Business, Science and Arts occupations in New Albany borough, the most male-oriented occupations are Computers, Engineering & Science (100.0%), Computers & Mathematics (100.0%), and Management (68.0%), while the most female-oriented occupations are Community & Social Service (100.0%), Education, Arts & Media (100.0%), and Education Instruction & Library (100.0%).
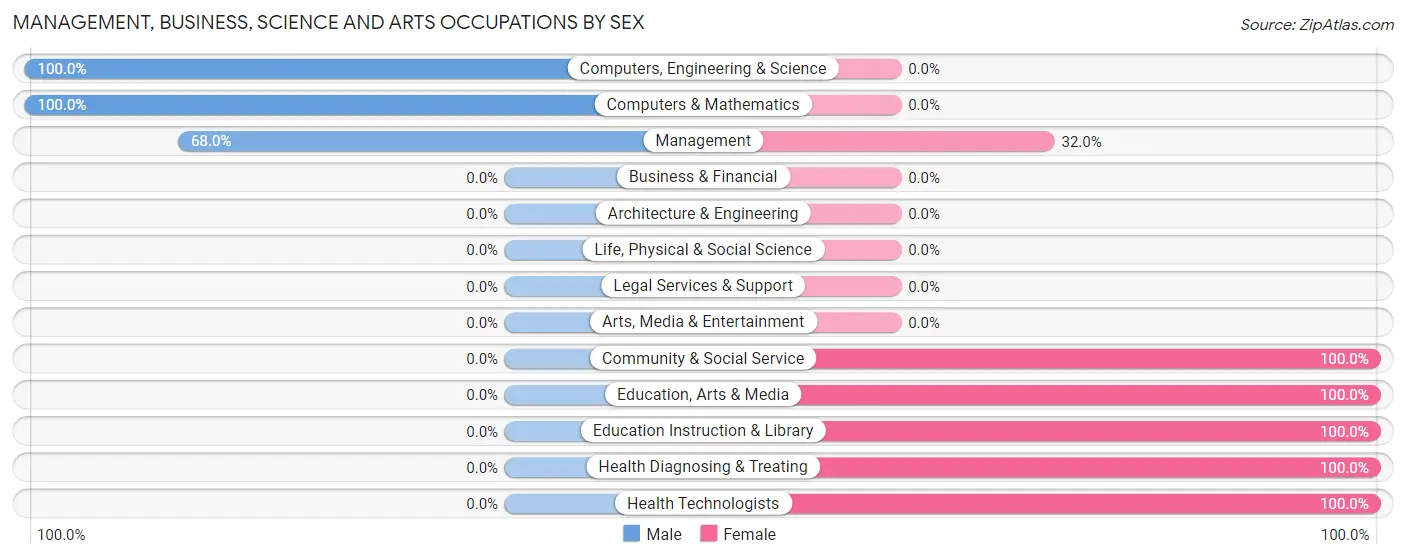
| Occupation | Male | Female |
| Management | 17 (68.0%) | 8 (32.0%) |
| Business & Financial | 0 (0.0%) | 0 (0.0%) |
| Computers, Engineering & Science | 4 (100.0%) | 0 (0.0%) |
| Computers & Mathematics | 4 (100.0%) | 0 (0.0%) |
| Architecture & Engineering | 0 (0.0%) | 0 (0.0%) |
| Life, Physical & Social Science | 0 (0.0%) | 0 (0.0%) |
| Community & Social Service | 0 (0.0%) | 7 (100.0%) |
| Education, Arts & Media | 0 (0.0%) | 1 (100.0%) |
| Legal Services & Support | 0 (0.0%) | 0 (0.0%) |
| Education Instruction & Library | 0 (0.0%) | 6 (100.0%) |
| Arts, Media & Entertainment | 0 (0.0%) | 0 (0.0%) |
| Health Diagnosing & Treating | 0 (0.0%) | 6 (100.0%) |
| Health Technologists | 0 (0.0%) | 6 (100.0%) |
| Total (Category) | 21 (50.0%) | 21 (50.0%) |
| Total (Overall) | 92 (59.7%) | 62 (40.3%) |
Services Occupations
The most common Services occupations in New Albany borough are Food Preparation & Serving (12 | 7.8%), Security & Protection (5 | 3.3%), Firefighting & Prevention (5 | 3.3%), Cleaning & Maintenance (4 | 2.6%), and Healthcare Support (1 | 0.6%).

Services Occupations by Sex
Within the Services occupations in New Albany borough, the most male-oriented occupations are Cleaning & Maintenance (75.0%), and Food Preparation & Serving (66.7%), while the most female-oriented occupations are Healthcare Support (100.0%), Security & Protection (100.0%), and Firefighting & Prevention (100.0%).
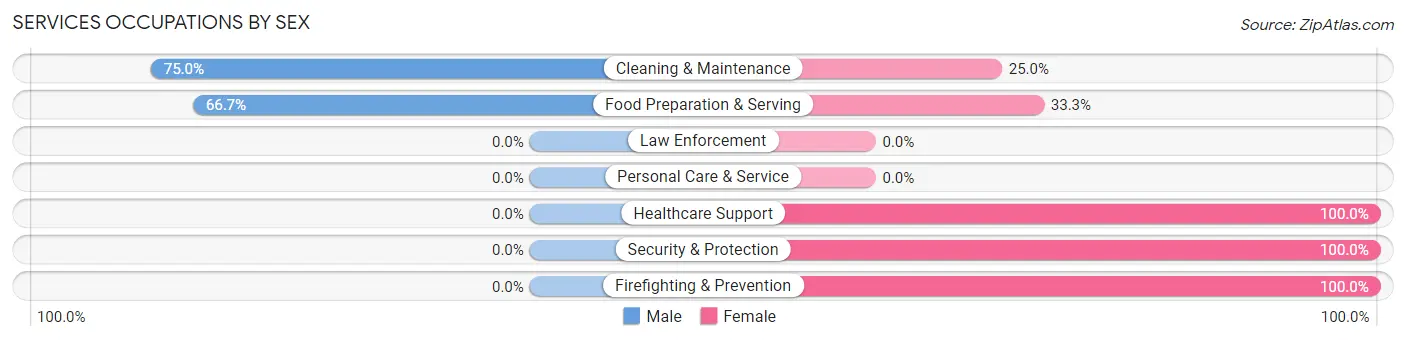
| Occupation | Male | Female |
| Healthcare Support | 0 (0.0%) | 1 (100.0%) |
| Security & Protection | 0 (0.0%) | 5 (100.0%) |
| Firefighting & Prevention | 0 (0.0%) | 5 (100.0%) |
| Law Enforcement | 0 (0.0%) | 0 (0.0%) |
| Food Preparation & Serving | 8 (66.7%) | 4 (33.3%) |
| Cleaning & Maintenance | 3 (75.0%) | 1 (25.0%) |
| Personal Care & Service | 0 (0.0%) | 0 (0.0%) |
| Total (Category) | 11 (50.0%) | 11 (50.0%) |
| Total (Overall) | 92 (59.7%) | 62 (40.3%) |
Sales and Office Occupations
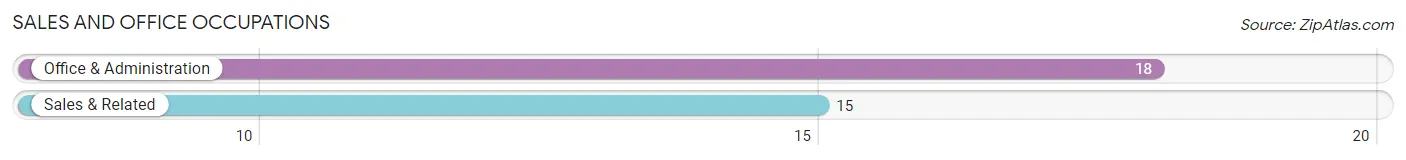
The most common Sales and Office occupations in New Albany borough are Office & Administration (18 | 11.7%), and Sales & Related (15 | 9.7%).
Sales and Office Occupations by Sex
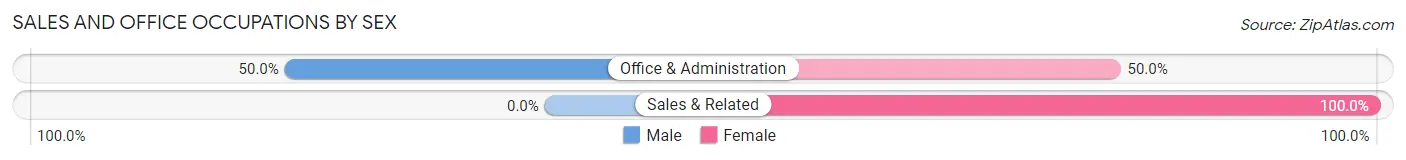
| Occupation | Male | Female |
| Sales & Related | 0 (0.0%) | 15 (100.0%) |
| Office & Administration | 9 (50.0%) | 9 (50.0%) |
| Total (Category) | 9 (27.3%) | 24 (72.7%) |
| Total (Overall) | 92 (59.7%) | 62 (40.3%) |
Natural Resources, Construction and Maintenance Occupations
The most common Natural Resources, Construction and Maintenance occupations in New Albany borough are Construction & Extraction (23 | 14.9%), and Installation, Maintenance & Repair (5 | 3.3%).
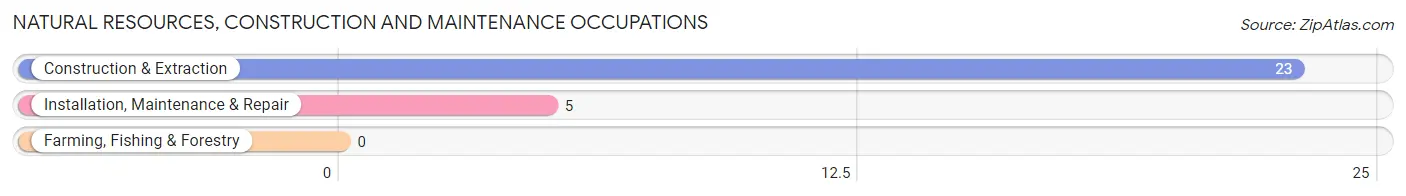
Natural Resources, Construction and Maintenance Occupations by Sex
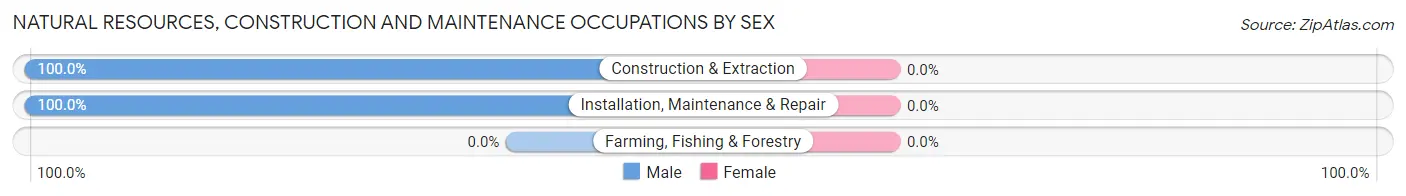
| Occupation | Male | Female |
| Farming, Fishing & Forestry | 0 (0.0%) | 0 (0.0%) |
| Construction & Extraction | 23 (100.0%) | 0 (0.0%) |
| Installation, Maintenance & Repair | 5 (100.0%) | 0 (0.0%) |
| Total (Category) | 28 (100.0%) | 0 (0.0%) |
| Total (Overall) | 92 (59.7%) | 62 (40.3%) |
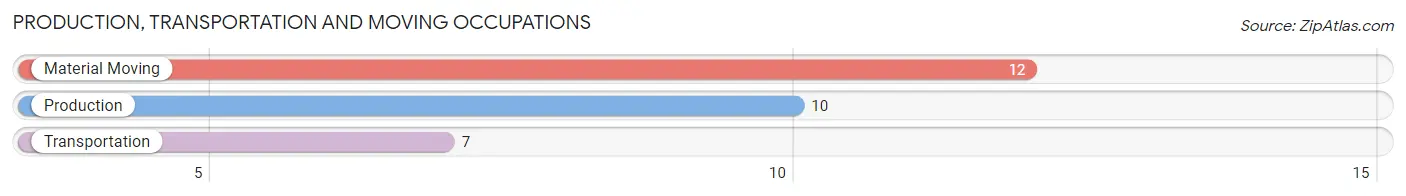
Production, Transportation and Moving Occupations
The most common Production, Transportation and Moving occupations in New Albany borough are Material Moving (12 | 7.8%), Production (10 | 6.5%), and Transportation (7 | 4.5%).
Production, Transportation and Moving Occupations by Sex
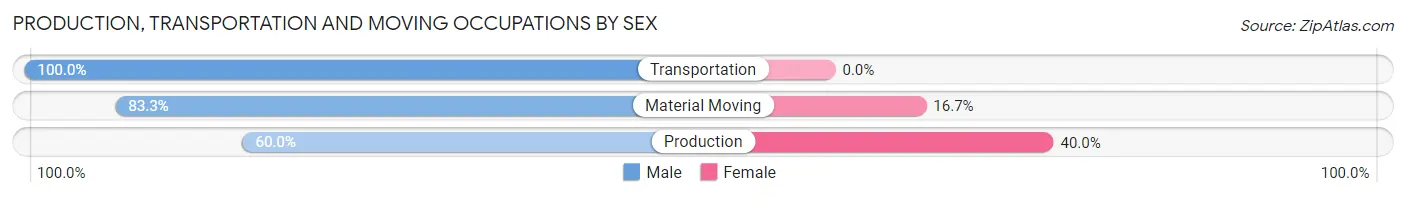
| Occupation | Male | Female |
| Production | 6 (60.0%) | 4 (40.0%) |
| Transportation | 7 (100.0%) | 0 (0.0%) |
| Material Moving | 10 (83.3%) | 2 (16.7%) |
| Total (Category) | 23 (79.3%) | 6 (20.7%) |
| Total (Overall) | 92 (59.7%) | 62 (40.3%) |
Employment Industries by Sex in New Albany borough
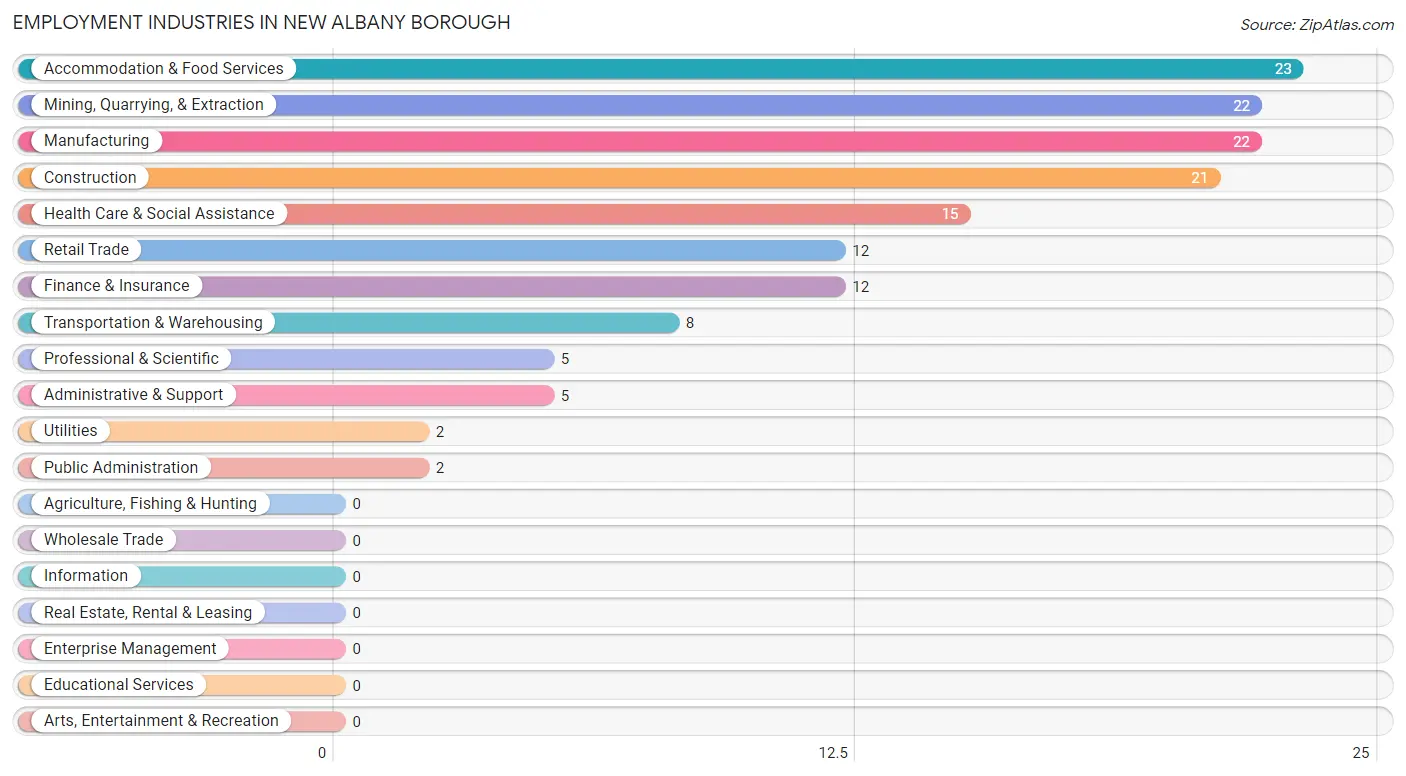
Employment Industries in New Albany borough
The major employment industries in New Albany borough include Accommodation & Food Services (23 | 14.9%), Mining, Quarrying, & Extraction (22 | 14.3%), Manufacturing (22 | 14.3%), Construction (21 | 13.6%), and Health Care & Social Assistance (15 | 9.7%).
Employment Industries by Sex in New Albany borough
The New Albany borough industries that see more men than women are Mining, Quarrying, & Extraction (100.0%), Transportation & Warehousing (100.0%), and Utilities (100.0%), whereas the industries that tend to have a higher number of women are Finance & Insurance (100.0%), Administrative & Support (100.0%), and Health Care & Social Assistance (93.3%).
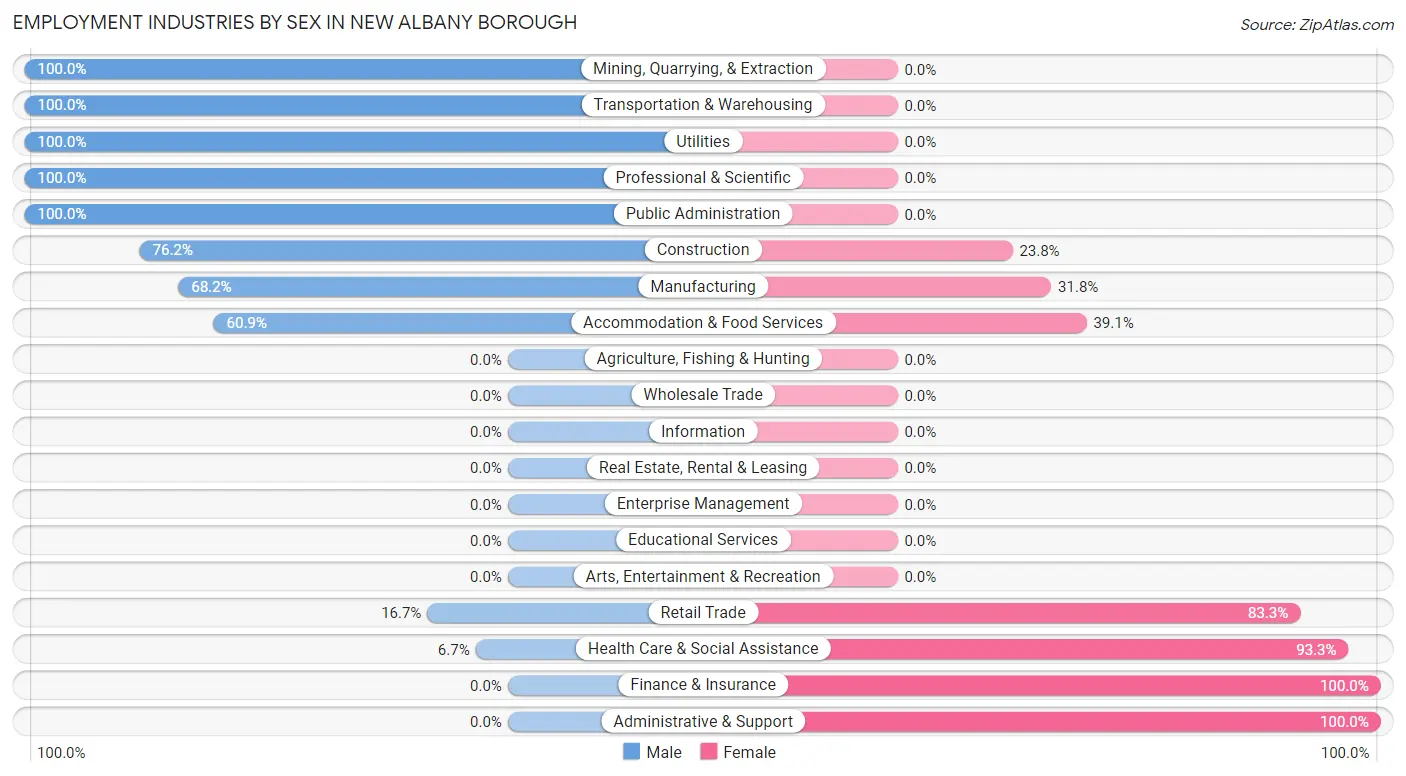
| Industry | Male | Female |
| Agriculture, Fishing & Hunting | 0 (0.0%) | 0 (0.0%) |
| Mining, Quarrying, & Extraction | 22 (100.0%) | 0 (0.0%) |
| Construction | 16 (76.2%) | 5 (23.8%) |
| Manufacturing | 15 (68.2%) | 7 (31.8%) |
| Wholesale Trade | 0 (0.0%) | 0 (0.0%) |
| Retail Trade | 2 (16.7%) | 10 (83.3%) |
| Transportation & Warehousing | 8 (100.0%) | 0 (0.0%) |
| Utilities | 2 (100.0%) | 0 (0.0%) |
| Information | 0 (0.0%) | 0 (0.0%) |
| Finance & Insurance | 0 (0.0%) | 12 (100.0%) |
| Real Estate, Rental & Leasing | 0 (0.0%) | 0 (0.0%) |
| Professional & Scientific | 5 (100.0%) | 0 (0.0%) |
| Enterprise Management | 0 (0.0%) | 0 (0.0%) |
| Administrative & Support | 0 (0.0%) | 5 (100.0%) |
| Educational Services | 0 (0.0%) | 0 (0.0%) |
| Health Care & Social Assistance | 1 (6.7%) | 14 (93.3%) |
| Arts, Entertainment & Recreation | 0 (0.0%) | 0 (0.0%) |
| Accommodation & Food Services | 14 (60.9%) | 9 (39.1%) |
| Public Administration | 2 (100.0%) | 0 (0.0%) |
| Total | 92 (59.7%) | 62 (40.3%) |
Education in New Albany borough
School Enrollment in New Albany borough
The most common levels of schooling among the 96 students in New Albany borough are high school (35 | 36.5%), elementary school (25 | 26.0%), and middle school (19 | 19.8%).
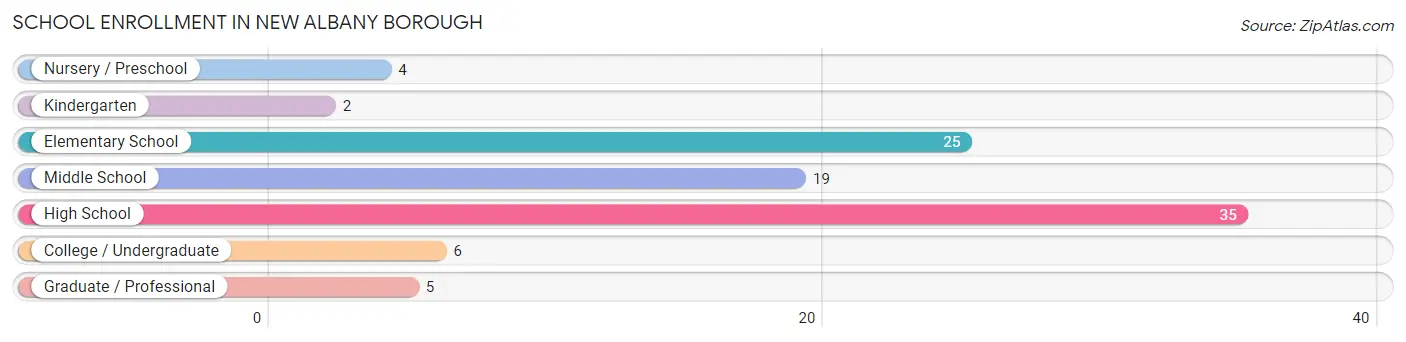
| School Level | # Students | % Students |
| Nursery / Preschool | 4 | 4.2% |
| Kindergarten | 2 | 2.1% |
| Elementary School | 25 | 26.0% |
| Middle School | 19 | 19.8% |
| High School | 35 | 36.5% |
| College / Undergraduate | 6 | 6.2% |
| Graduate / Professional | 5 | 5.2% |
| Total | 96 | 100.0% |
School Enrollment by Age by Funding Source in New Albany borough
Out of a total of 96 students who are enrolled in schools in New Albany borough, 12 (12.5%) attend a private institution, while the remaining 84 (87.5%) are enrolled in public schools. The age group of 5 to 9 year old has the highest likelihood of being enrolled in private schools, with 10 (38.5% in the age bracket) enrolled. Conversely, the age group of 15 to 17 year olds has the lowest likelihood of being enrolled in a private school, with 27 (100.0% in the age bracket) attending a public institution.
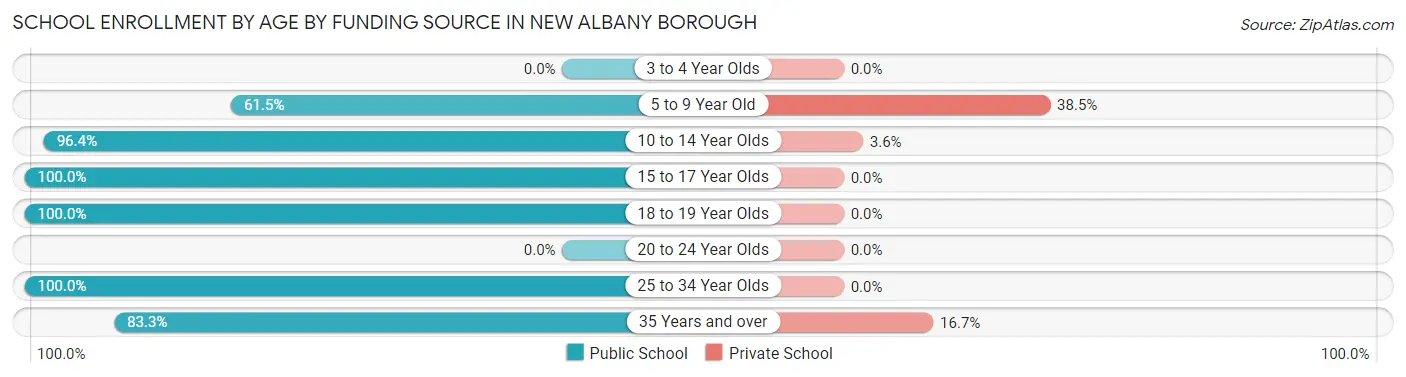
| Age Bracket | Public School | Private School |
| 3 to 4 Year Olds | 0 (0.0%) | 0 (0.0%) |
| 5 to 9 Year Old | 16 (61.5%) | 10 (38.5%) |
| 10 to 14 Year Olds | 27 (96.4%) | 1 (3.6%) |
| 15 to 17 Year Olds | 27 (100.0%) | 0 (0.0%) |
| 18 to 19 Year Olds | 4 (100.0%) | 0 (0.0%) |
| 20 to 24 Year Olds | 0 (0.0%) | 0 (0.0%) |
| 25 to 34 Year Olds | 5 (100.0%) | 0 (0.0%) |
| 35 Years and over | 5 (83.3%) | 1 (16.7%) |
| Total | 84 (87.5%) | 12 (12.5%) |
Educational Attainment by Field of Study in New Albany borough
Bio, nature & agricultural (7 | 43.8%), business (7 | 43.8%), science & technology (1 | 6.2%), and arts & humanities (1 | 6.2%) are the most common fields of study among 16 individuals in New Albany borough who have obtained a bachelor's degree or higher.
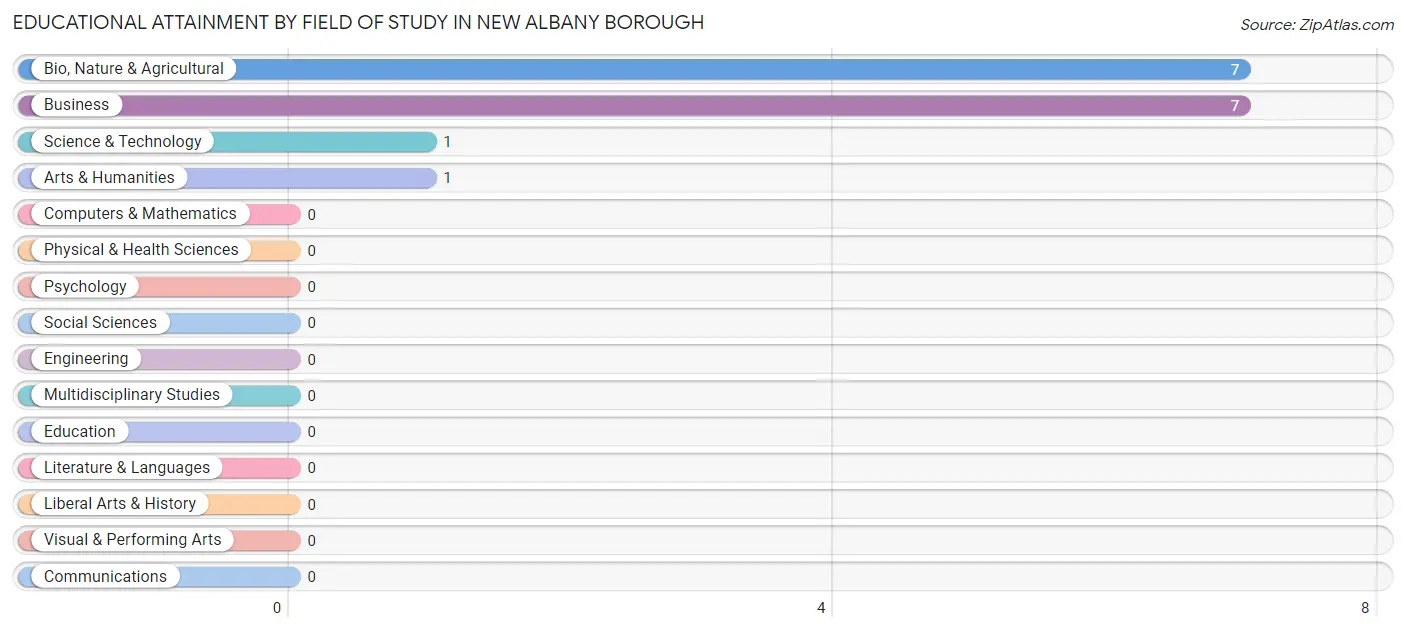
| Field of Study | # Graduates | % Graduates |
| Computers & Mathematics | 0 | 0.0% |
| Bio, Nature & Agricultural | 7 | 43.8% |
| Physical & Health Sciences | 0 | 0.0% |
| Psychology | 0 | 0.0% |
| Social Sciences | 0 | 0.0% |
| Engineering | 0 | 0.0% |
| Multidisciplinary Studies | 0 | 0.0% |
| Science & Technology | 1 | 6.2% |
| Business | 7 | 43.8% |
| Education | 0 | 0.0% |
| Literature & Languages | 0 | 0.0% |
| Liberal Arts & History | 0 | 0.0% |
| Visual & Performing Arts | 0 | 0.0% |
| Communications | 0 | 0.0% |
| Arts & Humanities | 1 | 6.2% |
| Total | 16 | 100.0% |
Transportation & Commute in New Albany borough
Vehicle Availability by Sex in New Albany borough
The most prevalent vehicle ownership categories in New Albany borough are males with 1 vehicle (39, accounting for 42.4%) and females with 1 vehicle (7, making up 62.9%).
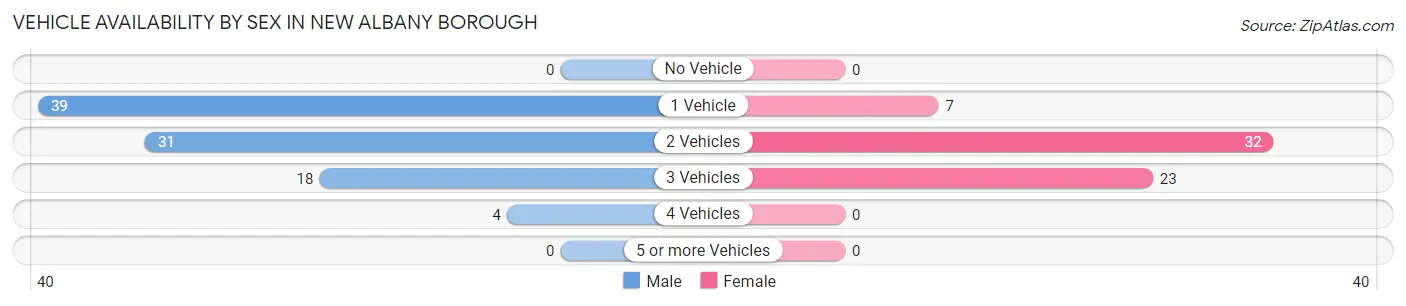
| Vehicles Available | Male | Female |
| No Vehicle | 0 (0.0%) | 0 (0.0%) |
| 1 Vehicle | 39 (42.4%) | 7 (11.3%) |
| 2 Vehicles | 31 (33.7%) | 32 (51.6%) |
| 3 Vehicles | 18 (19.6%) | 23 (37.1%) |
| 4 Vehicles | 4 (4.3%) | 0 (0.0%) |
| 5 or more Vehicles | 0 (0.0%) | 0 (0.0%) |
| Total | 92 (100.0%) | 62 (100.0%) |
Commute Time in New Albany borough
The most frequently occuring commute durations in New Albany borough are 5 to 9 minutes (33 commuters, 22.0%), 20 to 24 minutes (32 commuters, 21.3%), and 30 to 34 minutes (24 commuters, 16.0%).
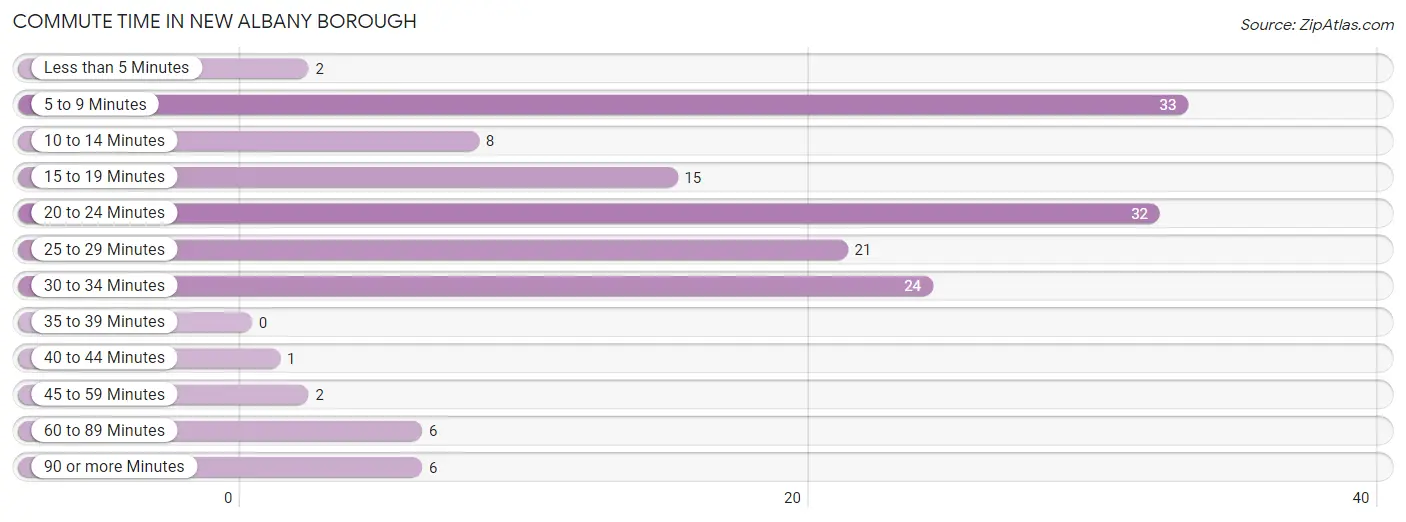
| Commute Time | # Commuters | % Commuters |
| Less than 5 Minutes | 2 | 1.3% |
| 5 to 9 Minutes | 33 | 22.0% |
| 10 to 14 Minutes | 8 | 5.3% |
| 15 to 19 Minutes | 15 | 10.0% |
| 20 to 24 Minutes | 32 | 21.3% |
| 25 to 29 Minutes | 21 | 14.0% |
| 30 to 34 Minutes | 24 | 16.0% |
| 35 to 39 Minutes | 0 | 0.0% |
| 40 to 44 Minutes | 1 | 0.7% |
| 45 to 59 Minutes | 2 | 1.3% |
| 60 to 89 Minutes | 6 | 4.0% |
| 90 or more Minutes | 6 | 4.0% |
Commute Time by Sex in New Albany borough
The most common commute times in New Albany borough are 5 to 9 minutes (33 commuters, 37.5%) for males and 20 to 24 minutes (19 commuters, 30.6%) for females.
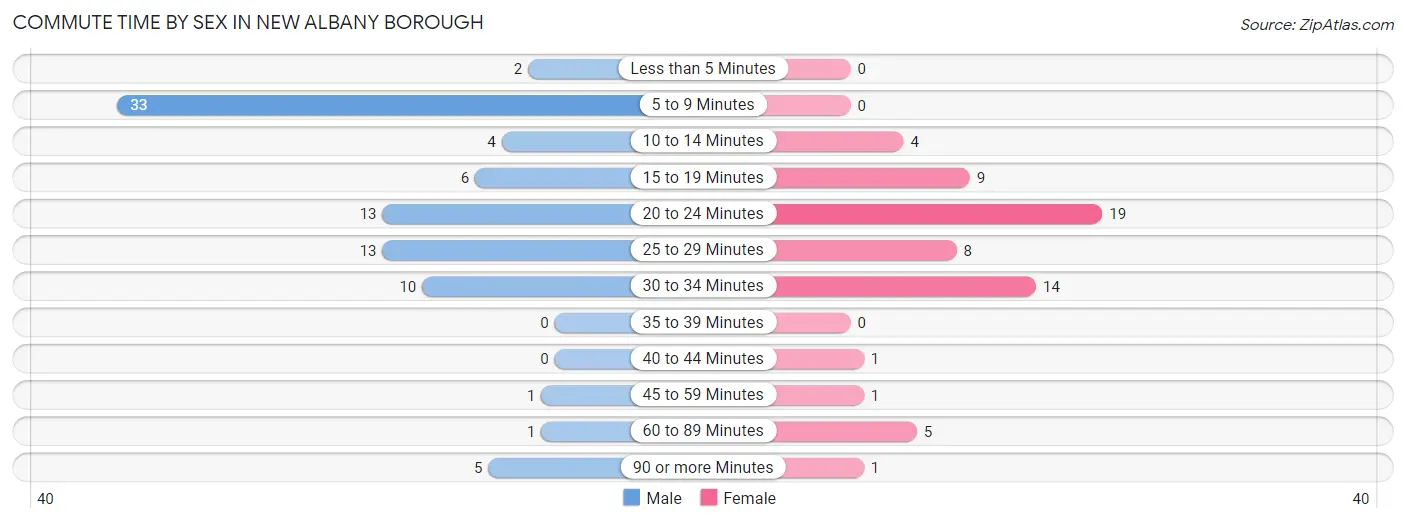
| Commute Time | Male | Female |
| Less than 5 Minutes | 2 (2.3%) | 0 (0.0%) |
| 5 to 9 Minutes | 33 (37.5%) | 0 (0.0%) |
| 10 to 14 Minutes | 4 (4.5%) | 4 (6.5%) |
| 15 to 19 Minutes | 6 (6.8%) | 9 (14.5%) |
| 20 to 24 Minutes | 13 (14.8%) | 19 (30.6%) |
| 25 to 29 Minutes | 13 (14.8%) | 8 (12.9%) |
| 30 to 34 Minutes | 10 (11.4%) | 14 (22.6%) |
| 35 to 39 Minutes | 0 (0.0%) | 0 (0.0%) |
| 40 to 44 Minutes | 0 (0.0%) | 1 (1.6%) |
| 45 to 59 Minutes | 1 (1.1%) | 1 (1.6%) |
| 60 to 89 Minutes | 1 (1.1%) | 5 (8.1%) |
| 90 or more Minutes | 5 (5.7%) | 1 (1.6%) |
Time of Departure to Work by Sex in New Albany borough
The most frequent times of departure to work in New Albany borough are 12:00 AM to 4:59 AM (27, 30.7%) for males and 6:00 AM to 6:29 AM (23, 37.1%) for females.
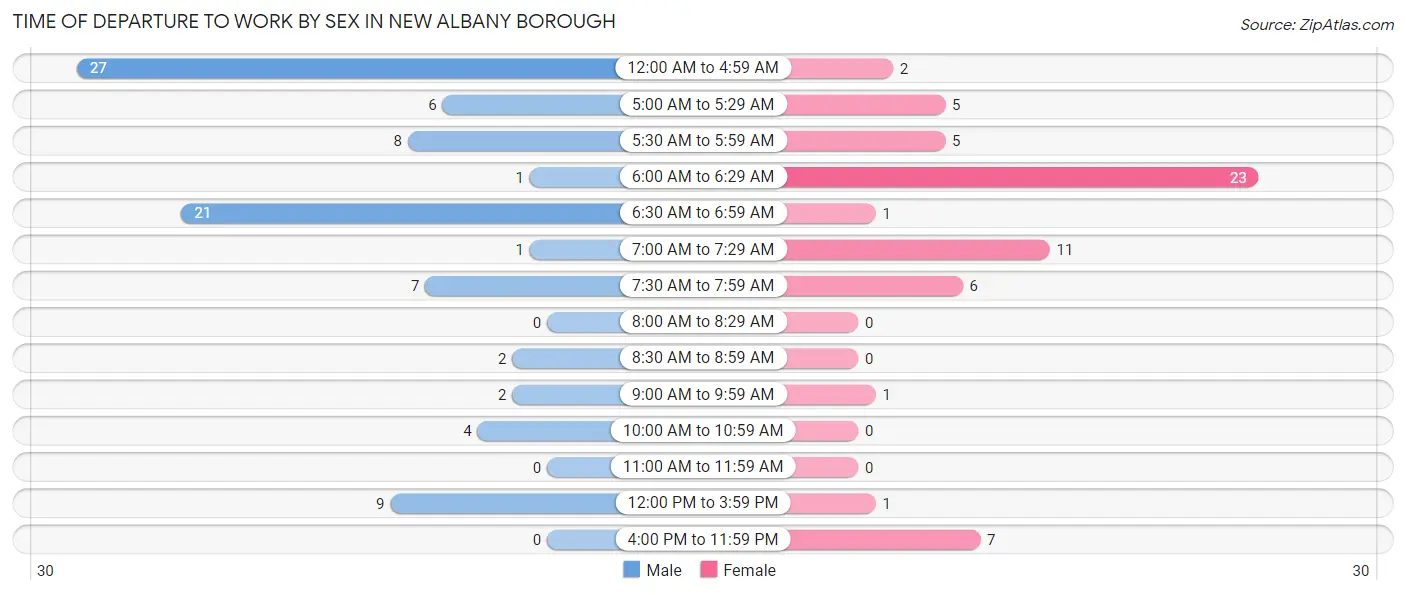
| Time of Departure | Male | Female |
| 12:00 AM to 4:59 AM | 27 (30.7%) | 2 (3.2%) |
| 5:00 AM to 5:29 AM | 6 (6.8%) | 5 (8.1%) |
| 5:30 AM to 5:59 AM | 8 (9.1%) | 5 (8.1%) |
| 6:00 AM to 6:29 AM | 1 (1.1%) | 23 (37.1%) |
| 6:30 AM to 6:59 AM | 21 (23.9%) | 1 (1.6%) |
| 7:00 AM to 7:29 AM | 1 (1.1%) | 11 (17.7%) |
| 7:30 AM to 7:59 AM | 7 (8.0%) | 6 (9.7%) |
| 8:00 AM to 8:29 AM | 0 (0.0%) | 0 (0.0%) |
| 8:30 AM to 8:59 AM | 2 (2.3%) | 0 (0.0%) |
| 9:00 AM to 9:59 AM | 2 (2.3%) | 1 (1.6%) |
| 10:00 AM to 10:59 AM | 4 (4.5%) | 0 (0.0%) |
| 11:00 AM to 11:59 AM | 0 (0.0%) | 0 (0.0%) |
| 12:00 PM to 3:59 PM | 9 (10.2%) | 1 (1.6%) |
| 4:00 PM to 11:59 PM | 0 (0.0%) | 7 (11.3%) |
| Total | 88 (100.0%) | 62 (100.0%) |
Housing Occupancy in New Albany borough
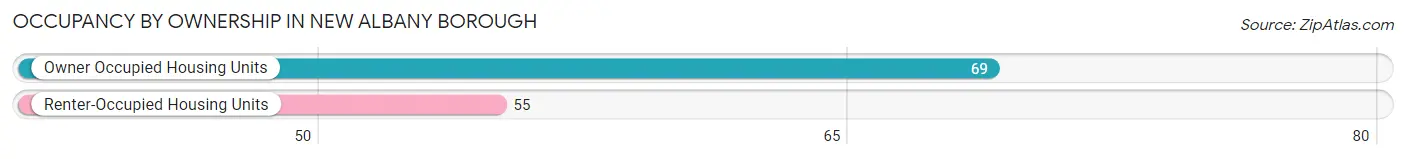
Occupancy by Ownership in New Albany borough
Of the total 124 dwellings in New Albany borough, owner-occupied units account for 69 (55.6%), while renter-occupied units make up 55 (44.4%).
| Occupancy | # Housing Units | % Housing Units |
| Owner Occupied Housing Units | 69 | 55.6% |
| Renter-Occupied Housing Units | 55 | 44.4% |
| Total Occupied Housing Units | 124 | 100.0% |
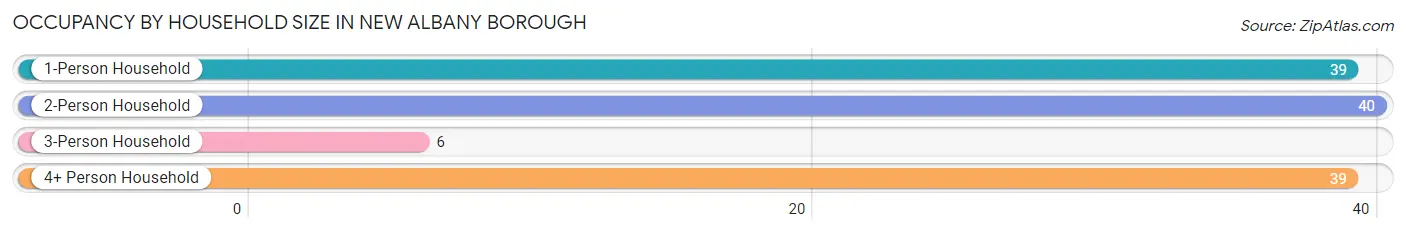
Occupancy by Household Size in New Albany borough
| Household Size | # Housing Units | % Housing Units |
| 1-Person Household | 39 | 31.5% |
| 2-Person Household | 40 | 32.3% |
| 3-Person Household | 6 | 4.8% |
| 4+ Person Household | 39 | 31.5% |
| Total Housing Units | 124 | 100.0% |
Occupancy by Ownership by Household Size in New Albany borough
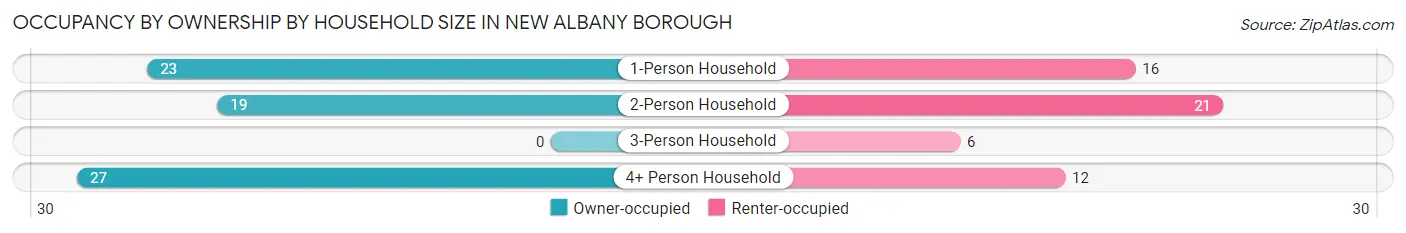
| Household Size | Owner-occupied | Renter-occupied |
| 1-Person Household | 23 (59.0%) | 16 (41.0%) |
| 2-Person Household | 19 (47.5%) | 21 (52.5%) |
| 3-Person Household | 0 (0.0%) | 6 (100.0%) |
| 4+ Person Household | 27 (69.2%) | 12 (30.8%) |
| Total Housing Units | 69 (55.6%) | 55 (44.4%) |
Occupancy by Educational Attainment in New Albany borough
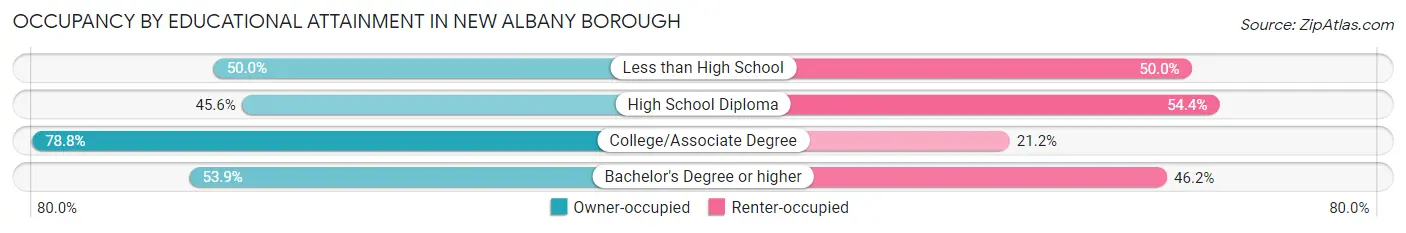
| Household Size | Owner-occupied | Renter-occupied |
| Less than High School | 5 (50.0%) | 5 (50.0%) |
| High School Diploma | 31 (45.6%) | 37 (54.4%) |
| College/Associate Degree | 26 (78.8%) | 7 (21.2%) |
| Bachelor's Degree or higher | 7 (53.8%) | 6 (46.2%) |
Occupancy by Age of Householder in New Albany borough
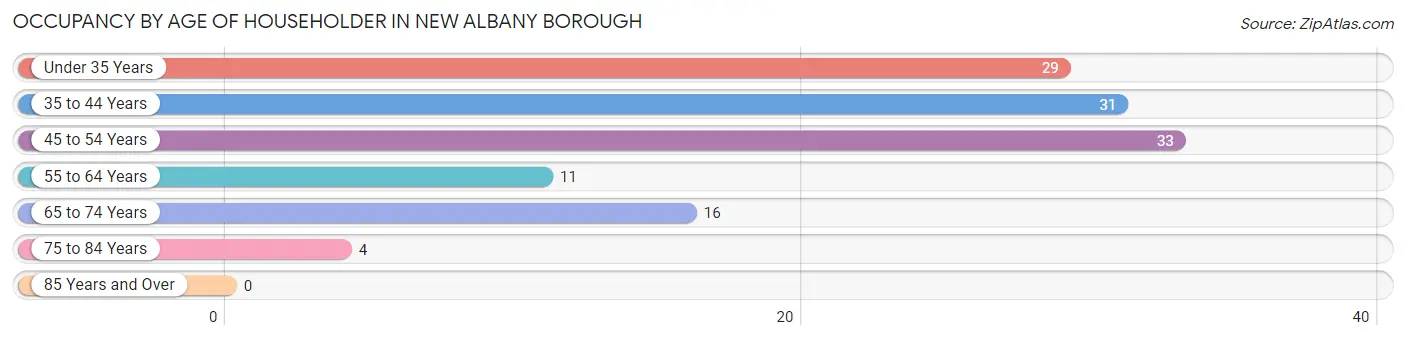
| Age Bracket | # Households | % Households |
| Under 35 Years | 29 | 23.4% |
| 35 to 44 Years | 31 | 25.0% |
| 45 to 54 Years | 33 | 26.6% |
| 55 to 64 Years | 11 | 8.9% |
| 65 to 74 Years | 16 | 12.9% |
| 75 to 84 Years | 4 | 3.2% |
| 85 Years and Over | 0 | 0.0% |
| Total | 124 | 100.0% |
Housing Finances in New Albany borough
Median Income by Occupancy in New Albany borough
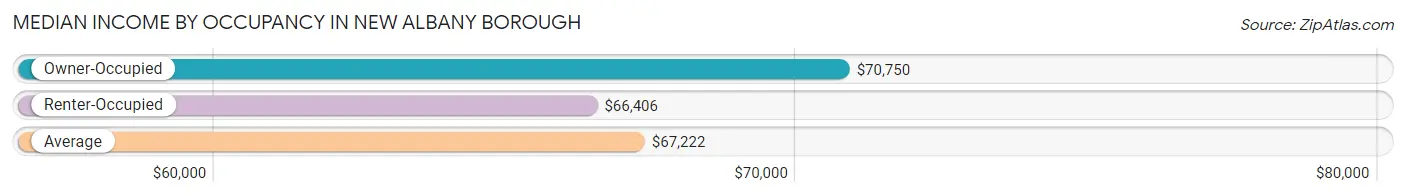
| Occupancy Type | # Households | Median Income |
| Owner-Occupied | 69 (55.6%) | $70,750 |
| Renter-Occupied | 55 (44.4%) | $66,406 |
| Average | 124 (100.0%) | $67,222 |
Occupancy by Householder Income Bracket in New Albany borough
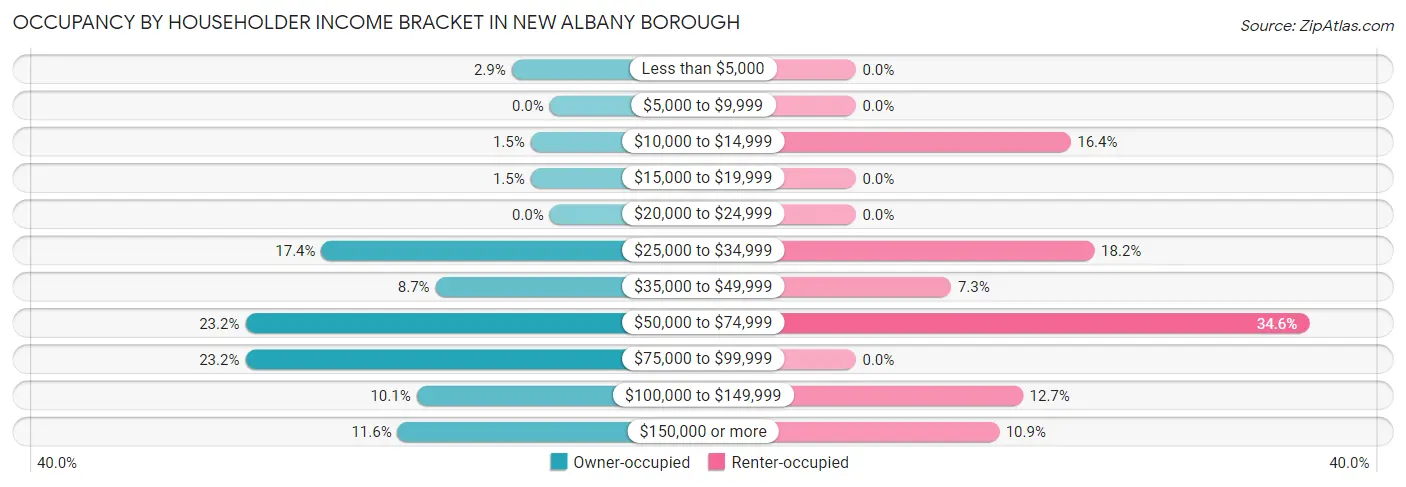
| Income Bracket | Owner-occupied | Renter-occupied |
| Less than $5,000 | 2 (2.9%) | 0 (0.0%) |
| $5,000 to $9,999 | 0 (0.0%) | 0 (0.0%) |
| $10,000 to $14,999 | 1 (1.5%) | 9 (16.4%) |
| $15,000 to $19,999 | 1 (1.5%) | 0 (0.0%) |
| $20,000 to $24,999 | 0 (0.0%) | 0 (0.0%) |
| $25,000 to $34,999 | 12 (17.4%) | 10 (18.2%) |
| $35,000 to $49,999 | 6 (8.7%) | 4 (7.3%) |
| $50,000 to $74,999 | 16 (23.2%) | 19 (34.5%) |
| $75,000 to $99,999 | 16 (23.2%) | 0 (0.0%) |
| $100,000 to $149,999 | 7 (10.1%) | 7 (12.7%) |
| $150,000 or more | 8 (11.6%) | 6 (10.9%) |
| Total | 69 (100.0%) | 55 (100.0%) |
Monthly Housing Cost Tiers in New Albany borough
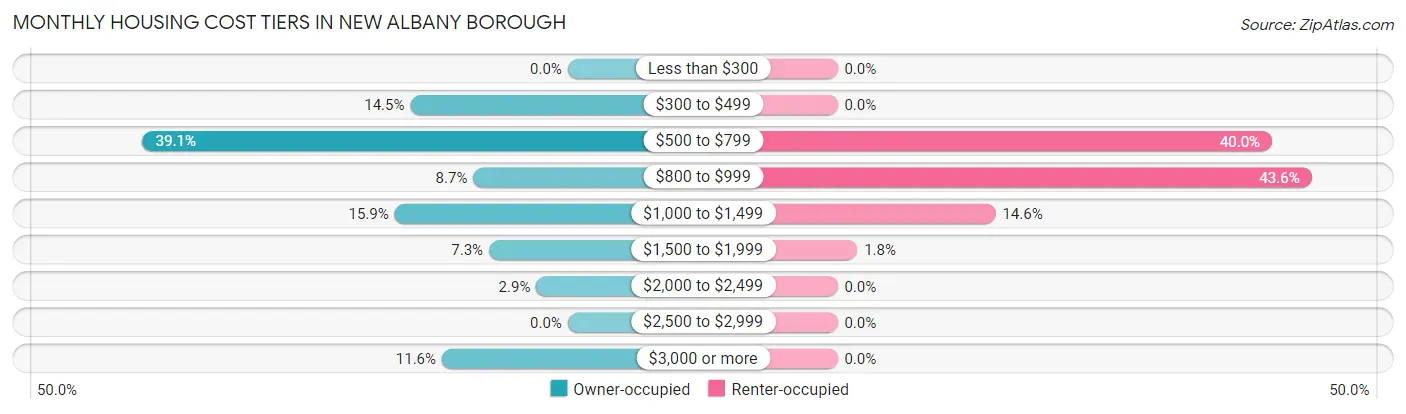
| Monthly Cost | Owner-occupied | Renter-occupied |
| Less than $300 | 0 (0.0%) | 0 (0.0%) |
| $300 to $499 | 10 (14.5%) | 0 (0.0%) |
| $500 to $799 | 27 (39.1%) | 22 (40.0%) |
| $800 to $999 | 6 (8.7%) | 24 (43.6%) |
| $1,000 to $1,499 | 11 (15.9%) | 8 (14.5%) |
| $1,500 to $1,999 | 5 (7.2%) | 1 (1.8%) |
| $2,000 to $2,499 | 2 (2.9%) | 0 (0.0%) |
| $2,500 to $2,999 | 0 (0.0%) | 0 (0.0%) |
| $3,000 or more | 8 (11.6%) | 0 (0.0%) |
| Total | 69 (100.0%) | 55 (100.0%) |
Physical Housing Characteristics in New Albany borough
Housing Structures in New Albany borough
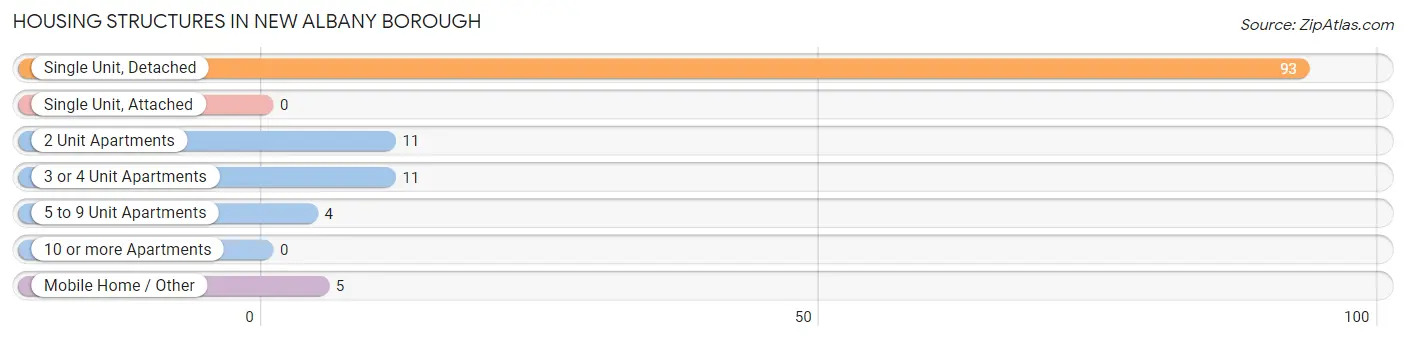
| Structure Type | # Housing Units | % Housing Units |
| Single Unit, Detached | 93 | 75.0% |
| Single Unit, Attached | 0 | 0.0% |
| 2 Unit Apartments | 11 | 8.9% |
| 3 or 4 Unit Apartments | 11 | 8.9% |
| 5 to 9 Unit Apartments | 4 | 3.2% |
| 10 or more Apartments | 0 | 0.0% |
| Mobile Home / Other | 5 | 4.0% |
| Total | 124 | 100.0% |
Housing Structures by Occupancy in New Albany borough
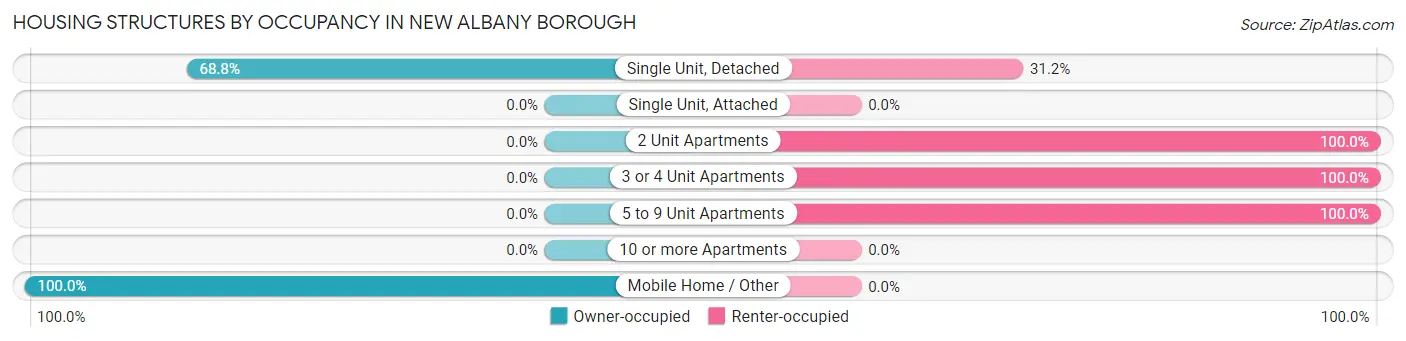
| Structure Type | Owner-occupied | Renter-occupied |
| Single Unit, Detached | 64 (68.8%) | 29 (31.2%) |
| Single Unit, Attached | 0 (0.0%) | 0 (0.0%) |
| 2 Unit Apartments | 0 (0.0%) | 11 (100.0%) |
| 3 or 4 Unit Apartments | 0 (0.0%) | 11 (100.0%) |
| 5 to 9 Unit Apartments | 0 (0.0%) | 4 (100.0%) |
| 10 or more Apartments | 0 (0.0%) | 0 (0.0%) |
| Mobile Home / Other | 5 (100.0%) | 0 (0.0%) |
| Total | 69 (55.6%) | 55 (44.4%) |
Housing Structures by Number of Rooms in New Albany borough
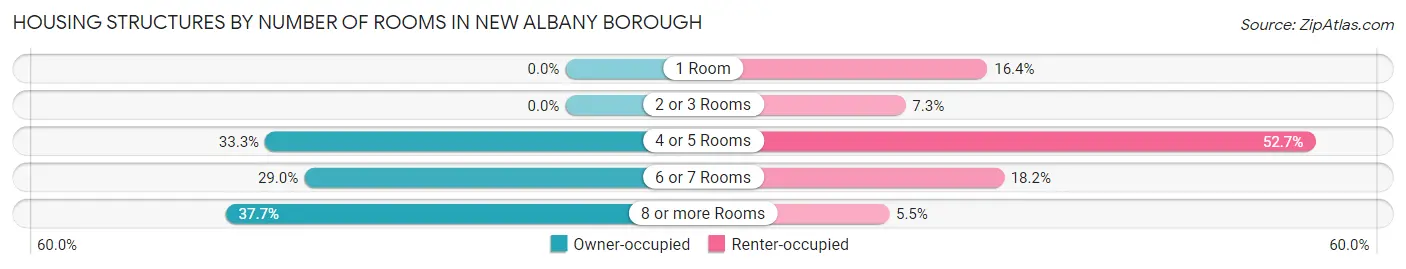
| Number of Rooms | Owner-occupied | Renter-occupied |
| 1 Room | 0 (0.0%) | 9 (16.4%) |
| 2 or 3 Rooms | 0 (0.0%) | 4 (7.3%) |
| 4 or 5 Rooms | 23 (33.3%) | 29 (52.7%) |
| 6 or 7 Rooms | 20 (29.0%) | 10 (18.2%) |
| 8 or more Rooms | 26 (37.7%) | 3 (5.4%) |
| Total | 69 (100.0%) | 55 (100.0%) |
Housing Structure by Heating Type in New Albany borough
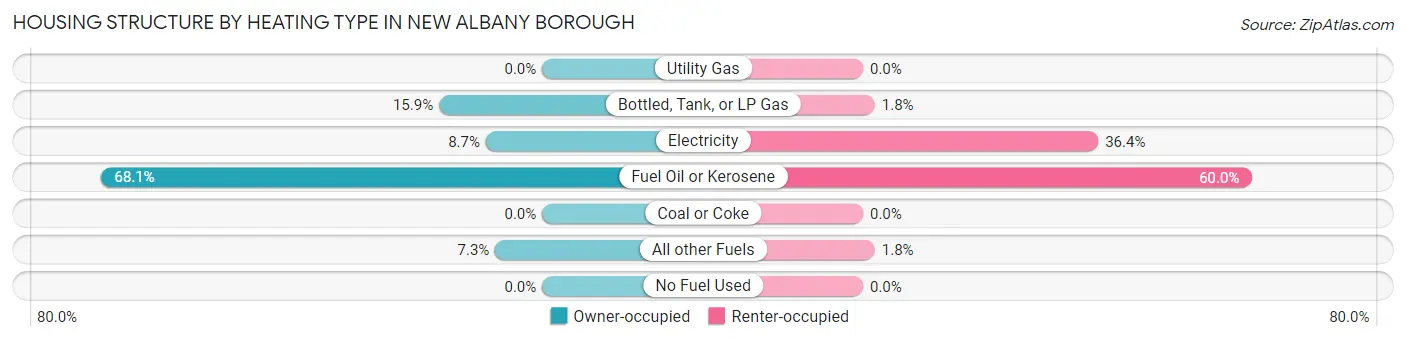
| Heating Type | Owner-occupied | Renter-occupied |
| Utility Gas | 0 (0.0%) | 0 (0.0%) |
| Bottled, Tank, or LP Gas | 11 (15.9%) | 1 (1.8%) |
| Electricity | 6 (8.7%) | 20 (36.4%) |
| Fuel Oil or Kerosene | 47 (68.1%) | 33 (60.0%) |
| Coal or Coke | 0 (0.0%) | 0 (0.0%) |
| All other Fuels | 5 (7.2%) | 1 (1.8%) |
| No Fuel Used | 0 (0.0%) | 0 (0.0%) |
| Total | 69 (100.0%) | 55 (100.0%) |
Household Vehicle Usage in New Albany borough
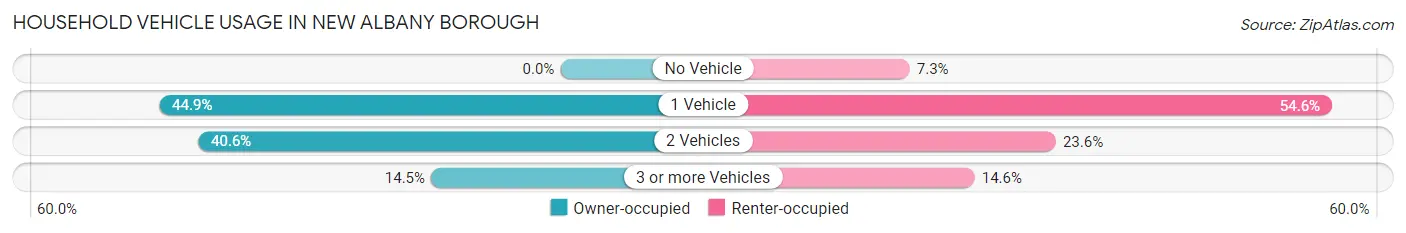
| Vehicles per Household | Owner-occupied | Renter-occupied |
| No Vehicle | 0 (0.0%) | 4 (7.3%) |
| 1 Vehicle | 31 (44.9%) | 30 (54.5%) |
| 2 Vehicles | 28 (40.6%) | 13 (23.6%) |
| 3 or more Vehicles | 10 (14.5%) | 8 (14.5%) |
| Total | 69 (100.0%) | 55 (100.0%) |
Real Estate & Mortgages in New Albany borough
Real Estate and Mortgage Overview in New Albany borough
| Characteristic | Without Mortgage | With Mortgage |
| Housing Units | 36 | 33 |
| Median Property Value | $112,500 | $179,200 |
| Median Household Income | $52,000 | $8 |
| Monthly Housing Costs | $617 | $8 |
| Real Estate Taxes | $1,500 | $0 |
Property Value by Mortgage Status in New Albany borough
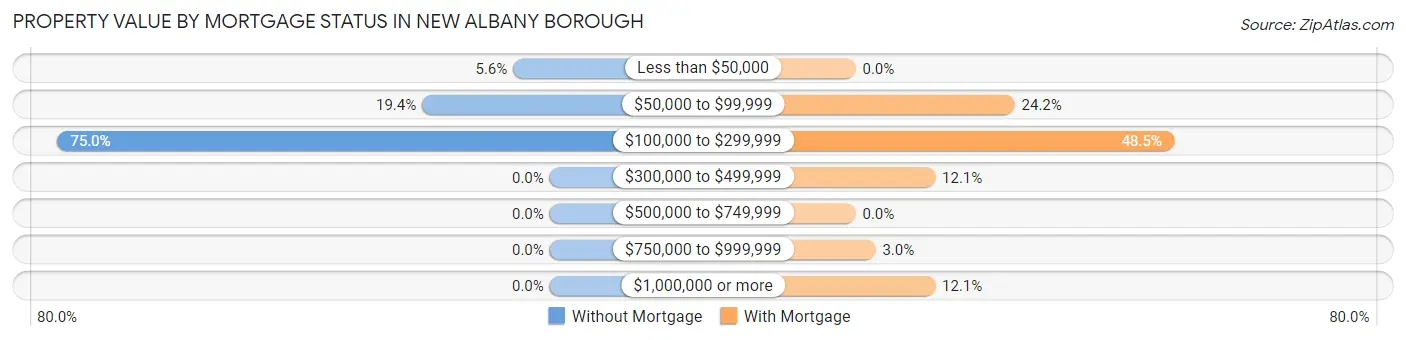
| Property Value | Without Mortgage | With Mortgage |
| Less than $50,000 | 2 (5.6%) | 0 (0.0%) |
| $50,000 to $99,999 | 7 (19.4%) | 8 (24.2%) |
| $100,000 to $299,999 | 27 (75.0%) | 16 (48.5%) |
| $300,000 to $499,999 | 0 (0.0%) | 4 (12.1%) |
| $500,000 to $749,999 | 0 (0.0%) | 0 (0.0%) |
| $750,000 to $999,999 | 0 (0.0%) | 1 (3.0%) |
| $1,000,000 or more | 0 (0.0%) | 4 (12.1%) |
| Total | 36 (100.0%) | 33 (100.0%) |
Household Income by Mortgage Status in New Albany borough
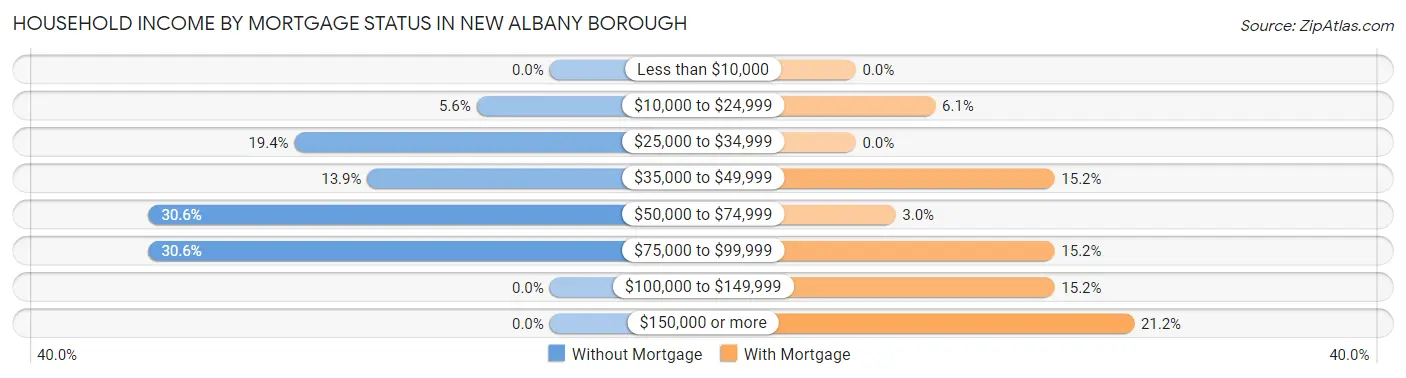
| Household Income | Without Mortgage | With Mortgage |
| Less than $10,000 | 0 (0.0%) | 0 (0.0%) |
| $10,000 to $24,999 | 2 (5.6%) | 2 (6.1%) |
| $25,000 to $34,999 | 7 (19.4%) | 0 (0.0%) |
| $35,000 to $49,999 | 5 (13.9%) | 5 (15.1%) |
| $50,000 to $74,999 | 11 (30.6%) | 1 (3.0%) |
| $75,000 to $99,999 | 11 (30.6%) | 5 (15.1%) |
| $100,000 to $149,999 | 0 (0.0%) | 5 (15.1%) |
| $150,000 or more | 0 (0.0%) | 7 (21.2%) |
| Total | 36 (100.0%) | 33 (100.0%) |
Property Value to Household Income Ratio in New Albany borough
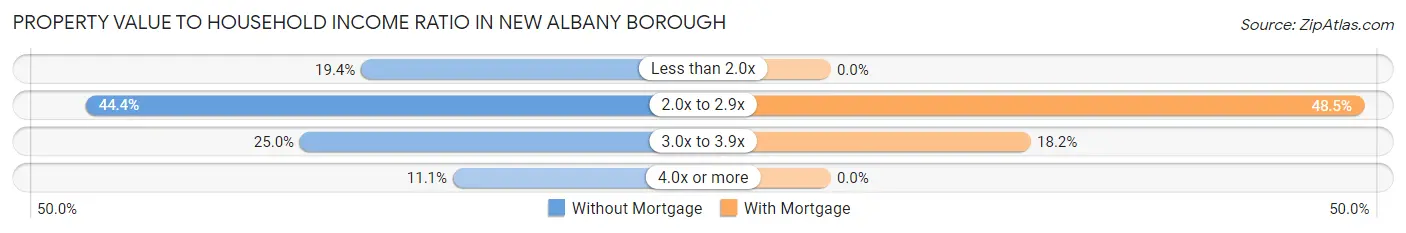
| Value-to-Income Ratio | Without Mortgage | With Mortgage |
| Less than 2.0x | 7 (19.4%) | 0 (0.0%) |
| 2.0x to 2.9x | 16 (44.4%) | 16 (48.5%) |
| 3.0x to 3.9x | 9 (25.0%) | 6 (18.2%) |
| 4.0x or more | 4 (11.1%) | 0 (0.0%) |
| Total | 36 (100.0%) | 33 (100.0%) |
Real Estate Taxes by Mortgage Status in New Albany borough
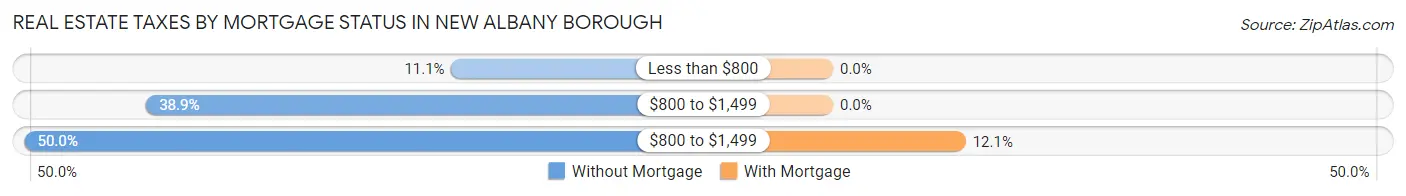
| Property Taxes | Without Mortgage | With Mortgage |
| Less than $800 | 4 (11.1%) | 0 (0.0%) |
| $800 to $1,499 | 14 (38.9%) | 0 (0.0%) |
| $800 to $1,499 | 18 (50.0%) | 4 (12.1%) |
| Total | 36 (100.0%) | 33 (100.0%) |
Health & Disability in New Albany borough
Health Insurance Coverage by Age in New Albany borough
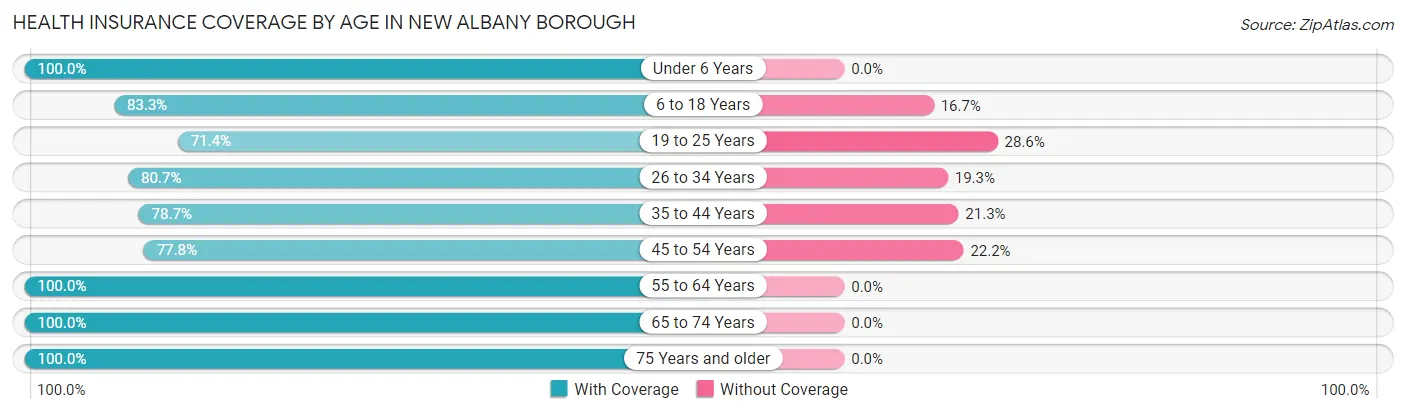
| Age Bracket | With Coverage | Without Coverage |
| Under 6 Years | 18 (100.0%) | 0 (0.0%) |
| 6 to 18 Years | 70 (83.3%) | 14 (16.7%) |
| 19 to 25 Years | 20 (71.4%) | 8 (28.6%) |
| 26 to 34 Years | 46 (80.7%) | 11 (19.3%) |
| 35 to 44 Years | 37 (78.7%) | 10 (21.3%) |
| 45 to 54 Years | 42 (77.8%) | 12 (22.2%) |
| 55 to 64 Years | 20 (100.0%) | 0 (0.0%) |
| 65 to 74 Years | 25 (100.0%) | 0 (0.0%) |
| 75 Years and older | 4 (100.0%) | 0 (0.0%) |
| Total | 282 (83.7%) | 55 (16.3%) |
Health Insurance Coverage by Citizenship Status in New Albany borough
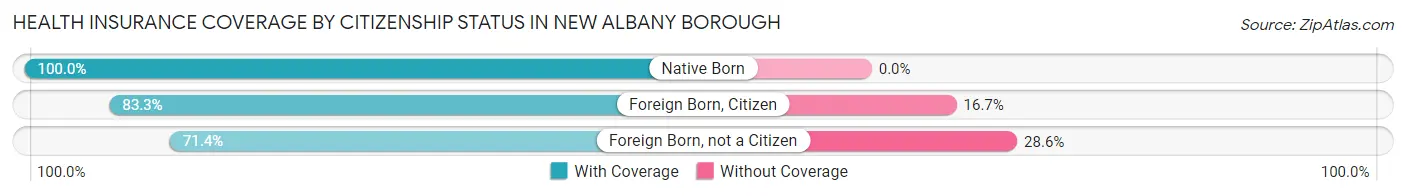
| Citizenship Status | With Coverage | Without Coverage |
| Native Born | 18 (100.0%) | 0 (0.0%) |
| Foreign Born, Citizen | 70 (83.3%) | 14 (16.7%) |
| Foreign Born, not a Citizen | 20 (71.4%) | 8 (28.6%) |
Health Insurance Coverage by Household Income in New Albany borough
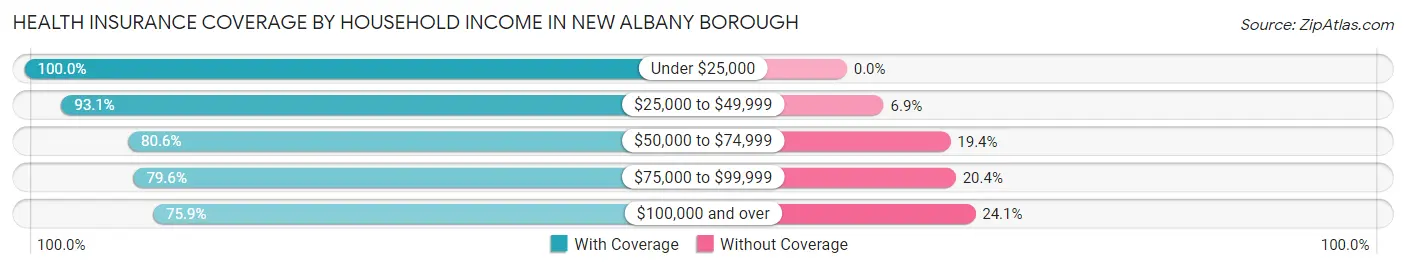
| Household Income | With Coverage | Without Coverage |
| Under $25,000 | 26 (100.0%) | 0 (0.0%) |
| $25,000 to $49,999 | 81 (93.1%) | 6 (6.9%) |
| $50,000 to $74,999 | 54 (80.6%) | 13 (19.4%) |
| $75,000 to $99,999 | 39 (79.6%) | 10 (20.4%) |
| $100,000 and over | 82 (75.9%) | 26 (24.1%) |
Public vs Private Health Insurance Coverage by Age in New Albany borough
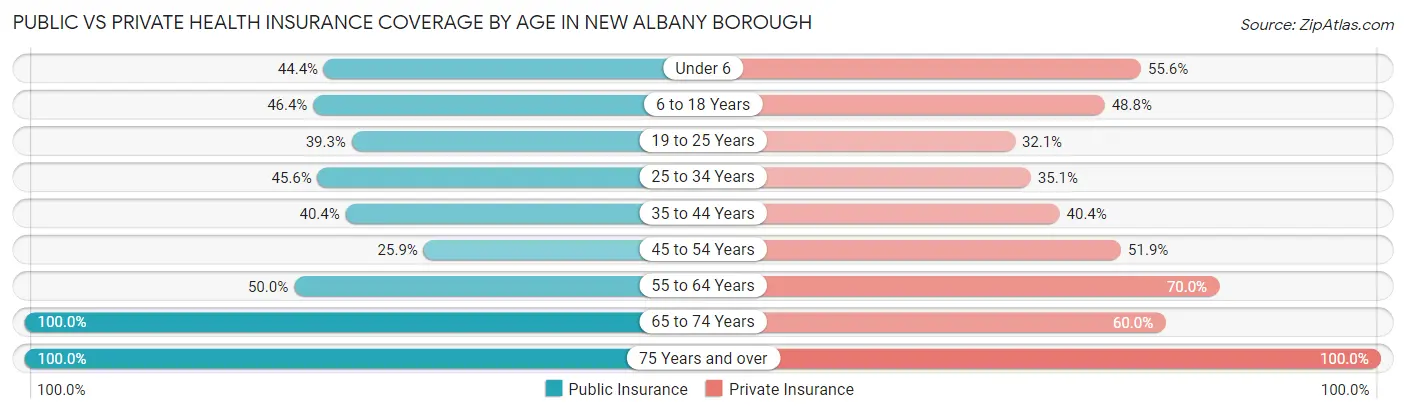
| Age Bracket | Public Insurance | Private Insurance |
| Under 6 | 8 (44.4%) | 10 (55.6%) |
| 6 to 18 Years | 39 (46.4%) | 41 (48.8%) |
| 19 to 25 Years | 11 (39.3%) | 9 (32.1%) |
| 25 to 34 Years | 26 (45.6%) | 20 (35.1%) |
| 35 to 44 Years | 19 (40.4%) | 19 (40.4%) |
| 45 to 54 Years | 14 (25.9%) | 28 (51.8%) |
| 55 to 64 Years | 10 (50.0%) | 14 (70.0%) |
| 65 to 74 Years | 25 (100.0%) | 15 (60.0%) |
| 75 Years and over | 4 (100.0%) | 4 (100.0%) |
| Total | 156 (46.3%) | 160 (47.5%) |
Disability Status by Sex by Age in New Albany borough
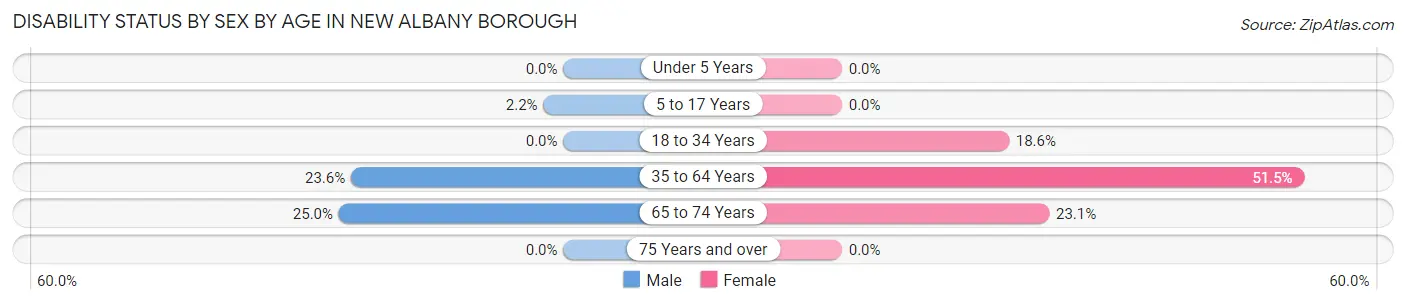
| Age Bracket | Male | Female |
| Under 5 Years | 0 (0.0%) | 0 (0.0%) |
| 5 to 17 Years | 1 (2.2%) | 0 (0.0%) |
| 18 to 34 Years | 0 (0.0%) | 8 (18.6%) |
| 35 to 64 Years | 13 (23.6%) | 34 (51.5%) |
| 65 to 74 Years | 3 (25.0%) | 3 (23.1%) |
| 75 Years and over | 0 (0.0%) | 0 (0.0%) |
Disability Class by Sex by Age in New Albany borough
Disability Class: Hearing Difficulty
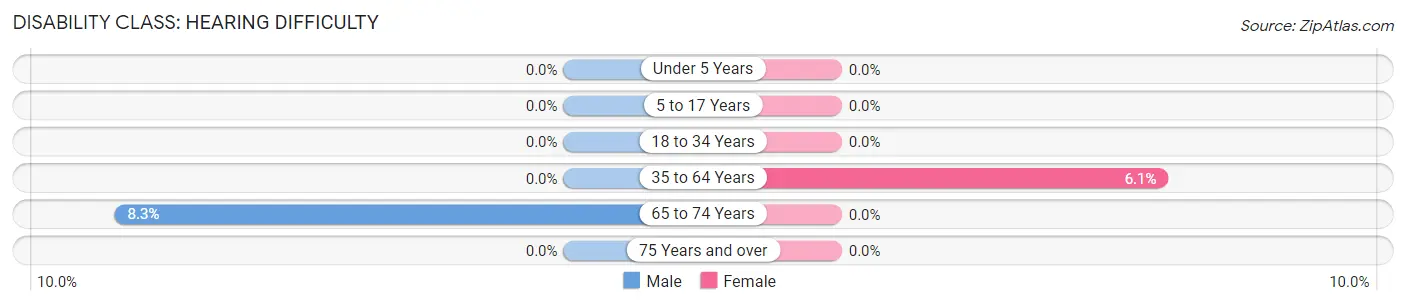
| Age Bracket | Male | Female |
| Under 5 Years | 0 (0.0%) | 0 (0.0%) |
| 5 to 17 Years | 0 (0.0%) | 0 (0.0%) |
| 18 to 34 Years | 0 (0.0%) | 0 (0.0%) |
| 35 to 64 Years | 0 (0.0%) | 4 (6.1%) |
| 65 to 74 Years | 1 (8.3%) | 0 (0.0%) |
| 75 Years and over | 0 (0.0%) | 0 (0.0%) |
Disability Class: Vision Difficulty
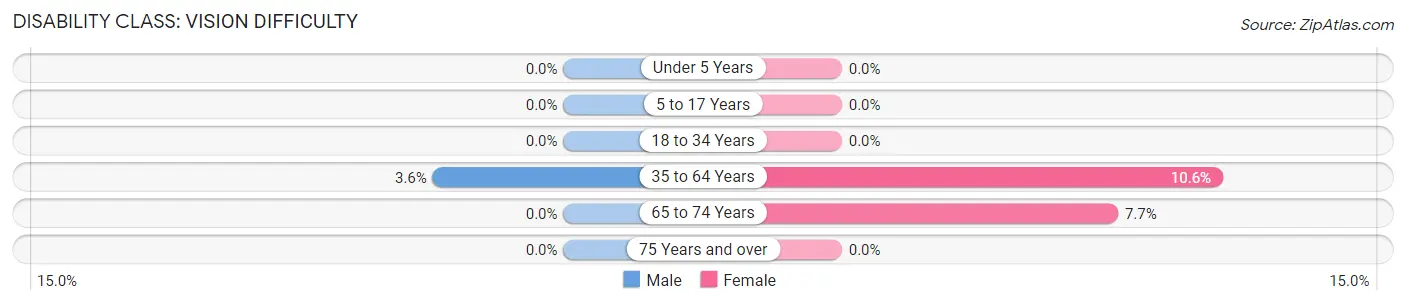
| Age Bracket | Male | Female |
| Under 5 Years | 0 (0.0%) | 0 (0.0%) |
| 5 to 17 Years | 0 (0.0%) | 0 (0.0%) |
| 18 to 34 Years | 0 (0.0%) | 0 (0.0%) |
| 35 to 64 Years | 2 (3.6%) | 7 (10.6%) |
| 65 to 74 Years | 0 (0.0%) | 1 (7.7%) |
| 75 Years and over | 0 (0.0%) | 0 (0.0%) |
Disability Class: Cognitive Difficulty
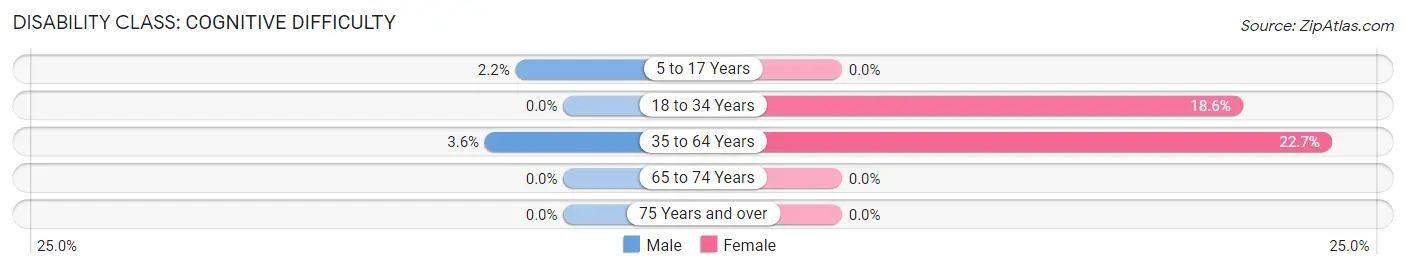
| Age Bracket | Male | Female |
| 5 to 17 Years | 1 (2.2%) | 0 (0.0%) |
| 18 to 34 Years | 0 (0.0%) | 8 (18.6%) |
| 35 to 64 Years | 2 (3.6%) | 15 (22.7%) |
| 65 to 74 Years | 0 (0.0%) | 0 (0.0%) |
| 75 Years and over | 0 (0.0%) | 0 (0.0%) |
Disability Class: Ambulatory Difficulty
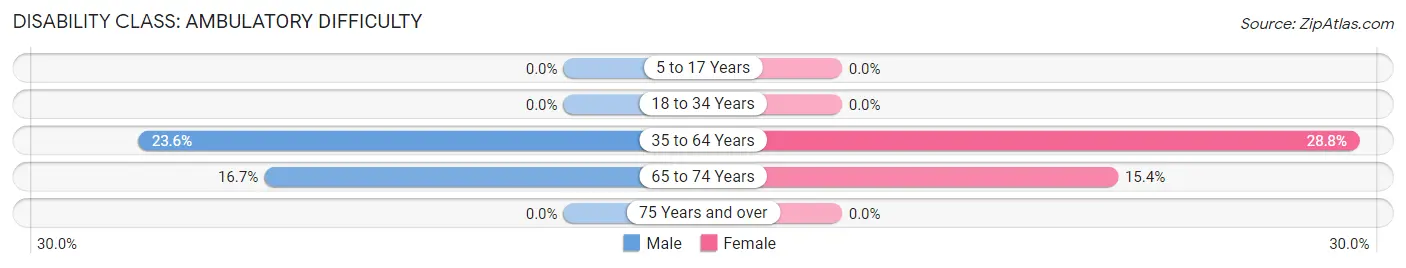
| Age Bracket | Male | Female |
| 5 to 17 Years | 0 (0.0%) | 0 (0.0%) |
| 18 to 34 Years | 0 (0.0%) | 0 (0.0%) |
| 35 to 64 Years | 13 (23.6%) | 19 (28.8%) |
| 65 to 74 Years | 2 (16.7%) | 2 (15.4%) |
| 75 Years and over | 0 (0.0%) | 0 (0.0%) |
Disability Class: Self-Care Difficulty
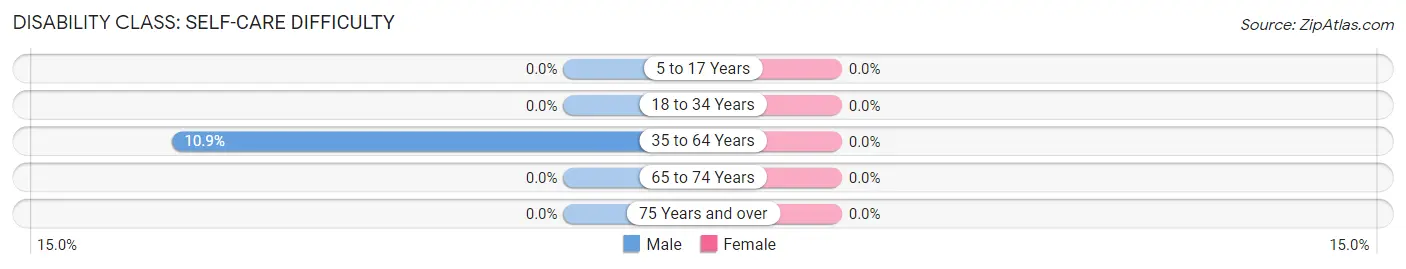
| Age Bracket | Male | Female |
| 5 to 17 Years | 0 (0.0%) | 0 (0.0%) |
| 18 to 34 Years | 0 (0.0%) | 0 (0.0%) |
| 35 to 64 Years | 6 (10.9%) | 0 (0.0%) |
| 65 to 74 Years | 0 (0.0%) | 0 (0.0%) |
| 75 Years and over | 0 (0.0%) | 0 (0.0%) |
Technology Access in New Albany borough
Computing Device Access in New Albany borough
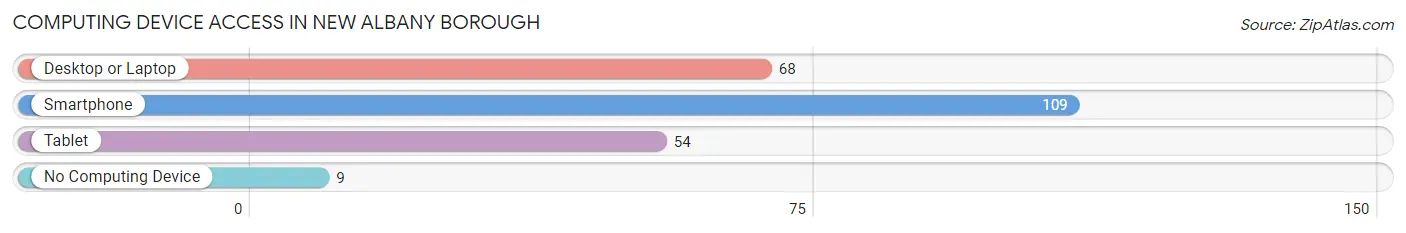
| Device Type | # Households | % Households |
| Desktop or Laptop | 68 | 54.8% |
| Smartphone | 109 | 87.9% |
| Tablet | 54 | 43.5% |
| No Computing Device | 9 | 7.3% |
| Total | 124 | 100.0% |
Internet Access in New Albany borough
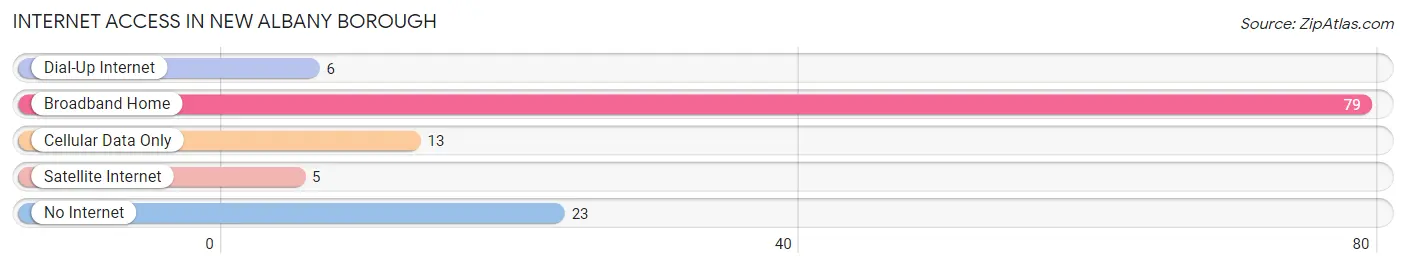
| Internet Type | # Households | % Households |
| Dial-Up Internet | 6 | 4.8% |
| Broadband Home | 79 | 63.7% |
| Cellular Data Only | 13 | 10.5% |
| Satellite Internet | 5 | 4.0% |
| No Internet | 23 | 18.5% |
| Total | 124 | 100.0% |
New Albany borough Summary
New Albany Borough is a small borough located in the state of Pennsylvania. It is situated in the northern part of the state, in the county of Northumberland. The borough is located in the Susquehanna Valley, and is bordered by the Susquehanna River to the east and the West Branch Susquehanna River to the west. The population of the borough was 1,845 at the 2010 census.
History
The area that is now New Albany Borough was first settled in the late 1700s by a group of German immigrants. The town was originally known as “New Berlin”, and was later renamed “New Albany” in 1817. The town was officially incorporated as a borough in 1851.
The town was an important stop on the Susquehanna and Tidewater Canal, which was built in the early 1800s. The canal was used to transport coal and other goods from the coal mines in the area to the markets in Philadelphia and Baltimore. The canal was eventually replaced by the Pennsylvania Railroad in the late 1800s.
The town was also an important stop on the Underground Railroad, which was used to help slaves escape to freedom in the northern states. The town was home to several prominent abolitionists, including William Still, who wrote the book “The Underground Railroad”.
Geography
New Albany Borough is located at 40°45'N, 76°37'W (40.75, -76.62). It is situated in the northern part of the state, in the county of Northumberland. The borough is located in the Susquehanna Valley, and is bordered by the Susquehanna River to the east and the West Branch Susquehanna River to the west.
The borough has a total area of 0.7 square miles, all of which is land. The borough is located in the humid continental climate zone, with cold winters and hot, humid summers. The average annual temperature is 48°F, and the average annual precipitation is 40 inches.
Economy
The economy of New Albany Borough is largely based on agriculture and tourism. The town is home to several small farms, which produce a variety of crops, including corn, soybeans, wheat, and hay. The town is also home to several small businesses, including restaurants, shops, and a bed and breakfast.
The town is also a popular tourist destination, due to its proximity to the Susquehanna River and the Pennsylvania Grand Canyon. The town is home to several parks and recreational areas, including the New Albany Borough Park, which offers camping, fishing, and hiking.
Demographics
As of the 2010 census, the population of New Albany Borough was 1,845. The racial makeup of the borough was 97.3% White, 0.7% African American, 0.2% Native American, 0.2% Asian, 0.2% from other races, and 1.6% from two or more races. Hispanic or Latino of any race were 1.2% of the population.
The median household income in the borough was $41,250, and the median family income was $50,000. The per capita income was $20,945. About 11.2% of the population was below the poverty line.
Common Questions
What is Per Capita Income in New Albany borough?
Per Capita income in New Albany borough is $34,878.
What is the Median Family Income in New Albany borough?
Median Family Income in New Albany borough is $46,875.
What is the Median Household income in New Albany borough?
Median Household Income in New Albany borough is $67,222.
What is Income or Wage Gap in New Albany borough?
Income or Wage Gap in New Albany borough is 40.9%.
Women in New Albany borough earn 59.1 cents for every dollar earned by a man.
What is Inequality or Gini Index in New Albany borough?
Inequality or Gini Index in New Albany borough is 0.54.
What is the Total Population of New Albany borough?
Total Population of New Albany borough is 337.
What is the Total Male Population of New Albany borough?
Total Male Population of New Albany borough is 170.
What is the Total Female Population of New Albany borough?
Total Female Population of New Albany borough is 167.
What is the Ratio of Males per 100 Females in New Albany borough?
There are 101.80 Males per 100 Females in New Albany borough.
What is the Ratio of Females per 100 Males in New Albany borough?
There are 98.24 Females per 100 Males in New Albany borough.
What is the Median Population Age in New Albany borough?
Median Population Age in New Albany borough is 28.7 Years.
What is the Average Family Size in New Albany borough
Average Family Size in New Albany borough is 3.3 People.
What is the Average Household Size in New Albany borough
Average Household Size in New Albany borough is 2.7 People.
How Large is the Labor Force in New Albany borough?
There are 162 People in the Labor Forcein in New Albany borough.
What is the Percentage of People in the Labor Force in New Albany borough?
61.8% of People are in the Labor Force in New Albany borough.
What is the Unemployment Rate in New Albany borough?
Unemployment Rate in New Albany borough is 4.9%.