Gang Mills, NY Map & Demographics
Gang Mills Map
Gang Mills Overview
$47,589
PER CAPITA INCOME
$141,389
AVG FAMILY INCOME
$102,015
AVG HOUSEHOLD INCOME
19.2%
WAGE / INCOME GAP [ % ]
80.8¢/ $1
WAGE / INCOME GAP [ $ ]
0.43
INEQUALITY / GINI INDEX
4,562
TOTAL POPULATION
2,299
MALE POPULATION
2,263
FEMALE POPULATION
101.59
MALES / 100 FEMALES
98.43
FEMALES / 100 MALES
40.7
MEDIAN AGE
2.9
AVG FAMILY SIZE
2.4
AVG HOUSEHOLD SIZE
2,361
LABOR FORCE [ PEOPLE ]
64.4%
PERCENT IN LABOR FORCE
2.6%
UNEMPLOYMENT RATE
Income in Gang Mills
Income Overview in Gang Mills
Per Capita Income in Gang Mills is $47,589, while median incomes of families and households are $141,389 and $102,015 respectively.
| Characteristic | Number | Measure |
| Per Capita Income | 4,562 | $47,589 |
| Median Family Income | 1,336 | $141,389 |
| Mean Family Income | 1,336 | $139,569 |
| Median Household Income | 1,819 | $102,015 |
| Mean Household Income | 1,819 | $118,741 |
| Income Deficit | 1,336 | $0 |
| Wage / Income Gap (%) | 4,562 | 19.25% |
| Wage / Income Gap ($) | 4,562 | 80.75¢ per $1 |
| Gini / Inequality Index | 4,562 | 0.43 |
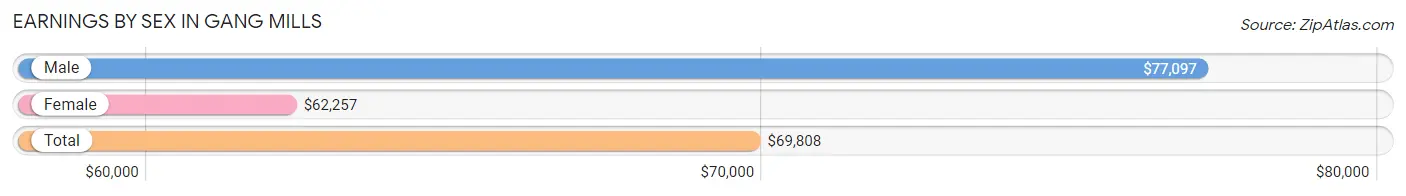
Earnings by Sex in Gang Mills
Average Earnings in Gang Mills are $69,808, $77,097 for men and $62,257 for women, a difference of 19.3%.
| Sex | Number | Average Earnings |
| Male | 1,281 (53.0%) | $77,097 |
| Female | 1,135 (47.0%) | $62,257 |
| Total | 2,416 (100.0%) | $69,808 |
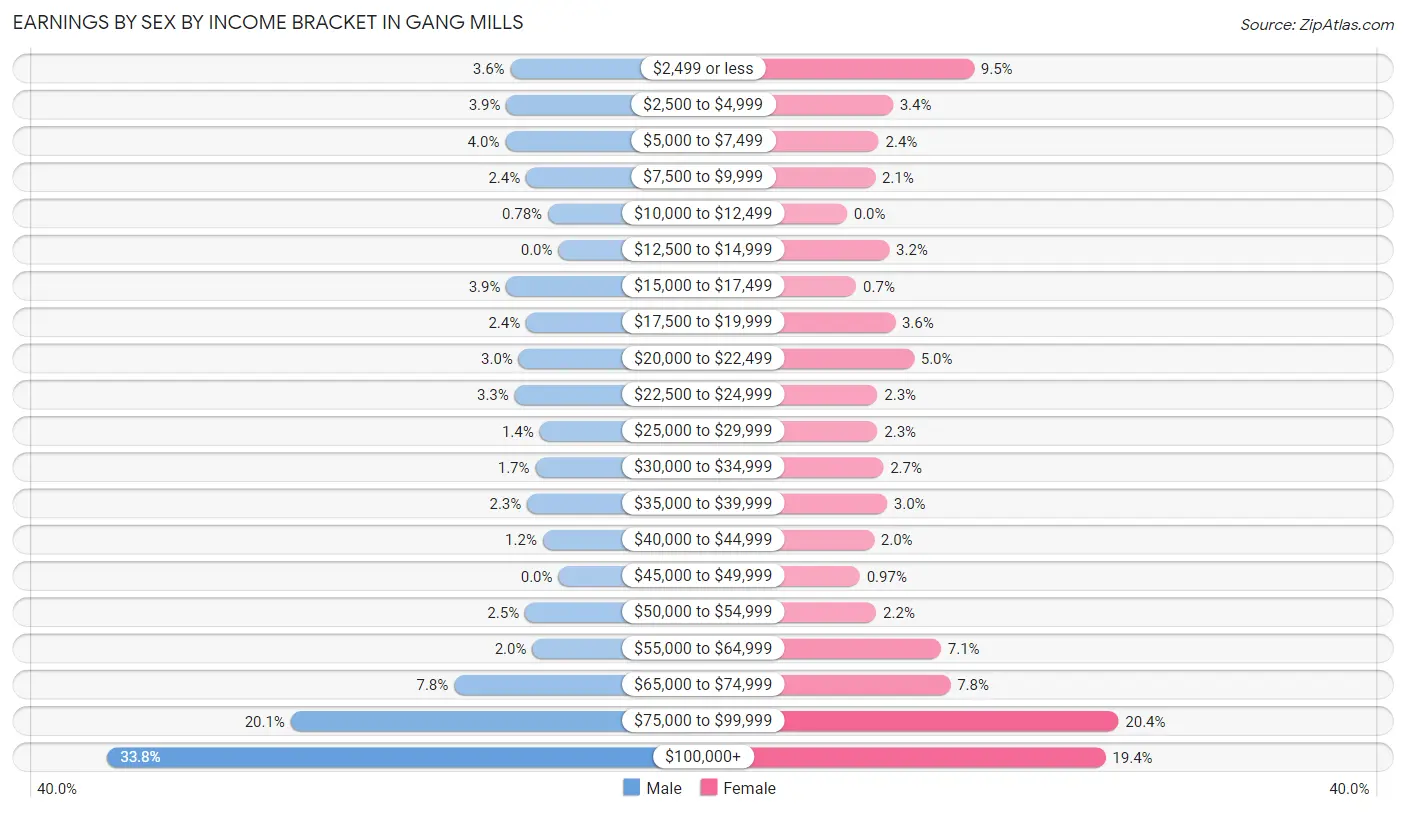
Earnings by Sex by Income Bracket in Gang Mills
The most common earnings brackets in Gang Mills are $100,000+ for men (433 | 33.8%) and $75,000 to $99,999 for women (231 | 20.3%).
| Income | Male | Female |
| $2,499 or less | 46 (3.6%) | 108 (9.5%) |
| $2,500 to $4,999 | 50 (3.9%) | 39 (3.4%) |
| $5,000 to $7,499 | 51 (4.0%) | 27 (2.4%) |
| $7,500 to $9,999 | 31 (2.4%) | 24 (2.1%) |
| $10,000 to $12,499 | 10 (0.8%) | 0 (0.0%) |
| $12,500 to $14,999 | 0 (0.0%) | 36 (3.2%) |
| $15,000 to $17,499 | 50 (3.9%) | 8 (0.7%) |
| $17,500 to $19,999 | 31 (2.4%) | 41 (3.6%) |
| $20,000 to $22,499 | 38 (3.0%) | 57 (5.0%) |
| $22,500 to $24,999 | 42 (3.3%) | 26 (2.3%) |
| $25,000 to $29,999 | 18 (1.4%) | 26 (2.3%) |
| $30,000 to $34,999 | 22 (1.7%) | 31 (2.7%) |
| $35,000 to $39,999 | 30 (2.3%) | 34 (3.0%) |
| $40,000 to $44,999 | 15 (1.2%) | 23 (2.0%) |
| $45,000 to $49,999 | 0 (0.0%) | 11 (1.0%) |
| $50,000 to $54,999 | 32 (2.5%) | 25 (2.2%) |
| $55,000 to $64,999 | 25 (1.9%) | 80 (7.0%) |
| $65,000 to $74,999 | 100 (7.8%) | 88 (7.7%) |
| $75,000 to $99,999 | 257 (20.1%) | 231 (20.3%) |
| $100,000+ | 433 (33.8%) | 220 (19.4%) |
| Total | 1,281 (100.0%) | 1,135 (100.0%) |
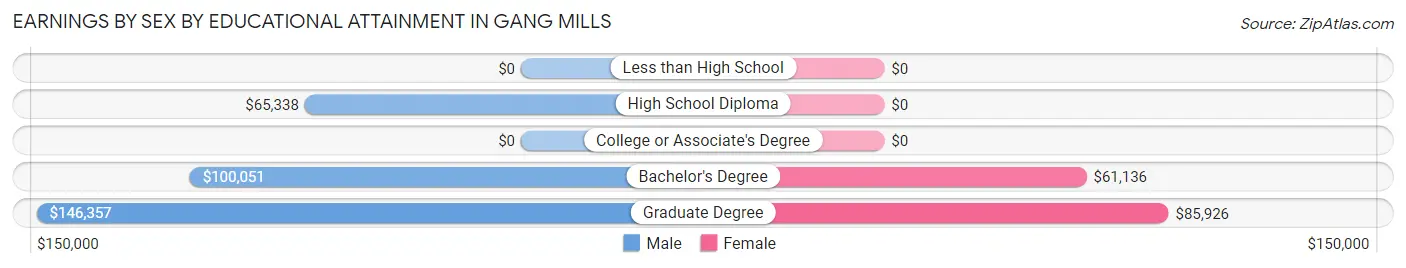
Earnings by Sex by Educational Attainment in Gang Mills
Average earnings in Gang Mills are $88,371 for men and $70,925 for women, a difference of 19.7%. Men with an educational attainment of graduate degree enjoy the highest average annual earnings of $146,357, while those with high school diploma education earn the least with $65,338. Women with an educational attainment of graduate degree earn the most with the average annual earnings of $85,926, while those with bachelor's degree education have the smallest earnings of $61,136.
| Educational Attainment | Male Income | Female Income |
| Less than High School | - | - |
| High School Diploma | $65,338 | $0 |
| College or Associate's Degree | - | - |
| Bachelor's Degree | $100,051 | $61,136 |
| Graduate Degree | $146,357 | $85,926 |
| Total | $88,371 | $70,925 |
Family Income in Gang Mills
Family Income Brackets in Gang Mills
According to the Gang Mills family income data, there are 432 families falling into the $150,000 to $199,999 income range, which is the most common income bracket and makes up 32.3% of all families.
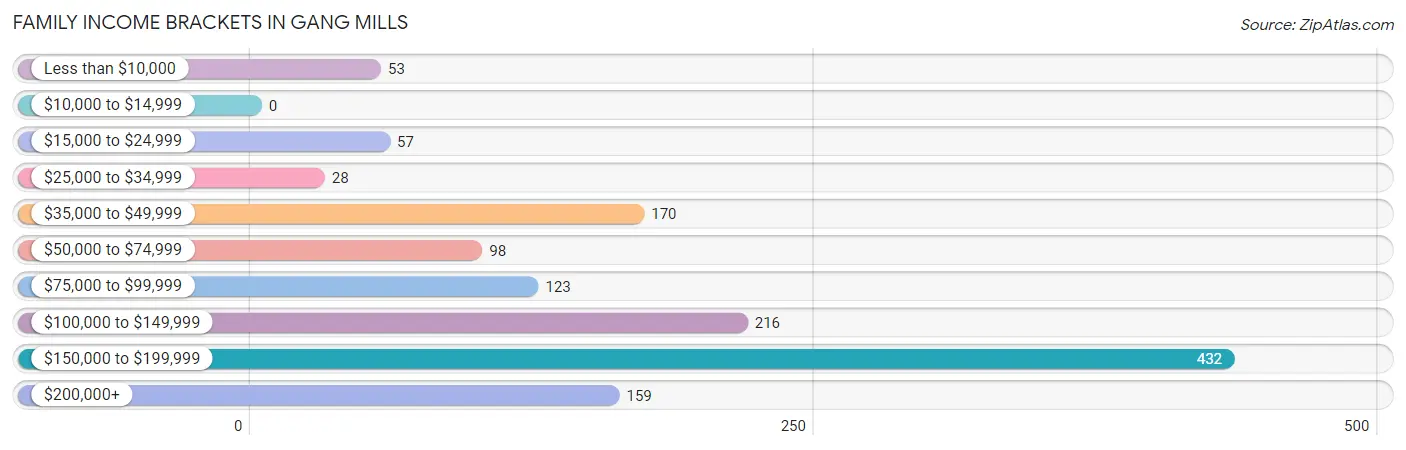
| Income Bracket | # Families | % Families |
| Less than $10,000 | 53 | 4.0% |
| $10,000 to $14,999 | 0 | 0.0% |
| $15,000 to $24,999 | 57 | 4.3% |
| $25,000 to $34,999 | 28 | 2.1% |
| $35,000 to $49,999 | 170 | 12.7% |
| $50,000 to $74,999 | 98 | 7.3% |
| $75,000 to $99,999 | 123 | 9.2% |
| $100,000 to $149,999 | 216 | 16.2% |
| $150,000 to $199,999 | 432 | 32.3% |
| $200,000+ | 159 | 11.9% |
Family Income by Famaliy Size in Gang Mills
5-person families (52 | 3.9%) account for the highest median family income in Gang Mills with $229,333 per family, while 3-person families (433 | 32.4%) have the highest median income of $46,490 per family member.
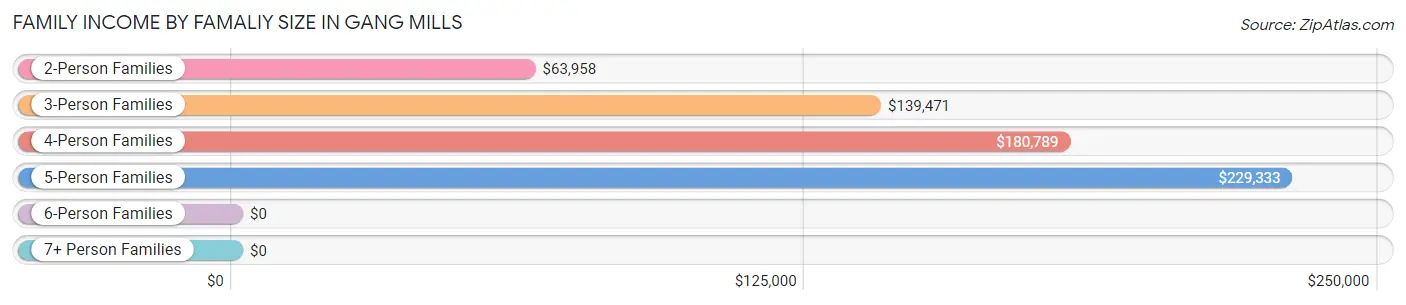
| Income Bracket | # Families | Median Income |
| 2-Person Families | 463 (34.7%) | $63,958 |
| 3-Person Families | 433 (32.4%) | $139,471 |
| 4-Person Families | 371 (27.8%) | $180,789 |
| 5-Person Families | 52 (3.9%) | $229,333 |
| 6-Person Families | 17 (1.3%) | $0 |
| 7+ Person Families | 0 (0.0%) | $0 |
| Total | 1,336 (100.0%) | $141,389 |
Family Income by Number of Earners in Gang Mills
The median family income in Gang Mills is $141,389, with families comprising 3+ earners (213) having the highest median family income of $180,740, while families with no earners (196) have the lowest median family income of $48,293, accounting for 15.9% and 14.7% of families, respectively.
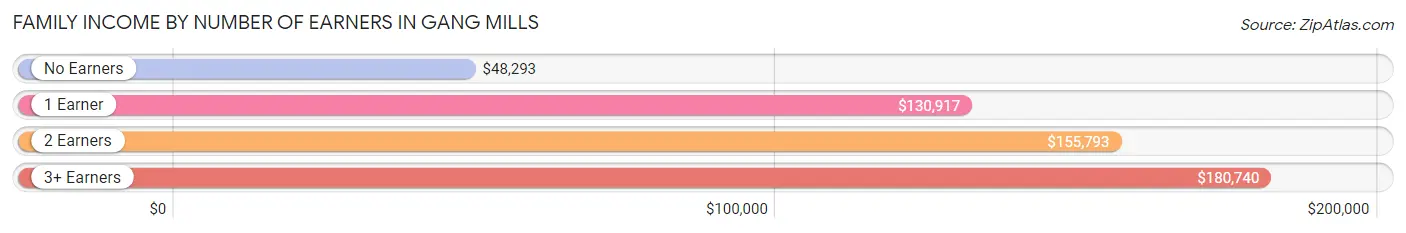
| Number of Earners | # Families | Median Income |
| No Earners | 196 (14.7%) | $48,293 |
| 1 Earner | 313 (23.4%) | $130,917 |
| 2 Earners | 614 (46.0%) | $155,793 |
| 3+ Earners | 213 (15.9%) | $180,740 |
| Total | 1,336 (100.0%) | $141,389 |
Household Income in Gang Mills
Household Income Brackets in Gang Mills
With 484 households falling in the category, the $150,000 to $199,999 income range is the most frequent in Gang Mills, accounting for 26.6% of all households. In contrast, only 22 households (1.2%) fall into the $10,000 to $14,999 income bracket, making it the least populous group.
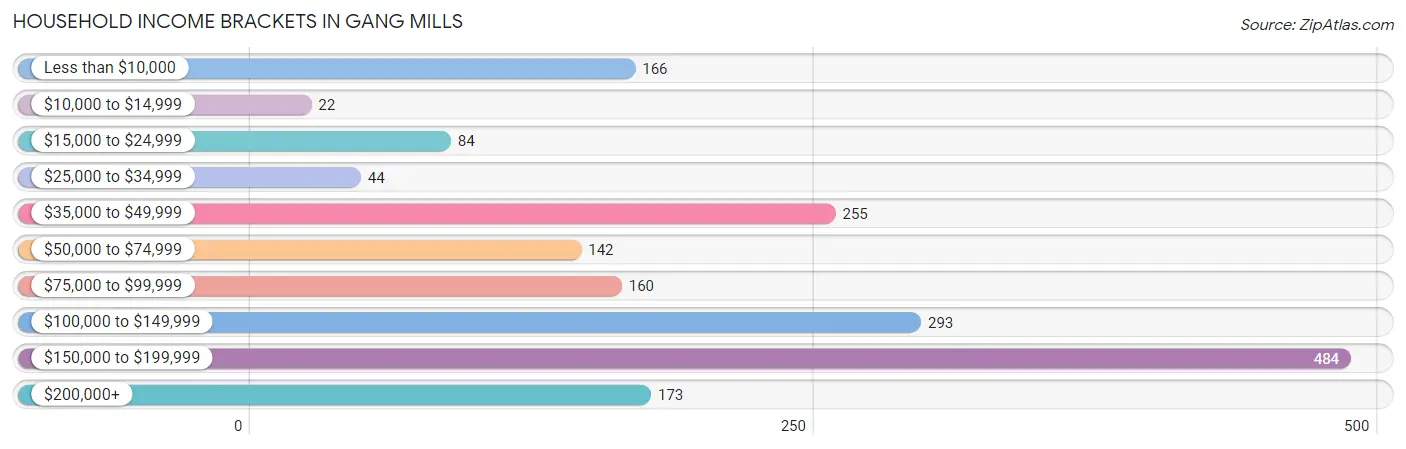
| Income Bracket | # Households | % Households |
| Less than $10,000 | 166 | 9.1% |
| $10,000 to $14,999 | 22 | 1.2% |
| $15,000 to $24,999 | 84 | 4.6% |
| $25,000 to $34,999 | 44 | 2.4% |
| $35,000 to $49,999 | 255 | 14.0% |
| $50,000 to $74,999 | 142 | 7.8% |
| $75,000 to $99,999 | 160 | 8.8% |
| $100,000 to $149,999 | 293 | 16.1% |
| $150,000 to $199,999 | 484 | 26.6% |
| $200,000+ | 173 | 9.5% |
Household Income by Householder Age in Gang Mills
The median household income in Gang Mills is $102,015, with the highest median household income of $174,647 found in the 45 to 64 years age bracket for the primary householder. A total of 691 households (38.0%) fall into this category. Meanwhile, the 15 to 24 years age bracket for the primary householder has the lowest median household income of $0, with 64 households (3.5%) in this group.
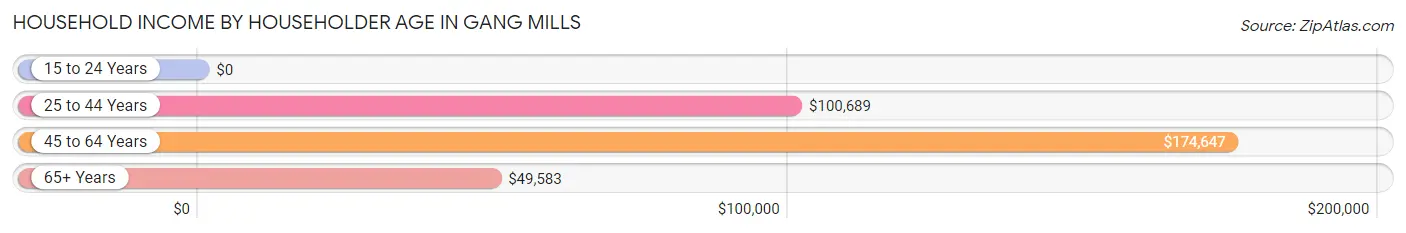
| Income Bracket | # Households | Median Income |
| 15 to 24 Years | 64 (3.5%) | $0 |
| 25 to 44 Years | 597 (32.8%) | $100,689 |
| 45 to 64 Years | 691 (38.0%) | $174,647 |
| 65+ Years | 467 (25.7%) | $49,583 |
| Total | 1,819 (100.0%) | $102,015 |
Poverty in Gang Mills
Income Below Poverty by Sex and Age in Gang Mills
With 4.7% poverty level for males and 10.3% for females among the residents of Gang Mills, under 5 year old males and 75 year old and over females are the most vulnerable to poverty, with 54 males (20.2%) and 86 females (31.0%) in their respective age groups living below the poverty level.
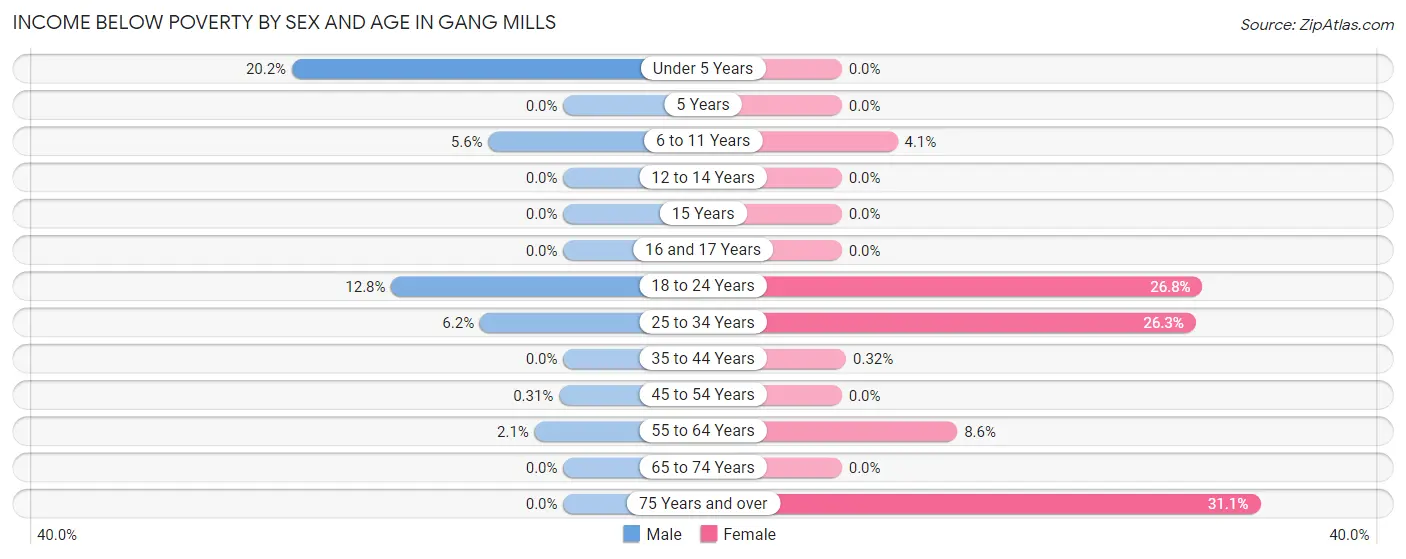
| Age Bracket | Male | Female |
| Under 5 Years | 54 (20.2%) | 0 (0.0%) |
| 5 Years | 0 (0.0%) | 0 (0.0%) |
| 6 to 11 Years | 10 (5.6%) | 7 (4.1%) |
| 12 to 14 Years | 0 (0.0%) | 0 (0.0%) |
| 15 Years | 0 (0.0%) | 0 (0.0%) |
| 16 and 17 Years | 0 (0.0%) | 0 (0.0%) |
| 18 to 24 Years | 12 (12.8%) | 53 (26.8%) |
| 25 to 34 Years | 21 (6.2%) | 57 (26.3%) |
| 35 to 44 Years | 0 (0.0%) | 1 (0.3%) |
| 45 to 54 Years | 1 (0.3%) | 0 (0.0%) |
| 55 to 64 Years | 7 (2.1%) | 24 (8.6%) |
| 65 to 74 Years | 0 (0.0%) | 0 (0.0%) |
| 75 Years and over | 0 (0.0%) | 86 (31.0%) |
| Total | 105 (4.7%) | 228 (10.3%) |
Income Above Poverty by Sex and Age in Gang Mills
According to the poverty statistics in Gang Mills, males aged 5 years and females aged under 5 years are the age groups that are most secure financially, with 100.0% of males and 100.0% of females in these age groups living above the poverty line.
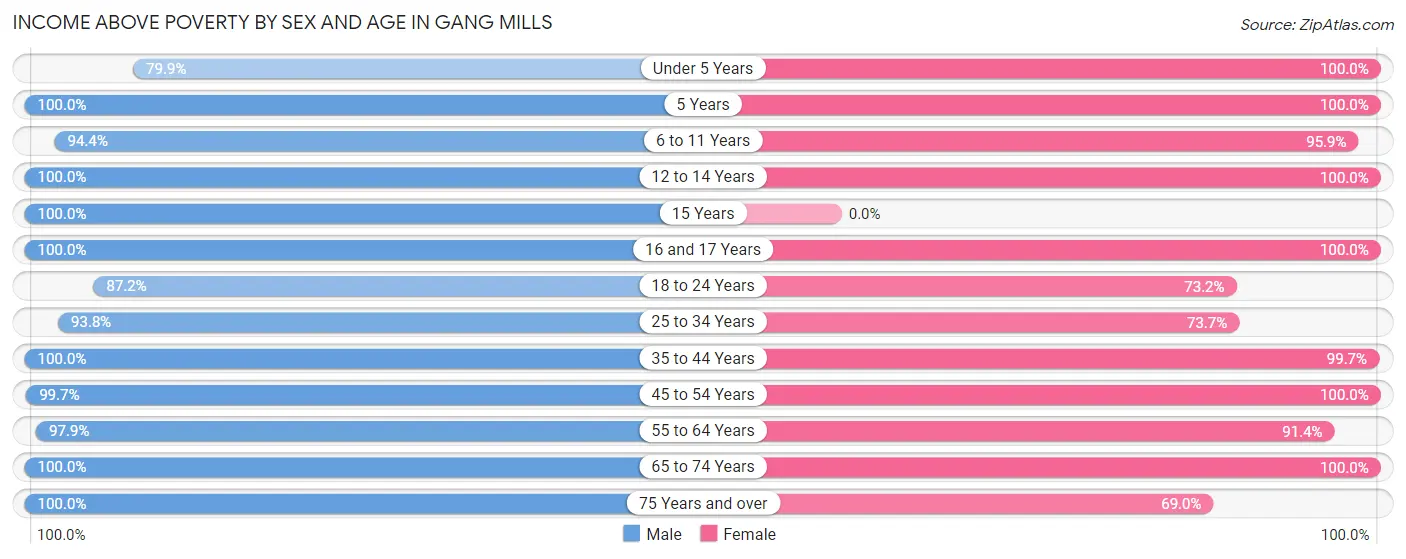
| Age Bracket | Male | Female |
| Under 5 Years | 214 (79.8%) | 71 (100.0%) |
| 5 Years | 10 (100.0%) | 40 (100.0%) |
| 6 to 11 Years | 170 (94.4%) | 162 (95.9%) |
| 12 to 14 Years | 60 (100.0%) | 11 (100.0%) |
| 15 Years | 87 (100.0%) | 0 (0.0%) |
| 16 and 17 Years | 59 (100.0%) | 100 (100.0%) |
| 18 to 24 Years | 82 (87.2%) | 145 (73.2%) |
| 25 to 34 Years | 318 (93.8%) | 160 (73.7%) |
| 35 to 44 Years | 228 (100.0%) | 307 (99.7%) |
| 45 to 54 Years | 320 (99.7%) | 422 (100.0%) |
| 55 to 64 Years | 322 (97.9%) | 256 (91.4%) |
| 65 to 74 Years | 179 (100.0%) | 120 (100.0%) |
| 75 Years and over | 91 (100.0%) | 191 (69.0%) |
| Total | 2,140 (95.3%) | 1,985 (89.7%) |
Income Below Poverty Among Married-Couple Families in Gang Mills
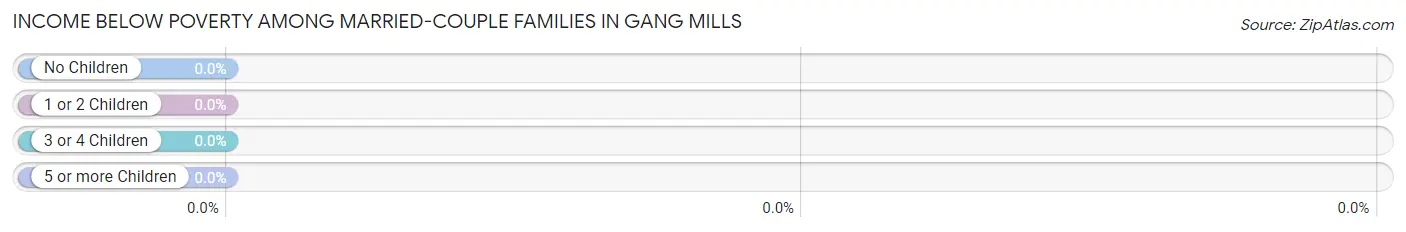
| Children | Above Poverty | Below Poverty |
| No Children | 550 (100.0%) | 0 (0.0%) |
| 1 or 2 Children | 541 (100.0%) | 0 (0.0%) |
| 3 or 4 Children | 55 (100.0%) | 0 (0.0%) |
| 5 or more Children | 0 (0.0%) | 0 (0.0%) |
| Total | 1,146 (100.0%) | 0 (0.0%) |
Income Below Poverty Among Single-Parent Households in Gang Mills
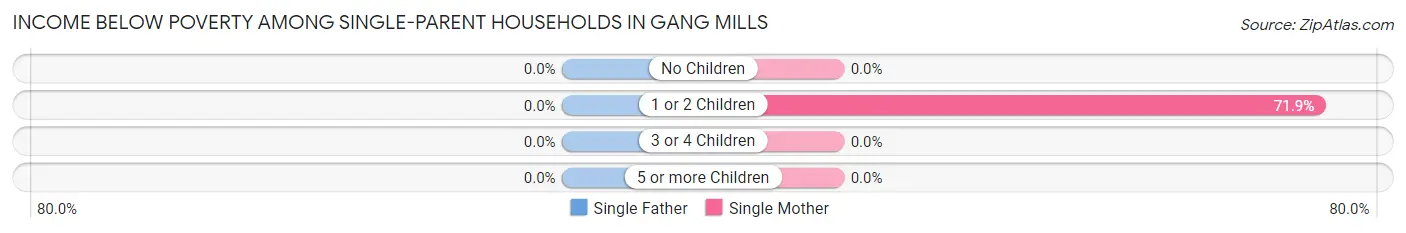
| Children | Single Father | Single Mother |
| No Children | 0 (0.0%) | 0 (0.0%) |
| 1 or 2 Children | 0 (0.0%) | 69 (71.9%) |
| 3 or 4 Children | 0 (0.0%) | 0 (0.0%) |
| 5 or more Children | 0 (0.0%) | 0 (0.0%) |
| Total | 0 (0.0%) | 69 (56.6%) |
Income Below Poverty Among Married-Couple vs Single-Parent Households in Gang Mills
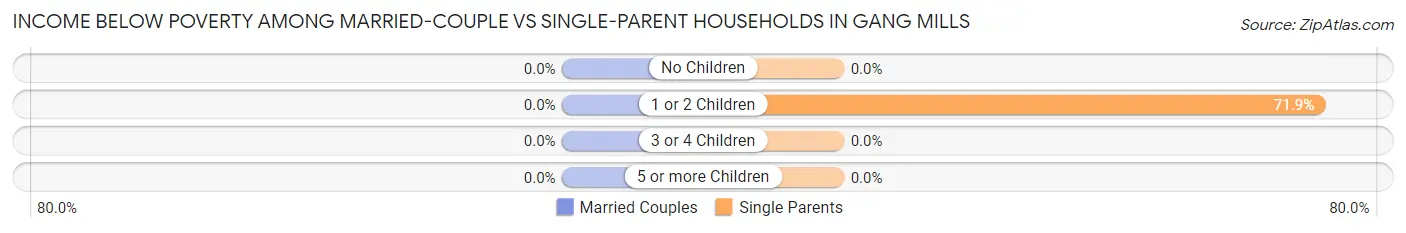
| Children | Married-Couple Families | Single-Parent Households |
| No Children | 0 (0.0%) | 0 (0.0%) |
| 1 or 2 Children | 0 (0.0%) | 69 (71.9%) |
| 3 or 4 Children | 0 (0.0%) | 0 (0.0%) |
| 5 or more Children | 0 (0.0%) | 0 (0.0%) |
| Total | 0 (0.0%) | 69 (36.3%) |
Race in Gang Mills
The most populous races in Gang Mills are White / Caucasian (3,321 | 72.8%), Asian (857 | 18.8%), and Two or more Races (254 | 5.6%).
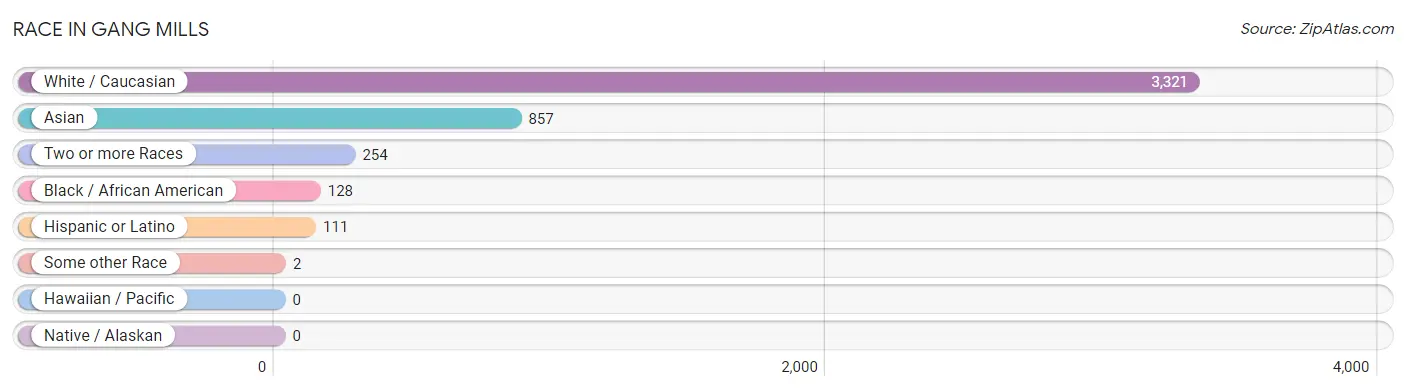
| Race | # Population | % Population |
| Asian | 857 | 18.8% |
| Black / African American | 128 | 2.8% |
| Hawaiian / Pacific | 0 | 0.0% |
| Hispanic or Latino | 111 | 2.4% |
| Native / Alaskan | 0 | 0.0% |
| White / Caucasian | 3,321 | 72.8% |
| Two or more Races | 254 | 5.6% |
| Some other Race | 2 | 0.0% |
| Total | 4,562 | 100.0% |
Ancestry in Gang Mills
The most populous ancestries reported in Gang Mills are Irish (893 | 19.6%), German (839 | 18.4%), Polish (524 | 11.5%), Italian (507 | 11.1%), and Indian (Asian) (483 | 10.6%), together accounting for 71.2% of all Gang Mills residents.
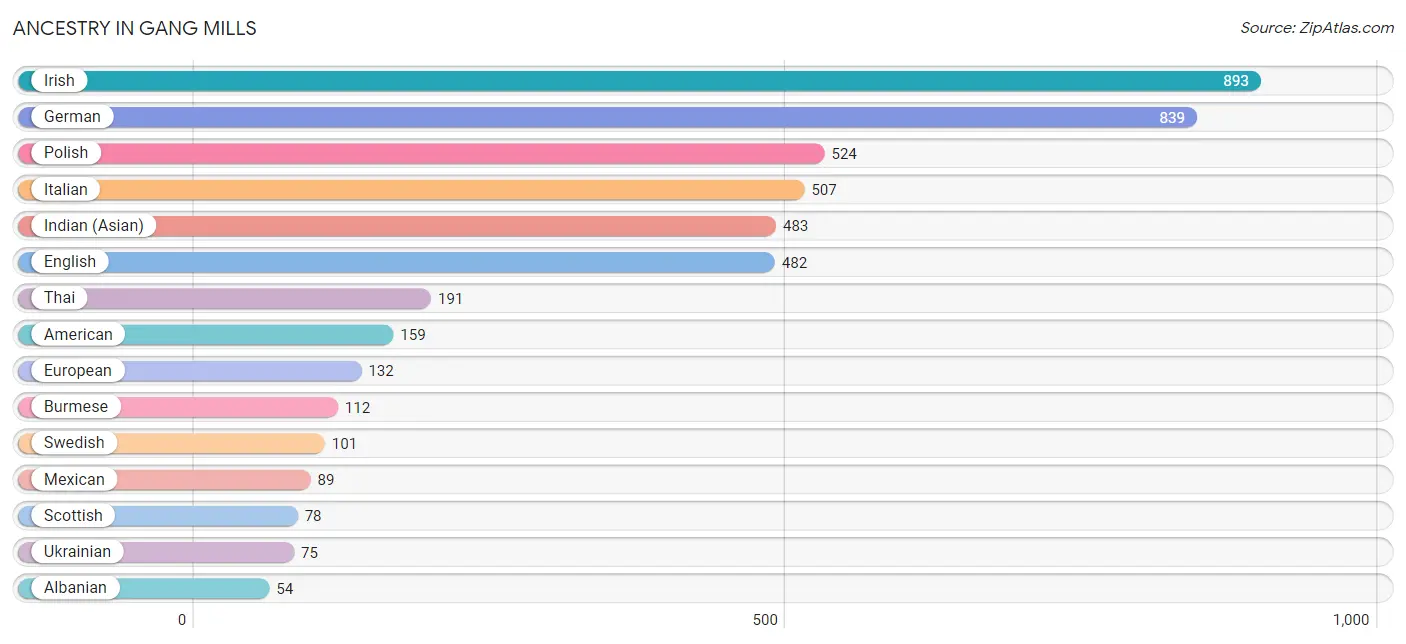
| Ancestry | # Population | % Population |
| Albanian | 54 | 1.2% |
| American | 159 | 3.5% |
| Bhutanese | 8 | 0.2% |
| Brazilian | 54 | 1.2% |
| British | 31 | 0.7% |
| Burmese | 112 | 2.5% |
| Czechoslovakian | 9 | 0.2% |
| Dutch | 16 | 0.4% |
| English | 482 | 10.6% |
| European | 132 | 2.9% |
| French | 36 | 0.8% |
| French Canadian | 9 | 0.2% |
| German | 839 | 18.4% |
| Greek | 11 | 0.2% |
| Indian (Asian) | 483 | 10.6% |
| Irish | 893 | 19.6% |
| Italian | 507 | 11.1% |
| Korean | 39 | 0.9% |
| Mexican | 89 | 1.9% |
| Pakistani | 8 | 0.2% |
| Polish | 524 | 11.5% |
| Puerto Rican | 19 | 0.4% |
| Romanian | 13 | 0.3% |
| Russian | 26 | 0.6% |
| Scottish | 78 | 1.7% |
| Swedish | 101 | 2.2% |
| Thai | 191 | 4.2% |
| Ukrainian | 75 | 1.6% |
| Vietnamese | 38 | 0.8% |
| Welsh | 43 | 0.9% | View All 30 Rows |
Immigrants in Gang Mills
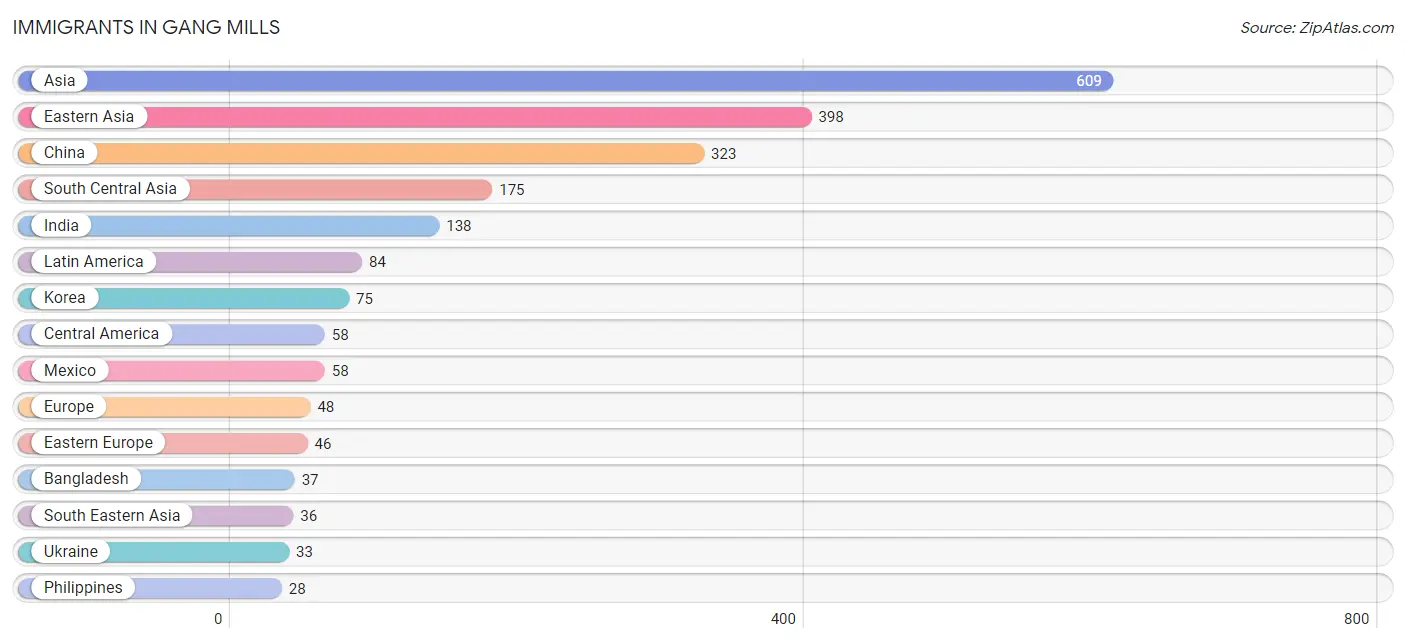
The most numerous immigrant groups reported in Gang Mills came from Asia (609 | 13.4%), Eastern Asia (398 | 8.7%), China (323 | 7.1%), South Central Asia (175 | 3.8%), and India (138 | 3.0%), together accounting for 36.0% of all Gang Mills residents.
| Immigration Origin | # Population | % Population |
| Asia | 609 | 13.4% |
| Bangladesh | 37 | 0.8% |
| Brazil | 26 | 0.6% |
| Canada | 26 | 0.6% |
| Central America | 58 | 1.3% |
| China | 323 | 7.1% |
| Eastern Asia | 398 | 8.7% |
| Eastern Europe | 46 | 1.0% |
| Europe | 48 | 1.1% |
| Germany | 2 | 0.0% |
| India | 138 | 3.0% |
| Korea | 75 | 1.6% |
| Latin America | 84 | 1.8% |
| Mexico | 58 | 1.3% |
| Philippines | 28 | 0.6% |
| Romania | 13 | 0.3% |
| South America | 26 | 0.6% |
| South Central Asia | 175 | 3.8% |
| South Eastern Asia | 36 | 0.8% |
| Thailand | 8 | 0.2% |
| Ukraine | 33 | 0.7% |
| Western Europe | 2 | 0.0% | View All 22 Rows |
Sex and Age in Gang Mills
Sex and Age in Gang Mills
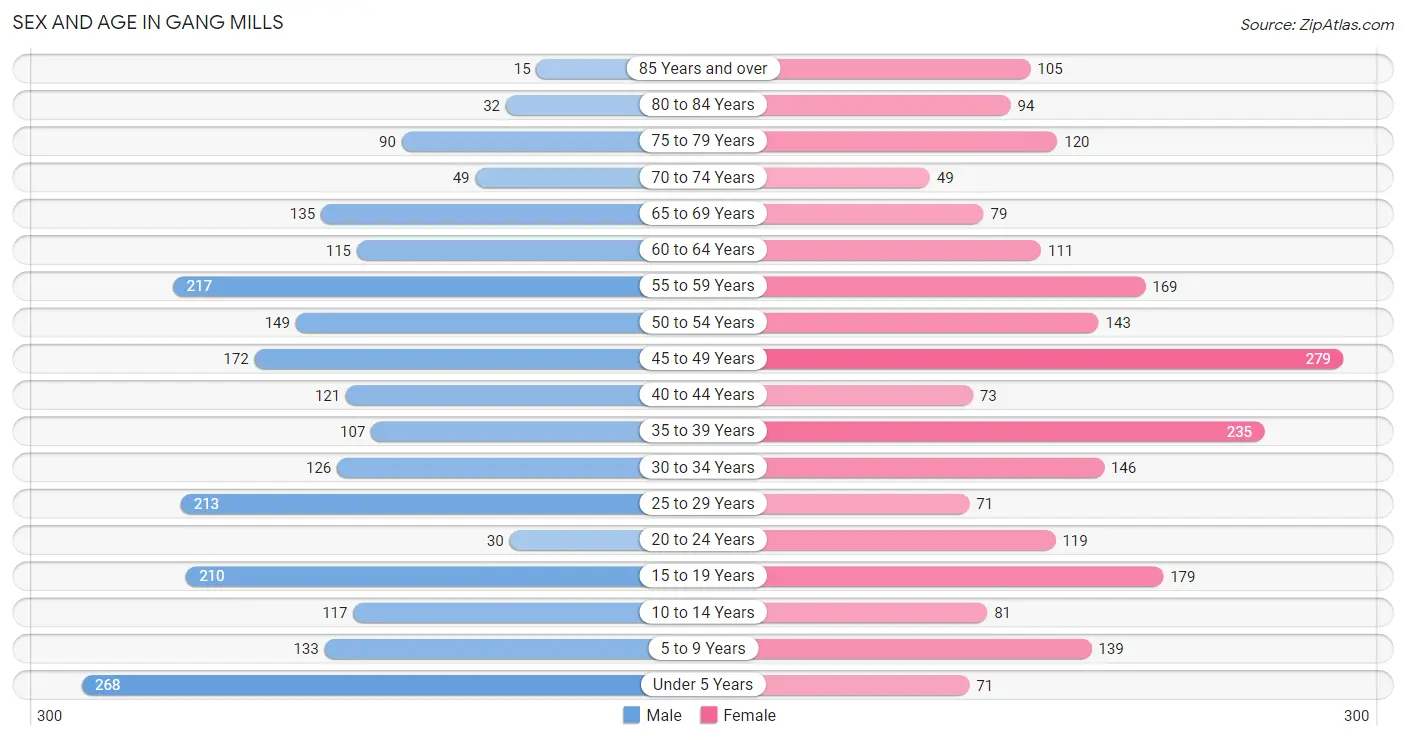
The most populous age groups in Gang Mills are Under 5 Years (268 | 11.7%) for men and 45 to 49 Years (279 | 12.3%) for women.
| Age Bracket | Male | Female |
| Under 5 Years | 268 (11.7%) | 71 (3.1%) |
| 5 to 9 Years | 133 (5.8%) | 139 (6.1%) |
| 10 to 14 Years | 117 (5.1%) | 81 (3.6%) |
| 15 to 19 Years | 210 (9.1%) | 179 (7.9%) |
| 20 to 24 Years | 30 (1.3%) | 119 (5.3%) |
| 25 to 29 Years | 213 (9.3%) | 71 (3.1%) |
| 30 to 34 Years | 126 (5.5%) | 146 (6.5%) |
| 35 to 39 Years | 107 (4.6%) | 235 (10.4%) |
| 40 to 44 Years | 121 (5.3%) | 73 (3.2%) |
| 45 to 49 Years | 172 (7.5%) | 279 (12.3%) |
| 50 to 54 Years | 149 (6.5%) | 143 (6.3%) |
| 55 to 59 Years | 217 (9.4%) | 169 (7.5%) |
| 60 to 64 Years | 115 (5.0%) | 111 (4.9%) |
| 65 to 69 Years | 135 (5.9%) | 79 (3.5%) |
| 70 to 74 Years | 49 (2.1%) | 49 (2.2%) |
| 75 to 79 Years | 90 (3.9%) | 120 (5.3%) |
| 80 to 84 Years | 32 (1.4%) | 94 (4.2%) |
| 85 Years and over | 15 (0.6%) | 105 (4.6%) |
| Total | 2,299 (100.0%) | 2,263 (100.0%) |
Families and Households in Gang Mills
Median Family Size in Gang Mills
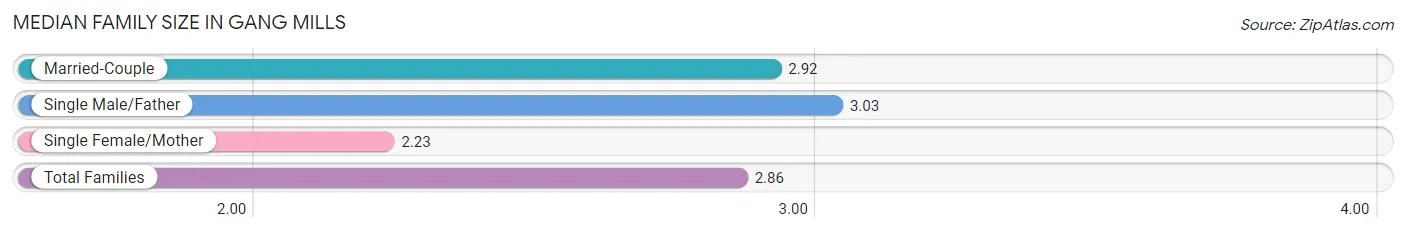
The median family size in Gang Mills is 2.86 persons per family, with single male/father families (68 | 5.1%) accounting for the largest median family size of 3.03 persons per family. On the other hand, single female/mother families (122 | 9.1%) represent the smallest median family size with 2.23 persons per family.
| Family Type | # Families | Family Size |
| Married-Couple | 1,146 (85.8%) | 2.92 |
| Single Male/Father | 68 (5.1%) | 3.03 |
| Single Female/Mother | 122 (9.1%) | 2.23 |
| Total Families | 1,336 (100.0%) | 2.86 |
Median Household Size in Gang Mills
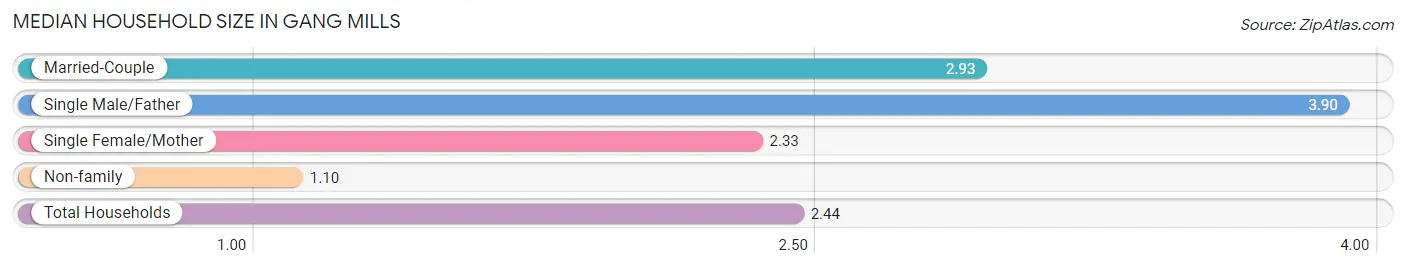
The median household size in Gang Mills is 2.44 persons per household, with single male/father households (68 | 3.7%) accounting for the largest median household size of 3.9 persons per household. non-family households (483 | 26.6%) represent the smallest median household size with 1.10 persons per household.
| Household Type | # Households | Household Size |
| Married-Couple | 1,146 (63.0%) | 2.93 |
| Single Male/Father | 68 (3.7%) | 3.90 |
| Single Female/Mother | 122 (6.7%) | 2.33 |
| Non-family | 483 (26.6%) | 1.10 |
| Total Households | 1,819 (100.0%) | 2.44 |
Household Size by Marriage Status in Gang Mills
Out of a total of 1,819 households in Gang Mills, 1,336 (73.5%) are family households, while 483 (26.6%) are nonfamily households. The most numerous type of family households are 2-person households, comprising 445, and the most common type of nonfamily households are 1-person households, comprising 433.
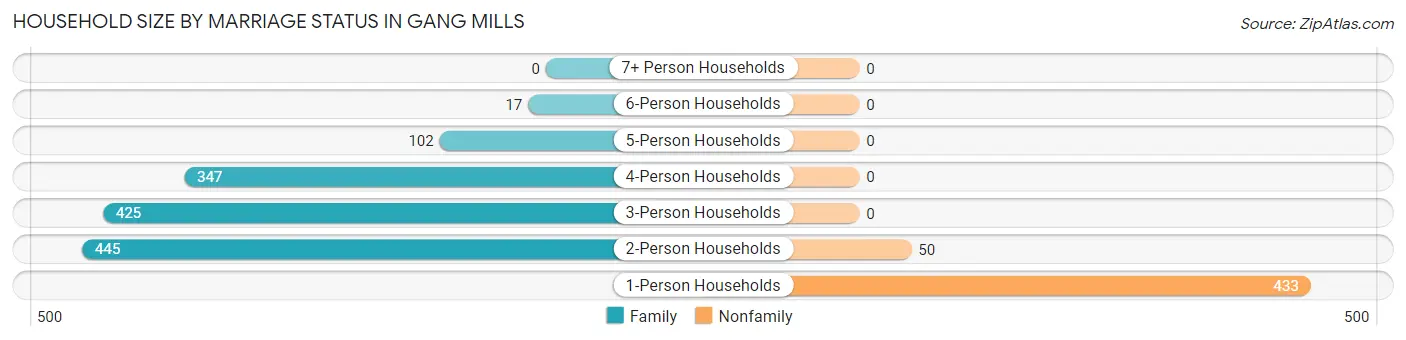
| Household Size | Family Households | Nonfamily Households |
| 1-Person Households | - | 433 (23.8%) |
| 2-Person Households | 445 (24.5%) | 50 (2.8%) |
| 3-Person Households | 425 (23.4%) | 0 (0.0%) |
| 4-Person Households | 347 (19.1%) | 0 (0.0%) |
| 5-Person Households | 102 (5.6%) | 0 (0.0%) |
| 6-Person Households | 17 (0.9%) | 0 (0.0%) |
| 7+ Person Households | 0 (0.0%) | 0 (0.0%) |
| Total | 1,336 (73.5%) | 483 (26.6%) |
Female Fertility in Gang Mills
Fertility by Age in Gang Mills
Average fertility rate in Gang Mills is 41.0 births per 1,000 women. Women in the age bracket of 20 to 34 years have the highest fertility rate with 140.0 births per 1,000 women. Women in the age bracket of 20 to 34 years acount for 100.0% of all women with births.
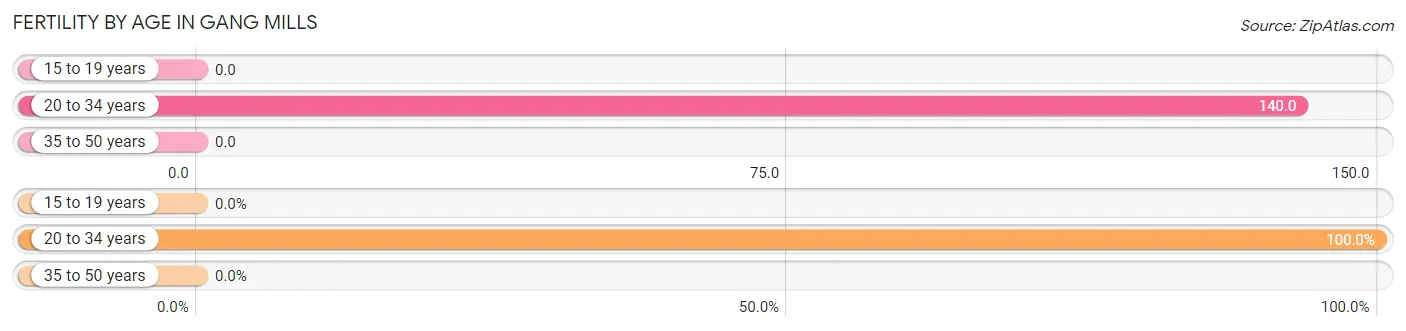
| Age Bracket | Women with Births | Births / 1,000 Women |
| 15 to 19 years | 0 (0.0%) | 0.0 |
| 20 to 34 years | 47 (100.0%) | 140.0 |
| 35 to 50 years | 0 (0.0%) | 0.0 |
| Total | 47 (100.0%) | 41.0 |
Fertility by Age by Marriage Status in Gang Mills
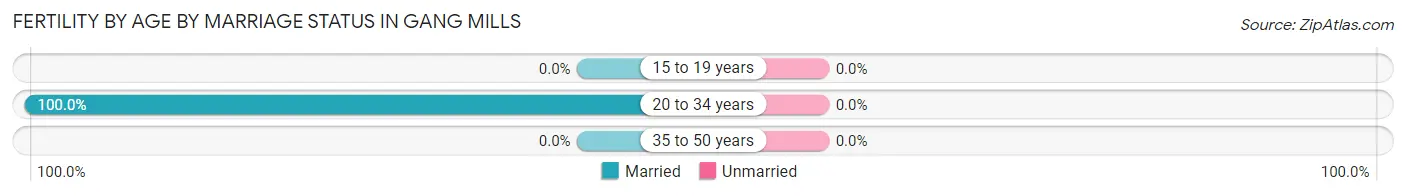
| Age Bracket | Married | Unmarried |
| 15 to 19 years | 0 (0.0%) | 0 (0.0%) |
| 20 to 34 years | 47 (100.0%) | 0 (0.0%) |
| 35 to 50 years | 0 (0.0%) | 0 (0.0%) |
| Total | 47 (100.0%) | 0 (0.0%) |
Fertility by Education in Gang Mills
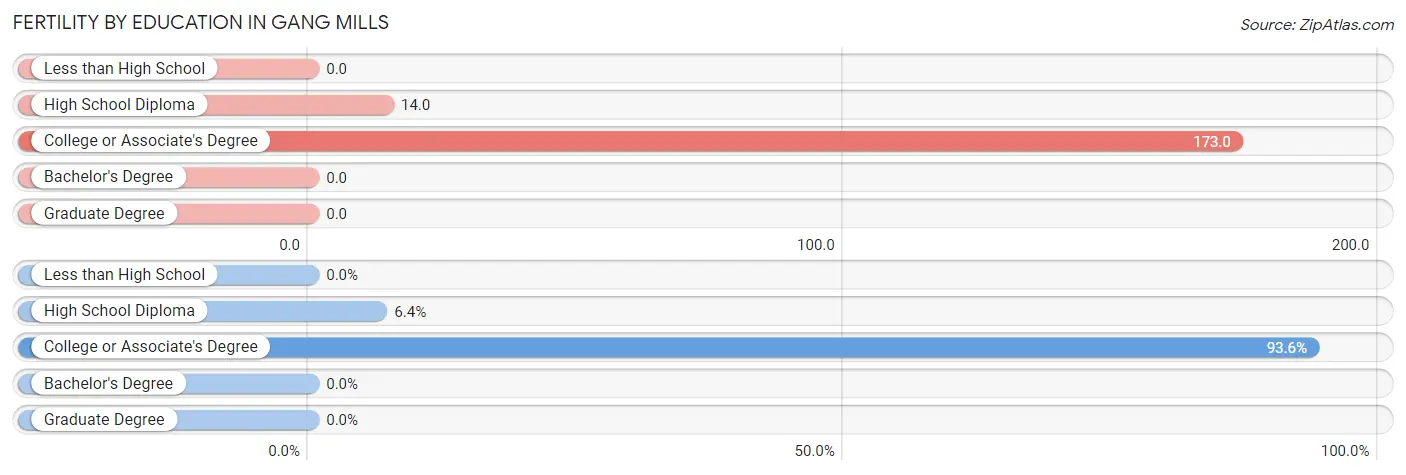
| Educational Attainment | Women with Births | Births / 1,000 Women |
| Less than High School | 0 (0.0%) | 0.0 |
| High School Diploma | 3 (6.4%) | 14.0 |
| College or Associate's Degree | 44 (93.6%) | 173.0 |
| Bachelor's Degree | 0 (0.0%) | 0.0 |
| Graduate Degree | 0 (0.0%) | 0.0 |
| Total | 47 (100.0%) | 41.0 |
Fertility by Education by Marriage Status in Gang Mills
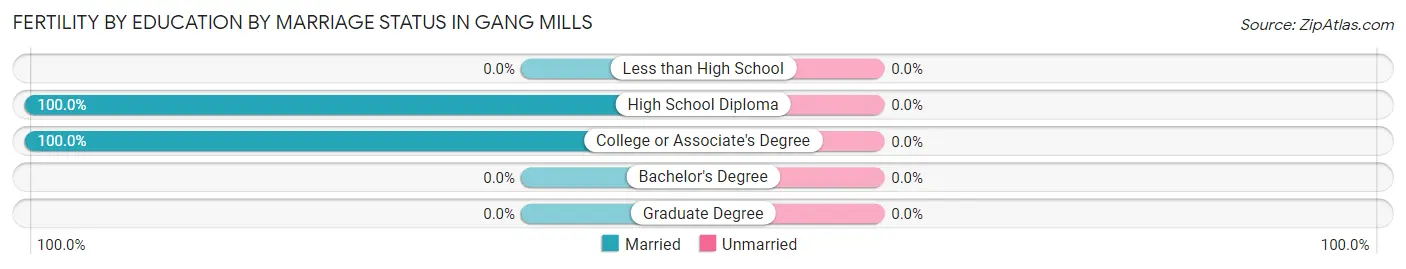
| Educational Attainment | Married | Unmarried |
| Less than High School | 0 (0.0%) | 0 (0.0%) |
| High School Diploma | 3 (100.0%) | 0 (0.0%) |
| College or Associate's Degree | 44 (100.0%) | 0 (0.0%) |
| Bachelor's Degree | 0 (0.0%) | 0 (0.0%) |
| Graduate Degree | 0 (0.0%) | 0 (0.0%) |
| Total | 47 (100.0%) | 0 (0.0%) |
Employment Characteristics in Gang Mills
Employment by Class of Employer in Gang Mills
Among the 2,190 employed individuals in Gang Mills, private company employees (1,483 | 67.7%), local government employees (391 | 17.8%), and not-for-profit organizations (129 | 5.9%) make up the most common classes of employment.
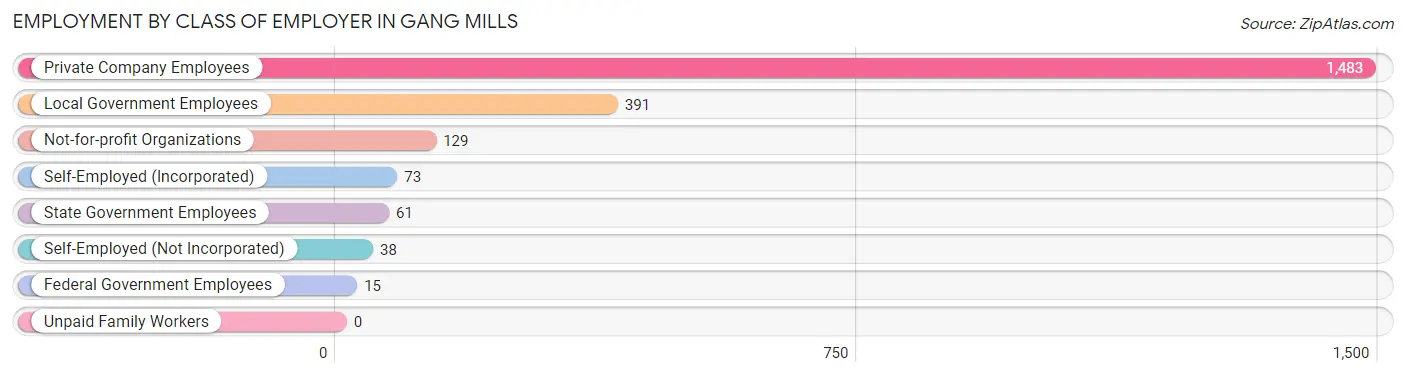
| Employer Class | # Employees | % Employees |
| Private Company Employees | 1,483 | 67.7% |
| Self-Employed (Incorporated) | 73 | 3.3% |
| Self-Employed (Not Incorporated) | 38 | 1.7% |
| Not-for-profit Organizations | 129 | 5.9% |
| Local Government Employees | 391 | 17.8% |
| State Government Employees | 61 | 2.8% |
| Federal Government Employees | 15 | 0.7% |
| Unpaid Family Workers | 0 | 0.0% |
| Total | 2,190 | 100.0% |
Employment Status by Age in Gang Mills
According to the labor force statistics for Gang Mills, out of the total population over 16 years of age (3,666), 64.4% or 2,361 individuals are in the labor force, with 2.6% or 61 of them unemployed. The age group with the highest labor force participation rate is 25 to 29 years, with 100.0% or 284 individuals in the labor force. Within the labor force, the 16 to 19 years age range has the highest percentage of unemployed individuals, with 12.5% or 11 of them being unemployed.
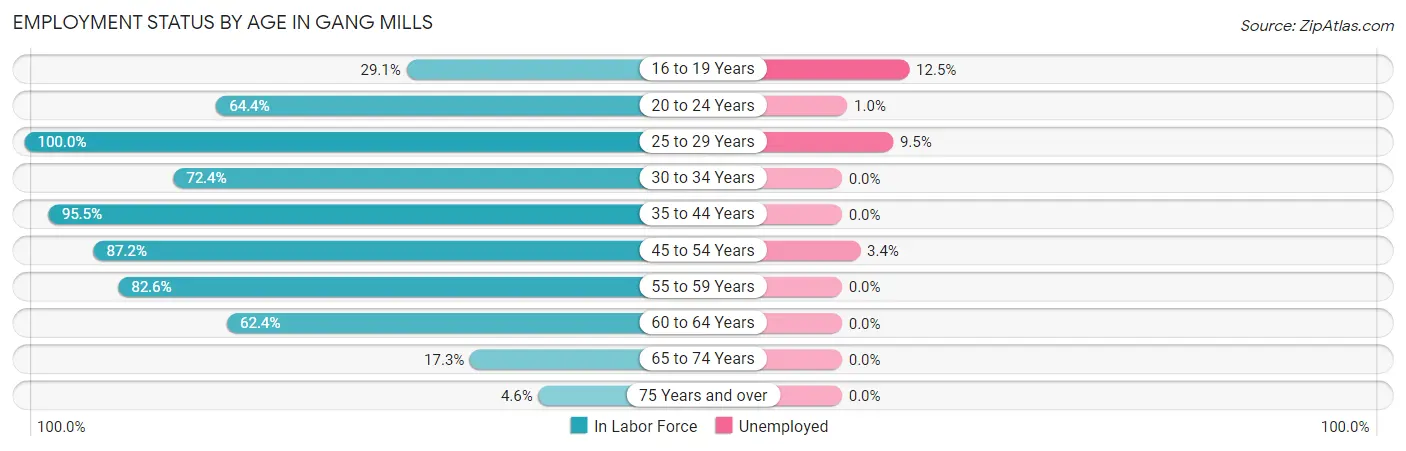
| Age Bracket | In Labor Force | Unemployed |
| 16 to 19 Years | 88 (29.1%) | 11 (12.5%) |
| 20 to 24 Years | 96 (64.4%) | 1 (1.0%) |
| 25 to 29 Years | 284 (100.0%) | 27 (9.5%) |
| 30 to 34 Years | 197 (72.4%) | 0 (0.0%) |
| 35 to 44 Years | 512 (95.5%) | 0 (0.0%) |
| 45 to 54 Years | 648 (87.2%) | 22 (3.4%) |
| 55 to 59 Years | 319 (82.6%) | 0 (0.0%) |
| 60 to 64 Years | 141 (62.4%) | 0 (0.0%) |
| 65 to 74 Years | 54 (17.3%) | 0 (0.0%) |
| 75 Years and over | 21 (4.6%) | 0 (0.0%) |
| Total | 2,361 (64.4%) | 61 (2.6%) |
Employment Status by Educational Attainment in Gang Mills
According to labor force statistics for Gang Mills, 85.9% of individuals (2,102) out of the total population between 25 and 64 years of age (2,447) are in the labor force, with 2.3% or 48 of them being unemployed. The group with the highest labor force participation rate are those with the educational attainment of bachelor's degree or higher, with 94.3% or 1,260 individuals in the labor force. Within the labor force, individuals with college / associate degree education have the highest percentage of unemployment, with 4.4% or 22 of them being unemployed.
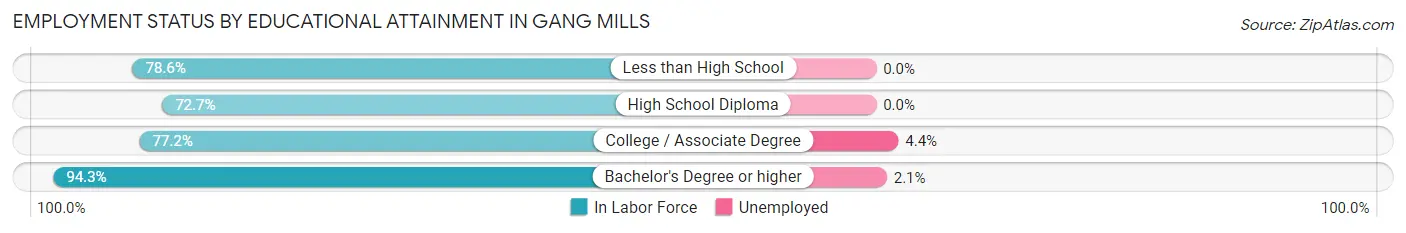
| Educational Attainment | In Labor Force | Unemployed |
| Less than High School | 55 (78.6%) | 0 (0.0%) |
| High School Diploma | 282 (72.7%) | 0 (0.0%) |
| College / Associate Degree | 504 (77.2%) | 29 (4.4%) |
| Bachelor's Degree or higher | 1,260 (94.3%) | 28 (2.1%) |
| Total | 2,102 (85.9%) | 56 (2.3%) |
Employment Occupations by Sex in Gang Mills
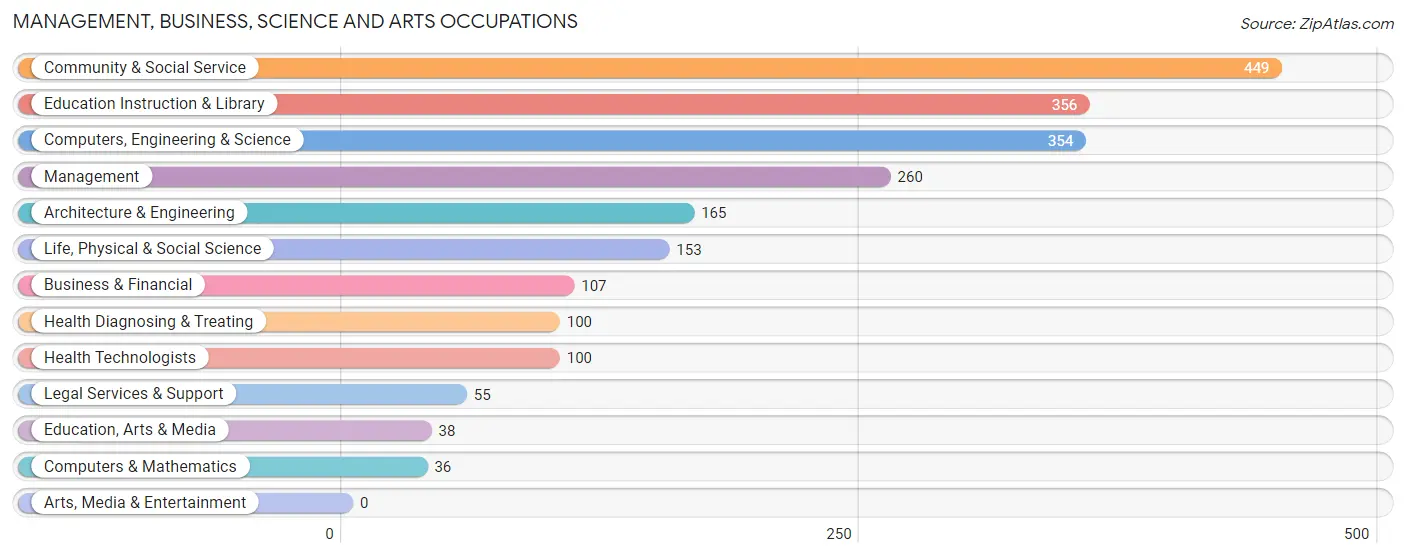
Management, Business, Science and Arts Occupations
The most common Management, Business, Science and Arts occupations in Gang Mills are Community & Social Service (449 | 19.5%), Education Instruction & Library (356 | 15.5%), Computers, Engineering & Science (354 | 15.4%), Management (260 | 11.3%), and Architecture & Engineering (165 | 7.2%).
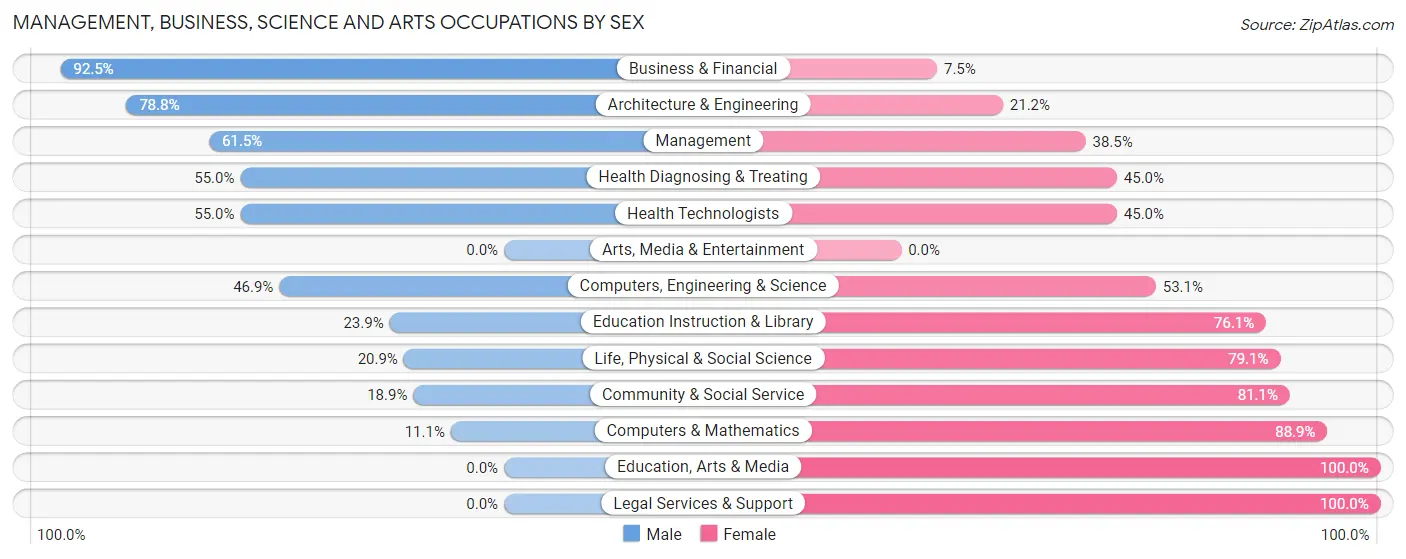
Management, Business, Science and Arts Occupations by Sex
Within the Management, Business, Science and Arts occupations in Gang Mills, the most male-oriented occupations are Business & Financial (92.5%), Architecture & Engineering (78.8%), and Management (61.5%), while the most female-oriented occupations are Education, Arts & Media (100.0%), Legal Services & Support (100.0%), and Computers & Mathematics (88.9%).
| Occupation | Male | Female |
| Management | 160 (61.5%) | 100 (38.5%) |
| Business & Financial | 99 (92.5%) | 8 (7.5%) |
| Computers, Engineering & Science | 166 (46.9%) | 188 (53.1%) |
| Computers & Mathematics | 4 (11.1%) | 32 (88.9%) |
| Architecture & Engineering | 130 (78.8%) | 35 (21.2%) |
| Life, Physical & Social Science | 32 (20.9%) | 121 (79.1%) |
| Community & Social Service | 85 (18.9%) | 364 (81.1%) |
| Education, Arts & Media | 0 (0.0%) | 38 (100.0%) |
| Legal Services & Support | 0 (0.0%) | 55 (100.0%) |
| Education Instruction & Library | 85 (23.9%) | 271 (76.1%) |
| Arts, Media & Entertainment | 0 (0.0%) | 0 (0.0%) |
| Health Diagnosing & Treating | 55 (55.0%) | 45 (45.0%) |
| Health Technologists | 55 (55.0%) | 45 (45.0%) |
| Total (Category) | 565 (44.5%) | 705 (55.5%) |
| Total (Overall) | 1,248 (54.3%) | 1,051 (45.7%) |
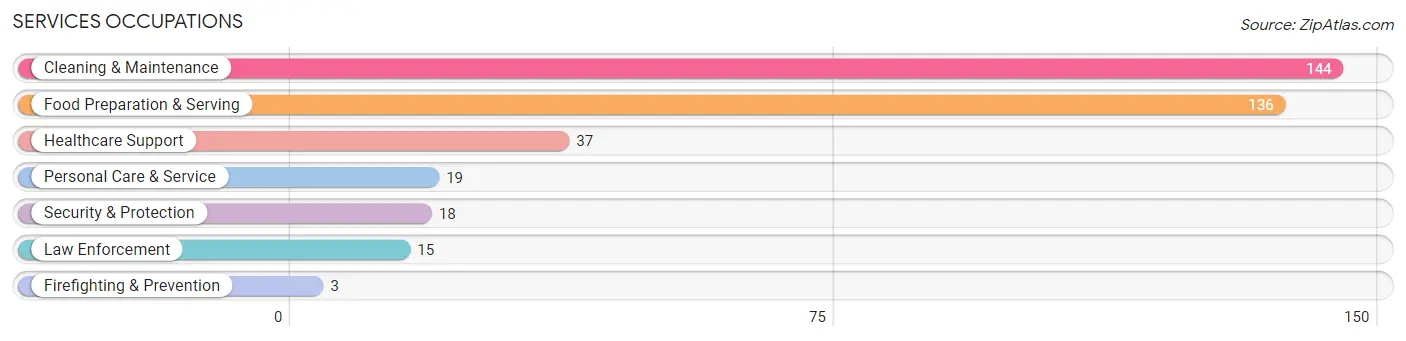
Services Occupations
The most common Services occupations in Gang Mills are Cleaning & Maintenance (144 | 6.3%), Food Preparation & Serving (136 | 5.9%), Healthcare Support (37 | 1.6%), Personal Care & Service (19 | 0.8%), and Security & Protection (18 | 0.8%).
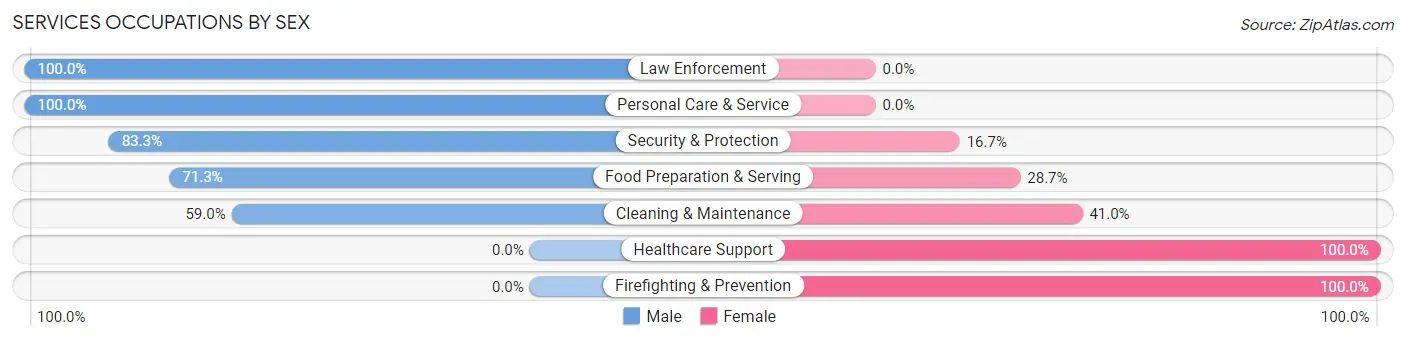
Services Occupations by Sex
Within the Services occupations in Gang Mills, the most male-oriented occupations are Law Enforcement (100.0%), Personal Care & Service (100.0%), and Security & Protection (83.3%), while the most female-oriented occupations are Healthcare Support (100.0%), Firefighting & Prevention (100.0%), and Cleaning & Maintenance (41.0%).
| Occupation | Male | Female |
| Healthcare Support | 0 (0.0%) | 37 (100.0%) |
| Security & Protection | 15 (83.3%) | 3 (16.7%) |
| Firefighting & Prevention | 0 (0.0%) | 3 (100.0%) |
| Law Enforcement | 15 (100.0%) | 0 (0.0%) |
| Food Preparation & Serving | 97 (71.3%) | 39 (28.7%) |
| Cleaning & Maintenance | 85 (59.0%) | 59 (41.0%) |
| Personal Care & Service | 19 (100.0%) | 0 (0.0%) |
| Total (Category) | 216 (61.0%) | 138 (39.0%) |
| Total (Overall) | 1,248 (54.3%) | 1,051 (45.7%) |
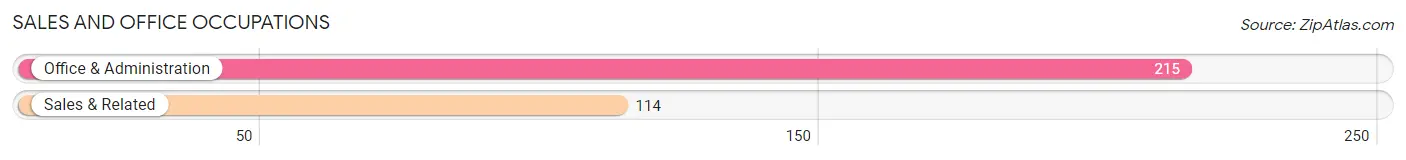
Sales and Office Occupations
The most common Sales and Office occupations in Gang Mills are Office & Administration (215 | 9.3%), and Sales & Related (114 | 5.0%).
Sales and Office Occupations by Sex
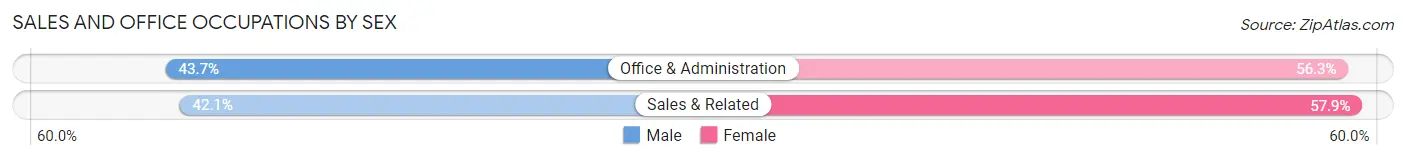
| Occupation | Male | Female |
| Sales & Related | 48 (42.1%) | 66 (57.9%) |
| Office & Administration | 94 (43.7%) | 121 (56.3%) |
| Total (Category) | 142 (43.2%) | 187 (56.8%) |
| Total (Overall) | 1,248 (54.3%) | 1,051 (45.7%) |
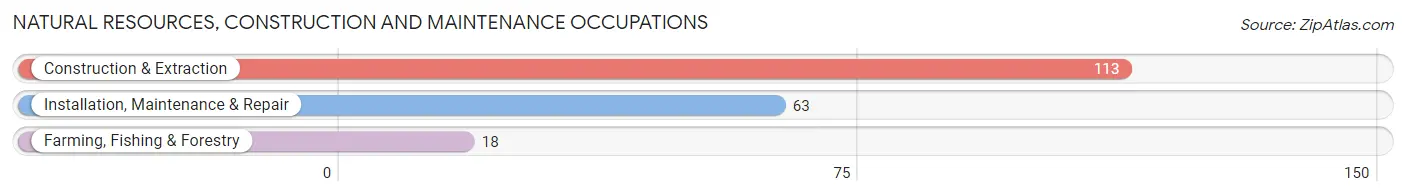
Natural Resources, Construction and Maintenance Occupations
The most common Natural Resources, Construction and Maintenance occupations in Gang Mills are Construction & Extraction (113 | 4.9%), Installation, Maintenance & Repair (63 | 2.7%), and Farming, Fishing & Forestry (18 | 0.8%).
Natural Resources, Construction and Maintenance Occupations by Sex
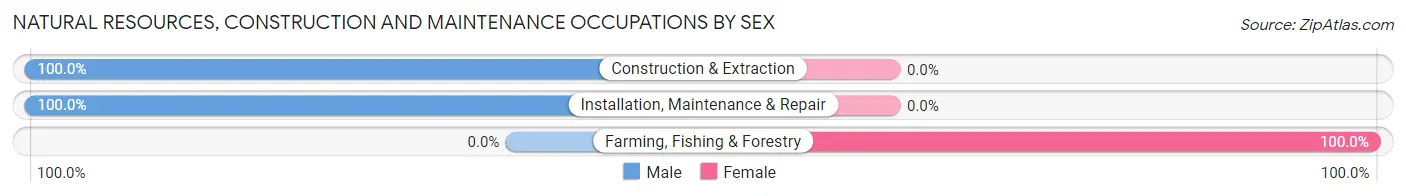
| Occupation | Male | Female |
| Farming, Fishing & Forestry | 0 (0.0%) | 18 (100.0%) |
| Construction & Extraction | 113 (100.0%) | 0 (0.0%) |
| Installation, Maintenance & Repair | 63 (100.0%) | 0 (0.0%) |
| Total (Category) | 176 (90.7%) | 18 (9.3%) |
| Total (Overall) | 1,248 (54.3%) | 1,051 (45.7%) |
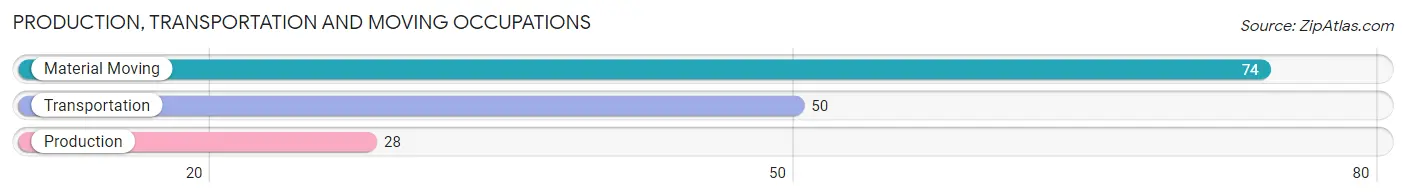
Production, Transportation and Moving Occupations
The most common Production, Transportation and Moving occupations in Gang Mills are Material Moving (74 | 3.2%), Transportation (50 | 2.2%), and Production (28 | 1.2%).
Production, Transportation and Moving Occupations by Sex
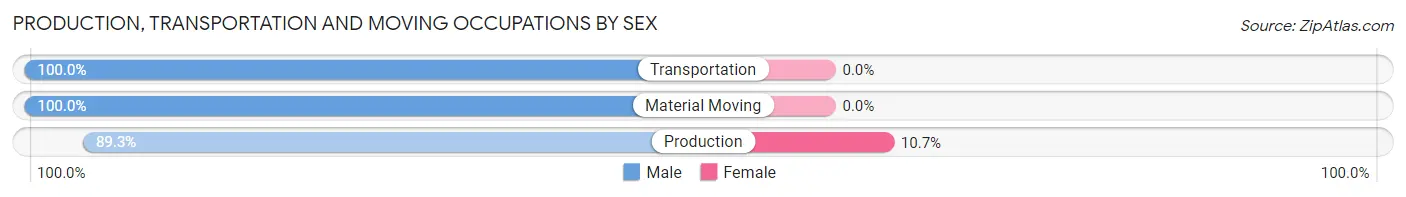
| Occupation | Male | Female |
| Production | 25 (89.3%) | 3 (10.7%) |
| Transportation | 50 (100.0%) | 0 (0.0%) |
| Material Moving | 74 (100.0%) | 0 (0.0%) |
| Total (Category) | 149 (98.0%) | 3 (2.0%) |
| Total (Overall) | 1,248 (54.3%) | 1,051 (45.7%) |
Employment Industries by Sex in Gang Mills
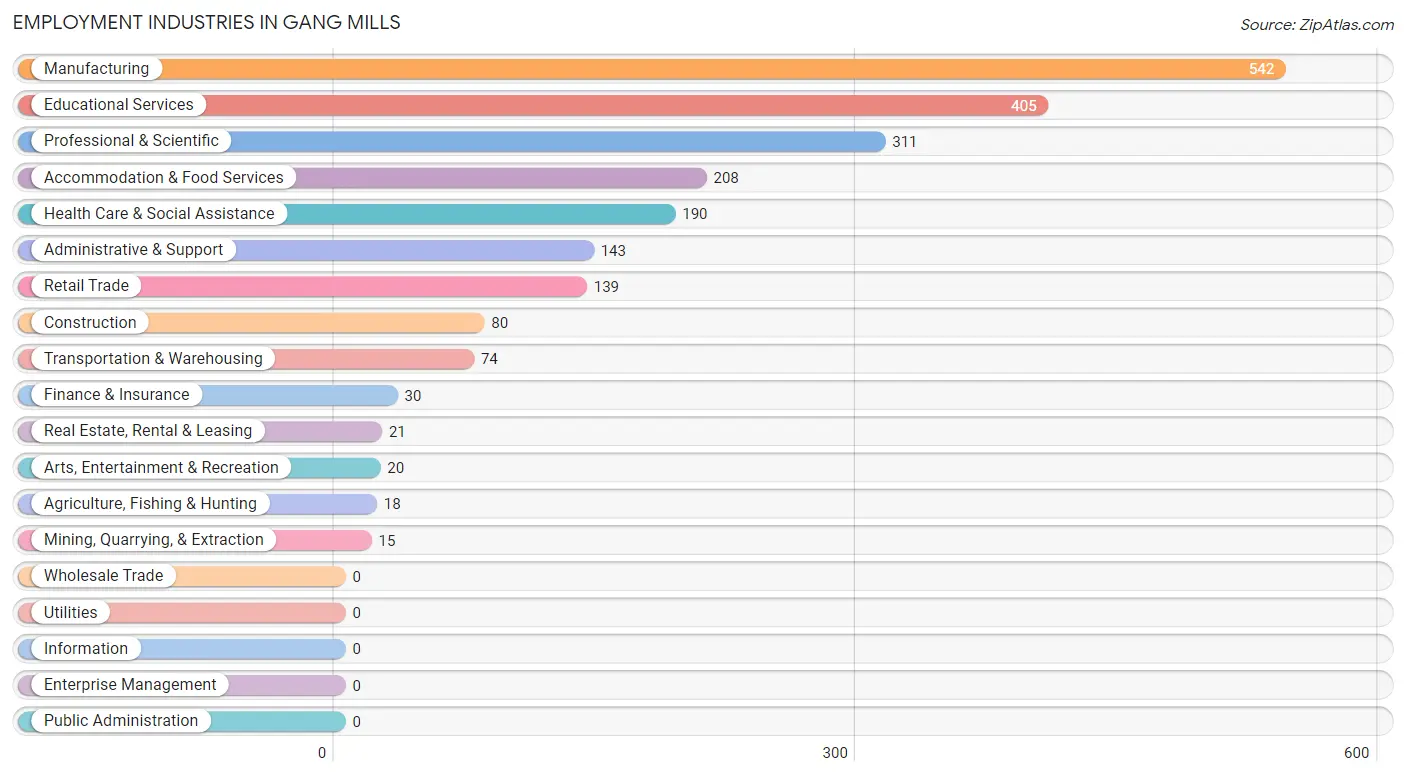
Employment Industries in Gang Mills
The major employment industries in Gang Mills include Manufacturing (542 | 23.6%), Educational Services (405 | 17.6%), Professional & Scientific (311 | 13.5%), Accommodation & Food Services (208 | 9.0%), and Health Care & Social Assistance (190 | 8.3%).
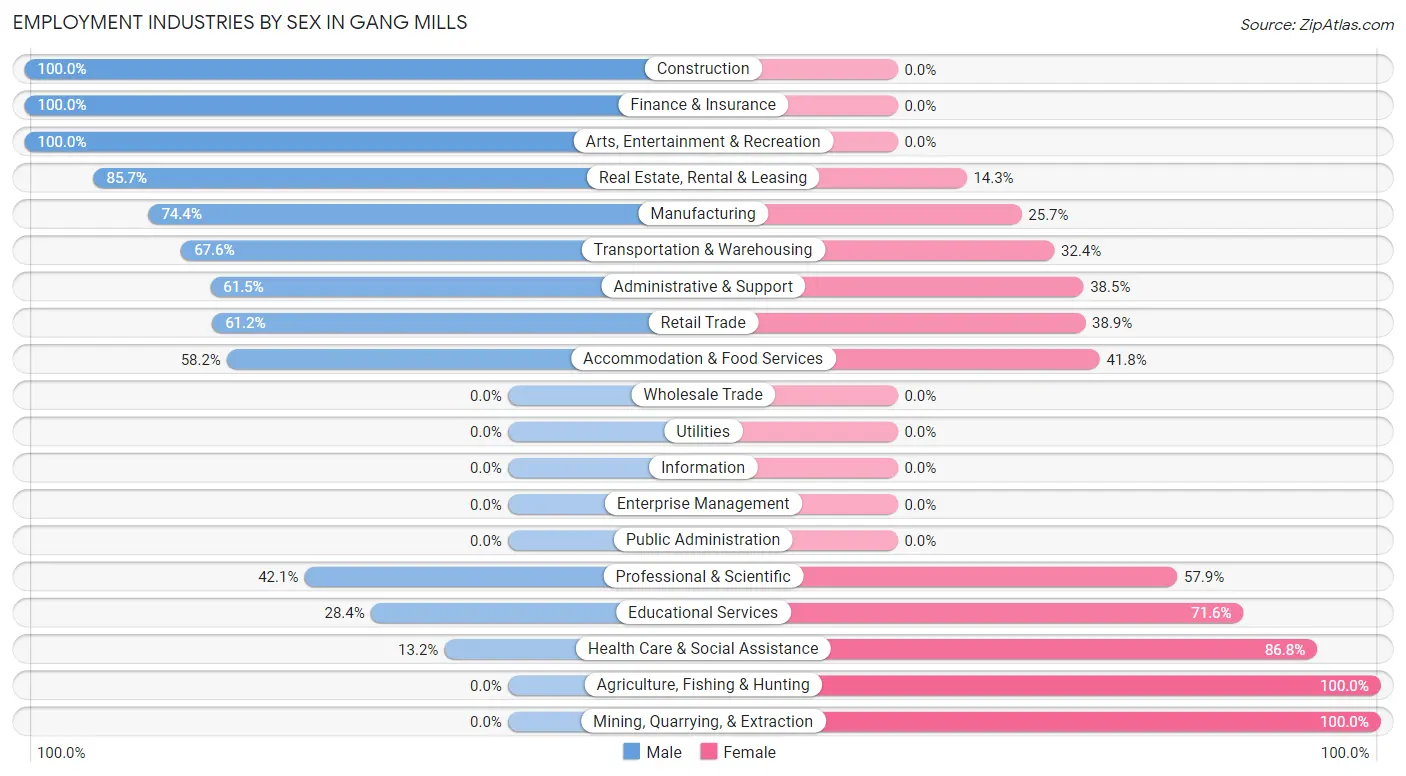
Employment Industries by Sex in Gang Mills
The Gang Mills industries that see more men than women are Construction (100.0%), Finance & Insurance (100.0%), and Arts, Entertainment & Recreation (100.0%), whereas the industries that tend to have a higher number of women are Agriculture, Fishing & Hunting (100.0%), Mining, Quarrying, & Extraction (100.0%), and Health Care & Social Assistance (86.8%).
| Industry | Male | Female |
| Agriculture, Fishing & Hunting | 0 (0.0%) | 18 (100.0%) |
| Mining, Quarrying, & Extraction | 0 (0.0%) | 15 (100.0%) |
| Construction | 80 (100.0%) | 0 (0.0%) |
| Manufacturing | 403 (74.4%) | 139 (25.7%) |
| Wholesale Trade | 0 (0.0%) | 0 (0.0%) |
| Retail Trade | 85 (61.2%) | 54 (38.9%) |
| Transportation & Warehousing | 50 (67.6%) | 24 (32.4%) |
| Utilities | 0 (0.0%) | 0 (0.0%) |
| Information | 0 (0.0%) | 0 (0.0%) |
| Finance & Insurance | 30 (100.0%) | 0 (0.0%) |
| Real Estate, Rental & Leasing | 18 (85.7%) | 3 (14.3%) |
| Professional & Scientific | 131 (42.1%) | 180 (57.9%) |
| Enterprise Management | 0 (0.0%) | 0 (0.0%) |
| Administrative & Support | 88 (61.5%) | 55 (38.5%) |
| Educational Services | 115 (28.4%) | 290 (71.6%) |
| Health Care & Social Assistance | 25 (13.2%) | 165 (86.8%) |
| Arts, Entertainment & Recreation | 20 (100.0%) | 0 (0.0%) |
| Accommodation & Food Services | 121 (58.2%) | 87 (41.8%) |
| Public Administration | 0 (0.0%) | 0 (0.0%) |
| Total | 1,248 (54.3%) | 1,051 (45.7%) |
Education in Gang Mills
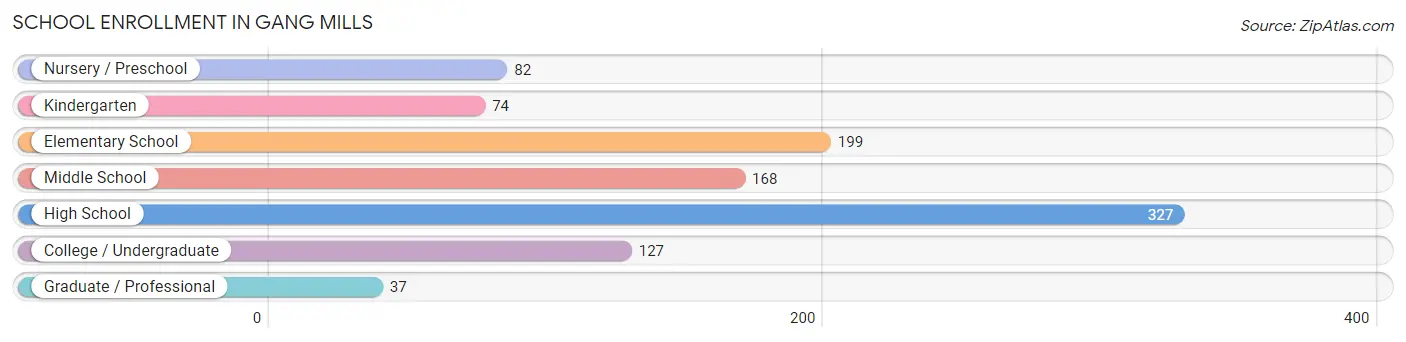
School Enrollment in Gang Mills
The most common levels of schooling among the 1,014 students in Gang Mills are high school (327 | 32.3%), elementary school (199 | 19.6%), and middle school (168 | 16.6%).
| School Level | # Students | % Students |
| Nursery / Preschool | 82 | 8.1% |
| Kindergarten | 74 | 7.3% |
| Elementary School | 199 | 19.6% |
| Middle School | 168 | 16.6% |
| High School | 327 | 32.3% |
| College / Undergraduate | 127 | 12.5% |
| Graduate / Professional | 37 | 3.6% |
| Total | 1,014 | 100.0% |
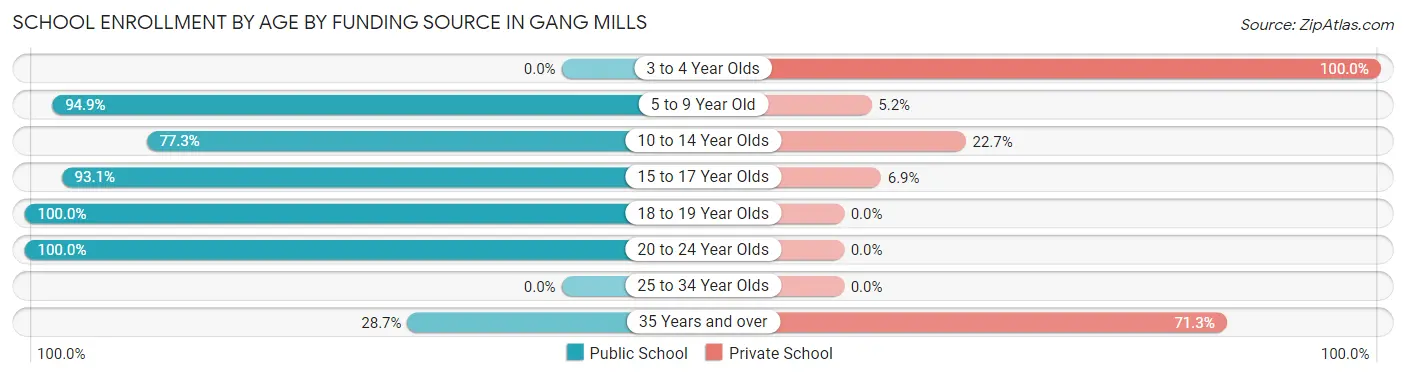
School Enrollment by Age by Funding Source in Gang Mills
Out of a total of 1,014 students who are enrolled in schools in Gang Mills, 218 (21.5%) attend a private institution, while the remaining 796 (78.5%) are enrolled in public schools. The age group of 3 to 4 year olds has the highest likelihood of being enrolled in private schools, with 68 (100.0% in the age bracket) enrolled. Conversely, the age group of 18 to 19 year olds has the lowest likelihood of being enrolled in a private school, with 123 (100.0% in the age bracket) attending a public institution.
| Age Bracket | Public School | Private School |
| 3 to 4 Year Olds | 0 (0.0%) | 68 (100.0%) |
| 5 to 9 Year Old | 258 (94.9%) | 14 (5.1%) |
| 10 to 14 Year Olds | 143 (77.3%) | 42 (22.7%) |
| 15 to 17 Year Olds | 229 (93.1%) | 17 (6.9%) |
| 18 to 19 Year Olds | 123 (100.0%) | 0 (0.0%) |
| 20 to 24 Year Olds | 12 (100.0%) | 0 (0.0%) |
| 25 to 34 Year Olds | 0 (0.0%) | 0 (0.0%) |
| 35 Years and over | 31 (28.7%) | 77 (71.3%) |
| Total | 796 (78.5%) | 218 (21.5%) |
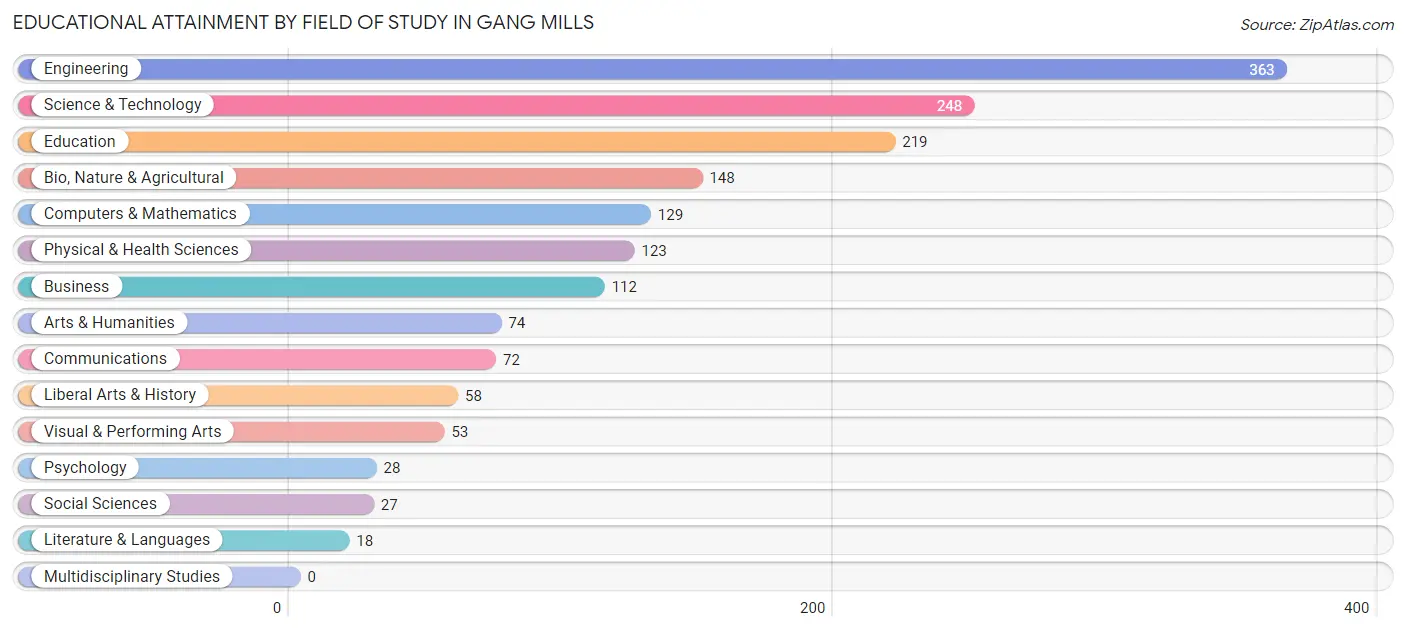
Educational Attainment by Field of Study in Gang Mills
Engineering (363 | 21.7%), science & technology (248 | 14.8%), education (219 | 13.1%), bio, nature & agricultural (148 | 8.8%), and computers & mathematics (129 | 7.7%) are the most common fields of study among 1,672 individuals in Gang Mills who have obtained a bachelor's degree or higher.
| Field of Study | # Graduates | % Graduates |
| Computers & Mathematics | 129 | 7.7% |
| Bio, Nature & Agricultural | 148 | 8.8% |
| Physical & Health Sciences | 123 | 7.4% |
| Psychology | 28 | 1.7% |
| Social Sciences | 27 | 1.6% |
| Engineering | 363 | 21.7% |
| Multidisciplinary Studies | 0 | 0.0% |
| Science & Technology | 248 | 14.8% |
| Business | 112 | 6.7% |
| Education | 219 | 13.1% |
| Literature & Languages | 18 | 1.1% |
| Liberal Arts & History | 58 | 3.5% |
| Visual & Performing Arts | 53 | 3.2% |
| Communications | 72 | 4.3% |
| Arts & Humanities | 74 | 4.4% |
| Total | 1,672 | 100.0% |
Transportation & Commute in Gang Mills
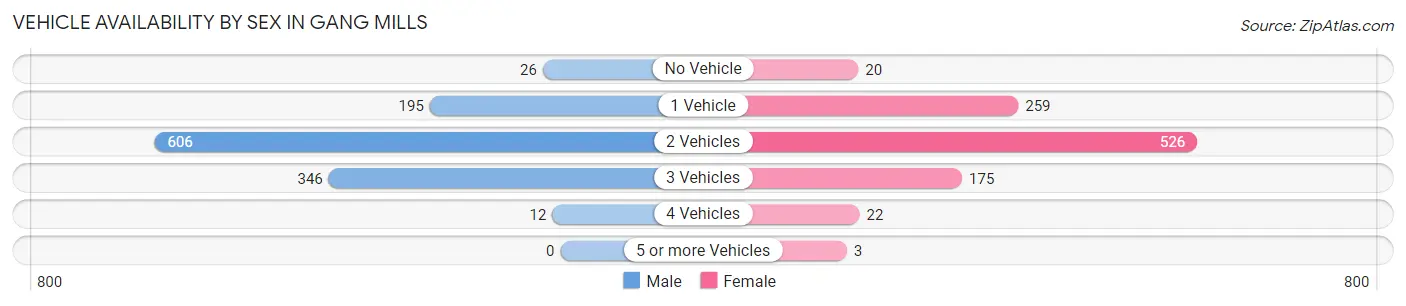
Vehicle Availability by Sex in Gang Mills
The most prevalent vehicle ownership categories in Gang Mills are males with 2 vehicles (606, accounting for 51.1%) and females with 2 vehicles (526, making up 60.3%).
| Vehicles Available | Male | Female |
| No Vehicle | 26 (2.2%) | 20 (2.0%) |
| 1 Vehicle | 195 (16.5%) | 259 (25.8%) |
| 2 Vehicles | 606 (51.1%) | 526 (52.3%) |
| 3 Vehicles | 346 (29.2%) | 175 (17.4%) |
| 4 Vehicles | 12 (1.0%) | 22 (2.2%) |
| 5 or more Vehicles | 0 (0.0%) | 3 (0.3%) |
| Total | 1,185 (100.0%) | 1,005 (100.0%) |
Commute Time in Gang Mills
The most frequently occuring commute durations in Gang Mills are 5 to 9 minutes (848 commuters, 41.6%), 10 to 14 minutes (728 commuters, 35.7%), and 15 to 19 minutes (236 commuters, 11.6%).
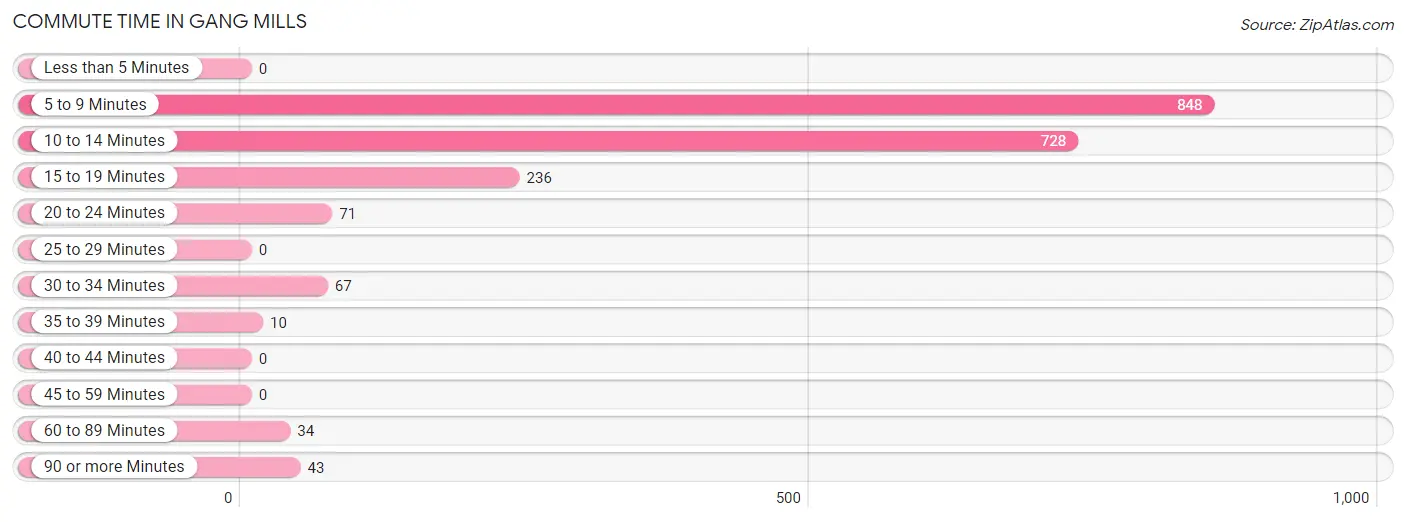
| Commute Time | # Commuters | % Commuters |
| Less than 5 Minutes | 0 | 0.0% |
| 5 to 9 Minutes | 848 | 41.6% |
| 10 to 14 Minutes | 728 | 35.7% |
| 15 to 19 Minutes | 236 | 11.6% |
| 20 to 24 Minutes | 71 | 3.5% |
| 25 to 29 Minutes | 0 | 0.0% |
| 30 to 34 Minutes | 67 | 3.3% |
| 35 to 39 Minutes | 10 | 0.5% |
| 40 to 44 Minutes | 0 | 0.0% |
| 45 to 59 Minutes | 0 | 0.0% |
| 60 to 89 Minutes | 34 | 1.7% |
| 90 or more Minutes | 43 | 2.1% |
Commute Time by Sex in Gang Mills
The most common commute times in Gang Mills are 5 to 9 minutes (541 commuters, 46.4%) for males and 5 to 9 minutes (307 commuters, 35.2%) for females.
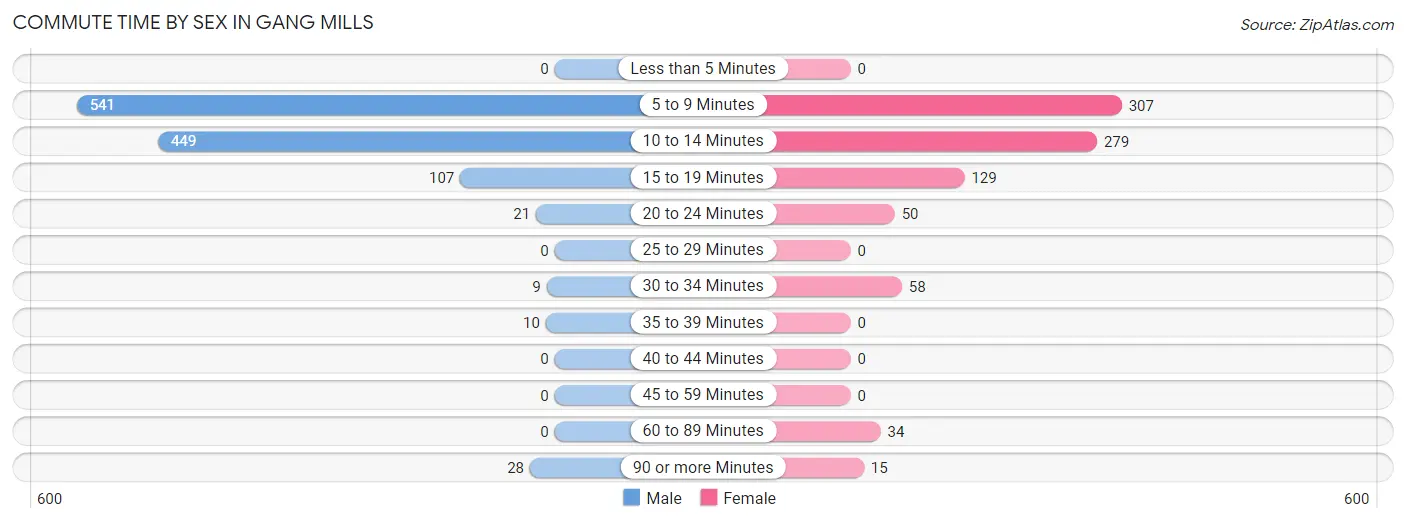
| Commute Time | Male | Female |
| Less than 5 Minutes | 0 (0.0%) | 0 (0.0%) |
| 5 to 9 Minutes | 541 (46.4%) | 307 (35.2%) |
| 10 to 14 Minutes | 449 (38.5%) | 279 (32.0%) |
| 15 to 19 Minutes | 107 (9.2%) | 129 (14.8%) |
| 20 to 24 Minutes | 21 (1.8%) | 50 (5.7%) |
| 25 to 29 Minutes | 0 (0.0%) | 0 (0.0%) |
| 30 to 34 Minutes | 9 (0.8%) | 58 (6.7%) |
| 35 to 39 Minutes | 10 (0.9%) | 0 (0.0%) |
| 40 to 44 Minutes | 0 (0.0%) | 0 (0.0%) |
| 45 to 59 Minutes | 0 (0.0%) | 0 (0.0%) |
| 60 to 89 Minutes | 0 (0.0%) | 34 (3.9%) |
| 90 or more Minutes | 28 (2.4%) | 15 (1.7%) |
Time of Departure to Work by Sex in Gang Mills
The most frequent times of departure to work in Gang Mills are 7:30 AM to 7:59 AM (362, 31.1%) for males and 7:30 AM to 7:59 AM (260, 29.8%) for females.
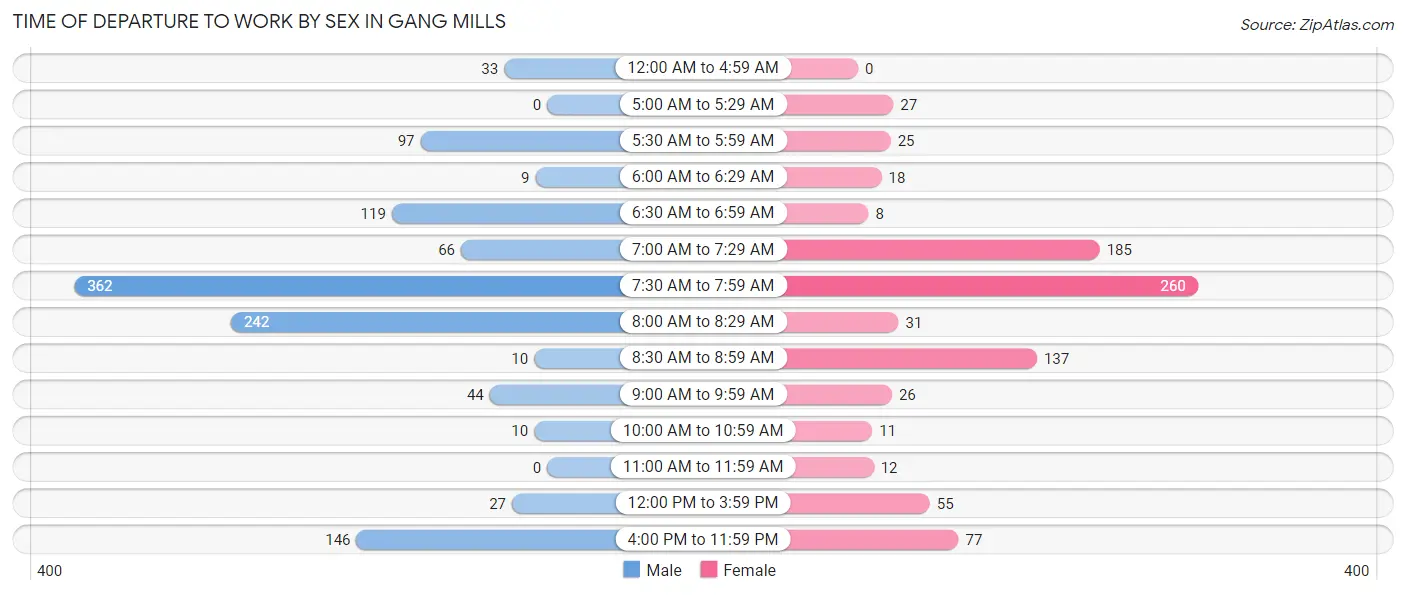
| Time of Departure | Male | Female |
| 12:00 AM to 4:59 AM | 33 (2.8%) | 0 (0.0%) |
| 5:00 AM to 5:29 AM | 0 (0.0%) | 27 (3.1%) |
| 5:30 AM to 5:59 AM | 97 (8.3%) | 25 (2.9%) |
| 6:00 AM to 6:29 AM | 9 (0.8%) | 18 (2.1%) |
| 6:30 AM to 6:59 AM | 119 (10.2%) | 8 (0.9%) |
| 7:00 AM to 7:29 AM | 66 (5.7%) | 185 (21.2%) |
| 7:30 AM to 7:59 AM | 362 (31.1%) | 260 (29.8%) |
| 8:00 AM to 8:29 AM | 242 (20.8%) | 31 (3.6%) |
| 8:30 AM to 8:59 AM | 10 (0.9%) | 137 (15.7%) |
| 9:00 AM to 9:59 AM | 44 (3.8%) | 26 (3.0%) |
| 10:00 AM to 10:59 AM | 10 (0.9%) | 11 (1.3%) |
| 11:00 AM to 11:59 AM | 0 (0.0%) | 12 (1.4%) |
| 12:00 PM to 3:59 PM | 27 (2.3%) | 55 (6.3%) |
| 4:00 PM to 11:59 PM | 146 (12.5%) | 77 (8.8%) |
| Total | 1,165 (100.0%) | 872 (100.0%) |
Housing Occupancy in Gang Mills
Occupancy by Ownership in Gang Mills
Of the total 1,819 dwellings in Gang Mills, owner-occupied units account for 1,118 (61.5%), while renter-occupied units make up 701 (38.5%).
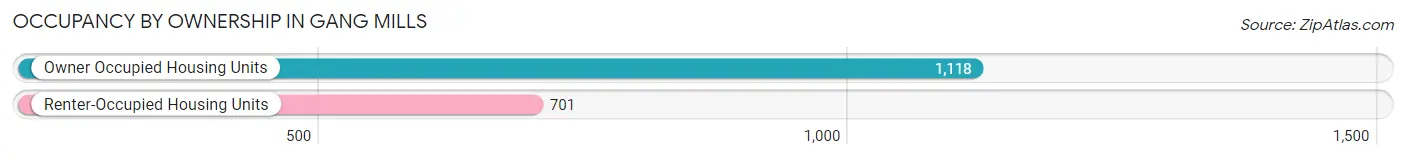
| Occupancy | # Housing Units | % Housing Units |
| Owner Occupied Housing Units | 1,118 | 61.5% |
| Renter-Occupied Housing Units | 701 | 38.5% |
| Total Occupied Housing Units | 1,819 | 100.0% |
Occupancy by Household Size in Gang Mills
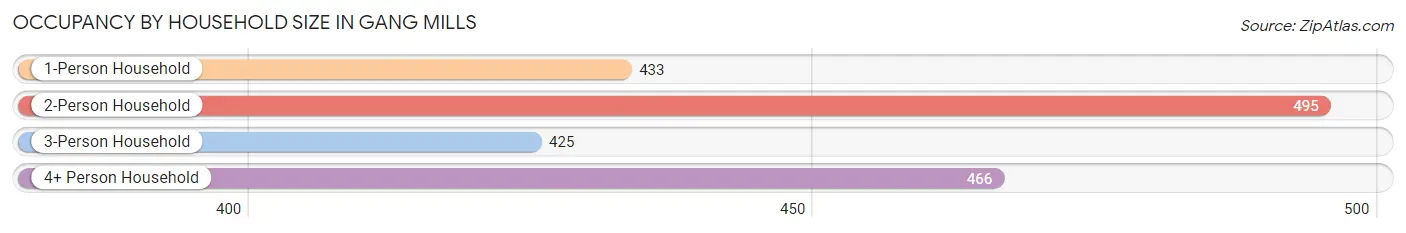
| Household Size | # Housing Units | % Housing Units |
| 1-Person Household | 433 | 23.8% |
| 2-Person Household | 495 | 27.2% |
| 3-Person Household | 425 | 23.4% |
| 4+ Person Household | 466 | 25.6% |
| Total Housing Units | 1,819 | 100.0% |
Occupancy by Ownership by Household Size in Gang Mills
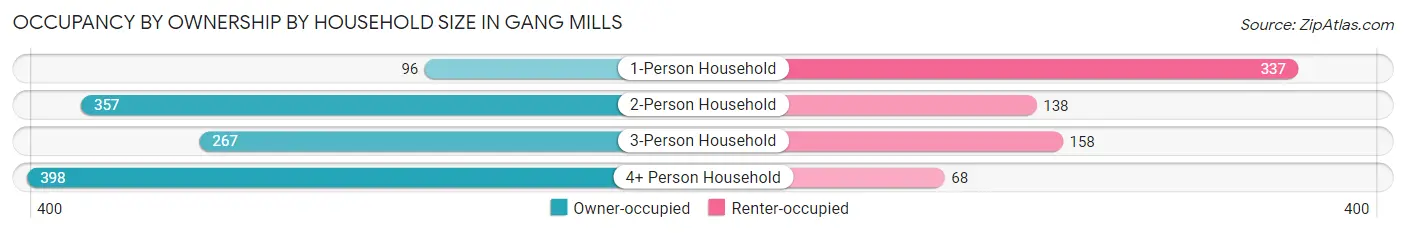
| Household Size | Owner-occupied | Renter-occupied |
| 1-Person Household | 96 (22.2%) | 337 (77.8%) |
| 2-Person Household | 357 (72.1%) | 138 (27.9%) |
| 3-Person Household | 267 (62.8%) | 158 (37.2%) |
| 4+ Person Household | 398 (85.4%) | 68 (14.6%) |
| Total Housing Units | 1,118 (61.5%) | 701 (38.5%) |
Occupancy by Educational Attainment in Gang Mills
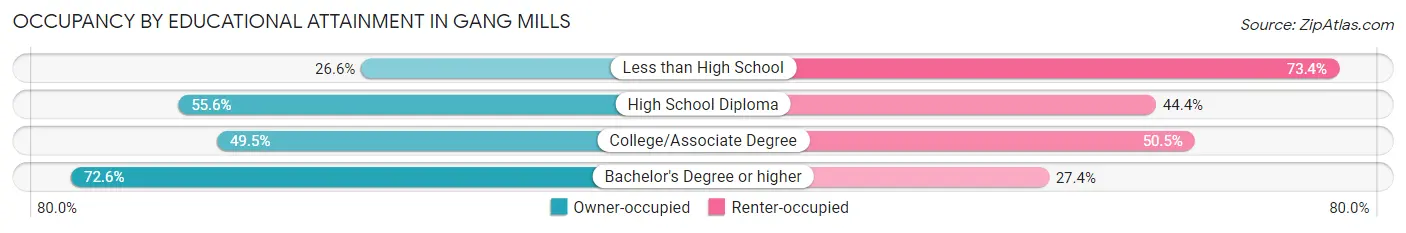
| Household Size | Owner-occupied | Renter-occupied |
| Less than High School | 37 (26.6%) | 102 (73.4%) |
| High School Diploma | 163 (55.6%) | 130 (44.4%) |
| College/Associate Degree | 191 (49.5%) | 195 (50.5%) |
| Bachelor's Degree or higher | 727 (72.6%) | 274 (27.4%) |
Occupancy by Age of Householder in Gang Mills
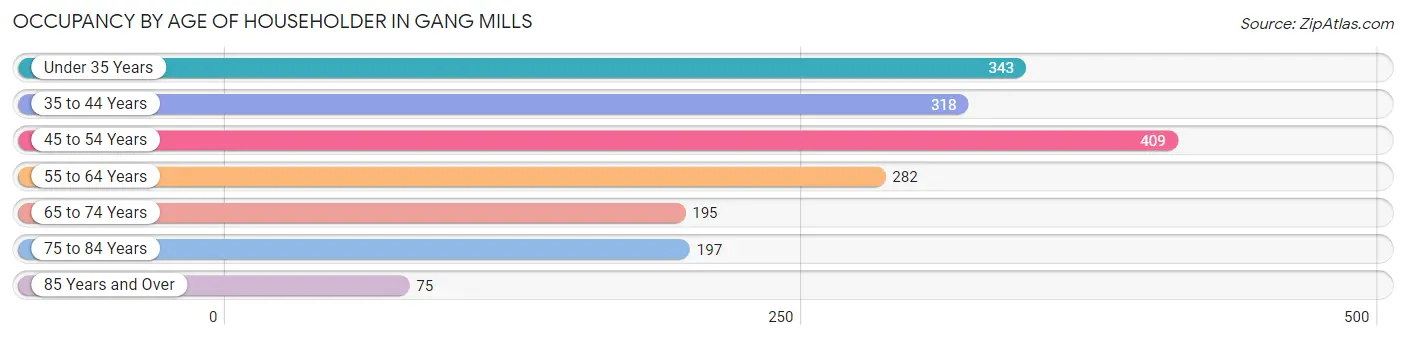
| Age Bracket | # Households | % Households |
| Under 35 Years | 343 | 18.9% |
| 35 to 44 Years | 318 | 17.5% |
| 45 to 54 Years | 409 | 22.5% |
| 55 to 64 Years | 282 | 15.5% |
| 65 to 74 Years | 195 | 10.7% |
| 75 to 84 Years | 197 | 10.8% |
| 85 Years and Over | 75 | 4.1% |
| Total | 1,819 | 100.0% |
Housing Finances in Gang Mills
Median Income by Occupancy in Gang Mills
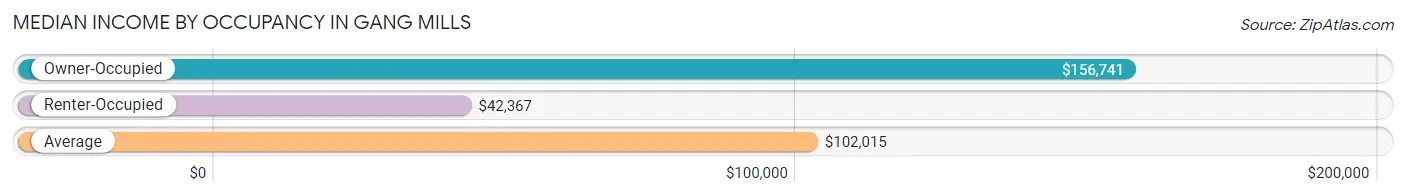
| Occupancy Type | # Households | Median Income |
| Owner-Occupied | 1,118 (61.5%) | $156,741 |
| Renter-Occupied | 701 (38.5%) | $42,367 |
| Average | 1,819 (100.0%) | $102,015 |
Occupancy by Householder Income Bracket in Gang Mills
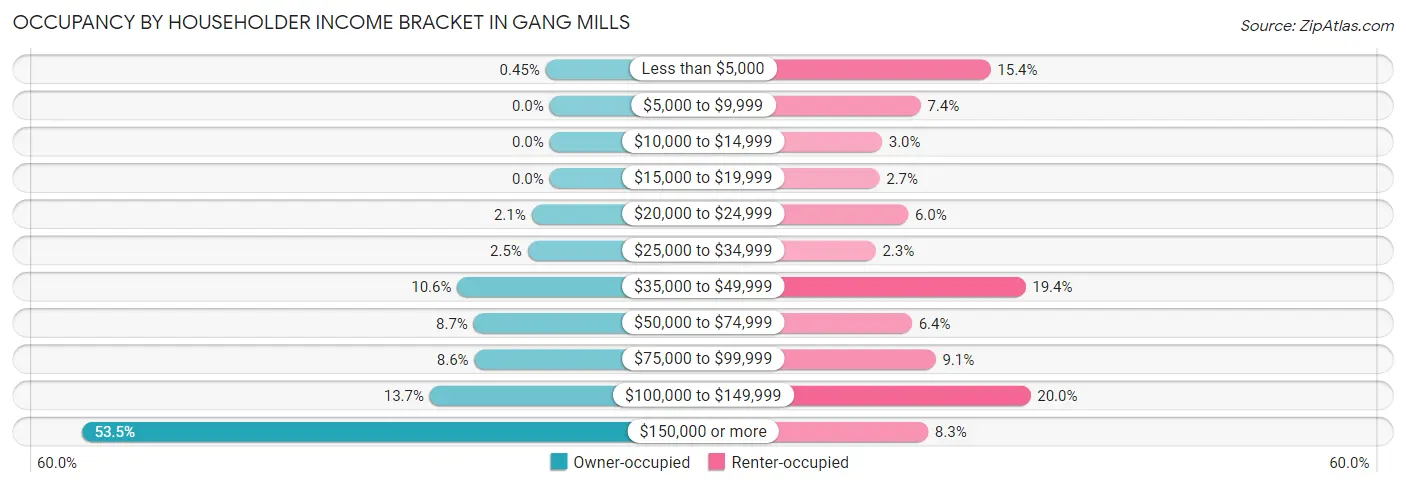
| Income Bracket | Owner-occupied | Renter-occupied |
| Less than $5,000 | 5 (0.4%) | 108 (15.4%) |
| $5,000 to $9,999 | 0 (0.0%) | 52 (7.4%) |
| $10,000 to $14,999 | 0 (0.0%) | 21 (3.0%) |
| $15,000 to $19,999 | 0 (0.0%) | 19 (2.7%) |
| $20,000 to $24,999 | 23 (2.1%) | 42 (6.0%) |
| $25,000 to $34,999 | 28 (2.5%) | 16 (2.3%) |
| $35,000 to $49,999 | 118 (10.5%) | 136 (19.4%) |
| $50,000 to $74,999 | 97 (8.7%) | 45 (6.4%) |
| $75,000 to $99,999 | 96 (8.6%) | 64 (9.1%) |
| $100,000 to $149,999 | 153 (13.7%) | 140 (20.0%) |
| $150,000 or more | 598 (53.5%) | 58 (8.3%) |
| Total | 1,118 (100.0%) | 701 (100.0%) |
Monthly Housing Cost Tiers in Gang Mills
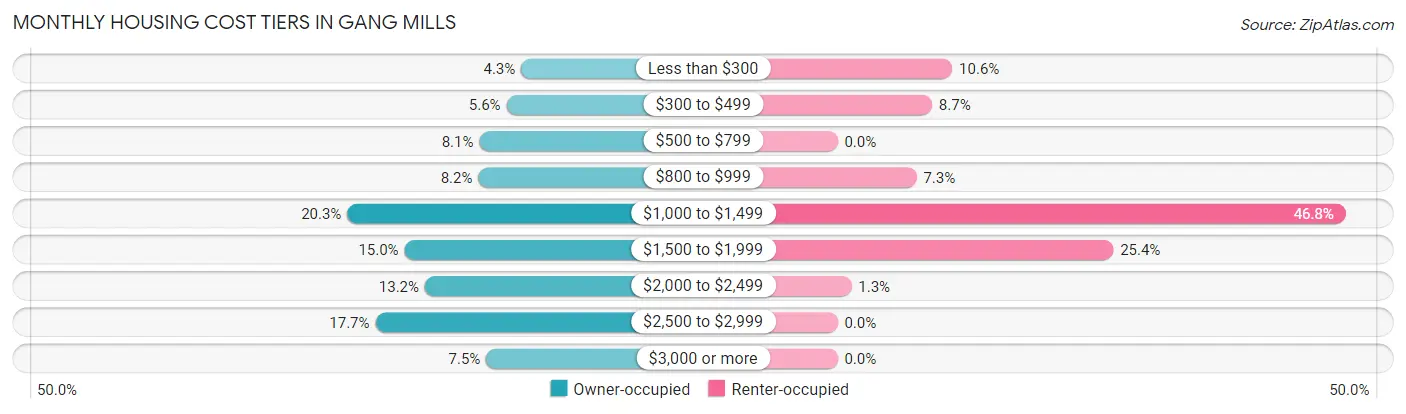
| Monthly Cost | Owner-occupied | Renter-occupied |
| Less than $300 | 48 (4.3%) | 74 (10.6%) |
| $300 to $499 | 63 (5.6%) | 61 (8.7%) |
| $500 to $799 | 91 (8.1%) | 0 (0.0%) |
| $800 to $999 | 92 (8.2%) | 51 (7.3%) |
| $1,000 to $1,499 | 227 (20.3%) | 328 (46.8%) |
| $1,500 to $1,999 | 168 (15.0%) | 178 (25.4%) |
| $2,000 to $2,499 | 147 (13.2%) | 9 (1.3%) |
| $2,500 to $2,999 | 198 (17.7%) | 0 (0.0%) |
| $3,000 or more | 84 (7.5%) | 0 (0.0%) |
| Total | 1,118 (100.0%) | 701 (100.0%) |
Physical Housing Characteristics in Gang Mills
Housing Structures in Gang Mills
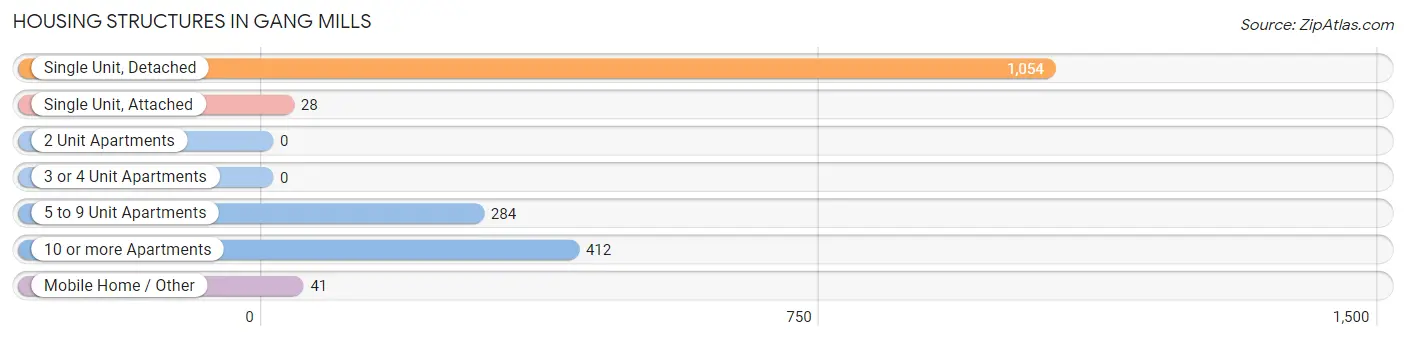
| Structure Type | # Housing Units | % Housing Units |
| Single Unit, Detached | 1,054 | 57.9% |
| Single Unit, Attached | 28 | 1.5% |
| 2 Unit Apartments | 0 | 0.0% |
| 3 or 4 Unit Apartments | 0 | 0.0% |
| 5 to 9 Unit Apartments | 284 | 15.6% |
| 10 or more Apartments | 412 | 22.7% |
| Mobile Home / Other | 41 | 2.2% |
| Total | 1,819 | 100.0% |
Housing Structures by Occupancy in Gang Mills
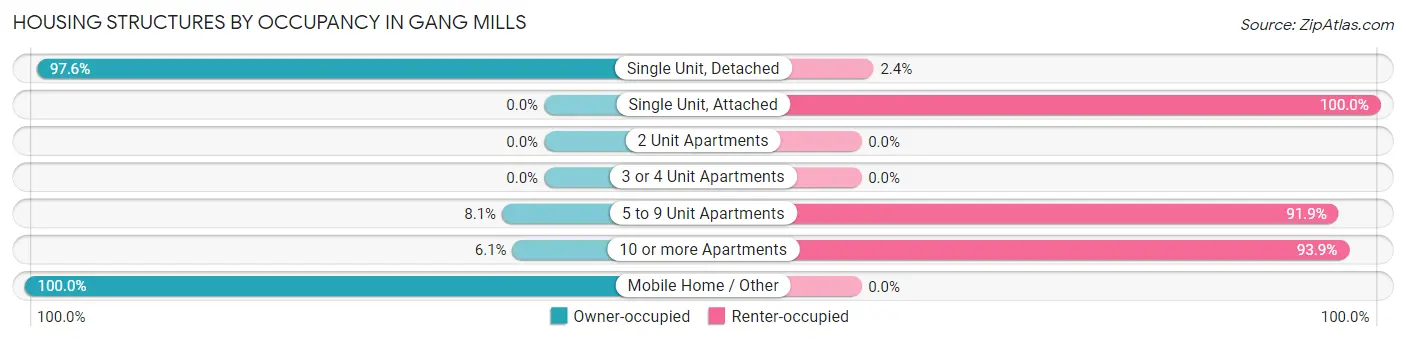
| Structure Type | Owner-occupied | Renter-occupied |
| Single Unit, Detached | 1,029 (97.6%) | 25 (2.4%) |
| Single Unit, Attached | 0 (0.0%) | 28 (100.0%) |
| 2 Unit Apartments | 0 (0.0%) | 0 (0.0%) |
| 3 or 4 Unit Apartments | 0 (0.0%) | 0 (0.0%) |
| 5 to 9 Unit Apartments | 23 (8.1%) | 261 (91.9%) |
| 10 or more Apartments | 25 (6.1%) | 387 (93.9%) |
| Mobile Home / Other | 41 (100.0%) | 0 (0.0%) |
| Total | 1,118 (61.5%) | 701 (38.5%) |
Housing Structures by Number of Rooms in Gang Mills
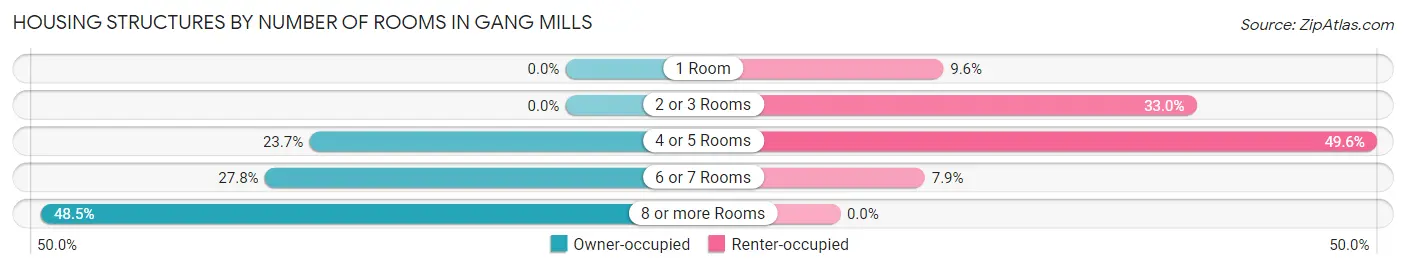
| Number of Rooms | Owner-occupied | Renter-occupied |
| 1 Room | 0 (0.0%) | 67 (9.6%) |
| 2 or 3 Rooms | 0 (0.0%) | 231 (33.0%) |
| 4 or 5 Rooms | 265 (23.7%) | 348 (49.6%) |
| 6 or 7 Rooms | 311 (27.8%) | 55 (7.9%) |
| 8 or more Rooms | 542 (48.5%) | 0 (0.0%) |
| Total | 1,118 (100.0%) | 701 (100.0%) |
Housing Structure by Heating Type in Gang Mills
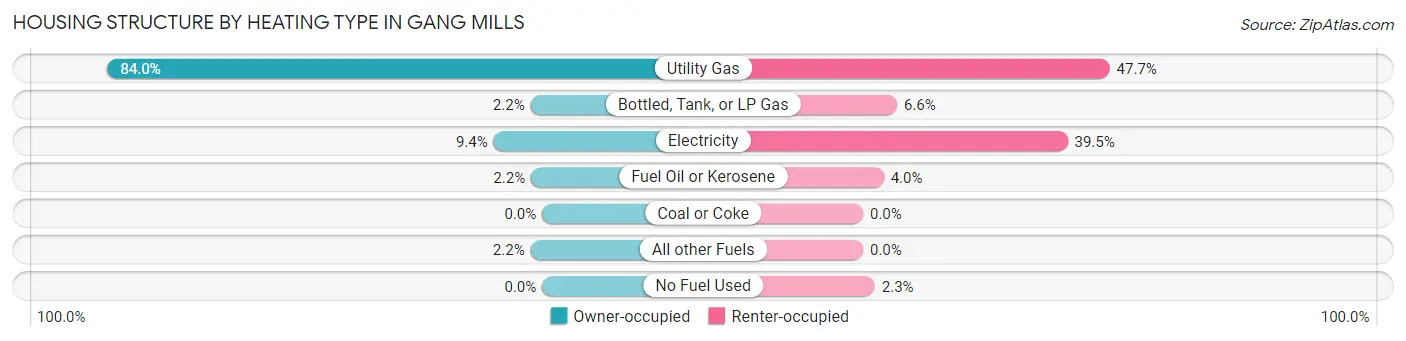
| Heating Type | Owner-occupied | Renter-occupied |
| Utility Gas | 939 (84.0%) | 334 (47.6%) |
| Bottled, Tank, or LP Gas | 25 (2.2%) | 46 (6.6%) |
| Electricity | 105 (9.4%) | 277 (39.5%) |
| Fuel Oil or Kerosene | 24 (2.1%) | 28 (4.0%) |
| Coal or Coke | 0 (0.0%) | 0 (0.0%) |
| All other Fuels | 25 (2.2%) | 0 (0.0%) |
| No Fuel Used | 0 (0.0%) | 16 (2.3%) |
| Total | 1,118 (100.0%) | 701 (100.0%) |
Household Vehicle Usage in Gang Mills
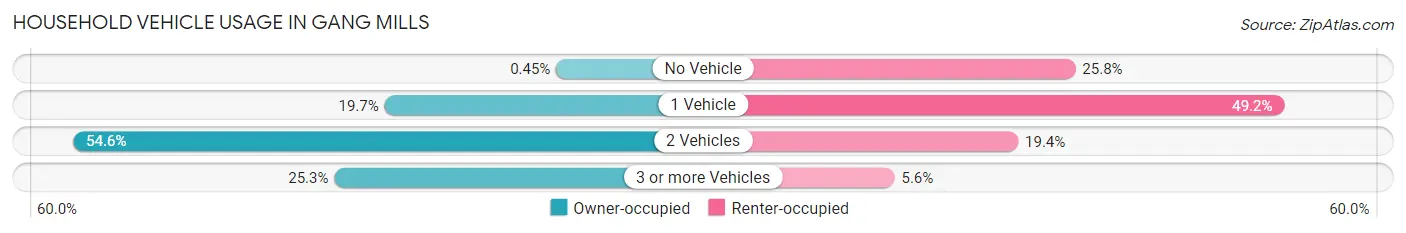
| Vehicles per Household | Owner-occupied | Renter-occupied |
| No Vehicle | 5 (0.4%) | 181 (25.8%) |
| 1 Vehicle | 220 (19.7%) | 345 (49.2%) |
| 2 Vehicles | 610 (54.6%) | 136 (19.4%) |
| 3 or more Vehicles | 283 (25.3%) | 39 (5.6%) |
| Total | 1,118 (100.0%) | 701 (100.0%) |
Real Estate & Mortgages in Gang Mills
Real Estate and Mortgage Overview in Gang Mills
| Characteristic | Without Mortgage | With Mortgage |
| Housing Units | 325 | 793 |
| Median Property Value | $137,100 | $270,500 |
| Median Household Income | - | - |
| Monthly Housing Costs | $724 | $84 |
| Real Estate Taxes | $3,693 | $0 |
Property Value by Mortgage Status in Gang Mills
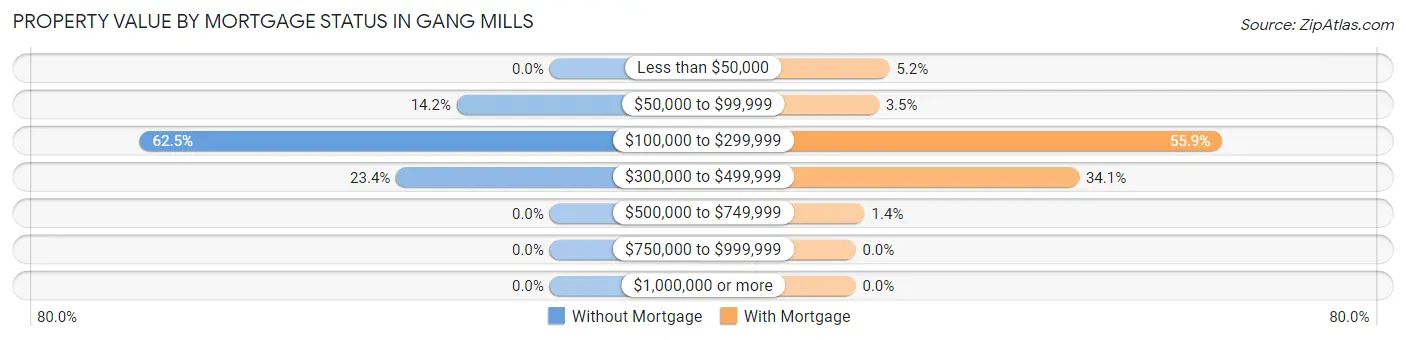
| Property Value | Without Mortgage | With Mortgage |
| Less than $50,000 | 0 (0.0%) | 41 (5.2%) |
| $50,000 to $99,999 | 46 (14.1%) | 28 (3.5%) |
| $100,000 to $299,999 | 203 (62.5%) | 443 (55.9%) |
| $300,000 to $499,999 | 76 (23.4%) | 270 (34.1%) |
| $500,000 to $749,999 | 0 (0.0%) | 11 (1.4%) |
| $750,000 to $999,999 | 0 (0.0%) | 0 (0.0%) |
| $1,000,000 or more | 0 (0.0%) | 0 (0.0%) |
| Total | 325 (100.0%) | 793 (100.0%) |
Household Income by Mortgage Status in Gang Mills
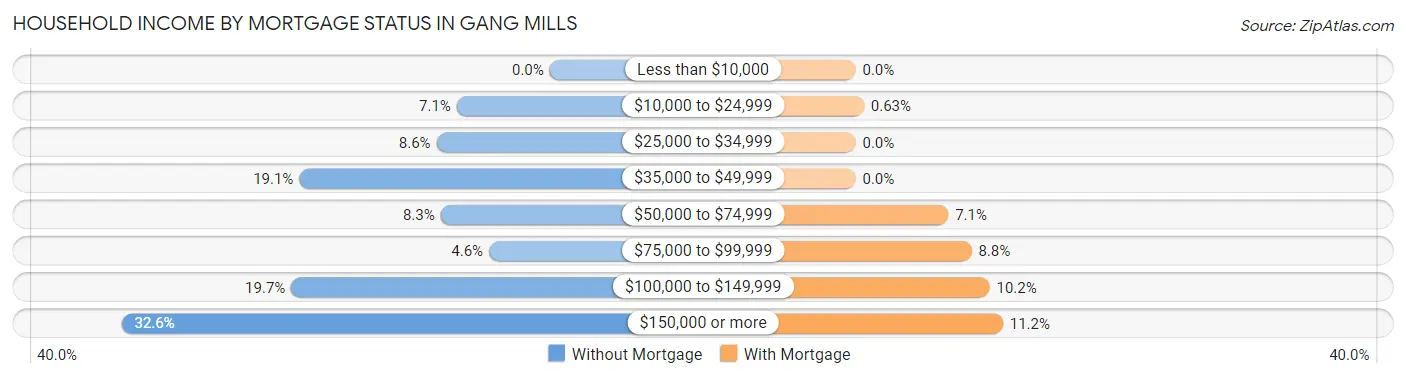
| Household Income | Without Mortgage | With Mortgage |
| Less than $10,000 | 0 (0.0%) | 0 (0.0%) |
| $10,000 to $24,999 | 23 (7.1%) | 5 (0.6%) |
| $25,000 to $34,999 | 28 (8.6%) | 0 (0.0%) |
| $35,000 to $49,999 | 62 (19.1%) | 0 (0.0%) |
| $50,000 to $74,999 | 27 (8.3%) | 56 (7.1%) |
| $75,000 to $99,999 | 15 (4.6%) | 70 (8.8%) |
| $100,000 to $149,999 | 64 (19.7%) | 81 (10.2%) |
| $150,000 or more | 106 (32.6%) | 89 (11.2%) |
| Total | 325 (100.0%) | 793 (100.0%) |
Property Value to Household Income Ratio in Gang Mills
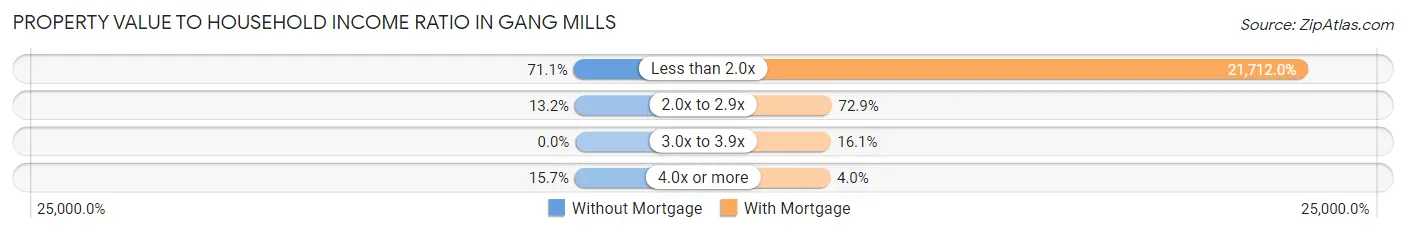
| Value-to-Income Ratio | Without Mortgage | With Mortgage |
| Less than 2.0x | 231 (71.1%) | 172,176 (21,712.0%) |
| 2.0x to 2.9x | 43 (13.2%) | 578 (72.9%) |
| 3.0x to 3.9x | 0 (0.0%) | 128 (16.1%) |
| 4.0x or more | 51 (15.7%) | 32 (4.0%) |
| Total | 325 (100.0%) | 793 (100.0%) |
Real Estate Taxes by Mortgage Status in Gang Mills
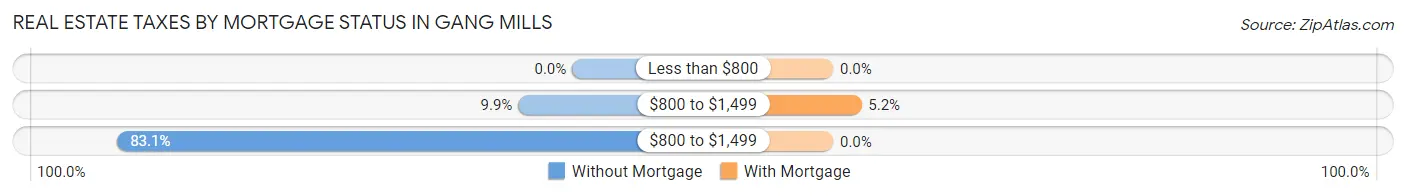
| Property Taxes | Without Mortgage | With Mortgage |
| Less than $800 | 0 (0.0%) | 0 (0.0%) |
| $800 to $1,499 | 32 (9.9%) | 41 (5.2%) |
| $800 to $1,499 | 270 (83.1%) | 0 (0.0%) |
| Total | 325 (100.0%) | 793 (100.0%) |
Health & Disability in Gang Mills
Health Insurance Coverage by Age in Gang Mills
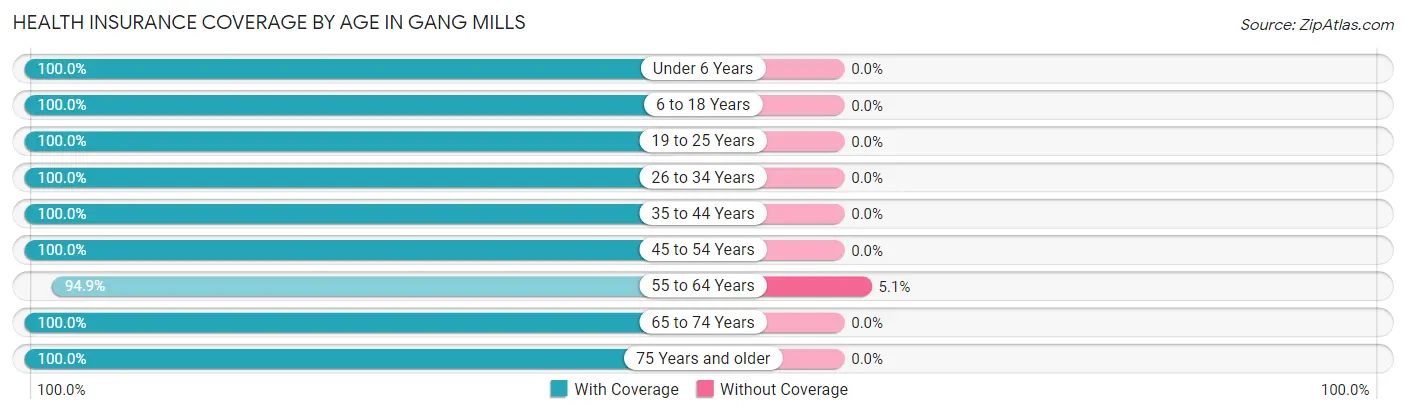
| Age Bracket | With Coverage | Without Coverage |
| Under 6 Years | 389 (100.0%) | 0 (0.0%) |
| 6 to 18 Years | 779 (100.0%) | 0 (0.0%) |
| 19 to 25 Years | 273 (100.0%) | 0 (0.0%) |
| 26 to 34 Years | 462 (100.0%) | 0 (0.0%) |
| 35 to 44 Years | 536 (100.0%) | 0 (0.0%) |
| 45 to 54 Years | 743 (100.0%) | 0 (0.0%) |
| 55 to 64 Years | 578 (94.9%) | 31 (5.1%) |
| 65 to 74 Years | 299 (100.0%) | 0 (0.0%) |
| 75 Years and older | 368 (100.0%) | 0 (0.0%) |
| Total | 4,427 (99.3%) | 31 (0.7%) |
Health Insurance Coverage by Citizenship Status in Gang Mills
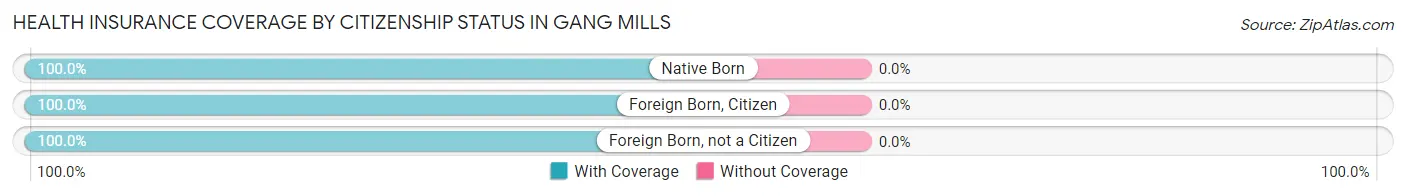
| Citizenship Status | With Coverage | Without Coverage |
| Native Born | 389 (100.0%) | 0 (0.0%) |
| Foreign Born, Citizen | 779 (100.0%) | 0 (0.0%) |
| Foreign Born, not a Citizen | 273 (100.0%) | 0 (0.0%) |
Health Insurance Coverage by Household Income in Gang Mills
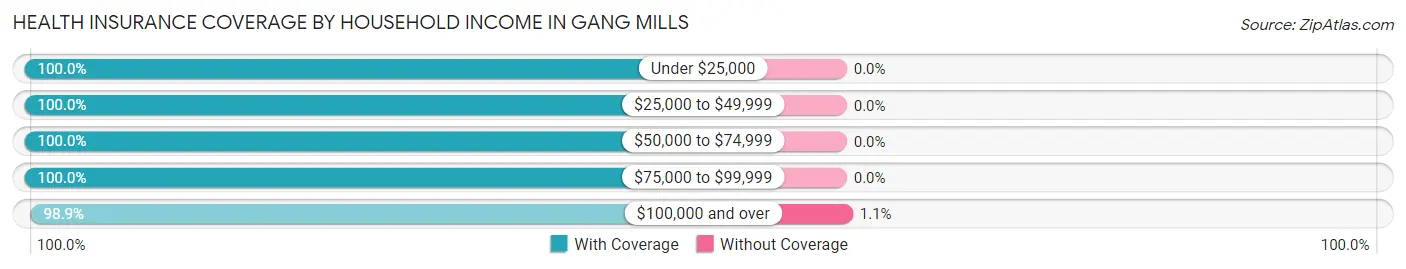
| Household Income | With Coverage | Without Coverage |
| Under $25,000 | 414 (100.0%) | 0 (0.0%) |
| $25,000 to $49,999 | 664 (100.0%) | 0 (0.0%) |
| $50,000 to $74,999 | 269 (100.0%) | 0 (0.0%) |
| $75,000 to $99,999 | 376 (100.0%) | 0 (0.0%) |
| $100,000 and over | 2,685 (98.9%) | 31 (1.1%) |
Public vs Private Health Insurance Coverage by Age in Gang Mills
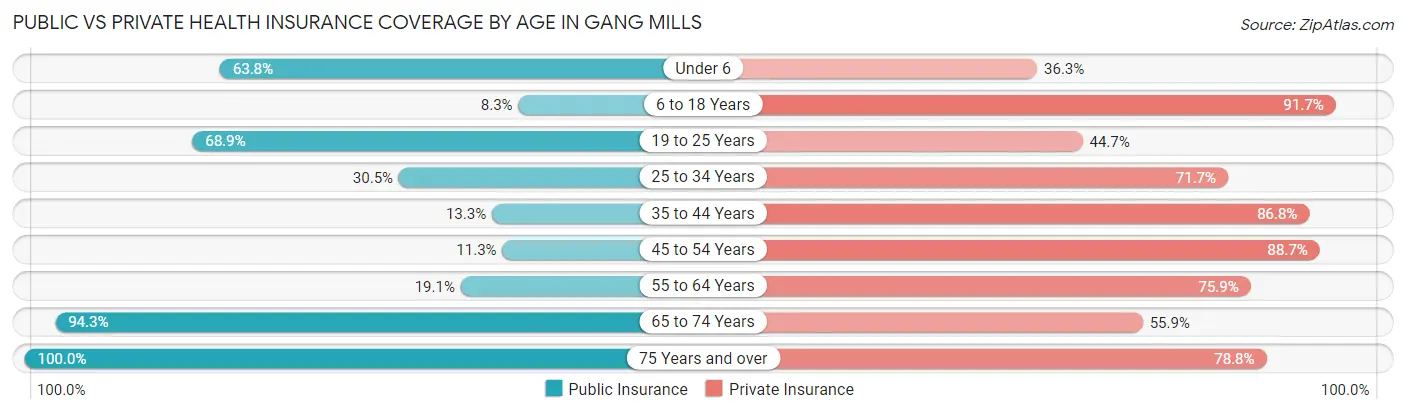
| Age Bracket | Public Insurance | Private Insurance |
| Under 6 | 248 (63.7%) | 141 (36.2%) |
| 6 to 18 Years | 65 (8.3%) | 714 (91.7%) |
| 19 to 25 Years | 188 (68.9%) | 122 (44.7%) |
| 25 to 34 Years | 141 (30.5%) | 331 (71.7%) |
| 35 to 44 Years | 71 (13.3%) | 465 (86.8%) |
| 45 to 54 Years | 84 (11.3%) | 659 (88.7%) |
| 55 to 64 Years | 116 (19.1%) | 462 (75.9%) |
| 65 to 74 Years | 282 (94.3%) | 167 (55.8%) |
| 75 Years and over | 368 (100.0%) | 290 (78.8%) |
| Total | 1,563 (35.1%) | 3,351 (75.2%) |
Disability Status by Sex by Age in Gang Mills
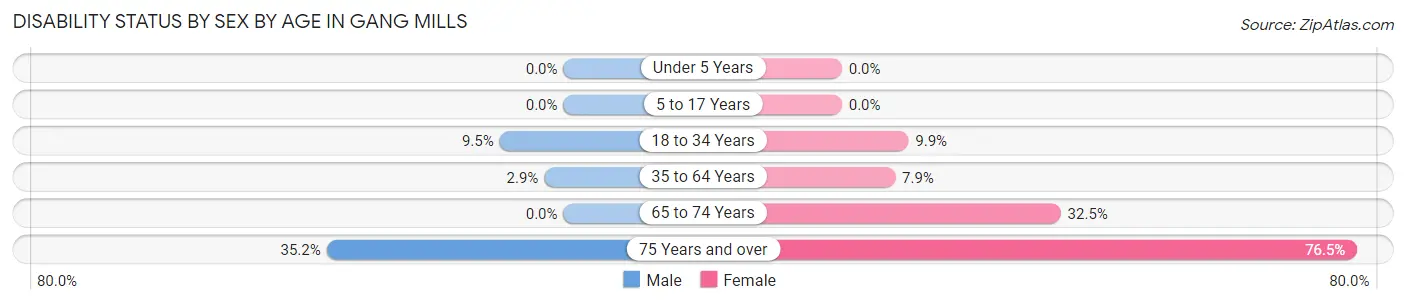
| Age Bracket | Male | Female |
| Under 5 Years | 0 (0.0%) | 0 (0.0%) |
| 5 to 17 Years | 0 (0.0%) | 0 (0.0%) |
| 18 to 34 Years | 41 (9.5%) | 41 (9.9%) |
| 35 to 64 Years | 25 (2.9%) | 80 (7.9%) |
| 65 to 74 Years | 0 (0.0%) | 39 (32.5%) |
| 75 Years and over | 32 (35.2%) | 212 (76.5%) |
Disability Class by Sex by Age in Gang Mills
Disability Class: Hearing Difficulty
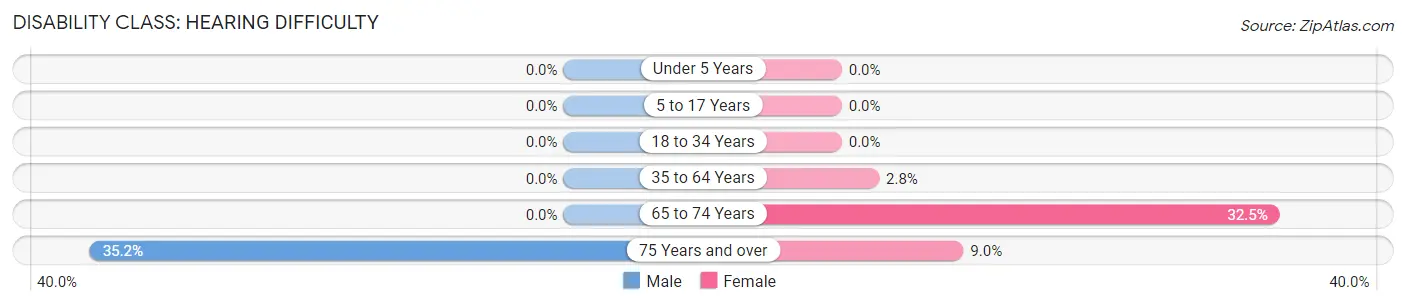
| Age Bracket | Male | Female |
| Under 5 Years | 0 (0.0%) | 0 (0.0%) |
| 5 to 17 Years | 0 (0.0%) | 0 (0.0%) |
| 18 to 34 Years | 0 (0.0%) | 0 (0.0%) |
| 35 to 64 Years | 0 (0.0%) | 28 (2.8%) |
| 65 to 74 Years | 0 (0.0%) | 39 (32.5%) |
| 75 Years and over | 32 (35.2%) | 25 (9.0%) |
Disability Class: Vision Difficulty
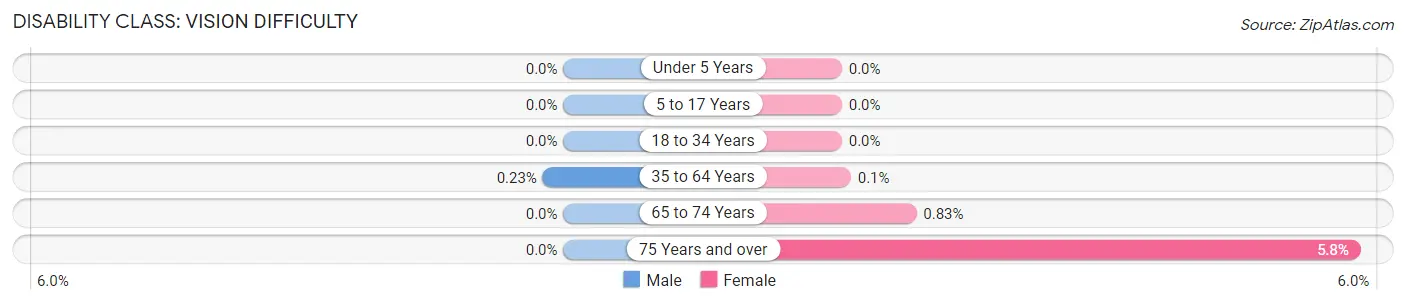
| Age Bracket | Male | Female |
| Under 5 Years | 0 (0.0%) | 0 (0.0%) |
| 5 to 17 Years | 0 (0.0%) | 0 (0.0%) |
| 18 to 34 Years | 0 (0.0%) | 0 (0.0%) |
| 35 to 64 Years | 2 (0.2%) | 1 (0.1%) |
| 65 to 74 Years | 0 (0.0%) | 1 (0.8%) |
| 75 Years and over | 0 (0.0%) | 16 (5.8%) |
Disability Class: Cognitive Difficulty
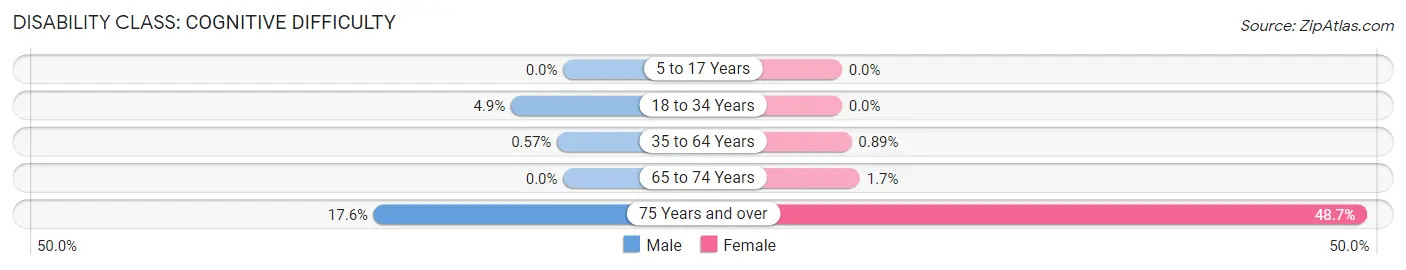
| Age Bracket | Male | Female |
| 5 to 17 Years | 0 (0.0%) | 0 (0.0%) |
| 18 to 34 Years | 21 (4.9%) | 0 (0.0%) |
| 35 to 64 Years | 5 (0.6%) | 9 (0.9%) |
| 65 to 74 Years | 0 (0.0%) | 2 (1.7%) |
| 75 Years and over | 16 (17.6%) | 135 (48.7%) |
Disability Class: Ambulatory Difficulty
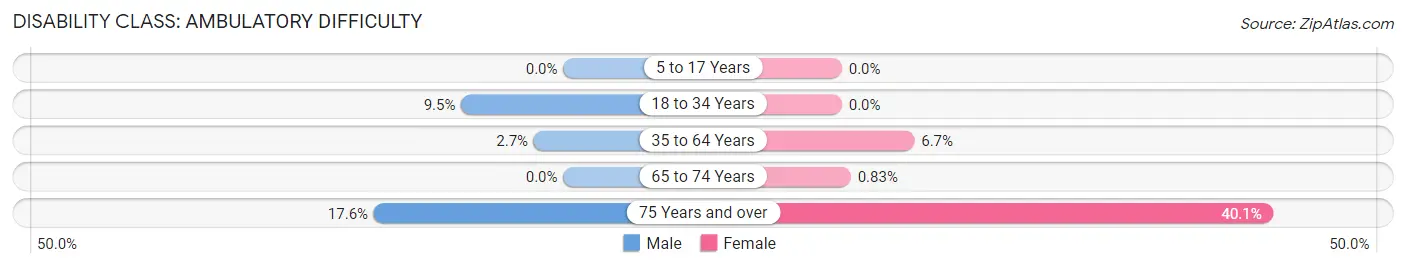
| Age Bracket | Male | Female |
| 5 to 17 Years | 0 (0.0%) | 0 (0.0%) |
| 18 to 34 Years | 41 (9.5%) | 0 (0.0%) |
| 35 to 64 Years | 24 (2.7%) | 68 (6.7%) |
| 65 to 74 Years | 0 (0.0%) | 1 (0.8%) |
| 75 Years and over | 16 (17.6%) | 111 (40.1%) |
Disability Class: Self-Care Difficulty
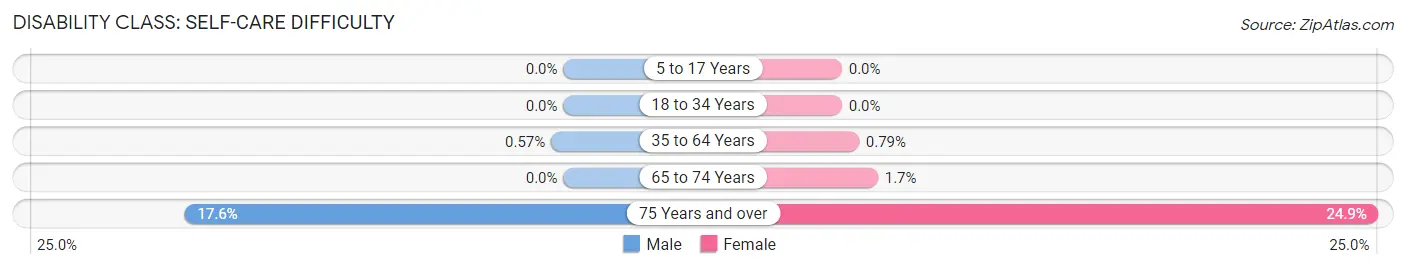
| Age Bracket | Male | Female |
| 5 to 17 Years | 0 (0.0%) | 0 (0.0%) |
| 18 to 34 Years | 0 (0.0%) | 0 (0.0%) |
| 35 to 64 Years | 5 (0.6%) | 8 (0.8%) |
| 65 to 74 Years | 0 (0.0%) | 2 (1.7%) |
| 75 Years and over | 16 (17.6%) | 69 (24.9%) |
Technology Access in Gang Mills
Computing Device Access in Gang Mills
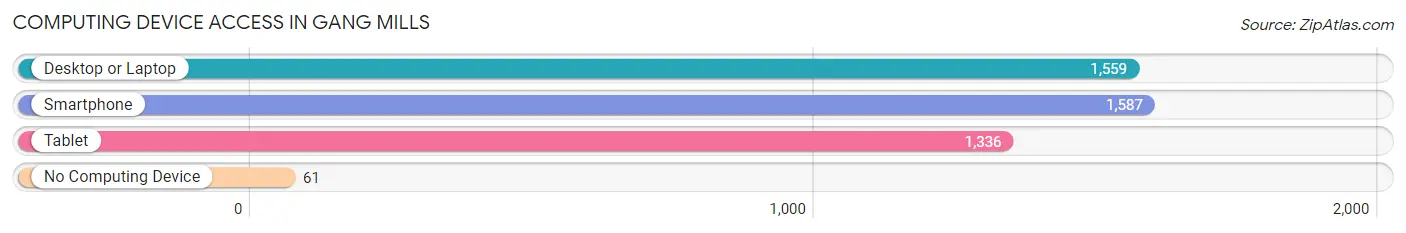
| Device Type | # Households | % Households |
| Desktop or Laptop | 1,559 | 85.7% |
| Smartphone | 1,587 | 87.3% |
| Tablet | 1,336 | 73.5% |
| No Computing Device | 61 | 3.4% |
| Total | 1,819 | 100.0% |
Internet Access in Gang Mills
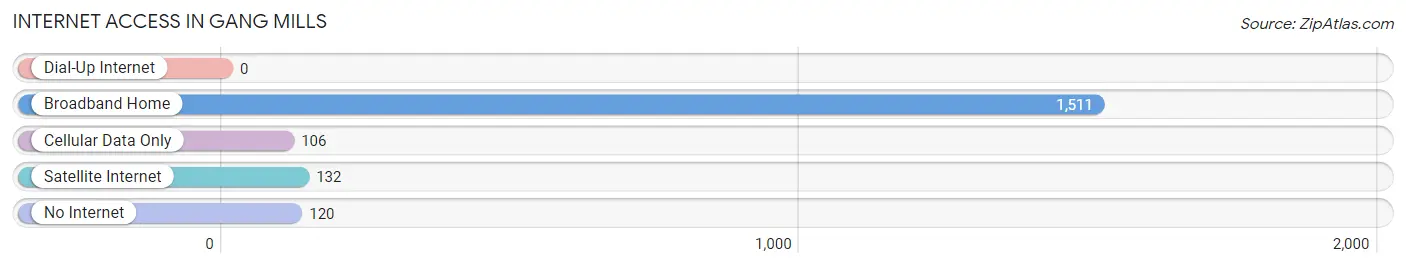
| Internet Type | # Households | % Households |
| Dial-Up Internet | 0 | 0.0% |
| Broadband Home | 1,511 | 83.1% |
| Cellular Data Only | 106 | 5.8% |
| Satellite Internet | 132 | 7.3% |
| No Internet | 120 | 6.6% |
| Total | 1,819 | 100.0% |
Gang Mills Summary
Gang Mills is a hamlet located in the Town of Erwin in Steuben County, New York. It is situated on the Chemung River, which is a tributary of the Susquehanna River. The hamlet is located approximately 10 miles south of Corning and 20 miles north of Elmira.
Geography
Gang Mills is located at 42° 8' 24" North, 76° 51' 24" West (42.1400, -76.8567). It is situated on the Chemung River, which is a tributary of the Susquehanna River. The hamlet is located approximately 10 miles south of Corning and 20 miles north of Elmira. The terrain is mostly flat with some rolling hills. The area is mostly rural with some small farms and wooded areas.
History
Gang Mills was first settled in the late 1700s by settlers from Connecticut. The hamlet was originally known as "Gang's Mills" after the Gang family who owned a sawmill and gristmill in the area. The hamlet was officially incorporated in 1848.
In the late 1800s, Gang Mills was a thriving industrial center. The hamlet was home to several factories, including a paper mill, a tannery, a brickyard, and a foundry. The paper mill was the largest employer in the area and employed hundreds of people.
The hamlet was also home to several churches, including the First Presbyterian Church, the Methodist Episcopal Church, and the Baptist Church.
In the early 1900s, the paper mill closed and the hamlet's population began to decline. The tannery and brickyard also closed in the early 1900s. The foundry closed in the mid-1900s.
Economy
Today, Gang Mills is a small, rural hamlet with a population of approximately 500 people. The economy is mostly based on agriculture and tourism. There are several small farms in the area that produce a variety of crops, including corn, soybeans, and hay.
The hamlet is also home to several small businesses, including a gas station, a convenience store, a restaurant, and a hardware store. There is also a small airport located in the hamlet.
Demographics
As of the 2010 census, the population of Gang Mills was 498. The racial makeup of the hamlet was 97.2% White, 0.6% African American, 0.2% Native American, 0.2% Asian, 0.2% from other races, and 1.8% from two or more races. Hispanic or Latino of any race were 1.2% of the population.
The median household income in Gang Mills was $41,250, and the median family income was $45,000. The per capita income was $19,845. About 11.2% of families and 13.2% of the population were below the poverty line, including 16.7% of those under age 18 and 8.3% of those age 65 or over.
Conclusion
Gang Mills is a small, rural hamlet located in Steuben County, New York. It is situated on the Chemung River, which is a tributary of the Susquehanna River. The hamlet was first settled in the late 1700s and was once a thriving industrial center. Today, the economy is mostly based on agriculture and tourism. The population of Gang Mills is approximately 500 people, and the median household income is $41,250.
Common Questions
What is Per Capita Income in Gang Mills?
Per Capita income in Gang Mills is $47,589.
What is the Median Family Income in Gang Mills?
Median Family Income in Gang Mills is $141,389.
What is the Median Household income in Gang Mills?
Median Household Income in Gang Mills is $102,015.
What is Income or Wage Gap in Gang Mills?
Income or Wage Gap in Gang Mills is 19.2%.
Women in Gang Mills earn 80.8 cents for every dollar earned by a man.
What is Inequality or Gini Index in Gang Mills?
Inequality or Gini Index in Gang Mills is 0.43.
What is the Total Population of Gang Mills?
Total Population of Gang Mills is 4,562.
What is the Total Male Population of Gang Mills?
Total Male Population of Gang Mills is 2,299.
What is the Total Female Population of Gang Mills?
Total Female Population of Gang Mills is 2,263.
What is the Ratio of Males per 100 Females in Gang Mills?
There are 101.59 Males per 100 Females in Gang Mills.
What is the Ratio of Females per 100 Males in Gang Mills?
There are 98.43 Females per 100 Males in Gang Mills.
What is the Median Population Age in Gang Mills?
Median Population Age in Gang Mills is 40.7 Years.
What is the Average Family Size in Gang Mills
Average Family Size in Gang Mills is 2.9 People.
What is the Average Household Size in Gang Mills
Average Household Size in Gang Mills is 2.4 People.
How Large is the Labor Force in Gang Mills?
There are 2,361 People in the Labor Forcein in Gang Mills.
What is the Percentage of People in the Labor Force in Gang Mills?
64.4% of People are in the Labor Force in Gang Mills.
What is the Unemployment Rate in Gang Mills?
Unemployment Rate in Gang Mills is 2.6%.