Elwood, NY Map & Demographics
Elwood Map
Elwood Overview
$64,726
PER CAPITA INCOME
$163,476
AVG FAMILY INCOME
$161,406
AVG HOUSEHOLD INCOME
21.8%
WAGE / INCOME GAP [ % ]
78.2¢/ $1
WAGE / INCOME GAP [ $ ]
0.42
INEQUALITY / GINI INDEX
11,124
TOTAL POPULATION
5,485
MALE POPULATION
5,639
FEMALE POPULATION
97.27
MALES / 100 FEMALES
102.81
FEMALES / 100 MALES
46.3
MEDIAN AGE
3.3
AVG FAMILY SIZE
3.0
AVG HOUSEHOLD SIZE
6,262
LABOR FORCE [ PEOPLE ]
67.9%
PERCENT IN LABOR FORCE
2.4%
UNEMPLOYMENT RATE
Elwood Area Codes
Income in Elwood
Income Overview in Elwood
Per Capita Income in Elwood is $64,726, while median incomes of families and households are $163,476 and $161,406 respectively.
| Characteristic | Number | Measure |
| Per Capita Income | 11,124 | $64,726 |
| Median Family Income | 2,994 | $163,476 |
| Mean Family Income | 2,994 | $203,461 |
| Median Household Income | 3,663 | $161,406 |
| Mean Household Income | 3,663 | $193,095 |
| Income Deficit | 2,994 | $0 |
| Wage / Income Gap (%) | 11,124 | 21.84% |
| Wage / Income Gap ($) | 11,124 | 78.16¢ per $1 |
| Gini / Inequality Index | 11,124 | 0.42 |
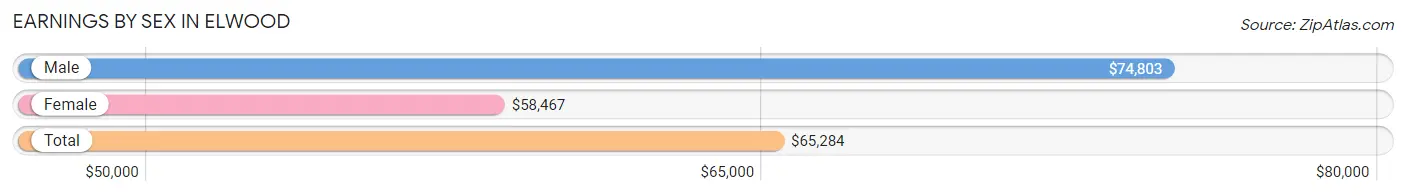
Earnings by Sex in Elwood
Average Earnings in Elwood are $65,284, $74,803 for men and $58,467 for women, a difference of 21.8%.
| Sex | Number | Average Earnings |
| Male | 3,568 (55.8%) | $74,803 |
| Female | 2,822 (44.2%) | $58,467 |
| Total | 6,390 (100.0%) | $65,284 |
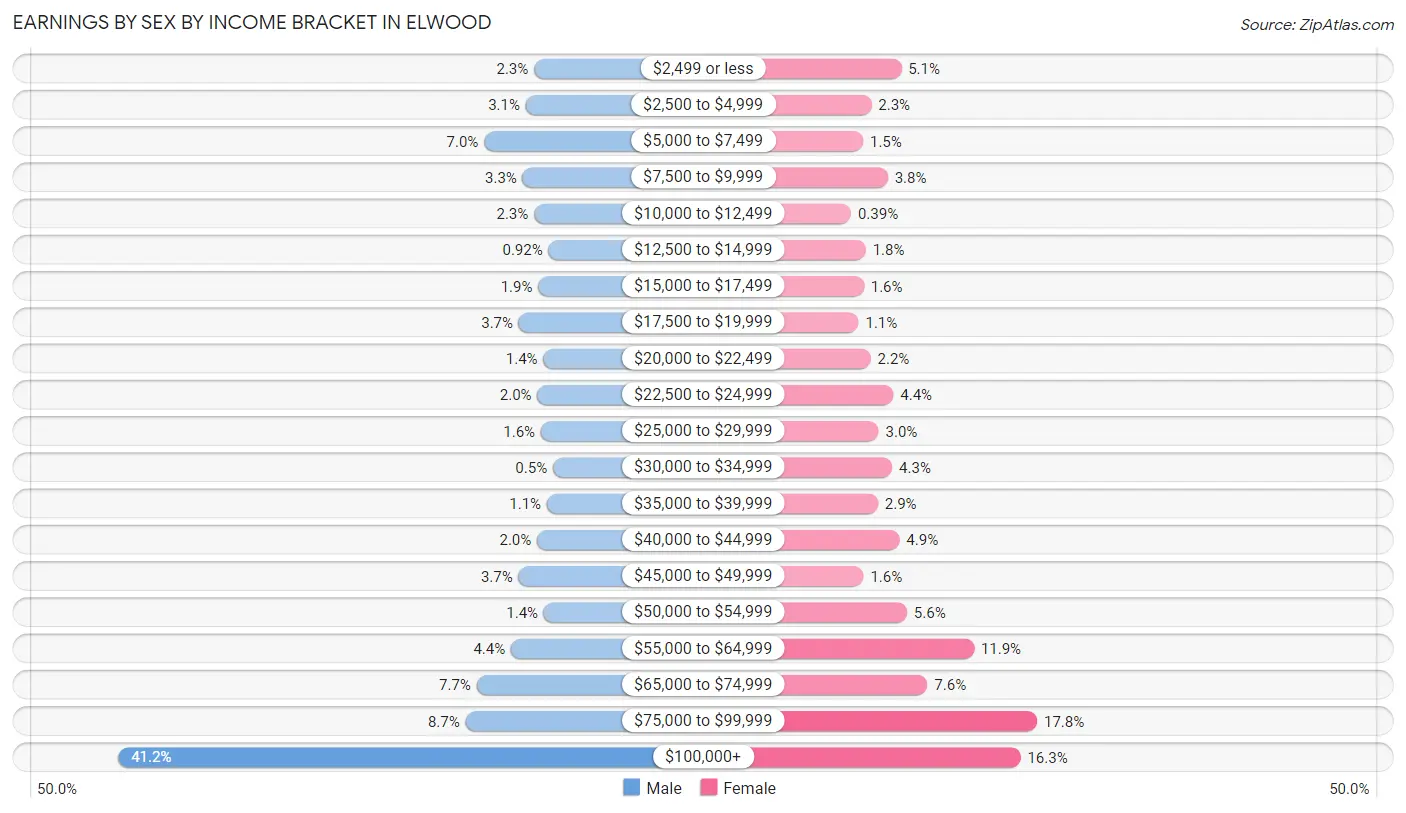
Earnings by Sex by Income Bracket in Elwood
The most common earnings brackets in Elwood are $100,000+ for men (1,471 | 41.2%) and $75,000 to $99,999 for women (503 | 17.8%).
| Income | Male | Female |
| $2,499 or less | 81 (2.3%) | 144 (5.1%) |
| $2,500 to $4,999 | 109 (3.0%) | 65 (2.3%) |
| $5,000 to $7,499 | 248 (7.0%) | 43 (1.5%) |
| $7,500 to $9,999 | 119 (3.3%) | 108 (3.8%) |
| $10,000 to $12,499 | 81 (2.3%) | 11 (0.4%) |
| $12,500 to $14,999 | 33 (0.9%) | 50 (1.8%) |
| $15,000 to $17,499 | 67 (1.9%) | 45 (1.6%) |
| $17,500 to $19,999 | 132 (3.7%) | 31 (1.1%) |
| $20,000 to $22,499 | 50 (1.4%) | 63 (2.2%) |
| $22,500 to $24,999 | 70 (2.0%) | 123 (4.4%) |
| $25,000 to $29,999 | 58 (1.6%) | 84 (3.0%) |
| $30,000 to $34,999 | 18 (0.5%) | 120 (4.3%) |
| $35,000 to $39,999 | 38 (1.1%) | 82 (2.9%) |
| $40,000 to $44,999 | 71 (2.0%) | 139 (4.9%) |
| $45,000 to $49,999 | 133 (3.7%) | 44 (1.6%) |
| $50,000 to $54,999 | 48 (1.3%) | 159 (5.6%) |
| $55,000 to $64,999 | 158 (4.4%) | 336 (11.9%) |
| $65,000 to $74,999 | 273 (7.6%) | 213 (7.5%) |
| $75,000 to $99,999 | 310 (8.7%) | 503 (17.8%) |
| $100,000+ | 1,471 (41.2%) | 459 (16.3%) |
| Total | 3,568 (100.0%) | 2,822 (100.0%) |
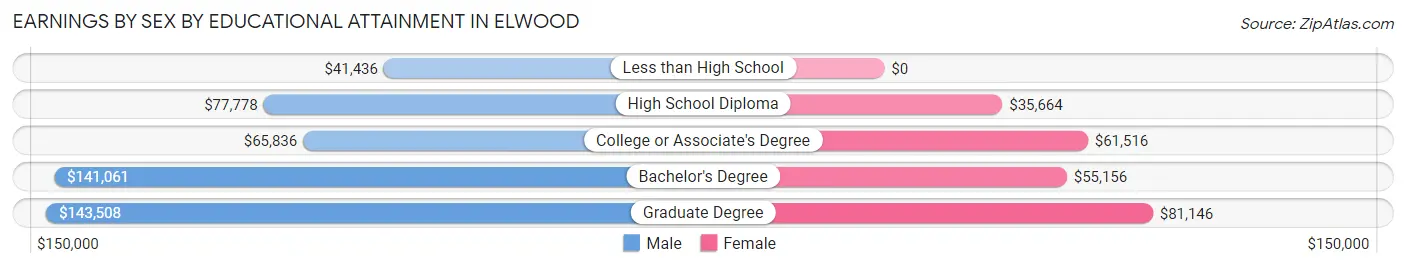
Earnings by Sex by Educational Attainment in Elwood
Average earnings in Elwood are $95,808 for men and $60,839 for women, a difference of 36.5%. Men with an educational attainment of graduate degree enjoy the highest average annual earnings of $143,508, while those with less than high school education earn the least with $41,436. Women with an educational attainment of graduate degree earn the most with the average annual earnings of $81,146, while those with high school diploma education have the smallest earnings of $35,664.
| Educational Attainment | Male Income | Female Income |
| Less than High School | $41,436 | $0 |
| High School Diploma | $77,778 | $35,664 |
| College or Associate's Degree | $65,836 | $61,516 |
| Bachelor's Degree | $141,061 | $55,156 |
| Graduate Degree | $143,508 | $81,146 |
| Total | $95,808 | $60,839 |
Family Income in Elwood
Family Income Brackets in Elwood
According to the Elwood family income data, there are 973 families falling into the $200,000+ income range, which is the most common income bracket and makes up 32.5% of all families.
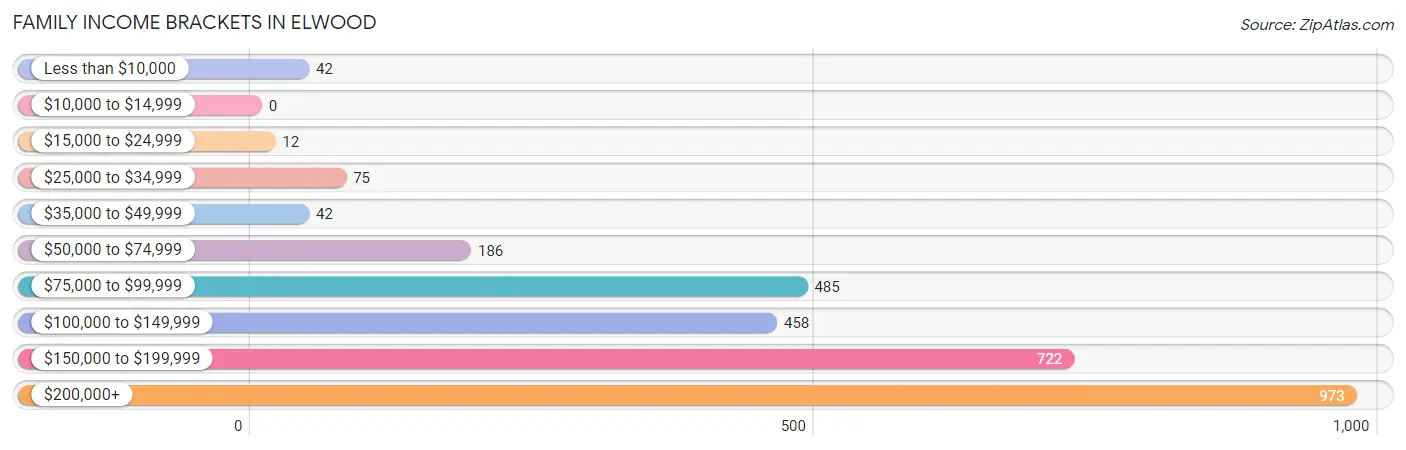
| Income Bracket | # Families | % Families |
| Less than $10,000 | 42 | 1.4% |
| $10,000 to $14,999 | 0 | 0.0% |
| $15,000 to $24,999 | 12 | 0.4% |
| $25,000 to $34,999 | 75 | 2.5% |
| $35,000 to $49,999 | 42 | 1.4% |
| $50,000 to $74,999 | 186 | 6.2% |
| $75,000 to $99,999 | 485 | 16.2% |
| $100,000 to $149,999 | 458 | 15.3% |
| $150,000 to $199,999 | 722 | 24.1% |
| $200,000+ | 973 | 32.5% |
Family Income by Famaliy Size in Elwood
5-person families (218 | 7.3%) account for the highest median family income in Elwood with $250,001 per family, while 2-person families (1,019 | 34.0%) have the highest median income of $62,969 per family member.
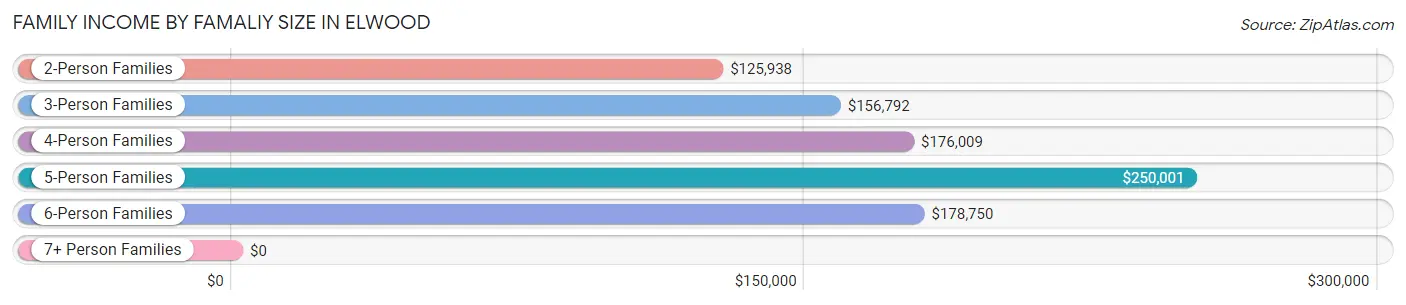
| Income Bracket | # Families | Median Income |
| 2-Person Families | 1,019 (34.0%) | $125,938 |
| 3-Person Families | 916 (30.6%) | $156,792 |
| 4-Person Families | 772 (25.8%) | $176,009 |
| 5-Person Families | 218 (7.3%) | $250,001 |
| 6-Person Families | 59 (2.0%) | $178,750 |
| 7+ Person Families | 10 (0.3%) | $0 |
| Total | 2,994 (100.0%) | $163,476 |
Family Income by Number of Earners in Elwood
The median family income in Elwood is $163,476, with families comprising 3+ earners (497) having the highest median family income of $187,404, while families with no earners (311) have the lowest median family income of $72,034, accounting for 16.6% and 10.4% of families, respectively.
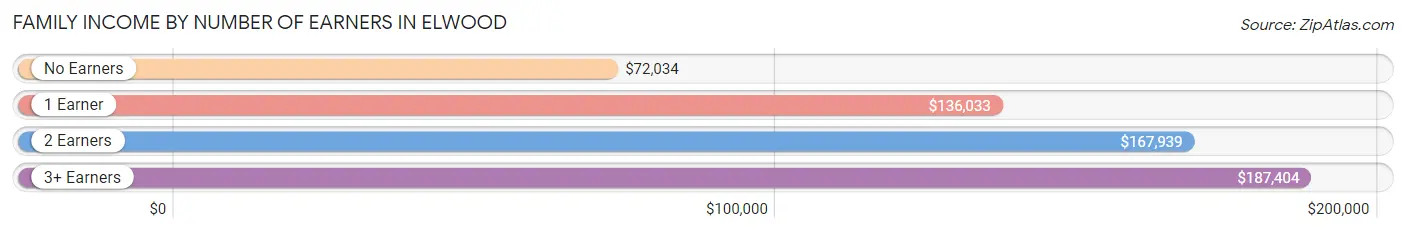
| Number of Earners | # Families | Median Income |
| No Earners | 311 (10.4%) | $72,034 |
| 1 Earner | 563 (18.8%) | $136,033 |
| 2 Earners | 1,623 (54.2%) | $167,939 |
| 3+ Earners | 497 (16.6%) | $187,404 |
| Total | 2,994 (100.0%) | $163,476 |
Household Income in Elwood
Household Income Brackets in Elwood
With 1,048 households falling in the category, the $200,000+ income range is the most frequent in Elwood, accounting for 28.6% of all households. In contrast, only 11 households (0.3%) fall into the $10,000 to $14,999 income bracket, making it the least populous group.
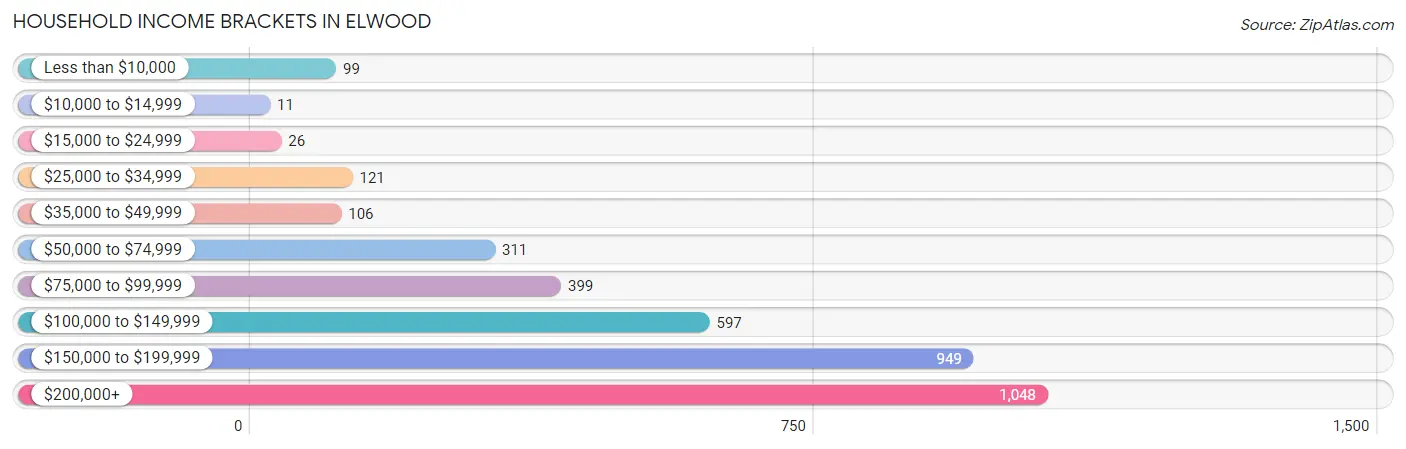
| Income Bracket | # Households | % Households |
| Less than $10,000 | 99 | 2.7% |
| $10,000 to $14,999 | 11 | 0.3% |
| $15,000 to $24,999 | 26 | 0.7% |
| $25,000 to $34,999 | 121 | 3.3% |
| $35,000 to $49,999 | 106 | 2.9% |
| $50,000 to $74,999 | 311 | 8.5% |
| $75,000 to $99,999 | 399 | 10.9% |
| $100,000 to $149,999 | 597 | 16.3% |
| $150,000 to $199,999 | 949 | 25.9% |
| $200,000+ | 1,048 | 28.6% |
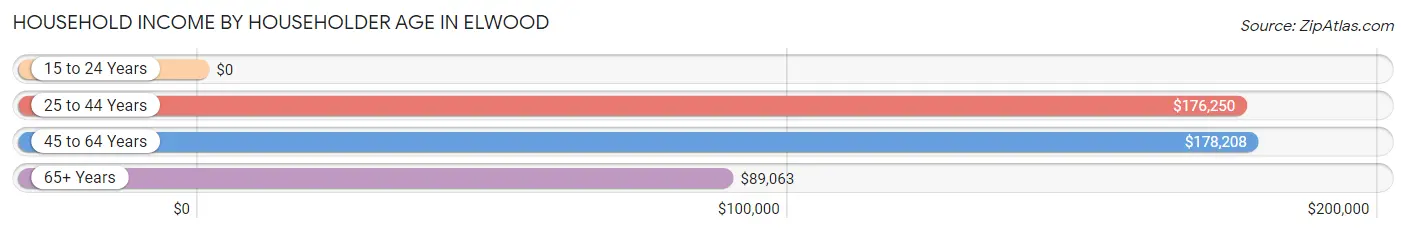
Household Income by Householder Age in Elwood
The median household income in Elwood is $161,406, with the highest median household income of $178,208 found in the 45 to 64 years age bracket for the primary householder. A total of 2,007 households (54.8%) fall into this category.
| Income Bracket | # Households | Median Income |
| 15 to 24 Years | 0 (0.0%) | $0 |
| 25 to 44 Years | 599 (16.4%) | $176,250 |
| 45 to 64 Years | 2,007 (54.8%) | $178,208 |
| 65+ Years | 1,057 (28.9%) | $89,063 |
| Total | 3,663 (100.0%) | $161,406 |
Poverty in Elwood
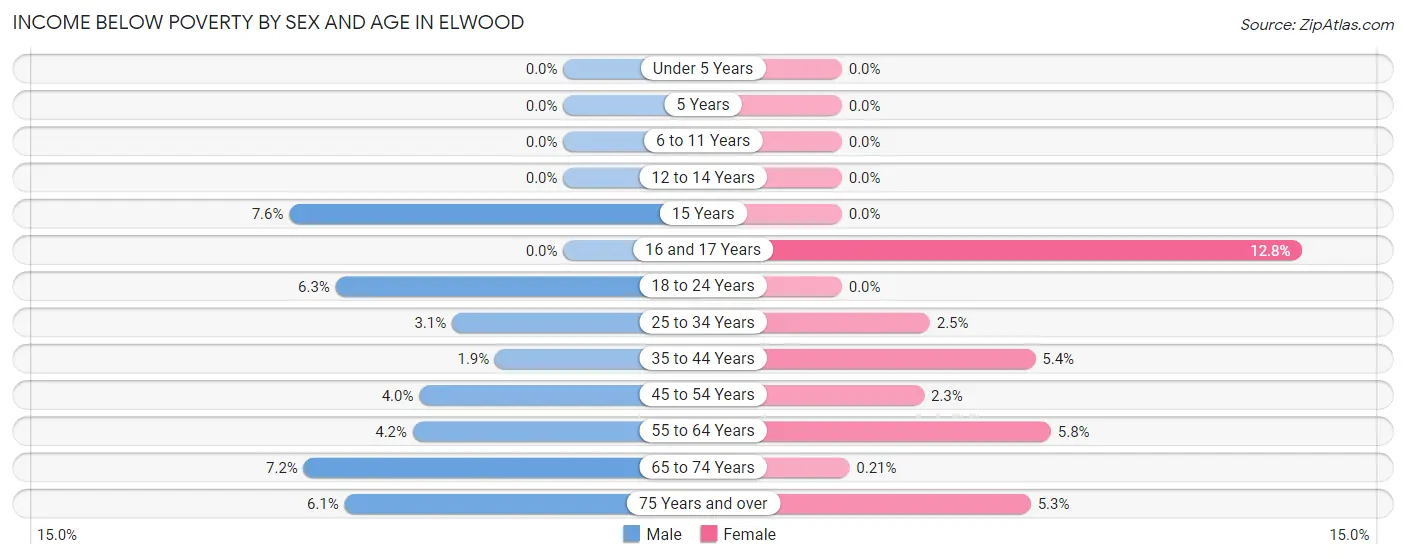
Income Below Poverty by Sex and Age in Elwood
With 3.9% poverty level for males and 3.2% for females among the residents of Elwood, 15 year old males and 16 and 17 year old females are the most vulnerable to poverty, with 10 males (7.6%) and 15 females (12.8%) in their respective age groups living below the poverty level.
| Age Bracket | Male | Female |
| Under 5 Years | 0 (0.0%) | 0 (0.0%) |
| 5 Years | 0 (0.0%) | 0 (0.0%) |
| 6 to 11 Years | 0 (0.0%) | 0 (0.0%) |
| 12 to 14 Years | 0 (0.0%) | 0 (0.0%) |
| 15 Years | 10 (7.6%) | 0 (0.0%) |
| 16 and 17 Years | 0 (0.0%) | 15 (12.8%) |
| 18 to 24 Years | 50 (6.3%) | 0 (0.0%) |
| 25 to 34 Years | 18 (3.1%) | 13 (2.5%) |
| 35 to 44 Years | 9 (1.9%) | 30 (5.4%) |
| 45 to 54 Years | 31 (4.0%) | 18 (2.3%) |
| 55 to 64 Years | 44 (4.2%) | 64 (5.8%) |
| 65 to 74 Years | 31 (7.2%) | 1 (0.2%) |
| 75 Years and over | 22 (6.1%) | 39 (5.3%) |
| Total | 215 (3.9%) | 180 (3.2%) |
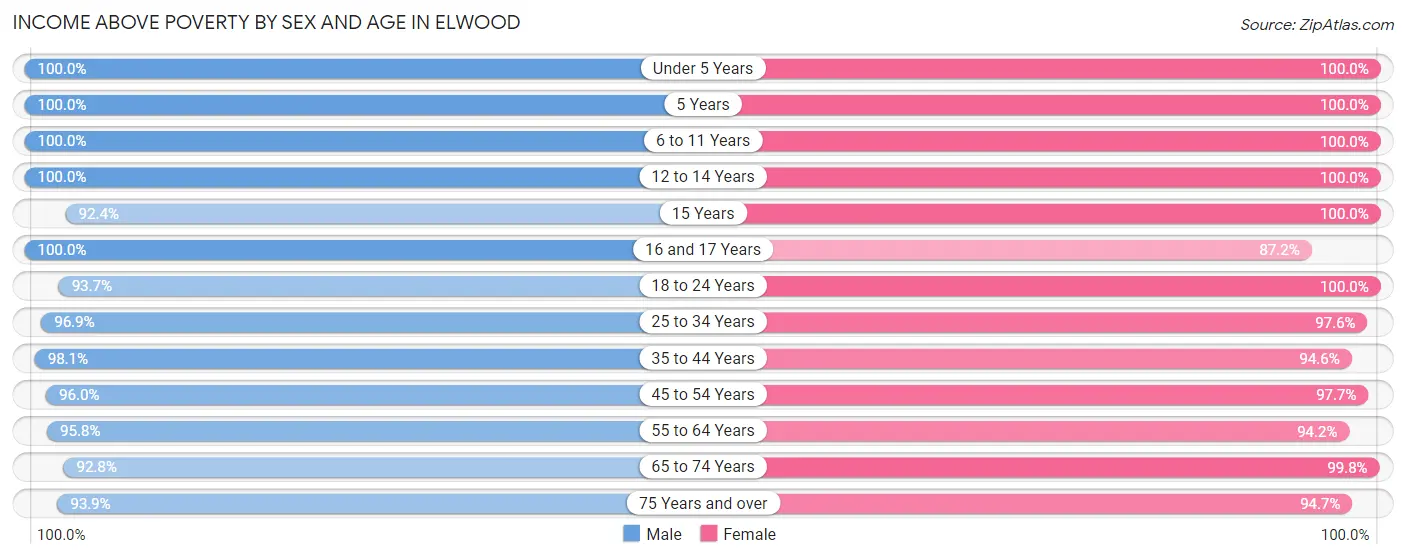
Income Above Poverty by Sex and Age in Elwood
According to the poverty statistics in Elwood, males aged under 5 years and females aged under 5 years are the age groups that are most secure financially, with 100.0% of males and 100.0% of females in these age groups living above the poverty line.
| Age Bracket | Male | Female |
| Under 5 Years | 184 (100.0%) | 283 (100.0%) |
| 5 Years | 72 (100.0%) | 32 (100.0%) |
| 6 to 11 Years | 371 (100.0%) | 322 (100.0%) |
| 12 to 14 Years | 148 (100.0%) | 247 (100.0%) |
| 15 Years | 121 (92.4%) | 57 (100.0%) |
| 16 and 17 Years | 107 (100.0%) | 102 (87.2%) |
| 18 to 24 Years | 739 (93.7%) | 331 (100.0%) |
| 25 to 34 Years | 563 (96.9%) | 517 (97.6%) |
| 35 to 44 Years | 465 (98.1%) | 527 (94.6%) |
| 45 to 54 Years | 743 (96.0%) | 767 (97.7%) |
| 55 to 64 Years | 1,007 (95.8%) | 1,036 (94.2%) |
| 65 to 74 Years | 398 (92.8%) | 469 (99.8%) |
| 75 Years and over | 339 (93.9%) | 702 (94.7%) |
| Total | 5,257 (96.1%) | 5,392 (96.8%) |
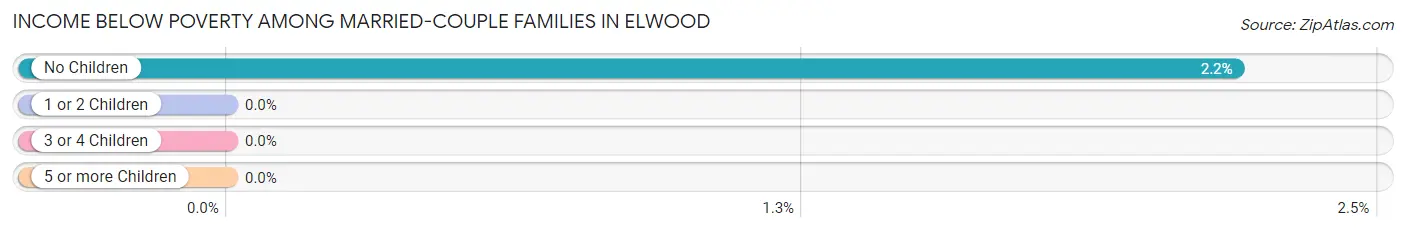
Income Below Poverty Among Married-Couple Families in Elwood
The poverty statistics for married-couple families in Elwood show that 1.3% or 30 of the total 2,306 families live below the poverty line. Families with no children have the highest poverty rate of 2.2%, comprising of 30 families. On the other hand, families with 1 or 2 children have the lowest poverty rate of 0.0%, which includes 0 families.
| Children | Above Poverty | Below Poverty |
| No Children | 1,340 (97.8%) | 30 (2.2%) |
| 1 or 2 Children | 763 (100.0%) | 0 (0.0%) |
| 3 or 4 Children | 173 (100.0%) | 0 (0.0%) |
| 5 or more Children | 0 (0.0%) | 0 (0.0%) |
| Total | 2,276 (98.7%) | 30 (1.3%) |
Income Below Poverty Among Single-Parent Households in Elwood
According to the poverty data in Elwood, 5.7% or 15 single-father households and 2.1% or 9 single-mother households are living below the poverty line. Among single-father households, those with 1 or 2 children have the highest poverty rate, with 15 households (14.6%) experiencing poverty. Likewise, among single-mother households, those with 1 or 2 children have the highest poverty rate, with 9 households (8.1%) falling below the poverty line.
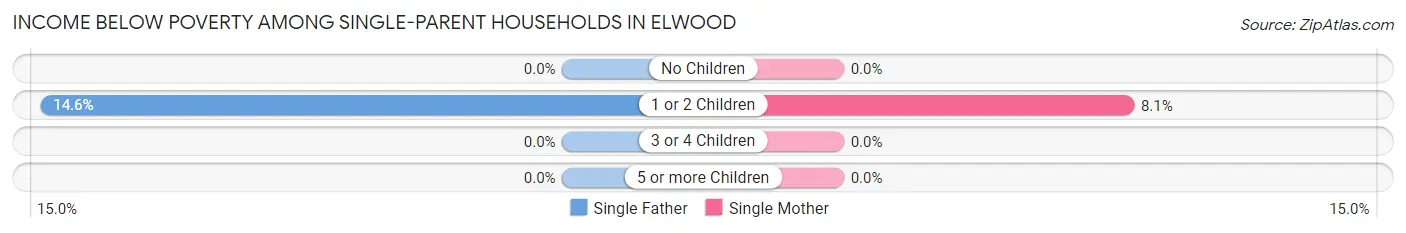
| Children | Single Father | Single Mother |
| No Children | 0 (0.0%) | 0 (0.0%) |
| 1 or 2 Children | 15 (14.6%) | 9 (8.1%) |
| 3 or 4 Children | 0 (0.0%) | 0 (0.0%) |
| 5 or more Children | 0 (0.0%) | 0 (0.0%) |
| Total | 15 (5.7%) | 9 (2.1%) |
Income Below Poverty Among Married-Couple vs Single-Parent Households in Elwood
The poverty data for Elwood shows that 30 of the married-couple family households (1.3%) and 24 of the single-parent households (3.5%) are living below the poverty level. Within the married-couple family households, those with no children have the highest poverty rate, with 30 households (2.2%) falling below the poverty line. Among the single-parent households, those with 1 or 2 children have the highest poverty rate, with 24 household (11.2%) living below poverty.
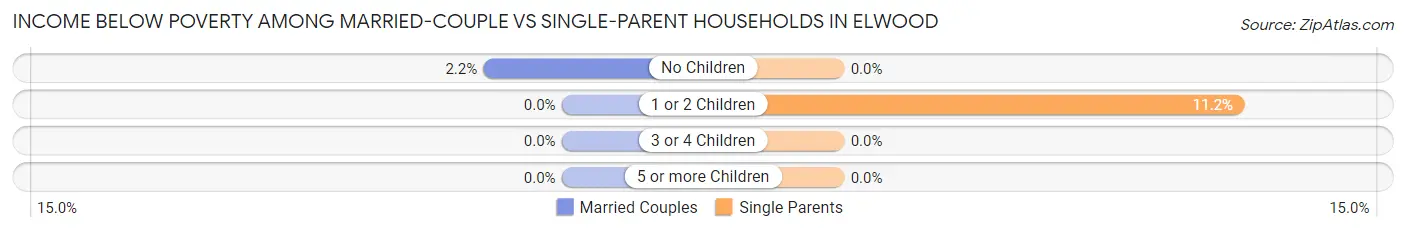
| Children | Married-Couple Families | Single-Parent Households |
| No Children | 30 (2.2%) | 0 (0.0%) |
| 1 or 2 Children | 0 (0.0%) | 24 (11.2%) |
| 3 or 4 Children | 0 (0.0%) | 0 (0.0%) |
| 5 or more Children | 0 (0.0%) | 0 (0.0%) |
| Total | 30 (1.3%) | 24 (3.5%) |
Race in Elwood
The most populous races in Elwood are White / Caucasian (8,557 | 76.9%), Hispanic or Latino (971 | 8.7%), and Two or more Races (876 | 7.9%).
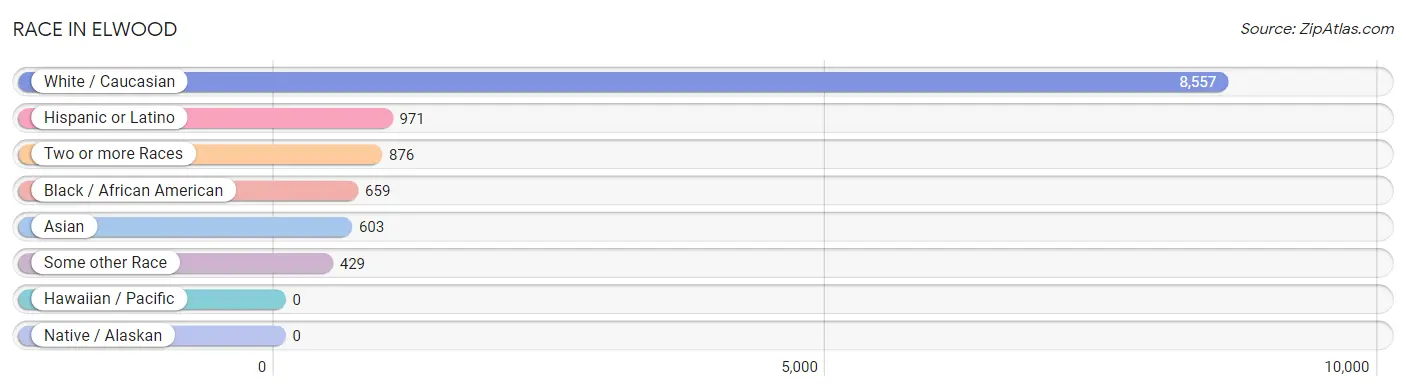
| Race | # Population | % Population |
| Asian | 603 | 5.4% |
| Black / African American | 659 | 5.9% |
| Hawaiian / Pacific | 0 | 0.0% |
| Hispanic or Latino | 971 | 8.7% |
| Native / Alaskan | 0 | 0.0% |
| White / Caucasian | 8,557 | 76.9% |
| Two or more Races | 876 | 7.9% |
| Some other Race | 429 | 3.9% |
| Total | 11,124 | 100.0% |
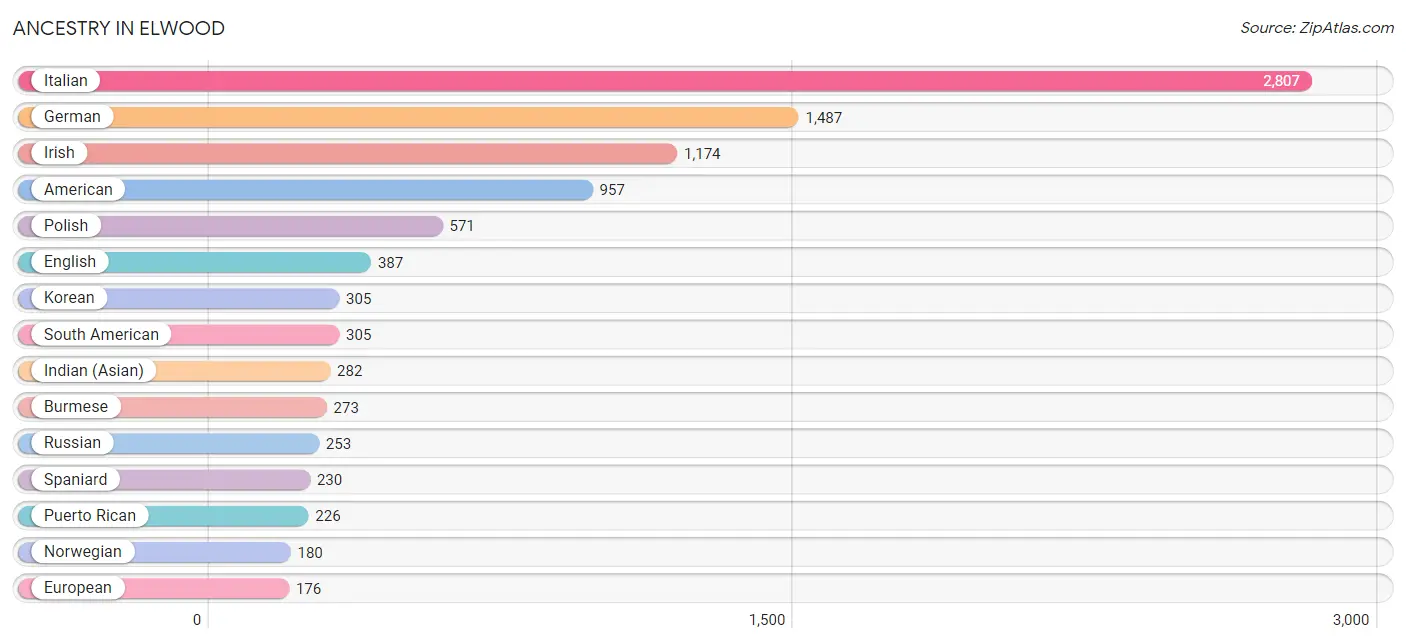
Ancestry in Elwood
The most populous ancestries reported in Elwood are Italian (2,807 | 25.2%), German (1,487 | 13.4%), Irish (1,174 | 10.5%), American (957 | 8.6%), and Polish (571 | 5.1%), together accounting for 62.9% of all Elwood residents.
| Ancestry | # Population | % Population |
| African | 55 | 0.5% |
| Alsatian | 25 | 0.2% |
| American | 957 | 8.6% |
| Arab | 41 | 0.4% |
| Armenian | 70 | 0.6% |
| Austrian | 86 | 0.8% |
| British | 111 | 1.0% |
| Burmese | 273 | 2.5% |
| Central American | 27 | 0.2% |
| Cherokee | 39 | 0.4% |
| Colombian | 137 | 1.2% |
| Croatian | 45 | 0.4% |
| Cuban | 15 | 0.1% |
| Cypriot | 23 | 0.2% |
| Czech | 80 | 0.7% |
| Czechoslovakian | 16 | 0.1% |
| Dominican | 57 | 0.5% |
| Dutch | 83 | 0.7% |
| Eastern European | 87 | 0.8% |
| Ecuadorian | 168 | 1.5% |
| English | 387 | 3.5% |
| European | 176 | 1.6% |
| Finnish | 11 | 0.1% |
| French | 15 | 0.1% |
| German | 1,487 | 13.4% |
| Greek | 152 | 1.4% |
| Guatemalan | 10 | 0.1% |
| Guyanese | 75 | 0.7% |
| Hungarian | 50 | 0.4% |
| Indian (Asian) | 282 | 2.5% |
| Iranian | 39 | 0.4% |
| Irish | 1,174 | 10.5% |
| Italian | 2,807 | 25.2% |
| Jamaican | 35 | 0.3% |
| Korean | 305 | 2.7% |
| Latvian | 14 | 0.1% |
| Lebanese | 5 | 0.0% |
| Mexican | 6 | 0.1% |
| Nigerian | 12 | 0.1% |
| Norwegian | 180 | 1.6% |
| Palestinian | 36 | 0.3% |
| Polish | 571 | 5.1% |
| Puerto Rican | 226 | 2.0% |
| Romanian | 95 | 0.9% |
| Russian | 253 | 2.3% |
| Salvadoran | 17 | 0.2% |
| Scotch-Irish | 16 | 0.1% |
| Scottish | 110 | 1.0% |
| Slovak | 16 | 0.1% |
| South American | 305 | 2.7% |
| Spaniard | 230 | 2.1% |
| Sri Lankan | 136 | 1.2% |
| Subsaharan African | 67 | 0.6% |
| Swedish | 17 | 0.2% |
| Swiss | 12 | 0.1% |
| Thai | 172 | 1.5% |
| Turkish | 7 | 0.1% |
| Ukrainian | 26 | 0.2% |
| Welsh | 91 | 0.8% |
| Yugoslavian | 6 | 0.1% | View All 60 Rows |
Immigrants in Elwood
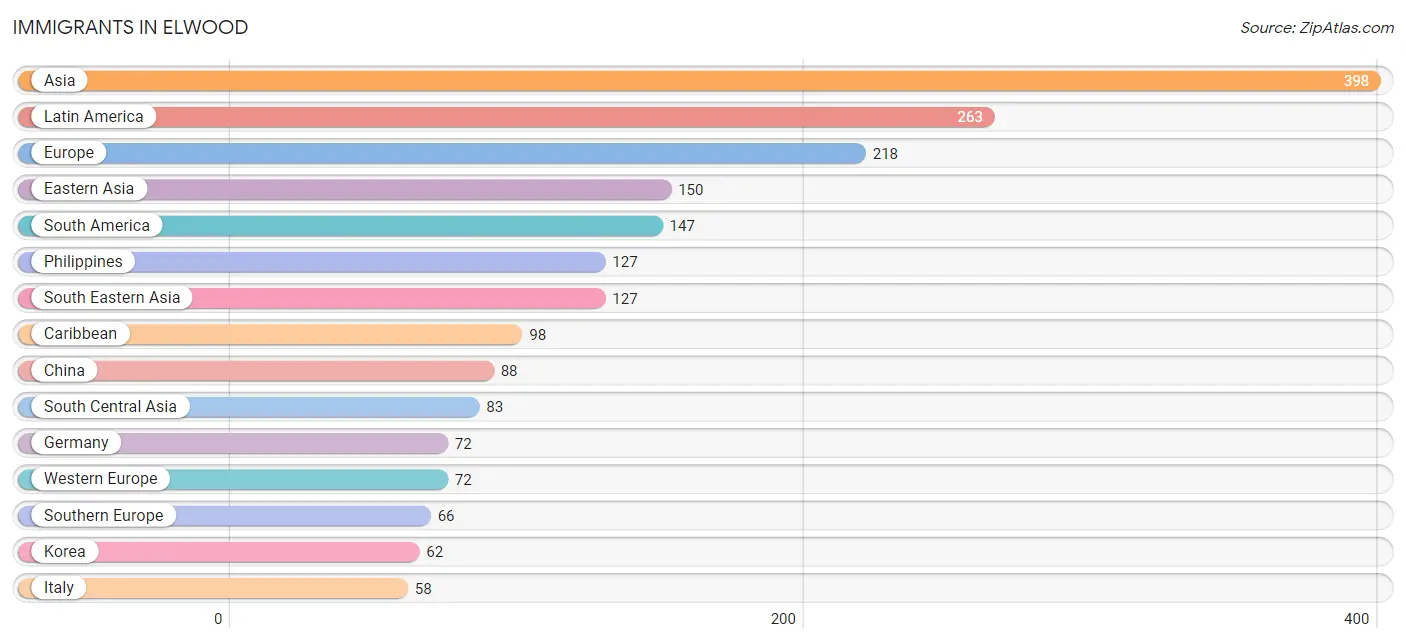
The most numerous immigrant groups reported in Elwood came from Asia (398 | 3.6%), Latin America (263 | 2.4%), Europe (218 | 2.0%), Eastern Asia (150 | 1.3%), and South America (147 | 1.3%), together accounting for 10.6% of all Elwood residents.
| Immigration Origin | # Population | % Population |
| Africa | 52 | 0.5% |
| Asia | 398 | 3.6% |
| Bangladesh | 27 | 0.2% |
| Caribbean | 98 | 0.9% |
| Central America | 18 | 0.2% |
| China | 88 | 0.8% |
| Colombia | 24 | 0.2% |
| Cuba | 23 | 0.2% |
| Dominican Republic | 23 | 0.2% |
| Eastern Asia | 150 | 1.3% |
| Eastern Europe | 48 | 0.4% |
| Ecuador | 24 | 0.2% |
| Egypt | 8 | 0.1% |
| El Salvador | 8 | 0.1% |
| Europe | 218 | 2.0% |
| Germany | 72 | 0.6% |
| Guatemala | 10 | 0.1% |
| Guyana | 51 | 0.5% |
| Haiti | 21 | 0.2% |
| India | 13 | 0.1% |
| Iran | 27 | 0.2% |
| Israel | 6 | 0.1% |
| Italy | 58 | 0.5% |
| Jamaica | 14 | 0.1% |
| Korea | 62 | 0.6% |
| Latin America | 263 | 2.4% |
| Latvia | 14 | 0.1% |
| Lebanon | 9 | 0.1% |
| Nigeria | 44 | 0.4% |
| Northern Africa | 8 | 0.1% |
| Northern Europe | 32 | 0.3% |
| Pakistan | 16 | 0.1% |
| Philippines | 127 | 1.1% |
| Romania | 8 | 0.1% |
| Russia | 26 | 0.2% |
| South America | 147 | 1.3% |
| South Central Asia | 83 | 0.7% |
| South Eastern Asia | 127 | 1.1% |
| Southern Europe | 66 | 0.6% |
| Spain | 8 | 0.1% |
| Trinidad and Tobago | 17 | 0.2% |
| Venezuela | 11 | 0.1% |
| Western Africa | 44 | 0.4% |
| Western Asia | 38 | 0.3% |
| Western Europe | 72 | 0.6% | View All 45 Rows |
Sex and Age in Elwood
Sex and Age in Elwood
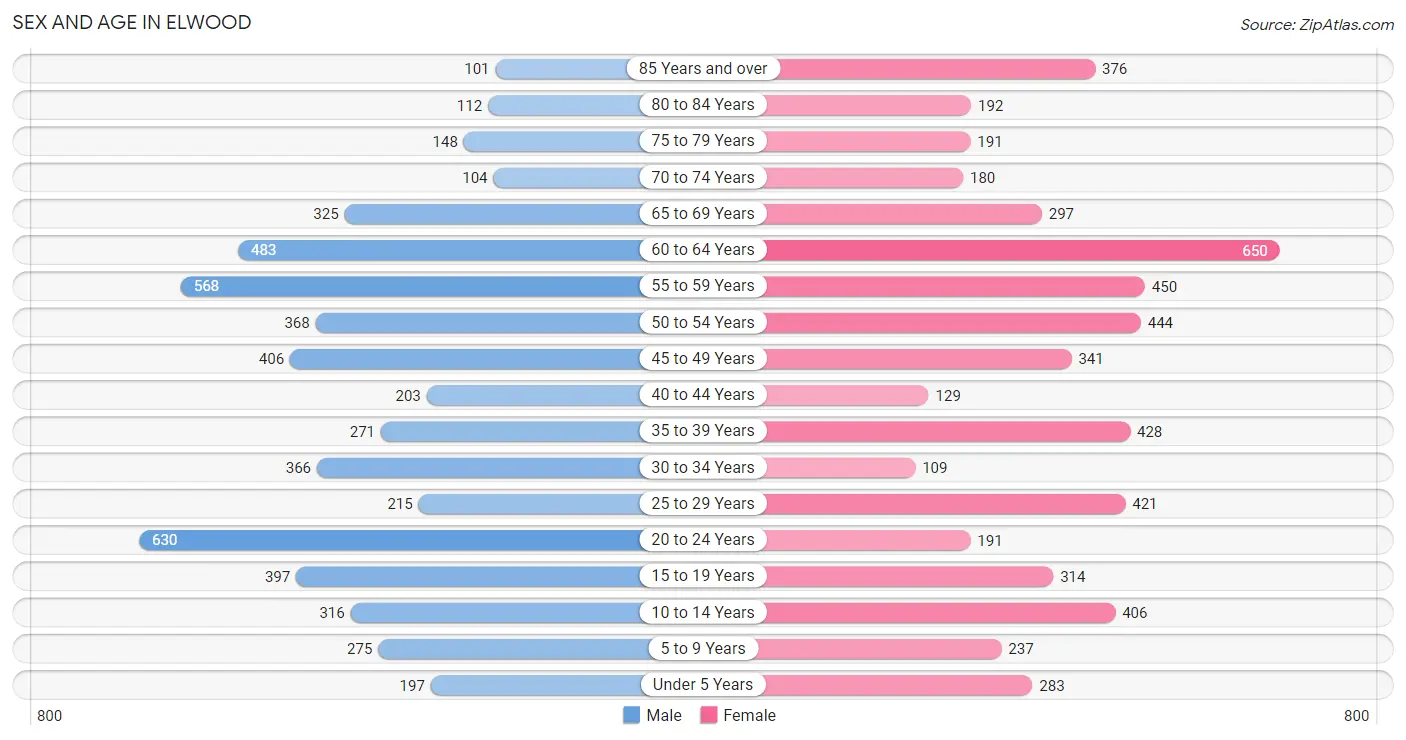
The most populous age groups in Elwood are 20 to 24 Years (630 | 11.5%) for men and 60 to 64 Years (650 | 11.5%) for women.
| Age Bracket | Male | Female |
| Under 5 Years | 197 (3.6%) | 283 (5.0%) |
| 5 to 9 Years | 275 (5.0%) | 237 (4.2%) |
| 10 to 14 Years | 316 (5.8%) | 406 (7.2%) |
| 15 to 19 Years | 397 (7.2%) | 314 (5.6%) |
| 20 to 24 Years | 630 (11.5%) | 191 (3.4%) |
| 25 to 29 Years | 215 (3.9%) | 421 (7.5%) |
| 30 to 34 Years | 366 (6.7%) | 109 (1.9%) |
| 35 to 39 Years | 271 (4.9%) | 428 (7.6%) |
| 40 to 44 Years | 203 (3.7%) | 129 (2.3%) |
| 45 to 49 Years | 406 (7.4%) | 341 (6.0%) |
| 50 to 54 Years | 368 (6.7%) | 444 (7.9%) |
| 55 to 59 Years | 568 (10.4%) | 450 (8.0%) |
| 60 to 64 Years | 483 (8.8%) | 650 (11.5%) |
| 65 to 69 Years | 325 (5.9%) | 297 (5.3%) |
| 70 to 74 Years | 104 (1.9%) | 180 (3.2%) |
| 75 to 79 Years | 148 (2.7%) | 191 (3.4%) |
| 80 to 84 Years | 112 (2.0%) | 192 (3.4%) |
| 85 Years and over | 101 (1.8%) | 376 (6.7%) |
| Total | 5,485 (100.0%) | 5,639 (100.0%) |
Families and Households in Elwood
Median Family Size in Elwood
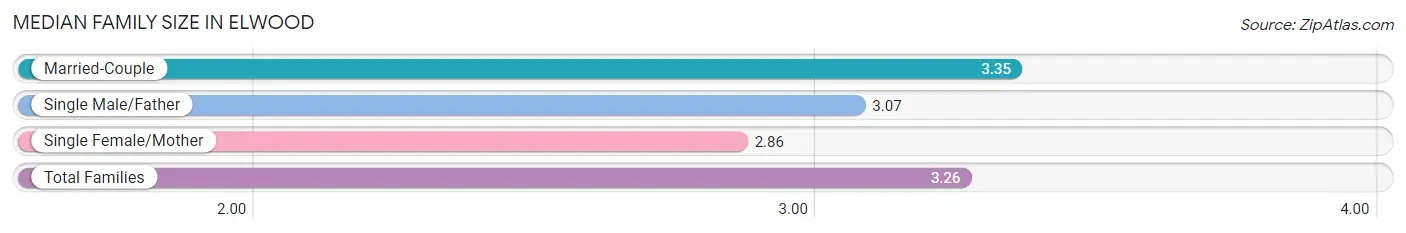
The median family size in Elwood is 3.26 persons per family, with married-couple families (2,306 | 77.0%) accounting for the largest median family size of 3.35 persons per family. On the other hand, single female/mother families (425 | 14.2%) represent the smallest median family size with 2.86 persons per family.
| Family Type | # Families | Family Size |
| Married-Couple | 2,306 (77.0%) | 3.35 |
| Single Male/Father | 263 (8.8%) | 3.07 |
| Single Female/Mother | 425 (14.2%) | 2.86 |
| Total Families | 2,994 (100.0%) | 3.26 |
Median Household Size in Elwood
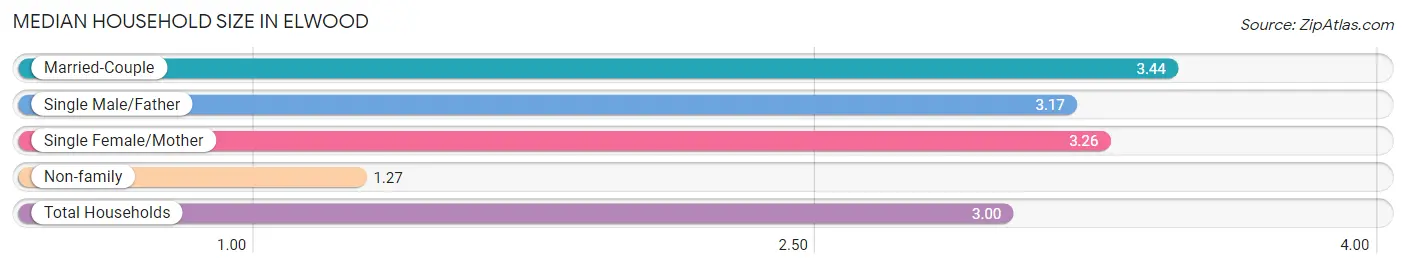
The median household size in Elwood is 3.00 persons per household, with married-couple households (2,306 | 62.9%) accounting for the largest median household size of 3.44 persons per household. non-family households (669 | 18.3%) represent the smallest median household size with 1.27 persons per household.
| Household Type | # Households | Household Size |
| Married-Couple | 2,306 (62.9%) | 3.44 |
| Single Male/Father | 263 (7.2%) | 3.17 |
| Single Female/Mother | 425 (11.6%) | 3.26 |
| Non-family | 669 (18.3%) | 1.27 |
| Total Households | 3,663 (100.0%) | 3.00 |
Household Size by Marriage Status in Elwood
Out of a total of 3,663 households in Elwood, 2,994 (81.7%) are family households, while 669 (18.3%) are nonfamily households. The most numerous type of family households are 2-person households, comprising 973, and the most common type of nonfamily households are 1-person households, comprising 568.
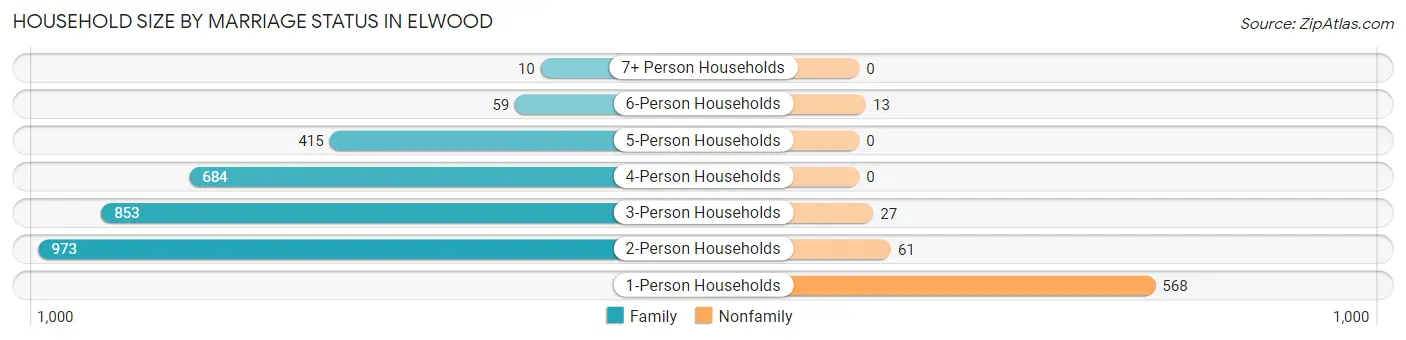
| Household Size | Family Households | Nonfamily Households |
| 1-Person Households | - | 568 (15.5%) |
| 2-Person Households | 973 (26.6%) | 61 (1.7%) |
| 3-Person Households | 853 (23.3%) | 27 (0.7%) |
| 4-Person Households | 684 (18.7%) | 0 (0.0%) |
| 5-Person Households | 415 (11.3%) | 0 (0.0%) |
| 6-Person Households | 59 (1.6%) | 13 (0.4%) |
| 7+ Person Households | 10 (0.3%) | 0 (0.0%) |
| Total | 2,994 (81.7%) | 669 (18.3%) |
Female Fertility in Elwood
Fertility by Age in Elwood
Average fertility rate in Elwood is 32.0 births per 1,000 women. Women in the age bracket of 35 to 50 years have the highest fertility rate with 53.0 births per 1,000 women. Women in the age bracket of 35 to 50 years acount for 81.2% of all women with births.
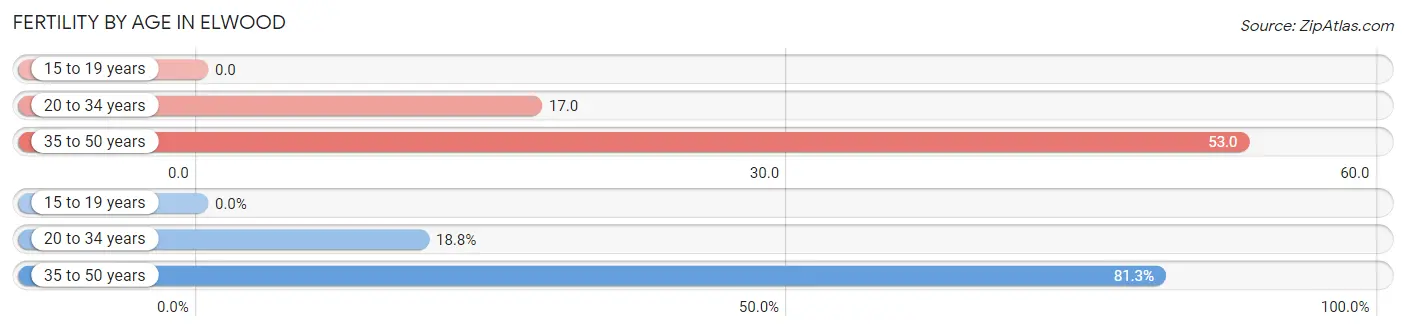
| Age Bracket | Women with Births | Births / 1,000 Women |
| 15 to 19 years | 0 (0.0%) | 0.0 |
| 20 to 34 years | 12 (18.8%) | 17.0 |
| 35 to 50 years | 52 (81.2%) | 53.0 |
| Total | 64 (100.0%) | 32.0 |
Fertility by Age by Marriage Status in Elwood
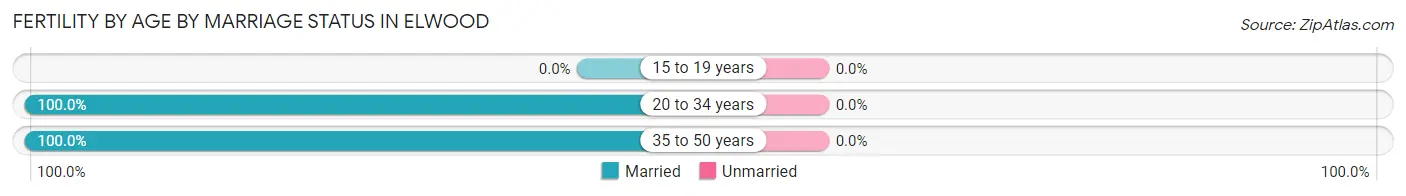
| Age Bracket | Married | Unmarried |
| 15 to 19 years | 0 (0.0%) | 0 (0.0%) |
| 20 to 34 years | 12 (100.0%) | 0 (0.0%) |
| 35 to 50 years | 52 (100.0%) | 0 (0.0%) |
| Total | 64 (100.0%) | 0 (0.0%) |
Fertility by Education in Elwood
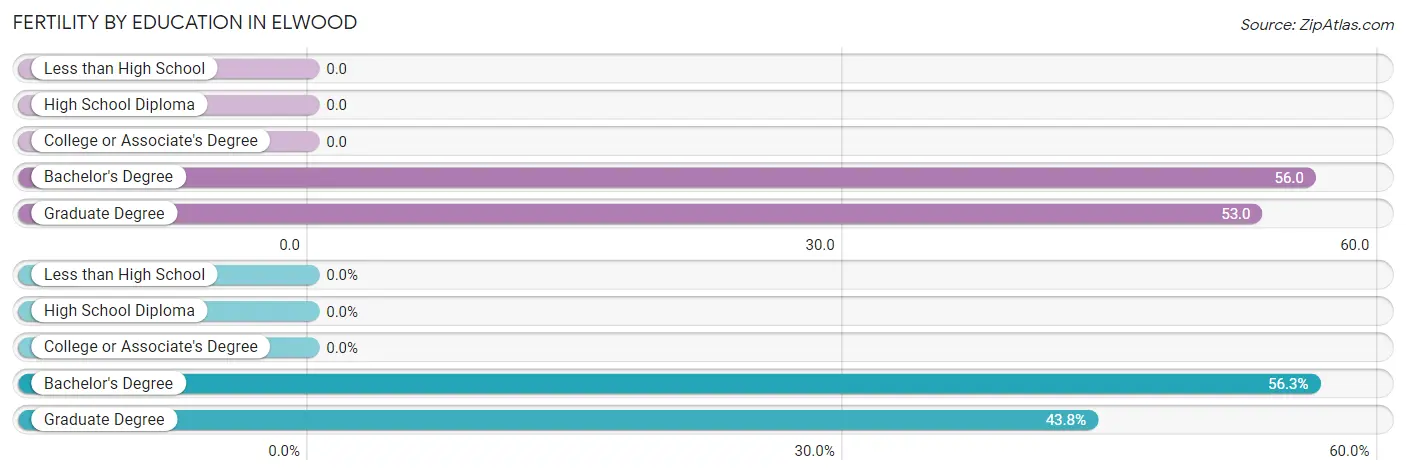
| Educational Attainment | Women with Births | Births / 1,000 Women |
| Less than High School | 0 (0.0%) | 0.0 |
| High School Diploma | 0 (0.0%) | 0.0 |
| College or Associate's Degree | 0 (0.0%) | 0.0 |
| Bachelor's Degree | 36 (56.2%) | 56.0 |
| Graduate Degree | 28 (43.8%) | 53.0 |
| Total | 64 (100.0%) | 32.0 |
Fertility by Education by Marriage Status in Elwood
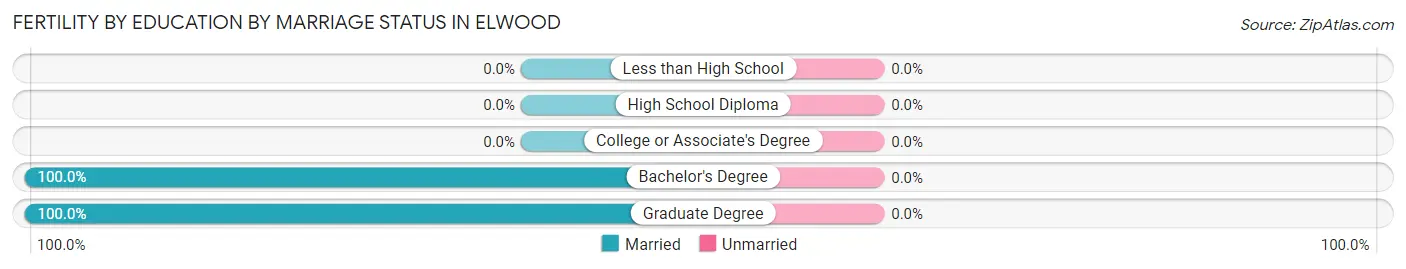
| Educational Attainment | Married | Unmarried |
| Less than High School | 0 (0.0%) | 0 (0.0%) |
| High School Diploma | 0 (0.0%) | 0 (0.0%) |
| College or Associate's Degree | 0 (0.0%) | 0 (0.0%) |
| Bachelor's Degree | 36 (100.0%) | 0 (0.0%) |
| Graduate Degree | 28 (100.0%) | 0 (0.0%) |
| Total | 64 (100.0%) | 0 (0.0%) |
Employment Characteristics in Elwood
Employment by Class of Employer in Elwood
Among the 5,857 employed individuals in Elwood, private company employees (3,832 | 65.4%), local government employees (583 | 10.0%), and not-for-profit organizations (543 | 9.3%) make up the most common classes of employment.
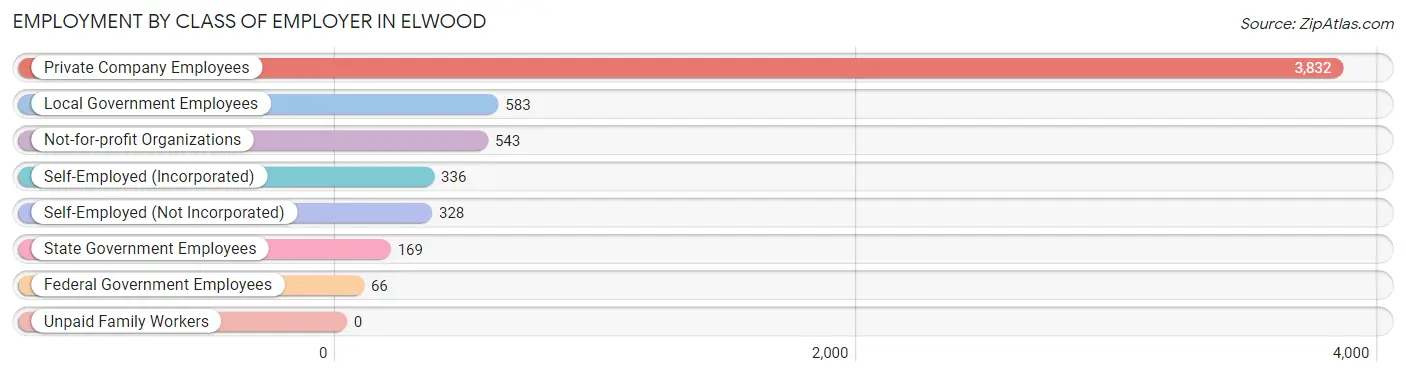
| Employer Class | # Employees | % Employees |
| Private Company Employees | 3,832 | 65.4% |
| Self-Employed (Incorporated) | 336 | 5.7% |
| Self-Employed (Not Incorporated) | 328 | 5.6% |
| Not-for-profit Organizations | 543 | 9.3% |
| Local Government Employees | 583 | 10.0% |
| State Government Employees | 169 | 2.9% |
| Federal Government Employees | 66 | 1.1% |
| Unpaid Family Workers | 0 | 0.0% |
| Total | 5,857 | 100.0% |
Employment Status by Age in Elwood
According to the labor force statistics for Elwood, out of the total population over 16 years of age (9,222), 67.9% or 6,262 individuals are in the labor force, with 2.4% or 150 of them unemployed. The age group with the highest labor force participation rate is 30 to 34 years, with 97.3% or 462 individuals in the labor force. Within the labor force, the 20 to 24 years age range has the highest percentage of unemployed individuals, with 6.9% or 45 of them being unemployed.
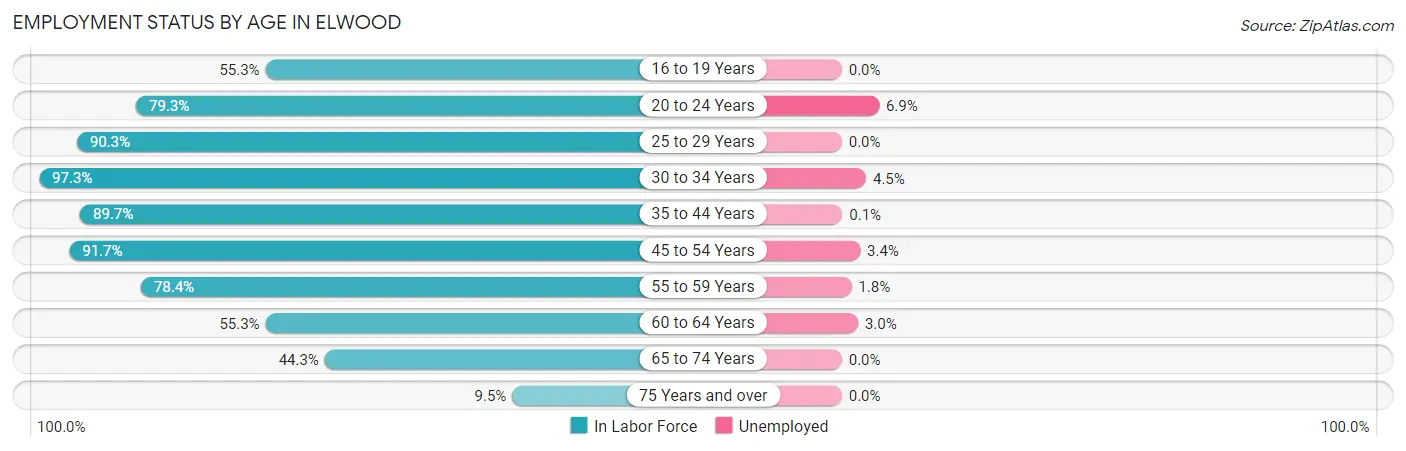
| Age Bracket | In Labor Force | Unemployed |
| 16 to 19 Years | 289 (55.3%) | 0 (0.0%) |
| 20 to 24 Years | 651 (79.3%) | 45 (6.9%) |
| 25 to 29 Years | 574 (90.3%) | 0 (0.0%) |
| 30 to 34 Years | 462 (97.3%) | 21 (4.5%) |
| 35 to 44 Years | 925 (89.7%) | 1 (0.1%) |
| 45 to 54 Years | 1,430 (91.7%) | 49 (3.4%) |
| 55 to 59 Years | 798 (78.4%) | 14 (1.8%) |
| 60 to 64 Years | 627 (55.3%) | 19 (3.0%) |
| 65 to 74 Years | 401 (44.3%) | 0 (0.0%) |
| 75 Years and over | 106 (9.5%) | 0 (0.0%) |
| Total | 6,262 (67.9%) | 150 (2.4%) |
Employment Status by Educational Attainment in Elwood
According to labor force statistics for Elwood, 82.3% of individuals (4,816) out of the total population between 25 and 64 years of age (5,852) are in the labor force, with 2.2% or 106 of them being unemployed. The group with the highest labor force participation rate are those with the educational attainment of college / associate degree, with 90.7% or 1,436 individuals in the labor force. Within the labor force, individuals with high school diploma education have the highest percentage of unemployment, with 5.6% or 24 of them being unemployed.
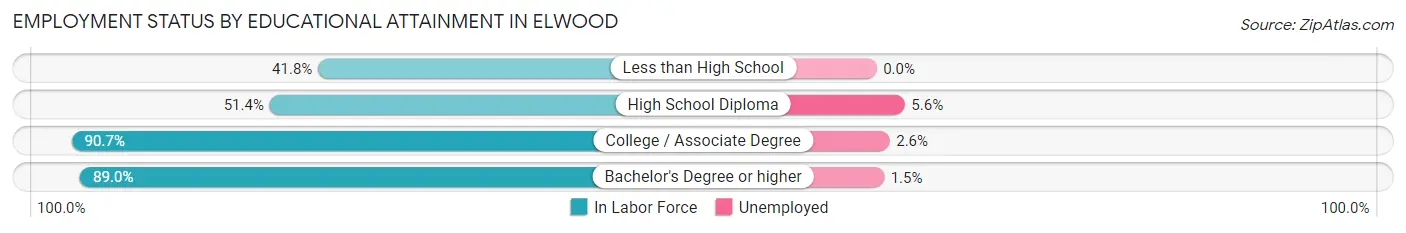
| Educational Attainment | In Labor Force | Unemployed |
| Less than High School | 94 (41.8%) | 0 (0.0%) |
| High School Diploma | 425 (51.4%) | 46 (5.6%) |
| College / Associate Degree | 1,436 (90.7%) | 41 (2.6%) |
| Bachelor's Degree or higher | 2,863 (89.0%) | 48 (1.5%) |
| Total | 4,816 (82.3%) | 129 (2.2%) |
Employment Occupations by Sex in Elwood
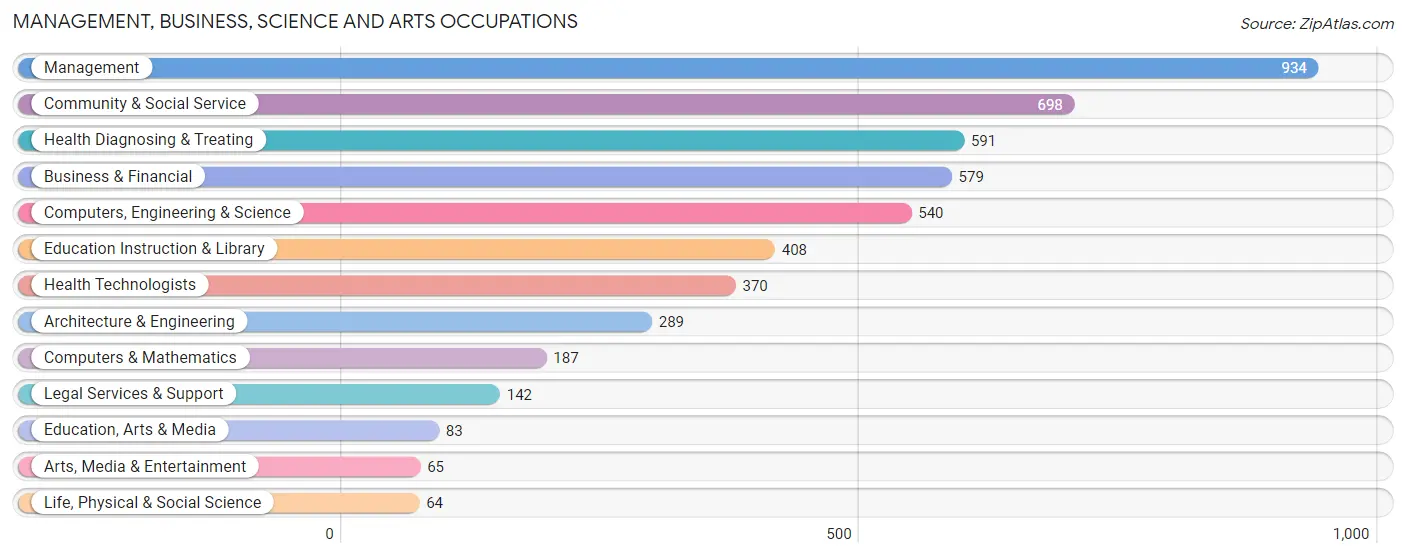
Management, Business, Science and Arts Occupations
The most common Management, Business, Science and Arts occupations in Elwood are Management (934 | 15.3%), Community & Social Service (698 | 11.4%), Health Diagnosing & Treating (591 | 9.7%), Business & Financial (579 | 9.5%), and Computers, Engineering & Science (540 | 8.8%).
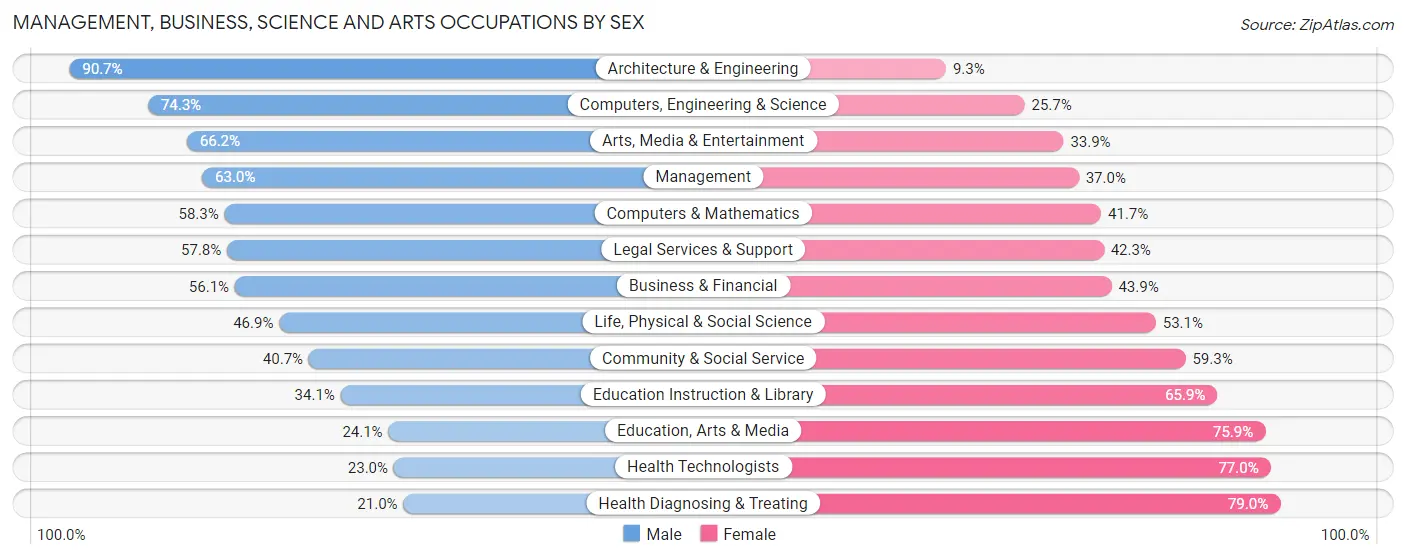
Management, Business, Science and Arts Occupations by Sex
Within the Management, Business, Science and Arts occupations in Elwood, the most male-oriented occupations are Architecture & Engineering (90.7%), Computers, Engineering & Science (74.3%), and Arts, Media & Entertainment (66.1%), while the most female-oriented occupations are Health Diagnosing & Treating (79.0%), Health Technologists (77.0%), and Education, Arts & Media (75.9%).
| Occupation | Male | Female |
| Management | 588 (63.0%) | 346 (37.0%) |
| Business & Financial | 325 (56.1%) | 254 (43.9%) |
| Computers, Engineering & Science | 401 (74.3%) | 139 (25.7%) |
| Computers & Mathematics | 109 (58.3%) | 78 (41.7%) |
| Architecture & Engineering | 262 (90.7%) | 27 (9.3%) |
| Life, Physical & Social Science | 30 (46.9%) | 34 (53.1%) |
| Community & Social Service | 284 (40.7%) | 414 (59.3%) |
| Education, Arts & Media | 20 (24.1%) | 63 (75.9%) |
| Legal Services & Support | 82 (57.8%) | 60 (42.2%) |
| Education Instruction & Library | 139 (34.1%) | 269 (65.9%) |
| Arts, Media & Entertainment | 43 (66.1%) | 22 (33.9%) |
| Health Diagnosing & Treating | 124 (21.0%) | 467 (79.0%) |
| Health Technologists | 85 (23.0%) | 285 (77.0%) |
| Total (Category) | 1,722 (51.5%) | 1,620 (48.5%) |
| Total (Overall) | 3,409 (55.8%) | 2,705 (44.2%) |
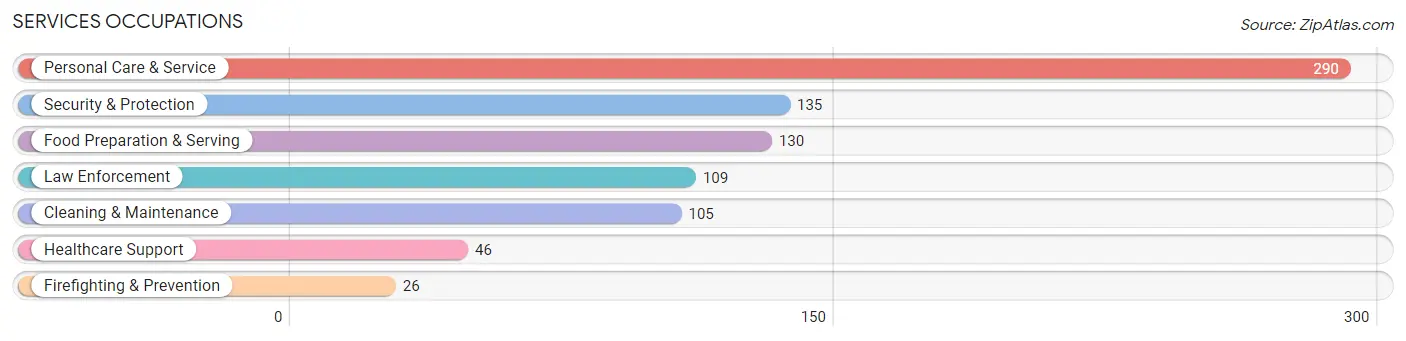
Services Occupations
The most common Services occupations in Elwood are Personal Care & Service (290 | 4.7%), Security & Protection (135 | 2.2%), Food Preparation & Serving (130 | 2.1%), Law Enforcement (109 | 1.8%), and Cleaning & Maintenance (105 | 1.7%).
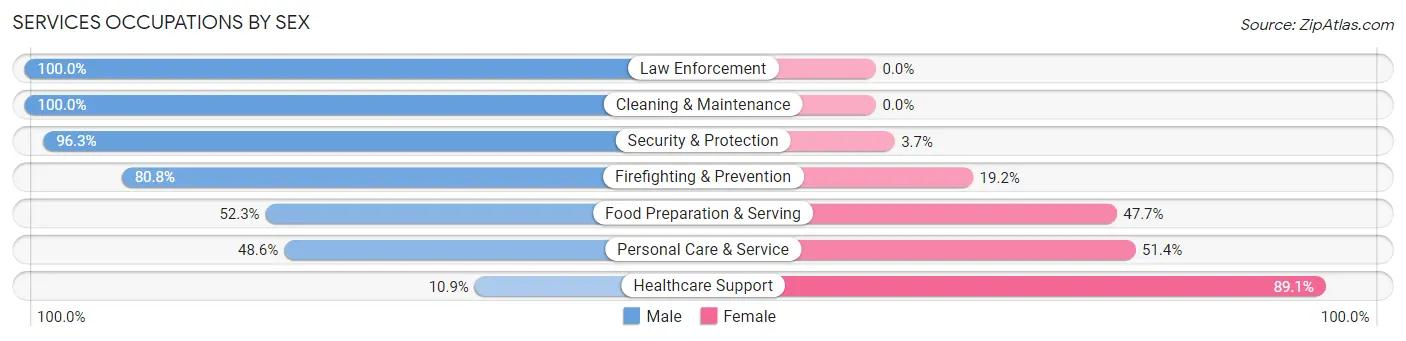
Services Occupations by Sex
Within the Services occupations in Elwood, the most male-oriented occupations are Law Enforcement (100.0%), Cleaning & Maintenance (100.0%), and Security & Protection (96.3%), while the most female-oriented occupations are Healthcare Support (89.1%), Personal Care & Service (51.4%), and Food Preparation & Serving (47.7%).
| Occupation | Male | Female |
| Healthcare Support | 5 (10.9%) | 41 (89.1%) |
| Security & Protection | 130 (96.3%) | 5 (3.7%) |
| Firefighting & Prevention | 21 (80.8%) | 5 (19.2%) |
| Law Enforcement | 109 (100.0%) | 0 (0.0%) |
| Food Preparation & Serving | 68 (52.3%) | 62 (47.7%) |
| Cleaning & Maintenance | 105 (100.0%) | 0 (0.0%) |
| Personal Care & Service | 141 (48.6%) | 149 (51.4%) |
| Total (Category) | 449 (63.6%) | 257 (36.4%) |
| Total (Overall) | 3,409 (55.8%) | 2,705 (44.2%) |
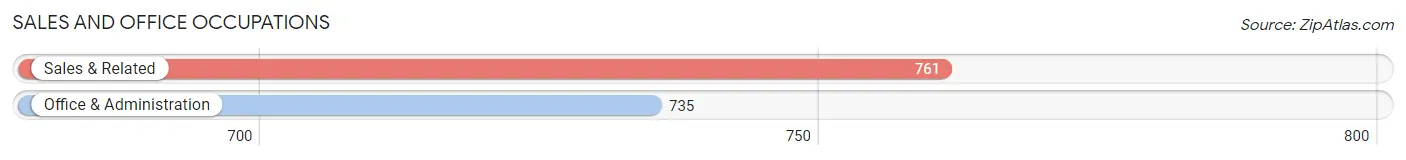
Sales and Office Occupations
The most common Sales and Office occupations in Elwood are Sales & Related (761 | 12.4%), and Office & Administration (735 | 12.0%).
Sales and Office Occupations by Sex
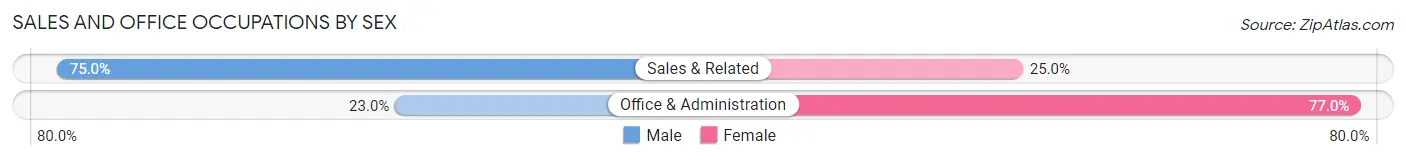
| Occupation | Male | Female |
| Sales & Related | 571 (75.0%) | 190 (25.0%) |
| Office & Administration | 169 (23.0%) | 566 (77.0%) |
| Total (Category) | 740 (49.5%) | 756 (50.5%) |
| Total (Overall) | 3,409 (55.8%) | 2,705 (44.2%) |
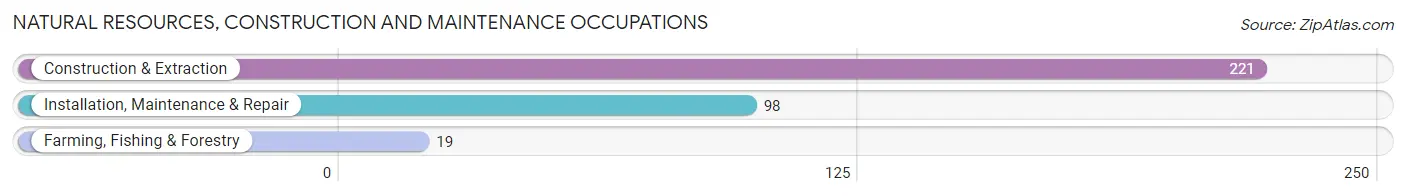
Natural Resources, Construction and Maintenance Occupations
The most common Natural Resources, Construction and Maintenance occupations in Elwood are Construction & Extraction (221 | 3.6%), Installation, Maintenance & Repair (98 | 1.6%), and Farming, Fishing & Forestry (19 | 0.3%).
Natural Resources, Construction and Maintenance Occupations by Sex
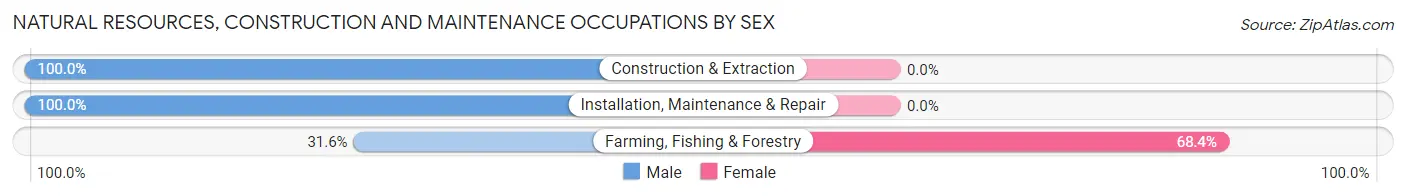
| Occupation | Male | Female |
| Farming, Fishing & Forestry | 6 (31.6%) | 13 (68.4%) |
| Construction & Extraction | 221 (100.0%) | 0 (0.0%) |
| Installation, Maintenance & Repair | 98 (100.0%) | 0 (0.0%) |
| Total (Category) | 325 (96.2%) | 13 (3.8%) |
| Total (Overall) | 3,409 (55.8%) | 2,705 (44.2%) |
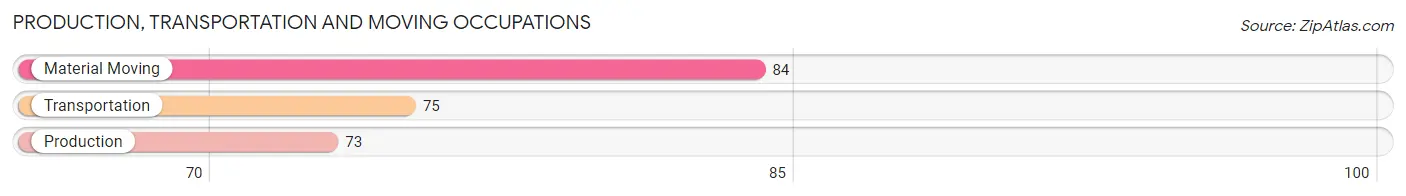
Production, Transportation and Moving Occupations
The most common Production, Transportation and Moving occupations in Elwood are Material Moving (84 | 1.4%), Transportation (75 | 1.2%), and Production (73 | 1.2%).
Production, Transportation and Moving Occupations by Sex
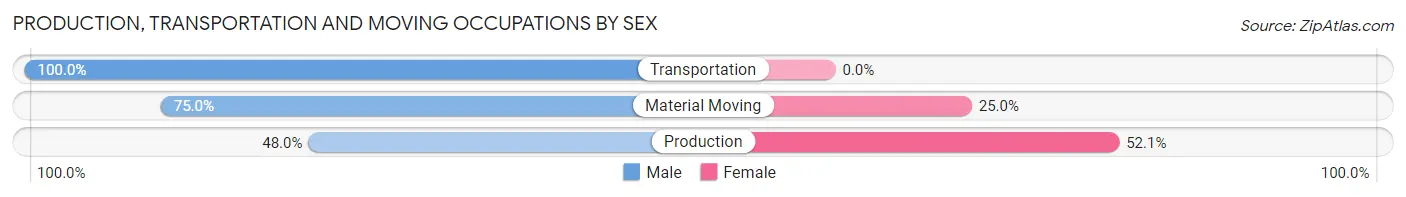
| Occupation | Male | Female |
| Production | 35 (47.9%) | 38 (52.0%) |
| Transportation | 75 (100.0%) | 0 (0.0%) |
| Material Moving | 63 (75.0%) | 21 (25.0%) |
| Total (Category) | 173 (74.6%) | 59 (25.4%) |
| Total (Overall) | 3,409 (55.8%) | 2,705 (44.2%) |
Employment Industries by Sex in Elwood
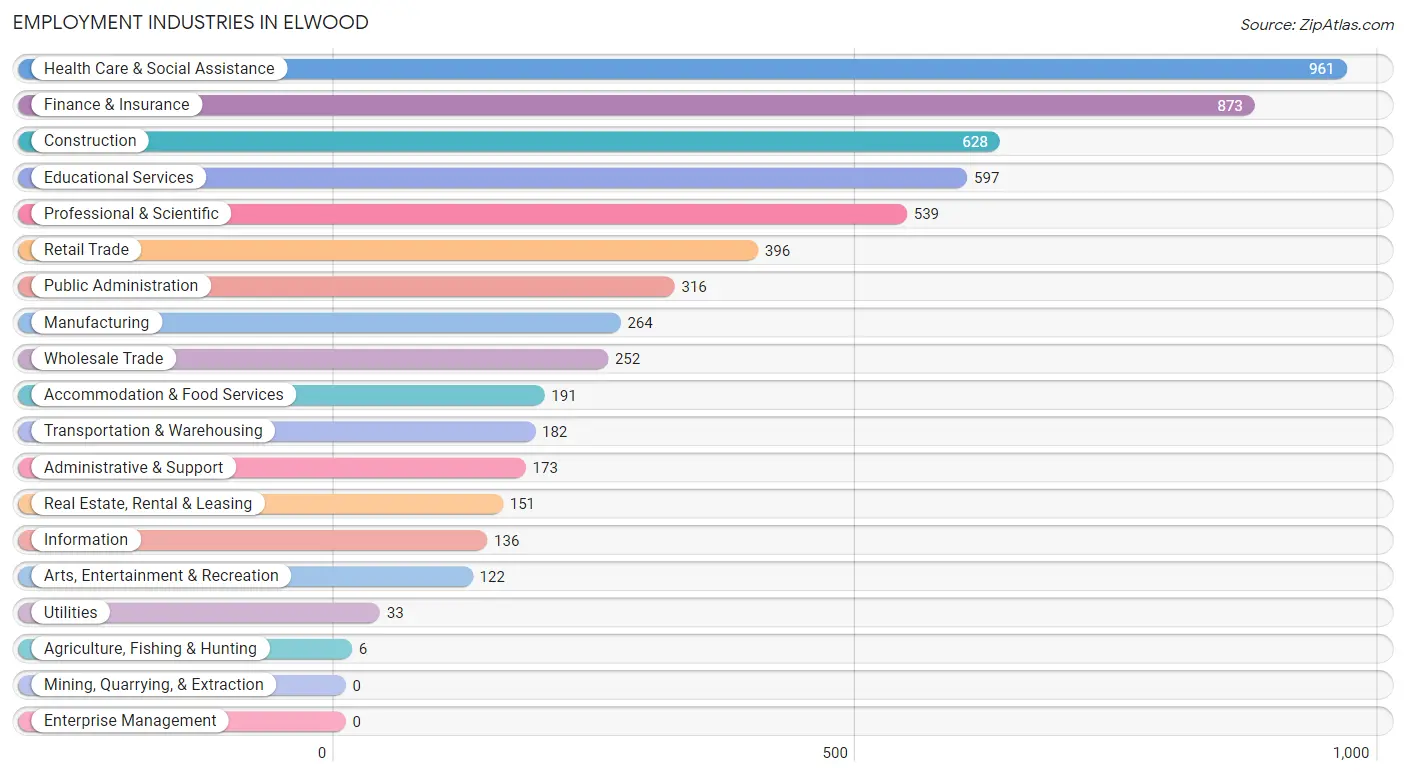
Employment Industries in Elwood
The major employment industries in Elwood include Health Care & Social Assistance (961 | 15.7%), Finance & Insurance (873 | 14.3%), Construction (628 | 10.3%), Educational Services (597 | 9.8%), and Professional & Scientific (539 | 8.8%).
Employment Industries by Sex in Elwood
The Elwood industries that see more men than women are Agriculture, Fishing & Hunting (100.0%), Administrative & Support (96.5%), and Wholesale Trade (96.4%), whereas the industries that tend to have a higher number of women are Utilities (75.8%), Health Care & Social Assistance (72.9%), and Manufacturing (71.6%).
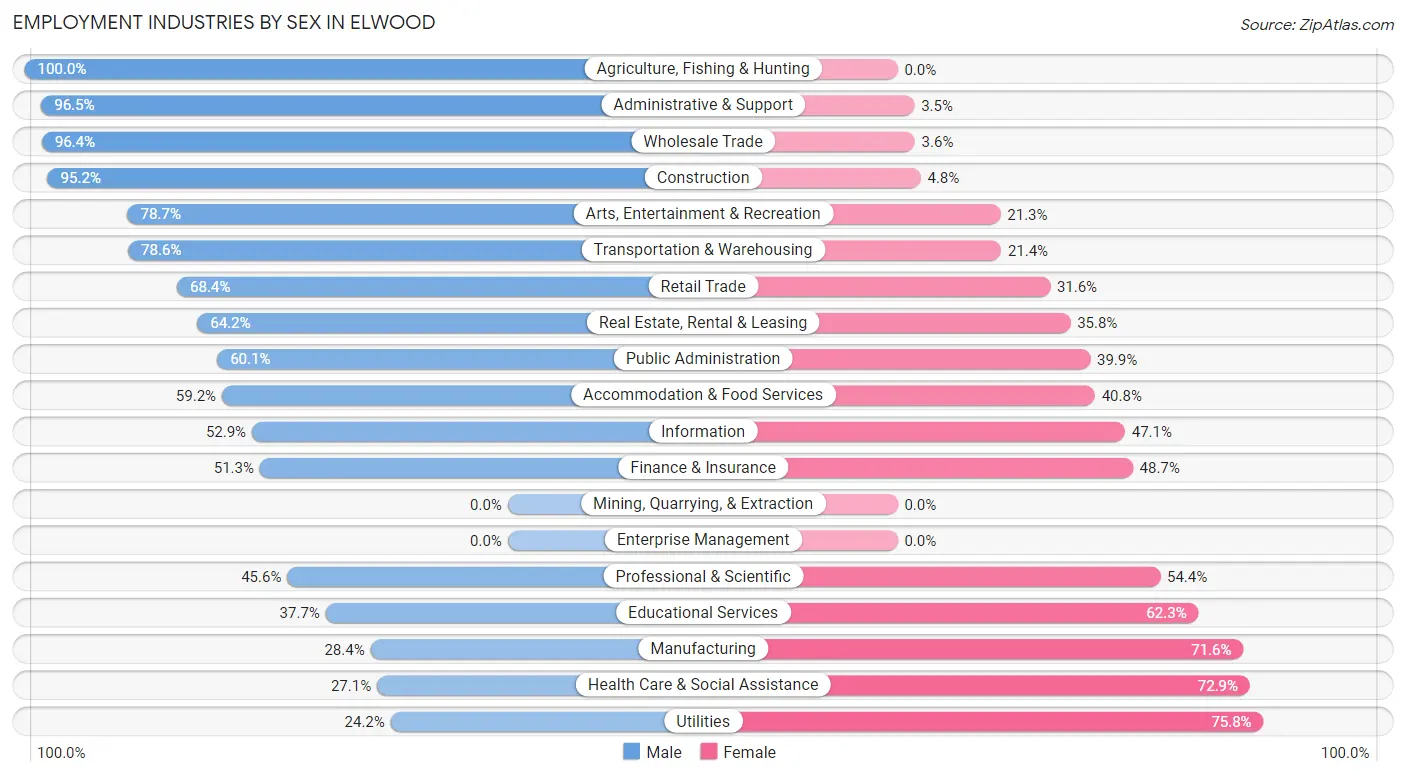
| Industry | Male | Female |
| Agriculture, Fishing & Hunting | 6 (100.0%) | 0 (0.0%) |
| Mining, Quarrying, & Extraction | 0 (0.0%) | 0 (0.0%) |
| Construction | 598 (95.2%) | 30 (4.8%) |
| Manufacturing | 75 (28.4%) | 189 (71.6%) |
| Wholesale Trade | 243 (96.4%) | 9 (3.6%) |
| Retail Trade | 271 (68.4%) | 125 (31.6%) |
| Transportation & Warehousing | 143 (78.6%) | 39 (21.4%) |
| Utilities | 8 (24.2%) | 25 (75.8%) |
| Information | 72 (52.9%) | 64 (47.1%) |
| Finance & Insurance | 448 (51.3%) | 425 (48.7%) |
| Real Estate, Rental & Leasing | 97 (64.2%) | 54 (35.8%) |
| Professional & Scientific | 246 (45.6%) | 293 (54.4%) |
| Enterprise Management | 0 (0.0%) | 0 (0.0%) |
| Administrative & Support | 167 (96.5%) | 6 (3.5%) |
| Educational Services | 225 (37.7%) | 372 (62.3%) |
| Health Care & Social Assistance | 260 (27.1%) | 701 (72.9%) |
| Arts, Entertainment & Recreation | 96 (78.7%) | 26 (21.3%) |
| Accommodation & Food Services | 113 (59.2%) | 78 (40.8%) |
| Public Administration | 190 (60.1%) | 126 (39.9%) |
| Total | 3,409 (55.8%) | 2,705 (44.2%) |
Education in Elwood
School Enrollment in Elwood
The most common levels of schooling among the 2,577 students in Elwood are high school (755 | 29.3%), middle school (567 | 22.0%), and college / undergraduate (398 | 15.4%).
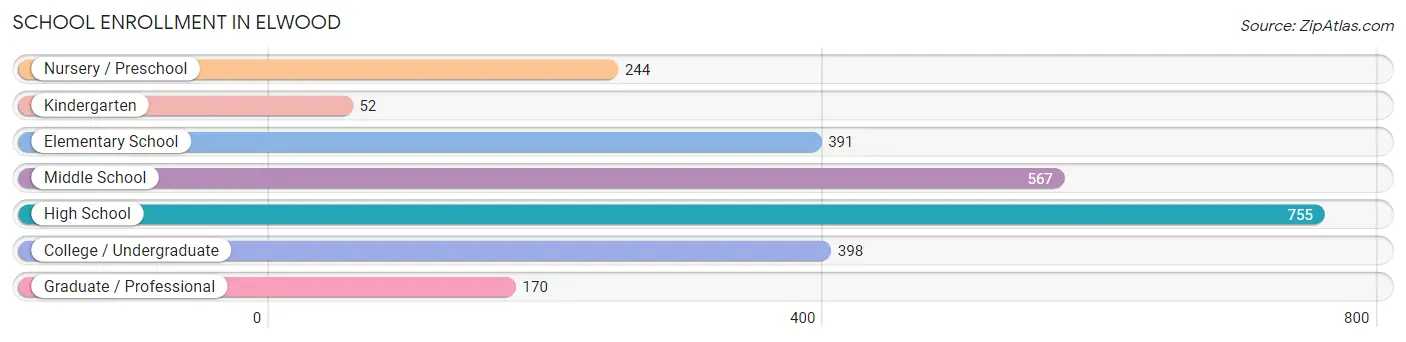
| School Level | # Students | % Students |
| Nursery / Preschool | 244 | 9.5% |
| Kindergarten | 52 | 2.0% |
| Elementary School | 391 | 15.2% |
| Middle School | 567 | 22.0% |
| High School | 755 | 29.3% |
| College / Undergraduate | 398 | 15.4% |
| Graduate / Professional | 170 | 6.6% |
| Total | 2,577 | 100.0% |
School Enrollment by Age by Funding Source in Elwood
Out of a total of 2,577 students who are enrolled in schools in Elwood, 500 (19.4%) attend a private institution, while the remaining 2,077 (80.6%) are enrolled in public schools. The age group of 3 to 4 year olds has the highest likelihood of being enrolled in private schools, with 125 (63.8% in the age bracket) enrolled. Conversely, the age group of 10 to 14 year olds has the lowest likelihood of being enrolled in a private school, with 698 (96.7% in the age bracket) attending a public institution.
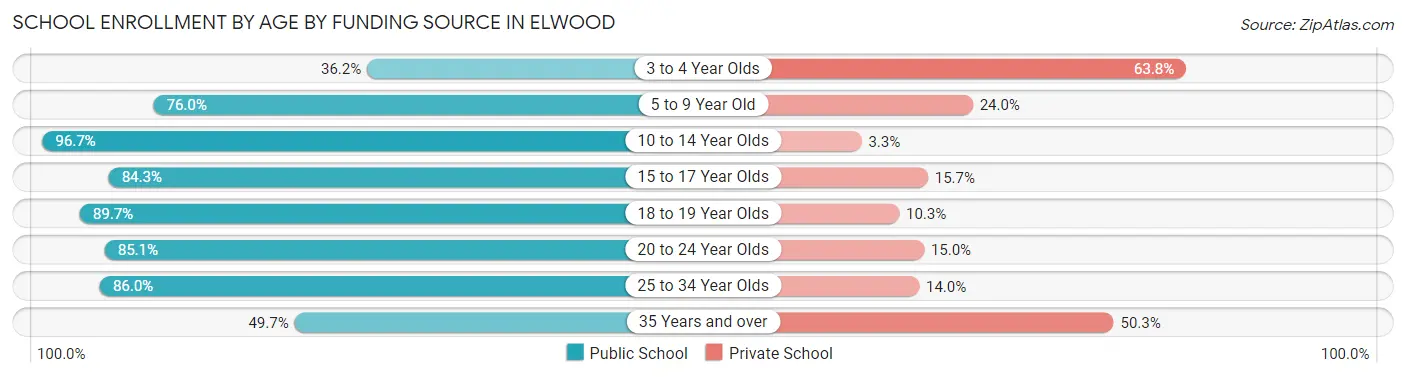
| Age Bracket | Public School | Private School |
| 3 to 4 Year Olds | 71 (36.2%) | 125 (63.8%) |
| 5 to 9 Year Old | 373 (76.0%) | 118 (24.0%) |
| 10 to 14 Year Olds | 698 (96.7%) | 24 (3.3%) |
| 15 to 17 Year Olds | 339 (84.3%) | 63 (15.7%) |
| 18 to 19 Year Olds | 200 (89.7%) | 23 (10.3%) |
| 20 to 24 Year Olds | 256 (85.1%) | 45 (14.9%) |
| 25 to 34 Year Olds | 49 (86.0%) | 8 (14.0%) |
| 35 Years and over | 92 (49.7%) | 93 (50.3%) |
| Total | 2,077 (80.6%) | 500 (19.4%) |
Educational Attainment by Field of Study in Elwood
Business (937 | 22.3%), education (442 | 10.5%), science & technology (389 | 9.2%), psychology (383 | 9.1%), and social sciences (363 | 8.6%) are the most common fields of study among 4,208 individuals in Elwood who have obtained a bachelor's degree or higher.
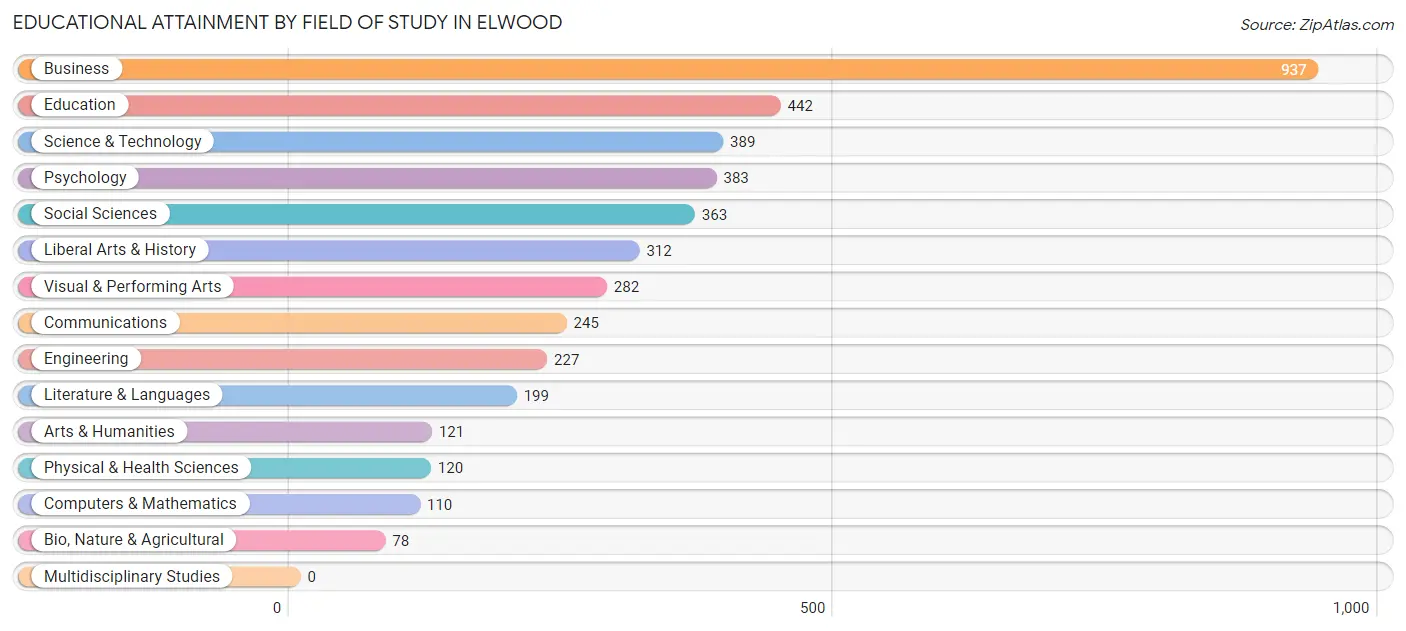
| Field of Study | # Graduates | % Graduates |
| Computers & Mathematics | 110 | 2.6% |
| Bio, Nature & Agricultural | 78 | 1.8% |
| Physical & Health Sciences | 120 | 2.9% |
| Psychology | 383 | 9.1% |
| Social Sciences | 363 | 8.6% |
| Engineering | 227 | 5.4% |
| Multidisciplinary Studies | 0 | 0.0% |
| Science & Technology | 389 | 9.2% |
| Business | 937 | 22.3% |
| Education | 442 | 10.5% |
| Literature & Languages | 199 | 4.7% |
| Liberal Arts & History | 312 | 7.4% |
| Visual & Performing Arts | 282 | 6.7% |
| Communications | 245 | 5.8% |
| Arts & Humanities | 121 | 2.9% |
| Total | 4,208 | 100.0% |
Transportation & Commute in Elwood
Vehicle Availability by Sex in Elwood
The most prevalent vehicle ownership categories in Elwood are males with 2 vehicles (1,340, accounting for 40.4%) and females with 2 vehicles (1,034, making up 53.0%).
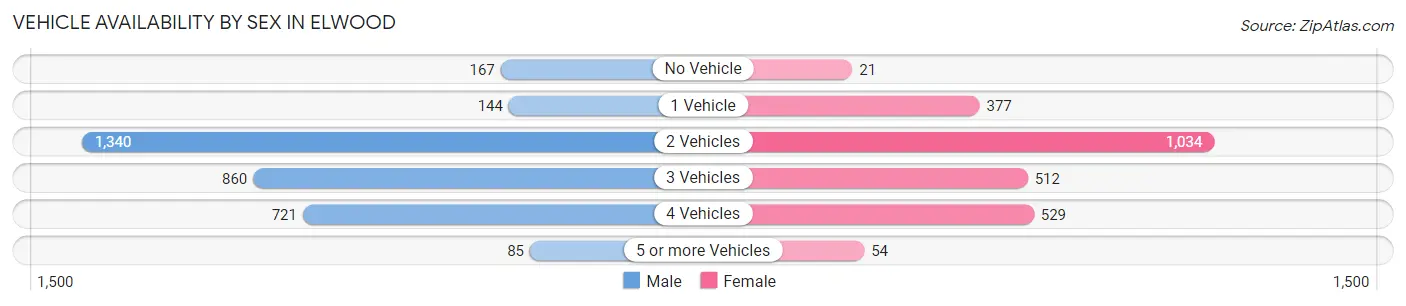
| Vehicles Available | Male | Female |
| No Vehicle | 167 (5.0%) | 21 (0.8%) |
| 1 Vehicle | 144 (4.3%) | 377 (14.9%) |
| 2 Vehicles | 1,340 (40.4%) | 1,034 (40.9%) |
| 3 Vehicles | 860 (25.9%) | 512 (20.3%) |
| 4 Vehicles | 721 (21.7%) | 529 (20.9%) |
| 5 or more Vehicles | 85 (2.6%) | 54 (2.1%) |
| Total | 3,317 (100.0%) | 2,527 (100.0%) |
Commute Time in Elwood
The most frequently occuring commute durations in Elwood are 90 or more minutes (728 commuters, 14.6%), 40 to 44 minutes (600 commuters, 12.1%), and 45 to 59 minutes (563 commuters, 11.3%).
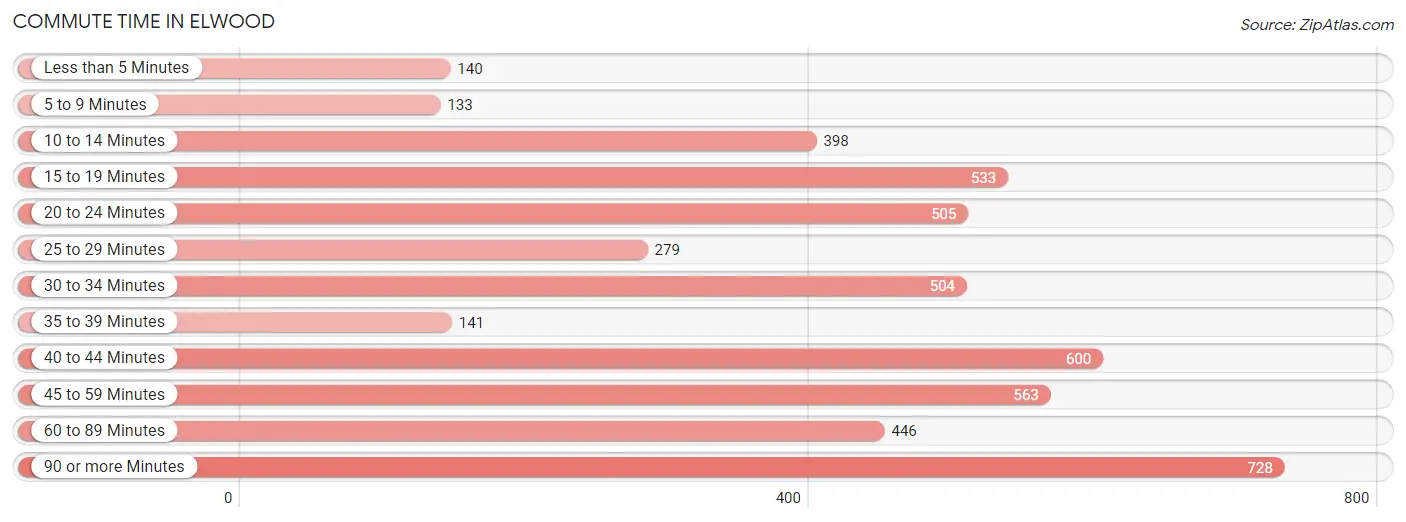
| Commute Time | # Commuters | % Commuters |
| Less than 5 Minutes | 140 | 2.8% |
| 5 to 9 Minutes | 133 | 2.7% |
| 10 to 14 Minutes | 398 | 8.0% |
| 15 to 19 Minutes | 533 | 10.7% |
| 20 to 24 Minutes | 505 | 10.2% |
| 25 to 29 Minutes | 279 | 5.6% |
| 30 to 34 Minutes | 504 | 10.1% |
| 35 to 39 Minutes | 141 | 2.8% |
| 40 to 44 Minutes | 600 | 12.1% |
| 45 to 59 Minutes | 563 | 11.3% |
| 60 to 89 Minutes | 446 | 9.0% |
| 90 or more Minutes | 728 | 14.6% |
Commute Time by Sex in Elwood
The most common commute times in Elwood are 40 to 44 minutes (543 commuters, 19.6%) for males and 45 to 59 minutes (402 commuters, 18.3%) for females.
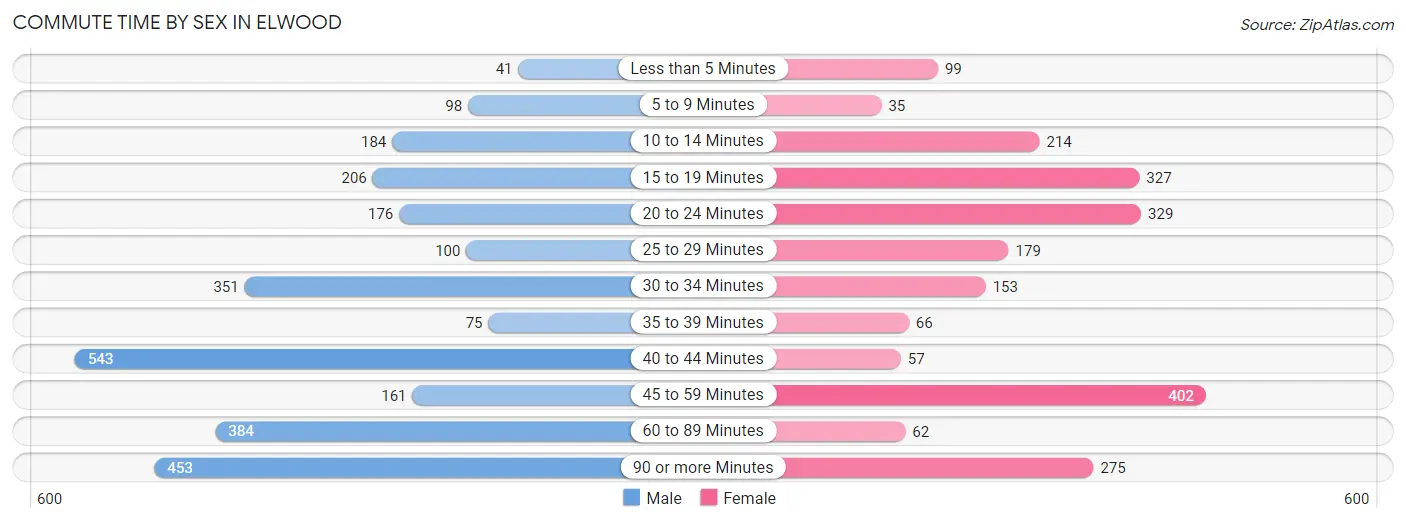
| Commute Time | Male | Female |
| Less than 5 Minutes | 41 (1.5%) | 99 (4.5%) |
| 5 to 9 Minutes | 98 (3.5%) | 35 (1.6%) |
| 10 to 14 Minutes | 184 (6.6%) | 214 (9.7%) |
| 15 to 19 Minutes | 206 (7.4%) | 327 (14.9%) |
| 20 to 24 Minutes | 176 (6.4%) | 329 (15.0%) |
| 25 to 29 Minutes | 100 (3.6%) | 179 (8.1%) |
| 30 to 34 Minutes | 351 (12.7%) | 153 (7.0%) |
| 35 to 39 Minutes | 75 (2.7%) | 66 (3.0%) |
| 40 to 44 Minutes | 543 (19.6%) | 57 (2.6%) |
| 45 to 59 Minutes | 161 (5.8%) | 402 (18.3%) |
| 60 to 89 Minutes | 384 (13.9%) | 62 (2.8%) |
| 90 or more Minutes | 453 (16.3%) | 275 (12.5%) |
Time of Departure to Work by Sex in Elwood
The most frequent times of departure to work in Elwood are 6:30 AM to 6:59 AM (497, 17.9%) for males and 7:00 AM to 7:29 AM (480, 21.8%) for females.
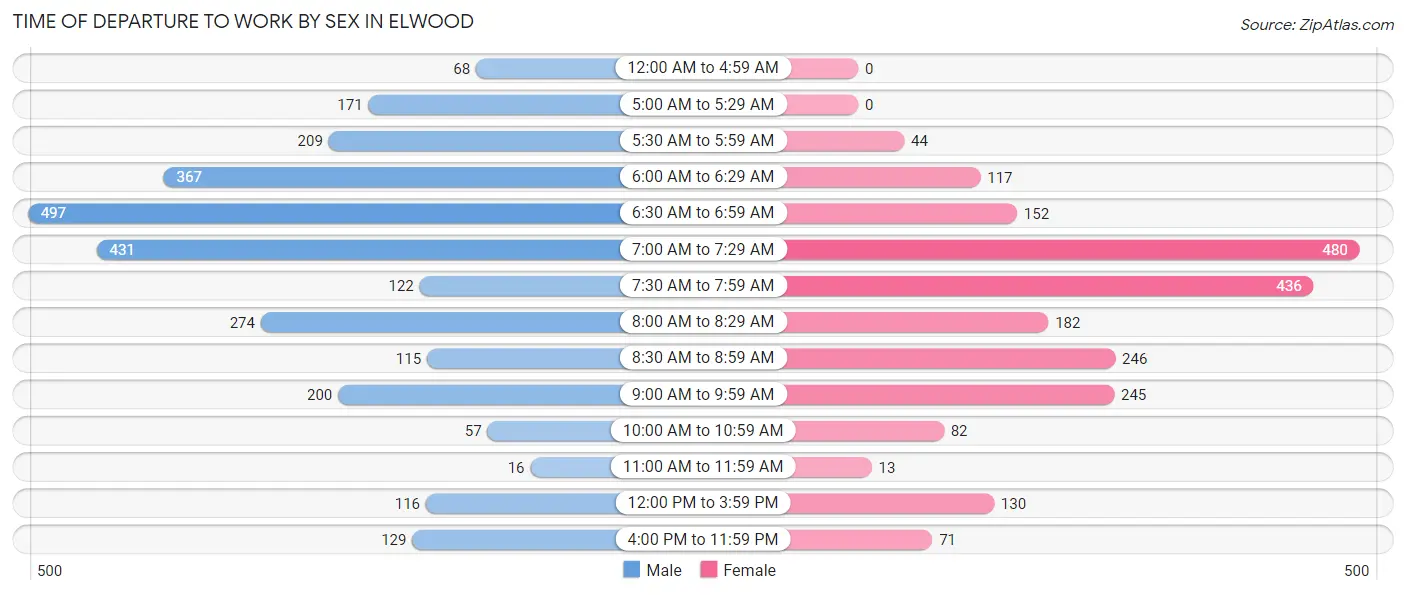
| Time of Departure | Male | Female |
| 12:00 AM to 4:59 AM | 68 (2.5%) | 0 (0.0%) |
| 5:00 AM to 5:29 AM | 171 (6.2%) | 0 (0.0%) |
| 5:30 AM to 5:59 AM | 209 (7.5%) | 44 (2.0%) |
| 6:00 AM to 6:29 AM | 367 (13.2%) | 117 (5.3%) |
| 6:30 AM to 6:59 AM | 497 (17.9%) | 152 (6.9%) |
| 7:00 AM to 7:29 AM | 431 (15.5%) | 480 (21.8%) |
| 7:30 AM to 7:59 AM | 122 (4.4%) | 436 (19.8%) |
| 8:00 AM to 8:29 AM | 274 (9.9%) | 182 (8.3%) |
| 8:30 AM to 8:59 AM | 115 (4.2%) | 246 (11.2%) |
| 9:00 AM to 9:59 AM | 200 (7.2%) | 245 (11.2%) |
| 10:00 AM to 10:59 AM | 57 (2.1%) | 82 (3.7%) |
| 11:00 AM to 11:59 AM | 16 (0.6%) | 13 (0.6%) |
| 12:00 PM to 3:59 PM | 116 (4.2%) | 130 (5.9%) |
| 4:00 PM to 11:59 PM | 129 (4.6%) | 71 (3.2%) |
| Total | 2,772 (100.0%) | 2,198 (100.0%) |
Housing Occupancy in Elwood
Occupancy by Ownership in Elwood
Of the total 3,663 dwellings in Elwood, owner-occupied units account for 3,562 (97.2%), while renter-occupied units make up 101 (2.8%).
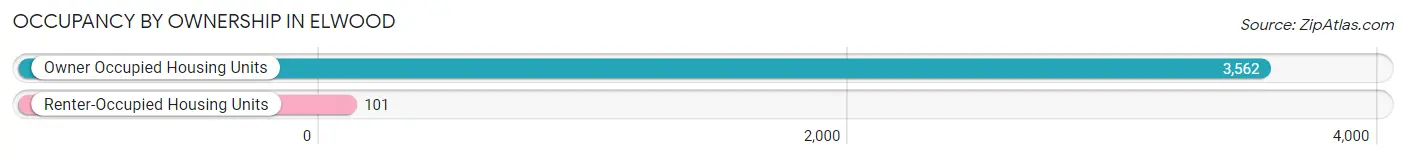
| Occupancy | # Housing Units | % Housing Units |
| Owner Occupied Housing Units | 3,562 | 97.2% |
| Renter-Occupied Housing Units | 101 | 2.8% |
| Total Occupied Housing Units | 3,663 | 100.0% |
Occupancy by Household Size in Elwood
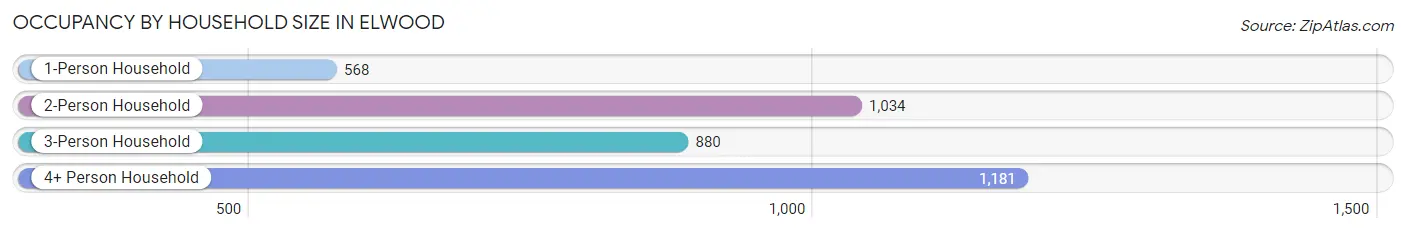
| Household Size | # Housing Units | % Housing Units |
| 1-Person Household | 568 | 15.5% |
| 2-Person Household | 1,034 | 28.2% |
| 3-Person Household | 880 | 24.0% |
| 4+ Person Household | 1,181 | 32.2% |
| Total Housing Units | 3,663 | 100.0% |
Occupancy by Ownership by Household Size in Elwood
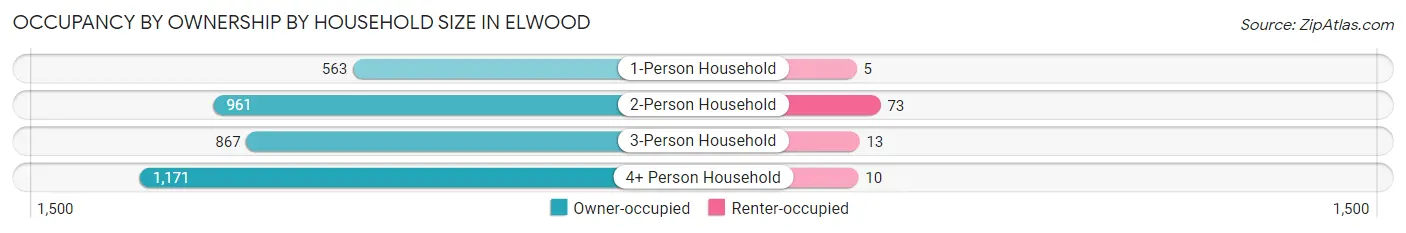
| Household Size | Owner-occupied | Renter-occupied |
| 1-Person Household | 563 (99.1%) | 5 (0.9%) |
| 2-Person Household | 961 (92.9%) | 73 (7.1%) |
| 3-Person Household | 867 (98.5%) | 13 (1.5%) |
| 4+ Person Household | 1,171 (99.2%) | 10 (0.9%) |
| Total Housing Units | 3,562 (97.2%) | 101 (2.8%) |
Occupancy by Educational Attainment in Elwood
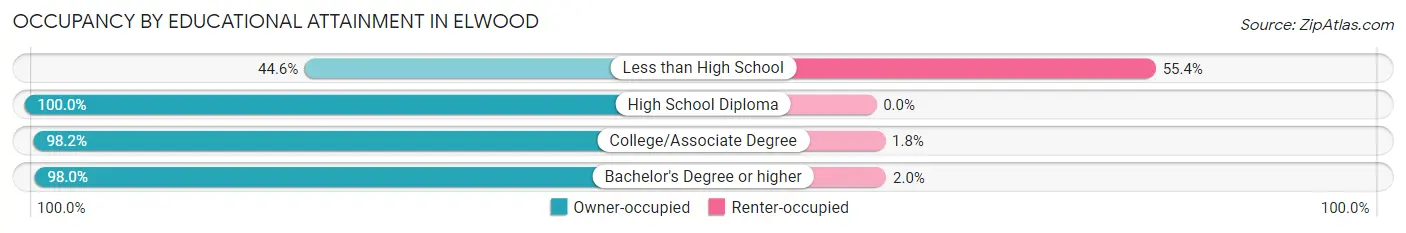
| Household Size | Owner-occupied | Renter-occupied |
| Less than High School | 37 (44.6%) | 46 (55.4%) |
| High School Diploma | 697 (100.0%) | 0 (0.0%) |
| College/Associate Degree | 889 (98.2%) | 16 (1.8%) |
| Bachelor's Degree or higher | 1,939 (98.0%) | 39 (2.0%) |
Occupancy by Age of Householder in Elwood
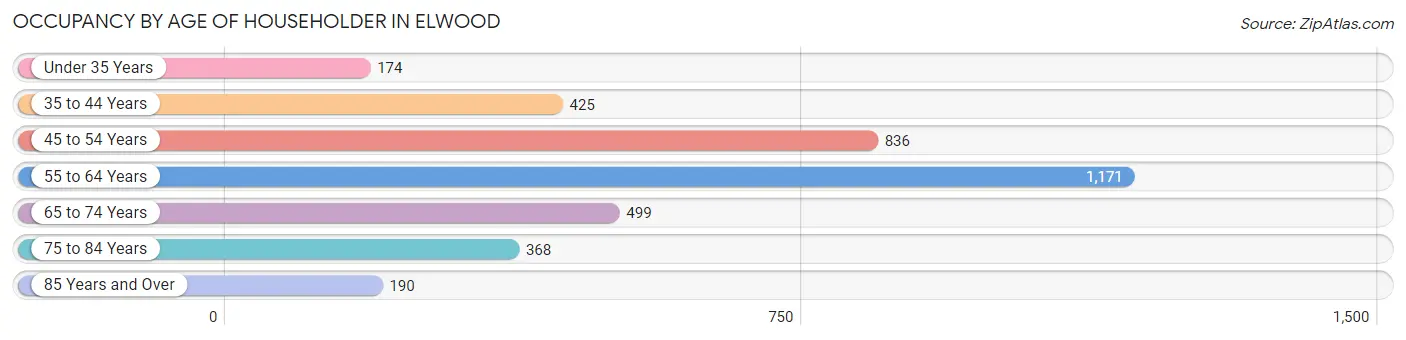
| Age Bracket | # Households | % Households |
| Under 35 Years | 174 | 4.8% |
| 35 to 44 Years | 425 | 11.6% |
| 45 to 54 Years | 836 | 22.8% |
| 55 to 64 Years | 1,171 | 32.0% |
| 65 to 74 Years | 499 | 13.6% |
| 75 to 84 Years | 368 | 10.1% |
| 85 Years and Over | 190 | 5.2% |
| Total | 3,663 | 100.0% |
Housing Finances in Elwood
Median Income by Occupancy in Elwood
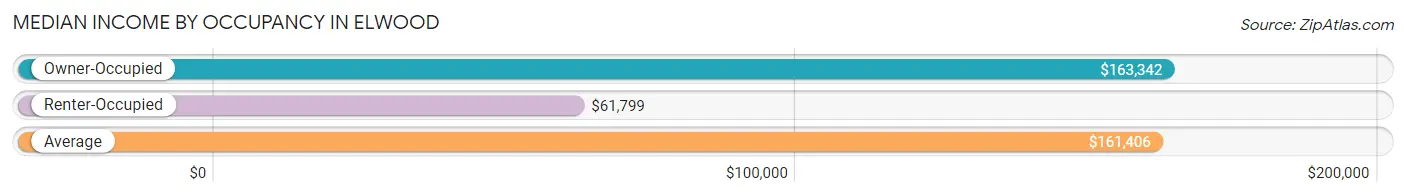
| Occupancy Type | # Households | Median Income |
| Owner-Occupied | 3,562 (97.2%) | $163,342 |
| Renter-Occupied | 101 (2.8%) | $61,799 |
| Average | 3,663 (100.0%) | $161,406 |
Occupancy by Householder Income Bracket in Elwood
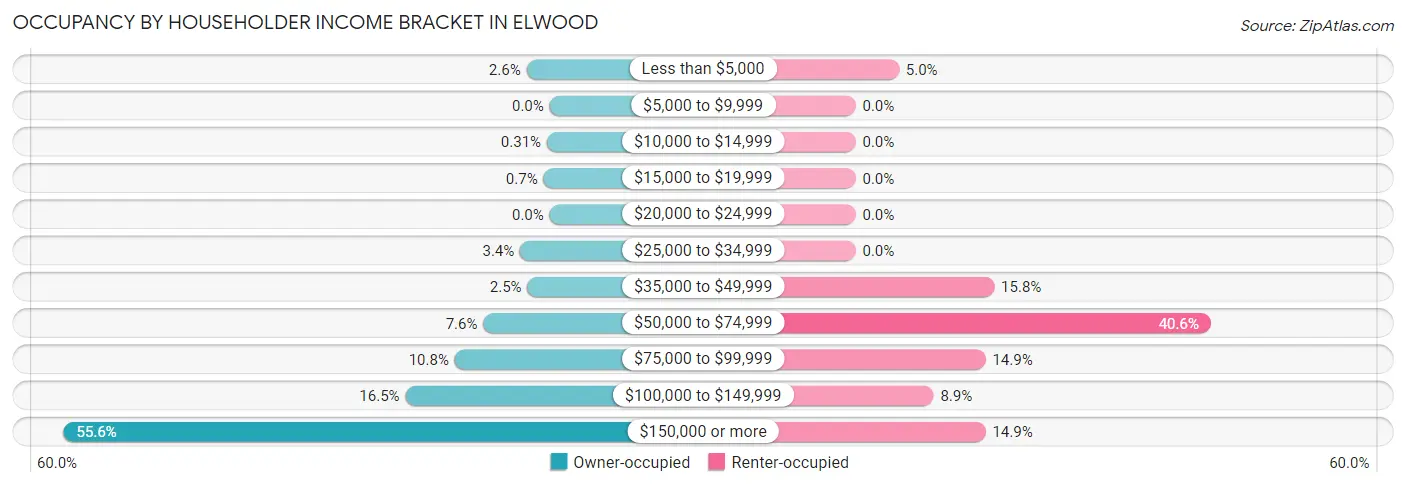
| Income Bracket | Owner-occupied | Renter-occupied |
| Less than $5,000 | 94 (2.6%) | 5 (5.0%) |
| $5,000 to $9,999 | 0 (0.0%) | 0 (0.0%) |
| $10,000 to $14,999 | 11 (0.3%) | 0 (0.0%) |
| $15,000 to $19,999 | 25 (0.7%) | 0 (0.0%) |
| $20,000 to $24,999 | 0 (0.0%) | 0 (0.0%) |
| $25,000 to $34,999 | 120 (3.4%) | 0 (0.0%) |
| $35,000 to $49,999 | 90 (2.5%) | 16 (15.8%) |
| $50,000 to $74,999 | 270 (7.6%) | 41 (40.6%) |
| $75,000 to $99,999 | 386 (10.8%) | 15 (14.8%) |
| $100,000 to $149,999 | 587 (16.5%) | 9 (8.9%) |
| $150,000 or more | 1,979 (55.6%) | 15 (14.8%) |
| Total | 3,562 (100.0%) | 101 (100.0%) |
Monthly Housing Cost Tiers in Elwood
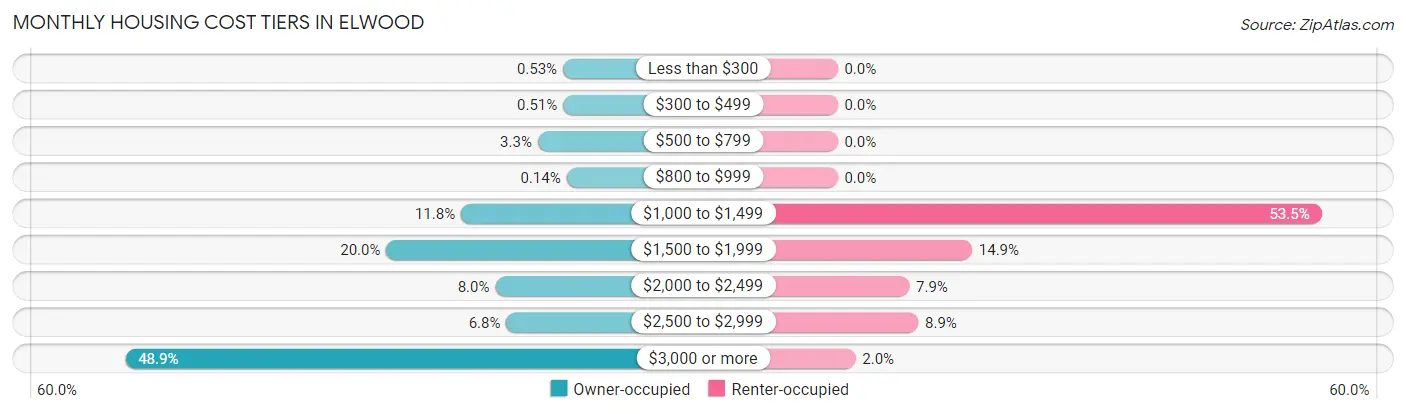
| Monthly Cost | Owner-occupied | Renter-occupied |
| Less than $300 | 19 (0.5%) | 0 (0.0%) |
| $300 to $499 | 18 (0.5%) | 0 (0.0%) |
| $500 to $799 | 118 (3.3%) | 0 (0.0%) |
| $800 to $999 | 5 (0.1%) | 0 (0.0%) |
| $1,000 to $1,499 | 420 (11.8%) | 54 (53.5%) |
| $1,500 to $1,999 | 714 (20.0%) | 15 (14.8%) |
| $2,000 to $2,499 | 285 (8.0%) | 8 (7.9%) |
| $2,500 to $2,999 | 242 (6.8%) | 9 (8.9%) |
| $3,000 or more | 1,741 (48.9%) | 2 (2.0%) |
| Total | 3,562 (100.0%) | 101 (100.0%) |
Physical Housing Characteristics in Elwood
Housing Structures in Elwood
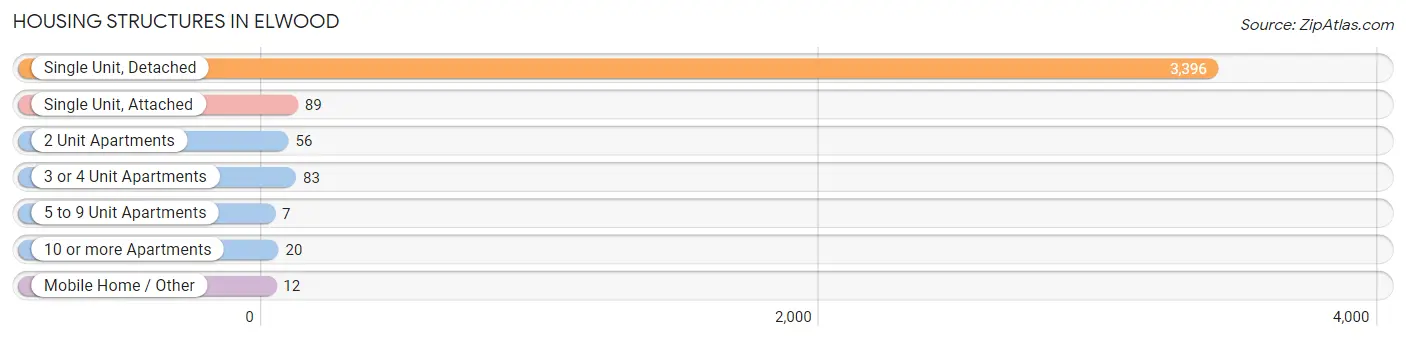
| Structure Type | # Housing Units | % Housing Units |
| Single Unit, Detached | 3,396 | 92.7% |
| Single Unit, Attached | 89 | 2.4% |
| 2 Unit Apartments | 56 | 1.5% |
| 3 or 4 Unit Apartments | 83 | 2.3% |
| 5 to 9 Unit Apartments | 7 | 0.2% |
| 10 or more Apartments | 20 | 0.5% |
| Mobile Home / Other | 12 | 0.3% |
| Total | 3,663 | 100.0% |
Housing Structures by Occupancy in Elwood
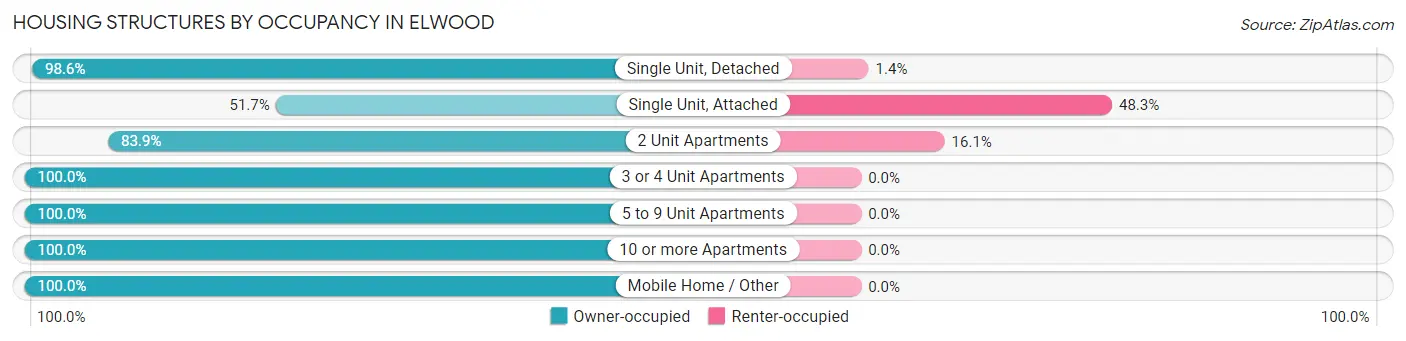
| Structure Type | Owner-occupied | Renter-occupied |
| Single Unit, Detached | 3,347 (98.6%) | 49 (1.4%) |
| Single Unit, Attached | 46 (51.7%) | 43 (48.3%) |
| 2 Unit Apartments | 47 (83.9%) | 9 (16.1%) |
| 3 or 4 Unit Apartments | 83 (100.0%) | 0 (0.0%) |
| 5 to 9 Unit Apartments | 7 (100.0%) | 0 (0.0%) |
| 10 or more Apartments | 20 (100.0%) | 0 (0.0%) |
| Mobile Home / Other | 12 (100.0%) | 0 (0.0%) |
| Total | 3,562 (97.2%) | 101 (2.8%) |
Housing Structures by Number of Rooms in Elwood
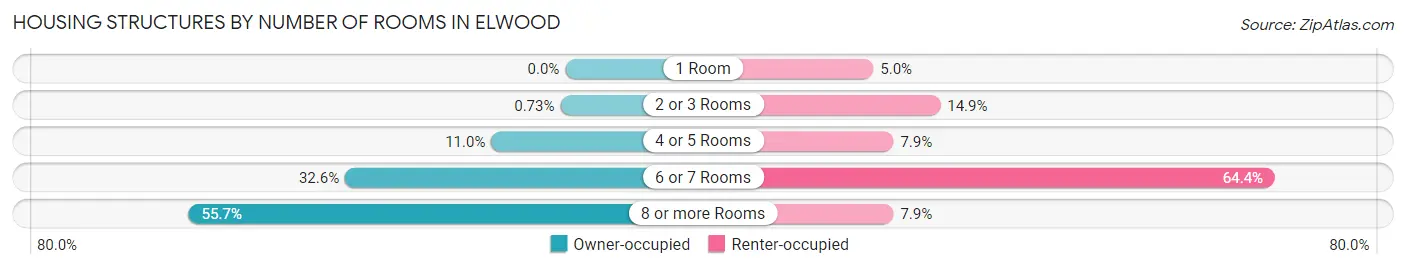
| Number of Rooms | Owner-occupied | Renter-occupied |
| 1 Room | 0 (0.0%) | 5 (5.0%) |
| 2 or 3 Rooms | 26 (0.7%) | 15 (14.8%) |
| 4 or 5 Rooms | 390 (11.0%) | 8 (7.9%) |
| 6 or 7 Rooms | 1,161 (32.6%) | 65 (64.4%) |
| 8 or more Rooms | 1,985 (55.7%) | 8 (7.9%) |
| Total | 3,562 (100.0%) | 101 (100.0%) |
Housing Structure by Heating Type in Elwood
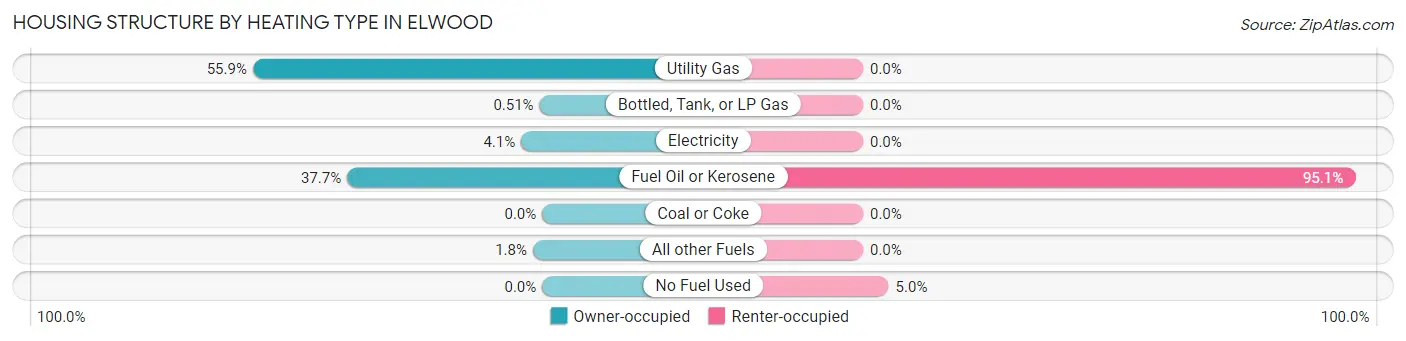
| Heating Type | Owner-occupied | Renter-occupied |
| Utility Gas | 1,992 (55.9%) | 0 (0.0%) |
| Bottled, Tank, or LP Gas | 18 (0.5%) | 0 (0.0%) |
| Electricity | 145 (4.1%) | 0 (0.0%) |
| Fuel Oil or Kerosene | 1,343 (37.7%) | 96 (95.1%) |
| Coal or Coke | 0 (0.0%) | 0 (0.0%) |
| All other Fuels | 64 (1.8%) | 0 (0.0%) |
| No Fuel Used | 0 (0.0%) | 5 (5.0%) |
| Total | 3,562 (100.0%) | 101 (100.0%) |
Household Vehicle Usage in Elwood
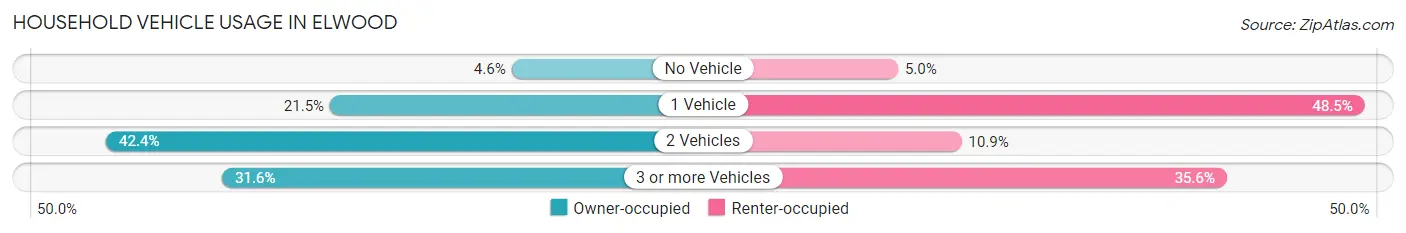
| Vehicles per Household | Owner-occupied | Renter-occupied |
| No Vehicle | 162 (4.5%) | 5 (5.0%) |
| 1 Vehicle | 766 (21.5%) | 49 (48.5%) |
| 2 Vehicles | 1,510 (42.4%) | 11 (10.9%) |
| 3 or more Vehicles | 1,124 (31.6%) | 36 (35.6%) |
| Total | 3,562 (100.0%) | 101 (100.0%) |
Real Estate & Mortgages in Elwood
Real Estate and Mortgage Overview in Elwood
| Characteristic | Without Mortgage | With Mortgage |
| Housing Units | 1,483 | 2,079 |
| Median Property Value | $614,400 | $657,300 |
| Median Household Income | $124,267 | $1,349 |
| Monthly Housing Costs | $1,501 | $1,714 |
| Real Estate Taxes | $10,001 | $11 |
Property Value by Mortgage Status in Elwood
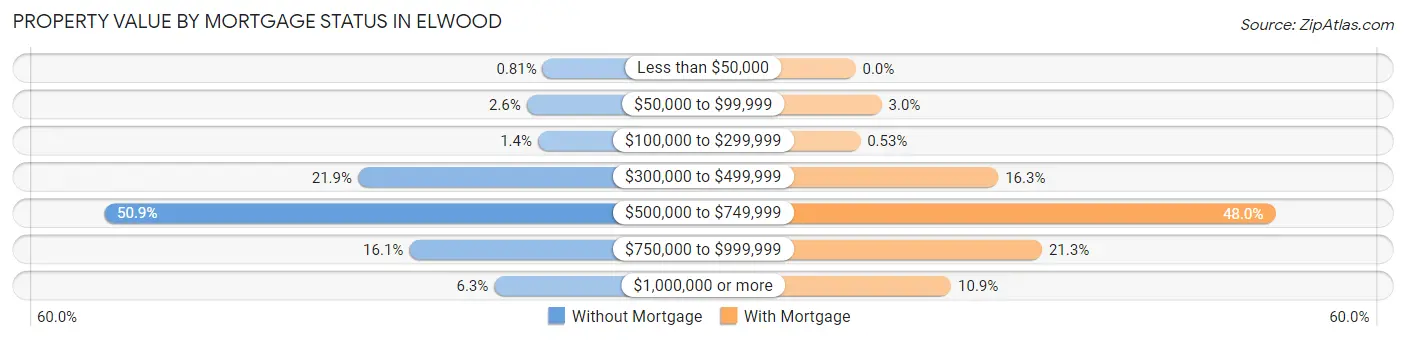
| Property Value | Without Mortgage | With Mortgage |
| Less than $50,000 | 12 (0.8%) | 0 (0.0%) |
| $50,000 to $99,999 | 39 (2.6%) | 62 (3.0%) |
| $100,000 to $299,999 | 20 (1.3%) | 11 (0.5%) |
| $300,000 to $499,999 | 325 (21.9%) | 339 (16.3%) |
| $500,000 to $749,999 | 755 (50.9%) | 997 (48.0%) |
| $750,000 to $999,999 | 238 (16.1%) | 443 (21.3%) |
| $1,000,000 or more | 94 (6.3%) | 227 (10.9%) |
| Total | 1,483 (100.0%) | 2,079 (100.0%) |
Household Income by Mortgage Status in Elwood
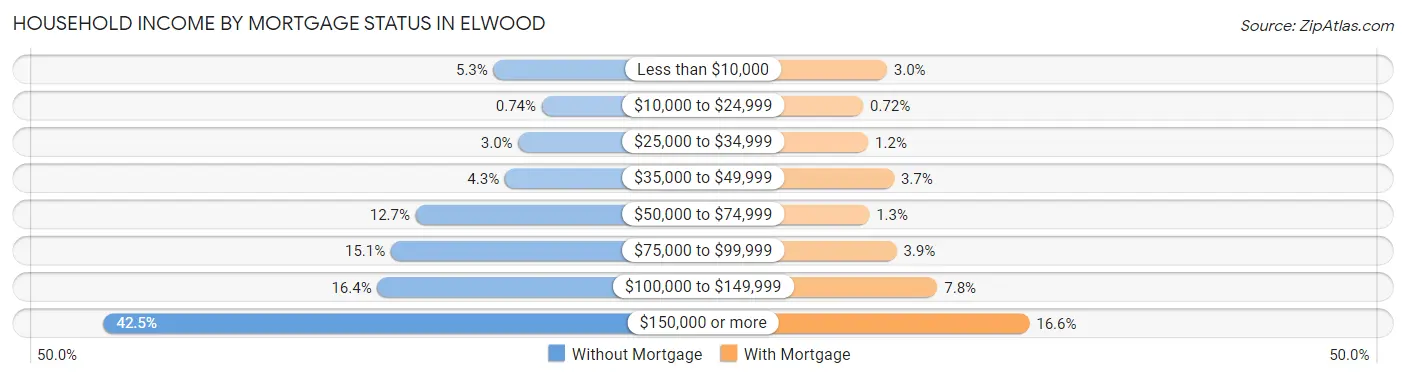
| Household Income | Without Mortgage | With Mortgage |
| Less than $10,000 | 79 (5.3%) | 62 (3.0%) |
| $10,000 to $24,999 | 11 (0.7%) | 15 (0.7%) |
| $25,000 to $34,999 | 44 (3.0%) | 25 (1.2%) |
| $35,000 to $49,999 | 63 (4.3%) | 76 (3.7%) |
| $50,000 to $74,999 | 189 (12.7%) | 27 (1.3%) |
| $75,000 to $99,999 | 224 (15.1%) | 81 (3.9%) |
| $100,000 to $149,999 | 243 (16.4%) | 162 (7.8%) |
| $150,000 or more | 630 (42.5%) | 344 (16.6%) |
| Total | 1,483 (100.0%) | 2,079 (100.0%) |
Property Value to Household Income Ratio in Elwood
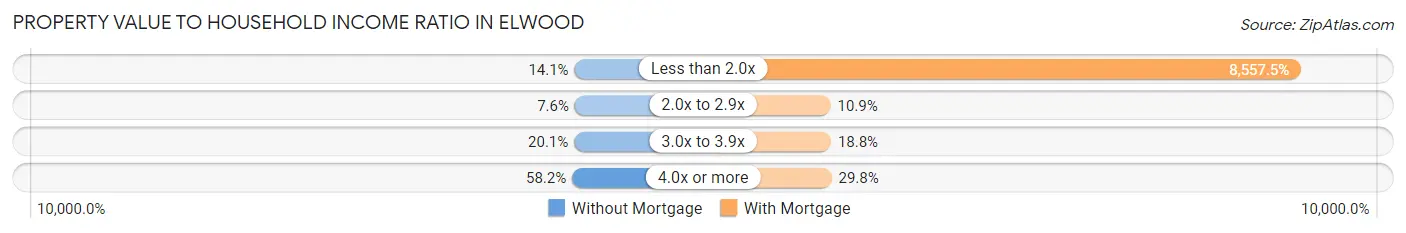
| Value-to-Income Ratio | Without Mortgage | With Mortgage |
| Less than 2.0x | 209 (14.1%) | 177,911 (8,557.5%) |
| 2.0x to 2.9x | 113 (7.6%) | 226 (10.9%) |
| 3.0x to 3.9x | 298 (20.1%) | 390 (18.8%) |
| 4.0x or more | 863 (58.2%) | 620 (29.8%) |
| Total | 1,483 (100.0%) | 2,079 (100.0%) |
Real Estate Taxes by Mortgage Status in Elwood
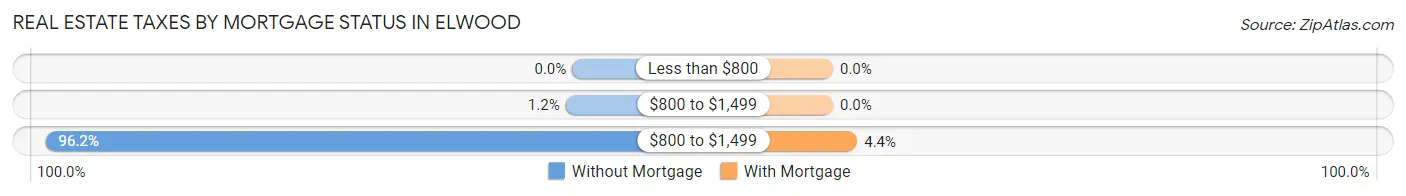
| Property Taxes | Without Mortgage | With Mortgage |
| Less than $800 | 0 (0.0%) | 0 (0.0%) |
| $800 to $1,499 | 18 (1.2%) | 0 (0.0%) |
| $800 to $1,499 | 1,426 (96.2%) | 92 (4.4%) |
| Total | 1,483 (100.0%) | 2,079 (100.0%) |
Health & Disability in Elwood
Health Insurance Coverage by Age in Elwood
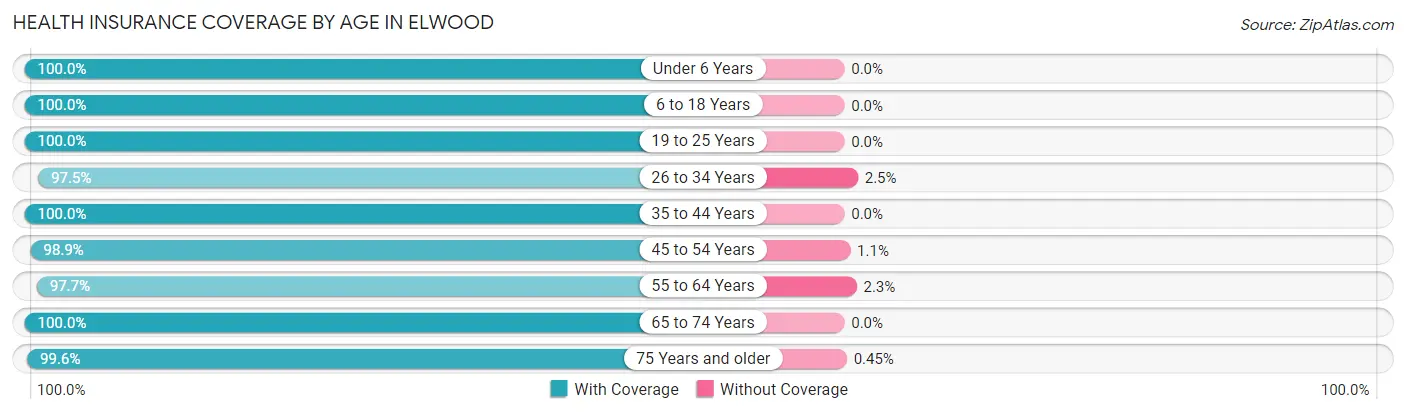
| Age Bracket | With Coverage | Without Coverage |
| Under 6 Years | 584 (100.0%) | 0 (0.0%) |
| 6 to 18 Years | 1,701 (100.0%) | 0 (0.0%) |
| 19 to 25 Years | 1,159 (100.0%) | 0 (0.0%) |
| 26 to 34 Years | 890 (97.5%) | 23 (2.5%) |
| 35 to 44 Years | 1,031 (100.0%) | 0 (0.0%) |
| 45 to 54 Years | 1,542 (98.9%) | 17 (1.1%) |
| 55 to 64 Years | 2,102 (97.7%) | 49 (2.3%) |
| 65 to 74 Years | 899 (100.0%) | 0 (0.0%) |
| 75 Years and older | 1,097 (99.6%) | 5 (0.4%) |
| Total | 11,005 (99.2%) | 94 (0.9%) |
Health Insurance Coverage by Citizenship Status in Elwood
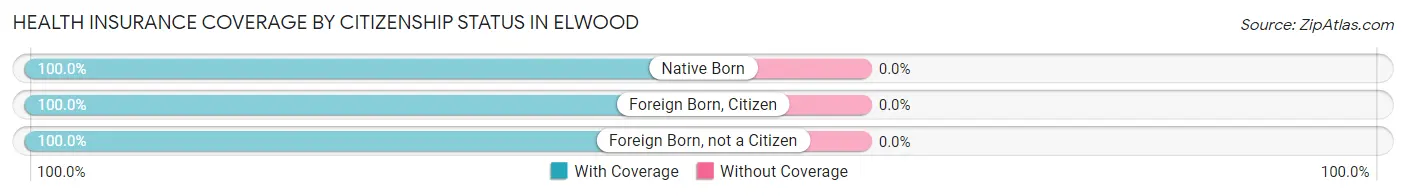
| Citizenship Status | With Coverage | Without Coverage |
| Native Born | 584 (100.0%) | 0 (0.0%) |
| Foreign Born, Citizen | 1,701 (100.0%) | 0 (0.0%) |
| Foreign Born, not a Citizen | 1,159 (100.0%) | 0 (0.0%) |
Health Insurance Coverage by Household Income in Elwood
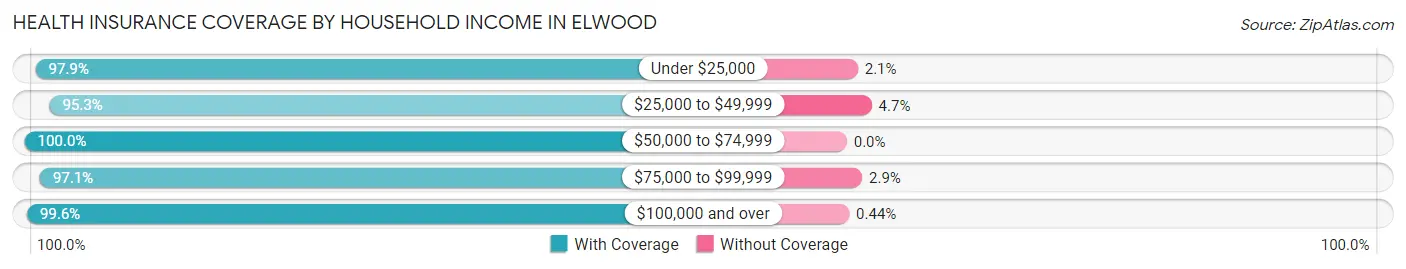
| Household Income | With Coverage | Without Coverage |
| Under $25,000 | 238 (97.9%) | 5 (2.1%) |
| $25,000 to $49,999 | 348 (95.3%) | 17 (4.7%) |
| $50,000 to $74,999 | 497 (100.0%) | 0 (0.0%) |
| $75,000 to $99,999 | 1,152 (97.1%) | 34 (2.9%) |
| $100,000 and over | 8,668 (99.6%) | 38 (0.4%) |
Public vs Private Health Insurance Coverage by Age in Elwood
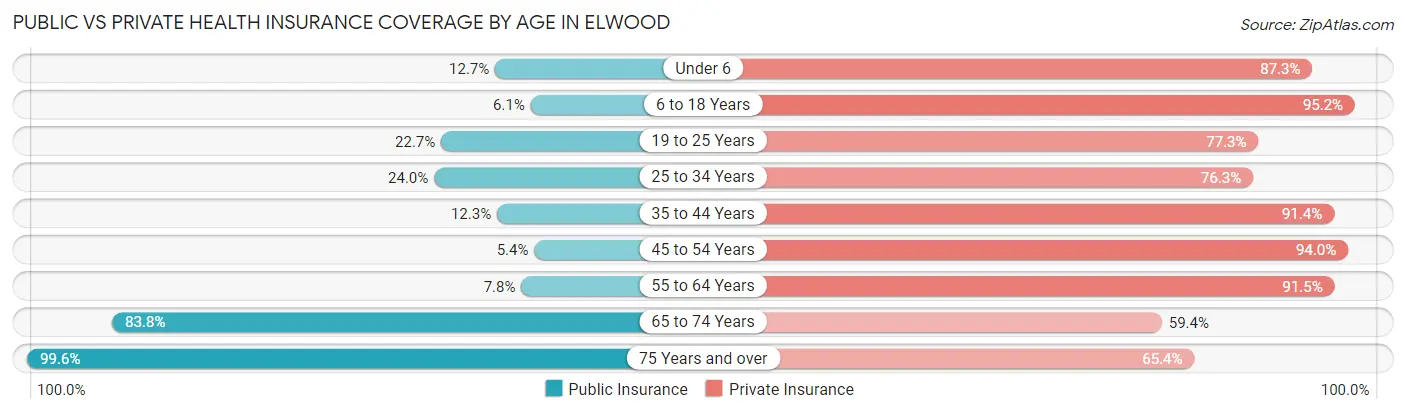
| Age Bracket | Public Insurance | Private Insurance |
| Under 6 | 74 (12.7%) | 510 (87.3%) |
| 6 to 18 Years | 103 (6.1%) | 1,620 (95.2%) |
| 19 to 25 Years | 263 (22.7%) | 896 (77.3%) |
| 25 to 34 Years | 219 (24.0%) | 697 (76.3%) |
| 35 to 44 Years | 127 (12.3%) | 942 (91.4%) |
| 45 to 54 Years | 84 (5.4%) | 1,465 (94.0%) |
| 55 to 64 Years | 168 (7.8%) | 1,967 (91.4%) |
| 65 to 74 Years | 753 (83.8%) | 534 (59.4%) |
| 75 Years and over | 1,097 (99.6%) | 721 (65.4%) |
| Total | 2,888 (26.0%) | 9,352 (84.3%) |
Disability Status by Sex by Age in Elwood
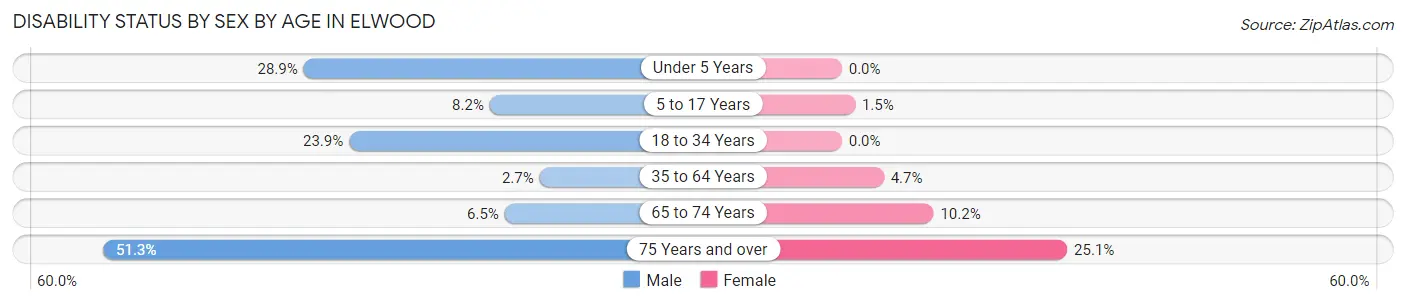
| Age Bracket | Male | Female |
| Under 5 Years | 57 (28.9%) | 0 (0.0%) |
| 5 to 17 Years | 68 (8.2%) | 12 (1.5%) |
| 18 to 34 Years | 327 (23.9%) | 0 (0.0%) |
| 35 to 64 Years | 61 (2.6%) | 114 (4.7%) |
| 65 to 74 Years | 28 (6.5%) | 48 (10.2%) |
| 75 Years and over | 185 (51.2%) | 186 (25.1%) |
Disability Class by Sex by Age in Elwood
Disability Class: Hearing Difficulty
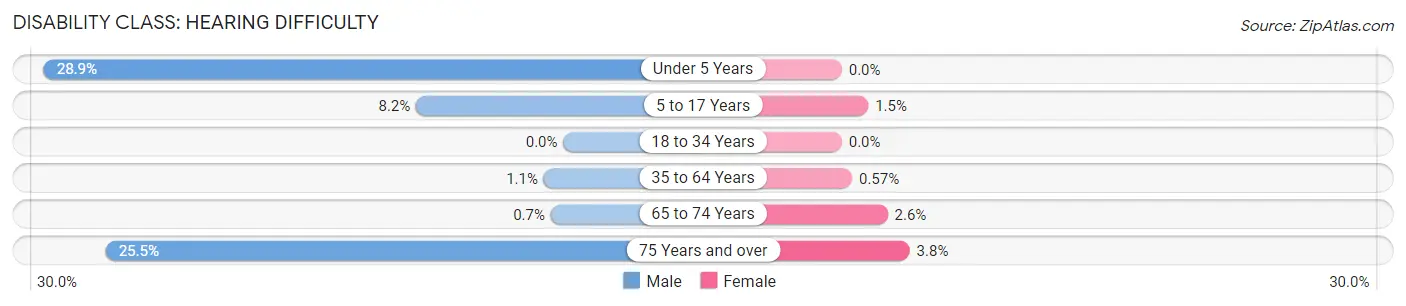
| Age Bracket | Male | Female |
| Under 5 Years | 57 (28.9%) | 0 (0.0%) |
| 5 to 17 Years | 68 (8.2%) | 12 (1.5%) |
| 18 to 34 Years | 0 (0.0%) | 0 (0.0%) |
| 35 to 64 Years | 25 (1.1%) | 14 (0.6%) |
| 65 to 74 Years | 3 (0.7%) | 12 (2.5%) |
| 75 Years and over | 92 (25.5%) | 28 (3.8%) |
Disability Class: Vision Difficulty
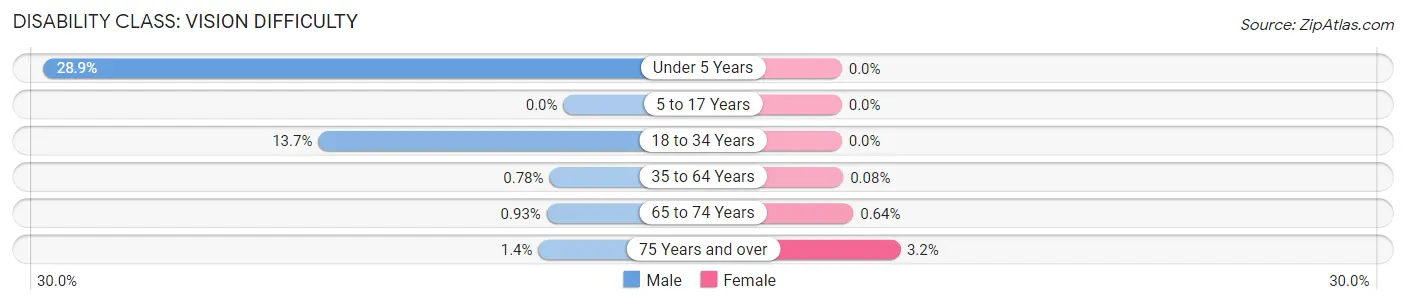
| Age Bracket | Male | Female |
| Under 5 Years | 57 (28.9%) | 0 (0.0%) |
| 5 to 17 Years | 0 (0.0%) | 0 (0.0%) |
| 18 to 34 Years | 187 (13.7%) | 0 (0.0%) |
| 35 to 64 Years | 18 (0.8%) | 2 (0.1%) |
| 65 to 74 Years | 4 (0.9%) | 3 (0.6%) |
| 75 Years and over | 5 (1.4%) | 24 (3.2%) |
Disability Class: Cognitive Difficulty
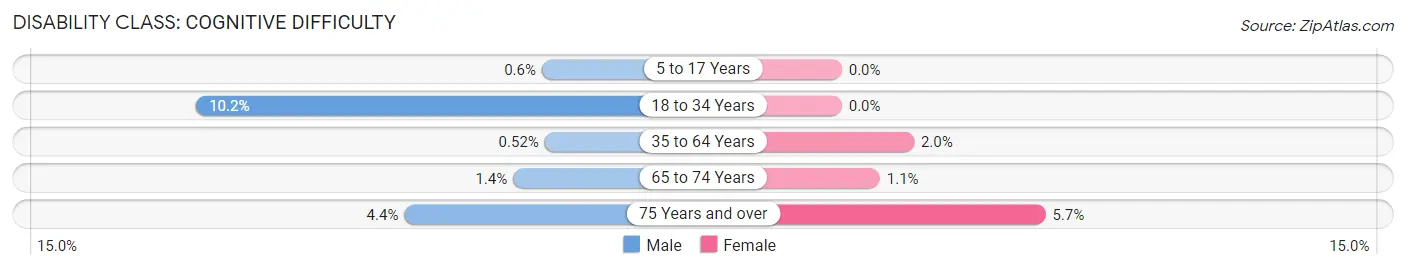
| Age Bracket | Male | Female |
| 5 to 17 Years | 5 (0.6%) | 0 (0.0%) |
| 18 to 34 Years | 140 (10.2%) | 0 (0.0%) |
| 35 to 64 Years | 12 (0.5%) | 49 (2.0%) |
| 65 to 74 Years | 6 (1.4%) | 5 (1.1%) |
| 75 Years and over | 16 (4.4%) | 42 (5.7%) |
Disability Class: Ambulatory Difficulty
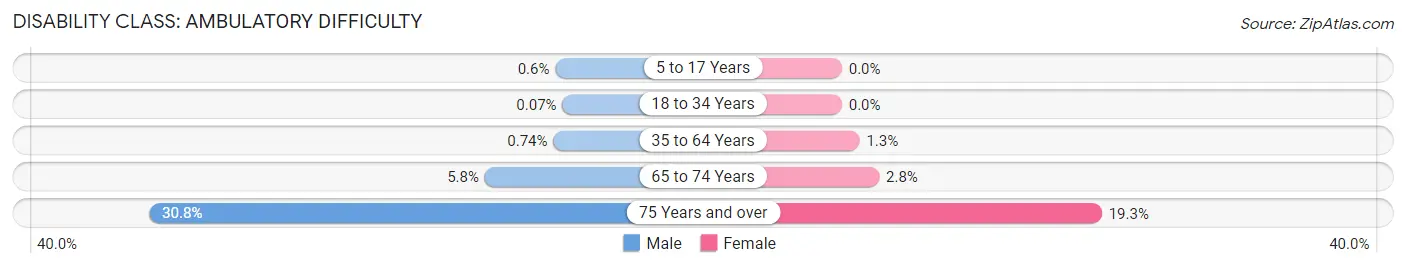
| Age Bracket | Male | Female |
| 5 to 17 Years | 5 (0.6%) | 0 (0.0%) |
| 18 to 34 Years | 1 (0.1%) | 0 (0.0%) |
| 35 to 64 Years | 17 (0.7%) | 32 (1.3%) |
| 65 to 74 Years | 25 (5.8%) | 13 (2.8%) |
| 75 Years and over | 111 (30.7%) | 143 (19.3%) |
Disability Class: Self-Care Difficulty
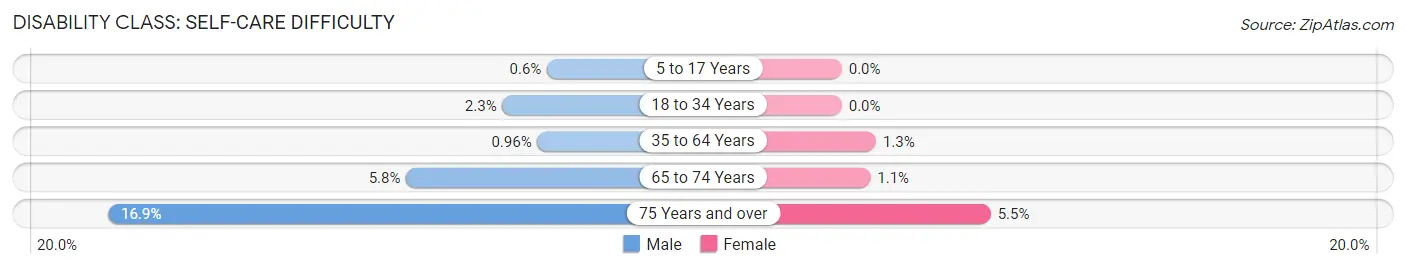
| Age Bracket | Male | Female |
| 5 to 17 Years | 5 (0.6%) | 0 (0.0%) |
| 18 to 34 Years | 31 (2.3%) | 0 (0.0%) |
| 35 to 64 Years | 22 (1.0%) | 31 (1.3%) |
| 65 to 74 Years | 25 (5.8%) | 5 (1.1%) |
| 75 Years and over | 61 (16.9%) | 41 (5.5%) |
Technology Access in Elwood
Computing Device Access in Elwood
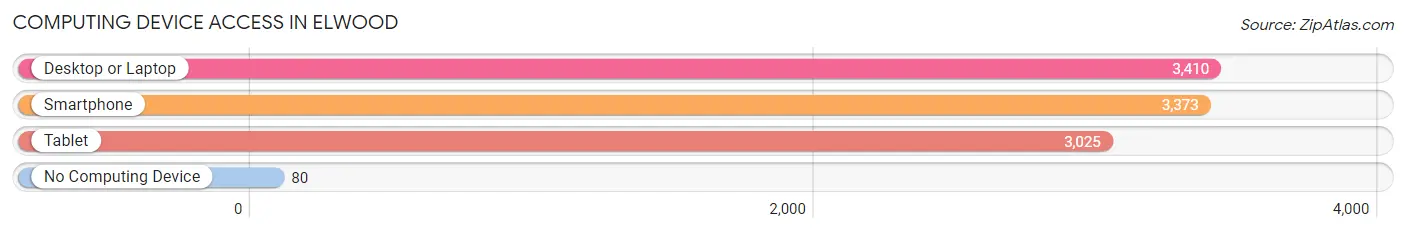
| Device Type | # Households | % Households |
| Desktop or Laptop | 3,410 | 93.1% |
| Smartphone | 3,373 | 92.1% |
| Tablet | 3,025 | 82.6% |
| No Computing Device | 80 | 2.2% |
| Total | 3,663 | 100.0% |
Internet Access in Elwood
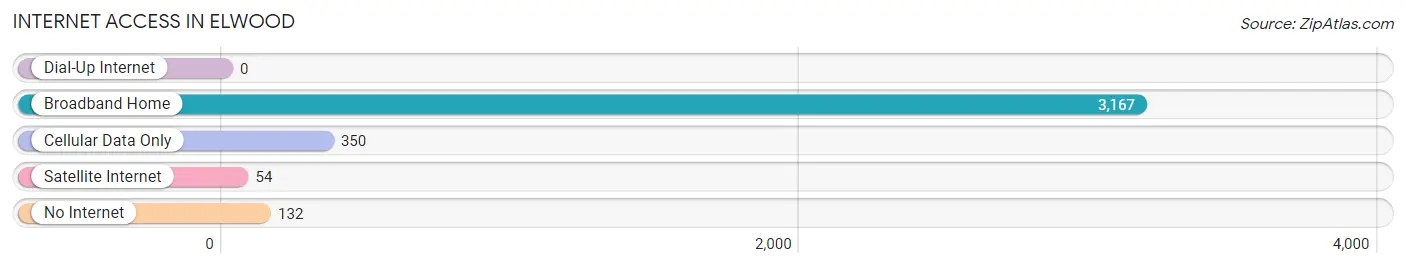
| Internet Type | # Households | % Households |
| Dial-Up Internet | 0 | 0.0% |
| Broadband Home | 3,167 | 86.5% |
| Cellular Data Only | 350 | 9.6% |
| Satellite Internet | 54 | 1.5% |
| No Internet | 132 | 3.6% |
| Total | 3,663 | 100.0% |
Elwood Summary
Elwood is a hamlet located in the Town of Huntington in Suffolk County, New York. It is located on the North Shore of Long Island, approximately 50 miles east of New York City. Elwood is bordered by the hamlets of Greenlawn to the west, East Northport to the east, and Huntington Station to the south.
History
The area that is now Elwood was originally inhabited by the Matinecock Native American tribe. The first European settlers arrived in the area in the 1650s, and the hamlet was officially established in 1845. The name Elwood is derived from the name of a local landowner, Elihu Wood.
In the late 19th century, Elwood was a popular summer resort destination for wealthy New Yorkers. The area was home to several large estates, including the estate of William K. Vanderbilt, which was later converted into a golf course.
In the early 20th century, Elwood began to experience rapid population growth as the area became increasingly suburbanized. The hamlet was home to several large factories, including a paper mill and a brickyard.
Geography
Elwood is located at 40°51'N 73°21'W. It has a total area of 2.3 square miles, all of which is land. The hamlet is located on the North Shore of Long Island, approximately 50 miles east of New York City. It is bordered by the hamlets of Greenlawn to the west, East Northport to the east, and Huntington Station to the south.
The terrain of Elwood is mostly flat, with some rolling hills. The hamlet is located on the edge of the Harbor Hill Moraine, a ridge of glacial debris that runs along the North Shore of Long Island.
Economy
The economy of Elwood is largely based on retail and services. The hamlet is home to several large shopping centers, including the Elwood Shopping Center and the Elwood Commons Shopping Center. It is also home to several restaurants, banks, and other businesses.
The hamlet is also home to several industrial and manufacturing businesses, including a paper mill and a brickyard.
Demographics
As of the 2010 census, Elwood had a population of 8,293. The racial makeup of the hamlet was 79.2% White, 8.2% African American, 0.3% Native American, 5.2% Asian, and 6.9% from other races. Hispanic or Latino of any race were 13.2% of the population.
The median household income in Elwood was $90,945, and the median family income was $103,945. The per capita income was $37,945. About 4.2% of families and 5.7% of the population were below the poverty line.
Elwood is served by the Elwood Union Free School District. The district consists of two elementary schools, one middle school, and one high school.
Common Questions
What is Per Capita Income in Elwood?
Per Capita income in Elwood is $64,726.
What is the Median Family Income in Elwood?
Median Family Income in Elwood is $163,476.
What is the Median Household income in Elwood?
Median Household Income in Elwood is $161,406.
What is Income or Wage Gap in Elwood?
Income or Wage Gap in Elwood is 21.8%.
Women in Elwood earn 78.2 cents for every dollar earned by a man.
What is Inequality or Gini Index in Elwood?
Inequality or Gini Index in Elwood is 0.42.
What is the Total Population of Elwood?
Total Population of Elwood is 11,124.
What is the Total Male Population of Elwood?
Total Male Population of Elwood is 5,485.
What is the Total Female Population of Elwood?
Total Female Population of Elwood is 5,639.
What is the Ratio of Males per 100 Females in Elwood?
There are 97.27 Males per 100 Females in Elwood.
What is the Ratio of Females per 100 Males in Elwood?
There are 102.81 Females per 100 Males in Elwood.
What is the Median Population Age in Elwood?
Median Population Age in Elwood is 46.3 Years.
What is the Average Family Size in Elwood
Average Family Size in Elwood is 3.3 People.
What is the Average Household Size in Elwood
Average Household Size in Elwood is 3.0 People.
How Large is the Labor Force in Elwood?
There are 6,262 People in the Labor Forcein in Elwood.
What is the Percentage of People in the Labor Force in Elwood?
67.9% of People are in the Labor Force in Elwood.
What is the Unemployment Rate in Elwood?
Unemployment Rate in Elwood is 2.4%.