Wappingers Falls, NY Map & Demographics
Wappingers Falls Map
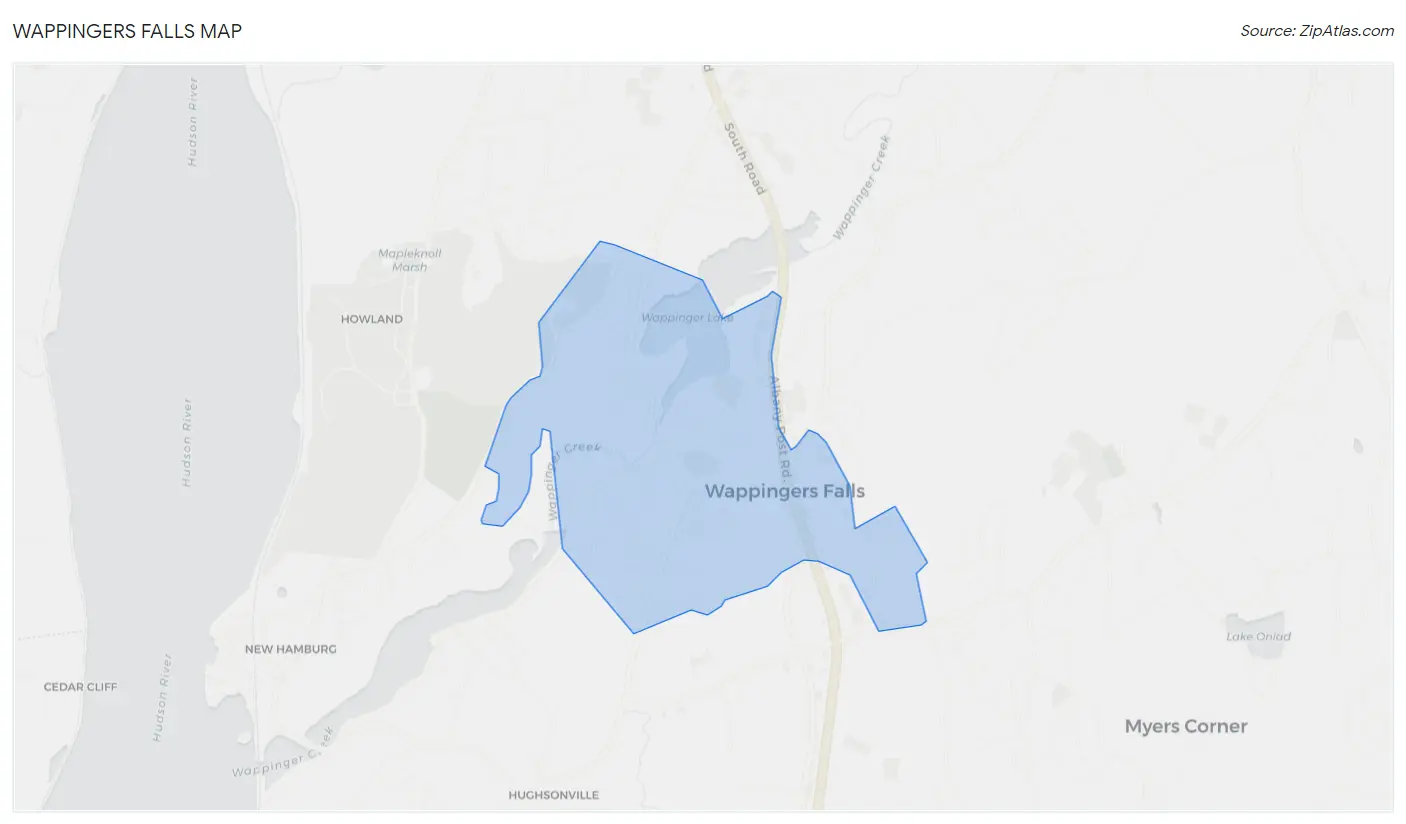
Wappingers Falls Overview
$34,991
PER CAPITA INCOME
$83,239
AVG FAMILY INCOME
$61,554
AVG HOUSEHOLD INCOME
46.4%
WAGE / INCOME GAP [ % ]
53.6¢/ $1
WAGE / INCOME GAP [ $ ]
0.39
INEQUALITY / GINI INDEX
5,775
TOTAL POPULATION
2,882
MALE POPULATION
2,893
FEMALE POPULATION
99.62
MALES / 100 FEMALES
100.38
FEMALES / 100 MALES
47.9
MEDIAN AGE
3.2
AVG FAMILY SIZE
2.2
AVG HOUSEHOLD SIZE
2,858
LABOR FORCE [ PEOPLE ]
57.3%
PERCENT IN LABOR FORCE
3.8%
UNEMPLOYMENT RATE
Wappingers Falls Zip Codes
Wappingers Falls Area Codes
Income in Wappingers Falls
Income Overview in Wappingers Falls
Per Capita Income in Wappingers Falls is $34,991, while median incomes of families and households are $83,239 and $61,554 respectively.
| Characteristic | Number | Measure |
| Per Capita Income | 5,775 | $34,991 |
| Median Family Income | 1,281 | $83,239 |
| Mean Family Income | 1,281 | $100,657 |
| Median Household Income | 2,515 | $61,554 |
| Mean Household Income | 2,515 | $79,432 |
| Income Deficit | 1,281 | $0 |
| Wage / Income Gap (%) | 5,775 | 46.43% |
| Wage / Income Gap ($) | 5,775 | 53.57¢ per $1 |
| Gini / Inequality Index | 5,775 | 0.39 |
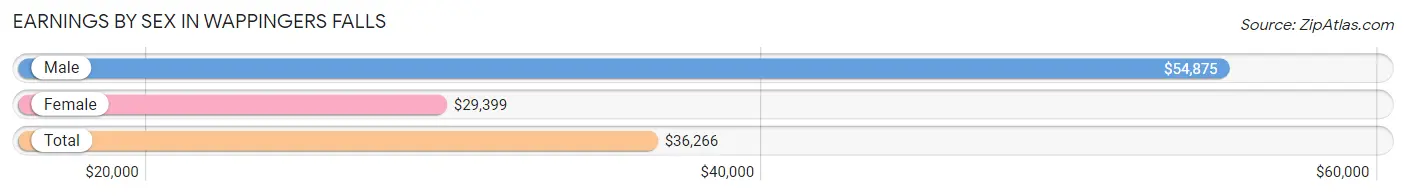
Earnings by Sex in Wappingers Falls
Average Earnings in Wappingers Falls are $36,266, $54,875 for men and $29,399 for women, a difference of 46.4%.
| Sex | Number | Average Earnings |
| Male | 1,378 (44.3%) | $54,875 |
| Female | 1,730 (55.7%) | $29,399 |
| Total | 3,108 (100.0%) | $36,266 |
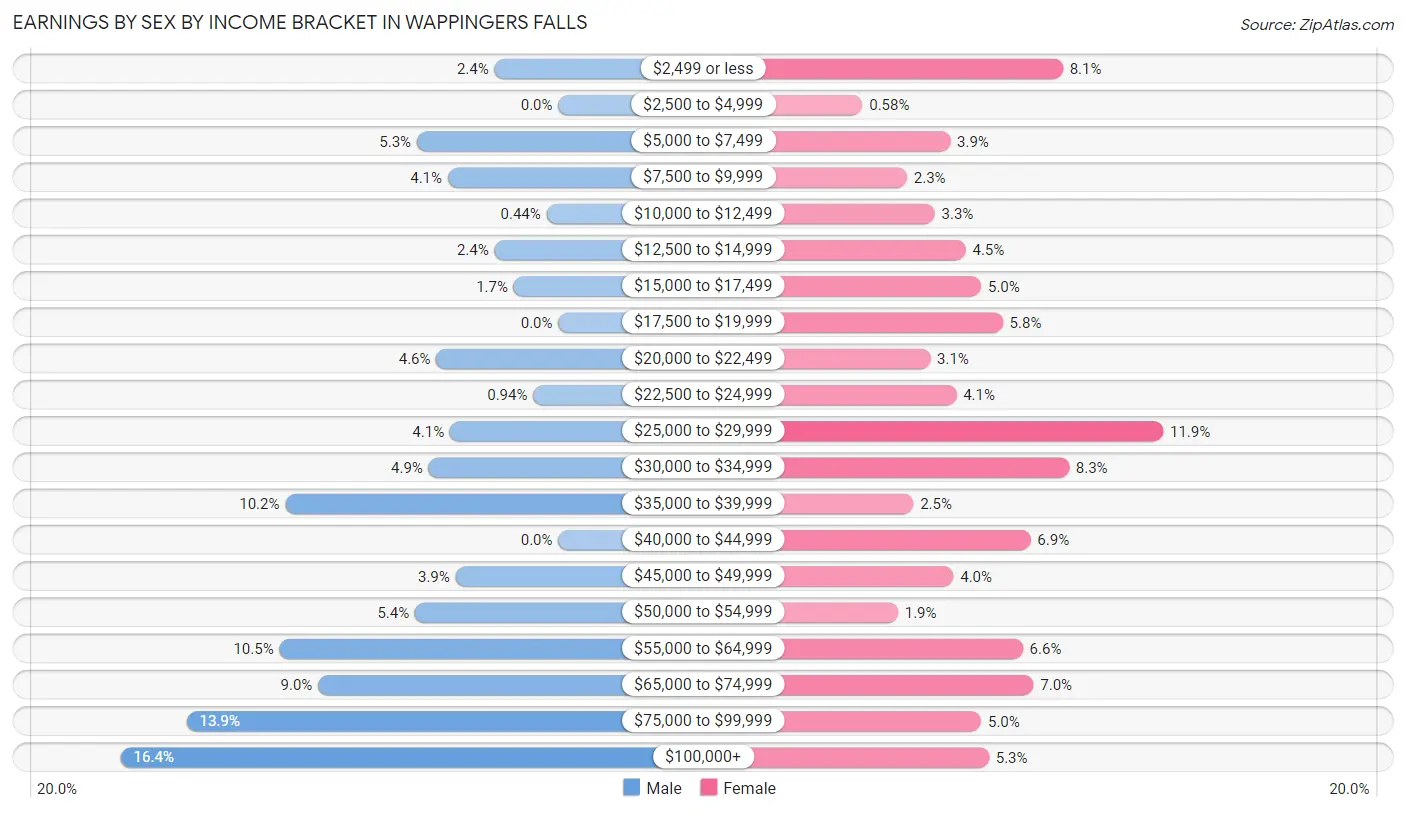
Earnings by Sex by Income Bracket in Wappingers Falls
The most common earnings brackets in Wappingers Falls are $100,000+ for men (226 | 16.4%) and $25,000 to $29,999 for women (205 | 11.8%).
| Income | Male | Female |
| $2,499 or less | 33 (2.4%) | 140 (8.1%) |
| $2,500 to $4,999 | 0 (0.0%) | 10 (0.6%) |
| $5,000 to $7,499 | 73 (5.3%) | 67 (3.9%) |
| $7,500 to $9,999 | 57 (4.1%) | 39 (2.2%) |
| $10,000 to $12,499 | 6 (0.4%) | 57 (3.3%) |
| $12,500 to $14,999 | 33 (2.4%) | 77 (4.4%) |
| $15,000 to $17,499 | 23 (1.7%) | 87 (5.0%) |
| $17,500 to $19,999 | 0 (0.0%) | 101 (5.8%) |
| $20,000 to $22,499 | 63 (4.6%) | 54 (3.1%) |
| $22,500 to $24,999 | 13 (0.9%) | 71 (4.1%) |
| $25,000 to $29,999 | 56 (4.1%) | 205 (11.8%) |
| $30,000 to $34,999 | 67 (4.9%) | 144 (8.3%) |
| $35,000 to $39,999 | 141 (10.2%) | 43 (2.5%) |
| $40,000 to $44,999 | 0 (0.0%) | 119 (6.9%) |
| $45,000 to $49,999 | 53 (3.8%) | 69 (4.0%) |
| $50,000 to $54,999 | 74 (5.4%) | 33 (1.9%) |
| $55,000 to $64,999 | 144 (10.4%) | 114 (6.6%) |
| $65,000 to $74,999 | 124 (9.0%) | 121 (7.0%) |
| $75,000 to $99,999 | 192 (13.9%) | 87 (5.0%) |
| $100,000+ | 226 (16.4%) | 92 (5.3%) |
| Total | 1,378 (100.0%) | 1,730 (100.0%) |
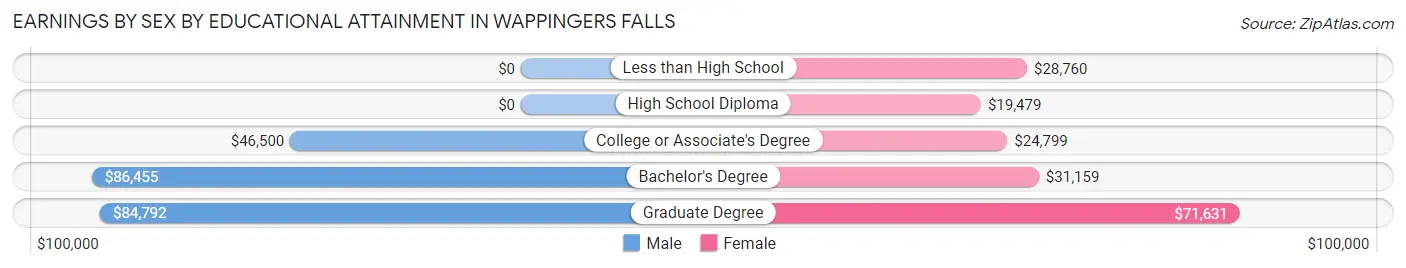
Earnings by Sex by Educational Attainment in Wappingers Falls
Average earnings in Wappingers Falls are $58,246 for men and $30,524 for women, a difference of 47.6%. Men with an educational attainment of bachelor's degree enjoy the highest average annual earnings of $86,455, while those with college or associate's degree education earn the least with $46,500. Women with an educational attainment of graduate degree earn the most with the average annual earnings of $71,631, while those with high school diploma education have the smallest earnings of $19,479.
| Educational Attainment | Male Income | Female Income |
| Less than High School | - | - |
| High School Diploma | - | - |
| College or Associate's Degree | $46,500 | $24,799 |
| Bachelor's Degree | $86,455 | $31,159 |
| Graduate Degree | $84,792 | $71,631 |
| Total | $58,246 | $30,524 |
Family Income in Wappingers Falls
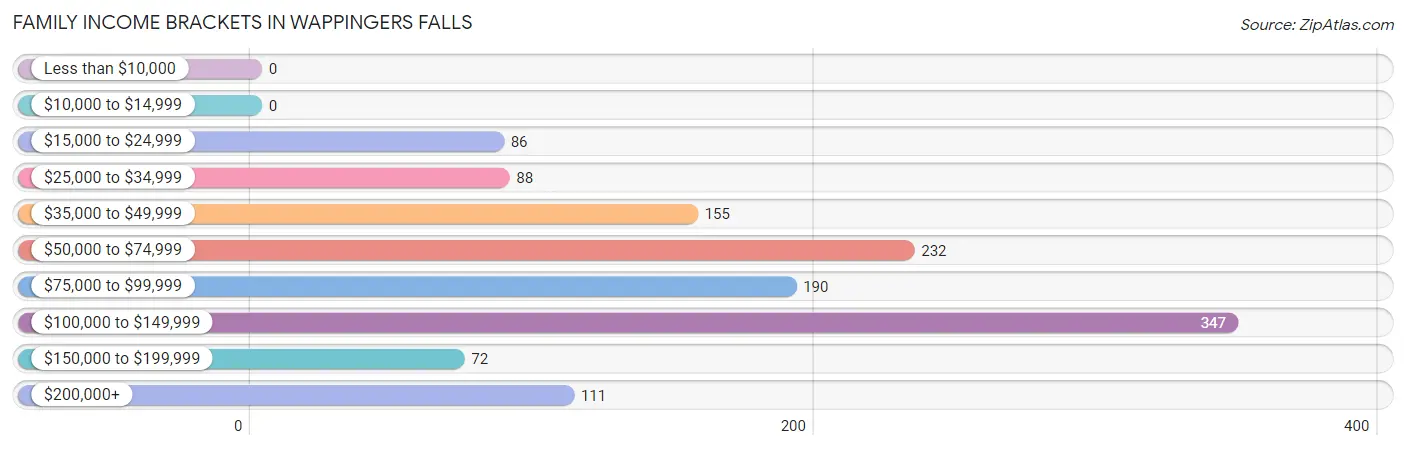
Family Income Brackets in Wappingers Falls
According to the Wappingers Falls family income data, there are 347 families falling into the $100,000 to $149,999 income range, which is the most common income bracket and makes up 27.1% of all families.
| Income Bracket | # Families | % Families |
| Less than $10,000 | 0 | 0.0% |
| $10,000 to $14,999 | 0 | 0.0% |
| $15,000 to $24,999 | 86 | 6.7% |
| $25,000 to $34,999 | 88 | 6.9% |
| $35,000 to $49,999 | 155 | 12.1% |
| $50,000 to $74,999 | 232 | 18.1% |
| $75,000 to $99,999 | 190 | 14.8% |
| $100,000 to $149,999 | 347 | 27.1% |
| $150,000 to $199,999 | 72 | 5.6% |
| $200,000+ | 111 | 8.7% |
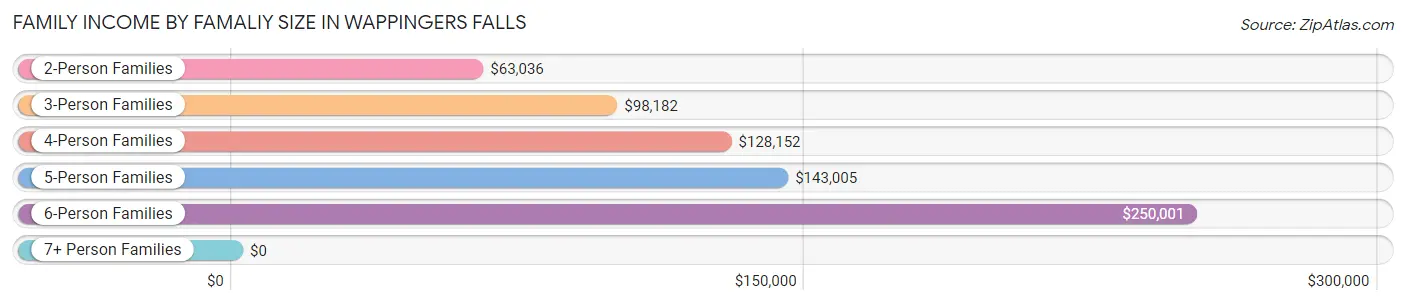
Family Income by Famaliy Size in Wappingers Falls
6-person families (53 | 4.1%) account for the highest median family income in Wappingers Falls with $250,001 per family, while 6-person families (53 | 4.1%) have the highest median income of $41,667 per family member.
| Income Bracket | # Families | Median Income |
| 2-Person Families | 644 (50.3%) | $63,036 |
| 3-Person Families | 224 (17.5%) | $98,182 |
| 4-Person Families | 210 (16.4%) | $128,152 |
| 5-Person Families | 150 (11.7%) | $143,005 |
| 6-Person Families | 53 (4.1%) | $250,001 |
| 7+ Person Families | 0 (0.0%) | $0 |
| Total | 1,281 (100.0%) | $83,239 |
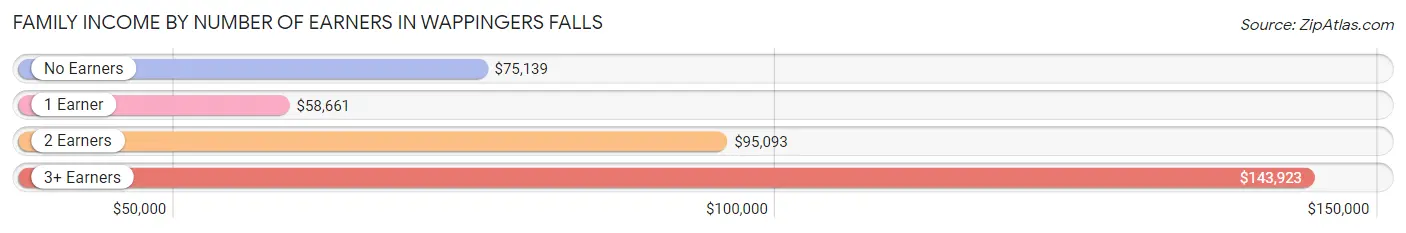
Family Income by Number of Earners in Wappingers Falls
The median family income in Wappingers Falls is $83,239, with families comprising 3+ earners (271) having the highest median family income of $143,923, while families with 1 earner (348) have the lowest median family income of $58,661, accounting for 21.2% and 27.2% of families, respectively.
| Number of Earners | # Families | Median Income |
| No Earners | 238 (18.6%) | $75,139 |
| 1 Earner | 348 (27.2%) | $58,661 |
| 2 Earners | 424 (33.1%) | $95,093 |
| 3+ Earners | 271 (21.2%) | $143,923 |
| Total | 1,281 (100.0%) | $83,239 |
Household Income in Wappingers Falls
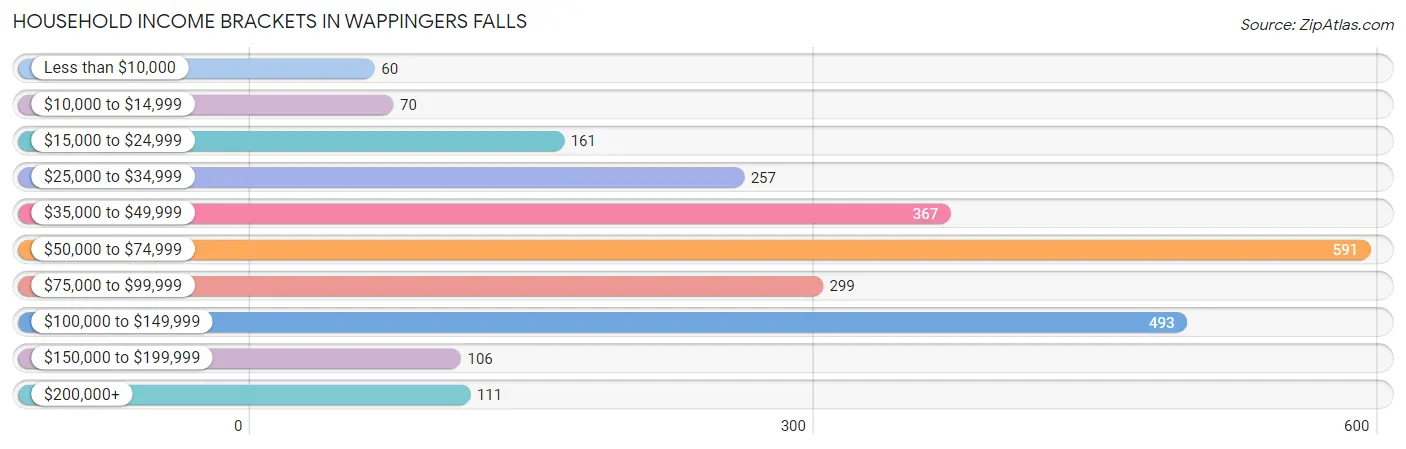
Household Income Brackets in Wappingers Falls
With 591 households falling in the category, the $50,000 to $74,999 income range is the most frequent in Wappingers Falls, accounting for 23.5% of all households. In contrast, only 60 households (2.4%) fall into the less than $10,000 income bracket, making it the least populous group.
| Income Bracket | # Households | % Households |
| Less than $10,000 | 60 | 2.4% |
| $10,000 to $14,999 | 70 | 2.8% |
| $15,000 to $24,999 | 161 | 6.4% |
| $25,000 to $34,999 | 257 | 10.2% |
| $35,000 to $49,999 | 367 | 14.6% |
| $50,000 to $74,999 | 591 | 23.5% |
| $75,000 to $99,999 | 299 | 11.9% |
| $100,000 to $149,999 | 493 | 19.6% |
| $150,000 to $199,999 | 106 | 4.2% |
| $200,000+ | 111 | 4.4% |
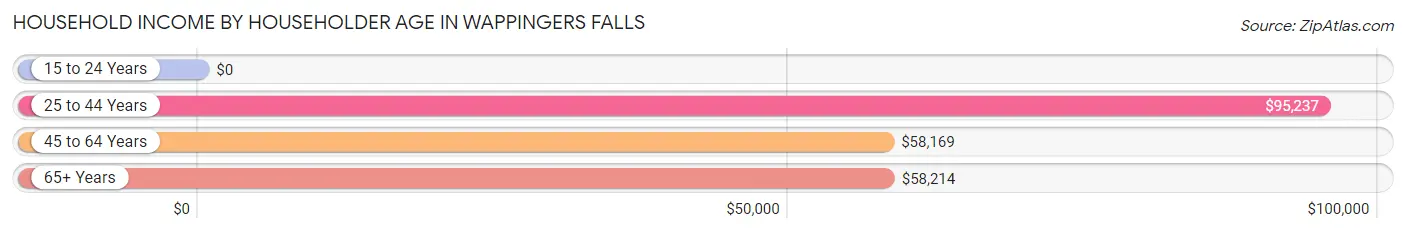
Household Income by Householder Age in Wappingers Falls
The median household income in Wappingers Falls is $61,554, with the highest median household income of $95,237 found in the 25 to 44 years age bracket for the primary householder. A total of 625 households (24.8%) fall into this category. Meanwhile, the 15 to 24 years age bracket for the primary householder has the lowest median household income of $0, with 30 households (1.2%) in this group.
| Income Bracket | # Households | Median Income |
| 15 to 24 Years | 30 (1.2%) | $0 |
| 25 to 44 Years | 625 (24.8%) | $95,237 |
| 45 to 64 Years | 1,024 (40.7%) | $58,169 |
| 65+ Years | 836 (33.2%) | $58,214 |
| Total | 2,515 (100.0%) | $61,554 |
Poverty in Wappingers Falls
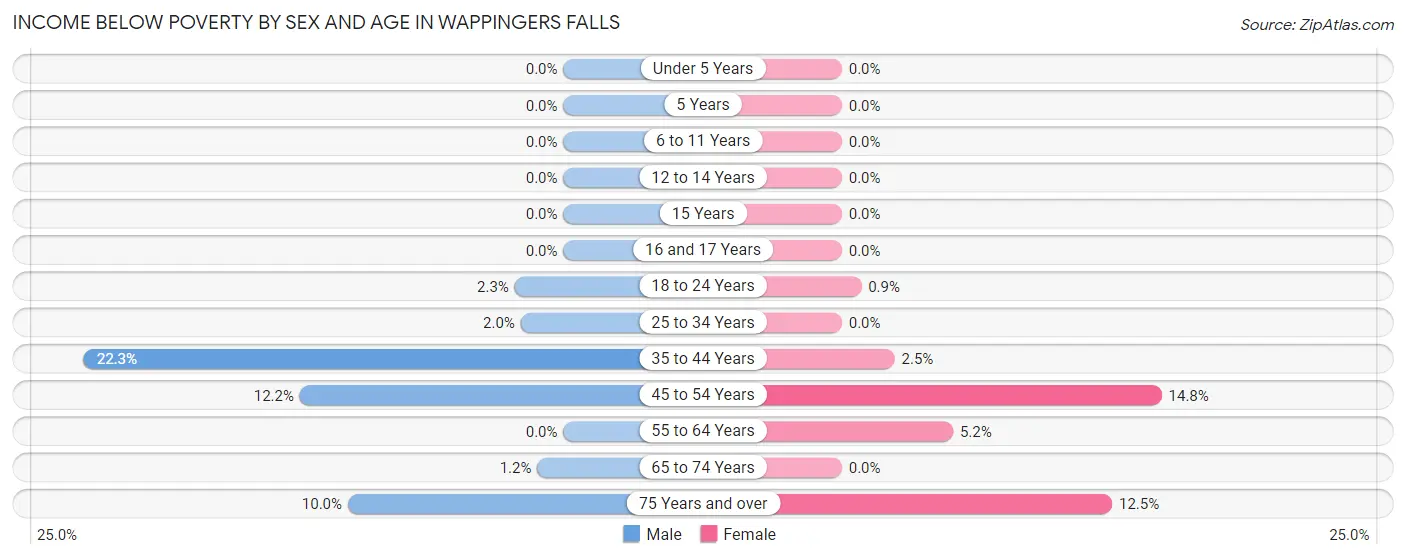
Income Below Poverty by Sex and Age in Wappingers Falls
With 7.0% poverty level for males and 4.8% for females among the residents of Wappingers Falls, 35 to 44 year old males and 45 to 54 year old females are the most vulnerable to poverty, with 87 males (22.3%) and 57 females (14.8%) in their respective age groups living below the poverty level.
| Age Bracket | Male | Female |
| Under 5 Years | 0 (0.0%) | 0 (0.0%) |
| 5 Years | 0 (0.0%) | 0 (0.0%) |
| 6 to 11 Years | 0 (0.0%) | 0 (0.0%) |
| 12 to 14 Years | 0 (0.0%) | 0 (0.0%) |
| 15 Years | 0 (0.0%) | 0 (0.0%) |
| 16 and 17 Years | 0 (0.0%) | 0 (0.0%) |
| 18 to 24 Years | 3 (2.3%) | 3 (0.9%) |
| 25 to 34 Years | 6 (2.0%) | 0 (0.0%) |
| 35 to 44 Years | 87 (22.3%) | 11 (2.5%) |
| 45 to 54 Years | 78 (12.2%) | 57 (14.8%) |
| 55 to 64 Years | 0 (0.0%) | 23 (5.2%) |
| 65 to 74 Years | 4 (1.2%) | 0 (0.0%) |
| 75 Years and over | 21 (10.0%) | 44 (12.5%) |
| Total | 199 (7.0%) | 138 (4.8%) |
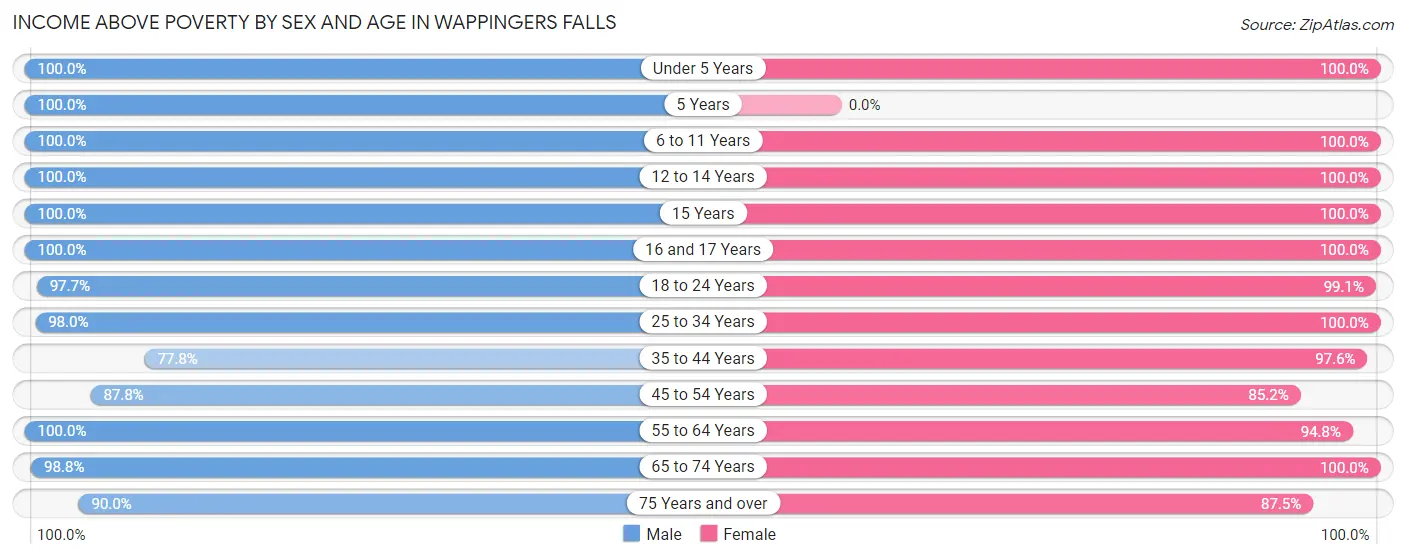
Income Above Poverty by Sex and Age in Wappingers Falls
According to the poverty statistics in Wappingers Falls, males aged under 5 years and females aged under 5 years are the age groups that are most secure financially, with 100.0% of males and 100.0% of females in these age groups living above the poverty line.
| Age Bracket | Male | Female |
| Under 5 Years | 111 (100.0%) | 98 (100.0%) |
| 5 Years | 40 (100.0%) | 0 (0.0%) |
| 6 to 11 Years | 106 (100.0%) | 136 (100.0%) |
| 12 to 14 Years | 187 (100.0%) | 11 (100.0%) |
| 15 Years | 72 (100.0%) | 26 (100.0%) |
| 16 and 17 Years | 40 (100.0%) | 34 (100.0%) |
| 18 to 24 Years | 130 (97.7%) | 332 (99.1%) |
| 25 to 34 Years | 297 (98.0%) | 253 (100.0%) |
| 35 to 44 Years | 304 (77.7%) | 438 (97.6%) |
| 45 to 54 Years | 560 (87.8%) | 327 (85.2%) |
| 55 to 64 Years | 287 (100.0%) | 423 (94.8%) |
| 65 to 74 Years | 326 (98.8%) | 349 (100.0%) |
| 75 Years and over | 189 (90.0%) | 307 (87.5%) |
| Total | 2,649 (93.0%) | 2,734 (95.2%) |
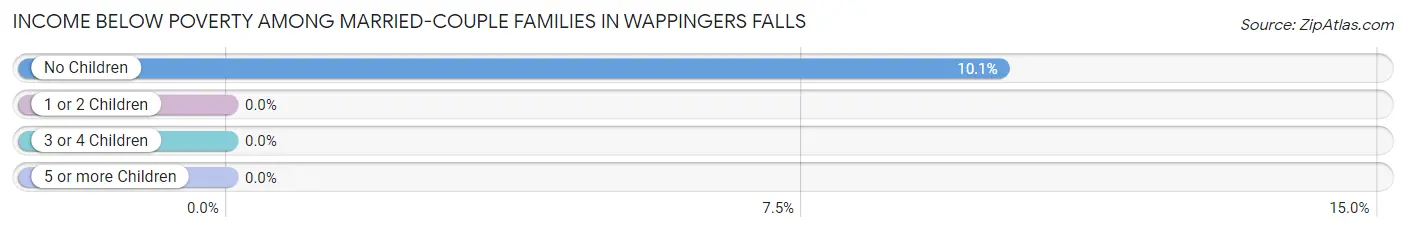
Income Below Poverty Among Married-Couple Families in Wappingers Falls
The poverty statistics for married-couple families in Wappingers Falls show that 6.1% or 58 of the total 947 families live below the poverty line. Families with no children have the highest poverty rate of 10.1%, comprising of 58 families. On the other hand, families with 1 or 2 children have the lowest poverty rate of 0.0%, which includes 0 families.
| Children | Above Poverty | Below Poverty |
| No Children | 518 (89.9%) | 58 (10.1%) |
| 1 or 2 Children | 339 (100.0%) | 0 (0.0%) |
| 3 or 4 Children | 32 (100.0%) | 0 (0.0%) |
| 5 or more Children | 0 (0.0%) | 0 (0.0%) |
| Total | 889 (93.9%) | 58 (6.1%) |
Income Below Poverty Among Single-Parent Households in Wappingers Falls
| Children | Single Father | Single Mother |
| No Children | 0 (0.0%) | 0 (0.0%) |
| 1 or 2 Children | 0 (0.0%) | 0 (0.0%) |
| 3 or 4 Children | 0 (0.0%) | 0 (0.0%) |
| 5 or more Children | 0 (0.0%) | 0 (0.0%) |
| Total | 0 (0.0%) | 0 (0.0%) |
Income Below Poverty Among Married-Couple vs Single-Parent Households in Wappingers Falls
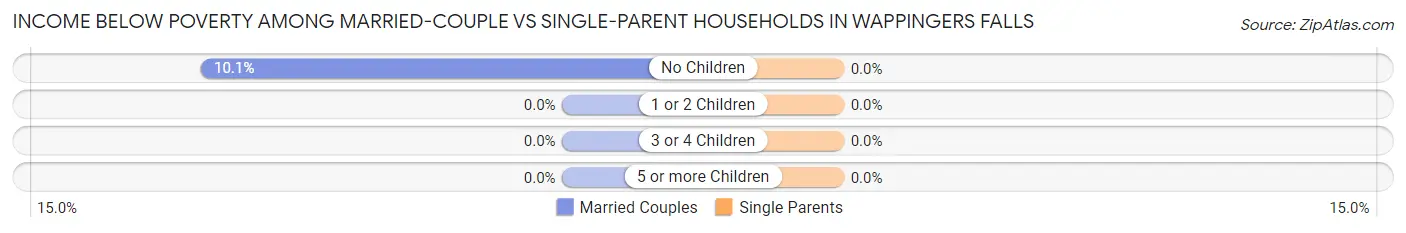
| Children | Married-Couple Families | Single-Parent Households |
| No Children | 58 (10.1%) | 0 (0.0%) |
| 1 or 2 Children | 0 (0.0%) | 0 (0.0%) |
| 3 or 4 Children | 0 (0.0%) | 0 (0.0%) |
| 5 or more Children | 0 (0.0%) | 0 (0.0%) |
| Total | 58 (6.1%) | 0 (0.0%) |
Race in Wappingers Falls
The most populous races in Wappingers Falls are White / Caucasian (3,972 | 68.8%), Hispanic or Latino (1,225 | 21.2%), and Black / African American (780 | 13.5%).
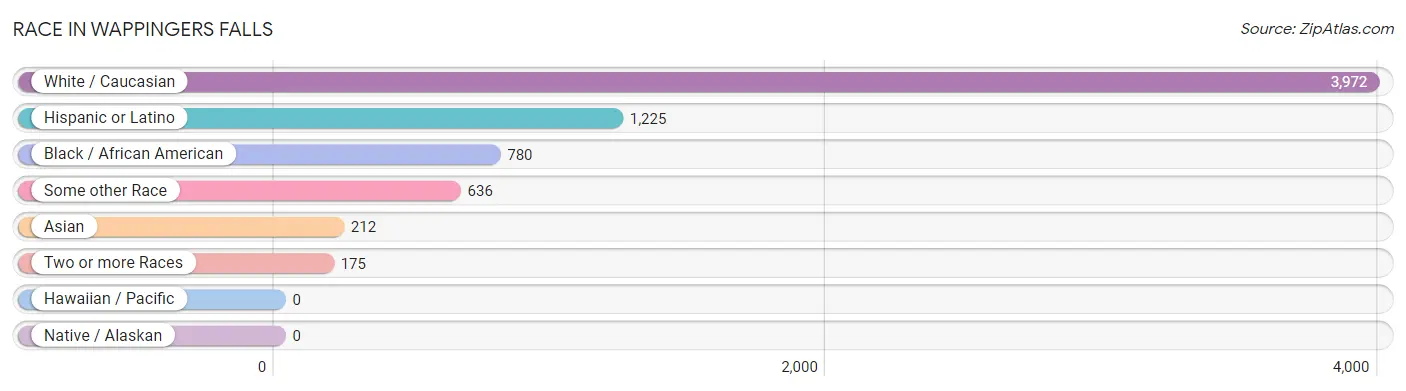
| Race | # Population | % Population |
| Asian | 212 | 3.7% |
| Black / African American | 780 | 13.5% |
| Hawaiian / Pacific | 0 | 0.0% |
| Hispanic or Latino | 1,225 | 21.2% |
| Native / Alaskan | 0 | 0.0% |
| White / Caucasian | 3,972 | 68.8% |
| Two or more Races | 175 | 3.0% |
| Some other Race | 636 | 11.0% |
| Total | 5,775 | 100.0% |
Ancestry in Wappingers Falls
The most populous ancestries reported in Wappingers Falls are Irish (971 | 16.8%), Italian (829 | 14.3%), Puerto Rican (491 | 8.5%), German (472 | 8.2%), and South American (317 | 5.5%), together accounting for 53.3% of all Wappingers Falls residents.
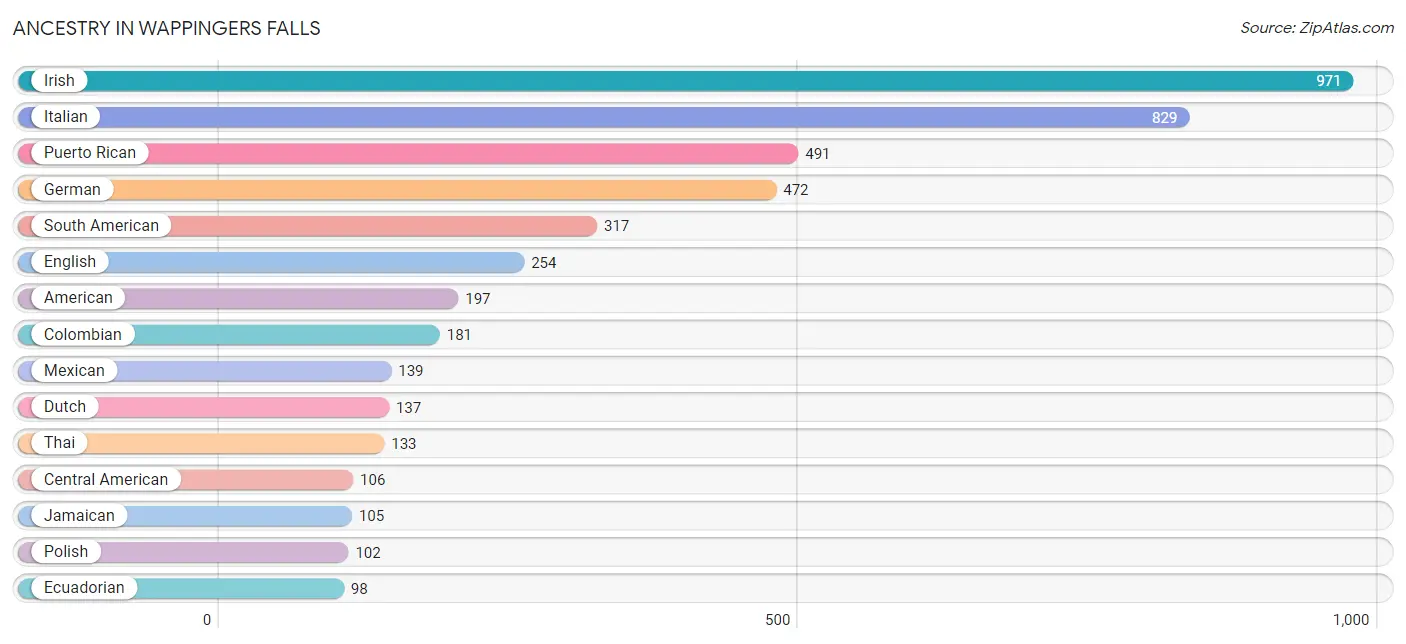
| Ancestry | # Population | % Population |
| American | 197 | 3.4% |
| Arab | 74 | 1.3% |
| Armenian | 82 | 1.4% |
| Austrian | 28 | 0.5% |
| Bhutanese | 14 | 0.2% |
| British | 10 | 0.2% |
| Canadian | 59 | 1.0% |
| Central American | 106 | 1.8% |
| Colombian | 181 | 3.1% |
| Cuban | 29 | 0.5% |
| Dutch | 137 | 2.4% |
| Eastern European | 16 | 0.3% |
| Ecuadorian | 98 | 1.7% |
| English | 254 | 4.4% |
| European | 65 | 1.1% |
| French | 31 | 0.5% |
| French Canadian | 93 | 1.6% |
| German | 472 | 8.2% |
| Greek | 8 | 0.1% |
| Guatemalan | 81 | 1.4% |
| Guyanese | 95 | 1.7% |
| Honduran | 25 | 0.4% |
| Hungarian | 74 | 1.3% |
| Indian (Asian) | 32 | 0.5% |
| Iraqi | 54 | 0.9% |
| Irish | 971 | 16.8% |
| Italian | 829 | 14.3% |
| Jamaican | 105 | 1.8% |
| Mexican | 139 | 2.4% |
| Norwegian | 5 | 0.1% |
| Peruvian | 23 | 0.4% |
| Polish | 102 | 1.8% |
| Puerto Rican | 491 | 8.5% |
| Romanian | 75 | 1.3% |
| Russian | 21 | 0.4% |
| Scotch-Irish | 23 | 0.4% |
| Scottish | 62 | 1.1% |
| Slovak | 41 | 0.7% |
| South American | 317 | 5.5% |
| Spaniard | 21 | 0.4% |
| Sri Lankan | 33 | 0.6% |
| Swedish | 29 | 0.5% |
| Swiss | 2 | 0.0% |
| Thai | 133 | 2.3% |
| Ukrainian | 18 | 0.3% |
| Uruguayan | 15 | 0.3% |
| Welsh | 23 | 0.4% |
| West Indian | 29 | 0.5% | View All 48 Rows |
Immigrants in Wappingers Falls
The most numerous immigrant groups reported in Wappingers Falls came from Latin America (530 | 9.2%), South America (286 | 5.0%), Asia (159 | 2.8%), Central America (140 | 2.4%), and Europe (123 | 2.1%), together accounting for 21.4% of all Wappingers Falls residents.
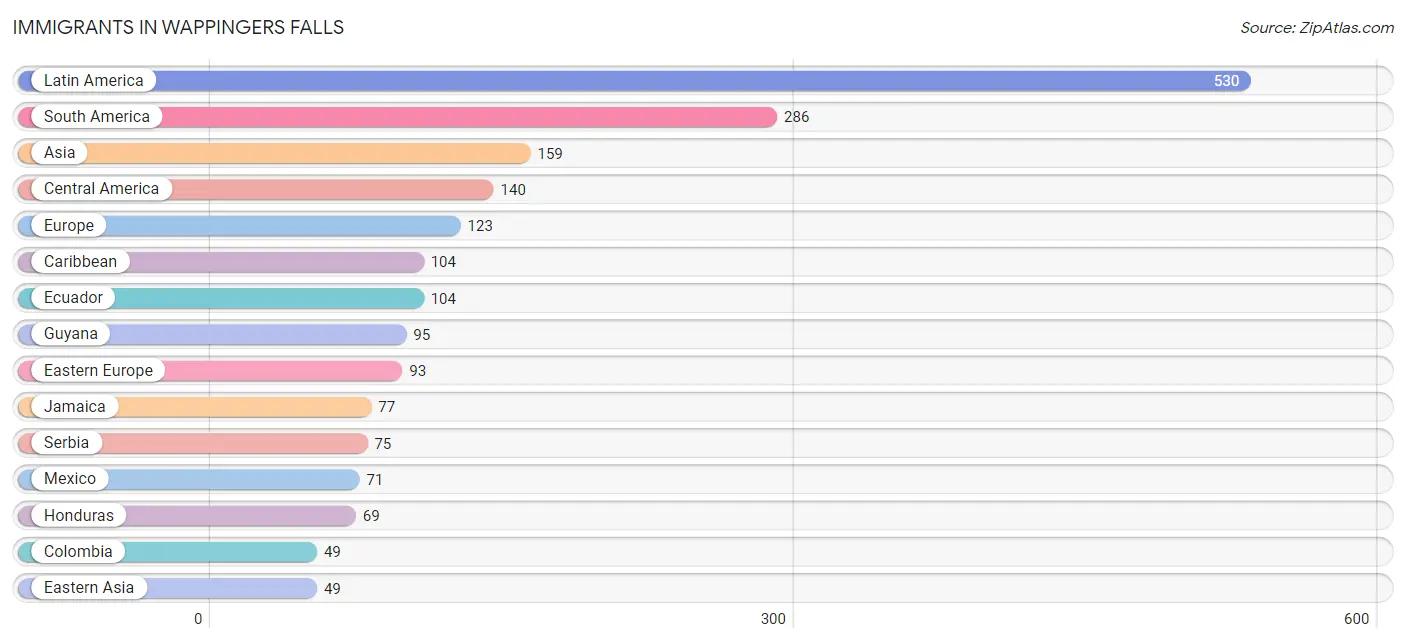
| Immigration Origin | # Population | % Population |
| Asia | 159 | 2.8% |
| Caribbean | 104 | 1.8% |
| Central America | 140 | 2.4% |
| China | 32 | 0.5% |
| Colombia | 49 | 0.9% |
| Cuba | 13 | 0.2% |
| Eastern Asia | 49 | 0.9% |
| Eastern Europe | 93 | 1.6% |
| Ecuador | 104 | 1.8% |
| Europe | 123 | 2.1% |
| Guyana | 95 | 1.7% |
| Honduras | 69 | 1.2% |
| India | 40 | 0.7% |
| Iraq | 42 | 0.7% |
| Italy | 30 | 0.5% |
| Jamaica | 77 | 1.3% |
| Japan | 14 | 0.2% |
| Korea | 3 | 0.1% |
| Latin America | 530 | 9.2% |
| Mexico | 71 | 1.2% |
| Peru | 38 | 0.7% |
| Serbia | 75 | 1.3% |
| South America | 286 | 5.0% |
| South Central Asia | 40 | 0.7% |
| Southern Europe | 30 | 0.5% |
| Ukraine | 18 | 0.3% |
| Western Asia | 42 | 0.7% | View All 27 Rows |
Sex and Age in Wappingers Falls
Sex and Age in Wappingers Falls
The most populous age groups in Wappingers Falls are 45 to 49 Years (461 | 16.0%) for men and 50 to 54 Years (329 | 11.4%) for women.
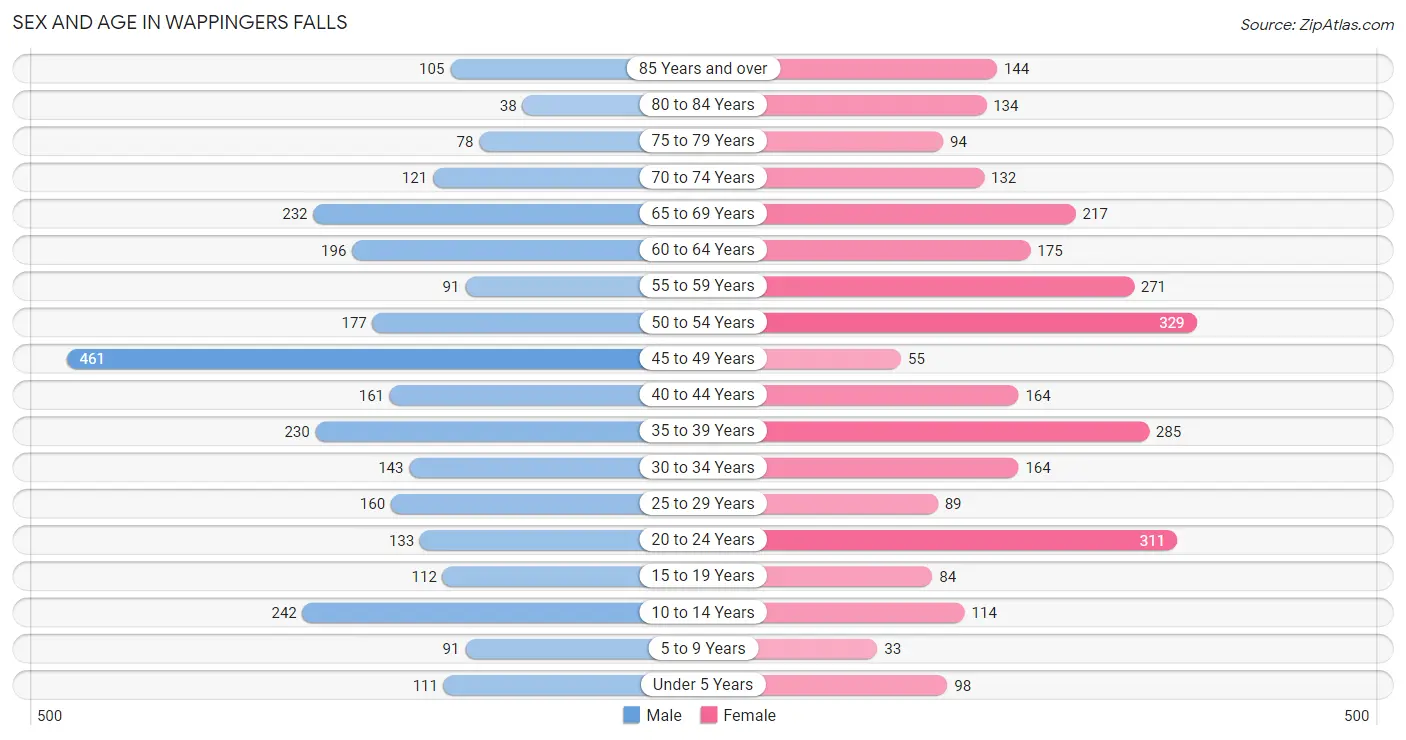
| Age Bracket | Male | Female |
| Under 5 Years | 111 (3.8%) | 98 (3.4%) |
| 5 to 9 Years | 91 (3.2%) | 33 (1.1%) |
| 10 to 14 Years | 242 (8.4%) | 114 (3.9%) |
| 15 to 19 Years | 112 (3.9%) | 84 (2.9%) |
| 20 to 24 Years | 133 (4.6%) | 311 (10.7%) |
| 25 to 29 Years | 160 (5.6%) | 89 (3.1%) |
| 30 to 34 Years | 143 (5.0%) | 164 (5.7%) |
| 35 to 39 Years | 230 (8.0%) | 285 (9.9%) |
| 40 to 44 Years | 161 (5.6%) | 164 (5.7%) |
| 45 to 49 Years | 461 (16.0%) | 55 (1.9%) |
| 50 to 54 Years | 177 (6.1%) | 329 (11.4%) |
| 55 to 59 Years | 91 (3.2%) | 271 (9.4%) |
| 60 to 64 Years | 196 (6.8%) | 175 (6.0%) |
| 65 to 69 Years | 232 (8.1%) | 217 (7.5%) |
| 70 to 74 Years | 121 (4.2%) | 132 (4.6%) |
| 75 to 79 Years | 78 (2.7%) | 94 (3.3%) |
| 80 to 84 Years | 38 (1.3%) | 134 (4.6%) |
| 85 Years and over | 105 (3.6%) | 144 (5.0%) |
| Total | 2,882 (100.0%) | 2,893 (100.0%) |
Families and Households in Wappingers Falls
Median Family Size in Wappingers Falls
The median family size in Wappingers Falls is 3.20 persons per family, with married-couple families (947 | 73.9%) accounting for the largest median family size of 3.26 persons per family. On the other hand, single male/father families (14 | 1.1%) represent the smallest median family size with 1.86 persons per family.
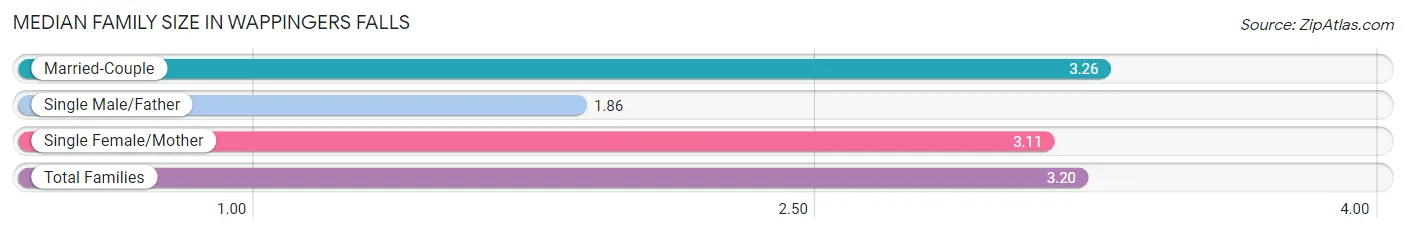
| Family Type | # Families | Family Size |
| Married-Couple | 947 (73.9%) | 3.26 |
| Single Male/Father | 14 (1.1%) | 1.86 |
| Single Female/Mother | 320 (25.0%) | 3.11 |
| Total Families | 1,281 (100.0%) | 3.20 |
Median Household Size in Wappingers Falls
The median household size in Wappingers Falls is 2.25 persons per household, with single female/mother households (320 | 12.7%) accounting for the largest median household size of 3.41 persons per household. non-family households (1,234 | 49.1%) represent the smallest median household size with 1.18 persons per household.
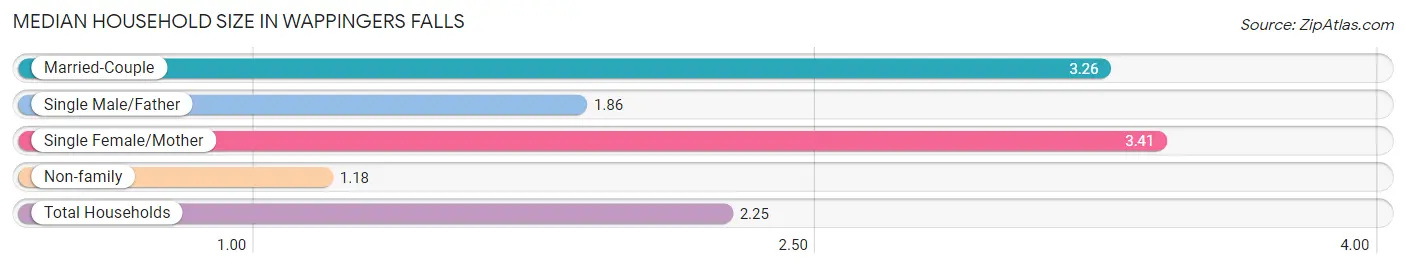
| Household Type | # Households | Household Size |
| Married-Couple | 947 (37.7%) | 3.26 |
| Single Male/Father | 14 (0.6%) | 1.86 |
| Single Female/Mother | 320 (12.7%) | 3.41 |
| Non-family | 1,234 (49.1%) | 1.18 |
| Total Households | 2,515 (100.0%) | 2.25 |
Household Size by Marriage Status in Wappingers Falls
Out of a total of 2,515 households in Wappingers Falls, 1,281 (50.9%) are family households, while 1,234 (49.1%) are nonfamily households. The most numerous type of family households are 2-person households, comprising 569, and the most common type of nonfamily households are 1-person households, comprising 1,017.
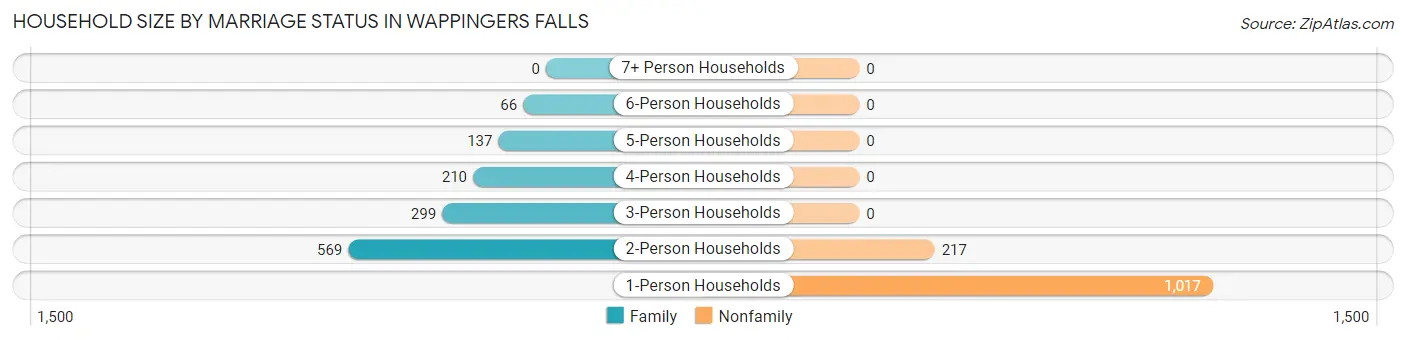
| Household Size | Family Households | Nonfamily Households |
| 1-Person Households | - | 1,017 (40.4%) |
| 2-Person Households | 569 (22.6%) | 217 (8.6%) |
| 3-Person Households | 299 (11.9%) | 0 (0.0%) |
| 4-Person Households | 210 (8.4%) | 0 (0.0%) |
| 5-Person Households | 137 (5.4%) | 0 (0.0%) |
| 6-Person Households | 66 (2.6%) | 0 (0.0%) |
| 7+ Person Households | 0 (0.0%) | 0 (0.0%) |
| Total | 1,281 (50.9%) | 1,234 (49.1%) |
Female Fertility in Wappingers Falls
Fertility by Age in Wappingers Falls
Average fertility rate in Wappingers Falls is 87.0 births per 1,000 women. Women in the age bracket of 20 to 34 years have the highest fertility rate with 140.0 births per 1,000 women. Women in the age bracket of 20 to 34 years acount for 78.2% of all women with births.
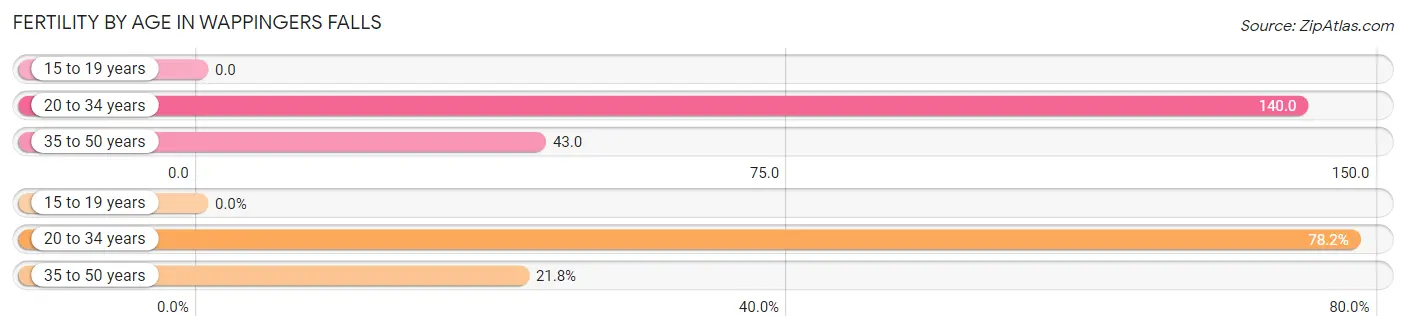
| Age Bracket | Women with Births | Births / 1,000 Women |
| 15 to 19 years | 0 (0.0%) | 0.0 |
| 20 to 34 years | 79 (78.2%) | 140.0 |
| 35 to 50 years | 22 (21.8%) | 43.0 |
| Total | 101 (100.0%) | 87.0 |
Fertility by Age by Marriage Status in Wappingers Falls
41.6% of women with births (101) in Wappingers Falls are married. The highest percentage of unmarried women with births falls into 20 to 34 years age bracket with 74.7% of them unmarried at the time of birth, while the lowest percentage of unmarried women with births belong to 35 to 50 years age bracket with 0.0% of them unmarried.
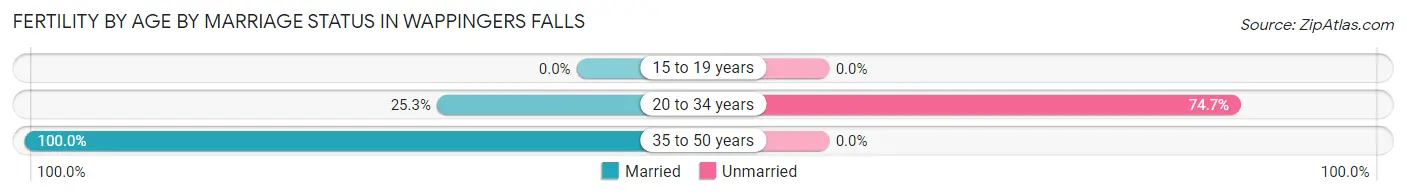
| Age Bracket | Married | Unmarried |
| 15 to 19 years | 0 (0.0%) | 0 (0.0%) |
| 20 to 34 years | 20 (25.3%) | 59 (74.7%) |
| 35 to 50 years | 22 (100.0%) | 0 (0.0%) |
| Total | 42 (41.6%) | 59 (58.4%) |
Fertility by Education in Wappingers Falls
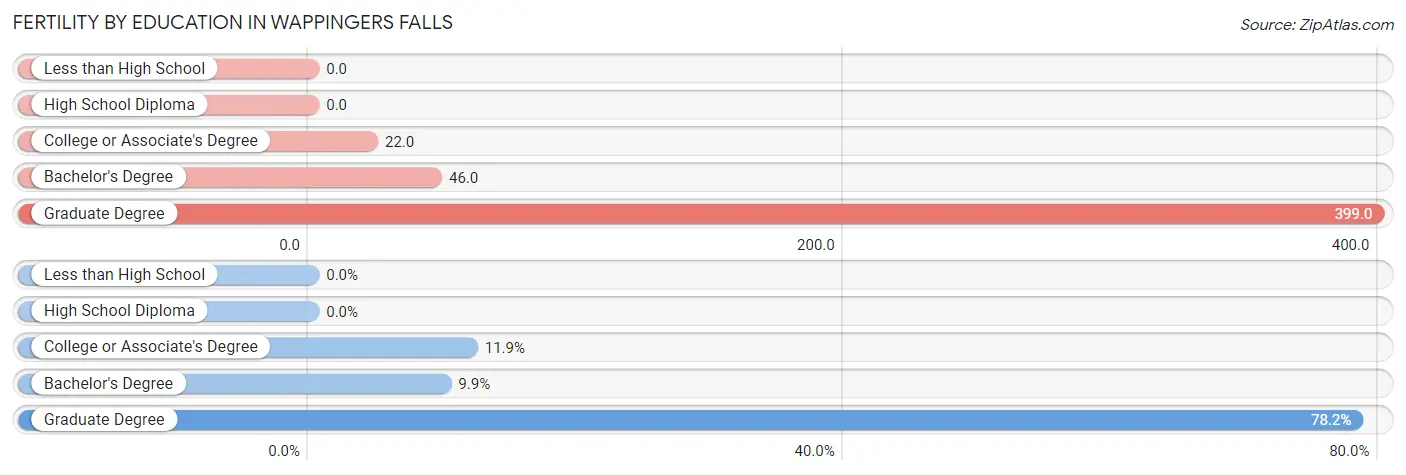
| Educational Attainment | Women with Births | Births / 1,000 Women |
| Less than High School | 0 (0.0%) | 0.0 |
| High School Diploma | 0 (0.0%) | 0.0 |
| College or Associate's Degree | 12 (11.9%) | 22.0 |
| Bachelor's Degree | 10 (9.9%) | 46.0 |
| Graduate Degree | 79 (78.2%) | 399.0 |
| Total | 101 (100.0%) | 87.0 |
Fertility by Education by Marriage Status in Wappingers Falls
58.4% of women with births in Wappingers Falls are unmarried. Women with the educational attainment of college or associate's degree are most likely to be married with 100.0% of them married at childbirth, while women with the educational attainment of graduate degree are least likely to be married with 74.7% of them unmarried at childbirth.
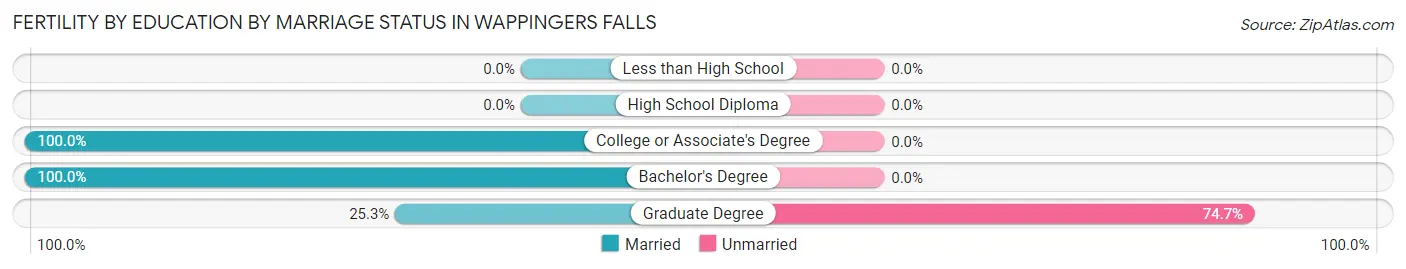
| Educational Attainment | Married | Unmarried |
| Less than High School | 0 (0.0%) | 0 (0.0%) |
| High School Diploma | 0 (0.0%) | 0 (0.0%) |
| College or Associate's Degree | 12 (100.0%) | 0 (0.0%) |
| Bachelor's Degree | 10 (100.0%) | 0 (0.0%) |
| Graduate Degree | 20 (25.3%) | 59 (74.7%) |
| Total | 42 (41.6%) | 59 (58.4%) |
Employment Characteristics in Wappingers Falls
Employment by Class of Employer in Wappingers Falls
Among the 2,697 employed individuals in Wappingers Falls, private company employees (1,906 | 70.7%), not-for-profit organizations (251 | 9.3%), and local government employees (215 | 8.0%) make up the most common classes of employment.
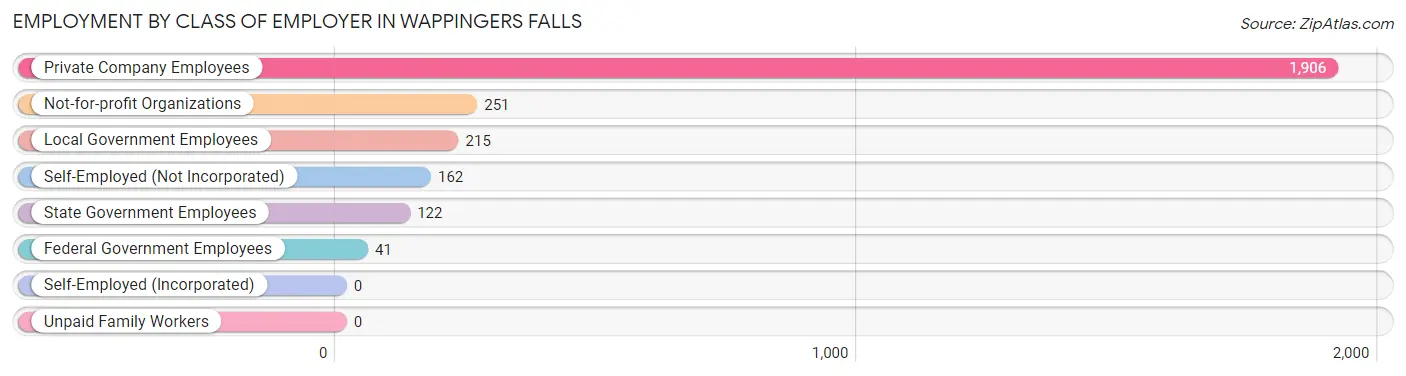
| Employer Class | # Employees | % Employees |
| Private Company Employees | 1,906 | 70.7% |
| Self-Employed (Incorporated) | 0 | 0.0% |
| Self-Employed (Not Incorporated) | 162 | 6.0% |
| Not-for-profit Organizations | 251 | 9.3% |
| Local Government Employees | 215 | 8.0% |
| State Government Employees | 122 | 4.5% |
| Federal Government Employees | 41 | 1.5% |
| Unpaid Family Workers | 0 | 0.0% |
| Total | 2,697 | 100.0% |
Employment Status by Age in Wappingers Falls
According to the labor force statistics for Wappingers Falls, out of the total population over 16 years of age (4,988), 57.3% or 2,858 individuals are in the labor force, with 3.8% or 109 of them unemployed. The age group with the highest labor force participation rate is 25 to 29 years, with 100.0% or 249 individuals in the labor force. Within the labor force, the 75 years and over age range has the highest percentage of unemployed individuals, with 58.3% or 21 of them being unemployed.
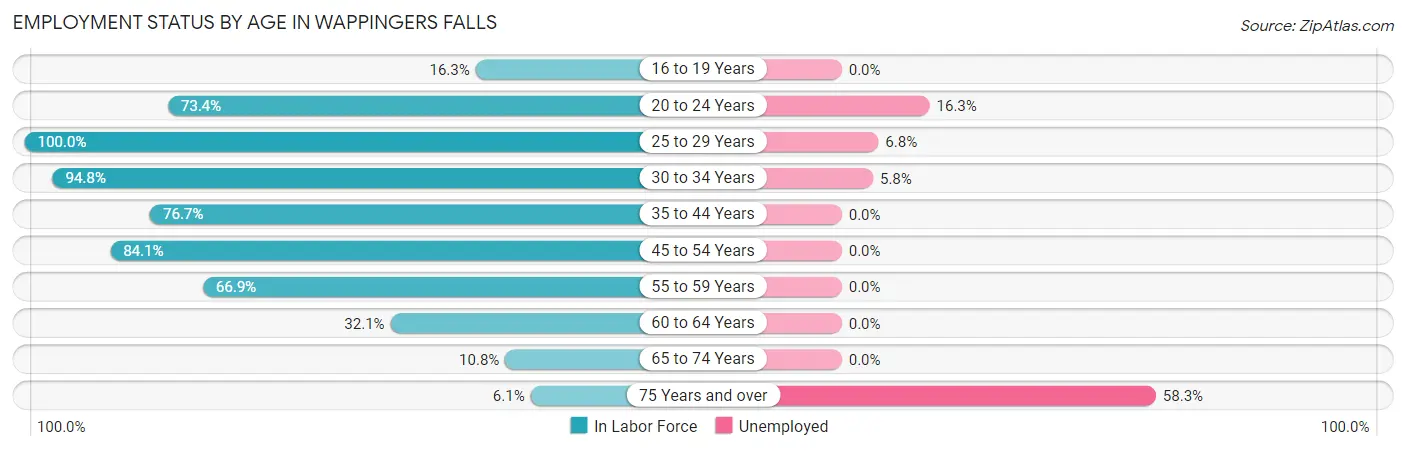
| Age Bracket | In Labor Force | Unemployed |
| 16 to 19 Years | 16 (16.3%) | 0 (0.0%) |
| 20 to 24 Years | 326 (73.4%) | 53 (16.3%) |
| 25 to 29 Years | 249 (100.0%) | 17 (6.8%) |
| 30 to 34 Years | 291 (94.8%) | 17 (5.8%) |
| 35 to 44 Years | 644 (76.7%) | 0 (0.0%) |
| 45 to 54 Years | 860 (84.1%) | 0 (0.0%) |
| 55 to 59 Years | 242 (66.9%) | 0 (0.0%) |
| 60 to 64 Years | 119 (32.1%) | 0 (0.0%) |
| 65 to 74 Years | 76 (10.8%) | 0 (0.0%) |
| 75 Years and over | 36 (6.1%) | 21 (58.3%) |
| Total | 2,858 (57.3%) | 109 (3.8%) |
Employment Status by Educational Attainment in Wappingers Falls
According to labor force statistics for Wappingers Falls, 76.3% of individuals (2,404) out of the total population between 25 and 64 years of age (3,151) are in the labor force, with 1.4% or 34 of them being unemployed. The group with the highest labor force participation rate are those with the educational attainment of bachelor's degree or higher, with 96.6% or 646 individuals in the labor force. Within the labor force, individuals with high school diploma education have the highest percentage of unemployment, with 7.2% or 34 of them being unemployed.
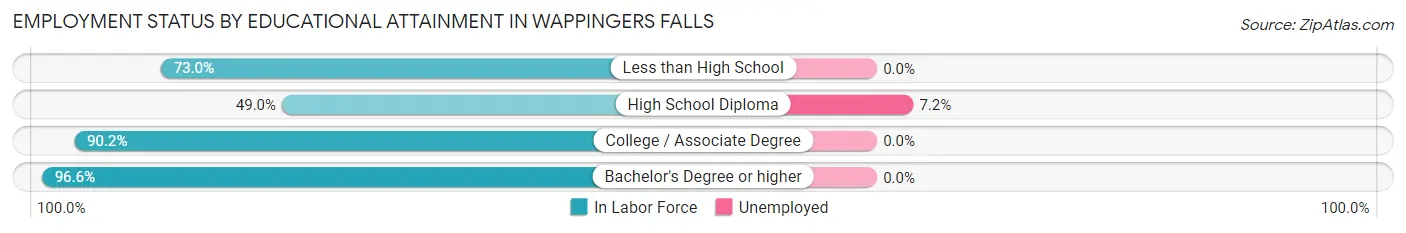
| Educational Attainment | In Labor Force | Unemployed |
| Less than High School | 349 (73.0%) | 0 (0.0%) |
| High School Diploma | 474 (49.0%) | 70 (7.2%) |
| College / Associate Degree | 935 (90.2%) | 0 (0.0%) |
| Bachelor's Degree or higher | 646 (96.6%) | 0 (0.0%) |
| Total | 2,404 (76.3%) | 44 (1.4%) |
Employment Occupations by Sex in Wappingers Falls
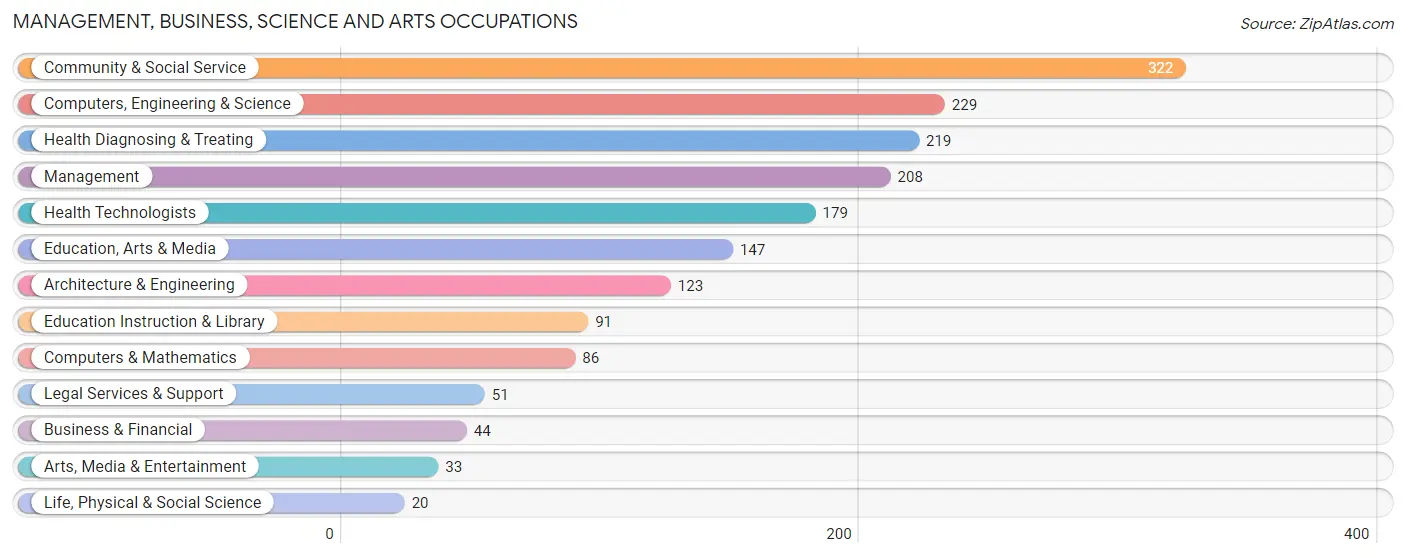
Management, Business, Science and Arts Occupations
The most common Management, Business, Science and Arts occupations in Wappingers Falls are Community & Social Service (322 | 11.7%), Computers, Engineering & Science (229 | 8.3%), Health Diagnosing & Treating (219 | 8.0%), Management (208 | 7.6%), and Health Technologists (179 | 6.5%).
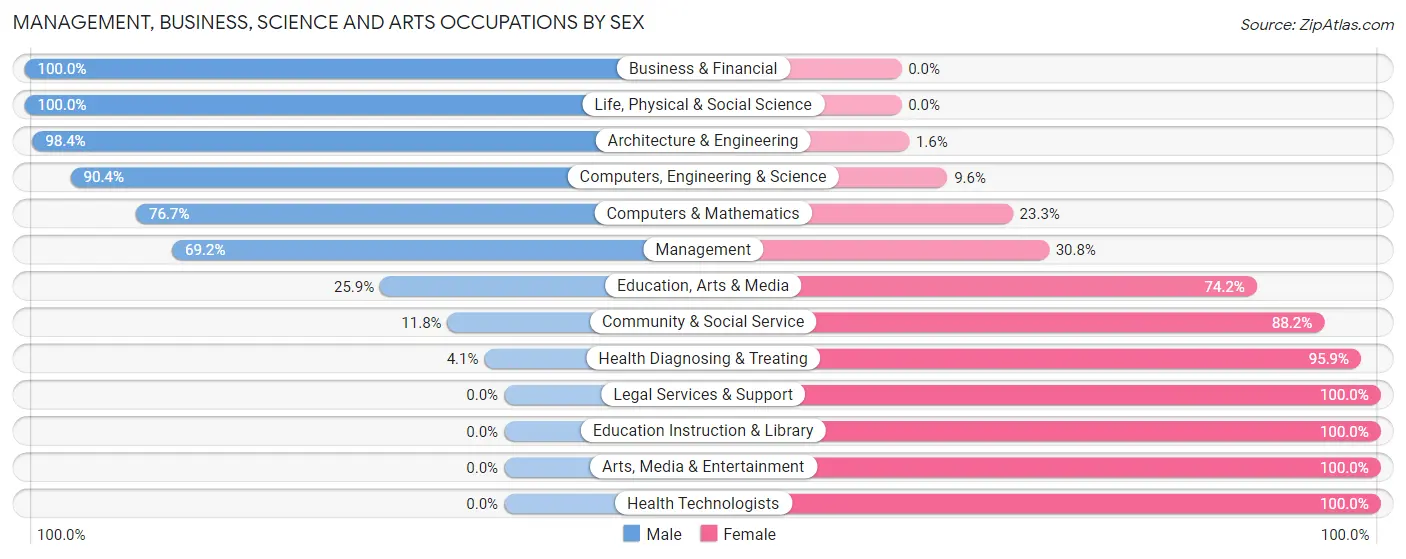
Management, Business, Science and Arts Occupations by Sex
Within the Management, Business, Science and Arts occupations in Wappingers Falls, the most male-oriented occupations are Business & Financial (100.0%), Life, Physical & Social Science (100.0%), and Architecture & Engineering (98.4%), while the most female-oriented occupations are Legal Services & Support (100.0%), Education Instruction & Library (100.0%), and Arts, Media & Entertainment (100.0%).
| Occupation | Male | Female |
| Management | 144 (69.2%) | 64 (30.8%) |
| Business & Financial | 44 (100.0%) | 0 (0.0%) |
| Computers, Engineering & Science | 207 (90.4%) | 22 (9.6%) |
| Computers & Mathematics | 66 (76.7%) | 20 (23.3%) |
| Architecture & Engineering | 121 (98.4%) | 2 (1.6%) |
| Life, Physical & Social Science | 20 (100.0%) | 0 (0.0%) |
| Community & Social Service | 38 (11.8%) | 284 (88.2%) |
| Education, Arts & Media | 38 (25.9%) | 109 (74.2%) |
| Legal Services & Support | 0 (0.0%) | 51 (100.0%) |
| Education Instruction & Library | 0 (0.0%) | 91 (100.0%) |
| Arts, Media & Entertainment | 0 (0.0%) | 33 (100.0%) |
| Health Diagnosing & Treating | 9 (4.1%) | 210 (95.9%) |
| Health Technologists | 0 (0.0%) | 179 (100.0%) |
| Total (Category) | 442 (43.2%) | 580 (56.8%) |
| Total (Overall) | 1,283 (46.7%) | 1,467 (53.3%) |
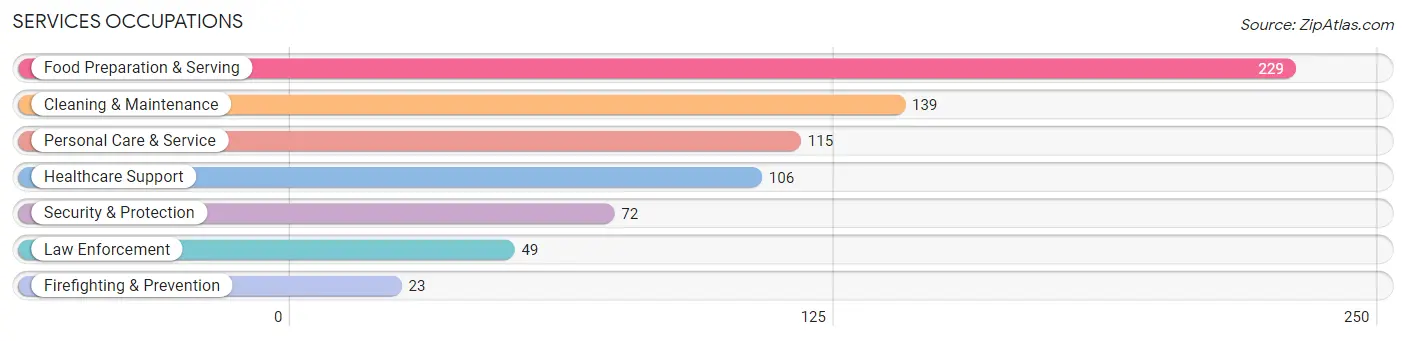
Services Occupations
The most common Services occupations in Wappingers Falls are Food Preparation & Serving (229 | 8.3%), Cleaning & Maintenance (139 | 5.1%), Personal Care & Service (115 | 4.2%), Healthcare Support (106 | 3.8%), and Security & Protection (72 | 2.6%).
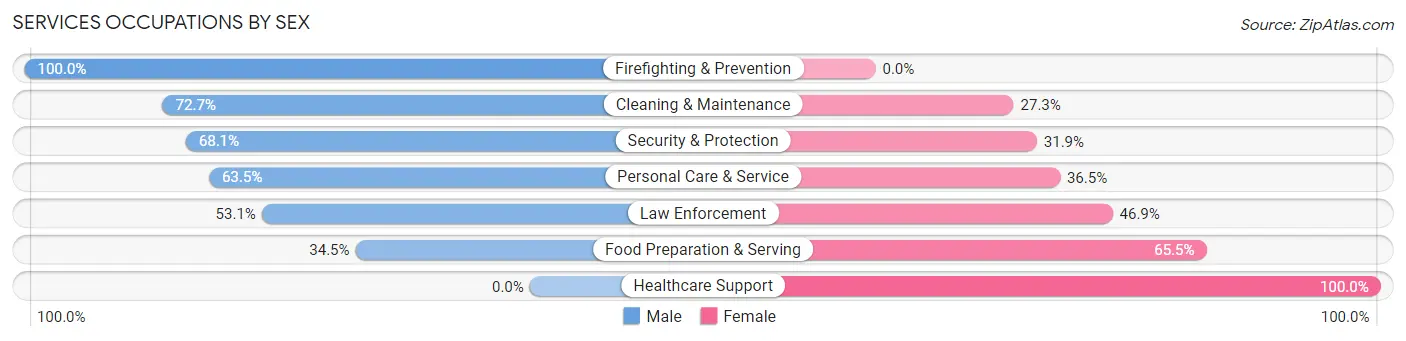
Services Occupations by Sex
Within the Services occupations in Wappingers Falls, the most male-oriented occupations are Firefighting & Prevention (100.0%), Cleaning & Maintenance (72.7%), and Security & Protection (68.1%), while the most female-oriented occupations are Healthcare Support (100.0%), Food Preparation & Serving (65.5%), and Law Enforcement (46.9%).
| Occupation | Male | Female |
| Healthcare Support | 0 (0.0%) | 106 (100.0%) |
| Security & Protection | 49 (68.1%) | 23 (31.9%) |
| Firefighting & Prevention | 23 (100.0%) | 0 (0.0%) |
| Law Enforcement | 26 (53.1%) | 23 (46.9%) |
| Food Preparation & Serving | 79 (34.5%) | 150 (65.5%) |
| Cleaning & Maintenance | 101 (72.7%) | 38 (27.3%) |
| Personal Care & Service | 73 (63.5%) | 42 (36.5%) |
| Total (Category) | 302 (45.7%) | 359 (54.3%) |
| Total (Overall) | 1,283 (46.7%) | 1,467 (53.3%) |
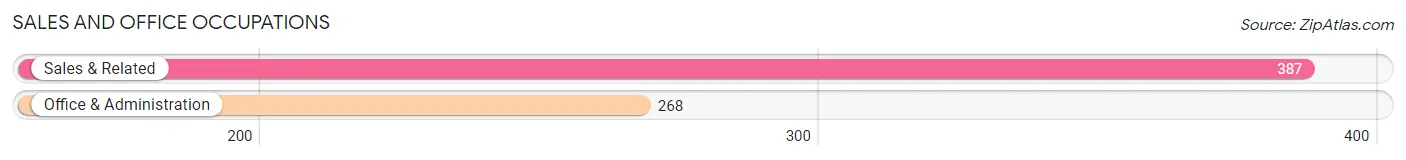
Sales and Office Occupations
The most common Sales and Office occupations in Wappingers Falls are Sales & Related (387 | 14.1%), and Office & Administration (268 | 9.8%).
Sales and Office Occupations by Sex
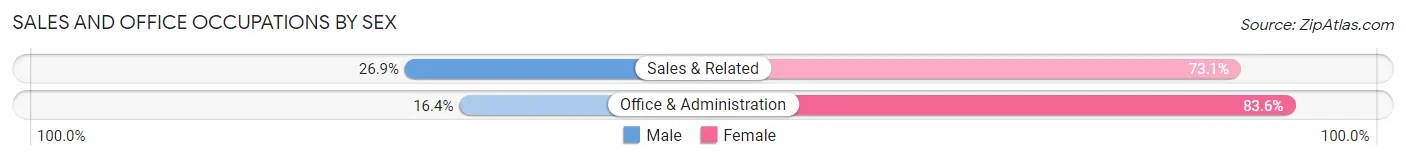
| Occupation | Male | Female |
| Sales & Related | 104 (26.9%) | 283 (73.1%) |
| Office & Administration | 44 (16.4%) | 224 (83.6%) |
| Total (Category) | 148 (22.6%) | 507 (77.4%) |
| Total (Overall) | 1,283 (46.7%) | 1,467 (53.3%) |
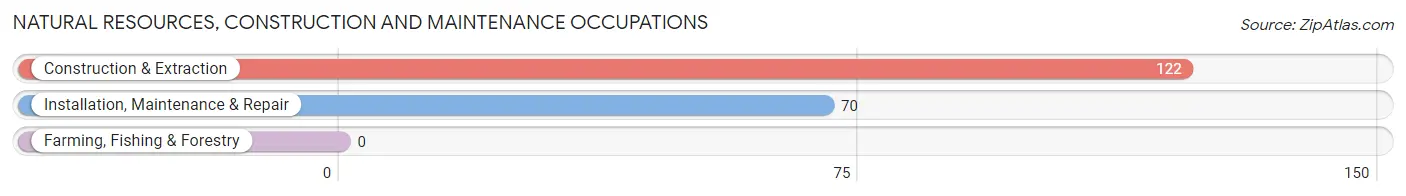
Natural Resources, Construction and Maintenance Occupations
The most common Natural Resources, Construction and Maintenance occupations in Wappingers Falls are Construction & Extraction (122 | 4.4%), and Installation, Maintenance & Repair (70 | 2.5%).
Natural Resources, Construction and Maintenance Occupations by Sex
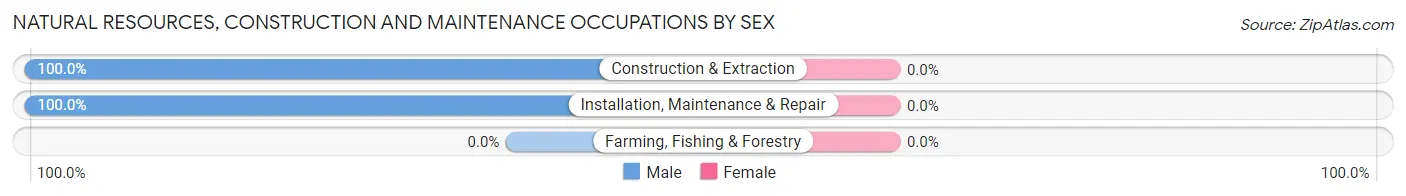
| Occupation | Male | Female |
| Farming, Fishing & Forestry | 0 (0.0%) | 0 (0.0%) |
| Construction & Extraction | 122 (100.0%) | 0 (0.0%) |
| Installation, Maintenance & Repair | 70 (100.0%) | 0 (0.0%) |
| Total (Category) | 192 (100.0%) | 0 (0.0%) |
| Total (Overall) | 1,283 (46.7%) | 1,467 (53.3%) |
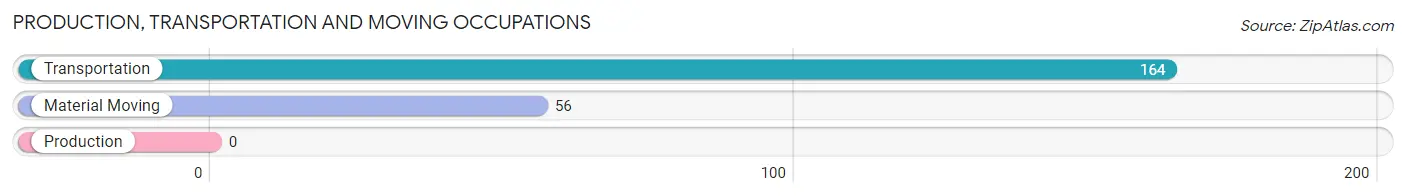
Production, Transportation and Moving Occupations
The most common Production, Transportation and Moving occupations in Wappingers Falls are Transportation (164 | 6.0%), and Material Moving (56 | 2.0%).
Production, Transportation and Moving Occupations by Sex
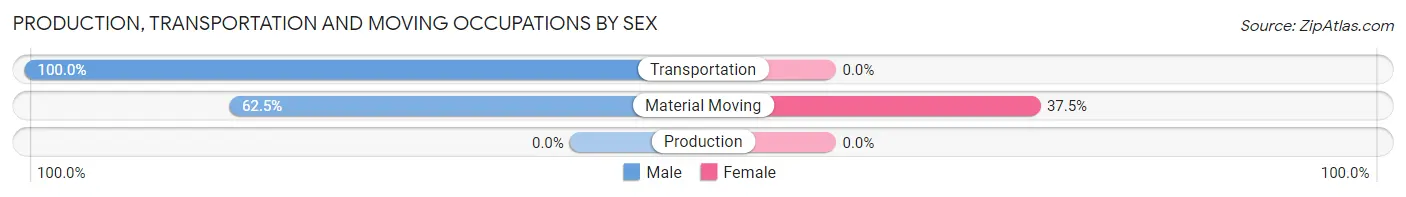
| Occupation | Male | Female |
| Production | 0 (0.0%) | 0 (0.0%) |
| Transportation | 164 (100.0%) | 0 (0.0%) |
| Material Moving | 35 (62.5%) | 21 (37.5%) |
| Total (Category) | 199 (90.4%) | 21 (9.6%) |
| Total (Overall) | 1,283 (46.7%) | 1,467 (53.3%) |
Employment Industries by Sex in Wappingers Falls
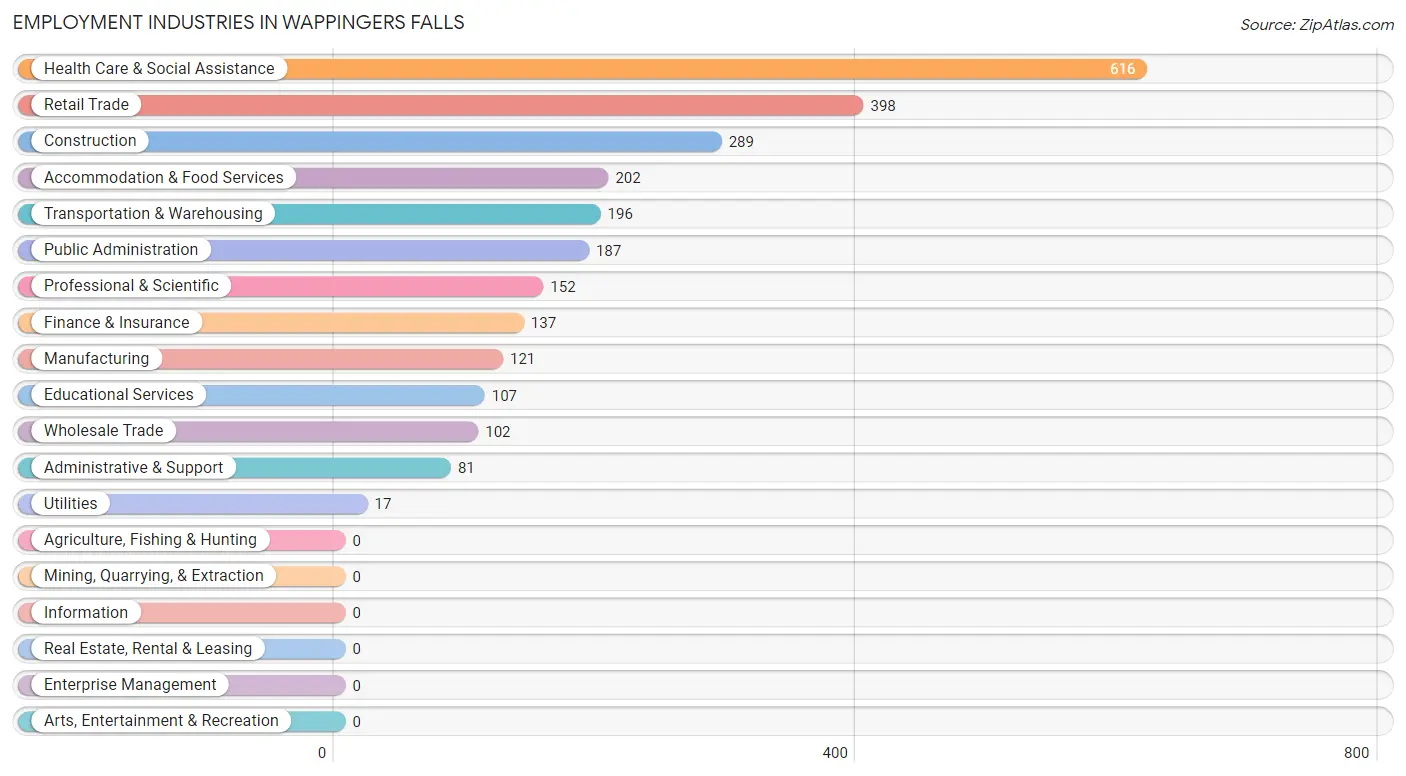
Employment Industries in Wappingers Falls
The major employment industries in Wappingers Falls include Health Care & Social Assistance (616 | 22.4%), Retail Trade (398 | 14.5%), Construction (289 | 10.5%), Accommodation & Food Services (202 | 7.3%), and Transportation & Warehousing (196 | 7.1%).
Employment Industries by Sex in Wappingers Falls
The Wappingers Falls industries that see more men than women are Utilities (100.0%), Administrative & Support (100.0%), and Construction (95.2%), whereas the industries that tend to have a higher number of women are Educational Services (100.0%), Finance & Insurance (83.2%), and Health Care & Social Assistance (75.8%).
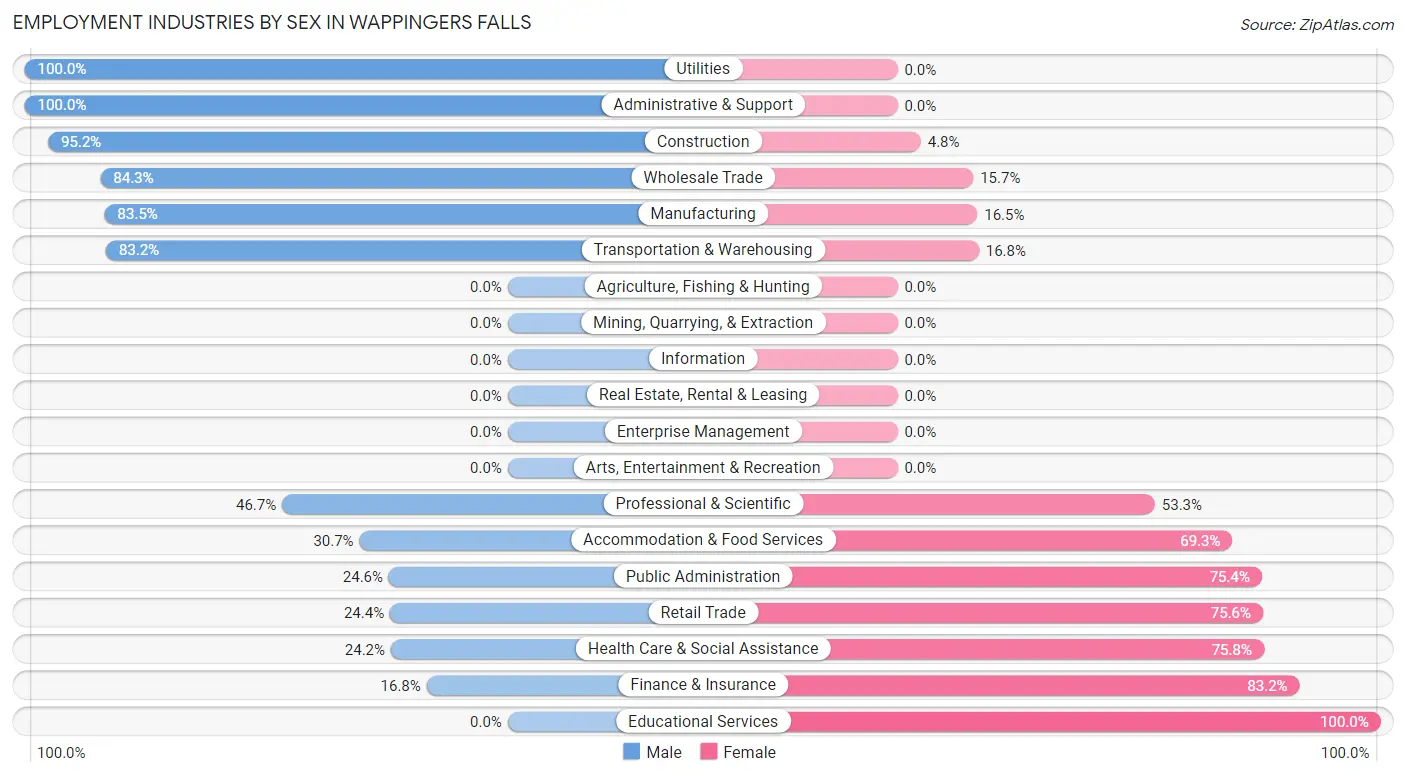
| Industry | Male | Female |
| Agriculture, Fishing & Hunting | 0 (0.0%) | 0 (0.0%) |
| Mining, Quarrying, & Extraction | 0 (0.0%) | 0 (0.0%) |
| Construction | 275 (95.2%) | 14 (4.8%) |
| Manufacturing | 101 (83.5%) | 20 (16.5%) |
| Wholesale Trade | 86 (84.3%) | 16 (15.7%) |
| Retail Trade | 97 (24.4%) | 301 (75.6%) |
| Transportation & Warehousing | 163 (83.2%) | 33 (16.8%) |
| Utilities | 17 (100.0%) | 0 (0.0%) |
| Information | 0 (0.0%) | 0 (0.0%) |
| Finance & Insurance | 23 (16.8%) | 114 (83.2%) |
| Real Estate, Rental & Leasing | 0 (0.0%) | 0 (0.0%) |
| Professional & Scientific | 71 (46.7%) | 81 (53.3%) |
| Enterprise Management | 0 (0.0%) | 0 (0.0%) |
| Administrative & Support | 81 (100.0%) | 0 (0.0%) |
| Educational Services | 0 (0.0%) | 107 (100.0%) |
| Health Care & Social Assistance | 149 (24.2%) | 467 (75.8%) |
| Arts, Entertainment & Recreation | 0 (0.0%) | 0 (0.0%) |
| Accommodation & Food Services | 62 (30.7%) | 140 (69.3%) |
| Public Administration | 46 (24.6%) | 141 (75.4%) |
| Total | 1,283 (46.7%) | 1,467 (53.3%) |
Education in Wappingers Falls
School Enrollment in Wappingers Falls
The most common levels of schooling among the 1,038 students in Wappingers Falls are college / undergraduate (371 | 35.7%), high school (296 | 28.5%), and middle school (242 | 23.3%).
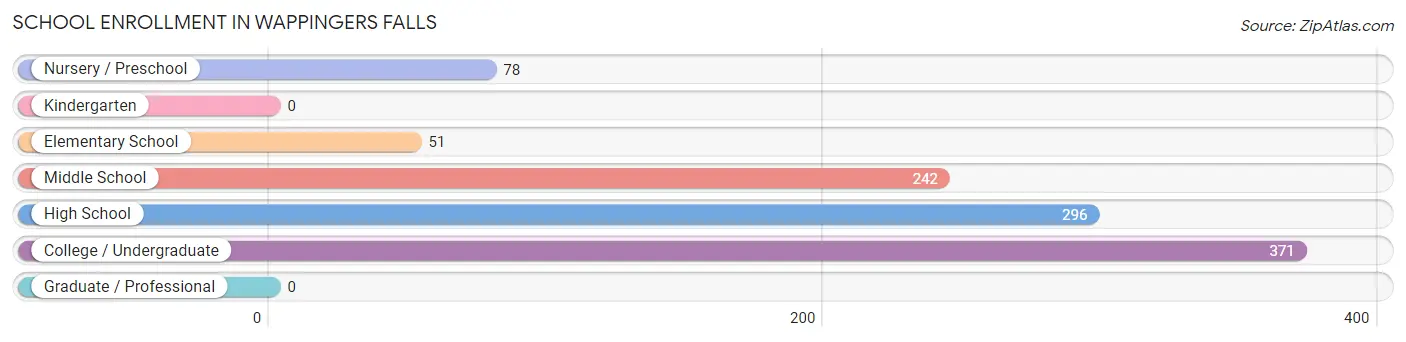
| School Level | # Students | % Students |
| Nursery / Preschool | 78 | 7.5% |
| Kindergarten | 0 | 0.0% |
| Elementary School | 51 | 4.9% |
| Middle School | 242 | 23.3% |
| High School | 296 | 28.5% |
| College / Undergraduate | 371 | 35.7% |
| Graduate / Professional | 0 | 0.0% |
| Total | 1,038 | 100.0% |
School Enrollment by Age by Funding Source in Wappingers Falls
Out of a total of 1,038 students who are enrolled in schools in Wappingers Falls, 170 (16.4%) attend a private institution, while the remaining 868 (83.6%) are enrolled in public schools. The age group of 3 to 4 year olds has the highest likelihood of being enrolled in private schools, with 26 (68.4% in the age bracket) enrolled. Conversely, the age group of 25 to 34 year olds has the lowest likelihood of being enrolled in a private school, with 28 (100.0% in the age bracket) attending a public institution.
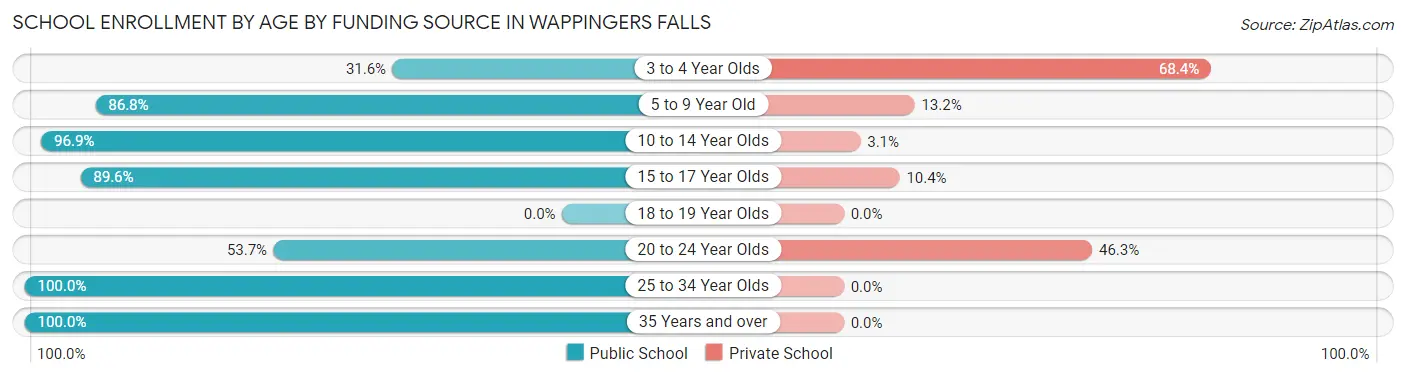
| Age Bracket | Public School | Private School |
| 3 to 4 Year Olds | 12 (31.6%) | 26 (68.4%) |
| 5 to 9 Year Old | 79 (86.8%) | 12 (13.2%) |
| 10 to 14 Year Olds | 345 (96.9%) | 11 (3.1%) |
| 15 to 17 Year Olds | 138 (89.6%) | 16 (10.4%) |
| 18 to 19 Year Olds | 0 (0.0%) | 0 (0.0%) |
| 20 to 24 Year Olds | 122 (53.7%) | 105 (46.3%) |
| 25 to 34 Year Olds | 28 (100.0%) | 0 (0.0%) |
| 35 Years and over | 144 (100.0%) | 0 (0.0%) |
| Total | 868 (83.6%) | 170 (16.4%) |
Educational Attainment by Field of Study in Wappingers Falls
Business (176 | 18.0%), science & technology (125 | 12.8%), liberal arts & history (101 | 10.3%), engineering (92 | 9.4%), and literature & languages (91 | 9.3%) are the most common fields of study among 976 individuals in Wappingers Falls who have obtained a bachelor's degree or higher.
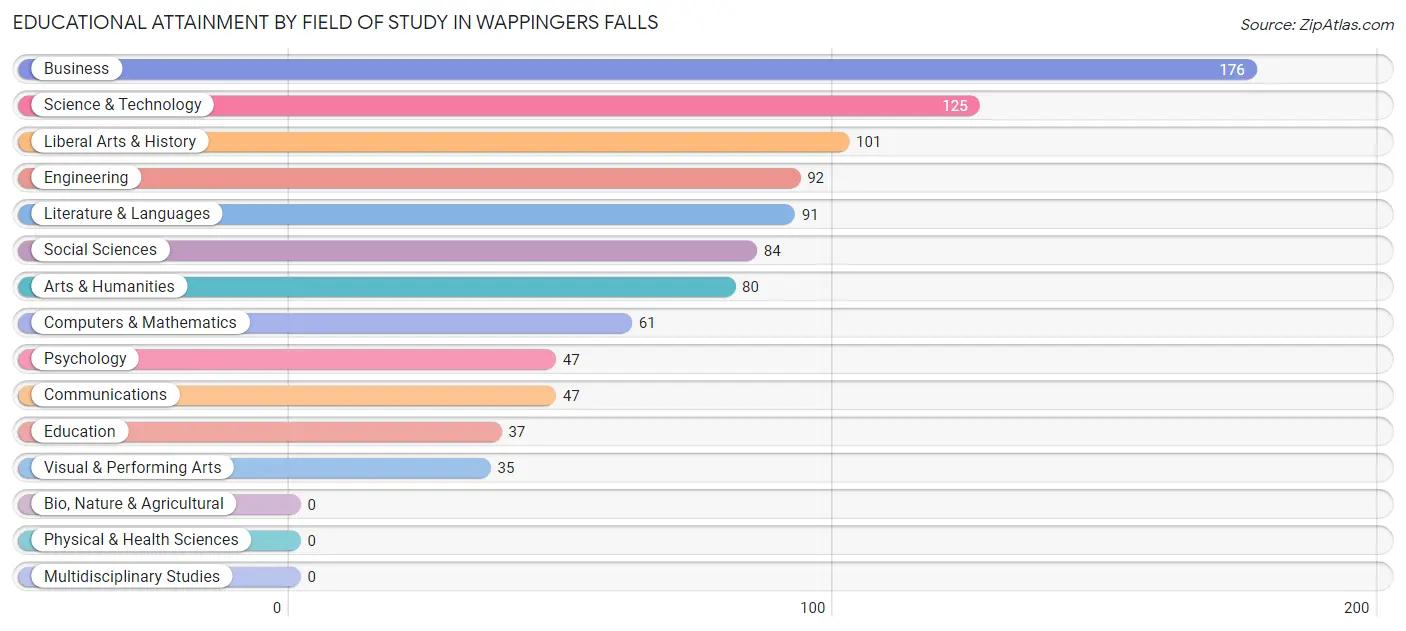
| Field of Study | # Graduates | % Graduates |
| Computers & Mathematics | 61 | 6.2% |
| Bio, Nature & Agricultural | 0 | 0.0% |
| Physical & Health Sciences | 0 | 0.0% |
| Psychology | 47 | 4.8% |
| Social Sciences | 84 | 8.6% |
| Engineering | 92 | 9.4% |
| Multidisciplinary Studies | 0 | 0.0% |
| Science & Technology | 125 | 12.8% |
| Business | 176 | 18.0% |
| Education | 37 | 3.8% |
| Literature & Languages | 91 | 9.3% |
| Liberal Arts & History | 101 | 10.3% |
| Visual & Performing Arts | 35 | 3.6% |
| Communications | 47 | 4.8% |
| Arts & Humanities | 80 | 8.2% |
| Total | 976 | 100.0% |
Transportation & Commute in Wappingers Falls
Vehicle Availability by Sex in Wappingers Falls
The most prevalent vehicle ownership categories in Wappingers Falls are males with 2 vehicles (463, accounting for 37.2%) and females with 2 vehicles (545, making up 32.0%).
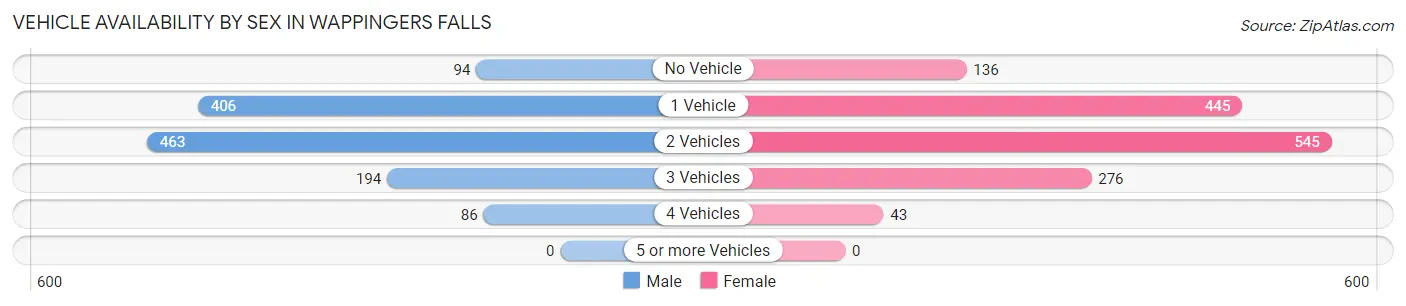
| Vehicles Available | Male | Female |
| No Vehicle | 94 (7.6%) | 136 (9.4%) |
| 1 Vehicle | 406 (32.7%) | 445 (30.8%) |
| 2 Vehicles | 463 (37.2%) | 545 (37.7%) |
| 3 Vehicles | 194 (15.6%) | 276 (19.1%) |
| 4 Vehicles | 86 (6.9%) | 43 (3.0%) |
| 5 or more Vehicles | 0 (0.0%) | 0 (0.0%) |
| Total | 1,243 (100.0%) | 1,445 (100.0%) |
Commute Time in Wappingers Falls
The most frequently occuring commute durations in Wappingers Falls are 15 to 19 minutes (415 commuters, 17.8%), 60 to 89 minutes (327 commuters, 14.0%), and 5 to 9 minutes (304 commuters, 13.0%).
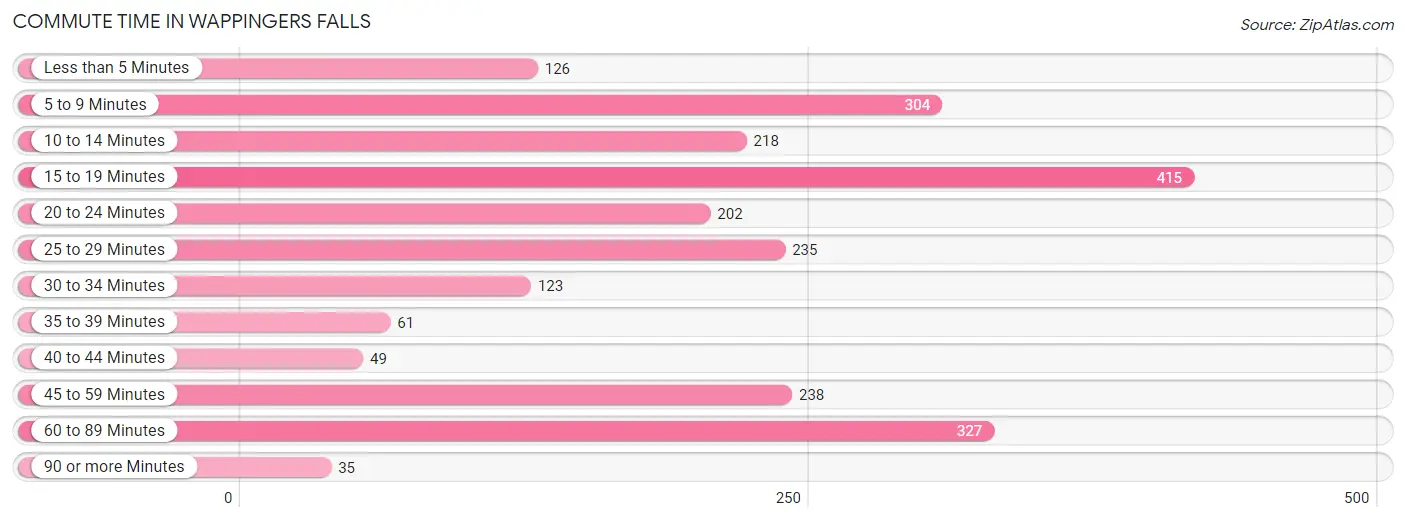
| Commute Time | # Commuters | % Commuters |
| Less than 5 Minutes | 126 | 5.4% |
| 5 to 9 Minutes | 304 | 13.0% |
| 10 to 14 Minutes | 218 | 9.3% |
| 15 to 19 Minutes | 415 | 17.8% |
| 20 to 24 Minutes | 202 | 8.7% |
| 25 to 29 Minutes | 235 | 10.1% |
| 30 to 34 Minutes | 123 | 5.3% |
| 35 to 39 Minutes | 61 | 2.6% |
| 40 to 44 Minutes | 49 | 2.1% |
| 45 to 59 Minutes | 238 | 10.2% |
| 60 to 89 Minutes | 327 | 14.0% |
| 90 or more Minutes | 35 | 1.5% |
Commute Time by Sex in Wappingers Falls
The most common commute times in Wappingers Falls are 15 to 19 minutes (213 commuters, 20.9%) for males and 5 to 9 minutes (250 commuters, 19.0%) for females.
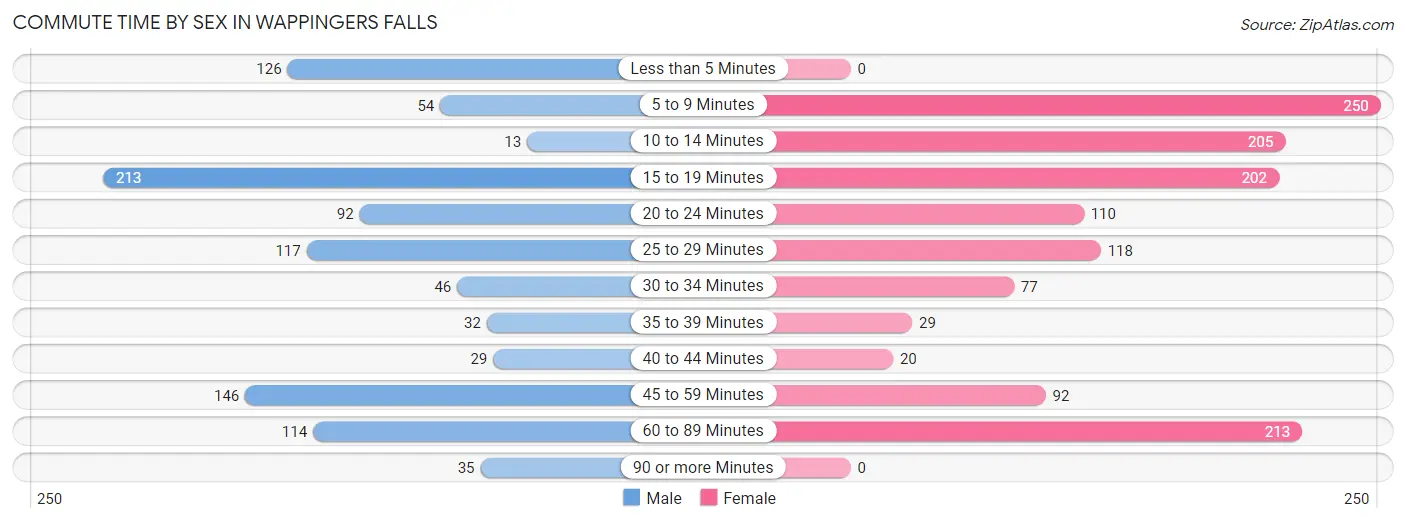
| Commute Time | Male | Female |
| Less than 5 Minutes | 126 (12.4%) | 0 (0.0%) |
| 5 to 9 Minutes | 54 (5.3%) | 250 (19.0%) |
| 10 to 14 Minutes | 13 (1.3%) | 205 (15.6%) |
| 15 to 19 Minutes | 213 (20.9%) | 202 (15.3%) |
| 20 to 24 Minutes | 92 (9.0%) | 110 (8.4%) |
| 25 to 29 Minutes | 117 (11.5%) | 118 (9.0%) |
| 30 to 34 Minutes | 46 (4.5%) | 77 (5.9%) |
| 35 to 39 Minutes | 32 (3.2%) | 29 (2.2%) |
| 40 to 44 Minutes | 29 (2.9%) | 20 (1.5%) |
| 45 to 59 Minutes | 146 (14.4%) | 92 (7.0%) |
| 60 to 89 Minutes | 114 (11.2%) | 213 (16.2%) |
| 90 or more Minutes | 35 (3.4%) | 0 (0.0%) |
Time of Departure to Work by Sex in Wappingers Falls
The most frequent times of departure to work in Wappingers Falls are 12:00 AM to 4:59 AM (179, 17.6%) for males and 8:00 AM to 8:29 AM (220, 16.7%) for females.
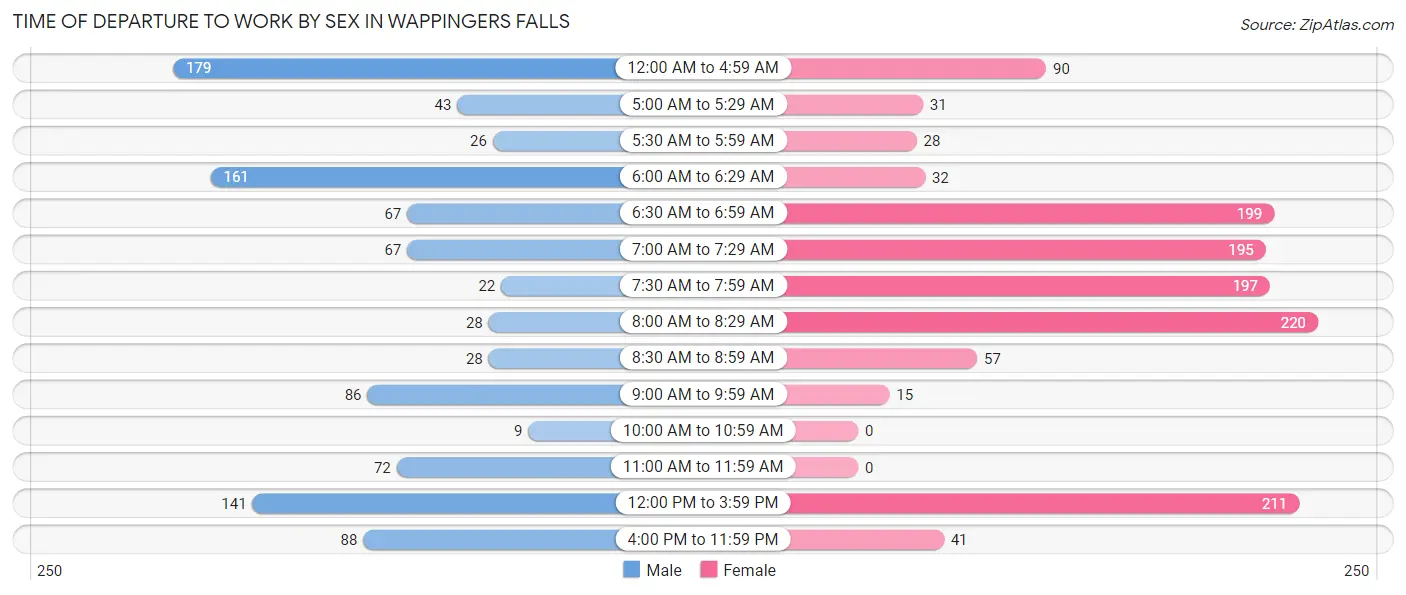
| Time of Departure | Male | Female |
| 12:00 AM to 4:59 AM | 179 (17.6%) | 90 (6.8%) |
| 5:00 AM to 5:29 AM | 43 (4.2%) | 31 (2.4%) |
| 5:30 AM to 5:59 AM | 26 (2.6%) | 28 (2.1%) |
| 6:00 AM to 6:29 AM | 161 (15.8%) | 32 (2.4%) |
| 6:30 AM to 6:59 AM | 67 (6.6%) | 199 (15.1%) |
| 7:00 AM to 7:29 AM | 67 (6.6%) | 195 (14.8%) |
| 7:30 AM to 7:59 AM | 22 (2.2%) | 197 (15.0%) |
| 8:00 AM to 8:29 AM | 28 (2.8%) | 220 (16.7%) |
| 8:30 AM to 8:59 AM | 28 (2.8%) | 57 (4.3%) |
| 9:00 AM to 9:59 AM | 86 (8.5%) | 15 (1.1%) |
| 10:00 AM to 10:59 AM | 9 (0.9%) | 0 (0.0%) |
| 11:00 AM to 11:59 AM | 72 (7.1%) | 0 (0.0%) |
| 12:00 PM to 3:59 PM | 141 (13.9%) | 211 (16.0%) |
| 4:00 PM to 11:59 PM | 88 (8.6%) | 41 (3.1%) |
| Total | 1,017 (100.0%) | 1,316 (100.0%) |
Housing Occupancy in Wappingers Falls
Occupancy by Ownership in Wappingers Falls
Of the total 2,515 dwellings in Wappingers Falls, owner-occupied units account for 790 (31.4%), while renter-occupied units make up 1,725 (68.6%).
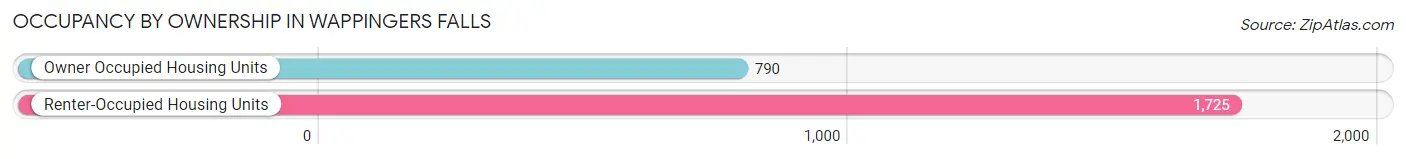
| Occupancy | # Housing Units | % Housing Units |
| Owner Occupied Housing Units | 790 | 31.4% |
| Renter-Occupied Housing Units | 1,725 | 68.6% |
| Total Occupied Housing Units | 2,515 | 100.0% |
Occupancy by Household Size in Wappingers Falls
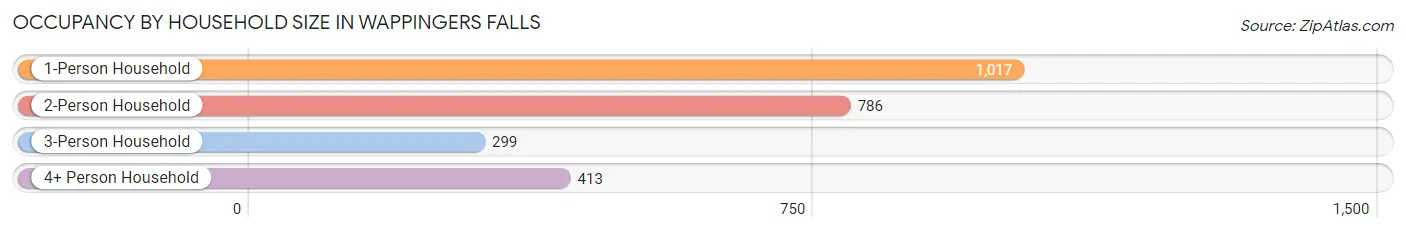
| Household Size | # Housing Units | % Housing Units |
| 1-Person Household | 1,017 | 40.4% |
| 2-Person Household | 786 | 31.2% |
| 3-Person Household | 299 | 11.9% |
| 4+ Person Household | 413 | 16.4% |
| Total Housing Units | 2,515 | 100.0% |
Occupancy by Ownership by Household Size in Wappingers Falls
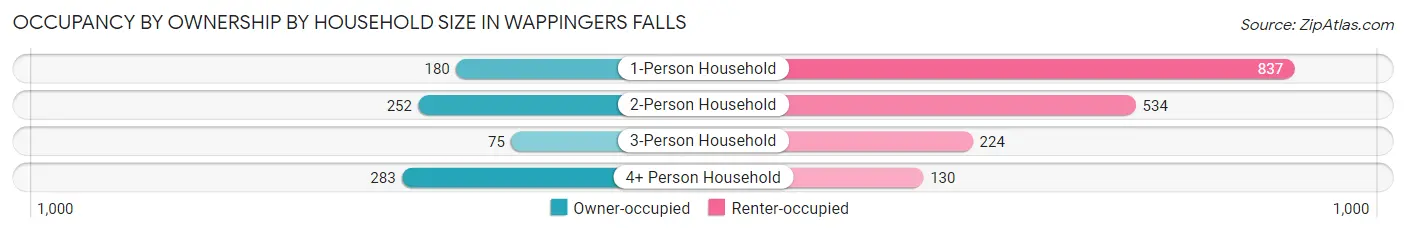
| Household Size | Owner-occupied | Renter-occupied |
| 1-Person Household | 180 (17.7%) | 837 (82.3%) |
| 2-Person Household | 252 (32.1%) | 534 (67.9%) |
| 3-Person Household | 75 (25.1%) | 224 (74.9%) |
| 4+ Person Household | 283 (68.5%) | 130 (31.5%) |
| Total Housing Units | 790 (31.4%) | 1,725 (68.6%) |
Occupancy by Educational Attainment in Wappingers Falls
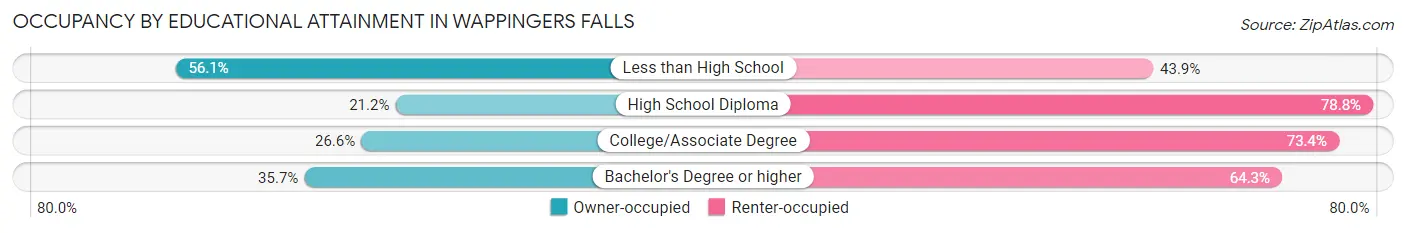
| Household Size | Owner-occupied | Renter-occupied |
| Less than High School | 194 (56.1%) | 152 (43.9%) |
| High School Diploma | 161 (21.2%) | 598 (78.8%) |
| College/Associate Degree | 200 (26.6%) | 551 (73.4%) |
| Bachelor's Degree or higher | 235 (35.7%) | 424 (64.3%) |
Occupancy by Age of Householder in Wappingers Falls
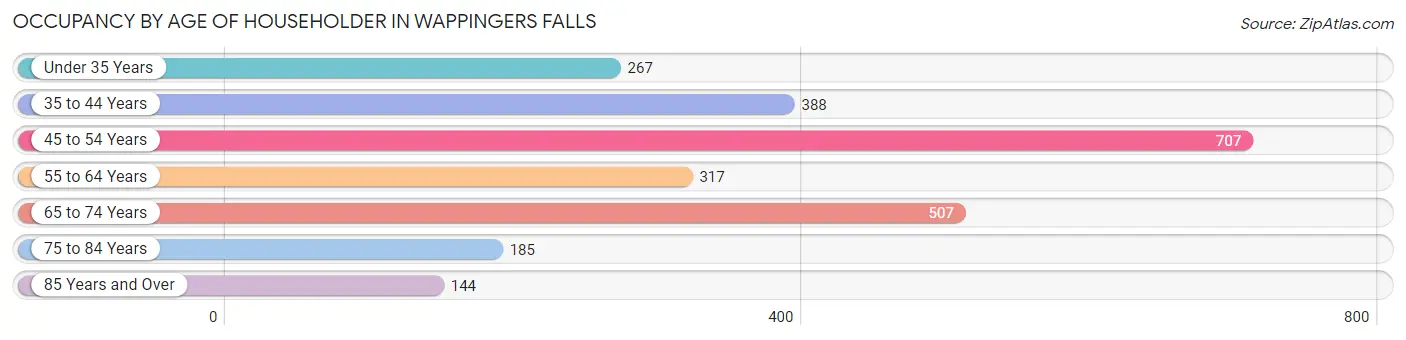
| Age Bracket | # Households | % Households |
| Under 35 Years | 267 | 10.6% |
| 35 to 44 Years | 388 | 15.4% |
| 45 to 54 Years | 707 | 28.1% |
| 55 to 64 Years | 317 | 12.6% |
| 65 to 74 Years | 507 | 20.2% |
| 75 to 84 Years | 185 | 7.4% |
| 85 Years and Over | 144 | 5.7% |
| Total | 2,515 | 100.0% |
Housing Finances in Wappingers Falls
Median Income by Occupancy in Wappingers Falls
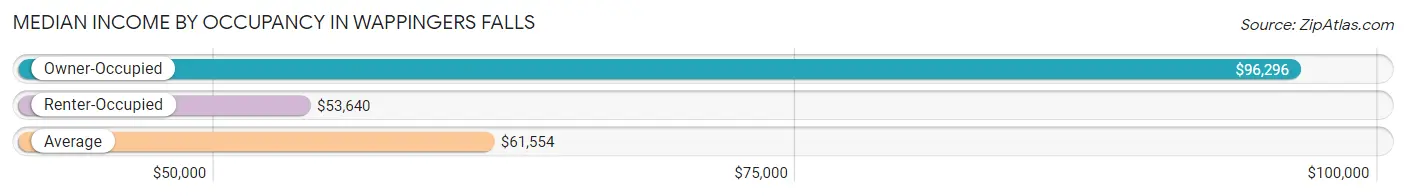
| Occupancy Type | # Households | Median Income |
| Owner-Occupied | 790 (31.4%) | $96,296 |
| Renter-Occupied | 1,725 (68.6%) | $53,640 |
| Average | 2,515 (100.0%) | $61,554 |
Occupancy by Householder Income Bracket in Wappingers Falls
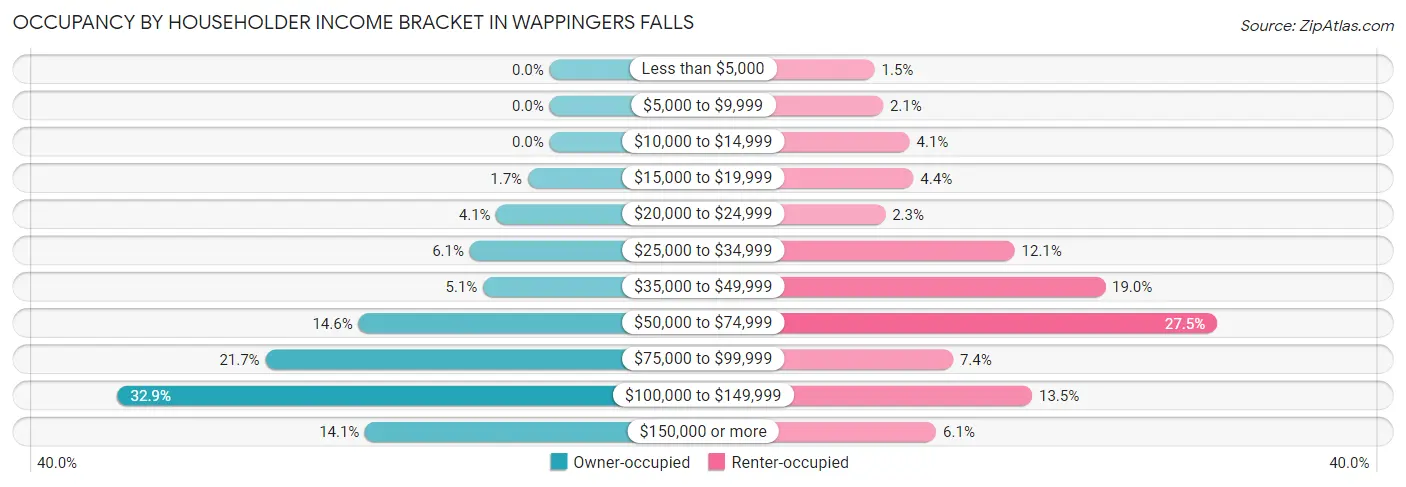
| Income Bracket | Owner-occupied | Renter-occupied |
| Less than $5,000 | 0 (0.0%) | 25 (1.5%) |
| $5,000 to $9,999 | 0 (0.0%) | 36 (2.1%) |
| $10,000 to $14,999 | 0 (0.0%) | 71 (4.1%) |
| $15,000 to $19,999 | 13 (1.7%) | 76 (4.4%) |
| $20,000 to $24,999 | 32 (4.1%) | 39 (2.3%) |
| $25,000 to $34,999 | 48 (6.1%) | 209 (12.1%) |
| $35,000 to $49,999 | 40 (5.1%) | 328 (19.0%) |
| $50,000 to $74,999 | 115 (14.6%) | 475 (27.5%) |
| $75,000 to $99,999 | 171 (21.6%) | 128 (7.4%) |
| $100,000 to $149,999 | 260 (32.9%) | 232 (13.5%) |
| $150,000 or more | 111 (14.1%) | 106 (6.1%) |
| Total | 790 (100.0%) | 1,725 (100.0%) |
Monthly Housing Cost Tiers in Wappingers Falls
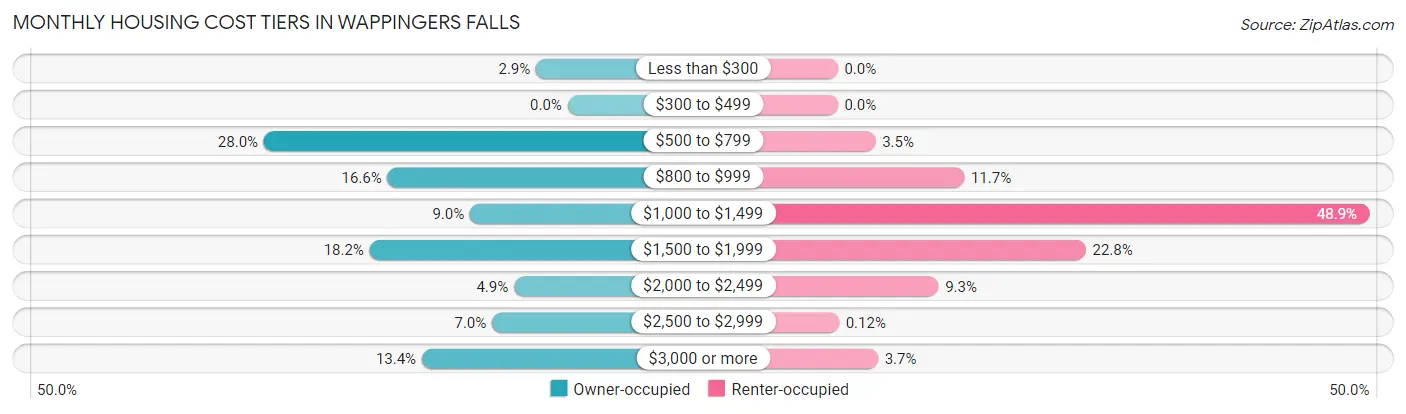
| Monthly Cost | Owner-occupied | Renter-occupied |
| Less than $300 | 23 (2.9%) | 0 (0.0%) |
| $300 to $499 | 0 (0.0%) | 0 (0.0%) |
| $500 to $799 | 221 (28.0%) | 60 (3.5%) |
| $800 to $999 | 131 (16.6%) | 201 (11.7%) |
| $1,000 to $1,499 | 71 (9.0%) | 844 (48.9%) |
| $1,500 to $1,999 | 144 (18.2%) | 394 (22.8%) |
| $2,000 to $2,499 | 39 (4.9%) | 160 (9.3%) |
| $2,500 to $2,999 | 55 (7.0%) | 2 (0.1%) |
| $3,000 or more | 106 (13.4%) | 64 (3.7%) |
| Total | 790 (100.0%) | 1,725 (100.0%) |
Physical Housing Characteristics in Wappingers Falls
Housing Structures in Wappingers Falls
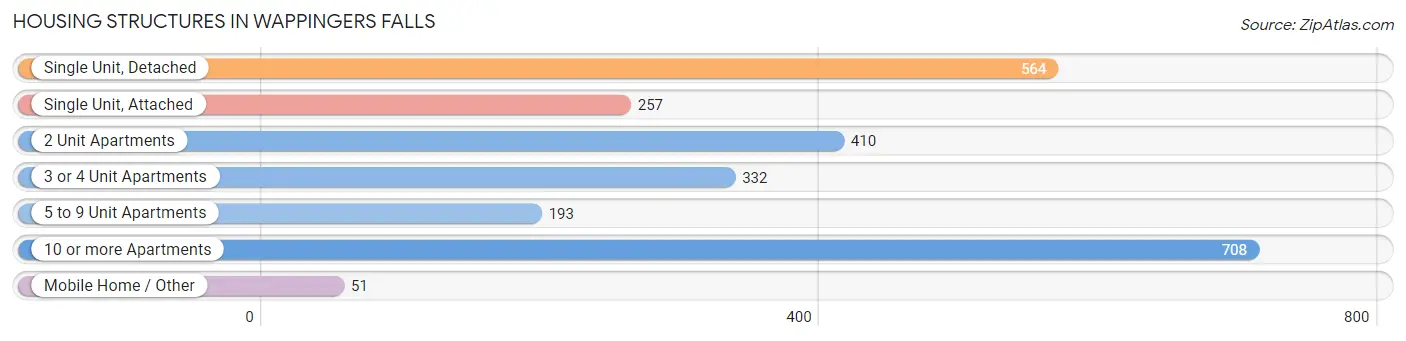
| Structure Type | # Housing Units | % Housing Units |
| Single Unit, Detached | 564 | 22.4% |
| Single Unit, Attached | 257 | 10.2% |
| 2 Unit Apartments | 410 | 16.3% |
| 3 or 4 Unit Apartments | 332 | 13.2% |
| 5 to 9 Unit Apartments | 193 | 7.7% |
| 10 or more Apartments | 708 | 28.1% |
| Mobile Home / Other | 51 | 2.0% |
| Total | 2,515 | 100.0% |
Housing Structures by Occupancy in Wappingers Falls
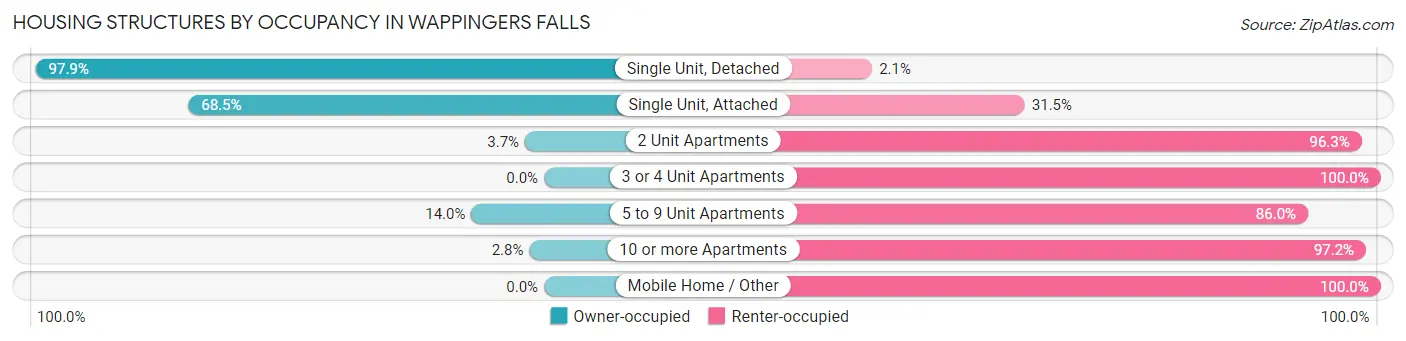
| Structure Type | Owner-occupied | Renter-occupied |
| Single Unit, Detached | 552 (97.9%) | 12 (2.1%) |
| Single Unit, Attached | 176 (68.5%) | 81 (31.5%) |
| 2 Unit Apartments | 15 (3.7%) | 395 (96.3%) |
| 3 or 4 Unit Apartments | 0 (0.0%) | 332 (100.0%) |
| 5 to 9 Unit Apartments | 27 (14.0%) | 166 (86.0%) |
| 10 or more Apartments | 20 (2.8%) | 688 (97.2%) |
| Mobile Home / Other | 0 (0.0%) | 51 (100.0%) |
| Total | 790 (31.4%) | 1,725 (68.6%) |
Housing Structures by Number of Rooms in Wappingers Falls
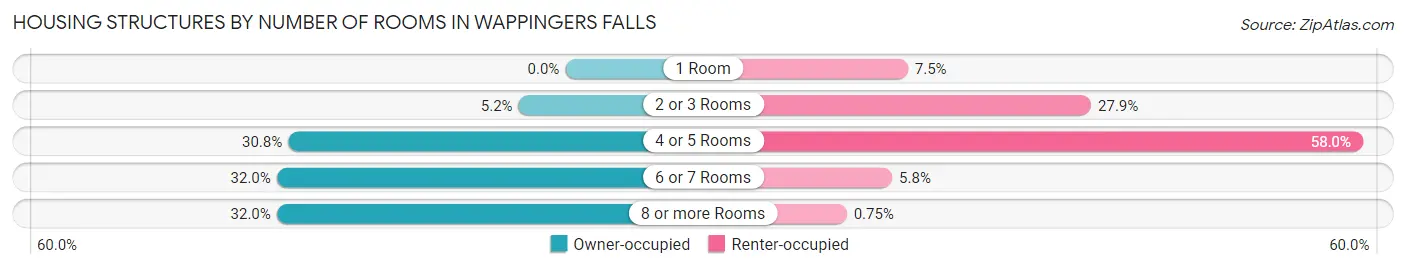
| Number of Rooms | Owner-occupied | Renter-occupied |
| 1 Room | 0 (0.0%) | 130 (7.5%) |
| 2 or 3 Rooms | 41 (5.2%) | 481 (27.9%) |
| 4 or 5 Rooms | 243 (30.8%) | 1,001 (58.0%) |
| 6 or 7 Rooms | 253 (32.0%) | 100 (5.8%) |
| 8 or more Rooms | 253 (32.0%) | 13 (0.7%) |
| Total | 790 (100.0%) | 1,725 (100.0%) |
Housing Structure by Heating Type in Wappingers Falls
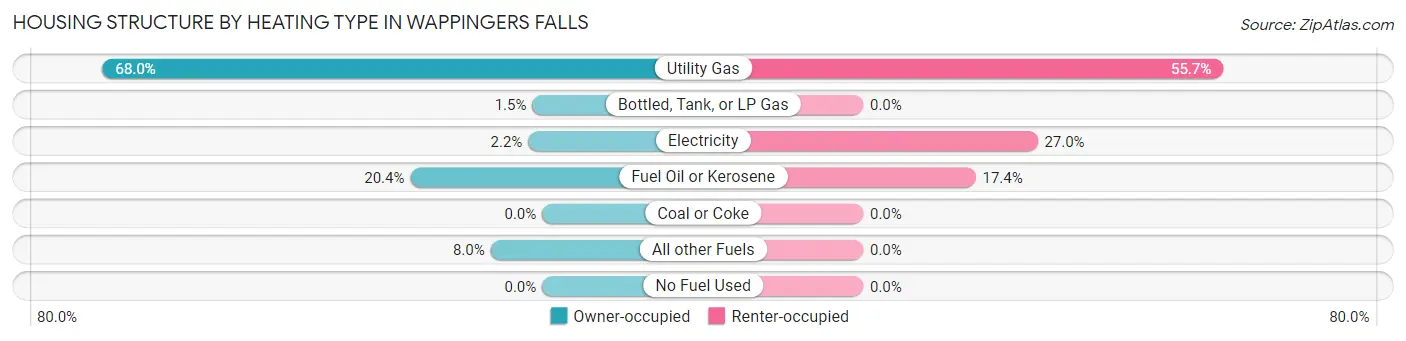
| Heating Type | Owner-occupied | Renter-occupied |
| Utility Gas | 537 (68.0%) | 960 (55.6%) |
| Bottled, Tank, or LP Gas | 12 (1.5%) | 0 (0.0%) |
| Electricity | 17 (2.1%) | 465 (27.0%) |
| Fuel Oil or Kerosene | 161 (20.4%) | 300 (17.4%) |
| Coal or Coke | 0 (0.0%) | 0 (0.0%) |
| All other Fuels | 63 (8.0%) | 0 (0.0%) |
| No Fuel Used | 0 (0.0%) | 0 (0.0%) |
| Total | 790 (100.0%) | 1,725 (100.0%) |
Household Vehicle Usage in Wappingers Falls
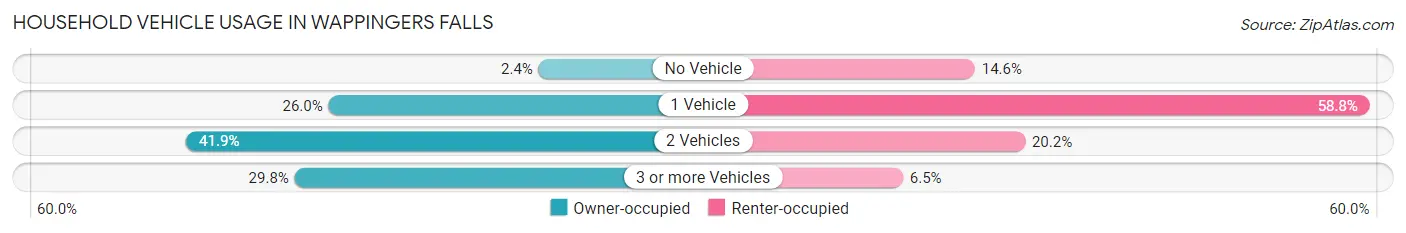
| Vehicles per Household | Owner-occupied | Renter-occupied |
| No Vehicle | 19 (2.4%) | 251 (14.5%) |
| 1 Vehicle | 205 (26.0%) | 1,014 (58.8%) |
| 2 Vehicles | 331 (41.9%) | 348 (20.2%) |
| 3 or more Vehicles | 235 (29.7%) | 112 (6.5%) |
| Total | 790 (100.0%) | 1,725 (100.0%) |
Real Estate & Mortgages in Wappingers Falls
Real Estate and Mortgage Overview in Wappingers Falls
| Characteristic | Without Mortgage | With Mortgage |
| Housing Units | 372 | 418 |
| Median Property Value | $284,100 | $255,300 |
| Median Household Income | $72,647 | $101 |
| Monthly Housing Costs | $712 | $106 |
| Real Estate Taxes | $5,235 | $27 |
Property Value by Mortgage Status in Wappingers Falls
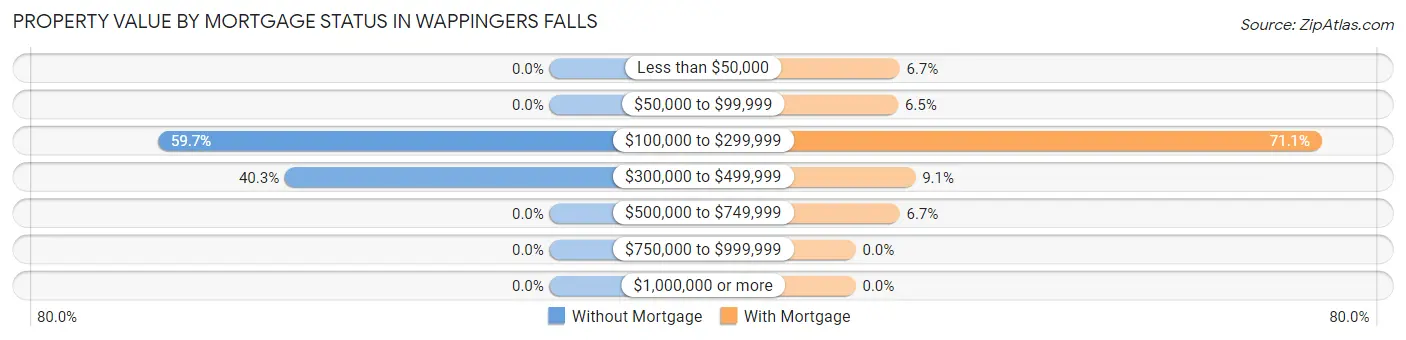
| Property Value | Without Mortgage | With Mortgage |
| Less than $50,000 | 0 (0.0%) | 28 (6.7%) |
| $50,000 to $99,999 | 0 (0.0%) | 27 (6.5%) |
| $100,000 to $299,999 | 222 (59.7%) | 297 (71.1%) |
| $300,000 to $499,999 | 150 (40.3%) | 38 (9.1%) |
| $500,000 to $749,999 | 0 (0.0%) | 28 (6.7%) |
| $750,000 to $999,999 | 0 (0.0%) | 0 (0.0%) |
| $1,000,000 or more | 0 (0.0%) | 0 (0.0%) |
| Total | 372 (100.0%) | 418 (100.0%) |
Household Income by Mortgage Status in Wappingers Falls
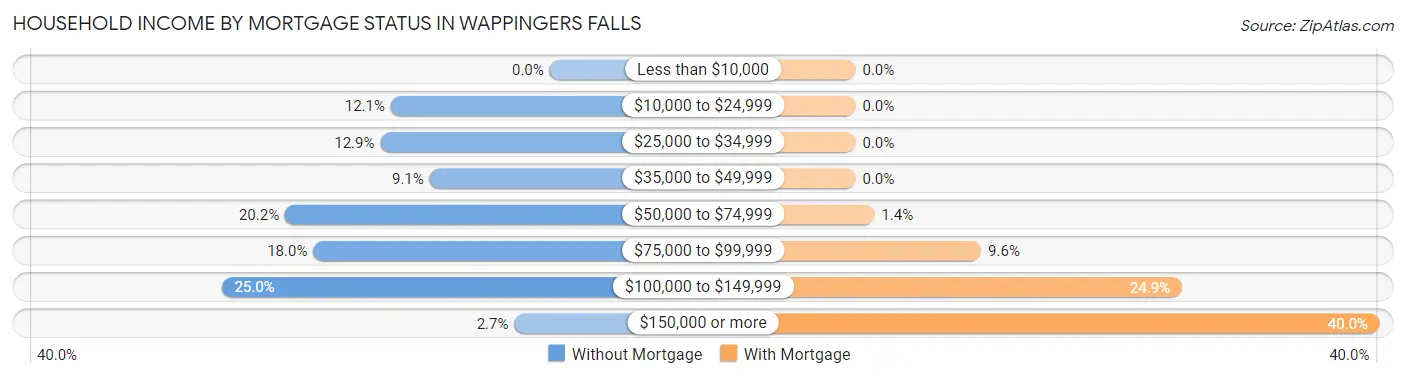
| Household Income | Without Mortgage | With Mortgage |
| Less than $10,000 | 0 (0.0%) | 0 (0.0%) |
| $10,000 to $24,999 | 45 (12.1%) | 0 (0.0%) |
| $25,000 to $34,999 | 48 (12.9%) | 0 (0.0%) |
| $35,000 to $49,999 | 34 (9.1%) | 0 (0.0%) |
| $50,000 to $74,999 | 75 (20.2%) | 6 (1.4%) |
| $75,000 to $99,999 | 67 (18.0%) | 40 (9.6%) |
| $100,000 to $149,999 | 93 (25.0%) | 104 (24.9%) |
| $150,000 or more | 10 (2.7%) | 167 (40.0%) |
| Total | 372 (100.0%) | 418 (100.0%) |
Property Value to Household Income Ratio in Wappingers Falls
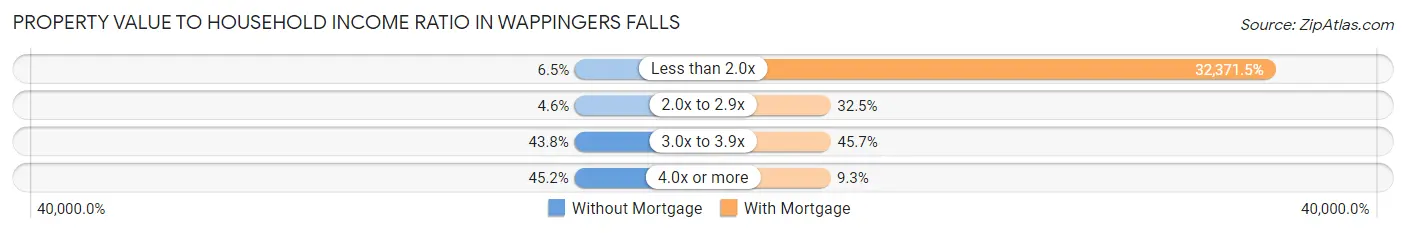
| Value-to-Income Ratio | Without Mortgage | With Mortgage |
| Less than 2.0x | 24 (6.5%) | 135,313 (32,371.5%) |
| 2.0x to 2.9x | 17 (4.6%) | 136 (32.5%) |
| 3.0x to 3.9x | 163 (43.8%) | 191 (45.7%) |
| 4.0x or more | 168 (45.2%) | 39 (9.3%) |
| Total | 372 (100.0%) | 418 (100.0%) |
Real Estate Taxes by Mortgage Status in Wappingers Falls
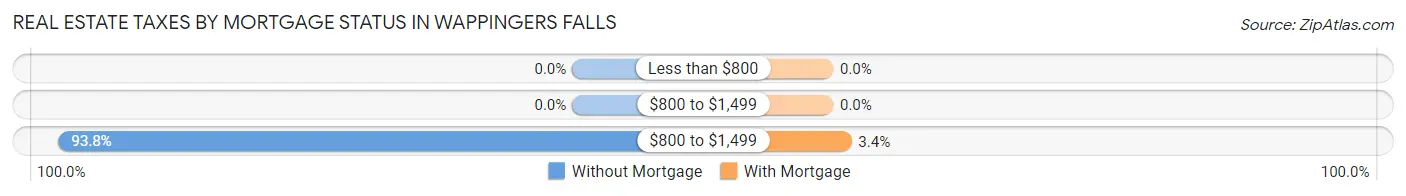
| Property Taxes | Without Mortgage | With Mortgage |
| Less than $800 | 0 (0.0%) | 0 (0.0%) |
| $800 to $1,499 | 0 (0.0%) | 0 (0.0%) |
| $800 to $1,499 | 349 (93.8%) | 14 (3.4%) |
| Total | 372 (100.0%) | 418 (100.0%) |
Health & Disability in Wappingers Falls
Health Insurance Coverage by Age in Wappingers Falls
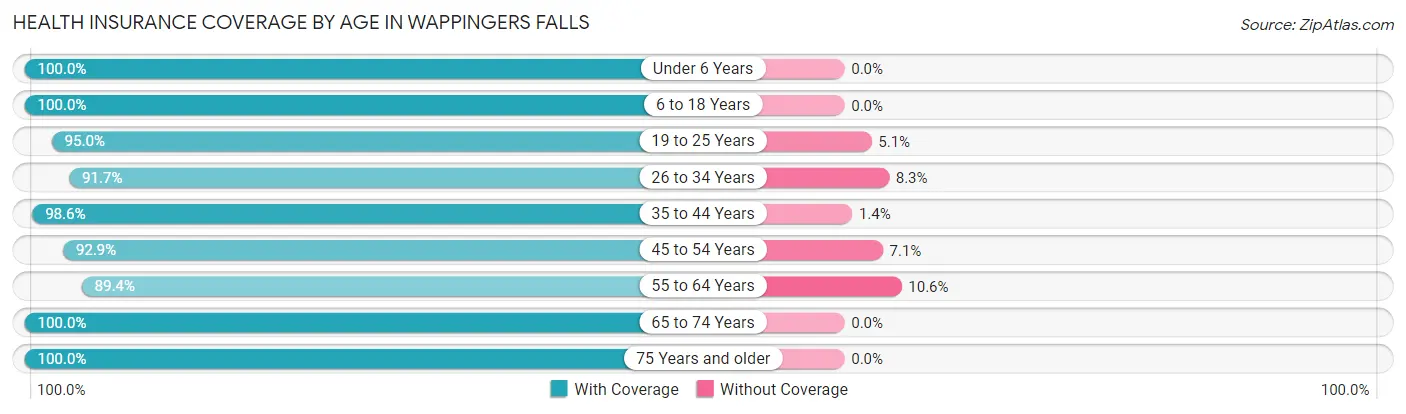
| Age Bracket | With Coverage | Without Coverage |
| Under 6 Years | 249 (100.0%) | 0 (0.0%) |
| 6 to 18 Years | 612 (100.0%) | 0 (0.0%) |
| 19 to 25 Years | 526 (95.0%) | 28 (5.1%) |
| 26 to 34 Years | 431 (91.7%) | 39 (8.3%) |
| 35 to 44 Years | 828 (98.6%) | 12 (1.4%) |
| 45 to 54 Years | 949 (92.9%) | 73 (7.1%) |
| 55 to 64 Years | 655 (89.4%) | 78 (10.6%) |
| 65 to 74 Years | 679 (100.0%) | 0 (0.0%) |
| 75 Years and older | 561 (100.0%) | 0 (0.0%) |
| Total | 5,490 (96.0%) | 230 (4.0%) |
Health Insurance Coverage by Citizenship Status in Wappingers Falls
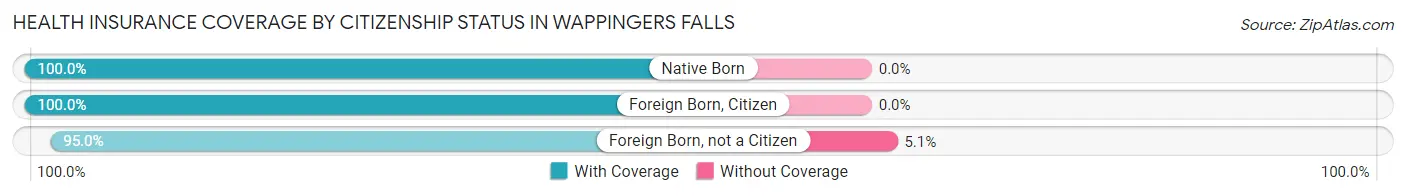
| Citizenship Status | With Coverage | Without Coverage |
| Native Born | 249 (100.0%) | 0 (0.0%) |
| Foreign Born, Citizen | 612 (100.0%) | 0 (0.0%) |
| Foreign Born, not a Citizen | 526 (95.0%) | 28 (5.1%) |
Health Insurance Coverage by Household Income in Wappingers Falls
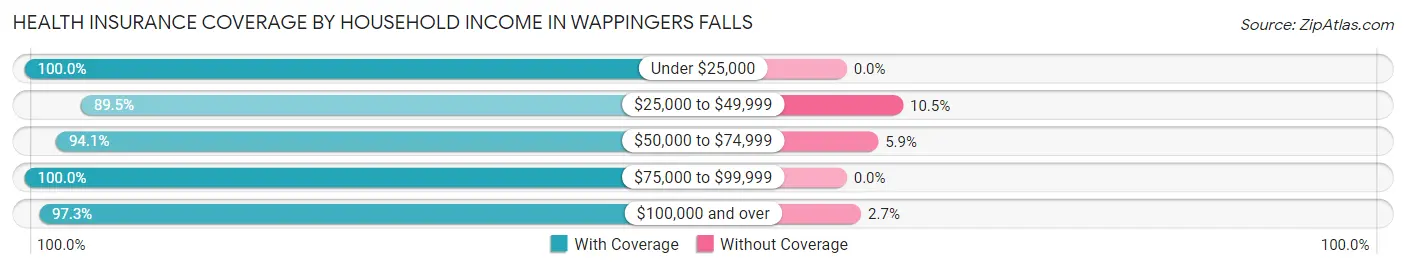
| Household Income | With Coverage | Without Coverage |
| Under $25,000 | 396 (100.0%) | 0 (0.0%) |
| $25,000 to $49,999 | 874 (89.5%) | 103 (10.5%) |
| $50,000 to $74,999 | 1,070 (94.1%) | 67 (5.9%) |
| $75,000 to $99,999 | 915 (100.0%) | 0 (0.0%) |
| $100,000 and over | 2,170 (97.3%) | 60 (2.7%) |
Public vs Private Health Insurance Coverage by Age in Wappingers Falls
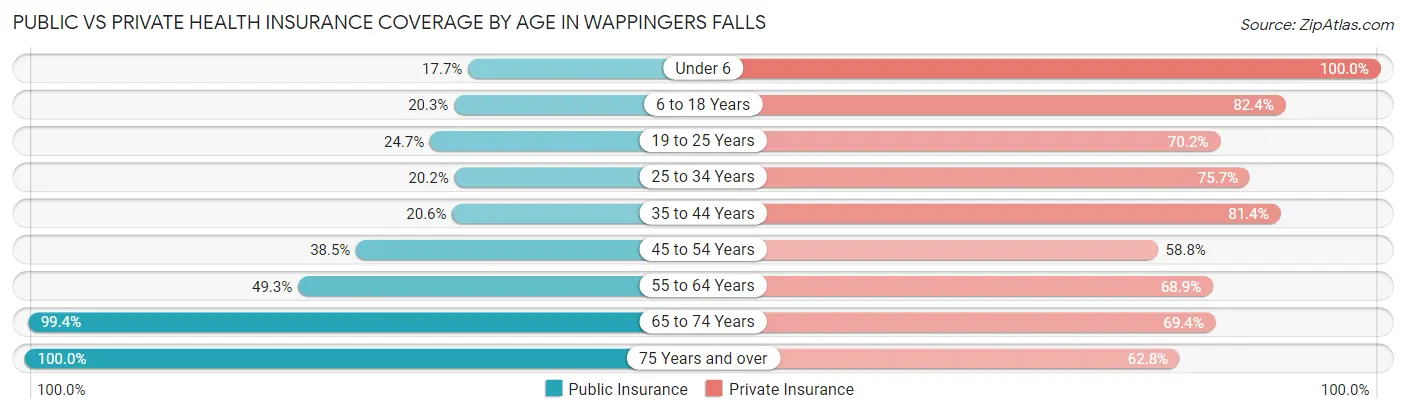
| Age Bracket | Public Insurance | Private Insurance |
| Under 6 | 44 (17.7%) | 249 (100.0%) |
| 6 to 18 Years | 124 (20.3%) | 504 (82.4%) |
| 19 to 25 Years | 137 (24.7%) | 389 (70.2%) |
| 25 to 34 Years | 95 (20.2%) | 356 (75.7%) |
| 35 to 44 Years | 173 (20.6%) | 684 (81.4%) |
| 45 to 54 Years | 393 (38.5%) | 601 (58.8%) |
| 55 to 64 Years | 361 (49.2%) | 505 (68.9%) |
| 65 to 74 Years | 675 (99.4%) | 471 (69.4%) |
| 75 Years and over | 561 (100.0%) | 352 (62.7%) |
| Total | 2,563 (44.8%) | 4,111 (71.9%) |
Disability Status by Sex by Age in Wappingers Falls
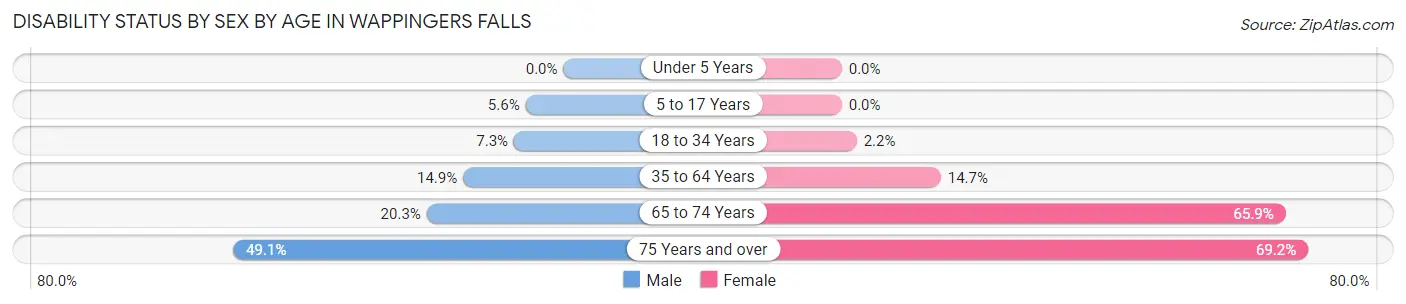
| Age Bracket | Male | Female |
| Under 5 Years | 0 (0.0%) | 0 (0.0%) |
| 5 to 17 Years | 25 (5.6%) | 0 (0.0%) |
| 18 to 34 Years | 32 (7.3%) | 13 (2.2%) |
| 35 to 64 Years | 196 (14.9%) | 188 (14.7%) |
| 65 to 74 Years | 67 (20.3%) | 230 (65.9%) |
| 75 Years and over | 103 (49.0%) | 243 (69.2%) |
Disability Class by Sex by Age in Wappingers Falls
Disability Class: Hearing Difficulty
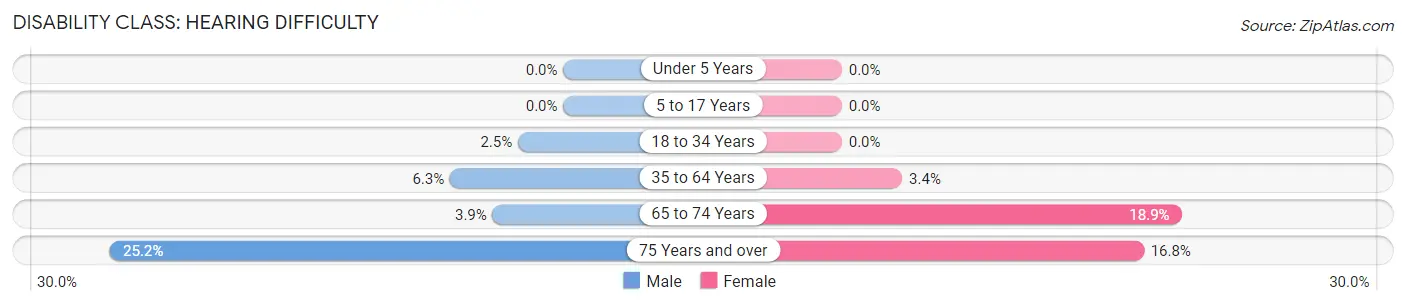
| Age Bracket | Male | Female |
| Under 5 Years | 0 (0.0%) | 0 (0.0%) |
| 5 to 17 Years | 0 (0.0%) | 0 (0.0%) |
| 18 to 34 Years | 11 (2.5%) | 0 (0.0%) |
| 35 to 64 Years | 83 (6.3%) | 43 (3.4%) |
| 65 to 74 Years | 13 (3.9%) | 66 (18.9%) |
| 75 Years and over | 53 (25.2%) | 59 (16.8%) |
Disability Class: Vision Difficulty
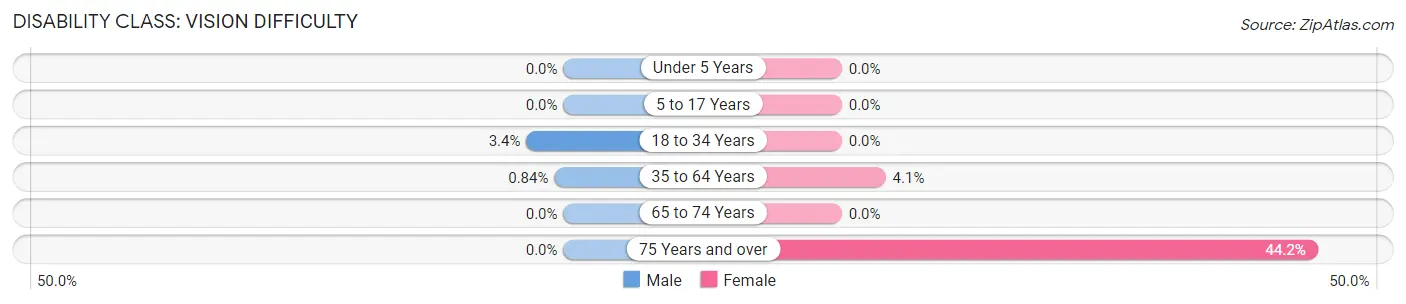
| Age Bracket | Male | Female |
| Under 5 Years | 0 (0.0%) | 0 (0.0%) |
| 5 to 17 Years | 0 (0.0%) | 0 (0.0%) |
| 18 to 34 Years | 15 (3.4%) | 0 (0.0%) |
| 35 to 64 Years | 11 (0.8%) | 52 (4.1%) |
| 65 to 74 Years | 0 (0.0%) | 0 (0.0%) |
| 75 Years and over | 0 (0.0%) | 155 (44.2%) |
Disability Class: Cognitive Difficulty
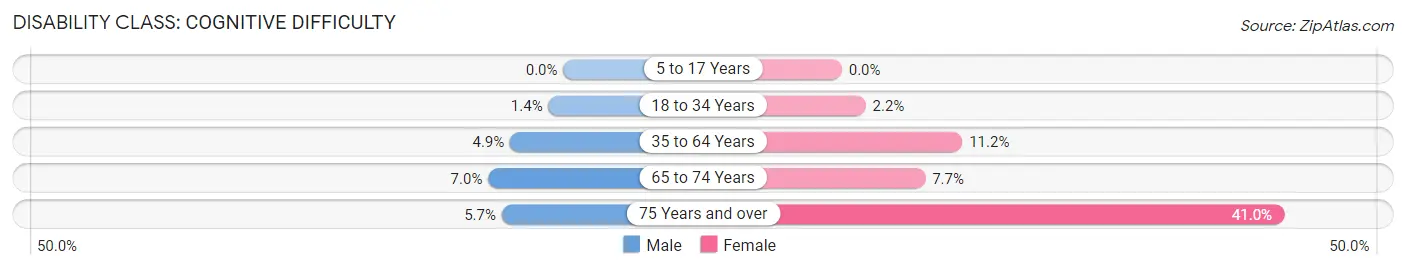
| Age Bracket | Male | Female |
| 5 to 17 Years | 0 (0.0%) | 0 (0.0%) |
| 18 to 34 Years | 6 (1.4%) | 13 (2.2%) |
| 35 to 64 Years | 65 (4.9%) | 143 (11.2%) |
| 65 to 74 Years | 23 (7.0%) | 27 (7.7%) |
| 75 Years and over | 12 (5.7%) | 144 (41.0%) |
Disability Class: Ambulatory Difficulty
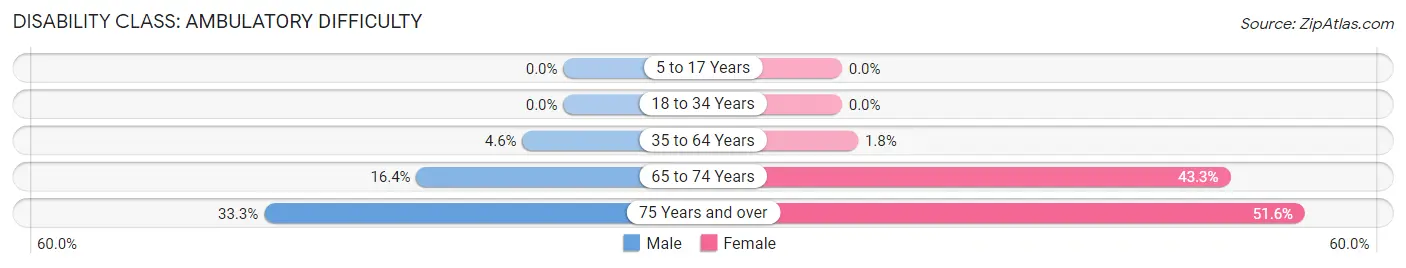
| Age Bracket | Male | Female |
| 5 to 17 Years | 0 (0.0%) | 0 (0.0%) |
| 18 to 34 Years | 0 (0.0%) | 0 (0.0%) |
| 35 to 64 Years | 60 (4.6%) | 23 (1.8%) |
| 65 to 74 Years | 54 (16.4%) | 151 (43.3%) |
| 75 Years and over | 70 (33.3%) | 181 (51.6%) |
Disability Class: Self-Care Difficulty
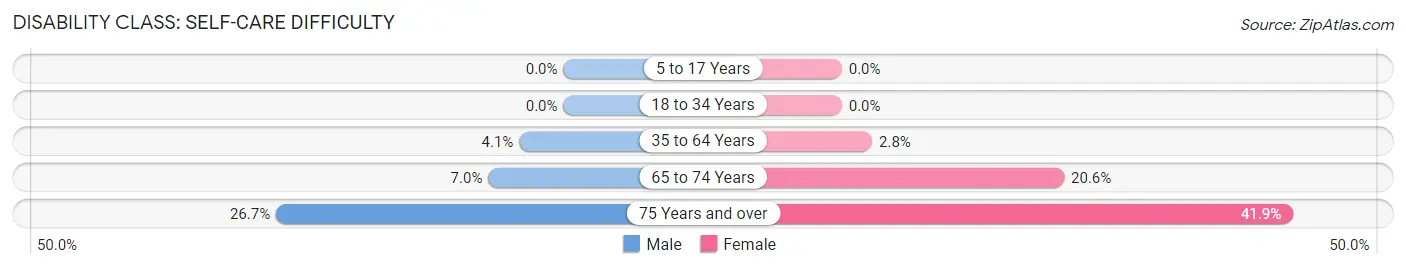
| Age Bracket | Male | Female |
| 5 to 17 Years | 0 (0.0%) | 0 (0.0%) |
| 18 to 34 Years | 0 (0.0%) | 0 (0.0%) |
| 35 to 64 Years | 54 (4.1%) | 36 (2.8%) |
| 65 to 74 Years | 23 (7.0%) | 72 (20.6%) |
| 75 Years and over | 56 (26.7%) | 147 (41.9%) |
Technology Access in Wappingers Falls
Computing Device Access in Wappingers Falls
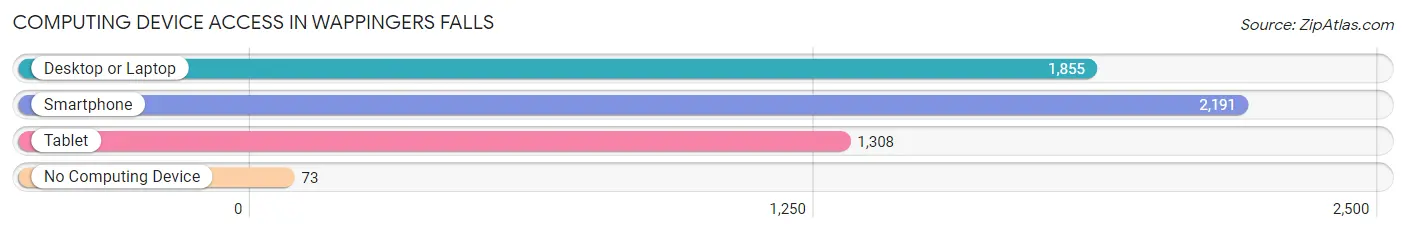
| Device Type | # Households | % Households |
| Desktop or Laptop | 1,855 | 73.8% |
| Smartphone | 2,191 | 87.1% |
| Tablet | 1,308 | 52.0% |
| No Computing Device | 73 | 2.9% |
| Total | 2,515 | 100.0% |
Internet Access in Wappingers Falls
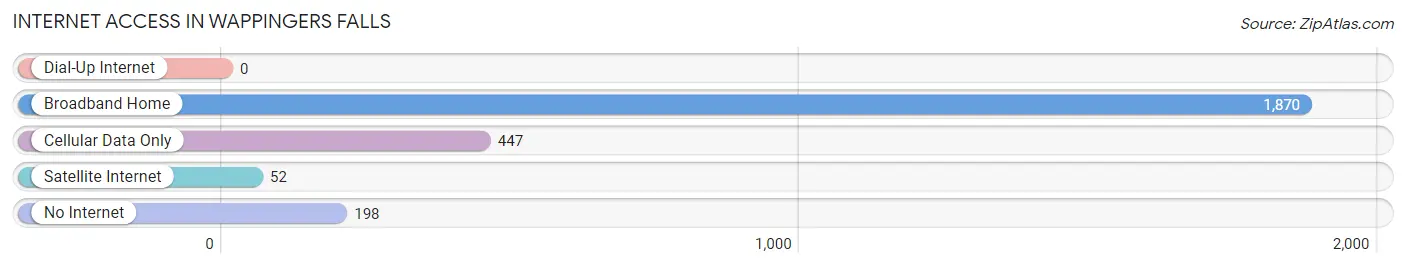
| Internet Type | # Households | % Households |
| Dial-Up Internet | 0 | 0.0% |
| Broadband Home | 1,870 | 74.4% |
| Cellular Data Only | 447 | 17.8% |
| Satellite Internet | 52 | 2.1% |
| No Internet | 198 | 7.9% |
| Total | 2,515 | 100.0% |
Wappingers Falls Summary
Wappingers Falls is a village located in Dutchess County, New York, United States. It is part of the Poughkeepsie–Newburgh–Middletown Metropolitan Statistical Area. The population was 5,522 at the 2010 census.
History
The area that is now Wappingers Falls was originally inhabited by the Wappinger Native American tribe. The first Europeans to settle in the area were Dutch farmers in the late 17th century. The village was originally known as "Little Nine Partners," referring to the nine original land-owning families. The village was later renamed "Wappingers Falls" after the Wappinger tribe.
The village was incorporated in 1871. In the late 19th century, the village was a popular tourist destination, with several hotels and resorts. The village was also home to several factories, including a paper mill and a brickyard.
Geography
Wappingers Falls is located in southeastern Dutchess County, in the Hudson Valley region of New York. It is bordered to the north by the town of Poughkeepsie, to the east by the town of East Fishkill, to the south by the town of Fishkill, and to the west by the town of Wappinger.
The village is located on the east bank of the Wappinger Creek, a tributary of the Hudson River. The creek is spanned by two bridges in the village: the Wappingers Creek Bridge and the Wappingers Falls Bridge.
The village is located at the intersection of U.S. Route 9 and New York State Route 9D. It is about 60 miles (97 km) north of New York City and about 20 miles (32 km) south of Albany.
Economy
The economy of Wappingers Falls is largely based on tourism and manufacturing. The village is home to several hotels and resorts, as well as several factories. The largest employers in the village are IBM, the Dutchess County government, and the Wappingers Central School District.
Demographics
As of the 2010 census, there were 5,522 people, 2,093 households, and 1,346 families residing in the village. The population density was 2,845.3 people per square mile (1,101.3/km2). There were 2,309 housing units at an average density of 1,179.3 per square mile (456.2/km2). The racial makeup of the village was 81.2% White, 8.2% African American, 0.2% Native American, 4.2% Asian, 0.1% Pacific Islander, 4.2% from other races, and 1.9% from two or more races. Hispanic or Latino of any race were 11.2% of the population.
There were 2,093 households, out of which 32.2% had children under the age of 18 living with them, 44.2% were married couples living together, 14.7% had a female householder with no husband present, and 35.2% were non-families. 28.2% of all households were made up of individuals, and 10.2% had someone living alone who was 65 years of age or older. The average household size was 2.60 and the average family size was 3.20.
In the village, the population was spread out, with 25.2% under the age of 18, 8.2% from 18 to 24, 30.2% from 25 to 44, 22.7% from 45 to 64, and 13.7% who were 65 years of age or older. The median age was 36 years. For every 100 females, there were 93.2 males. For every 100 females age 18 and over, there were 90.2 males.
The median income for a household in the village was $50,972, and the median income for a family was $60,938. Males had a median income of $41,964 versus $31,964 for females. The per capita income for the village was $23,945. About 5.2% of families and 7.2% of the population were below the poverty line, including 8.2% of those under age 18 and 5.2% of those age 65 or over.
Common Questions
What is Per Capita Income in Wappingers Falls?
Per Capita income in Wappingers Falls is $34,991.
What is the Median Family Income in Wappingers Falls?
Median Family Income in Wappingers Falls is $83,239.
What is the Median Household income in Wappingers Falls?
Median Household Income in Wappingers Falls is $61,554.
What is Income or Wage Gap in Wappingers Falls?
Income or Wage Gap in Wappingers Falls is 46.4%.
Women in Wappingers Falls earn 53.6 cents for every dollar earned by a man.
What is Inequality or Gini Index in Wappingers Falls?
Inequality or Gini Index in Wappingers Falls is 0.39.
What is the Total Population of Wappingers Falls?
Total Population of Wappingers Falls is 5,775.
What is the Total Male Population of Wappingers Falls?
Total Male Population of Wappingers Falls is 2,882.
What is the Total Female Population of Wappingers Falls?
Total Female Population of Wappingers Falls is 2,893.
What is the Ratio of Males per 100 Females in Wappingers Falls?
There are 99.62 Males per 100 Females in Wappingers Falls.
What is the Ratio of Females per 100 Males in Wappingers Falls?
There are 100.38 Females per 100 Males in Wappingers Falls.
What is the Median Population Age in Wappingers Falls?
Median Population Age in Wappingers Falls is 47.9 Years.
What is the Average Family Size in Wappingers Falls
Average Family Size in Wappingers Falls is 3.2 People.
What is the Average Household Size in Wappingers Falls
Average Household Size in Wappingers Falls is 2.2 People.
How Large is the Labor Force in Wappingers Falls?
There are 2,858 People in the Labor Forcein in Wappingers Falls.
What is the Percentage of People in the Labor Force in Wappingers Falls?
57.3% of People are in the Labor Force in Wappingers Falls.
What is the Unemployment Rate in Wappingers Falls?
Unemployment Rate in Wappingers Falls is 3.8%.