Corning, NY Map & Demographics
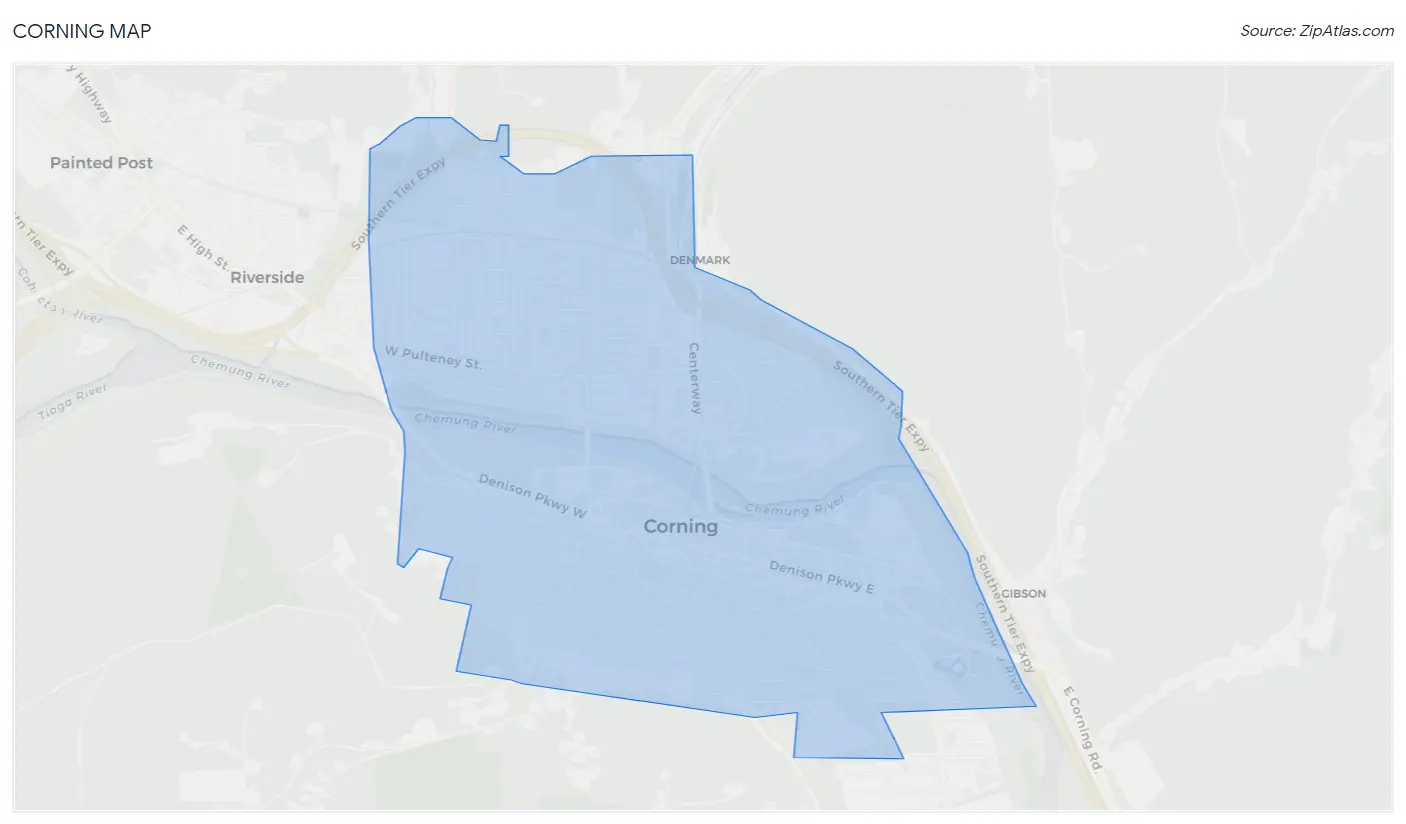
Corning Map
Corning Overview
$41,672
PER CAPITA INCOME
$89,643
AVG FAMILY INCOME
$59,453
AVG HOUSEHOLD INCOME
45.2%
WAGE / INCOME GAP [ % ]
54.8¢/ $1
WAGE / INCOME GAP [ $ ]
0.50
INEQUALITY / GINI INDEX
10,685
TOTAL POPULATION
5,097
MALE POPULATION
5,588
FEMALE POPULATION
91.21
MALES / 100 FEMALES
109.63
FEMALES / 100 MALES
37.1
MEDIAN AGE
2.7
AVG FAMILY SIZE
2.0
AVG HOUSEHOLD SIZE
5,873
LABOR FORCE [ PEOPLE ]
66.6%
PERCENT IN LABOR FORCE
6.8%
UNEMPLOYMENT RATE
Corning Zip Codes
Corning Area Codes
Income in Corning
Income Overview in Corning
Per Capita Income in Corning is $41,672, while median incomes of families and households are $89,643 and $59,453 respectively.
| Characteristic | Number | Measure |
| Per Capita Income | 10,685 | $41,672 |
| Median Family Income | 2,596 | $89,643 |
| Mean Family Income | 2,596 | $115,294 |
| Median Household Income | 5,284 | $59,453 |
| Mean Household Income | 5,284 | $82,633 |
| Income Deficit | 2,596 | $0 |
| Wage / Income Gap (%) | 10,685 | 45.21% |
| Wage / Income Gap ($) | 10,685 | 54.79¢ per $1 |
| Gini / Inequality Index | 10,685 | 0.50 |
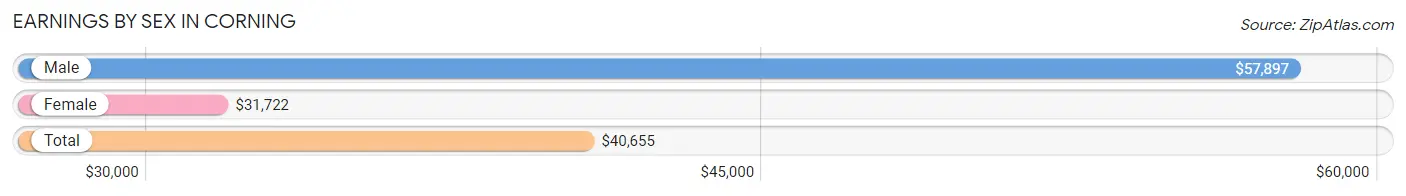
Earnings by Sex in Corning
Average Earnings in Corning are $40,655, $57,897 for men and $31,722 for women, a difference of 45.2%.
| Sex | Number | Average Earnings |
| Male | 3,092 (50.6%) | $57,897 |
| Female | 3,022 (49.4%) | $31,722 |
| Total | 6,114 (100.0%) | $40,655 |
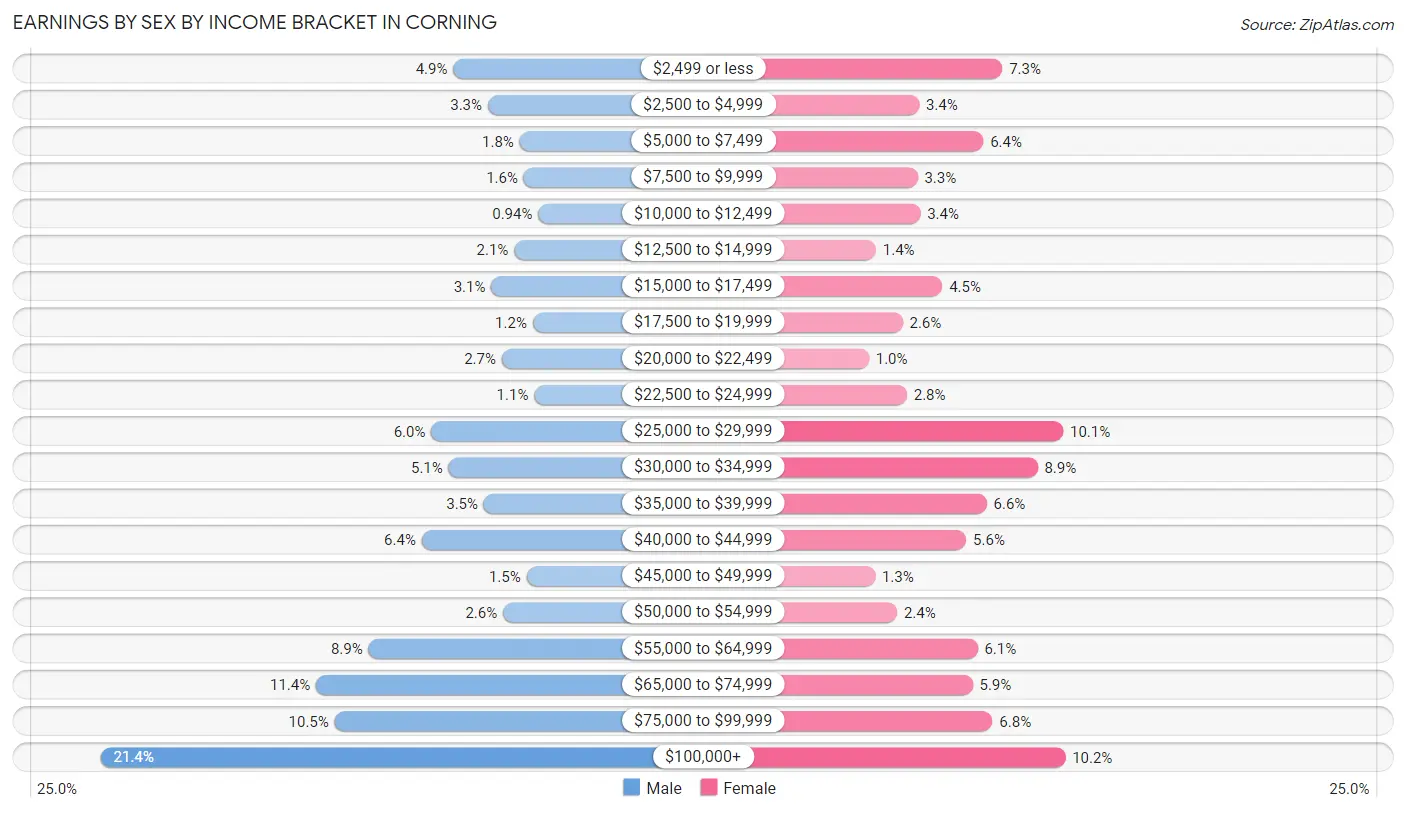
Earnings by Sex by Income Bracket in Corning
The most common earnings brackets in Corning are $100,000+ for men (663 | 21.4%) and $100,000+ for women (309 | 10.2%).
| Income | Male | Female |
| $2,499 or less | 152 (4.9%) | 220 (7.3%) |
| $2,500 to $4,999 | 102 (3.3%) | 102 (3.4%) |
| $5,000 to $7,499 | 56 (1.8%) | 193 (6.4%) |
| $7,500 to $9,999 | 50 (1.6%) | 100 (3.3%) |
| $10,000 to $12,499 | 29 (0.9%) | 104 (3.4%) |
| $12,500 to $14,999 | 64 (2.1%) | 41 (1.4%) |
| $15,000 to $17,499 | 97 (3.1%) | 135 (4.5%) |
| $17,500 to $19,999 | 37 (1.2%) | 79 (2.6%) |
| $20,000 to $22,499 | 82 (2.6%) | 31 (1.0%) |
| $22,500 to $24,999 | 35 (1.1%) | 85 (2.8%) |
| $25,000 to $29,999 | 184 (5.9%) | 306 (10.1%) |
| $30,000 to $34,999 | 159 (5.1%) | 270 (8.9%) |
| $35,000 to $39,999 | 108 (3.5%) | 198 (6.6%) |
| $40,000 to $44,999 | 198 (6.4%) | 169 (5.6%) |
| $45,000 to $49,999 | 46 (1.5%) | 40 (1.3%) |
| $50,000 to $54,999 | 80 (2.6%) | 71 (2.4%) |
| $55,000 to $64,999 | 275 (8.9%) | 185 (6.1%) |
| $65,000 to $74,999 | 351 (11.4%) | 178 (5.9%) |
| $75,000 to $99,999 | 324 (10.5%) | 206 (6.8%) |
| $100,000+ | 663 (21.4%) | 309 (10.2%) |
| Total | 3,092 (100.0%) | 3,022 (100.0%) |
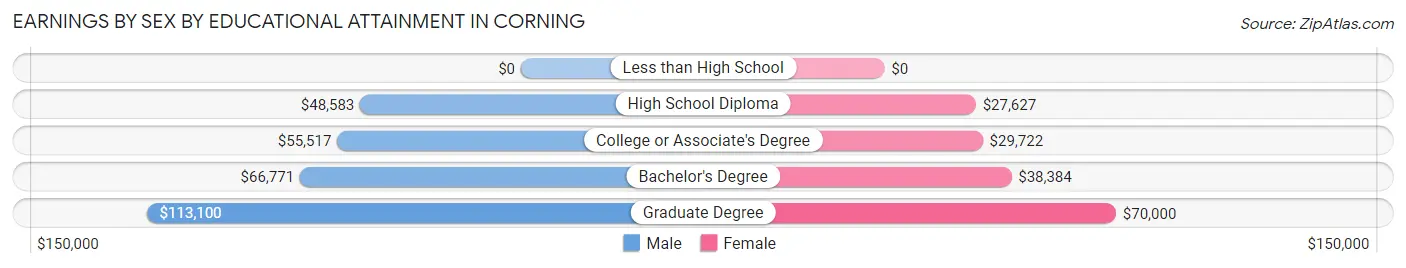
Earnings by Sex by Educational Attainment in Corning
Average earnings in Corning are $65,925 for men and $35,176 for women, a difference of 46.6%. Men with an educational attainment of graduate degree enjoy the highest average annual earnings of $113,100, while those with high school diploma education earn the least with $48,583. Women with an educational attainment of graduate degree earn the most with the average annual earnings of $70,000, while those with high school diploma education have the smallest earnings of $27,627.
| Educational Attainment | Male Income | Female Income |
| Less than High School | - | - |
| High School Diploma | $48,583 | $27,627 |
| College or Associate's Degree | $55,517 | $29,722 |
| Bachelor's Degree | $66,771 | $38,384 |
| Graduate Degree | $113,100 | $70,000 |
| Total | $65,925 | $35,176 |
Family Income in Corning
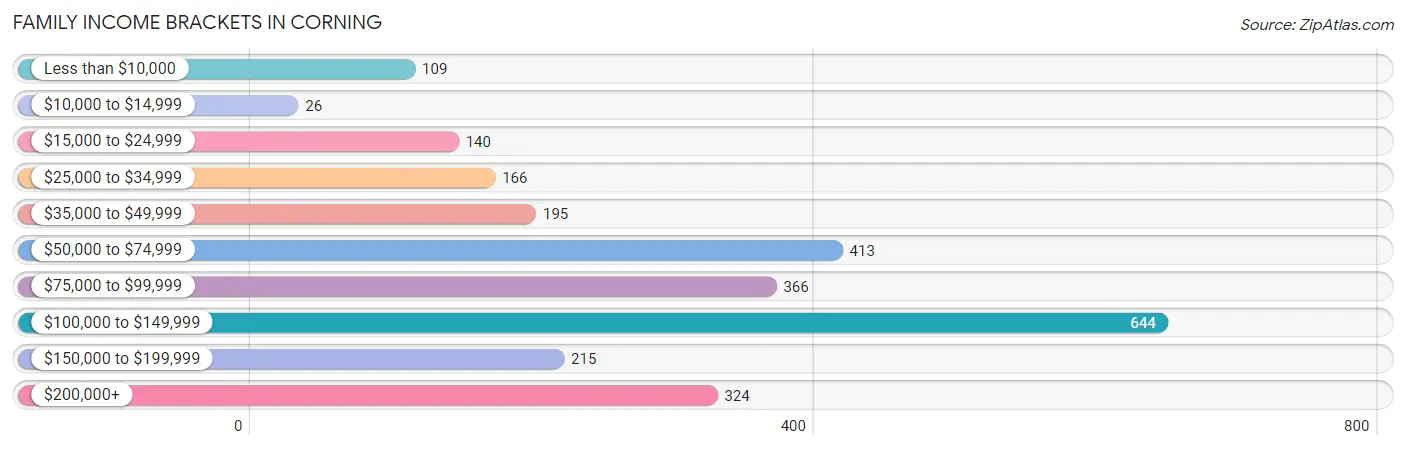
Family Income Brackets in Corning
According to the Corning family income data, there are 644 families falling into the $100,000 to $149,999 income range, which is the most common income bracket and makes up 24.8% of all families. Conversely, the $10,000 to $14,999 income bracket is the least frequent group with only 26 families (1.0%) belonging to this category.
| Income Bracket | # Families | % Families |
| Less than $10,000 | 109 | 4.2% |
| $10,000 to $14,999 | 26 | 1.0% |
| $15,000 to $24,999 | 140 | 5.4% |
| $25,000 to $34,999 | 166 | 6.4% |
| $35,000 to $49,999 | 195 | 7.5% |
| $50,000 to $74,999 | 413 | 15.9% |
| $75,000 to $99,999 | 366 | 14.1% |
| $100,000 to $149,999 | 644 | 24.8% |
| $150,000 to $199,999 | 215 | 8.3% |
| $200,000+ | 324 | 12.5% |
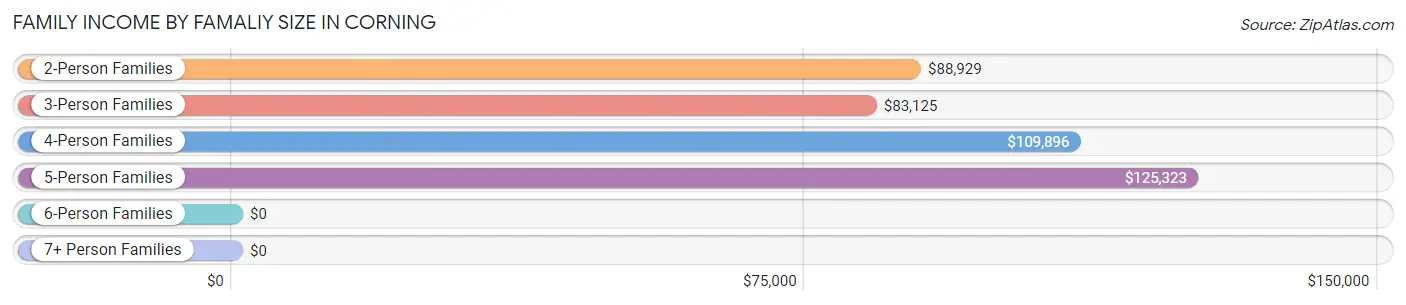
Family Income by Famaliy Size in Corning
5-person families (92 | 3.5%) account for the highest median family income in Corning with $125,323 per family, while 2-person families (1,404 | 54.1%) have the highest median income of $44,464 per family member.
| Income Bracket | # Families | Median Income |
| 2-Person Families | 1,404 (54.1%) | $88,929 |
| 3-Person Families | 687 (26.5%) | $83,125 |
| 4-Person Families | 407 (15.7%) | $109,896 |
| 5-Person Families | 92 (3.5%) | $125,323 |
| 6-Person Families | 0 (0.0%) | $0 |
| 7+ Person Families | 6 (0.2%) | $0 |
| Total | 2,596 (100.0%) | $89,643 |
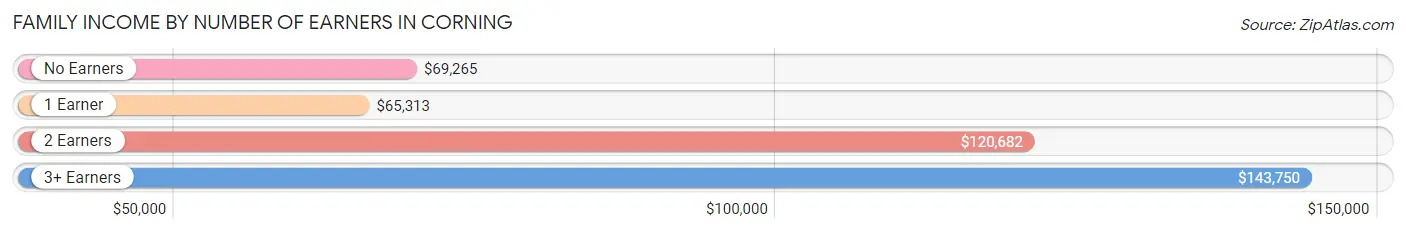
Family Income by Number of Earners in Corning
The median family income in Corning is $89,643, with families comprising 3+ earners (182) having the highest median family income of $143,750, while families with 1 earner (968) have the lowest median family income of $65,313, accounting for 7.0% and 37.3% of families, respectively.
| Number of Earners | # Families | Median Income |
| No Earners | 274 (10.5%) | $69,265 |
| 1 Earner | 968 (37.3%) | $65,313 |
| 2 Earners | 1,172 (45.2%) | $120,682 |
| 3+ Earners | 182 (7.0%) | $143,750 |
| Total | 2,596 (100.0%) | $89,643 |
Household Income in Corning
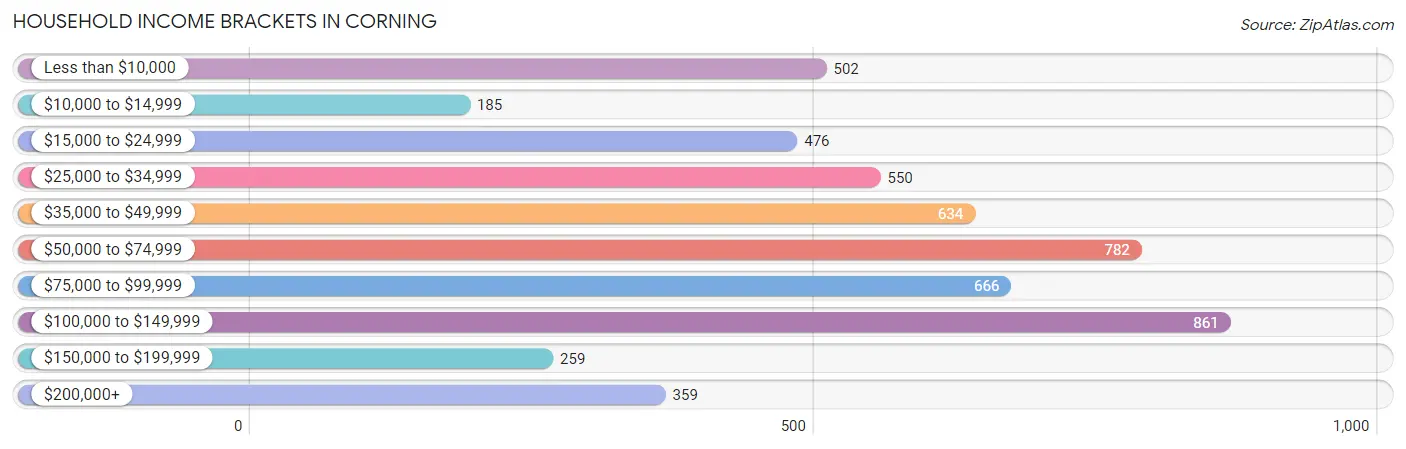
Household Income Brackets in Corning
With 861 households falling in the category, the $100,000 to $149,999 income range is the most frequent in Corning, accounting for 16.3% of all households. In contrast, only 185 households (3.5%) fall into the $10,000 to $14,999 income bracket, making it the least populous group.
| Income Bracket | # Households | % Households |
| Less than $10,000 | 502 | 9.5% |
| $10,000 to $14,999 | 185 | 3.5% |
| $15,000 to $24,999 | 476 | 9.0% |
| $25,000 to $34,999 | 550 | 10.4% |
| $35,000 to $49,999 | 634 | 12.0% |
| $50,000 to $74,999 | 782 | 14.8% |
| $75,000 to $99,999 | 666 | 12.6% |
| $100,000 to $149,999 | 861 | 16.3% |
| $150,000 to $199,999 | 259 | 4.9% |
| $200,000+ | 359 | 6.8% |
Household Income by Householder Age in Corning
The median household income in Corning is $59,453, with the highest median household income of $87,841 found in the 45 to 64 years age bracket for the primary householder. A total of 1,841 households (34.8%) fall into this category. Meanwhile, the 15 to 24 years age bracket for the primary householder has the lowest median household income of $30,531, with 527 households (10.0%) in this group.
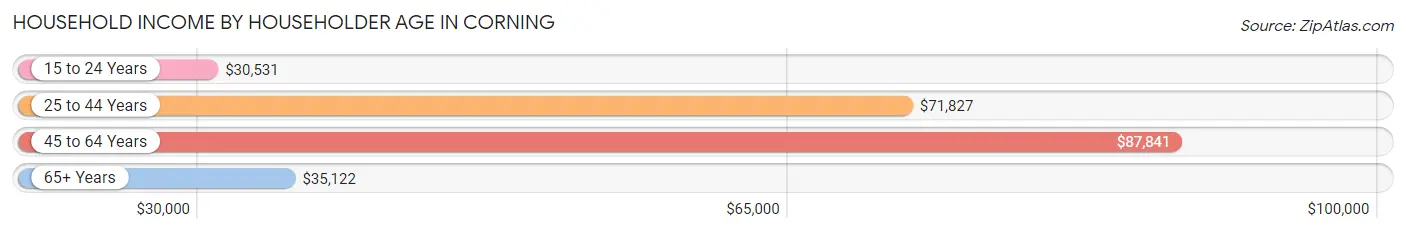
| Income Bracket | # Households | Median Income |
| 15 to 24 Years | 527 (10.0%) | $30,531 |
| 25 to 44 Years | 1,710 (32.4%) | $71,827 |
| 45 to 64 Years | 1,841 (34.8%) | $87,841 |
| 65+ Years | 1,206 (22.8%) | $35,122 |
| Total | 5,284 (100.0%) | $59,453 |
Poverty in Corning
Income Below Poverty by Sex and Age in Corning
With 15.8% poverty level for males and 17.8% for females among the residents of Corning, under 5 year old males and 18 to 24 year old females are the most vulnerable to poverty, with 73 males (39.3%) and 277 females (49.0%) in their respective age groups living below the poverty level.
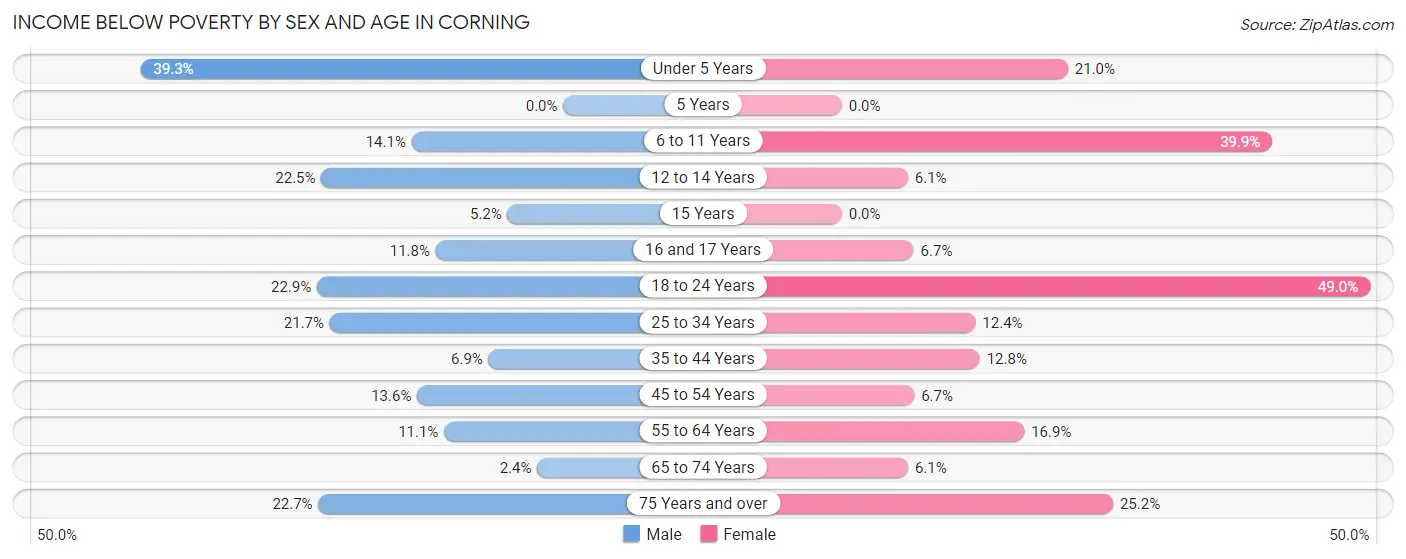
| Age Bracket | Male | Female |
| Under 5 Years | 73 (39.3%) | 73 (21.0%) |
| 5 Years | 0 (0.0%) | 0 (0.0%) |
| 6 to 11 Years | 57 (14.1%) | 129 (39.9%) |
| 12 to 14 Years | 42 (22.5%) | 10 (6.1%) |
| 15 Years | 6 (5.2%) | 0 (0.0%) |
| 16 and 17 Years | 9 (11.8%) | 5 (6.7%) |
| 18 to 24 Years | 112 (22.9%) | 277 (49.0%) |
| 25 to 34 Years | 236 (21.7%) | 111 (12.4%) |
| 35 to 44 Years | 35 (6.9%) | 81 (12.8%) |
| 45 to 54 Years | 91 (13.6%) | 45 (6.7%) |
| 55 to 64 Years | 78 (11.1%) | 130 (16.9%) |
| 65 to 74 Years | 10 (2.4%) | 39 (6.1%) |
| 75 Years and over | 50 (22.7%) | 76 (25.2%) |
| Total | 799 (15.8%) | 976 (17.8%) |
Income Above Poverty by Sex and Age in Corning
According to the poverty statistics in Corning, males aged 5 years and females aged 5 years are the age groups that are most secure financially, with 100.0% of males and 100.0% of females in these age groups living above the poverty line.
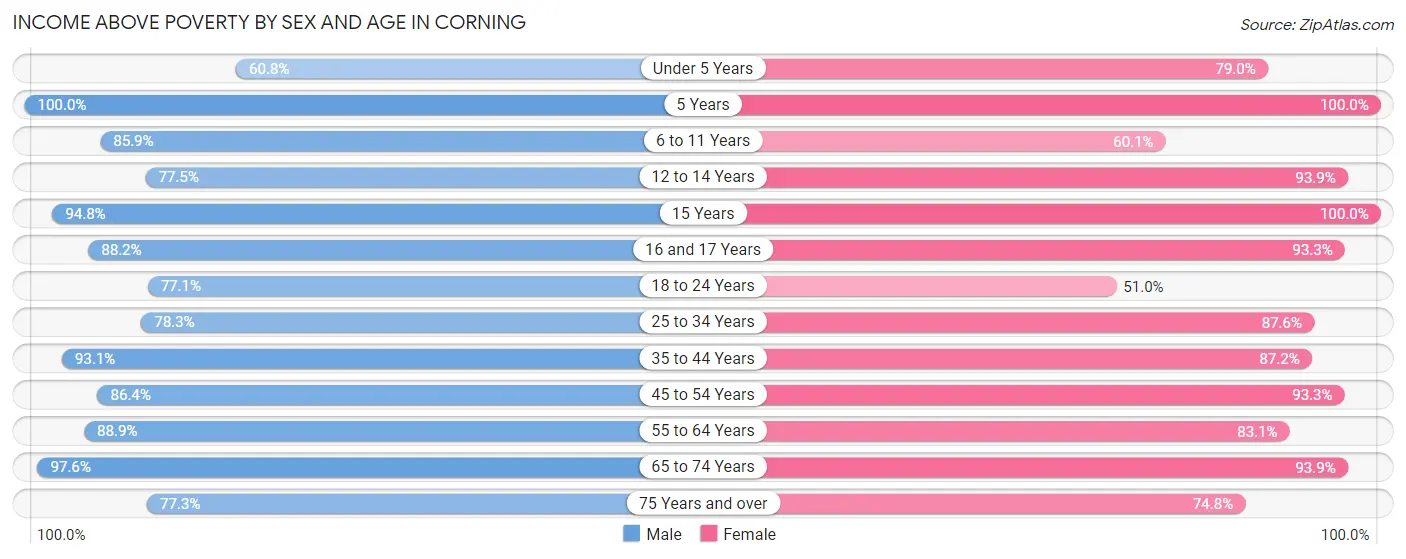
| Age Bracket | Male | Female |
| Under 5 Years | 113 (60.8%) | 275 (79.0%) |
| 5 Years | 5 (100.0%) | 66 (100.0%) |
| 6 to 11 Years | 348 (85.9%) | 194 (60.1%) |
| 12 to 14 Years | 145 (77.5%) | 153 (93.9%) |
| 15 Years | 110 (94.8%) | 46 (100.0%) |
| 16 and 17 Years | 67 (88.2%) | 70 (93.3%) |
| 18 to 24 Years | 378 (77.1%) | 288 (51.0%) |
| 25 to 34 Years | 853 (78.3%) | 784 (87.6%) |
| 35 to 44 Years | 470 (93.1%) | 552 (87.2%) |
| 45 to 54 Years | 580 (86.4%) | 625 (93.3%) |
| 55 to 64 Years | 627 (88.9%) | 638 (83.1%) |
| 65 to 74 Years | 404 (97.6%) | 596 (93.9%) |
| 75 Years and over | 170 (77.3%) | 226 (74.8%) |
| Total | 4,270 (84.2%) | 4,513 (82.2%) |
Income Below Poverty Among Married-Couple Families in Corning
The poverty statistics for married-couple families in Corning show that 4.4% or 83 of the total 1,873 families live below the poverty line. Families with 3 or 4 children have the highest poverty rate of 26.3%, comprising of 15 families. On the other hand, families with no children have the lowest poverty rate of 1.1%, which includes 13 families.
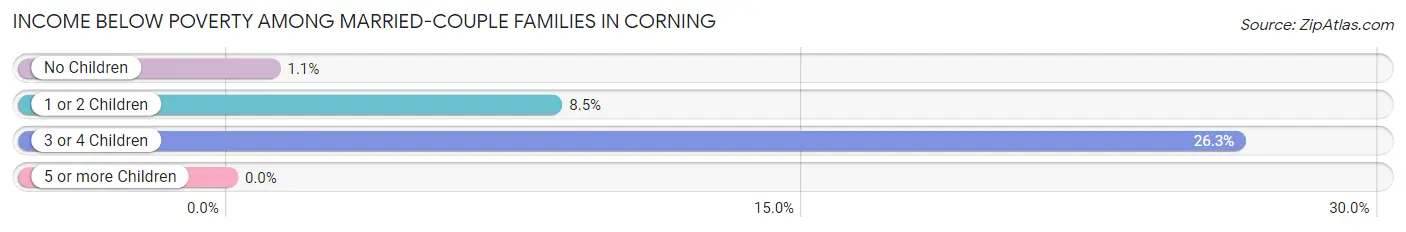
| Children | Above Poverty | Below Poverty |
| No Children | 1,154 (98.9%) | 13 (1.1%) |
| 1 or 2 Children | 594 (91.5%) | 55 (8.5%) |
| 3 or 4 Children | 42 (73.7%) | 15 (26.3%) |
| 5 or more Children | 0 (0.0%) | 0 (0.0%) |
| Total | 1,790 (95.6%) | 83 (4.4%) |
Income Below Poverty Among Single-Parent Households in Corning
According to the poverty data in Corning, 15.5% or 30 single-father households and 23.3% or 123 single-mother households are living below the poverty line. Among single-father households, those with 1 or 2 children have the highest poverty rate, with 30 households (46.2%) experiencing poverty. Likewise, among single-mother households, those with 1 or 2 children have the highest poverty rate, with 118 households (32.8%) falling below the poverty line.
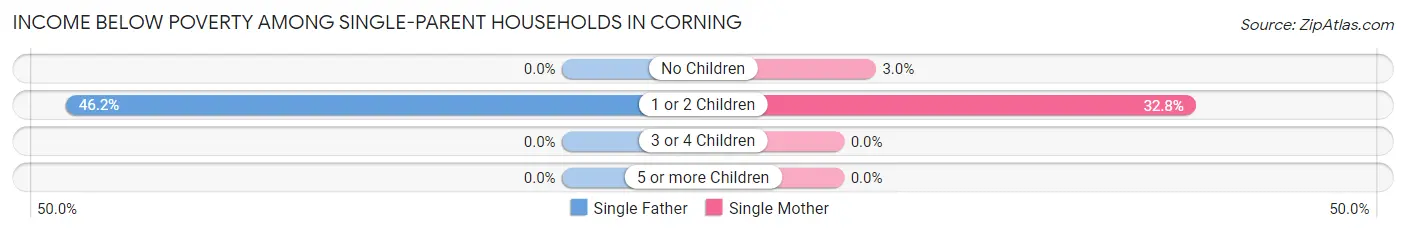
| Children | Single Father | Single Mother |
| No Children | 0 (0.0%) | 5 (3.0%) |
| 1 or 2 Children | 30 (46.2%) | 118 (32.8%) |
| 3 or 4 Children | 0 (0.0%) | 0 (0.0%) |
| 5 or more Children | 0 (0.0%) | 0 (0.0%) |
| Total | 30 (15.5%) | 123 (23.3%) |
Income Below Poverty Among Married-Couple vs Single-Parent Households in Corning
The poverty data for Corning shows that 83 of the married-couple family households (4.4%) and 153 of the single-parent households (21.2%) are living below the poverty level. Within the married-couple family households, those with 3 or 4 children have the highest poverty rate, with 15 households (26.3%) falling below the poverty line. Among the single-parent households, those with 1 or 2 children have the highest poverty rate, with 148 household (34.8%) living below poverty.
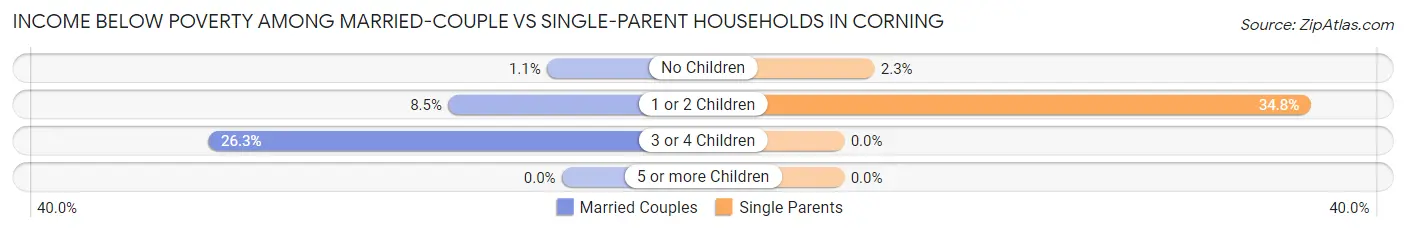
| Children | Married-Couple Families | Single-Parent Households |
| No Children | 13 (1.1%) | 5 (2.2%) |
| 1 or 2 Children | 55 (8.5%) | 148 (34.8%) |
| 3 or 4 Children | 15 (26.3%) | 0 (0.0%) |
| 5 or more Children | 0 (0.0%) | 0 (0.0%) |
| Total | 83 (4.4%) | 153 (21.2%) |
Race in Corning
The most populous races in Corning are White / Caucasian (9,775 | 91.5%), Hispanic or Latino (319 | 3.0%), and Two or more Races (319 | 3.0%).
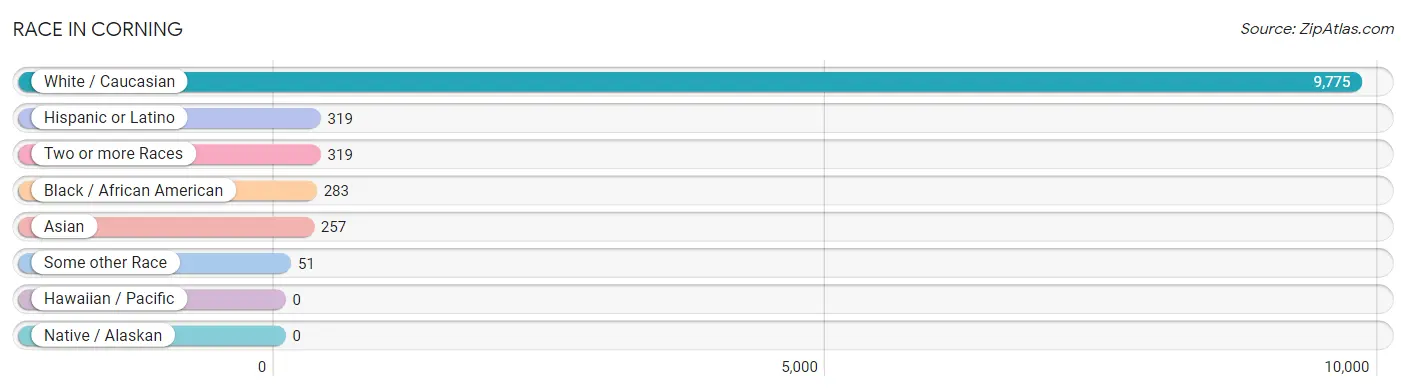
| Race | # Population | % Population |
| Asian | 257 | 2.4% |
| Black / African American | 283 | 2.6% |
| Hawaiian / Pacific | 0 | 0.0% |
| Hispanic or Latino | 319 | 3.0% |
| Native / Alaskan | 0 | 0.0% |
| White / Caucasian | 9,775 | 91.5% |
| Two or more Races | 319 | 3.0% |
| Some other Race | 51 | 0.5% |
| Total | 10,685 | 100.0% |
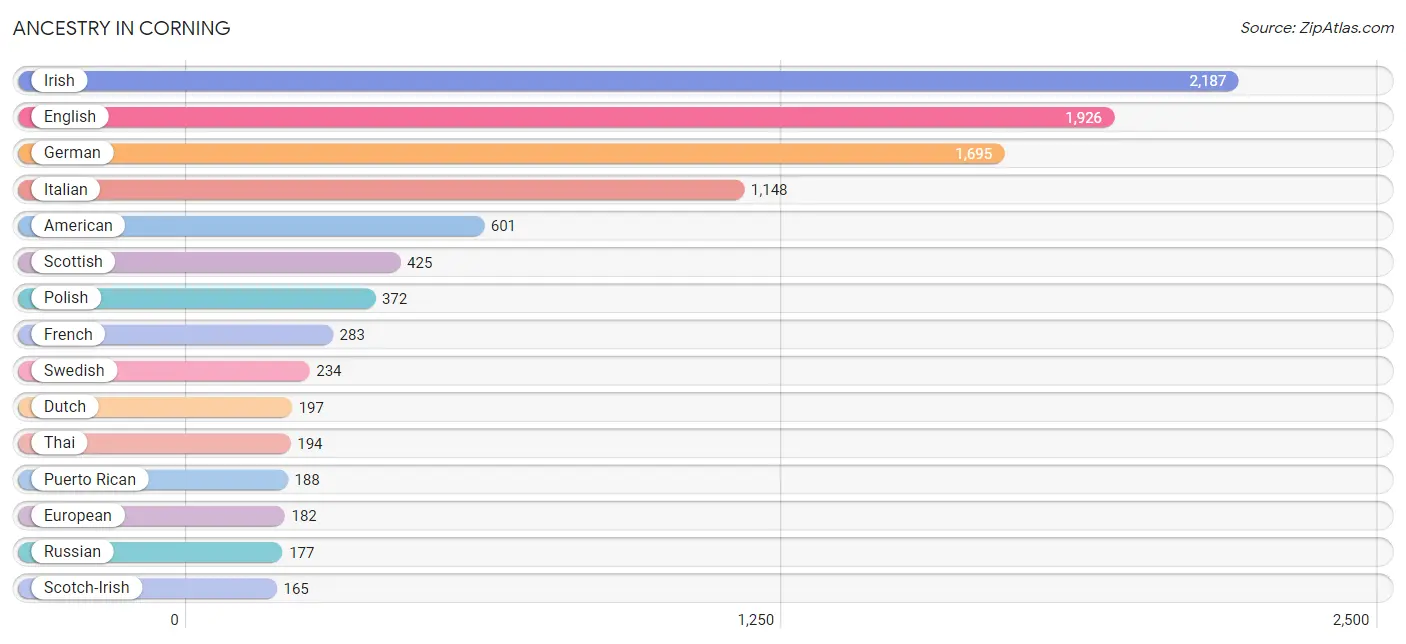
Ancestry in Corning
The most populous ancestries reported in Corning are Irish (2,187 | 20.5%), English (1,926 | 18.0%), German (1,695 | 15.9%), Italian (1,148 | 10.7%), and American (601 | 5.6%), together accounting for 70.7% of all Corning residents.
| Ancestry | # Population | % Population |
| American | 601 | 5.6% |
| Arab | 9 | 0.1% |
| Argentinean | 12 | 0.1% |
| Armenian | 5 | 0.1% |
| Australian | 78 | 0.7% |
| Austrian | 29 | 0.3% |
| Bhutanese | 17 | 0.2% |
| British | 62 | 0.6% |
| Burmese | 47 | 0.4% |
| Cajun | 13 | 0.1% |
| Canadian | 25 | 0.2% |
| Central American | 15 | 0.1% |
| Chilean | 24 | 0.2% |
| Colombian | 10 | 0.1% |
| Cuban | 37 | 0.4% |
| Czech | 32 | 0.3% |
| Czechoslovakian | 42 | 0.4% |
| Danish | 35 | 0.3% |
| Delaware | 6 | 0.1% |
| Dominican | 1 | 0.0% |
| Dutch | 197 | 1.8% |
| Eastern European | 21 | 0.2% |
| English | 1,926 | 18.0% |
| European | 182 | 1.7% |
| French | 283 | 2.6% |
| French Canadian | 72 | 0.7% |
| German | 1,695 | 15.9% |
| Honduran | 15 | 0.1% |
| Hungarian | 159 | 1.5% |
| Indian (Asian) | 52 | 0.5% |
| Iranian | 35 | 0.3% |
| Irish | 2,187 | 20.5% |
| Italian | 1,148 | 10.7% |
| Lebanese | 9 | 0.1% |
| Mexican | 11 | 0.1% |
| Northern European | 5 | 0.1% |
| Norwegian | 46 | 0.4% |
| Pakistani | 5 | 0.1% |
| Polish | 372 | 3.5% |
| Portuguese | 74 | 0.7% |
| Puerto Rican | 188 | 1.8% |
| Romanian | 147 | 1.4% |
| Russian | 177 | 1.7% |
| Scandinavian | 12 | 0.1% |
| Scotch-Irish | 165 | 1.5% |
| Scottish | 425 | 4.0% |
| Slovak | 25 | 0.2% |
| Slovene | 9 | 0.1% |
| South American | 46 | 0.4% |
| Spaniard | 21 | 0.2% |
| Subsaharan African | 24 | 0.2% |
| Swedish | 234 | 2.2% |
| Swiss | 48 | 0.4% |
| Thai | 194 | 1.8% |
| Ukrainian | 79 | 0.7% |
| Welsh | 61 | 0.6% |
| Zimbabwean | 24 | 0.2% | View All 57 Rows |
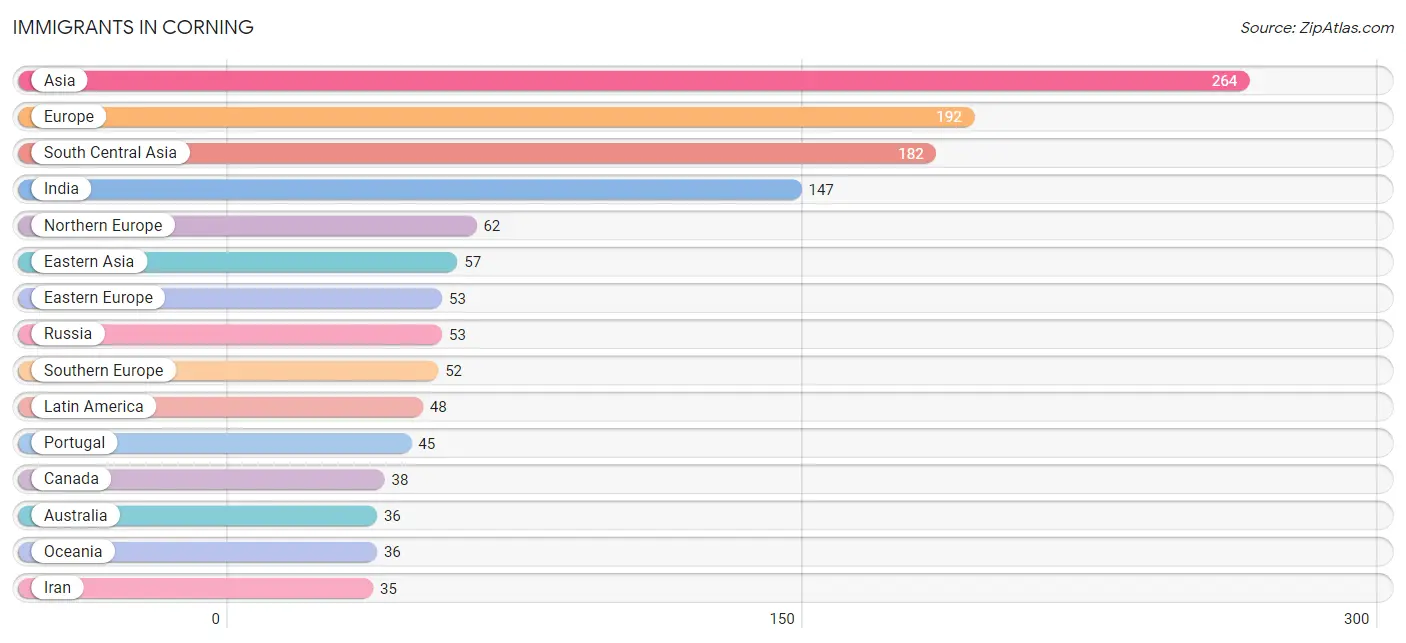
Immigrants in Corning
The most numerous immigrant groups reported in Corning came from Asia (264 | 2.5%), Europe (192 | 1.8%), South Central Asia (182 | 1.7%), India (147 | 1.4%), and Northern Europe (62 | 0.6%), together accounting for 7.9% of all Corning residents.
| Immigration Origin | # Population | % Population |
| Argentina | 12 | 0.1% |
| Asia | 264 | 2.5% |
| Australia | 36 | 0.3% |
| Austria | 9 | 0.1% |
| Canada | 38 | 0.4% |
| Caribbean | 26 | 0.2% |
| China | 29 | 0.3% |
| Colombia | 10 | 0.1% |
| Cuba | 7 | 0.1% |
| Denmark | 6 | 0.1% |
| Dominican Republic | 1 | 0.0% |
| Eastern Asia | 57 | 0.5% |
| Eastern Europe | 53 | 0.5% |
| England | 21 | 0.2% |
| Europe | 192 | 1.8% |
| France | 9 | 0.1% |
| Germany | 7 | 0.1% |
| Greece | 7 | 0.1% |
| Hong Kong | 4 | 0.0% |
| India | 147 | 1.4% |
| Iran | 35 | 0.3% |
| Ireland | 30 | 0.3% |
| Japan | 9 | 0.1% |
| Korea | 19 | 0.2% |
| Latin America | 48 | 0.4% |
| Northern Europe | 62 | 0.6% |
| Oceania | 36 | 0.3% |
| Portugal | 45 | 0.4% |
| Russia | 53 | 0.5% |
| Scotland | 5 | 0.1% |
| South America | 22 | 0.2% |
| South Central Asia | 182 | 1.7% |
| Southern Europe | 52 | 0.5% |
| Trinidad and Tobago | 18 | 0.2% |
| Western Asia | 25 | 0.2% |
| Western Europe | 25 | 0.2% | View All 36 Rows |
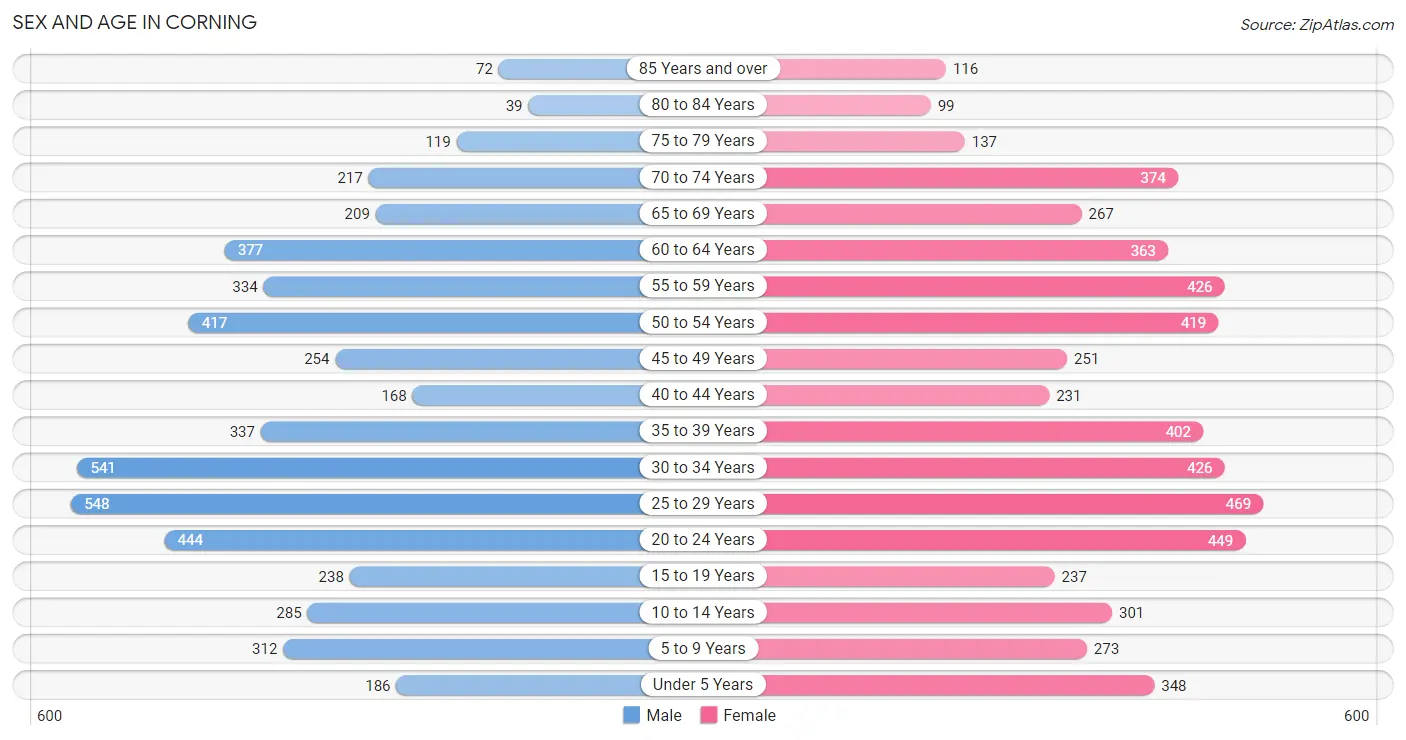
Sex and Age in Corning
Sex and Age in Corning
The most populous age groups in Corning are 25 to 29 Years (548 | 10.7%) for men and 25 to 29 Years (469 | 8.4%) for women.
| Age Bracket | Male | Female |
| Under 5 Years | 186 (3.6%) | 348 (6.2%) |
| 5 to 9 Years | 312 (6.1%) | 273 (4.9%) |
| 10 to 14 Years | 285 (5.6%) | 301 (5.4%) |
| 15 to 19 Years | 238 (4.7%) | 237 (4.2%) |
| 20 to 24 Years | 444 (8.7%) | 449 (8.0%) |
| 25 to 29 Years | 548 (10.7%) | 469 (8.4%) |
| 30 to 34 Years | 541 (10.6%) | 426 (7.6%) |
| 35 to 39 Years | 337 (6.6%) | 402 (7.2%) |
| 40 to 44 Years | 168 (3.3%) | 231 (4.1%) |
| 45 to 49 Years | 254 (5.0%) | 251 (4.5%) |
| 50 to 54 Years | 417 (8.2%) | 419 (7.5%) |
| 55 to 59 Years | 334 (6.6%) | 426 (7.6%) |
| 60 to 64 Years | 377 (7.4%) | 363 (6.5%) |
| 65 to 69 Years | 209 (4.1%) | 267 (4.8%) |
| 70 to 74 Years | 217 (4.3%) | 374 (6.7%) |
| 75 to 79 Years | 119 (2.3%) | 137 (2.5%) |
| 80 to 84 Years | 39 (0.8%) | 99 (1.8%) |
| 85 Years and over | 72 (1.4%) | 116 (2.1%) |
| Total | 5,097 (100.0%) | 5,588 (100.0%) |
Families and Households in Corning
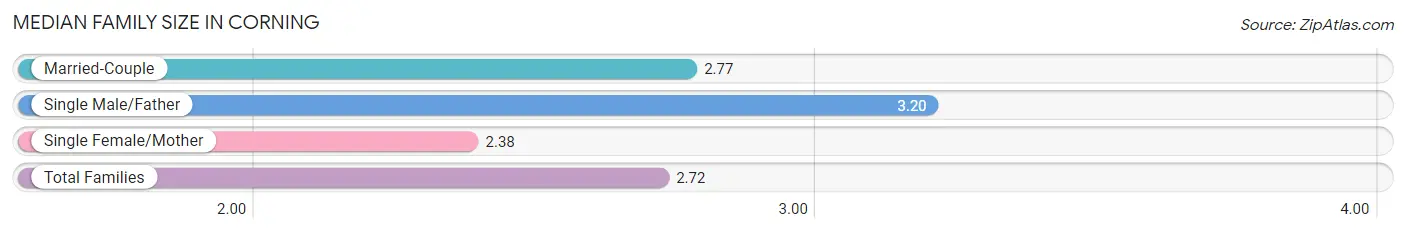
Median Family Size in Corning
The median family size in Corning is 2.72 persons per family, with single male/father families (194 | 7.5%) accounting for the largest median family size of 3.2 persons per family. On the other hand, single female/mother families (529 | 20.4%) represent the smallest median family size with 2.38 persons per family.
| Family Type | # Families | Family Size |
| Married-Couple | 1,873 (72.2%) | 2.77 |
| Single Male/Father | 194 (7.5%) | 3.20 |
| Single Female/Mother | 529 (20.4%) | 2.38 |
| Total Families | 2,596 (100.0%) | 2.72 |
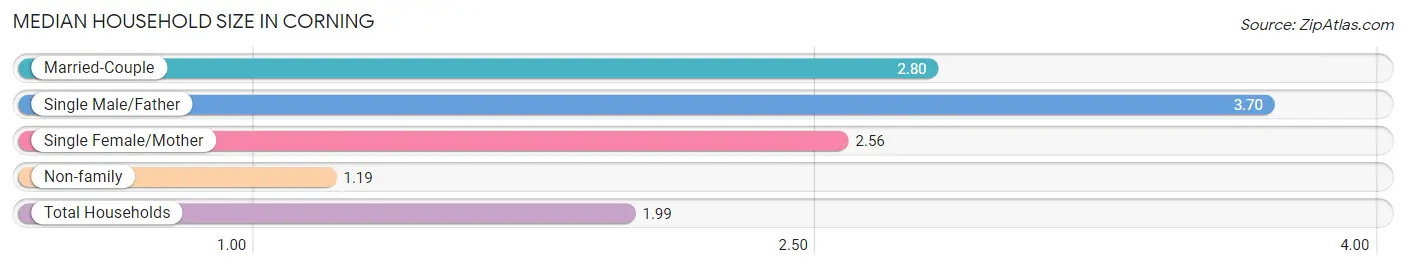
Median Household Size in Corning
The median household size in Corning is 1.99 persons per household, with single male/father households (194 | 3.7%) accounting for the largest median household size of 3.7 persons per household. non-family households (2,688 | 50.9%) represent the smallest median household size with 1.19 persons per household.
| Household Type | # Households | Household Size |
| Married-Couple | 1,873 (35.4%) | 2.80 |
| Single Male/Father | 194 (3.7%) | 3.70 |
| Single Female/Mother | 529 (10.0%) | 2.56 |
| Non-family | 2,688 (50.9%) | 1.19 |
| Total Households | 5,284 (100.0%) | 1.99 |
Household Size by Marriage Status in Corning
Out of a total of 5,284 households in Corning, 2,596 (49.1%) are family households, while 2,688 (50.9%) are nonfamily households. The most numerous type of family households are 2-person households, comprising 1,312, and the most common type of nonfamily households are 1-person households, comprising 2,243.
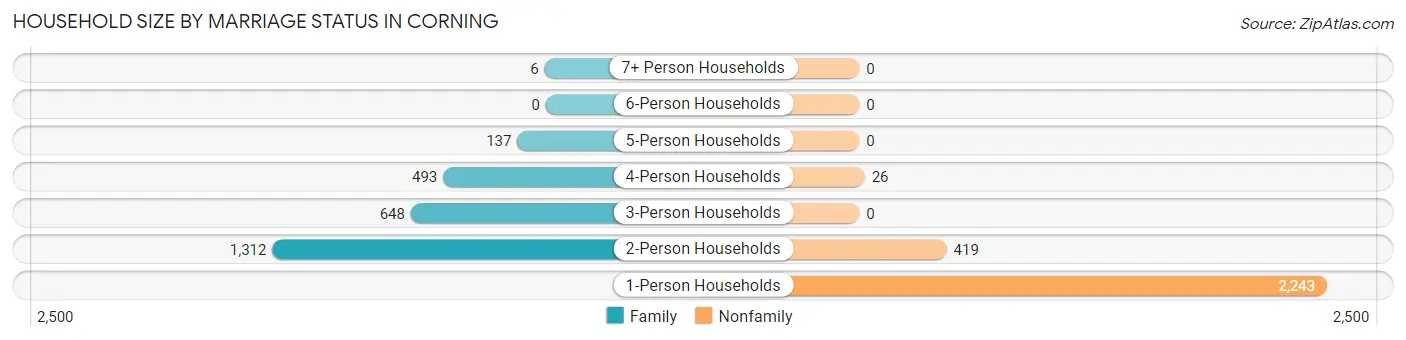
| Household Size | Family Households | Nonfamily Households |
| 1-Person Households | - | 2,243 (42.4%) |
| 2-Person Households | 1,312 (24.8%) | 419 (7.9%) |
| 3-Person Households | 648 (12.3%) | 0 (0.0%) |
| 4-Person Households | 493 (9.3%) | 26 (0.5%) |
| 5-Person Households | 137 (2.6%) | 0 (0.0%) |
| 6-Person Households | 0 (0.0%) | 0 (0.0%) |
| 7+ Person Households | 6 (0.1%) | 0 (0.0%) |
| Total | 2,596 (49.1%) | 2,688 (50.9%) |
Female Fertility in Corning
Fertility by Age in Corning
Average fertility rate in Corning is 40.0 births per 1,000 women. Women in the age bracket of 20 to 34 years have the highest fertility rate with 67.0 births per 1,000 women. Women in the age bracket of 20 to 34 years acount for 87.4% of all women with births.
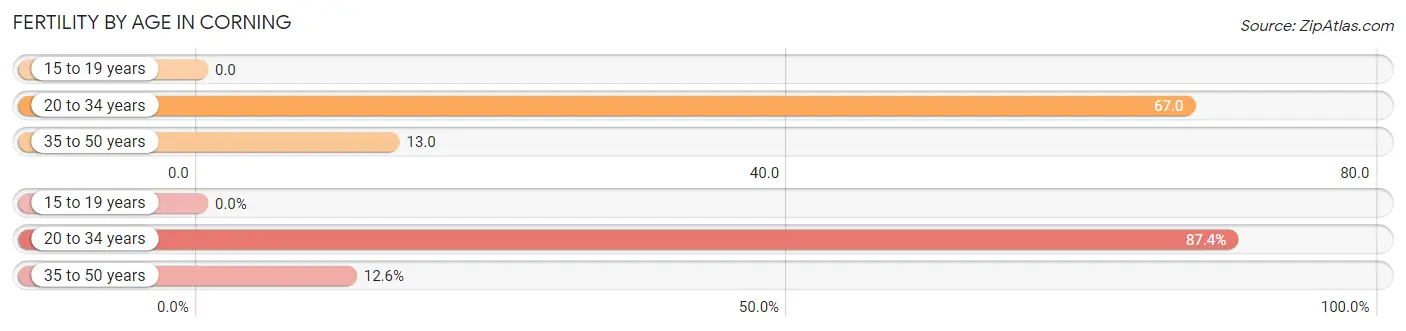
| Age Bracket | Women with Births | Births / 1,000 Women |
| 15 to 19 years | 0 (0.0%) | 0.0 |
| 20 to 34 years | 90 (87.4%) | 67.0 |
| 35 to 50 years | 13 (12.6%) | 13.0 |
| Total | 103 (100.0%) | 40.0 |
Fertility by Age by Marriage Status in Corning
87.4% of women with births (103) in Corning are married. The highest percentage of unmarried women with births falls into 35 to 50 years age bracket with 100.0% of them unmarried at the time of birth, while the lowest percentage of unmarried women with births belong to 20 to 34 years age bracket with 0.0% of them unmarried.
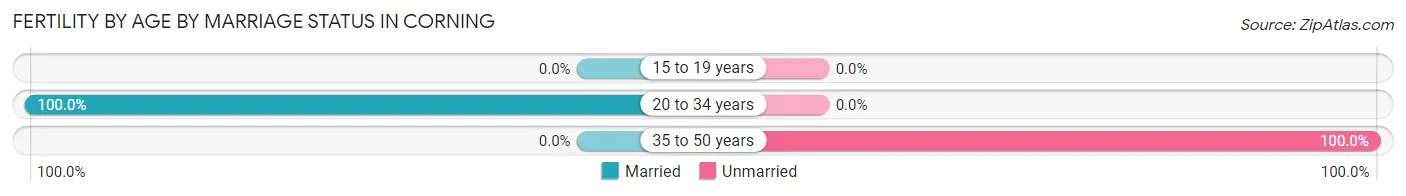
| Age Bracket | Married | Unmarried |
| 15 to 19 years | 0 (0.0%) | 0 (0.0%) |
| 20 to 34 years | 90 (100.0%) | 0 (0.0%) |
| 35 to 50 years | 0 (0.0%) | 13 (100.0%) |
| Total | 90 (87.4%) | 13 (12.6%) |
Fertility by Education in Corning
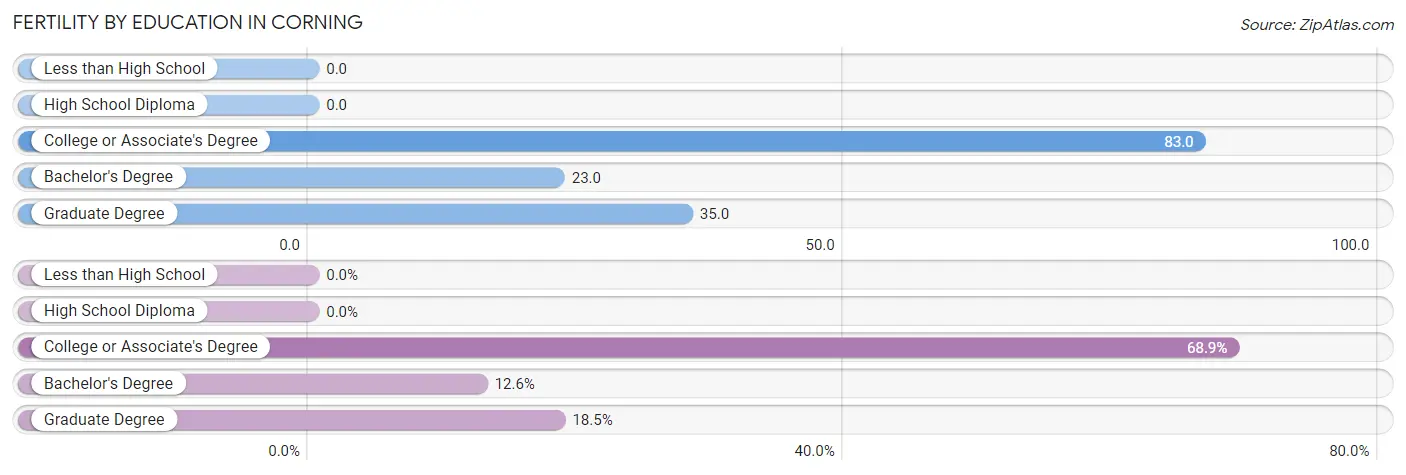
| Educational Attainment | Women with Births | Births / 1,000 Women |
| Less than High School | 0 (0.0%) | 0.0 |
| High School Diploma | 0 (0.0%) | 0.0 |
| College or Associate's Degree | 71 (68.9%) | 83.0 |
| Bachelor's Degree | 13 (12.6%) | 23.0 |
| Graduate Degree | 19 (18.4%) | 35.0 |
| Total | 103 (100.0%) | 40.0 |
Fertility by Education by Marriage Status in Corning
12.6% of women with births in Corning are unmarried. Women with the educational attainment of college or associate's degree are most likely to be married with 100.0% of them married at childbirth, while women with the educational attainment of bachelor's degree are least likely to be married with 100.0% of them unmarried at childbirth.
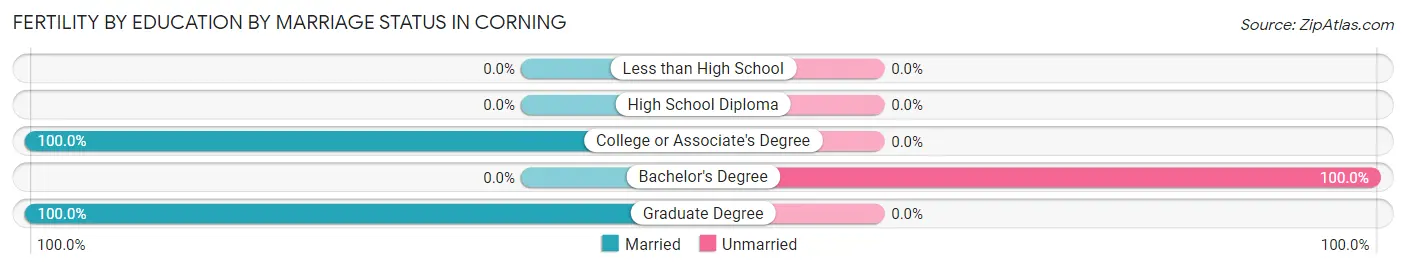
| Educational Attainment | Married | Unmarried |
| Less than High School | 0 (0.0%) | 0 (0.0%) |
| High School Diploma | 0 (0.0%) | 0 (0.0%) |
| College or Associate's Degree | 71 (100.0%) | 0 (0.0%) |
| Bachelor's Degree | 0 (0.0%) | 13 (100.0%) |
| Graduate Degree | 19 (100.0%) | 0 (0.0%) |
| Total | 90 (87.4%) | 13 (12.6%) |
Employment Characteristics in Corning
Employment by Class of Employer in Corning
Among the 5,354 employed individuals in Corning, private company employees (3,218 | 60.1%), not-for-profit organizations (873 | 16.3%), and local government employees (522 | 9.8%) make up the most common classes of employment.
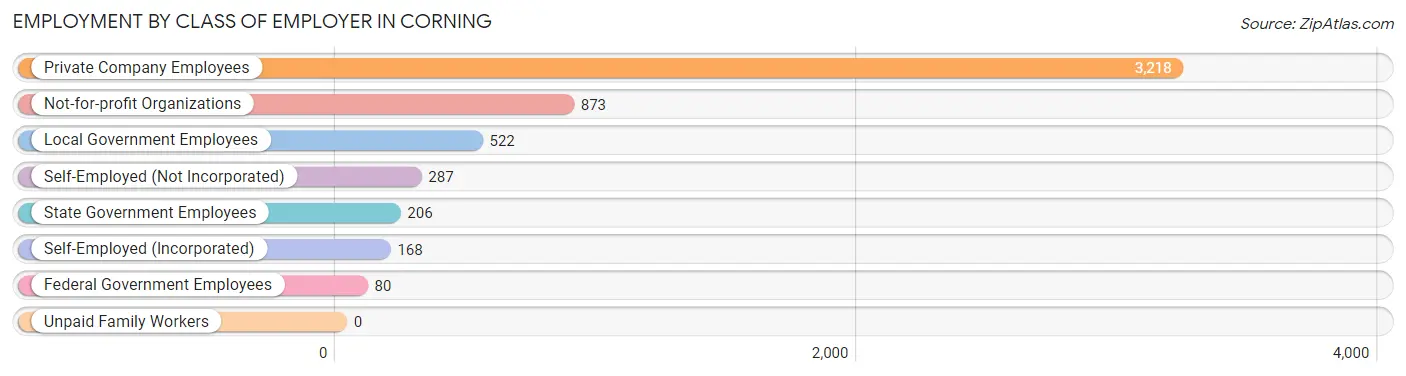
| Employer Class | # Employees | % Employees |
| Private Company Employees | 3,218 | 60.1% |
| Self-Employed (Incorporated) | 168 | 3.1% |
| Self-Employed (Not Incorporated) | 287 | 5.4% |
| Not-for-profit Organizations | 873 | 16.3% |
| Local Government Employees | 522 | 9.8% |
| State Government Employees | 206 | 3.8% |
| Federal Government Employees | 80 | 1.5% |
| Unpaid Family Workers | 0 | 0.0% |
| Total | 5,354 | 100.0% |
Employment Status by Age in Corning
According to the labor force statistics for Corning, out of the total population over 16 years of age (8,818), 66.6% or 5,873 individuals are in the labor force, with 6.8% or 399 of them unemployed. The age group with the highest labor force participation rate is 35 to 44 years, with 86.4% or 983 individuals in the labor force. Within the labor force, the 16 to 19 years age range has the highest percentage of unemployed individuals, with 45.4% or 64 of them being unemployed.
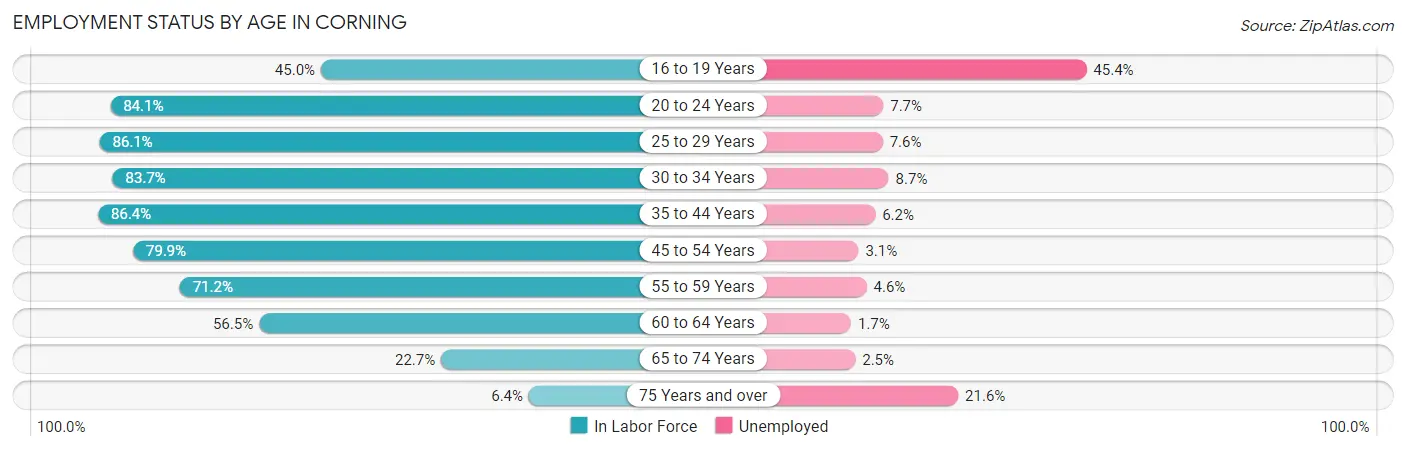
| Age Bracket | In Labor Force | Unemployed |
| 16 to 19 Years | 141 (45.0%) | 64 (45.4%) |
| 20 to 24 Years | 751 (84.1%) | 58 (7.7%) |
| 25 to 29 Years | 876 (86.1%) | 67 (7.6%) |
| 30 to 34 Years | 809 (83.7%) | 70 (8.7%) |
| 35 to 44 Years | 983 (86.4%) | 61 (6.2%) |
| 45 to 54 Years | 1,071 (79.9%) | 33 (3.1%) |
| 55 to 59 Years | 541 (71.2%) | 25 (4.6%) |
| 60 to 64 Years | 418 (56.5%) | 7 (1.7%) |
| 65 to 74 Years | 242 (22.7%) | 6 (2.5%) |
| 75 Years and over | 37 (6.4%) | 8 (21.6%) |
| Total | 5,873 (66.6%) | 399 (6.8%) |
Employment Status by Educational Attainment in Corning
According to labor force statistics for Corning, 78.8% of individuals (4,699) out of the total population between 25 and 64 years of age (5,963) are in the labor force, with 5.6% or 263 of them being unemployed. The group with the highest labor force participation rate are those with the educational attainment of bachelor's degree or higher, with 89.8% or 2,534 individuals in the labor force. Within the labor force, individuals with less than high school education have the highest percentage of unemployment, with 32.2% or 28 of them being unemployed.
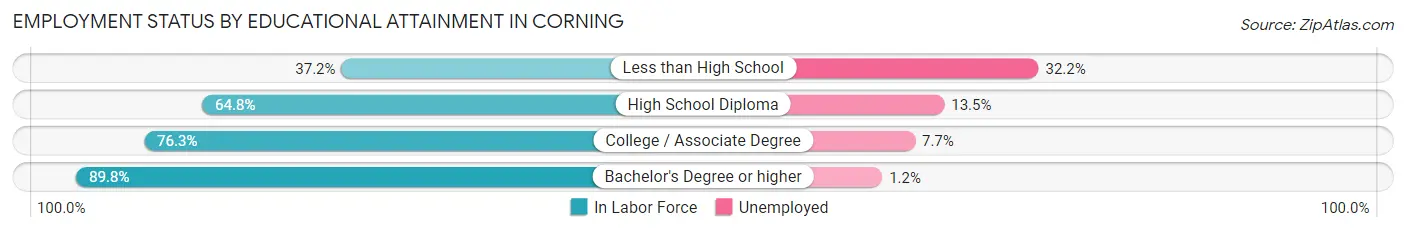
| Educational Attainment | In Labor Force | Unemployed |
| Less than High School | 87 (37.2%) | 75 (32.2%) |
| High School Diploma | 785 (64.8%) | 164 (13.5%) |
| College / Associate Degree | 1,293 (76.3%) | 131 (7.7%) |
| Bachelor's Degree or higher | 2,534 (89.8%) | 34 (1.2%) |
| Total | 4,699 (78.8%) | 334 (5.6%) |
Employment Occupations by Sex in Corning
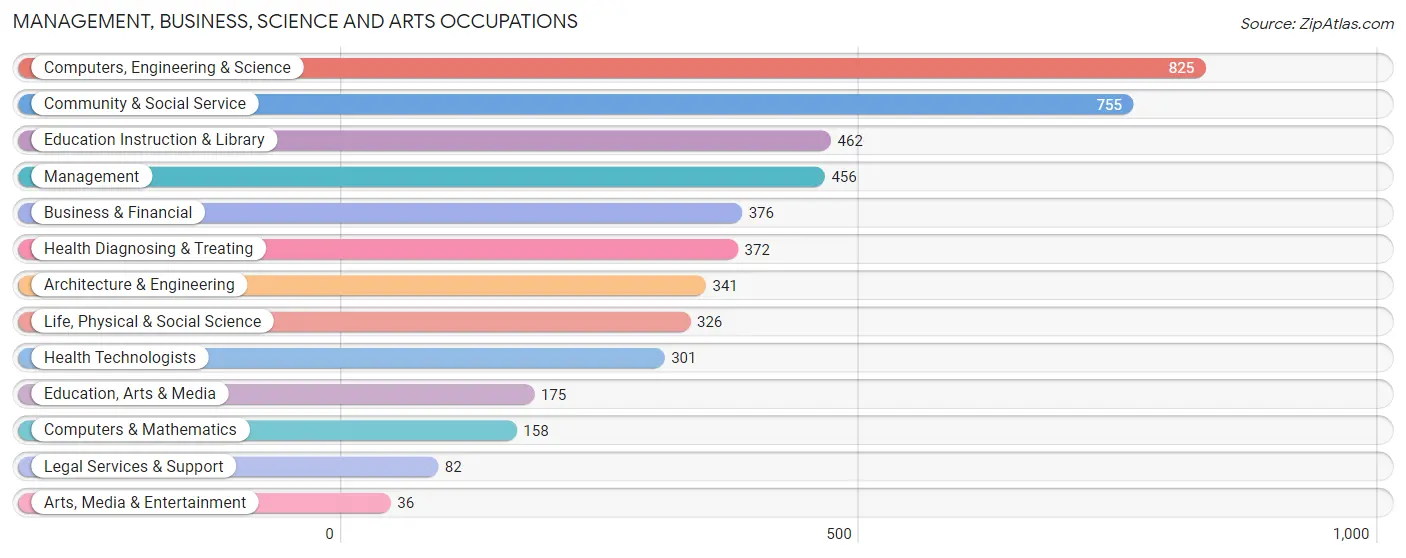
Management, Business, Science and Arts Occupations
The most common Management, Business, Science and Arts occupations in Corning are Computers, Engineering & Science (825 | 15.1%), Community & Social Service (755 | 13.8%), Education Instruction & Library (462 | 8.4%), Management (456 | 8.3%), and Business & Financial (376 | 6.9%).
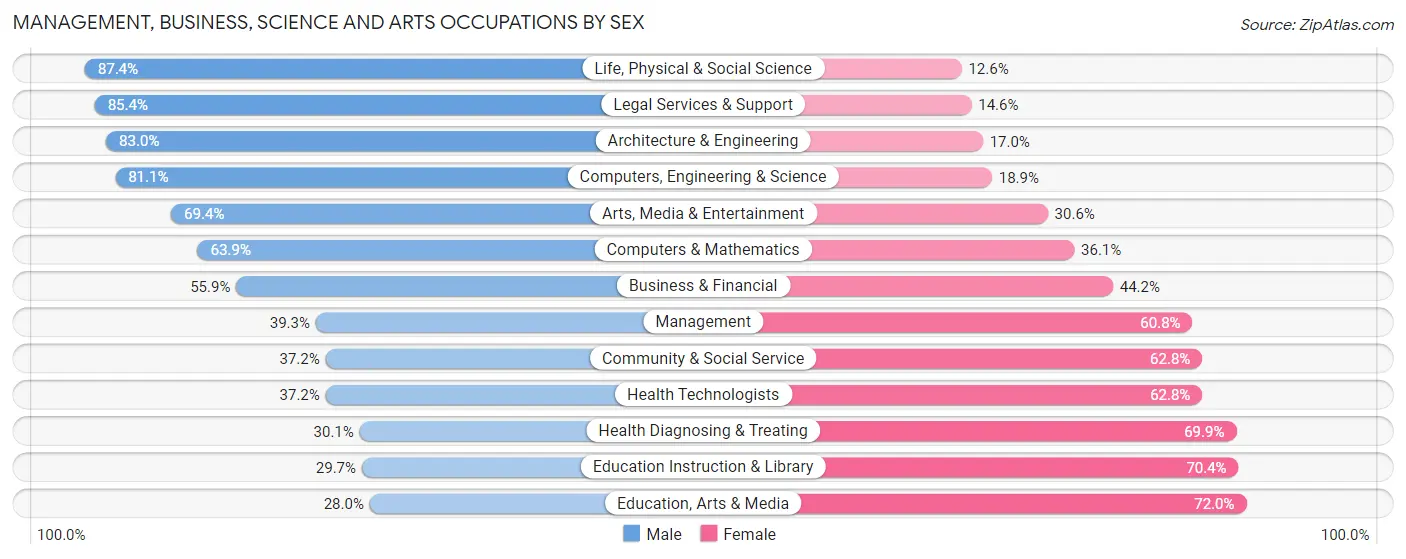
Management, Business, Science and Arts Occupations by Sex
Within the Management, Business, Science and Arts occupations in Corning, the most male-oriented occupations are Life, Physical & Social Science (87.4%), Legal Services & Support (85.4%), and Architecture & Engineering (83.0%), while the most female-oriented occupations are Education, Arts & Media (72.0%), Education Instruction & Library (70.4%), and Health Diagnosing & Treating (69.9%).
| Occupation | Male | Female |
| Management | 179 (39.3%) | 277 (60.8%) |
| Business & Financial | 210 (55.8%) | 166 (44.2%) |
| Computers, Engineering & Science | 669 (81.1%) | 156 (18.9%) |
| Computers & Mathematics | 101 (63.9%) | 57 (36.1%) |
| Architecture & Engineering | 283 (83.0%) | 58 (17.0%) |
| Life, Physical & Social Science | 285 (87.4%) | 41 (12.6%) |
| Community & Social Service | 281 (37.2%) | 474 (62.8%) |
| Education, Arts & Media | 49 (28.0%) | 126 (72.0%) |
| Legal Services & Support | 70 (85.4%) | 12 (14.6%) |
| Education Instruction & Library | 137 (29.6%) | 325 (70.4%) |
| Arts, Media & Entertainment | 25 (69.4%) | 11 (30.6%) |
| Health Diagnosing & Treating | 112 (30.1%) | 260 (69.9%) |
| Health Technologists | 112 (37.2%) | 189 (62.8%) |
| Total (Category) | 1,451 (52.1%) | 1,333 (47.9%) |
| Total (Overall) | 2,893 (52.9%) | 2,578 (47.1%) |
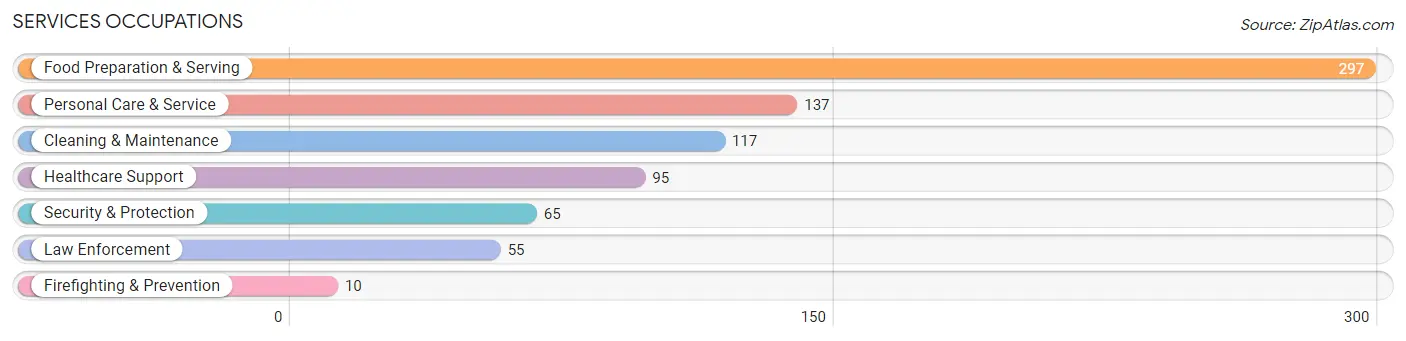
Services Occupations
The most common Services occupations in Corning are Food Preparation & Serving (297 | 5.4%), Personal Care & Service (137 | 2.5%), Cleaning & Maintenance (117 | 2.1%), Healthcare Support (95 | 1.7%), and Security & Protection (65 | 1.2%).
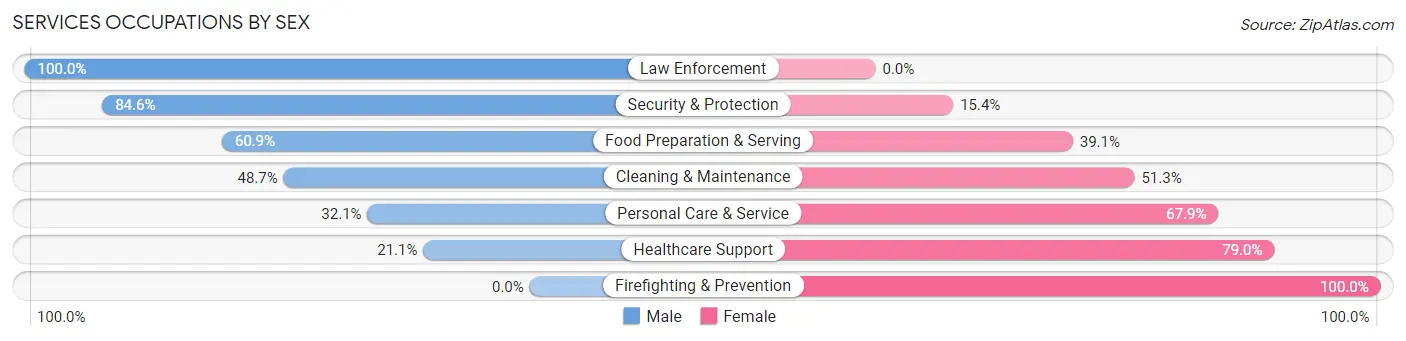
Services Occupations by Sex
Within the Services occupations in Corning, the most male-oriented occupations are Law Enforcement (100.0%), Security & Protection (84.6%), and Food Preparation & Serving (60.9%), while the most female-oriented occupations are Firefighting & Prevention (100.0%), Healthcare Support (78.9%), and Personal Care & Service (67.9%).
| Occupation | Male | Female |
| Healthcare Support | 20 (21.0%) | 75 (78.9%) |
| Security & Protection | 55 (84.6%) | 10 (15.4%) |
| Firefighting & Prevention | 0 (0.0%) | 10 (100.0%) |
| Law Enforcement | 55 (100.0%) | 0 (0.0%) |
| Food Preparation & Serving | 181 (60.9%) | 116 (39.1%) |
| Cleaning & Maintenance | 57 (48.7%) | 60 (51.3%) |
| Personal Care & Service | 44 (32.1%) | 93 (67.9%) |
| Total (Category) | 357 (50.2%) | 354 (49.8%) |
| Total (Overall) | 2,893 (52.9%) | 2,578 (47.1%) |
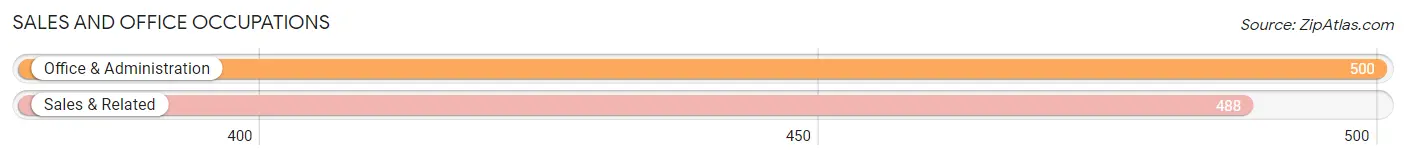
Sales and Office Occupations
The most common Sales and Office occupations in Corning are Office & Administration (500 | 9.1%), and Sales & Related (488 | 8.9%).
Sales and Office Occupations by Sex
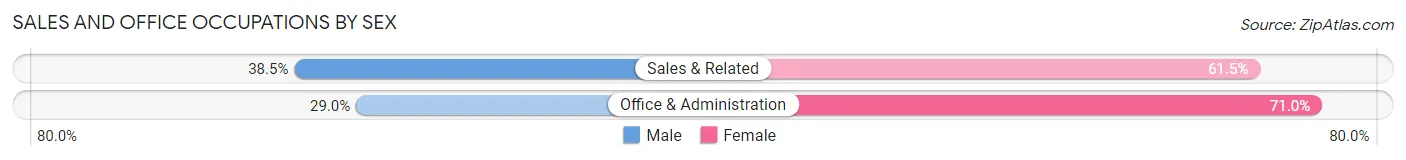
| Occupation | Male | Female |
| Sales & Related | 188 (38.5%) | 300 (61.5%) |
| Office & Administration | 145 (29.0%) | 355 (71.0%) |
| Total (Category) | 333 (33.7%) | 655 (66.3%) |
| Total (Overall) | 2,893 (52.9%) | 2,578 (47.1%) |
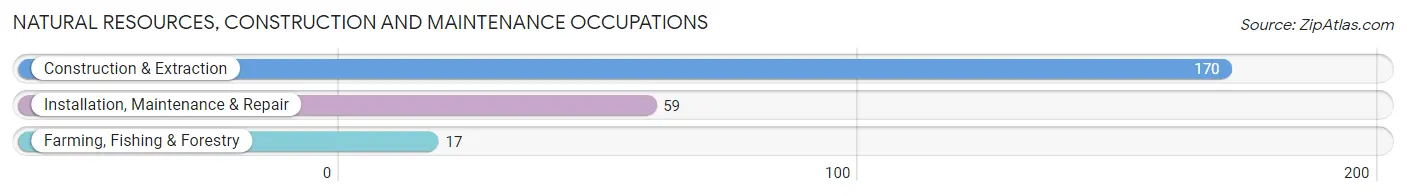
Natural Resources, Construction and Maintenance Occupations
The most common Natural Resources, Construction and Maintenance occupations in Corning are Construction & Extraction (170 | 3.1%), Installation, Maintenance & Repair (59 | 1.1%), and Farming, Fishing & Forestry (17 | 0.3%).
Natural Resources, Construction and Maintenance Occupations by Sex
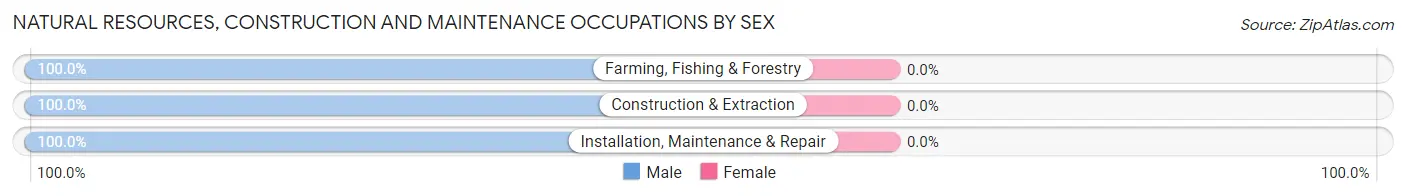
| Occupation | Male | Female |
| Farming, Fishing & Forestry | 17 (100.0%) | 0 (0.0%) |
| Construction & Extraction | 170 (100.0%) | 0 (0.0%) |
| Installation, Maintenance & Repair | 59 (100.0%) | 0 (0.0%) |
| Total (Category) | 246 (100.0%) | 0 (0.0%) |
| Total (Overall) | 2,893 (52.9%) | 2,578 (47.1%) |
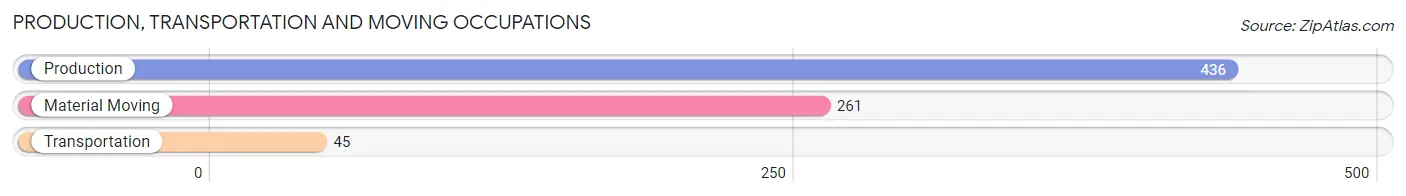
Production, Transportation and Moving Occupations
The most common Production, Transportation and Moving occupations in Corning are Production (436 | 8.0%), Material Moving (261 | 4.8%), and Transportation (45 | 0.8%).
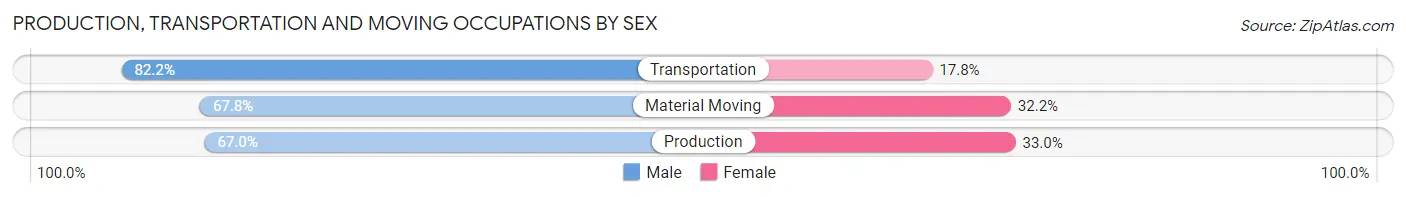
Production, Transportation and Moving Occupations by Sex
| Occupation | Male | Female |
| Production | 292 (67.0%) | 144 (33.0%) |
| Transportation | 37 (82.2%) | 8 (17.8%) |
| Material Moving | 177 (67.8%) | 84 (32.2%) |
| Total (Category) | 506 (68.2%) | 236 (31.8%) |
| Total (Overall) | 2,893 (52.9%) | 2,578 (47.1%) |
Employment Industries by Sex in Corning
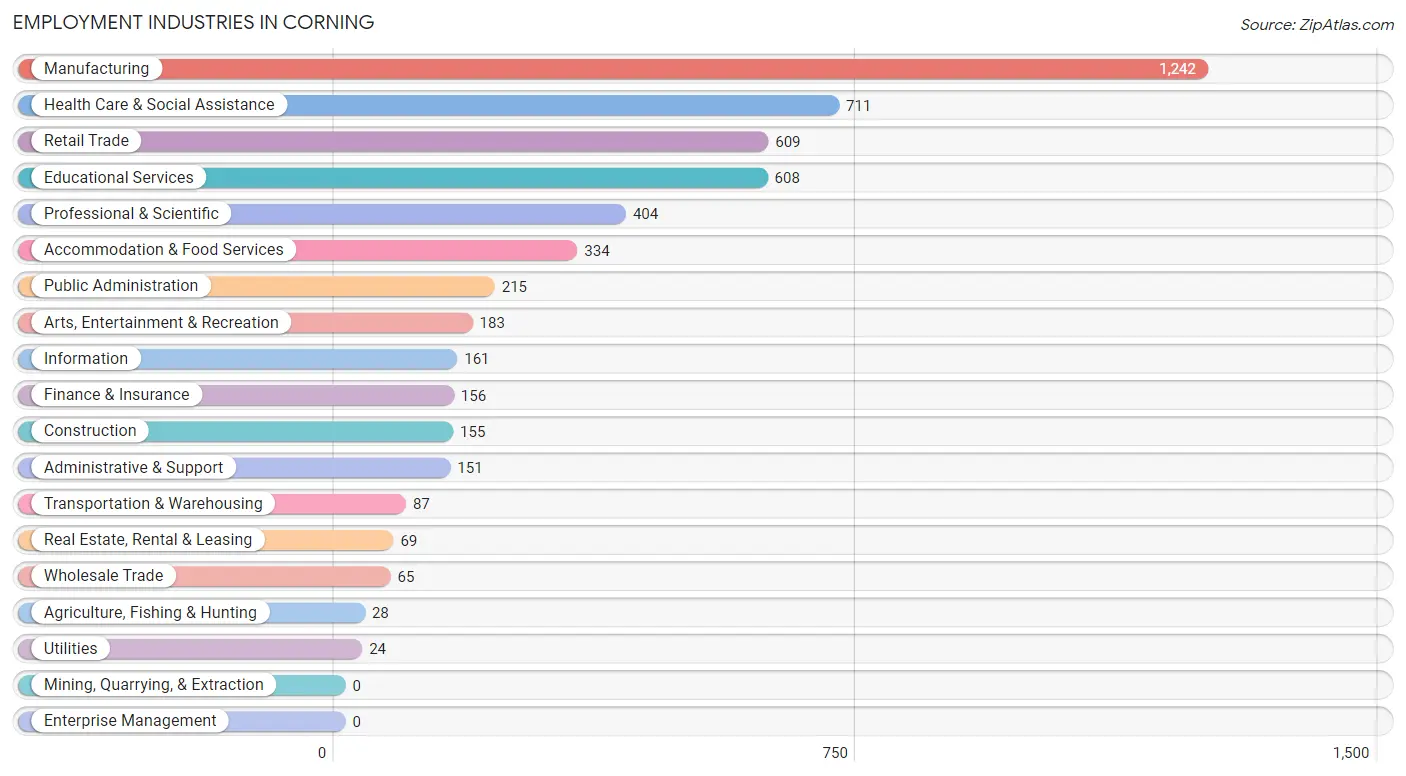
Employment Industries in Corning
The major employment industries in Corning include Manufacturing (1,242 | 22.7%), Health Care & Social Assistance (711 | 13.0%), Retail Trade (609 | 11.1%), Educational Services (608 | 11.1%), and Professional & Scientific (404 | 7.4%).
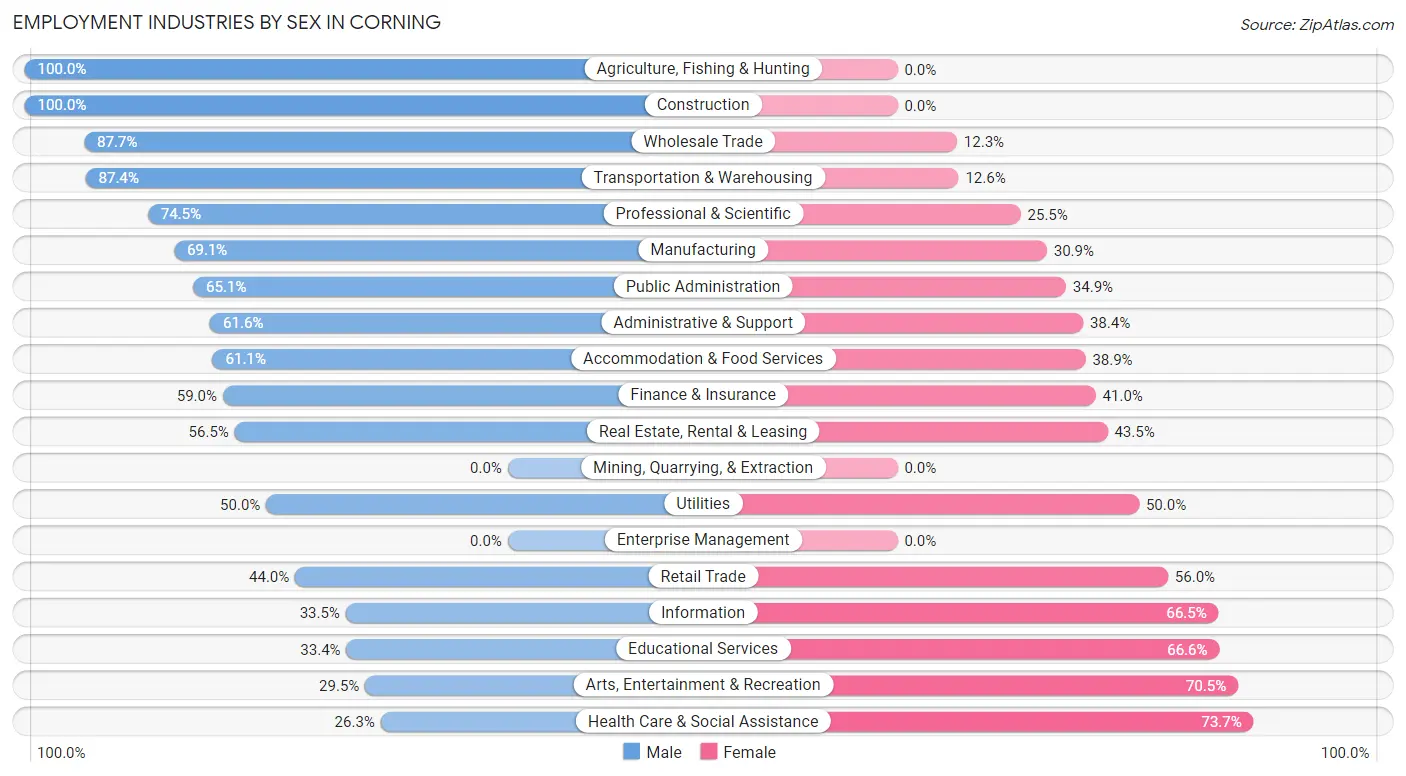
Employment Industries by Sex in Corning
The Corning industries that see more men than women are Agriculture, Fishing & Hunting (100.0%), Construction (100.0%), and Wholesale Trade (87.7%), whereas the industries that tend to have a higher number of women are Health Care & Social Assistance (73.7%), Arts, Entertainment & Recreation (70.5%), and Educational Services (66.6%).
| Industry | Male | Female |
| Agriculture, Fishing & Hunting | 28 (100.0%) | 0 (0.0%) |
| Mining, Quarrying, & Extraction | 0 (0.0%) | 0 (0.0%) |
| Construction | 155 (100.0%) | 0 (0.0%) |
| Manufacturing | 858 (69.1%) | 384 (30.9%) |
| Wholesale Trade | 57 (87.7%) | 8 (12.3%) |
| Retail Trade | 268 (44.0%) | 341 (56.0%) |
| Transportation & Warehousing | 76 (87.4%) | 11 (12.6%) |
| Utilities | 12 (50.0%) | 12 (50.0%) |
| Information | 54 (33.5%) | 107 (66.5%) |
| Finance & Insurance | 92 (59.0%) | 64 (41.0%) |
| Real Estate, Rental & Leasing | 39 (56.5%) | 30 (43.5%) |
| Professional & Scientific | 301 (74.5%) | 103 (25.5%) |
| Enterprise Management | 0 (0.0%) | 0 (0.0%) |
| Administrative & Support | 93 (61.6%) | 58 (38.4%) |
| Educational Services | 203 (33.4%) | 405 (66.6%) |
| Health Care & Social Assistance | 187 (26.3%) | 524 (73.7%) |
| Arts, Entertainment & Recreation | 54 (29.5%) | 129 (70.5%) |
| Accommodation & Food Services | 204 (61.1%) | 130 (38.9%) |
| Public Administration | 140 (65.1%) | 75 (34.9%) |
| Total | 2,893 (52.9%) | 2,578 (47.1%) |
Education in Corning
School Enrollment in Corning
The most common levels of schooling among the 1,926 students in Corning are middle school (520 | 27.0%), elementary school (417 | 21.6%), and high school (405 | 21.0%).
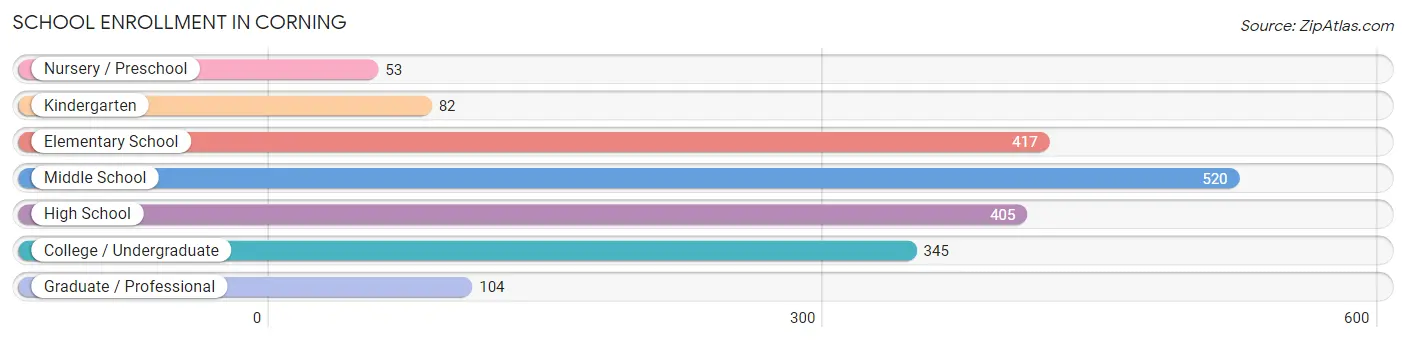
| School Level | # Students | % Students |
| Nursery / Preschool | 53 | 2.8% |
| Kindergarten | 82 | 4.3% |
| Elementary School | 417 | 21.6% |
| Middle School | 520 | 27.0% |
| High School | 405 | 21.0% |
| College / Undergraduate | 345 | 17.9% |
| Graduate / Professional | 104 | 5.4% |
| Total | 1,926 | 100.0% |
School Enrollment by Age by Funding Source in Corning
Out of a total of 1,926 students who are enrolled in schools in Corning, 304 (15.8%) attend a private institution, while the remaining 1,622 (84.2%) are enrolled in public schools. The age group of 3 to 4 year olds has the highest likelihood of being enrolled in private schools, with 37 (86.1% in the age bracket) enrolled. Conversely, the age group of 18 to 19 year olds has the lowest likelihood of being enrolled in a private school, with 98 (100.0% in the age bracket) attending a public institution.
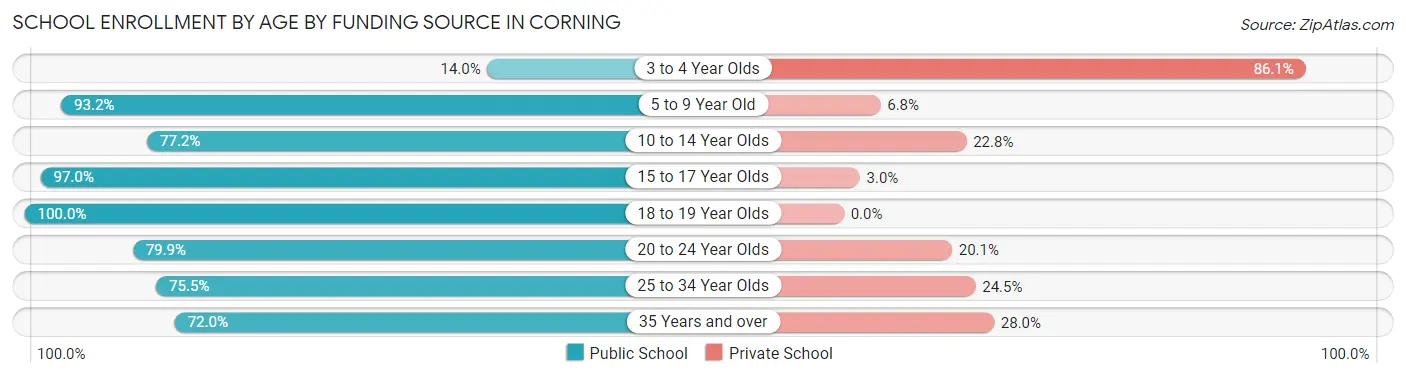
| Age Bracket | Public School | Private School |
| 3 to 4 Year Olds | 6 (14.0%) | 37 (86.1%) |
| 5 to 9 Year Old | 492 (93.2%) | 36 (6.8%) |
| 10 to 14 Year Olds | 436 (77.2%) | 129 (22.8%) |
| 15 to 17 Year Olds | 294 (97.0%) | 9 (3.0%) |
| 18 to 19 Year Olds | 98 (100.0%) | 0 (0.0%) |
| 20 to 24 Year Olds | 115 (79.9%) | 29 (20.1%) |
| 25 to 34 Year Olds | 77 (75.5%) | 25 (24.5%) |
| 35 Years and over | 103 (72.0%) | 40 (28.0%) |
| Total | 1,622 (84.2%) | 304 (15.8%) |
Educational Attainment by Field of Study in Corning
Education (527 | 14.2%), engineering (436 | 11.7%), business (375 | 10.1%), physical & health sciences (332 | 8.9%), and social sciences (289 | 7.8%) are the most common fields of study among 3,723 individuals in Corning who have obtained a bachelor's degree or higher.
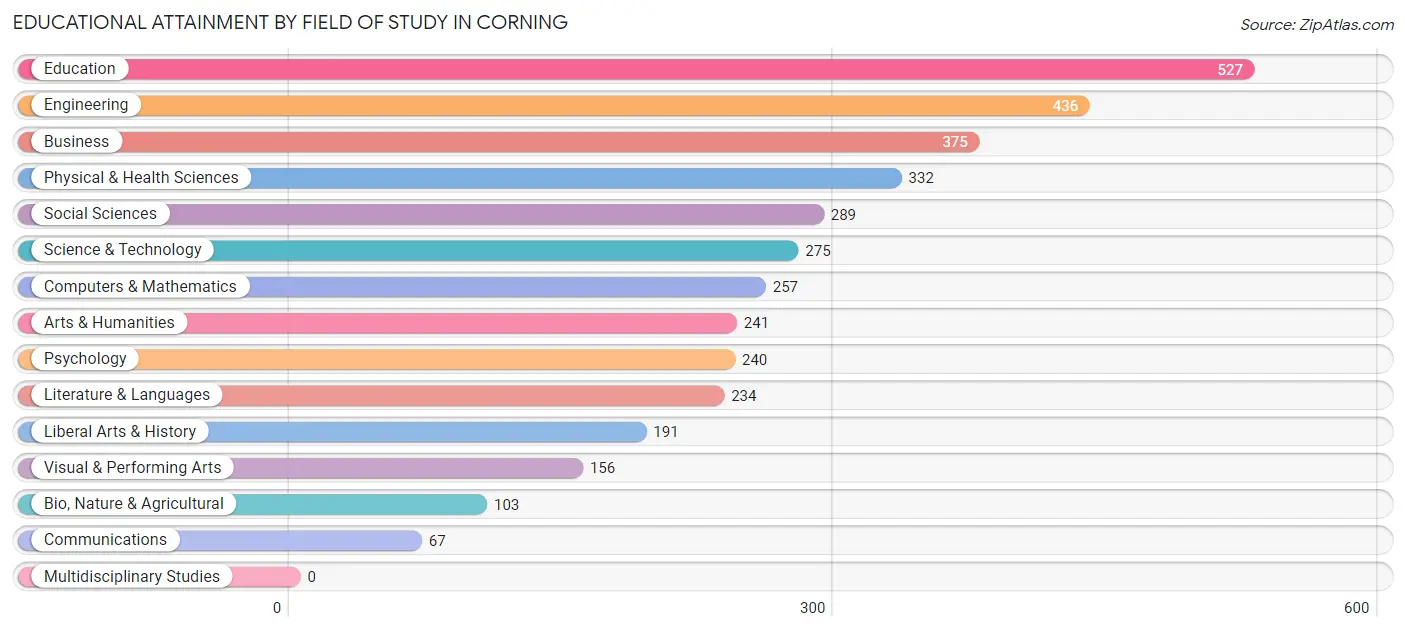
| Field of Study | # Graduates | % Graduates |
| Computers & Mathematics | 257 | 6.9% |
| Bio, Nature & Agricultural | 103 | 2.8% |
| Physical & Health Sciences | 332 | 8.9% |
| Psychology | 240 | 6.5% |
| Social Sciences | 289 | 7.8% |
| Engineering | 436 | 11.7% |
| Multidisciplinary Studies | 0 | 0.0% |
| Science & Technology | 275 | 7.4% |
| Business | 375 | 10.1% |
| Education | 527 | 14.2% |
| Literature & Languages | 234 | 6.3% |
| Liberal Arts & History | 191 | 5.1% |
| Visual & Performing Arts | 156 | 4.2% |
| Communications | 67 | 1.8% |
| Arts & Humanities | 241 | 6.5% |
| Total | 3,723 | 100.0% |
Transportation & Commute in Corning
Vehicle Availability by Sex in Corning
The most prevalent vehicle ownership categories in Corning are males with 2 vehicles (1,267, accounting for 44.0%) and females with 2 vehicles (1,157, making up 51.2%).
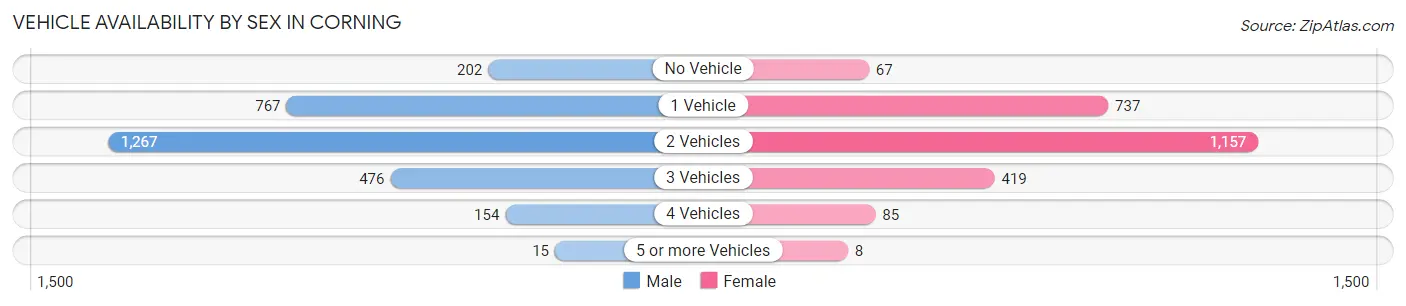
| Vehicles Available | Male | Female |
| No Vehicle | 202 (7.0%) | 67 (2.7%) |
| 1 Vehicle | 767 (26.6%) | 737 (29.8%) |
| 2 Vehicles | 1,267 (44.0%) | 1,157 (46.8%) |
| 3 Vehicles | 476 (16.5%) | 419 (16.9%) |
| 4 Vehicles | 154 (5.3%) | 85 (3.4%) |
| 5 or more Vehicles | 15 (0.5%) | 8 (0.3%) |
| Total | 2,881 (100.0%) | 2,473 (100.0%) |
Commute Time in Corning
The most frequently occuring commute durations in Corning are 10 to 14 minutes (1,321 commuters, 27.6%), 5 to 9 minutes (1,176 commuters, 24.5%), and 20 to 24 minutes (501 commuters, 10.5%).
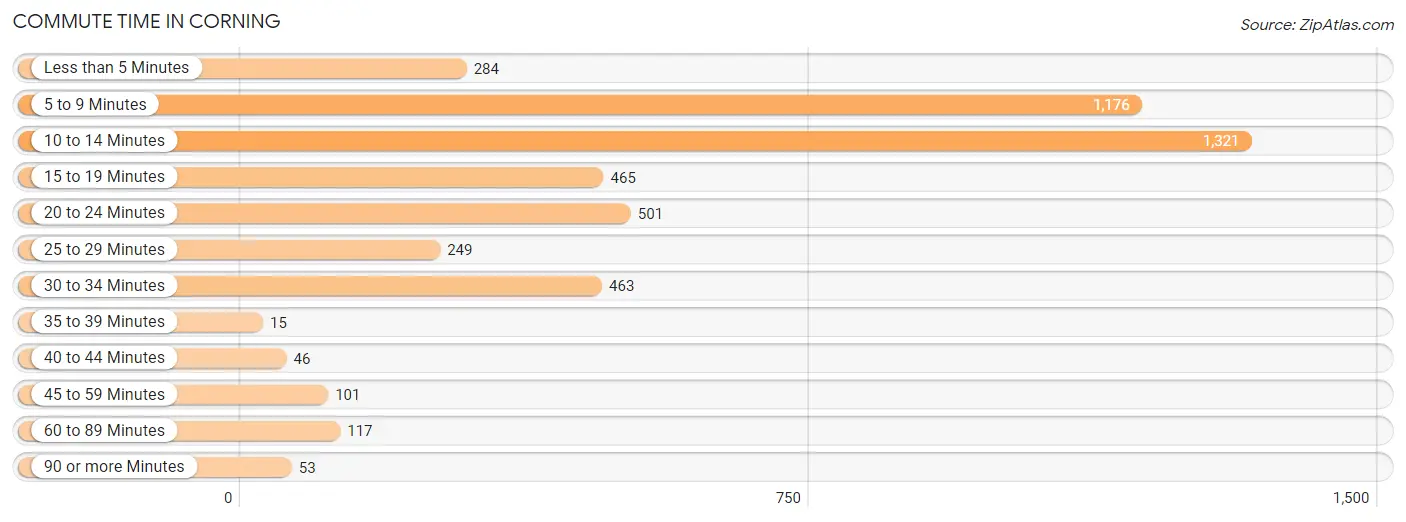
| Commute Time | # Commuters | % Commuters |
| Less than 5 Minutes | 284 | 5.9% |
| 5 to 9 Minutes | 1,176 | 24.5% |
| 10 to 14 Minutes | 1,321 | 27.6% |
| 15 to 19 Minutes | 465 | 9.7% |
| 20 to 24 Minutes | 501 | 10.5% |
| 25 to 29 Minutes | 249 | 5.2% |
| 30 to 34 Minutes | 463 | 9.7% |
| 35 to 39 Minutes | 15 | 0.3% |
| 40 to 44 Minutes | 46 | 1.0% |
| 45 to 59 Minutes | 101 | 2.1% |
| 60 to 89 Minutes | 117 | 2.4% |
| 90 or more Minutes | 53 | 1.1% |
Commute Time by Sex in Corning
The most common commute times in Corning are 10 to 14 minutes (844 commuters, 32.6%) for males and 5 to 9 minutes (733 commuters, 33.3%) for females.
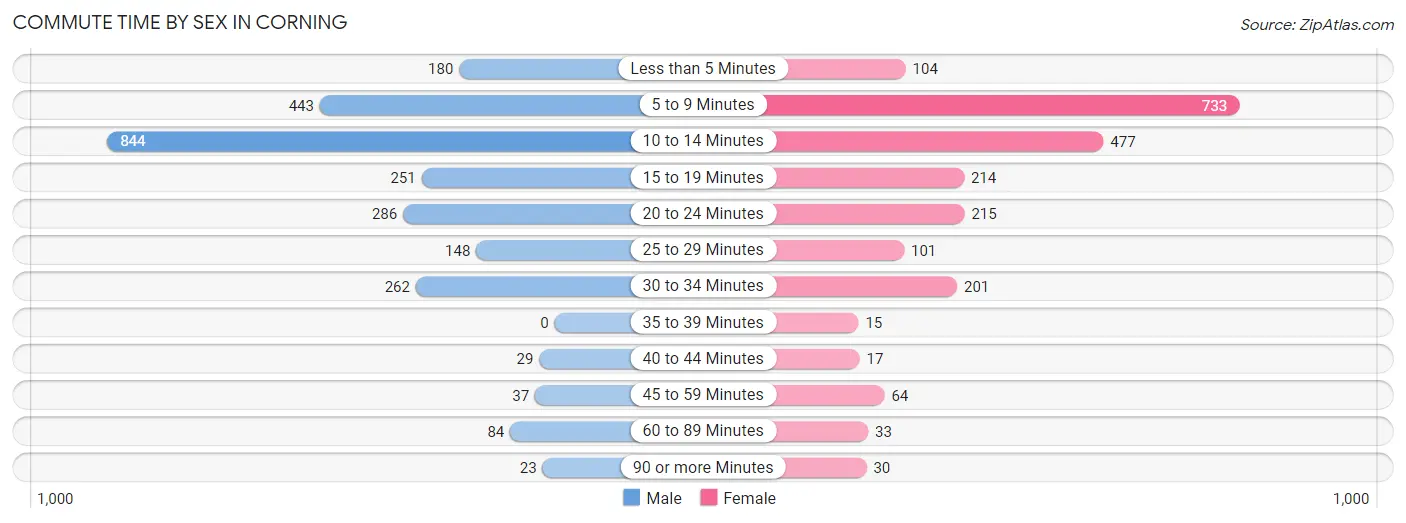
| Commute Time | Male | Female |
| Less than 5 Minutes | 180 (7.0%) | 104 (4.7%) |
| 5 to 9 Minutes | 443 (17.1%) | 733 (33.3%) |
| 10 to 14 Minutes | 844 (32.6%) | 477 (21.6%) |
| 15 to 19 Minutes | 251 (9.7%) | 214 (9.7%) |
| 20 to 24 Minutes | 286 (11.1%) | 215 (9.8%) |
| 25 to 29 Minutes | 148 (5.7%) | 101 (4.6%) |
| 30 to 34 Minutes | 262 (10.1%) | 201 (9.1%) |
| 35 to 39 Minutes | 0 (0.0%) | 15 (0.7%) |
| 40 to 44 Minutes | 29 (1.1%) | 17 (0.8%) |
| 45 to 59 Minutes | 37 (1.4%) | 64 (2.9%) |
| 60 to 89 Minutes | 84 (3.3%) | 33 (1.5%) |
| 90 or more Minutes | 23 (0.9%) | 30 (1.4%) |
Time of Departure to Work by Sex in Corning
The most frequent times of departure to work in Corning are 7:30 AM to 7:59 AM (531, 20.5%) for males and 7:00 AM to 7:29 AM (497, 22.6%) for females.
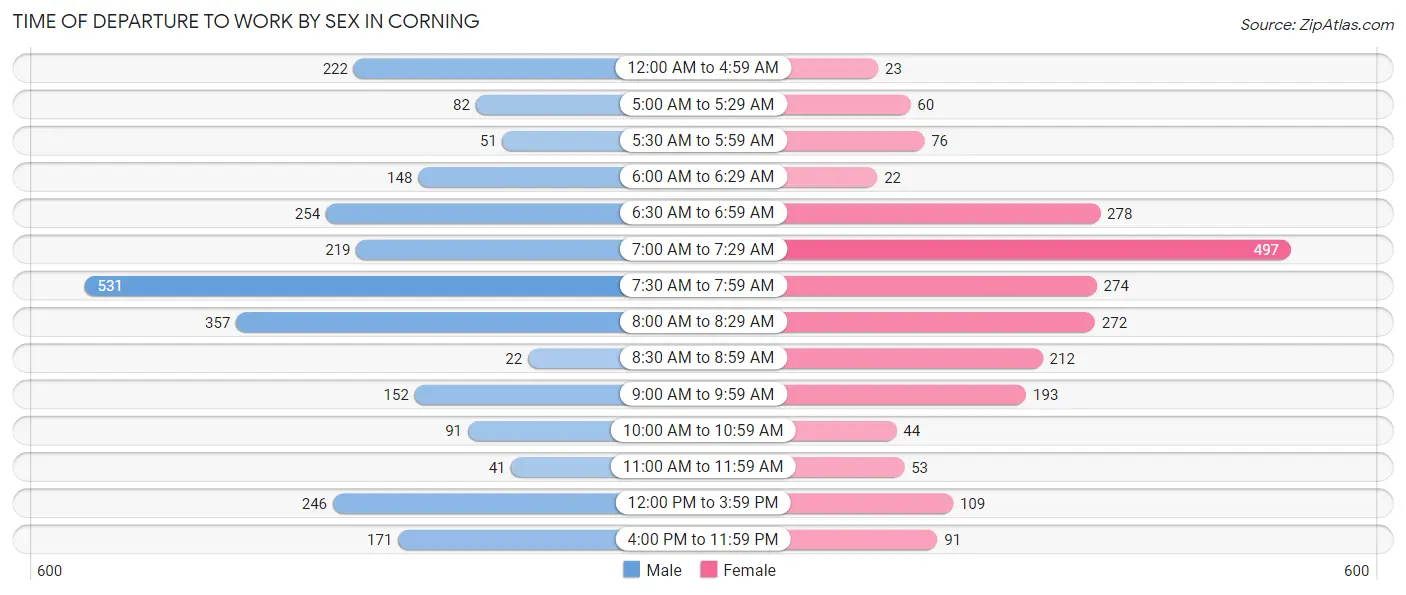
| Time of Departure | Male | Female |
| 12:00 AM to 4:59 AM | 222 (8.6%) | 23 (1.0%) |
| 5:00 AM to 5:29 AM | 82 (3.2%) | 60 (2.7%) |
| 5:30 AM to 5:59 AM | 51 (2.0%) | 76 (3.5%) |
| 6:00 AM to 6:29 AM | 148 (5.7%) | 22 (1.0%) |
| 6:30 AM to 6:59 AM | 254 (9.8%) | 278 (12.6%) |
| 7:00 AM to 7:29 AM | 219 (8.5%) | 497 (22.6%) |
| 7:30 AM to 7:59 AM | 531 (20.5%) | 274 (12.4%) |
| 8:00 AM to 8:29 AM | 357 (13.8%) | 272 (12.3%) |
| 8:30 AM to 8:59 AM | 22 (0.9%) | 212 (9.6%) |
| 9:00 AM to 9:59 AM | 152 (5.9%) | 193 (8.8%) |
| 10:00 AM to 10:59 AM | 91 (3.5%) | 44 (2.0%) |
| 11:00 AM to 11:59 AM | 41 (1.6%) | 53 (2.4%) |
| 12:00 PM to 3:59 PM | 246 (9.5%) | 109 (5.0%) |
| 4:00 PM to 11:59 PM | 171 (6.6%) | 91 (4.1%) |
| Total | 2,587 (100.0%) | 2,204 (100.0%) |
Housing Occupancy in Corning
Occupancy by Ownership in Corning
Of the total 5,284 dwellings in Corning, owner-occupied units account for 2,743 (51.9%), while renter-occupied units make up 2,541 (48.1%).
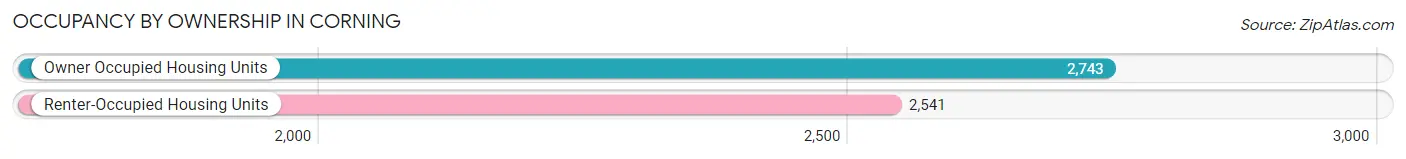
| Occupancy | # Housing Units | % Housing Units |
| Owner Occupied Housing Units | 2,743 | 51.9% |
| Renter-Occupied Housing Units | 2,541 | 48.1% |
| Total Occupied Housing Units | 5,284 | 100.0% |
Occupancy by Household Size in Corning
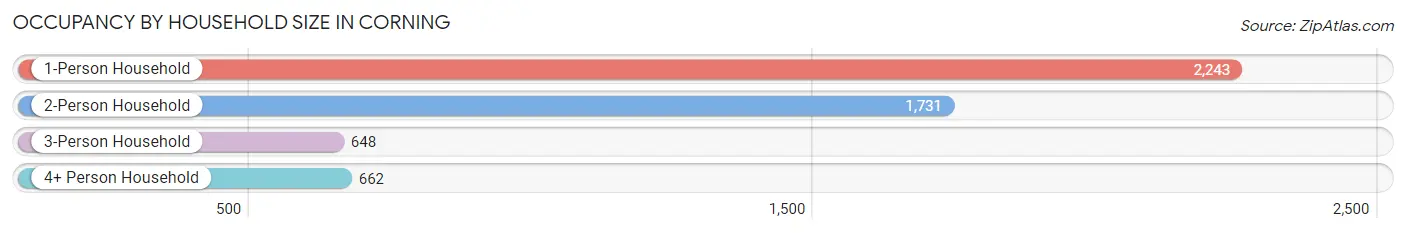
| Household Size | # Housing Units | % Housing Units |
| 1-Person Household | 2,243 | 42.4% |
| 2-Person Household | 1,731 | 32.8% |
| 3-Person Household | 648 | 12.3% |
| 4+ Person Household | 662 | 12.5% |
| Total Housing Units | 5,284 | 100.0% |
Occupancy by Ownership by Household Size in Corning
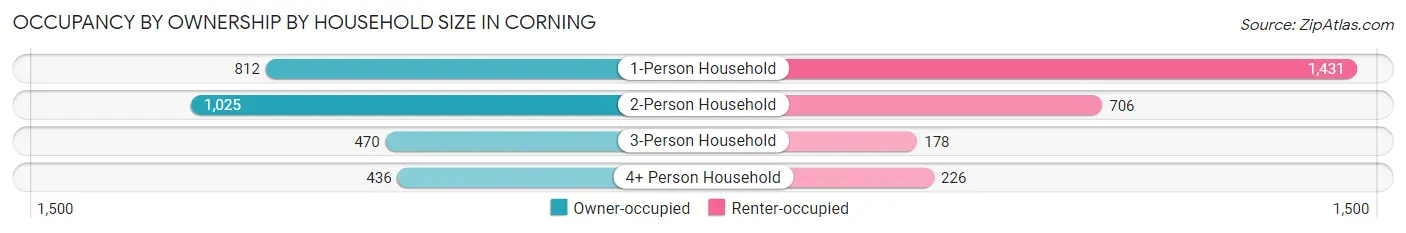
| Household Size | Owner-occupied | Renter-occupied |
| 1-Person Household | 812 (36.2%) | 1,431 (63.8%) |
| 2-Person Household | 1,025 (59.2%) | 706 (40.8%) |
| 3-Person Household | 470 (72.5%) | 178 (27.5%) |
| 4+ Person Household | 436 (65.9%) | 226 (34.1%) |
| Total Housing Units | 2,743 (51.9%) | 2,541 (48.1%) |
Occupancy by Educational Attainment in Corning
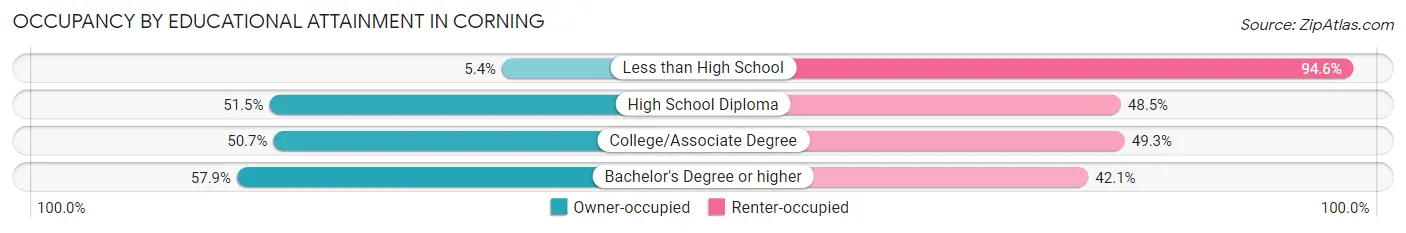
| Household Size | Owner-occupied | Renter-occupied |
| Less than High School | 15 (5.4%) | 265 (94.6%) |
| High School Diploma | 486 (51.5%) | 458 (48.5%) |
| College/Associate Degree | 769 (50.7%) | 748 (49.3%) |
| Bachelor's Degree or higher | 1,473 (57.9%) | 1,070 (42.1%) |
Occupancy by Age of Householder in Corning
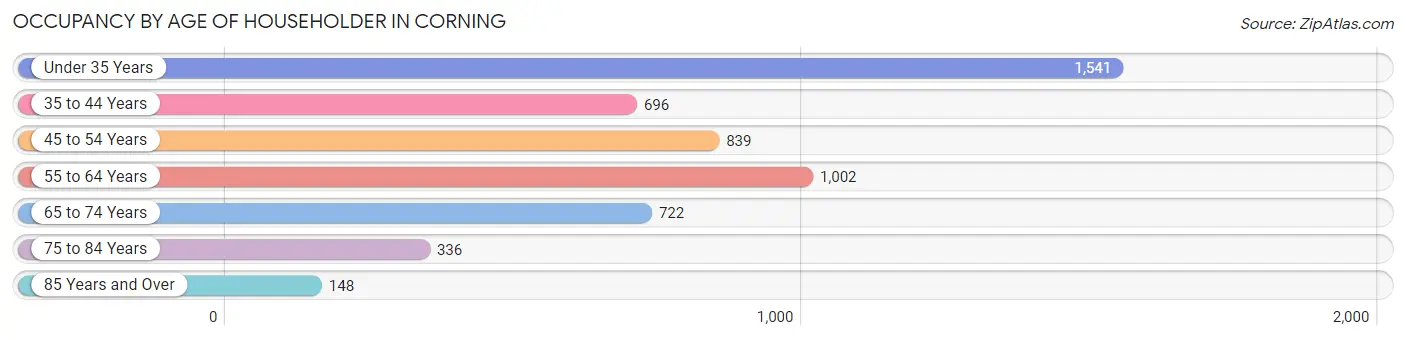
| Age Bracket | # Households | % Households |
| Under 35 Years | 1,541 | 29.2% |
| 35 to 44 Years | 696 | 13.2% |
| 45 to 54 Years | 839 | 15.9% |
| 55 to 64 Years | 1,002 | 19.0% |
| 65 to 74 Years | 722 | 13.7% |
| 75 to 84 Years | 336 | 6.4% |
| 85 Years and Over | 148 | 2.8% |
| Total | 5,284 | 100.0% |
Housing Finances in Corning
Median Income by Occupancy in Corning
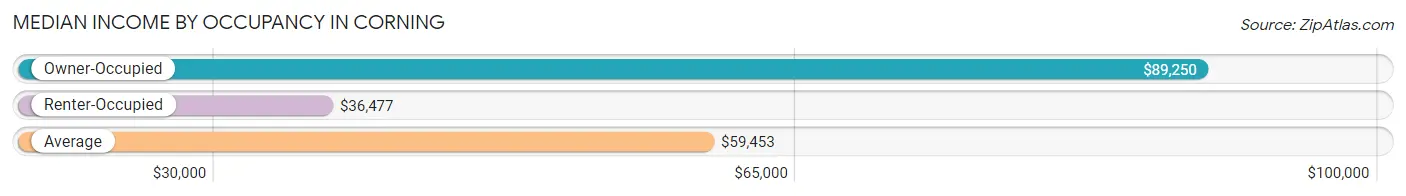
| Occupancy Type | # Households | Median Income |
| Owner-Occupied | 2,743 (51.9%) | $89,250 |
| Renter-Occupied | 2,541 (48.1%) | $36,477 |
| Average | 5,284 (100.0%) | $59,453 |
Occupancy by Householder Income Bracket in Corning
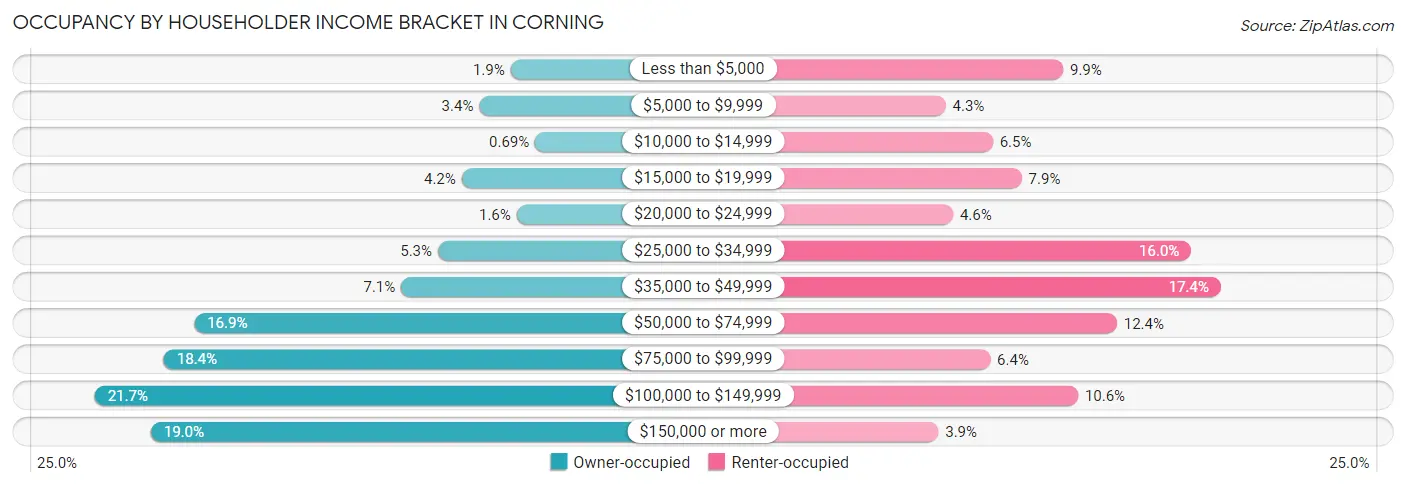
| Income Bracket | Owner-occupied | Renter-occupied |
| Less than $5,000 | 51 (1.9%) | 251 (9.9%) |
| $5,000 to $9,999 | 92 (3.4%) | 109 (4.3%) |
| $10,000 to $14,999 | 19 (0.7%) | 166 (6.5%) |
| $15,000 to $19,999 | 115 (4.2%) | 201 (7.9%) |
| $20,000 to $24,999 | 43 (1.6%) | 118 (4.6%) |
| $25,000 to $34,999 | 146 (5.3%) | 406 (16.0%) |
| $35,000 to $49,999 | 194 (7.1%) | 442 (17.4%) |
| $50,000 to $74,999 | 464 (16.9%) | 316 (12.4%) |
| $75,000 to $99,999 | 504 (18.4%) | 163 (6.4%) |
| $100,000 to $149,999 | 594 (21.7%) | 269 (10.6%) |
| $150,000 or more | 521 (19.0%) | 100 (3.9%) |
| Total | 2,743 (100.0%) | 2,541 (100.0%) |
Monthly Housing Cost Tiers in Corning
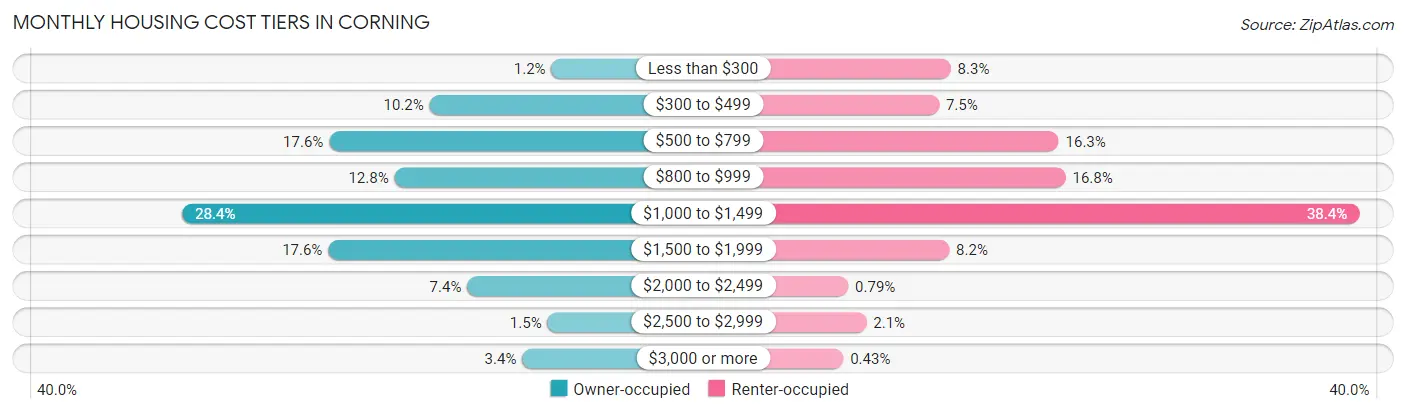
| Monthly Cost | Owner-occupied | Renter-occupied |
| Less than $300 | 33 (1.2%) | 212 (8.3%) |
| $300 to $499 | 279 (10.2%) | 190 (7.5%) |
| $500 to $799 | 482 (17.6%) | 414 (16.3%) |
| $800 to $999 | 350 (12.8%) | 427 (16.8%) |
| $1,000 to $1,499 | 779 (28.4%) | 976 (38.4%) |
| $1,500 to $1,999 | 484 (17.6%) | 209 (8.2%) |
| $2,000 to $2,499 | 203 (7.4%) | 20 (0.8%) |
| $2,500 to $2,999 | 41 (1.5%) | 54 (2.1%) |
| $3,000 or more | 92 (3.4%) | 11 (0.4%) |
| Total | 2,743 (100.0%) | 2,541 (100.0%) |
Physical Housing Characteristics in Corning
Housing Structures in Corning
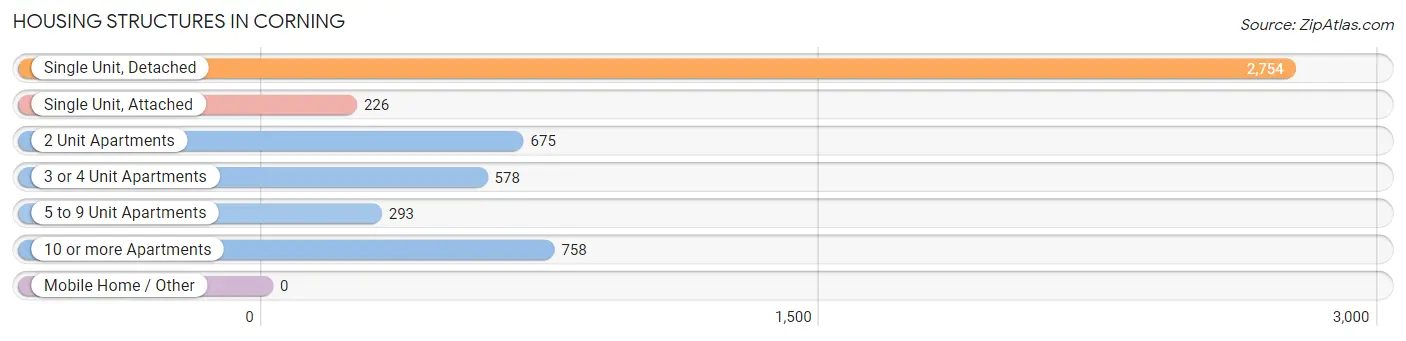
| Structure Type | # Housing Units | % Housing Units |
| Single Unit, Detached | 2,754 | 52.1% |
| Single Unit, Attached | 226 | 4.3% |
| 2 Unit Apartments | 675 | 12.8% |
| 3 or 4 Unit Apartments | 578 | 10.9% |
| 5 to 9 Unit Apartments | 293 | 5.6% |
| 10 or more Apartments | 758 | 14.3% |
| Mobile Home / Other | 0 | 0.0% |
| Total | 5,284 | 100.0% |
Housing Structures by Occupancy in Corning
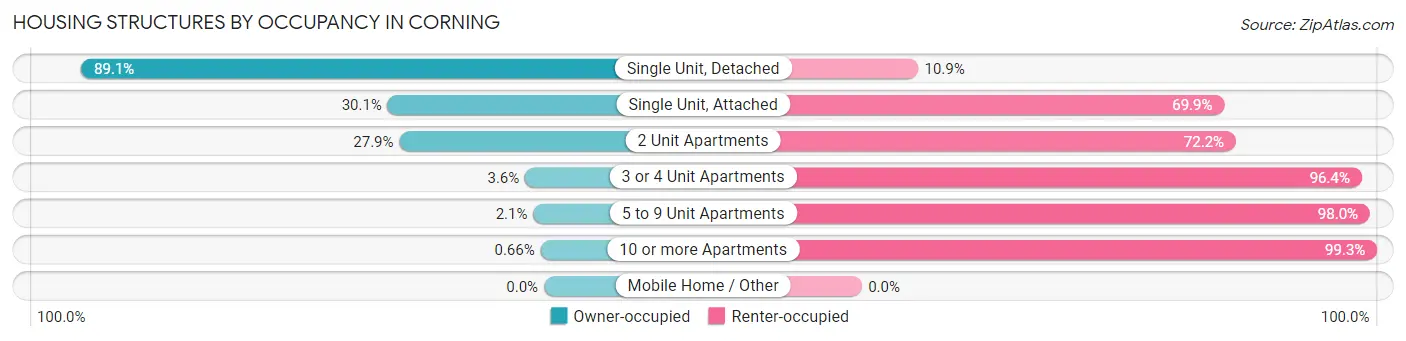
| Structure Type | Owner-occupied | Renter-occupied |
| Single Unit, Detached | 2,455 (89.1%) | 299 (10.9%) |
| Single Unit, Attached | 68 (30.1%) | 158 (69.9%) |
| 2 Unit Apartments | 188 (27.9%) | 487 (72.2%) |
| 3 or 4 Unit Apartments | 21 (3.6%) | 557 (96.4%) |
| 5 to 9 Unit Apartments | 6 (2.1%) | 287 (98.0%) |
| 10 or more Apartments | 5 (0.7%) | 753 (99.3%) |
| Mobile Home / Other | 0 (0.0%) | 0 (0.0%) |
| Total | 2,743 (51.9%) | 2,541 (48.1%) |
Housing Structures by Number of Rooms in Corning
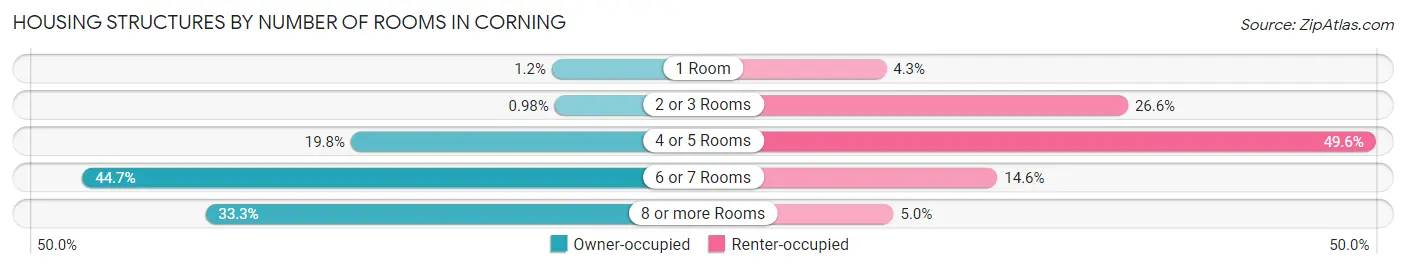
| Number of Rooms | Owner-occupied | Renter-occupied |
| 1 Room | 34 (1.2%) | 109 (4.3%) |
| 2 or 3 Rooms | 27 (1.0%) | 677 (26.6%) |
| 4 or 5 Rooms | 544 (19.8%) | 1,259 (49.5%) |
| 6 or 7 Rooms | 1,225 (44.7%) | 370 (14.6%) |
| 8 or more Rooms | 913 (33.3%) | 126 (5.0%) |
| Total | 2,743 (100.0%) | 2,541 (100.0%) |
Housing Structure by Heating Type in Corning
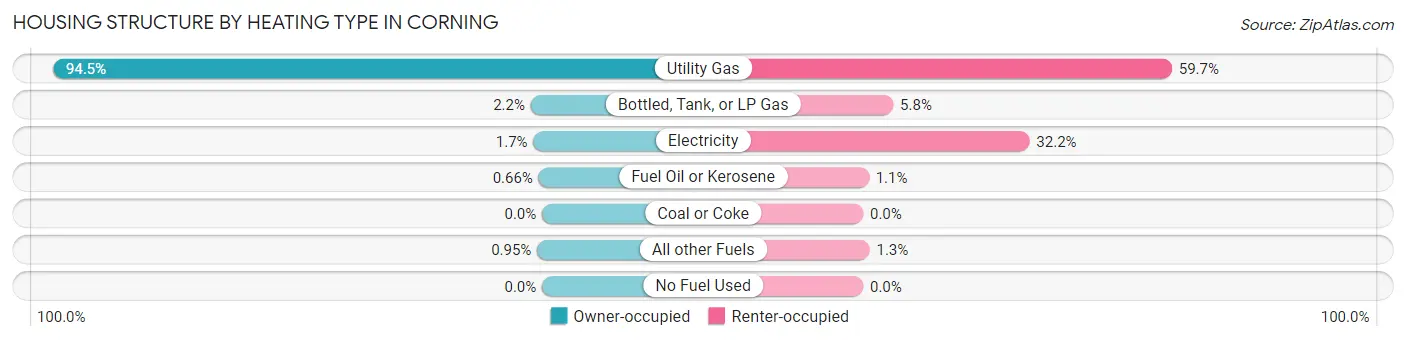
| Heating Type | Owner-occupied | Renter-occupied |
| Utility Gas | 2,593 (94.5%) | 1,516 (59.7%) |
| Bottled, Tank, or LP Gas | 60 (2.2%) | 148 (5.8%) |
| Electricity | 46 (1.7%) | 817 (32.2%) |
| Fuel Oil or Kerosene | 18 (0.7%) | 28 (1.1%) |
| Coal or Coke | 0 (0.0%) | 0 (0.0%) |
| All other Fuels | 26 (0.9%) | 32 (1.3%) |
| No Fuel Used | 0 (0.0%) | 0 (0.0%) |
| Total | 2,743 (100.0%) | 2,541 (100.0%) |
Household Vehicle Usage in Corning
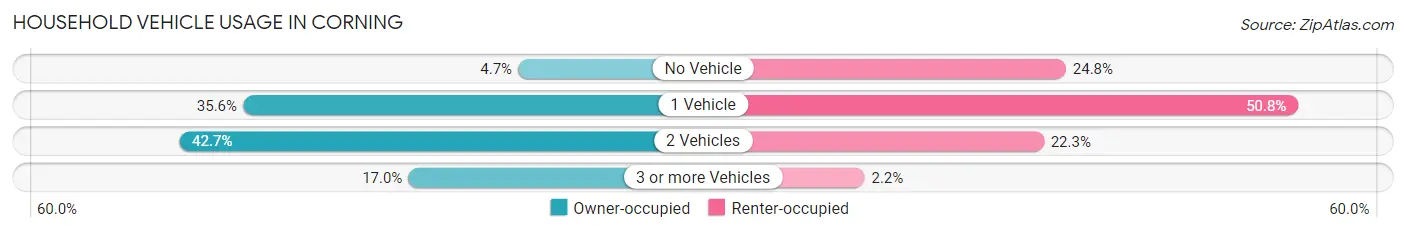
| Vehicles per Household | Owner-occupied | Renter-occupied |
| No Vehicle | 130 (4.7%) | 629 (24.7%) |
| 1 Vehicle | 975 (35.5%) | 1,290 (50.8%) |
| 2 Vehicles | 1,171 (42.7%) | 566 (22.3%) |
| 3 or more Vehicles | 467 (17.0%) | 56 (2.2%) |
| Total | 2,743 (100.0%) | 2,541 (100.0%) |
Real Estate & Mortgages in Corning
Real Estate and Mortgage Overview in Corning
| Characteristic | Without Mortgage | With Mortgage |
| Housing Units | 1,004 | 1,739 |
| Median Property Value | $143,700 | $141,700 |
| Median Household Income | $54,483 | $417 |
| Monthly Housing Costs | $604 | $72 |
| Real Estate Taxes | $3,202 | $44 |
Property Value by Mortgage Status in Corning
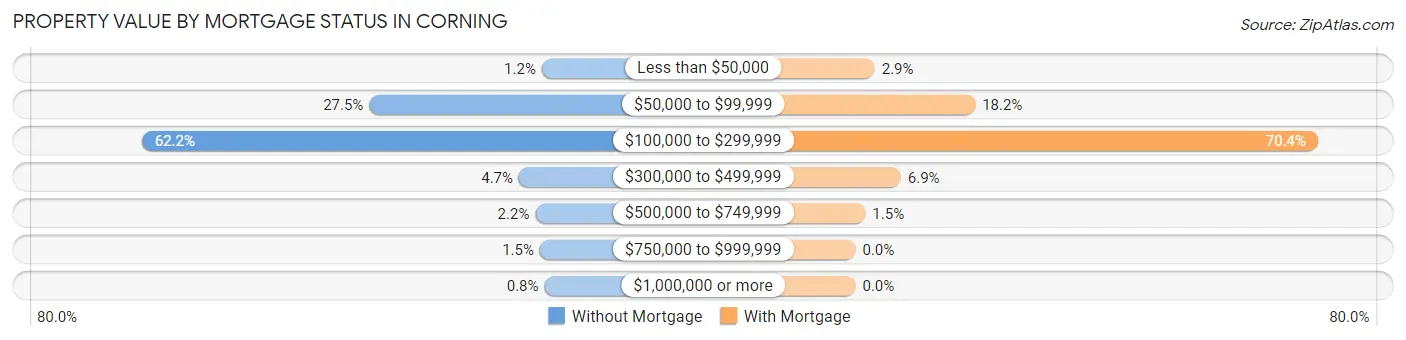
| Property Value | Without Mortgage | With Mortgage |
| Less than $50,000 | 12 (1.2%) | 51 (2.9%) |
| $50,000 to $99,999 | 276 (27.5%) | 317 (18.2%) |
| $100,000 to $299,999 | 624 (62.2%) | 1,225 (70.4%) |
| $300,000 to $499,999 | 47 (4.7%) | 120 (6.9%) |
| $500,000 to $749,999 | 22 (2.2%) | 26 (1.5%) |
| $750,000 to $999,999 | 15 (1.5%) | 0 (0.0%) |
| $1,000,000 or more | 8 (0.8%) | 0 (0.0%) |
| Total | 1,004 (100.0%) | 1,739 (100.0%) |
Household Income by Mortgage Status in Corning
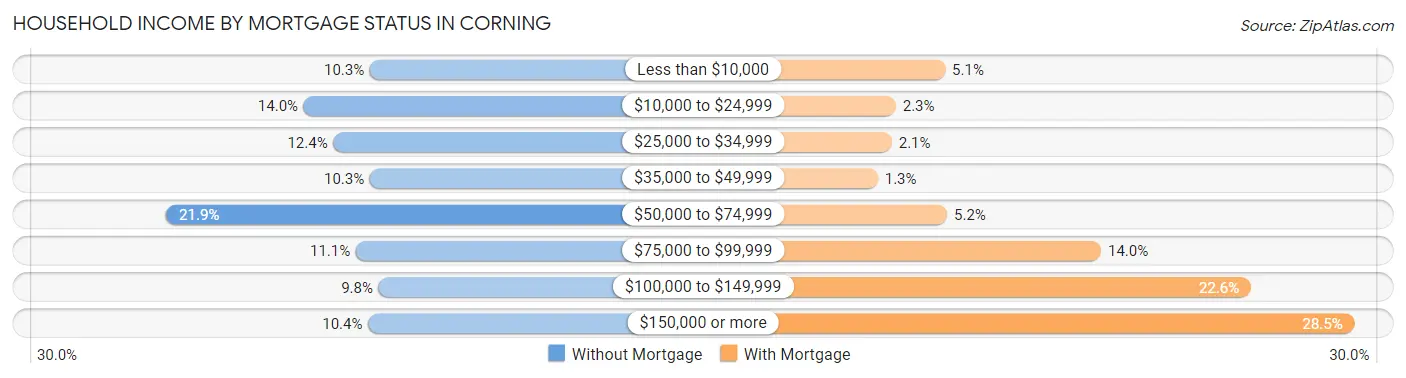
| Household Income | Without Mortgage | With Mortgage |
| Less than $10,000 | 103 (10.3%) | 89 (5.1%) |
| $10,000 to $24,999 | 141 (14.0%) | 40 (2.3%) |
| $25,000 to $34,999 | 124 (12.3%) | 36 (2.1%) |
| $35,000 to $49,999 | 103 (10.3%) | 22 (1.3%) |
| $50,000 to $74,999 | 220 (21.9%) | 91 (5.2%) |
| $75,000 to $99,999 | 111 (11.1%) | 244 (14.0%) |
| $100,000 to $149,999 | 98 (9.8%) | 393 (22.6%) |
| $150,000 or more | 104 (10.4%) | 496 (28.5%) |
| Total | 1,004 (100.0%) | 1,739 (100.0%) |
Property Value to Household Income Ratio in Corning
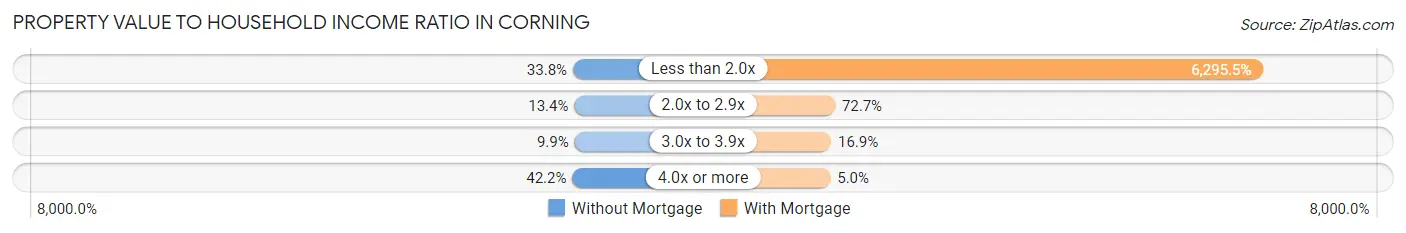
| Value-to-Income Ratio | Without Mortgage | With Mortgage |
| Less than 2.0x | 339 (33.8%) | 109,479 (6,295.5%) |
| 2.0x to 2.9x | 134 (13.4%) | 1,264 (72.7%) |
| 3.0x to 3.9x | 99 (9.9%) | 294 (16.9%) |
| 4.0x or more | 424 (42.2%) | 86 (5.0%) |
| Total | 1,004 (100.0%) | 1,739 (100.0%) |
Real Estate Taxes by Mortgage Status in Corning
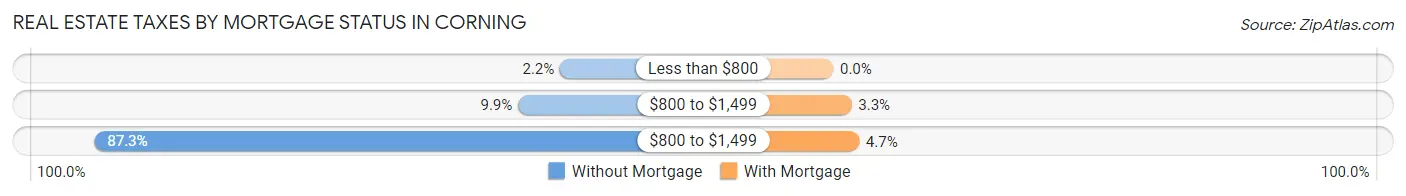
| Property Taxes | Without Mortgage | With Mortgage |
| Less than $800 | 22 (2.2%) | 0 (0.0%) |
| $800 to $1,499 | 99 (9.9%) | 58 (3.3%) |
| $800 to $1,499 | 876 (87.3%) | 82 (4.7%) |
| Total | 1,004 (100.0%) | 1,739 (100.0%) |
Health & Disability in Corning
Health Insurance Coverage by Age in Corning
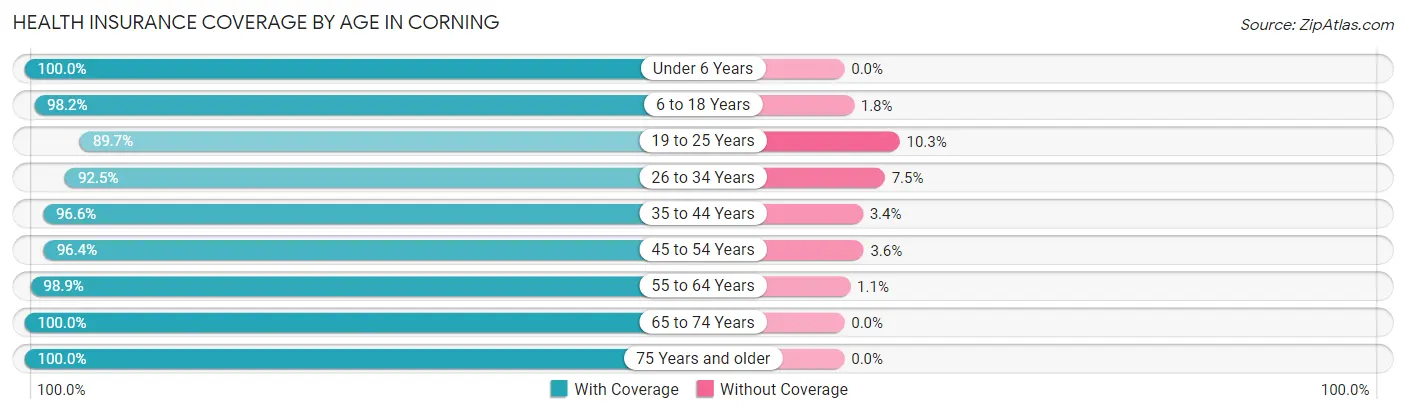
| Age Bracket | With Coverage | Without Coverage |
| Under 6 Years | 605 (100.0%) | 0 (0.0%) |
| 6 to 18 Years | 1,442 (98.2%) | 26 (1.8%) |
| 19 to 25 Years | 1,071 (89.7%) | 123 (10.3%) |
| 26 to 34 Years | 1,655 (92.5%) | 135 (7.5%) |
| 35 to 44 Years | 1,099 (96.6%) | 39 (3.4%) |
| 45 to 54 Years | 1,293 (96.4%) | 48 (3.6%) |
| 55 to 64 Years | 1,457 (98.9%) | 16 (1.1%) |
| 65 to 74 Years | 1,049 (100.0%) | 0 (0.0%) |
| 75 Years and older | 522 (100.0%) | 0 (0.0%) |
| Total | 10,193 (96.3%) | 387 (3.7%) |
Health Insurance Coverage by Citizenship Status in Corning
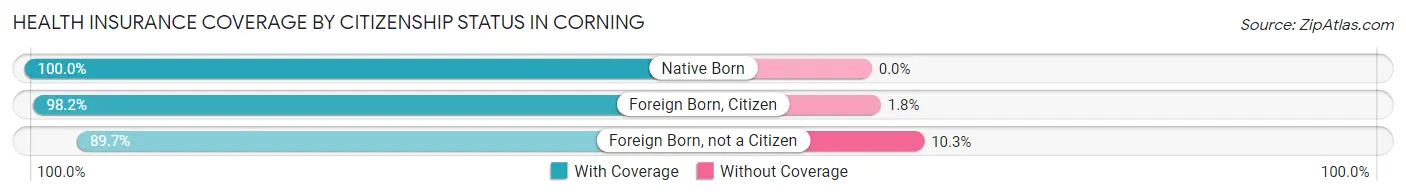
| Citizenship Status | With Coverage | Without Coverage |
| Native Born | 605 (100.0%) | 0 (0.0%) |
| Foreign Born, Citizen | 1,442 (98.2%) | 26 (1.8%) |
| Foreign Born, not a Citizen | 1,071 (89.7%) | 123 (10.3%) |
Health Insurance Coverage by Household Income in Corning
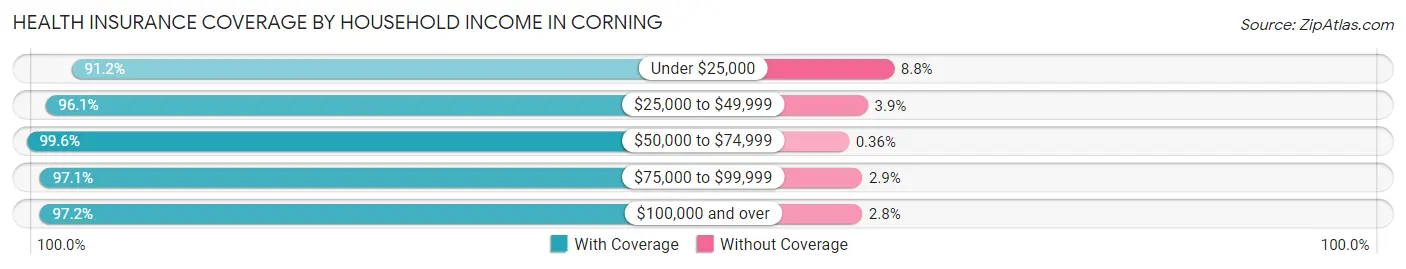
| Household Income | With Coverage | Without Coverage |
| Under $25,000 | 1,635 (91.2%) | 158 (8.8%) |
| $25,000 to $49,999 | 1,874 (96.1%) | 76 (3.9%) |
| $50,000 to $74,999 | 1,649 (99.6%) | 6 (0.4%) |
| $75,000 to $99,999 | 1,257 (97.1%) | 37 (2.9%) |
| $100,000 and over | 3,712 (97.2%) | 108 (2.8%) |
Public vs Private Health Insurance Coverage by Age in Corning
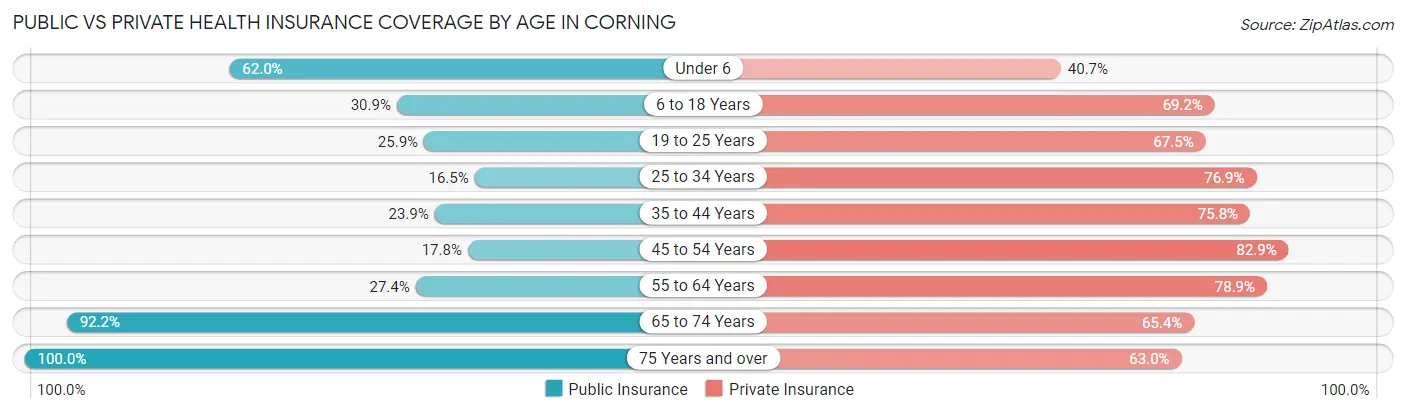
| Age Bracket | Public Insurance | Private Insurance |
| Under 6 | 375 (62.0%) | 246 (40.7%) |
| 6 to 18 Years | 454 (30.9%) | 1,016 (69.2%) |
| 19 to 25 Years | 309 (25.9%) | 806 (67.5%) |
| 25 to 34 Years | 295 (16.5%) | 1,377 (76.9%) |
| 35 to 44 Years | 272 (23.9%) | 862 (75.7%) |
| 45 to 54 Years | 238 (17.7%) | 1,112 (82.9%) |
| 55 to 64 Years | 404 (27.4%) | 1,162 (78.9%) |
| 65 to 74 Years | 967 (92.2%) | 686 (65.4%) |
| 75 Years and over | 522 (100.0%) | 329 (63.0%) |
| Total | 3,836 (36.3%) | 7,596 (71.8%) |
Disability Status by Sex by Age in Corning
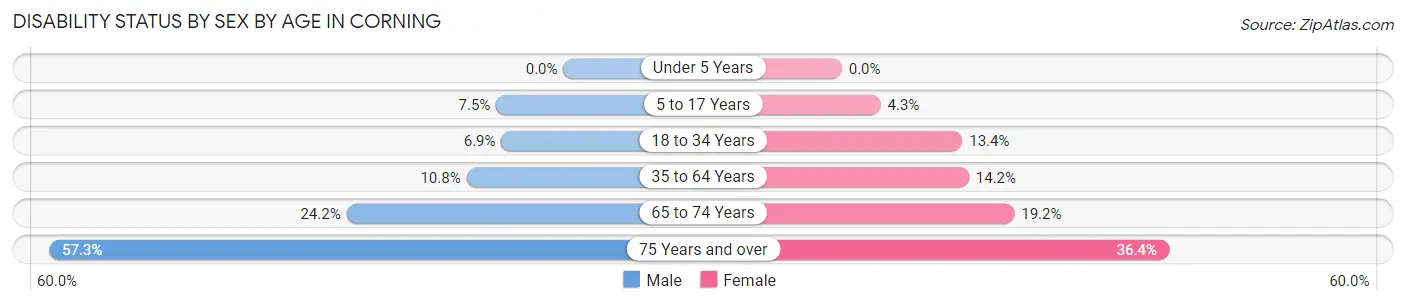
| Age Bracket | Male | Female |
| Under 5 Years | 0 (0.0%) | 0 (0.0%) |
| 5 to 17 Years | 59 (7.5%) | 30 (4.3%) |
| 18 to 34 Years | 109 (6.9%) | 196 (13.4%) |
| 35 to 64 Years | 203 (10.8%) | 293 (14.1%) |
| 65 to 74 Years | 100 (24.1%) | 122 (19.2%) |
| 75 Years and over | 126 (57.3%) | 110 (36.4%) |
Disability Class by Sex by Age in Corning
Disability Class: Hearing Difficulty
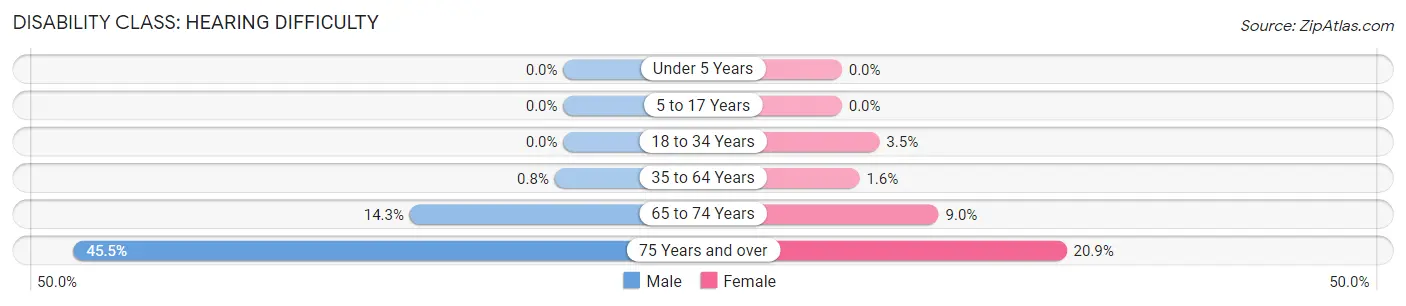
| Age Bracket | Male | Female |
| Under 5 Years | 0 (0.0%) | 0 (0.0%) |
| 5 to 17 Years | 0 (0.0%) | 0 (0.0%) |
| 18 to 34 Years | 0 (0.0%) | 51 (3.5%) |
| 35 to 64 Years | 15 (0.8%) | 34 (1.6%) |
| 65 to 74 Years | 59 (14.2%) | 57 (9.0%) |
| 75 Years and over | 100 (45.5%) | 63 (20.9%) |
Disability Class: Vision Difficulty
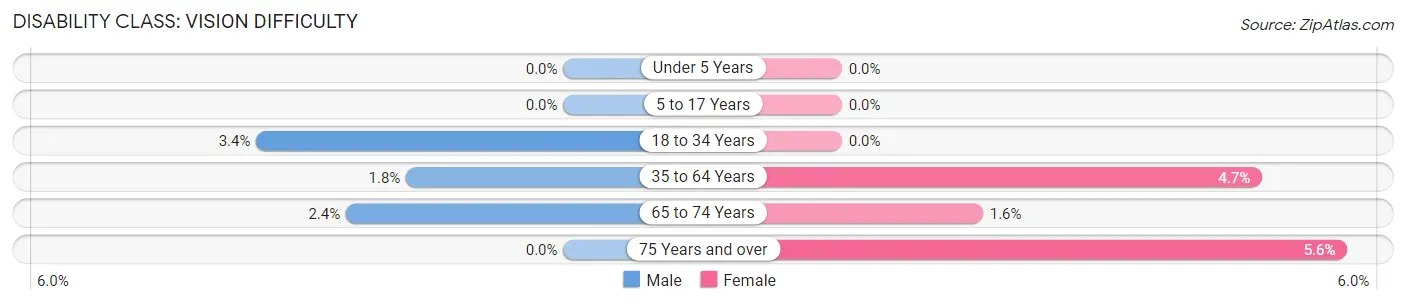
| Age Bracket | Male | Female |
| Under 5 Years | 0 (0.0%) | 0 (0.0%) |
| 5 to 17 Years | 0 (0.0%) | 0 (0.0%) |
| 18 to 34 Years | 54 (3.4%) | 0 (0.0%) |
| 35 to 64 Years | 33 (1.8%) | 97 (4.7%) |
| 65 to 74 Years | 10 (2.4%) | 10 (1.6%) |
| 75 Years and over | 0 (0.0%) | 17 (5.6%) |
Disability Class: Cognitive Difficulty
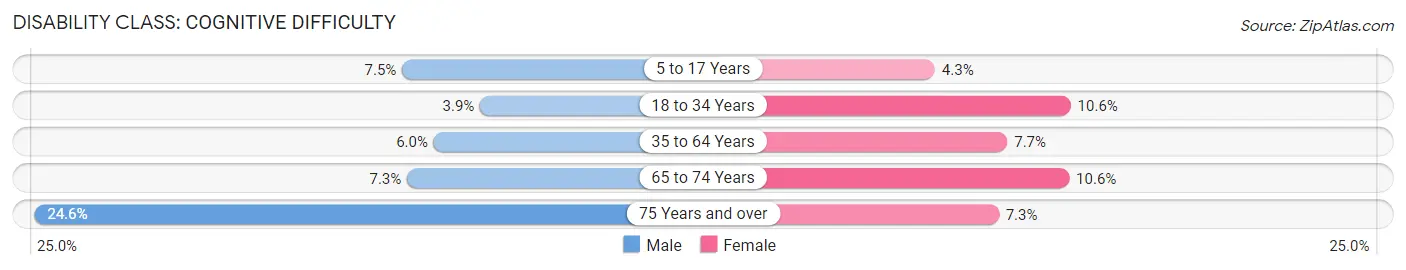
| Age Bracket | Male | Female |
| 5 to 17 Years | 59 (7.5%) | 30 (4.3%) |
| 18 to 34 Years | 61 (3.9%) | 155 (10.6%) |
| 35 to 64 Years | 113 (6.0%) | 159 (7.7%) |
| 65 to 74 Years | 30 (7.2%) | 67 (10.5%) |
| 75 Years and over | 54 (24.5%) | 22 (7.3%) |
Disability Class: Ambulatory Difficulty
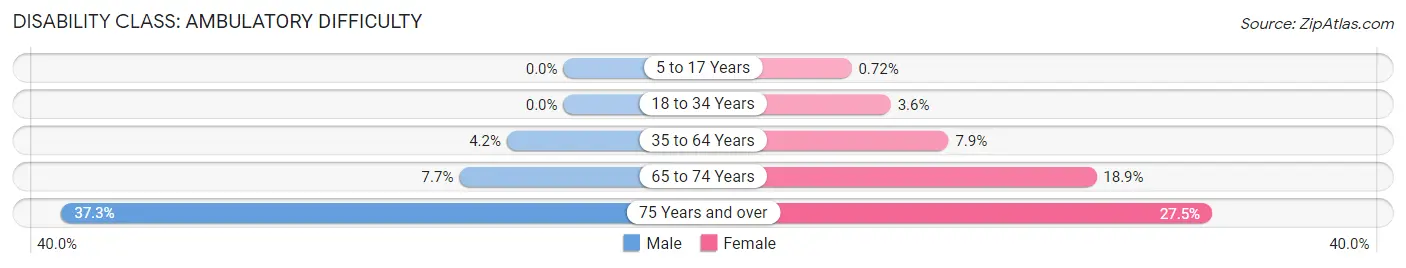
| Age Bracket | Male | Female |
| 5 to 17 Years | 0 (0.0%) | 5 (0.7%) |
| 18 to 34 Years | 0 (0.0%) | 53 (3.6%) |
| 35 to 64 Years | 79 (4.2%) | 164 (7.9%) |
| 65 to 74 Years | 32 (7.7%) | 120 (18.9%) |
| 75 Years and over | 82 (37.3%) | 83 (27.5%) |
Disability Class: Self-Care Difficulty
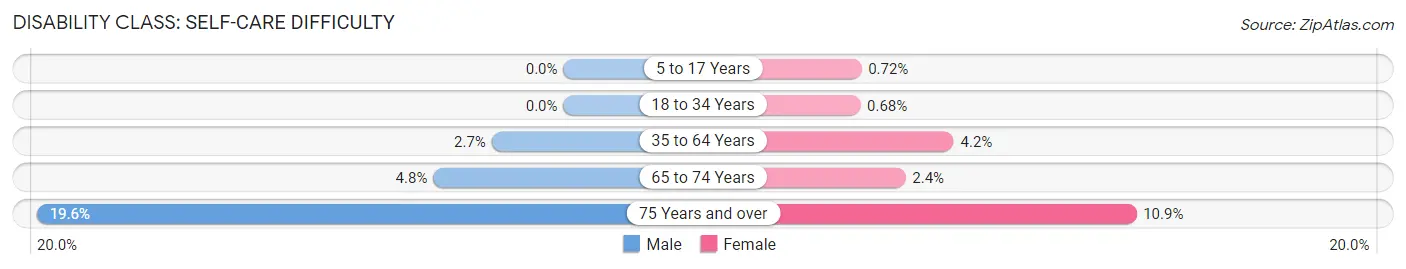
| Age Bracket | Male | Female |
| 5 to 17 Years | 0 (0.0%) | 5 (0.7%) |
| 18 to 34 Years | 0 (0.0%) | 10 (0.7%) |
| 35 to 64 Years | 50 (2.7%) | 86 (4.2%) |
| 65 to 74 Years | 20 (4.8%) | 15 (2.4%) |
| 75 Years and over | 43 (19.6%) | 33 (10.9%) |
Technology Access in Corning
Computing Device Access in Corning
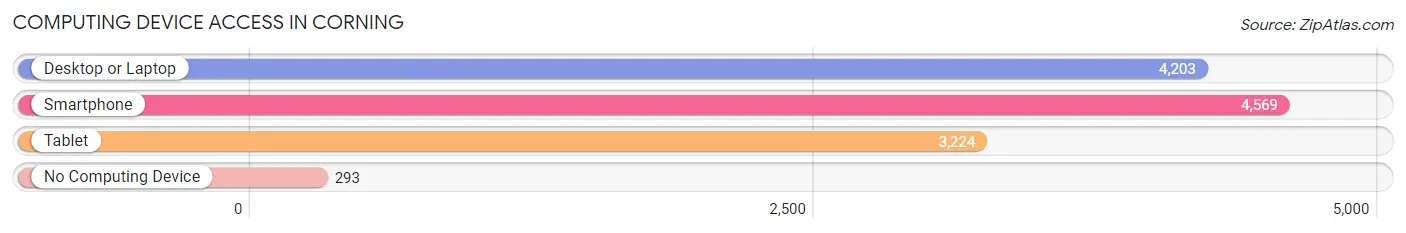
| Device Type | # Households | % Households |
| Desktop or Laptop | 4,203 | 79.5% |
| Smartphone | 4,569 | 86.5% |
| Tablet | 3,224 | 61.0% |
| No Computing Device | 293 | 5.6% |
| Total | 5,284 | 100.0% |
Internet Access in Corning
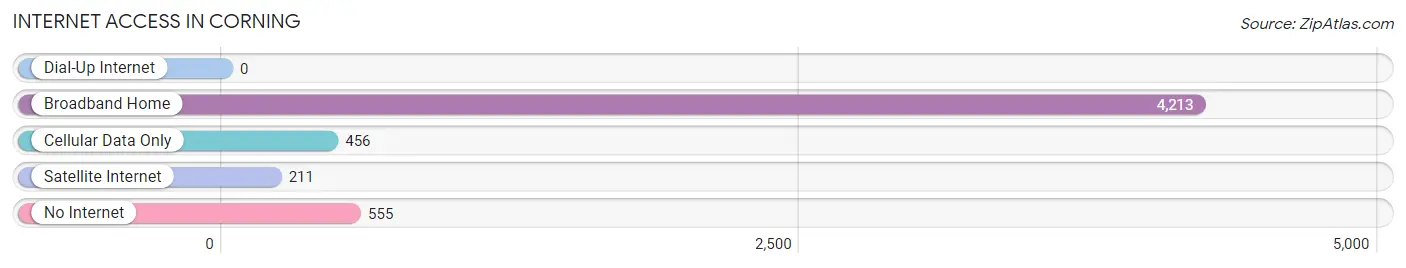
| Internet Type | # Households | % Households |
| Dial-Up Internet | 0 | 0.0% |
| Broadband Home | 4,213 | 79.7% |
| Cellular Data Only | 456 | 8.6% |
| Satellite Internet | 211 | 4.0% |
| No Internet | 555 | 10.5% |
| Total | 5,284 | 100.0% |
Corning Summary
Corning, New York is a city located in Steuben County, in the Southern Tier of New York State. It is situated on the Chemung River, approximately 30 miles south of Elmira and 50 miles east of the Finger Lakes region. The city is home to Corning Incorporated, a Fortune 500 company and the world’s leading manufacturer of glass and ceramic products.
History
The area that is now Corning was first settled in 1796 by Captain Ebenezer and Mary Ann (Horton) Corning, who were among the first settlers in the region. The city was officially incorporated in 1848 and was named after the Corning family.
In the late 19th century, Corning became a major center for glass production. The Corning Glass Works, now known as Corning Incorporated, was founded in 1851 and quickly became the largest glass manufacturer in the world. The company’s products, including Pyrex and CorningWare, are still widely used today.
Geography
Corning is located in the Southern Tier of New York State, approximately 30 miles south of Elmira and 50 miles east of the Finger Lakes region. The city is situated on the Chemung River, which flows through the city and is a major source of hydroelectric power. The city is surrounded by rolling hills and is located in a valley between the Allegheny and Catskill Mountains.
The city has a total area of 8.2 square miles, of which 8.1 square miles is land and 0.1 square miles is water. The city is located in a humid continental climate zone, with cold winters and hot, humid summers.
Economy
Corning’s economy is largely driven by Corning Incorporated, the world’s leading manufacturer of glass and ceramic products. The company is a Fortune 500 company and is the largest employer in the city, with over 10,000 employees. Other major employers in the city include Corning Community College, Corning Hospital, and Corning-Painted Post School District.
The city is also home to several small businesses, including restaurants, retail stores, and professional services. The city is also home to several wineries and breweries, as well as a number of tourist attractions, including the Corning Museum of Glass and the Rockwell Museum.
Demographics
As of the 2010 census, the city had a population of 11,183. The population is predominantly white (90.2%), with a small percentage of African Americans (3.2%), Asians (2.2%), and Hispanics (2.1%). The median household income is $41,945, and the median age is 40.
The city is home to several educational institutions, including Corning Community College, Corning-Painted Post School District, and Elmira College. The city is also home to several churches, including the First Presbyterian Church, St. Mary’s Catholic Church, and the Corning Unitarian Universalist Church.
Conclusion
Corning, New York is a city located in Steuben County, in the Southern Tier of New York State. It is situated on the Chemung River, approximately 30 miles south of Elmira and 50 miles east of the Finger Lakes region. The city is home to Corning Incorporated, a Fortune 500 company and the world’s leading manufacturer of glass and ceramic products. The city has a population of 11,183, with a median household income of $41,945 and a median age of 40. The city is home to several educational institutions, churches, and tourist attractions, as well as a number of small businesses.
Common Questions
What is Per Capita Income in Corning?
Per Capita income in Corning is $41,672.
What is the Median Family Income in Corning?
Median Family Income in Corning is $89,643.
What is the Median Household income in Corning?
Median Household Income in Corning is $59,453.
What is Income or Wage Gap in Corning?
Income or Wage Gap in Corning is 45.2%.
Women in Corning earn 54.8 cents for every dollar earned by a man.
What is Inequality or Gini Index in Corning?
Inequality or Gini Index in Corning is 0.50.
What is the Total Population of Corning?
Total Population of Corning is 10,685.
What is the Total Male Population of Corning?
Total Male Population of Corning is 5,097.
What is the Total Female Population of Corning?
Total Female Population of Corning is 5,588.
What is the Ratio of Males per 100 Females in Corning?
There are 91.21 Males per 100 Females in Corning.
What is the Ratio of Females per 100 Males in Corning?
There are 109.63 Females per 100 Males in Corning.
What is the Median Population Age in Corning?
Median Population Age in Corning is 37.1 Years.
What is the Average Family Size in Corning
Average Family Size in Corning is 2.7 People.
What is the Average Household Size in Corning
Average Household Size in Corning is 2.0 People.
How Large is the Labor Force in Corning?
There are 5,873 People in the Labor Forcein in Corning.
What is the Percentage of People in the Labor Force in Corning?
66.6% of People are in the Labor Force in Corning.
What is the Unemployment Rate in Corning?
Unemployment Rate in Corning is 6.8%.