Mariaville Lake, NY Map & Demographics
Mariaville Lake Map
Mariaville Lake Overview
$54,378
PER CAPITA INCOME
$181,154
AVG FAMILY INCOME
41.4%
WAGE / INCOME GAP [ % ]
58.6¢/ $1
WAGE / INCOME GAP [ $ ]
0.51
INEQUALITY / GINI INDEX
779
TOTAL POPULATION
439
MALE POPULATION
340
FEMALE POPULATION
129.12
MALES / 100 FEMALES
77.45
FEMALES / 100 MALES
54.3
MEDIAN AGE
2.9
AVG FAMILY SIZE
2.0
AVG HOUSEHOLD SIZE
439
LABOR FORCE [ PEOPLE ]
63.4%
PERCENT IN LABOR FORCE
Income in Mariaville Lake
Income Overview in Mariaville Lake
| Characteristic | Number | Measure |
| Per Capita Income | 779 | $54,378 |
| Median Family Income | 178 | $181,154 |
| Mean Family Income | 178 | $173,600 |
| Median Household Income | 392 | $0 |
| Mean Household Income | 392 | $108,411 |
| Income Deficit | 178 | $0 |
| Wage / Income Gap (%) | 779 | 41.44% |
| Wage / Income Gap ($) | 779 | 58.56¢ per $1 |
| Gini / Inequality Index | 779 | 0.51 |
Earnings by Sex in Mariaville Lake
Average Earnings in Mariaville Lake are $56,641, $84,615 for men and $49,554 for women, a difference of 41.4%.
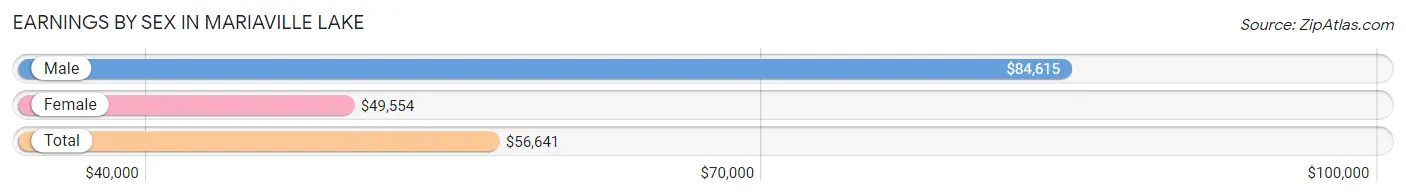
| Sex | Number | Average Earnings |
| Male | 192 (43.7%) | $84,615 |
| Female | 247 (56.3%) | $49,554 |
| Total | 439 (100.0%) | $56,641 |
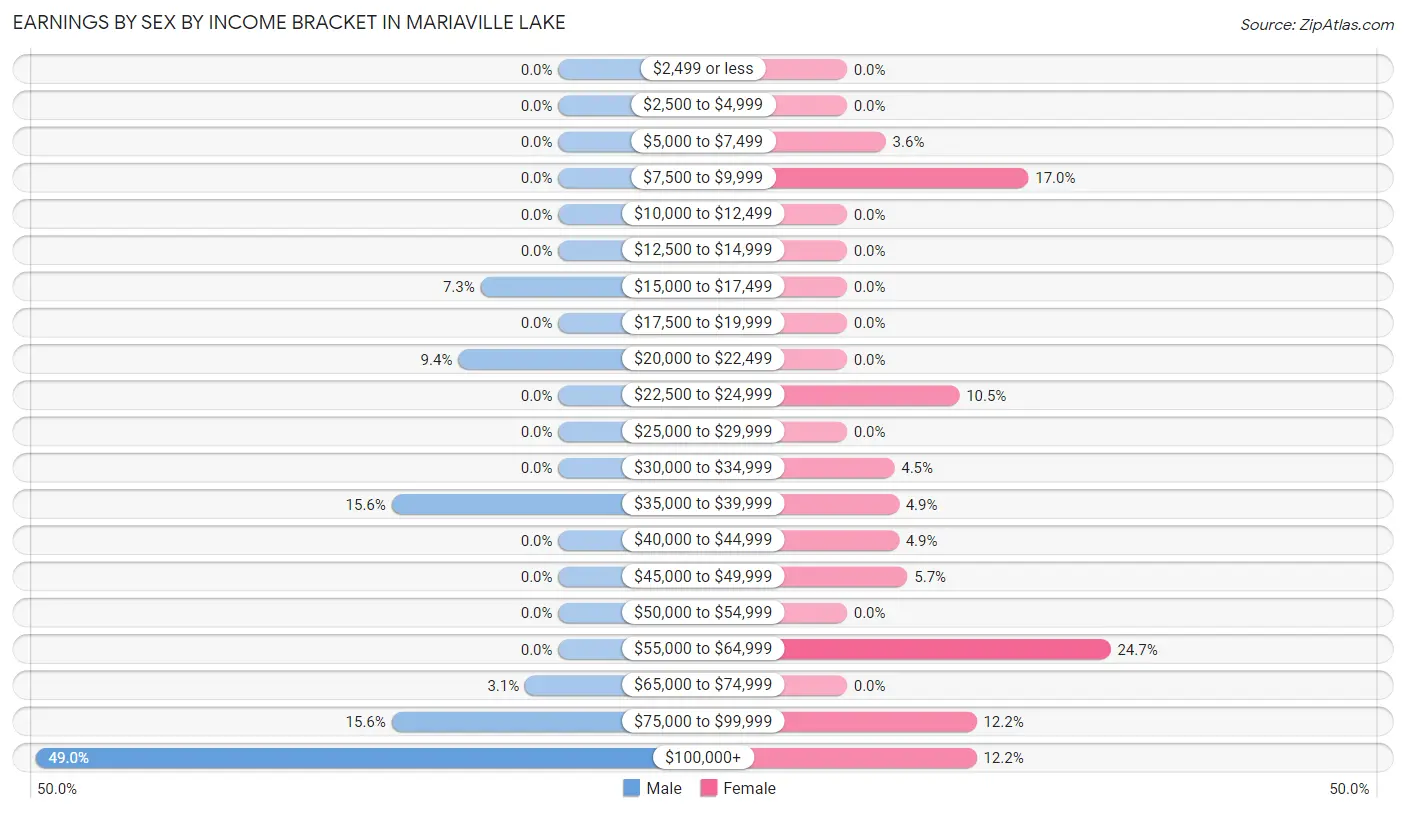
Earnings by Sex by Income Bracket in Mariaville Lake
The most common earnings brackets in Mariaville Lake are $100,000+ for men (94 | 49.0%) and $55,000 to $64,999 for women (61 | 24.7%).
| Income | Male | Female |
| $2,499 or less | 0 (0.0%) | 0 (0.0%) |
| $2,500 to $4,999 | 0 (0.0%) | 0 (0.0%) |
| $5,000 to $7,499 | 0 (0.0%) | 9 (3.6%) |
| $7,500 to $9,999 | 0 (0.0%) | 42 (17.0%) |
| $10,000 to $12,499 | 0 (0.0%) | 0 (0.0%) |
| $12,500 to $14,999 | 0 (0.0%) | 0 (0.0%) |
| $15,000 to $17,499 | 14 (7.3%) | 0 (0.0%) |
| $17,500 to $19,999 | 0 (0.0%) | 0 (0.0%) |
| $20,000 to $22,499 | 18 (9.4%) | 0 (0.0%) |
| $22,500 to $24,999 | 0 (0.0%) | 26 (10.5%) |
| $25,000 to $29,999 | 0 (0.0%) | 0 (0.0%) |
| $30,000 to $34,999 | 0 (0.0%) | 11 (4.4%) |
| $35,000 to $39,999 | 30 (15.6%) | 12 (4.9%) |
| $40,000 to $44,999 | 0 (0.0%) | 12 (4.9%) |
| $45,000 to $49,999 | 0 (0.0%) | 14 (5.7%) |
| $50,000 to $54,999 | 0 (0.0%) | 0 (0.0%) |
| $55,000 to $64,999 | 0 (0.0%) | 61 (24.7%) |
| $65,000 to $74,999 | 6 (3.1%) | 0 (0.0%) |
| $75,000 to $99,999 | 30 (15.6%) | 30 (12.1%) |
| $100,000+ | 94 (49.0%) | 30 (12.1%) |
| Total | 192 (100.0%) | 247 (100.0%) |
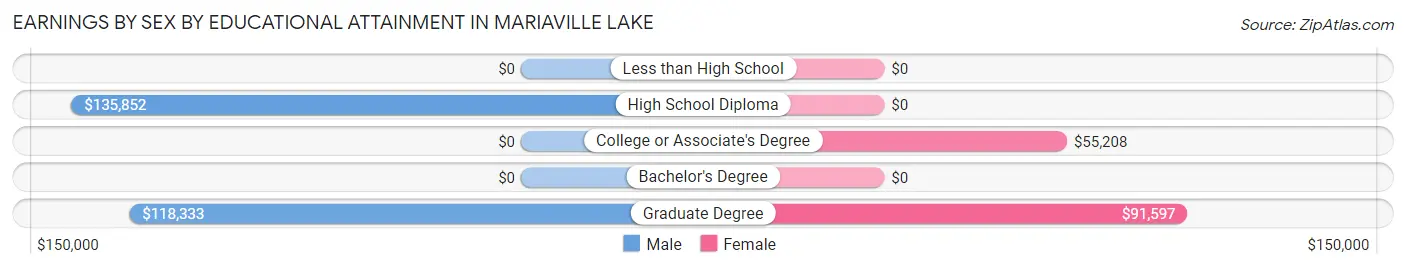
Earnings by Sex by Educational Attainment in Mariaville Lake
Average earnings in Mariaville Lake are $123,281 for men and $49,554 for women, a difference of 59.8%. Men with an educational attainment of high school diploma enjoy the highest average annual earnings of $135,852, while those with graduate degree education earn the least with $118,333. Women with an educational attainment of graduate degree earn the most with the average annual earnings of $91,597, while those with college or associate's degree education have the smallest earnings of $55,208.
| Educational Attainment | Male Income | Female Income |
| Less than High School | - | - |
| High School Diploma | $135,852 | $0 |
| College or Associate's Degree | - | - |
| Bachelor's Degree | - | - |
| Graduate Degree | $118,333 | $91,597 |
| Total | $123,281 | $49,554 |
Family Income in Mariaville Lake
Family Income Brackets in Mariaville Lake
According to the Mariaville Lake family income data, there are 82 families falling into the $200,000+ income range, which is the most common income bracket and makes up 46.1% of all families.
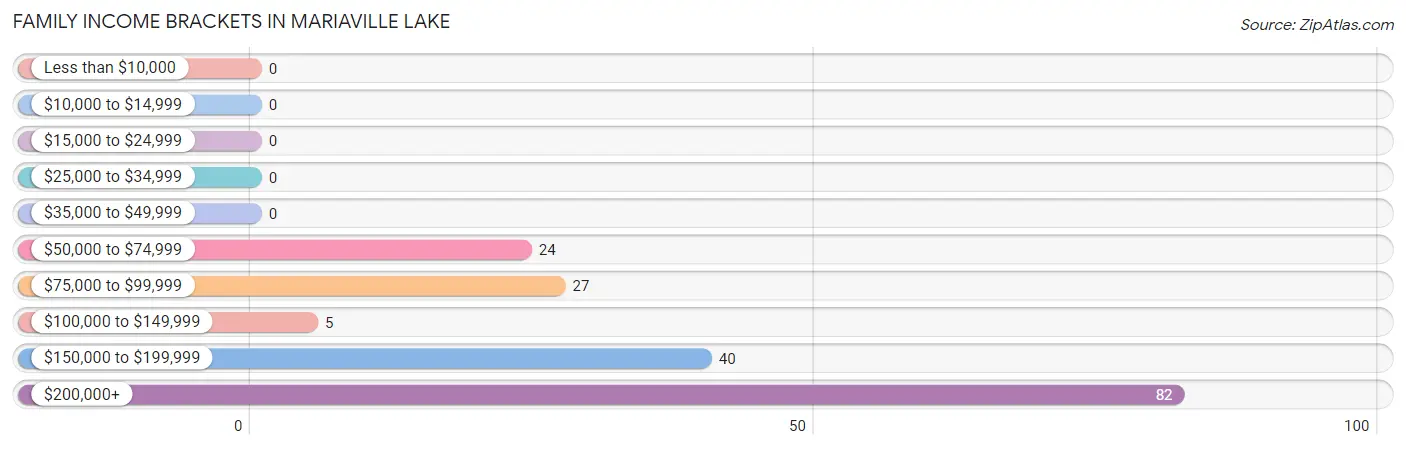
| Income Bracket | # Families | % Families |
| Less than $10,000 | 0 | 0.0% |
| $10,000 to $14,999 | 0 | 0.0% |
| $15,000 to $24,999 | 0 | 0.0% |
| $25,000 to $34,999 | 0 | 0.0% |
| $35,000 to $49,999 | 0 | 0.0% |
| $50,000 to $74,999 | 24 | 13.5% |
| $75,000 to $99,999 | 27 | 15.2% |
| $100,000 to $149,999 | 5 | 2.8% |
| $150,000 to $199,999 | 40 | 22.5% |
| $200,000+ | 82 | 46.1% |
Family Income by Famaliy Size in Mariaville Lake
4-person families (69 | 38.8%) account for the highest median family income in Mariaville Lake with $200,540 per family, while 2-person families (98 | 55.1%) have the highest median income of $90,192 per family member.
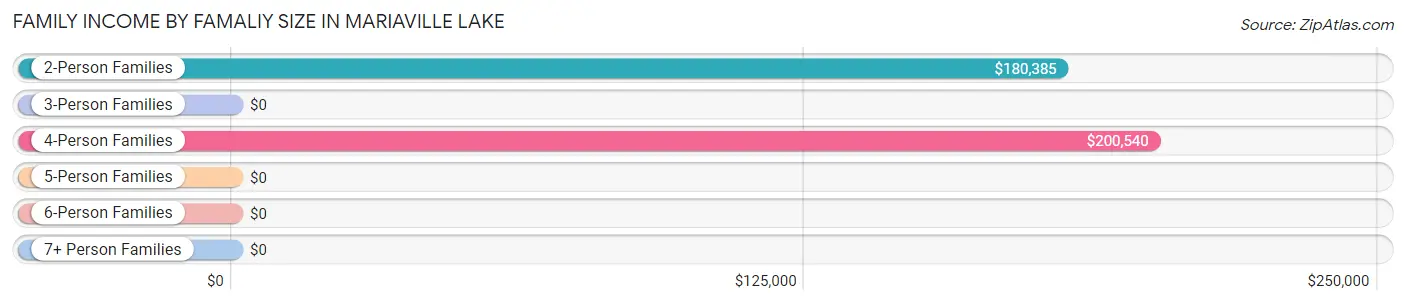
| Income Bracket | # Families | Median Income |
| 2-Person Families | 98 (55.1%) | $180,385 |
| 3-Person Families | 11 (6.2%) | $0 |
| 4-Person Families | 69 (38.8%) | $200,540 |
| 5-Person Families | 0 (0.0%) | $0 |
| 6-Person Families | 0 (0.0%) | $0 |
| 7+ Person Families | 0 (0.0%) | $0 |
| Total | 178 (100.0%) | $181,154 |
Family Income by Number of Earners in Mariaville Lake
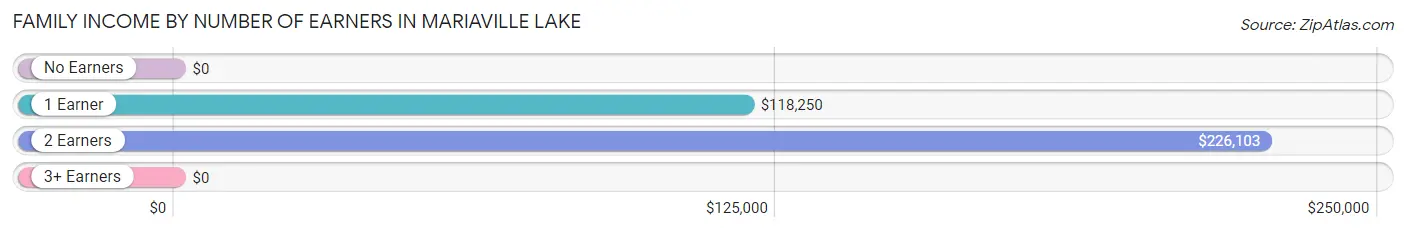
| Number of Earners | # Families | Median Income |
| No Earners | 18 (10.1%) | $0 |
| 1 Earner | 57 (32.0%) | $118,250 |
| 2 Earners | 51 (28.6%) | $226,103 |
| 3+ Earners | 52 (29.2%) | $0 |
| Total | 178 (100.0%) | $181,154 |
Household Income in Mariaville Lake
Household Income Brackets in Mariaville Lake
With 121 households falling in the category, the less than $10,000 income range is the most frequent in Mariaville Lake, accounting for 30.9% of all households.
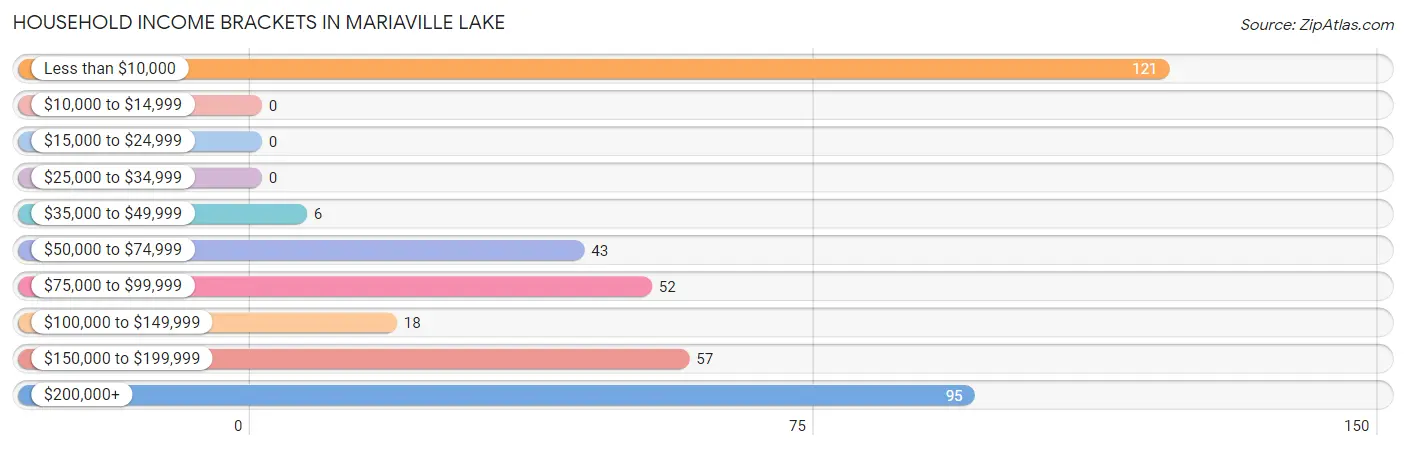
| Income Bracket | # Households | % Households |
| Less than $10,000 | 121 | 30.9% |
| $10,000 to $14,999 | 0 | 0.0% |
| $15,000 to $24,999 | 0 | 0.0% |
| $25,000 to $34,999 | 0 | 0.0% |
| $35,000 to $49,999 | 6 | 1.5% |
| $50,000 to $74,999 | 43 | 11.0% |
| $75,000 to $99,999 | 52 | 13.3% |
| $100,000 to $149,999 | 18 | 4.6% |
| $150,000 to $199,999 | 57 | 14.5% |
| $200,000+ | 95 | 24.2% |
Household Income by Householder Age in Mariaville Lake
The median household income in Mariaville Lake is $0, with the highest median household income of $171,324 found in the 25 to 44 years age bracket for the primary householder. A total of 76 households (19.4%) fall into this category.
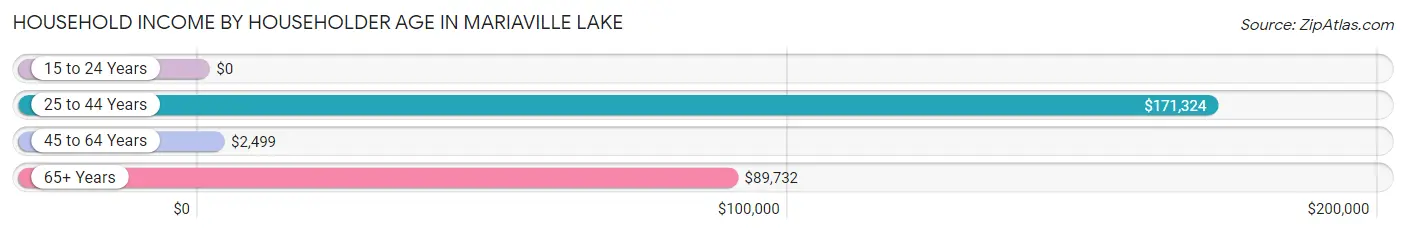
| Income Bracket | # Households | Median Income |
| 15 to 24 Years | 0 (0.0%) | $0 |
| 25 to 44 Years | 76 (19.4%) | $171,324 |
| 45 to 64 Years | 227 (57.9%) | $2,499 |
| 65+ Years | 89 (22.7%) | $89,732 |
| Total | 392 (100.0%) | $0 |
Poverty in Mariaville Lake
Income Below Poverty by Sex and Age in Mariaville Lake
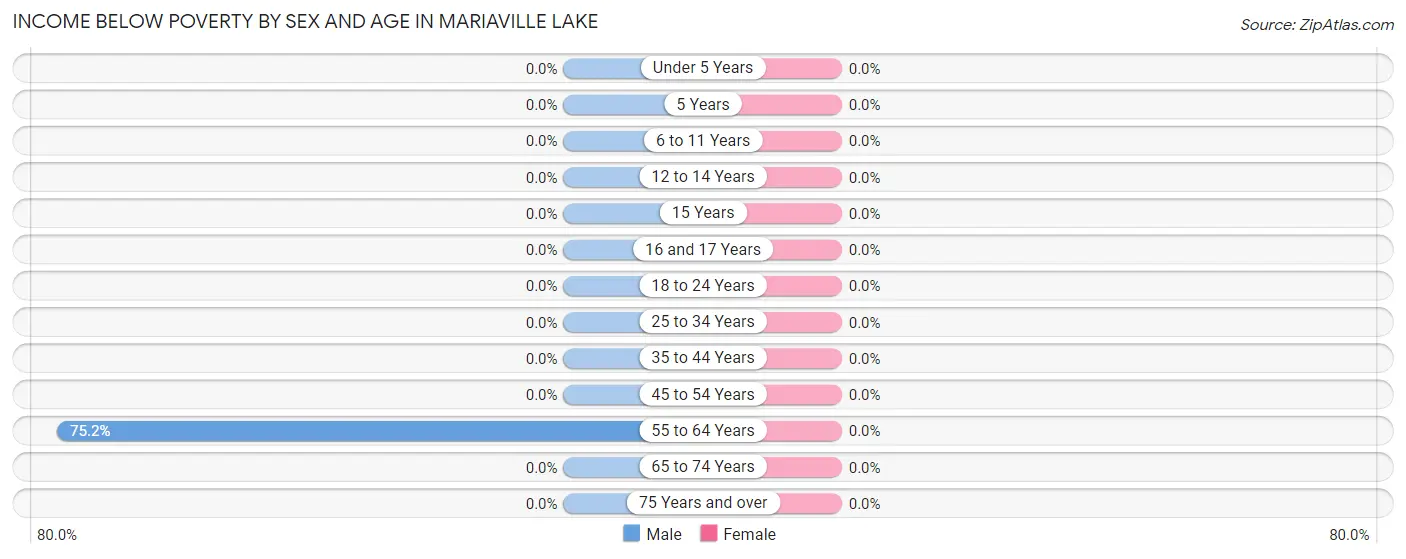
| Age Bracket | Male | Female |
| Under 5 Years | 0 (0.0%) | 0 (0.0%) |
| 5 Years | 0 (0.0%) | 0 (0.0%) |
| 6 to 11 Years | 0 (0.0%) | 0 (0.0%) |
| 12 to 14 Years | 0 (0.0%) | 0 (0.0%) |
| 15 Years | 0 (0.0%) | 0 (0.0%) |
| 16 and 17 Years | 0 (0.0%) | 0 (0.0%) |
| 18 to 24 Years | 0 (0.0%) | 0 (0.0%) |
| 25 to 34 Years | 0 (0.0%) | 0 (0.0%) |
| 35 to 44 Years | 0 (0.0%) | 0 (0.0%) |
| 45 to 54 Years | 0 (0.0%) | 0 (0.0%) |
| 55 to 64 Years | 121 (75.2%) | 0 (0.0%) |
| 65 to 74 Years | 0 (0.0%) | 0 (0.0%) |
| 75 Years and over | 0 (0.0%) | 0 (0.0%) |
| Total | 121 (27.6%) | 0 (0.0%) |
Income Above Poverty by Sex and Age in Mariaville Lake
According to the poverty statistics in Mariaville Lake, males aged 5 years and females aged 6 to 11 years are the age groups that are most secure financially, with 100.0% of males and 100.0% of females in these age groups living above the poverty line.
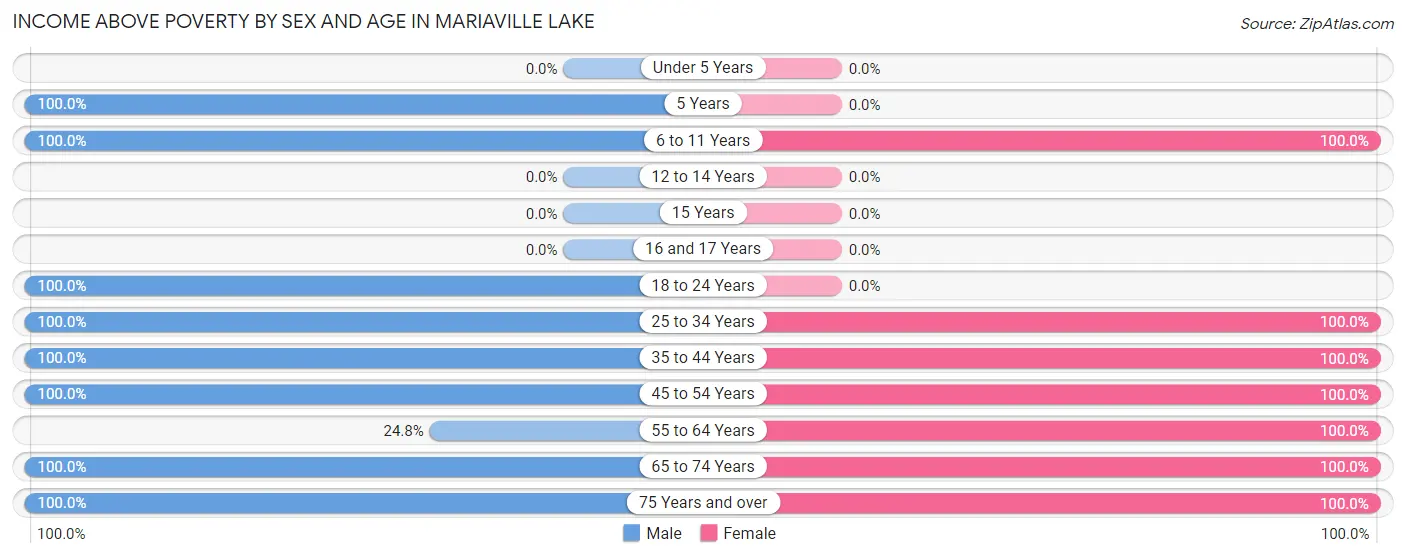
| Age Bracket | Male | Female |
| Under 5 Years | 0 (0.0%) | 0 (0.0%) |
| 5 Years | 44 (100.0%) | 0 (0.0%) |
| 6 to 11 Years | 6 (100.0%) | 37 (100.0%) |
| 12 to 14 Years | 0 (0.0%) | 0 (0.0%) |
| 15 Years | 0 (0.0%) | 0 (0.0%) |
| 16 and 17 Years | 0 (0.0%) | 0 (0.0%) |
| 18 to 24 Years | 33 (100.0%) | 0 (0.0%) |
| 25 to 34 Years | 31 (100.0%) | 89 (100.0%) |
| 35 to 44 Years | 35 (100.0%) | 51 (100.0%) |
| 45 to 54 Years | 65 (100.0%) | 40 (100.0%) |
| 55 to 64 Years | 40 (24.8%) | 55 (100.0%) |
| 65 to 74 Years | 47 (100.0%) | 42 (100.0%) |
| 75 Years and over | 17 (100.0%) | 26 (100.0%) |
| Total | 318 (72.4%) | 340 (100.0%) |
Income Below Poverty Among Married-Couple Families in Mariaville Lake
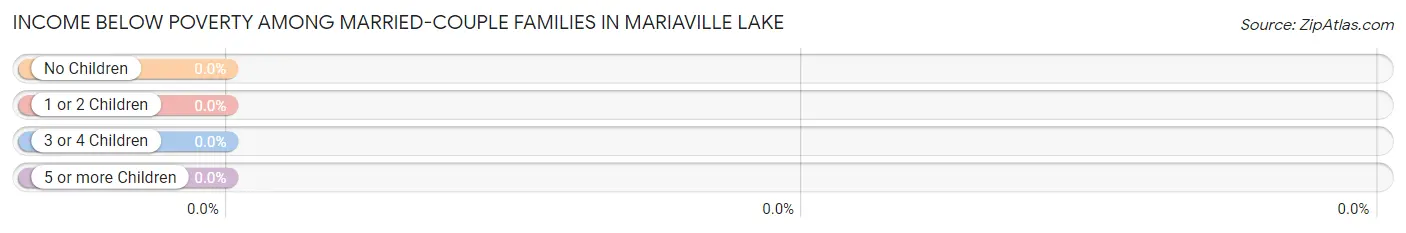
| Children | Above Poverty | Below Poverty |
| No Children | 117 (100.0%) | 0 (0.0%) |
| 1 or 2 Children | 61 (100.0%) | 0 (0.0%) |
| 3 or 4 Children | 0 (0.0%) | 0 (0.0%) |
| 5 or more Children | 0 (0.0%) | 0 (0.0%) |
| Total | 178 (100.0%) | 0 (0.0%) |
Income Below Poverty Among Single-Parent Households in Mariaville Lake
| Children | Single Father | Single Mother |
| No Children | 0 (0.0%) | 0 (0.0%) |
| 1 or 2 Children | 0 (0.0%) | 0 (0.0%) |
| 3 or 4 Children | 0 (0.0%) | 0 (0.0%) |
| 5 or more Children | 0 (0.0%) | 0 (0.0%) |
| Total | 0 (0.0%) | 0 (0.0%) |
Income Below Poverty Among Married-Couple vs Single-Parent Households in Mariaville Lake
| Children | Married-Couple Families | Single-Parent Households |
| No Children | 0 (0.0%) | 0 (0.0%) |
| 1 or 2 Children | 0 (0.0%) | 0 (0.0%) |
| 3 or 4 Children | 0 (0.0%) | 0 (0.0%) |
| 5 or more Children | 0 (0.0%) | 0 (0.0%) |
| Total | 0 (0.0%) | 0 (0.0%) |
Race in Mariaville Lake
The most populous races in Mariaville Lake are White / Caucasian (753 | 96.7%), Black / African American (13 | 1.7%), and Two or more Races (13 | 1.7%).
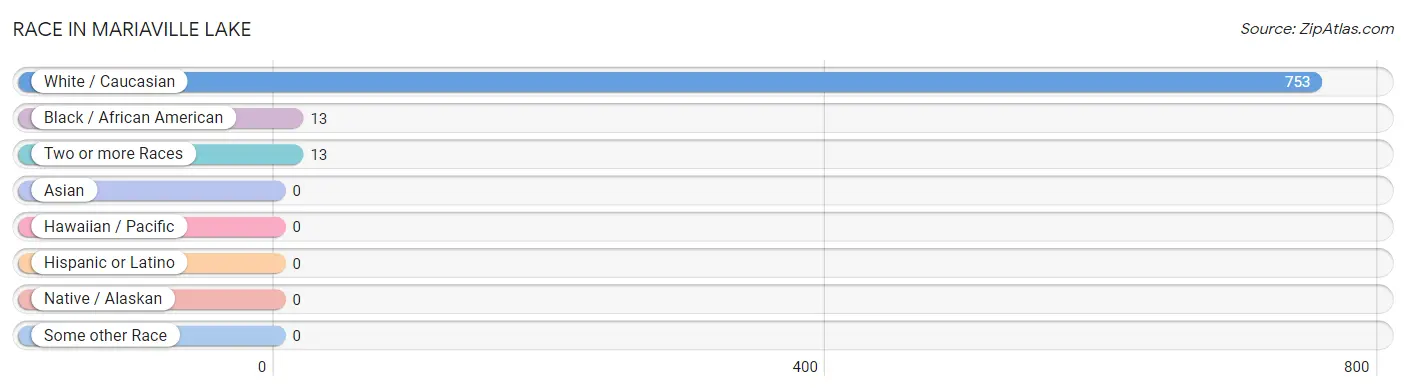
| Race | # Population | % Population |
| Asian | 0 | 0.0% |
| Black / African American | 13 | 1.7% |
| Hawaiian / Pacific | 0 | 0.0% |
| Hispanic or Latino | 0 | 0.0% |
| Native / Alaskan | 0 | 0.0% |
| White / Caucasian | 753 | 96.7% |
| Two or more Races | 13 | 1.7% |
| Some other Race | 0 | 0.0% |
| Total | 779 | 100.0% |
Ancestry in Mariaville Lake
The most populous ancestries reported in Mariaville Lake are Irish (185 | 23.7%), English (179 | 23.0%), Italian (150 | 19.3%), American (130 | 16.7%), and German (120 | 15.4%), together accounting for 98.1% of all Mariaville Lake residents.
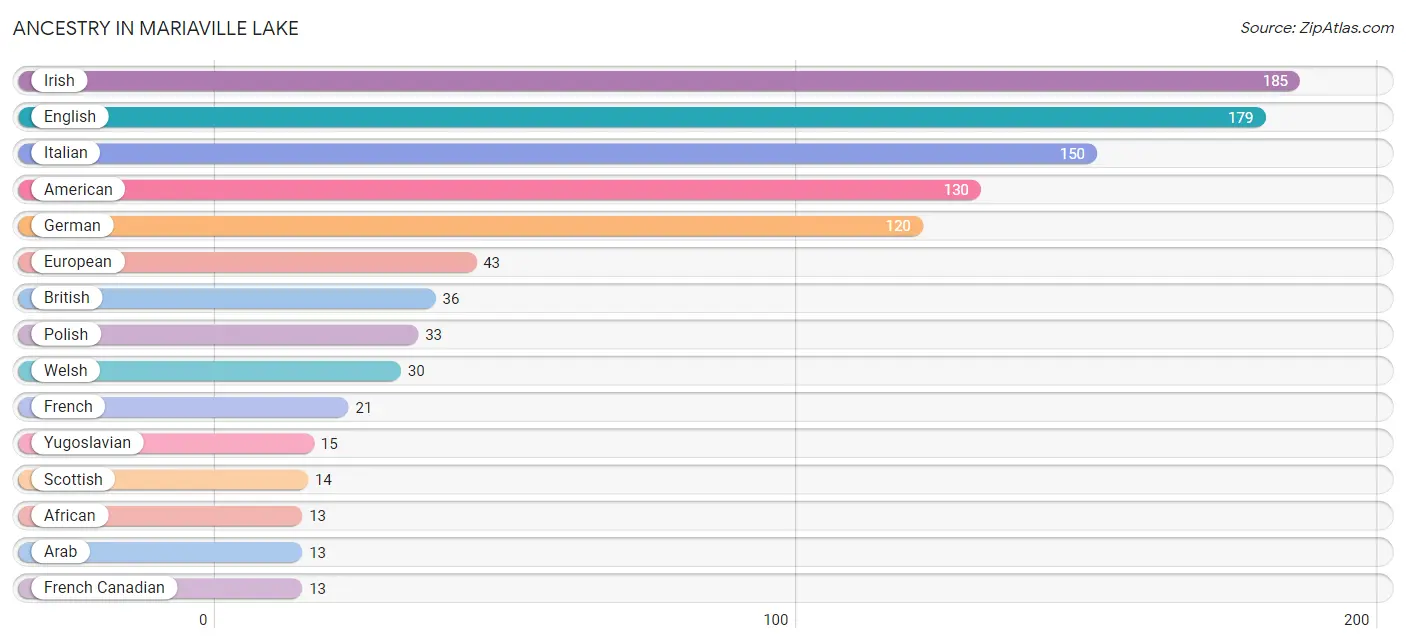
| Ancestry | # Population | % Population |
| African | 13 | 1.7% |
| American | 130 | 16.7% |
| Arab | 13 | 1.7% |
| British | 36 | 4.6% |
| Dutch | 4 | 0.5% |
| English | 179 | 23.0% |
| European | 43 | 5.5% |
| French | 21 | 2.7% |
| French Canadian | 13 | 1.7% |
| German | 120 | 15.4% |
| Irish | 185 | 23.7% |
| Italian | 150 | 19.3% |
| Lebanese | 13 | 1.7% |
| Polish | 33 | 4.2% |
| Scottish | 14 | 1.8% |
| Subsaharan African | 13 | 1.7% |
| Welsh | 30 | 3.8% |
| Yugoslavian | 15 | 1.9% | View All 18 Rows |
Immigrants in Mariaville Lake

| Immigration Origin | # Population | % Population | View All 0 Rows |
Sex and Age in Mariaville Lake
Sex and Age in Mariaville Lake
The most populous age groups in Mariaville Lake are 55 to 59 Years (161 | 36.7%) for men and 30 to 34 Years (66 | 19.4%) for women.
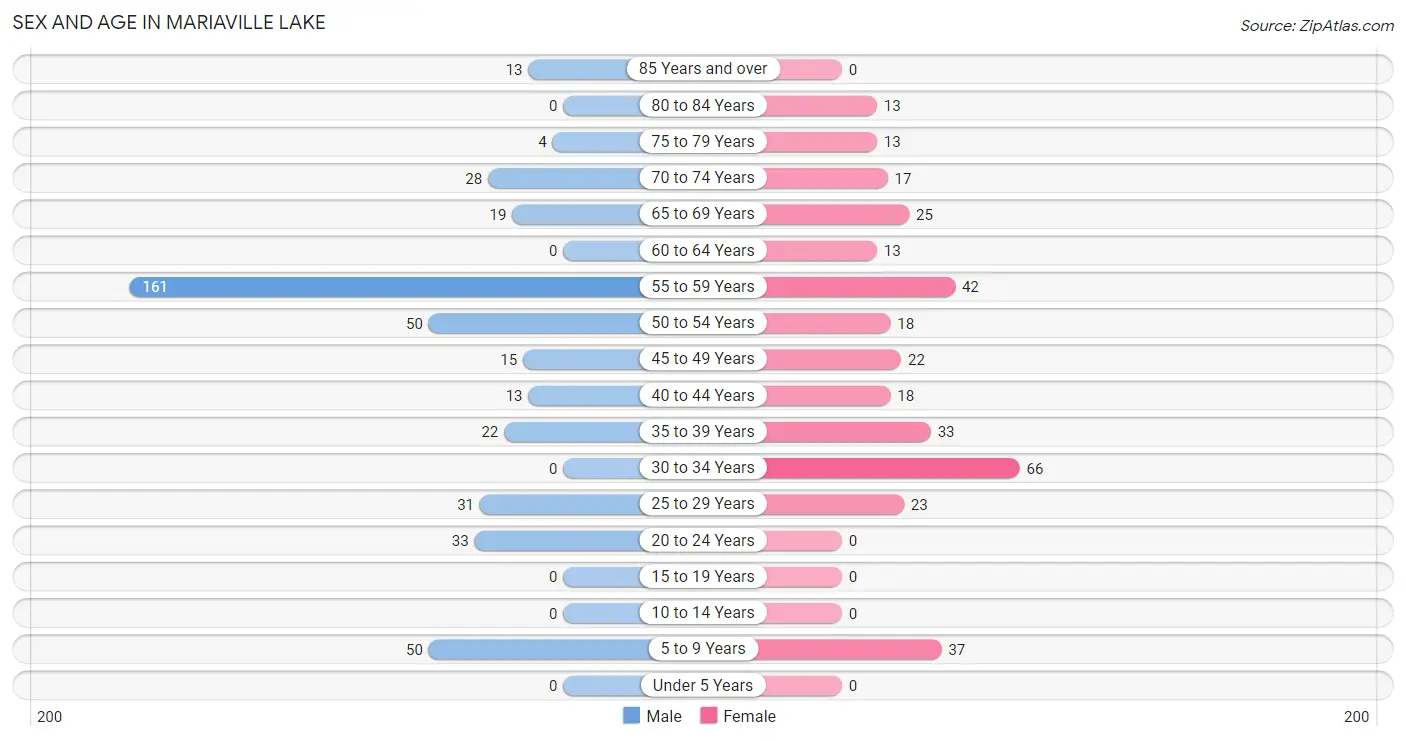
| Age Bracket | Male | Female |
| Under 5 Years | 0 (0.0%) | 0 (0.0%) |
| 5 to 9 Years | 50 (11.4%) | 37 (10.9%) |
| 10 to 14 Years | 0 (0.0%) | 0 (0.0%) |
| 15 to 19 Years | 0 (0.0%) | 0 (0.0%) |
| 20 to 24 Years | 33 (7.5%) | 0 (0.0%) |
| 25 to 29 Years | 31 (7.1%) | 23 (6.8%) |
| 30 to 34 Years | 0 (0.0%) | 66 (19.4%) |
| 35 to 39 Years | 22 (5.0%) | 33 (9.7%) |
| 40 to 44 Years | 13 (3.0%) | 18 (5.3%) |
| 45 to 49 Years | 15 (3.4%) | 22 (6.5%) |
| 50 to 54 Years | 50 (11.4%) | 18 (5.3%) |
| 55 to 59 Years | 161 (36.7%) | 42 (12.3%) |
| 60 to 64 Years | 0 (0.0%) | 13 (3.8%) |
| 65 to 69 Years | 19 (4.3%) | 25 (7.3%) |
| 70 to 74 Years | 28 (6.4%) | 17 (5.0%) |
| 75 to 79 Years | 4 (0.9%) | 13 (3.8%) |
| 80 to 84 Years | 0 (0.0%) | 13 (3.8%) |
| 85 Years and over | 13 (3.0%) | 0 (0.0%) |
| Total | 439 (100.0%) | 340 (100.0%) |
Families and Households in Mariaville Lake
Median Family Size in Mariaville Lake
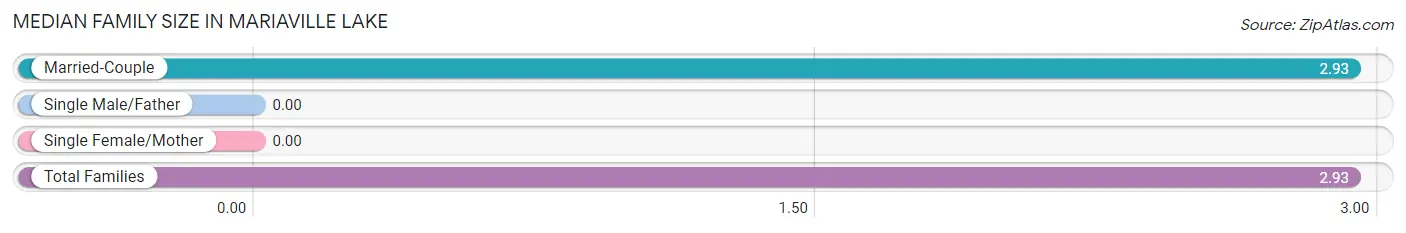
| Family Type | # Families | Family Size |
| Married-Couple | 178 (100.0%) | 2.93 |
| Single Male/Father | 0 (0.0%) | - |
| Single Female/Mother | 0 (0.0%) | - |
| Total Families | 178 (100.0%) | 2.93 |
Median Household Size in Mariaville Lake
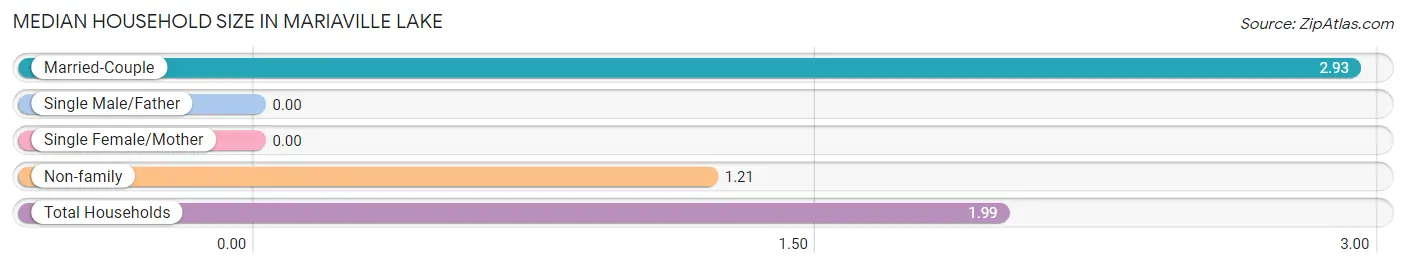
| Household Type | # Households | Household Size |
| Married-Couple | 178 (45.4%) | 2.93 |
| Single Male/Father | 0 (0.0%) | - |
| Single Female/Mother | 0 (0.0%) | - |
| Non-family | 214 (54.6%) | 1.21 |
| Total Households | 392 (100.0%) | 1.99 |
Household Size by Marriage Status in Mariaville Lake
Out of a total of 392 households in Mariaville Lake, 178 (45.4%) are family households, while 214 (54.6%) are nonfamily households. The most numerous type of family households are 2-person households, comprising 98, and the most common type of nonfamily households are 1-person households, comprising 171.
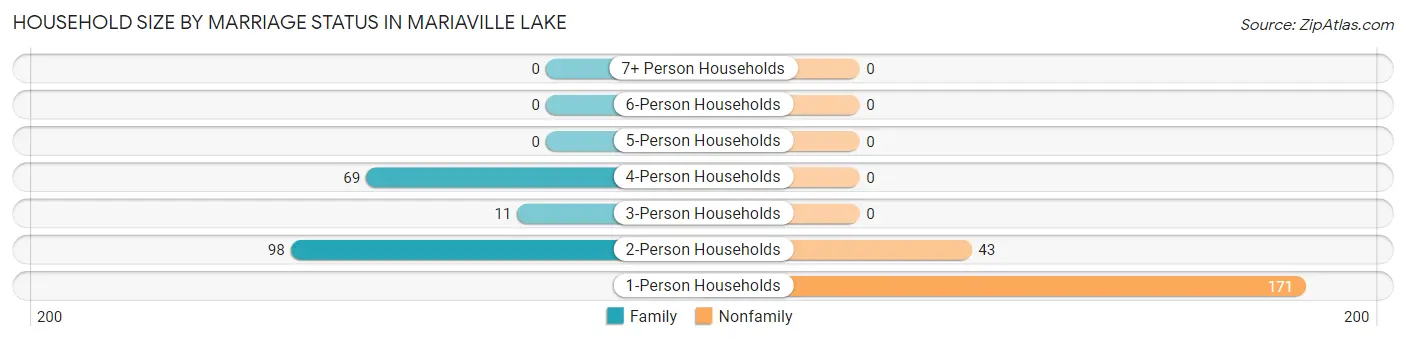
| Household Size | Family Households | Nonfamily Households |
| 1-Person Households | - | 171 (43.6%) |
| 2-Person Households | 98 (25.0%) | 43 (11.0%) |
| 3-Person Households | 11 (2.8%) | 0 (0.0%) |
| 4-Person Households | 69 (17.6%) | 0 (0.0%) |
| 5-Person Households | 0 (0.0%) | 0 (0.0%) |
| 6-Person Households | 0 (0.0%) | 0 (0.0%) |
| 7+ Person Households | 0 (0.0%) | 0 (0.0%) |
| Total | 178 (45.4%) | 214 (54.6%) |
Female Fertility in Mariaville Lake
Fertility by Age in Mariaville Lake
| Age Bracket | Women with Births | Births / 1,000 Women |
| 15 to 19 years | 0 (0.0%) | 0.0 |
| 20 to 34 years | 0 (0.0%) | 0.0 |
| 35 to 50 years | 0 (0.0%) | 0.0 |
| Total | 0 (0.0%) | 0.0 |
Fertility by Age by Marriage Status in Mariaville Lake
| Age Bracket | Married | Unmarried |
| 15 to 19 years | 0 (0.0%) | 0 (0.0%) |
| 20 to 34 years | 0 (0.0%) | 0 (0.0%) |
| 35 to 50 years | 0 (0.0%) | 0 (0.0%) |
| Total | 0 (0.0%) | 0 (0.0%) |
Fertility by Education in Mariaville Lake
| Educational Attainment | Women with Births | Births / 1,000 Women |
| Less than High School | 0 (0.0%) | 0.0 |
| High School Diploma | 0 (0.0%) | 0.0 |
| College or Associate's Degree | 0 (0.0%) | 0.0 |
| Bachelor's Degree | 0 (0.0%) | 0.0 |
| Graduate Degree | 0 (0.0%) | 0.0 |
| Total | 0 (0.0%) | 0.0 |
Fertility by Education by Marriage Status in Mariaville Lake
| Educational Attainment | Married | Unmarried |
| Less than High School | 0 (0.0%) | 0 (0.0%) |
| High School Diploma | 0 (0.0%) | 0 (0.0%) |
| College or Associate's Degree | 0 (0.0%) | 0 (0.0%) |
| Bachelor's Degree | 0 (0.0%) | 0 (0.0%) |
| Graduate Degree | 0 (0.0%) | 0 (0.0%) |
| Total | 0 (0.0%) | 0 (0.0%) |
Employment Characteristics in Mariaville Lake
Employment by Class of Employer in Mariaville Lake
Among the 439 employed individuals in Mariaville Lake, private company employees (194 | 44.2%), local government employees (134 | 30.5%), and not-for-profit organizations (66 | 15.0%) make up the most common classes of employment.
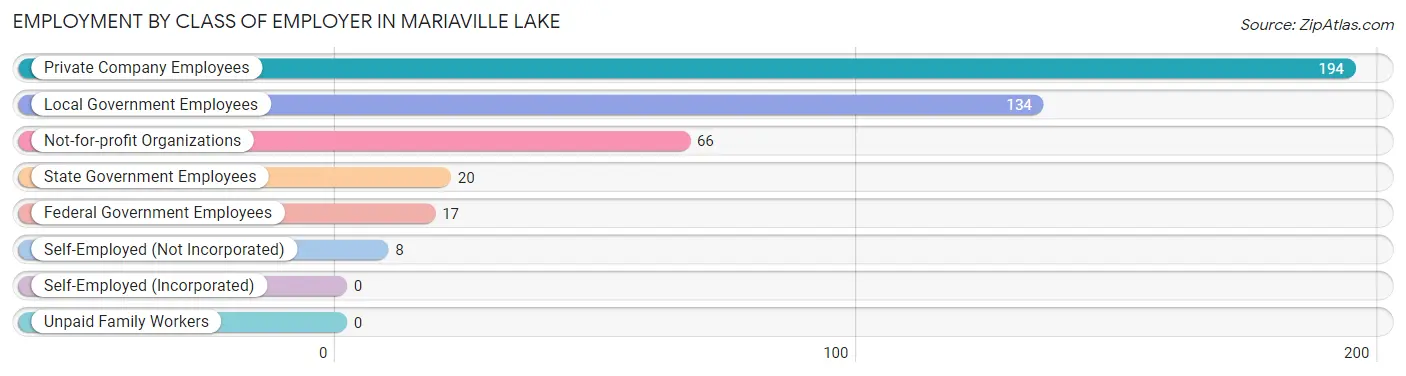
| Employer Class | # Employees | % Employees |
| Private Company Employees | 194 | 44.2% |
| Self-Employed (Incorporated) | 0 | 0.0% |
| Self-Employed (Not Incorporated) | 8 | 1.8% |
| Not-for-profit Organizations | 66 | 15.0% |
| Local Government Employees | 134 | 30.5% |
| State Government Employees | 20 | 4.6% |
| Federal Government Employees | 17 | 3.9% |
| Unpaid Family Workers | 0 | 0.0% |
| Total | 439 | 100.0% |
Employment Status by Age in Mariaville Lake
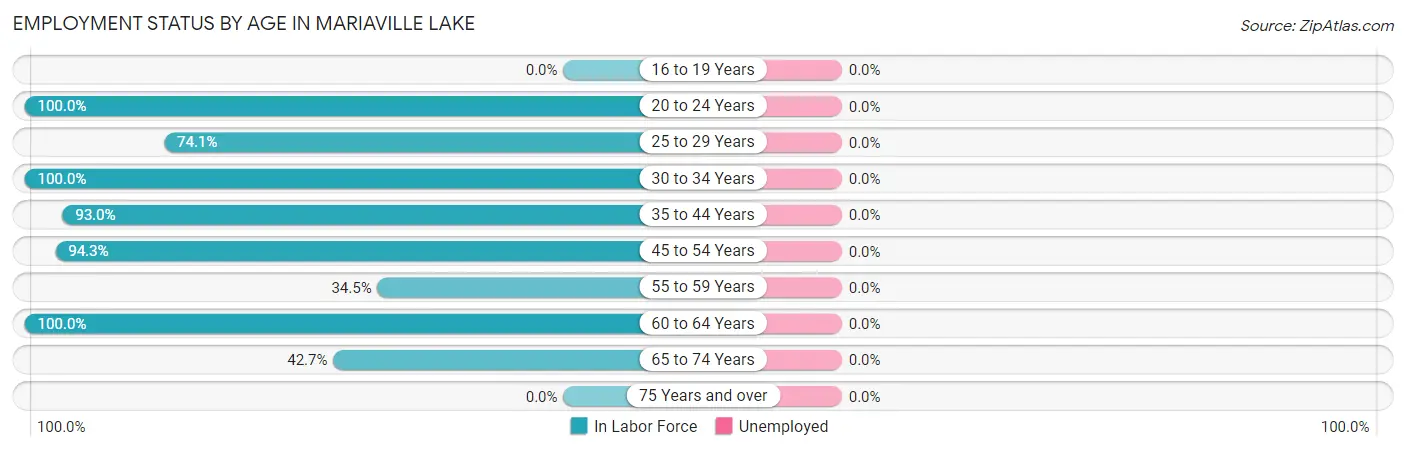
| Age Bracket | In Labor Force | Unemployed |
| 16 to 19 Years | 0 (0.0%) | 0 (0.0%) |
| 20 to 24 Years | 33 (100.0%) | 0 (0.0%) |
| 25 to 29 Years | 40 (74.1%) | 0 (0.0%) |
| 30 to 34 Years | 66 (100.0%) | 0 (0.0%) |
| 35 to 44 Years | 80 (93.0%) | 0 (0.0%) |
| 45 to 54 Years | 99 (94.3%) | 0 (0.0%) |
| 55 to 59 Years | 70 (34.5%) | 0 (0.0%) |
| 60 to 64 Years | 13 (100.0%) | 0 (0.0%) |
| 65 to 74 Years | 38 (42.7%) | 0 (0.0%) |
| 75 Years and over | 0 (0.0%) | 0 (0.0%) |
| Total | 439 (63.4%) | 0 (0.0%) |
Employment Status by Educational Attainment in Mariaville Lake
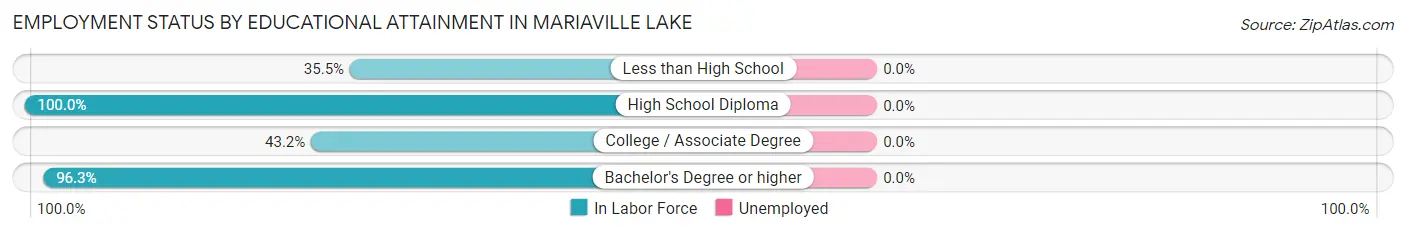
| Educational Attainment | In Labor Force | Unemployed |
| Less than High School | 11 (35.5%) | 0 (0.0%) |
| High School Diploma | 100 (100.0%) | 0 (0.0%) |
| College / Associate Degree | 101 (43.2%) | 0 (0.0%) |
| Bachelor's Degree or higher | 156 (96.3%) | 0 (0.0%) |
| Total | 368 (69.8%) | 0 (0.0%) |
Employment Occupations by Sex in Mariaville Lake
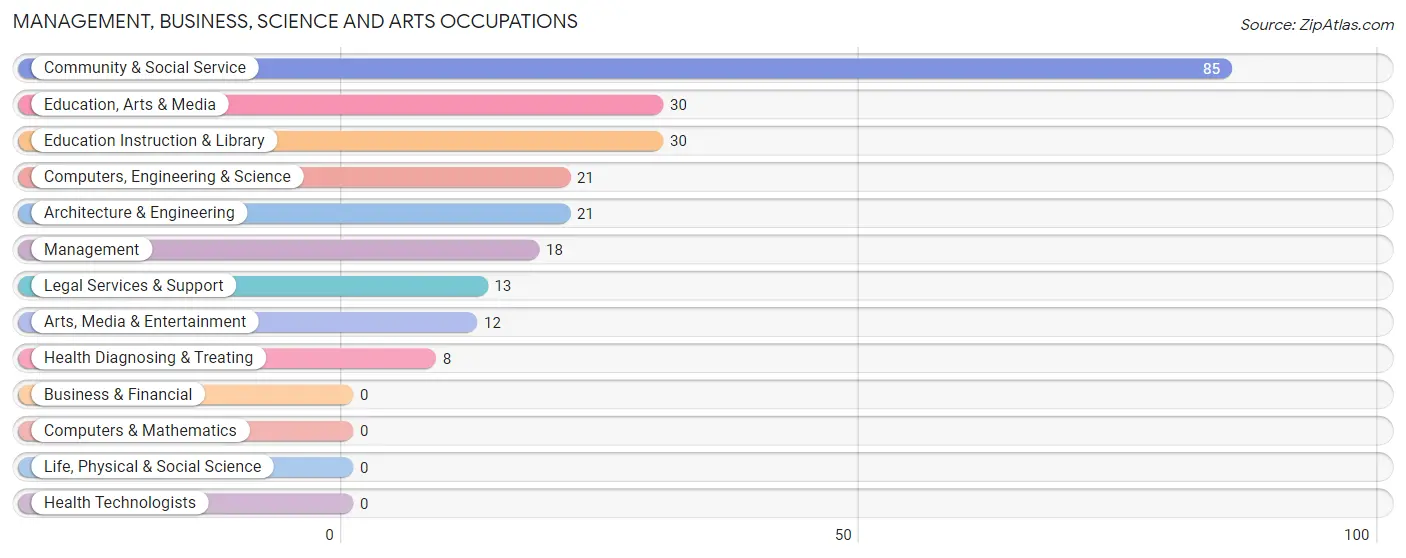
Management, Business, Science and Arts Occupations
The most common Management, Business, Science and Arts occupations in Mariaville Lake are Community & Social Service (85 | 19.4%), Education, Arts & Media (30 | 6.8%), Education Instruction & Library (30 | 6.8%), Computers, Engineering & Science (21 | 4.8%), and Architecture & Engineering (21 | 4.8%).
Management, Business, Science and Arts Occupations by Sex
Within the Management, Business, Science and Arts occupations in Mariaville Lake, the most male-oriented occupations are Management (100.0%), Legal Services & Support (100.0%), and Health Diagnosing & Treating (100.0%), while the most female-oriented occupations are Education Instruction & Library (100.0%), Arts, Media & Entertainment (100.0%), and Computers, Engineering & Science (66.7%).
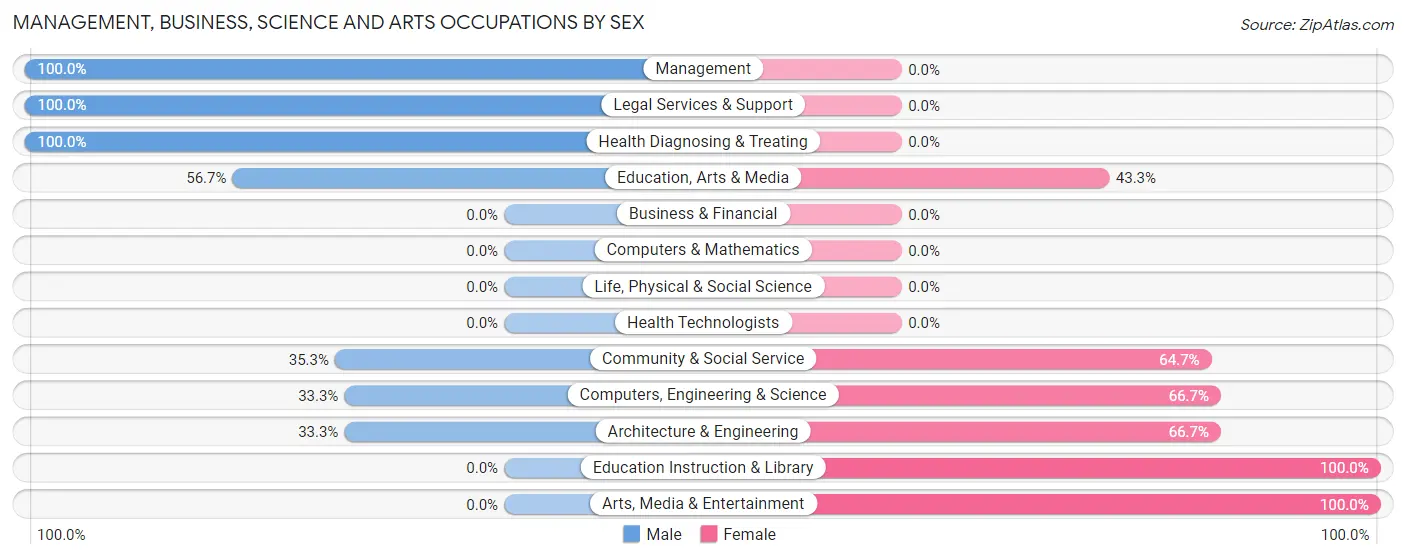
| Occupation | Male | Female |
| Management | 18 (100.0%) | 0 (0.0%) |
| Business & Financial | 0 (0.0%) | 0 (0.0%) |
| Computers, Engineering & Science | 7 (33.3%) | 14 (66.7%) |
| Computers & Mathematics | 0 (0.0%) | 0 (0.0%) |
| Architecture & Engineering | 7 (33.3%) | 14 (66.7%) |
| Life, Physical & Social Science | 0 (0.0%) | 0 (0.0%) |
| Community & Social Service | 30 (35.3%) | 55 (64.7%) |
| Education, Arts & Media | 17 (56.7%) | 13 (43.3%) |
| Legal Services & Support | 13 (100.0%) | 0 (0.0%) |
| Education Instruction & Library | 0 (0.0%) | 30 (100.0%) |
| Arts, Media & Entertainment | 0 (0.0%) | 12 (100.0%) |
| Health Diagnosing & Treating | 8 (100.0%) | 0 (0.0%) |
| Health Technologists | 0 (0.0%) | 0 (0.0%) |
| Total (Category) | 63 (47.7%) | 69 (52.3%) |
| Total (Overall) | 192 (43.7%) | 247 (56.3%) |
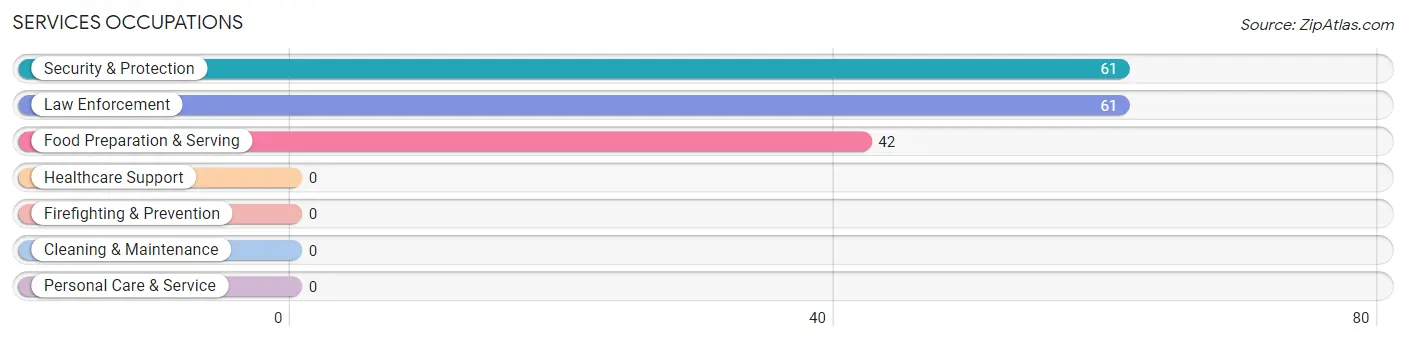
Services Occupations
The most common Services occupations in Mariaville Lake are Security & Protection (61 | 13.9%), Law Enforcement (61 | 13.9%), and Food Preparation & Serving (42 | 9.6%).
Services Occupations by Sex
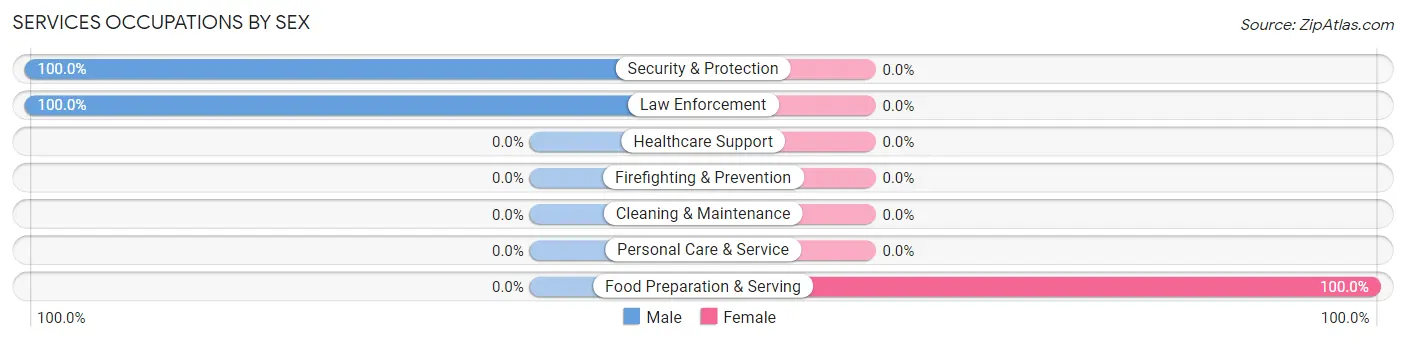
| Occupation | Male | Female |
| Healthcare Support | 0 (0.0%) | 0 (0.0%) |
| Security & Protection | 61 (100.0%) | 0 (0.0%) |
| Firefighting & Prevention | 0 (0.0%) | 0 (0.0%) |
| Law Enforcement | 61 (100.0%) | 0 (0.0%) |
| Food Preparation & Serving | 0 (0.0%) | 42 (100.0%) |
| Cleaning & Maintenance | 0 (0.0%) | 0 (0.0%) |
| Personal Care & Service | 0 (0.0%) | 0 (0.0%) |
| Total (Category) | 61 (59.2%) | 42 (40.8%) |
| Total (Overall) | 192 (43.7%) | 247 (56.3%) |
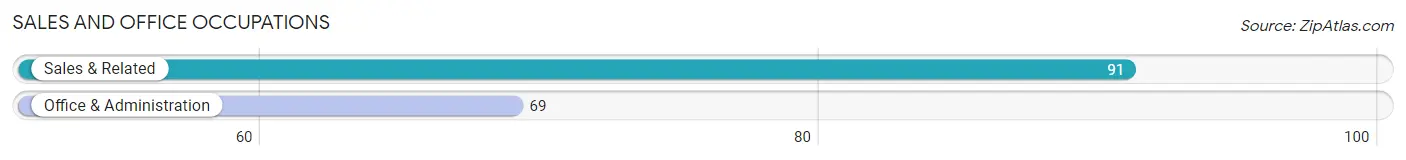
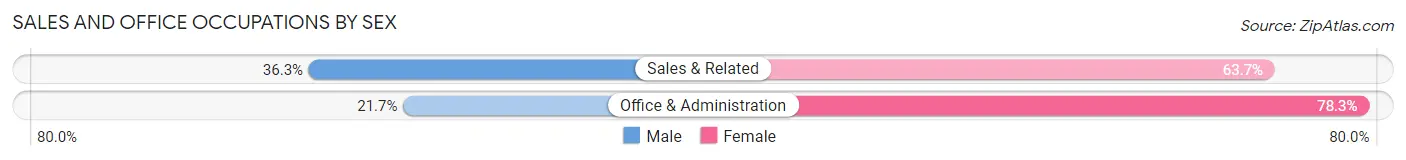
Sales and Office Occupations
The most common Sales and Office occupations in Mariaville Lake are Sales & Related (91 | 20.7%), and Office & Administration (69 | 15.7%).
Sales and Office Occupations by Sex
| Occupation | Male | Female |
| Sales & Related | 33 (36.3%) | 58 (63.7%) |
| Office & Administration | 15 (21.7%) | 54 (78.3%) |
| Total (Category) | 48 (30.0%) | 112 (70.0%) |
| Total (Overall) | 192 (43.7%) | 247 (56.3%) |
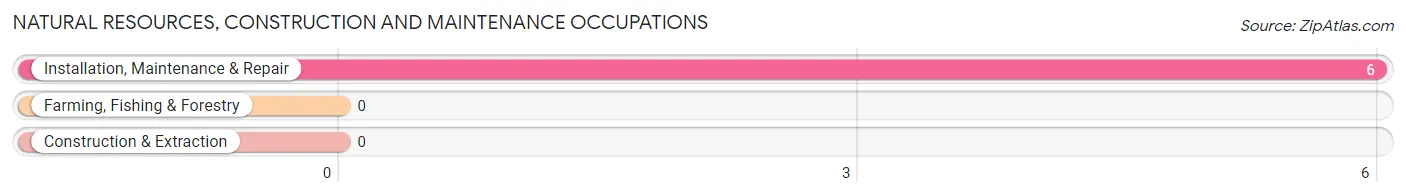
Natural Resources, Construction and Maintenance Occupations
The most common Natural Resources, Construction and Maintenance occupations in Mariaville Lake are , and Installation, Maintenance & Repair (6 | 1.4%).
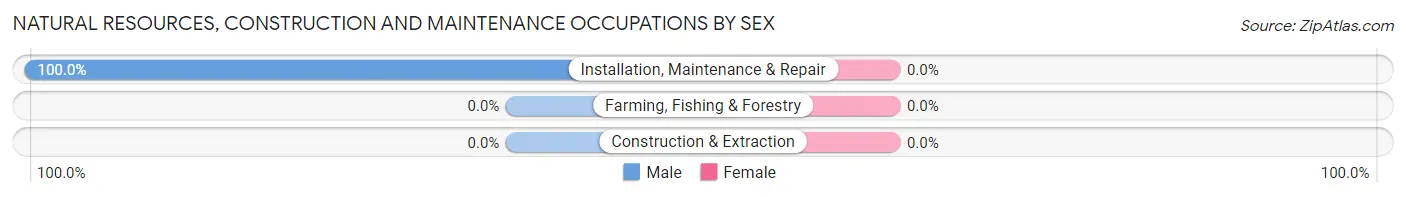
Natural Resources, Construction and Maintenance Occupations by Sex
| Occupation | Male | Female |
| Farming, Fishing & Forestry | 0 (0.0%) | 0 (0.0%) |
| Construction & Extraction | 0 (0.0%) | 0 (0.0%) |
| Installation, Maintenance & Repair | 6 (100.0%) | 0 (0.0%) |
| Total (Category) | 6 (100.0%) | 0 (0.0%) |
| Total (Overall) | 192 (43.7%) | 247 (56.3%) |
Production, Transportation and Moving Occupations
The most common Production, Transportation and Moving occupations in Mariaville Lake are Material Moving (24 | 5.5%), and Transportation (14 | 3.2%).
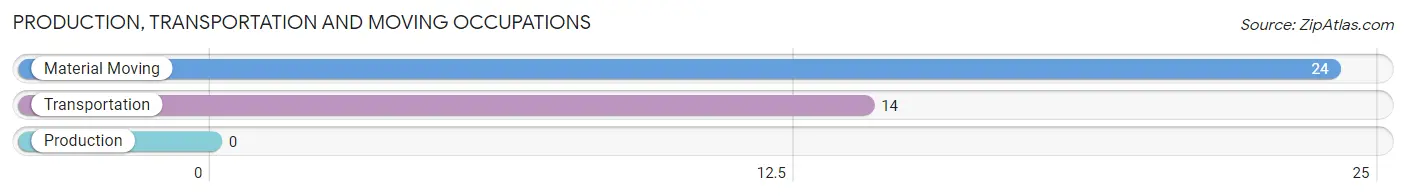
Production, Transportation and Moving Occupations by Sex
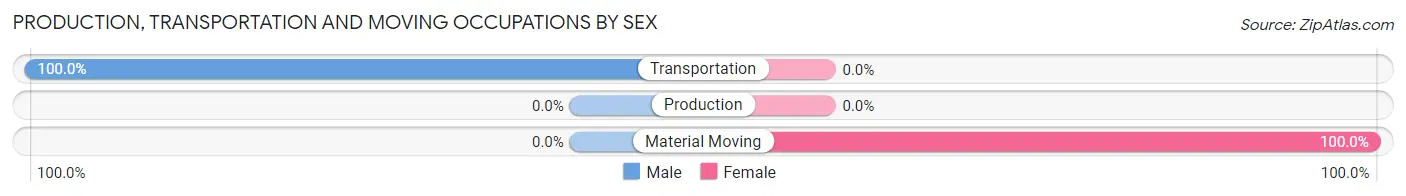
| Occupation | Male | Female |
| Production | 0 (0.0%) | 0 (0.0%) |
| Transportation | 14 (100.0%) | 0 (0.0%) |
| Material Moving | 0 (0.0%) | 24 (100.0%) |
| Total (Category) | 14 (36.8%) | 24 (63.2%) |
| Total (Overall) | 192 (43.7%) | 247 (56.3%) |
Employment Industries by Sex in Mariaville Lake
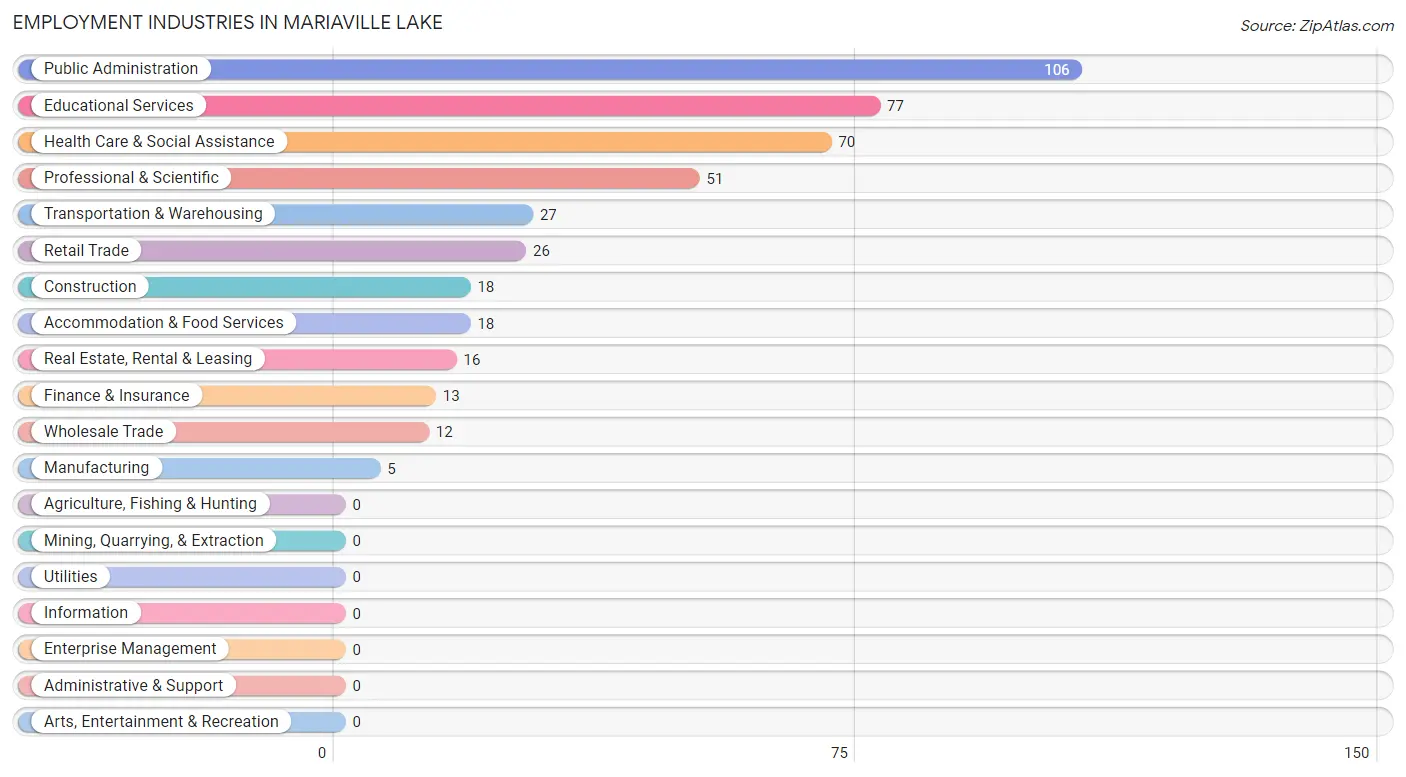
Employment Industries in Mariaville Lake
The major employment industries in Mariaville Lake include Public Administration (106 | 24.1%), Educational Services (77 | 17.5%), Health Care & Social Assistance (70 | 16.0%), Professional & Scientific (51 | 11.6%), and Transportation & Warehousing (27 | 6.1%).
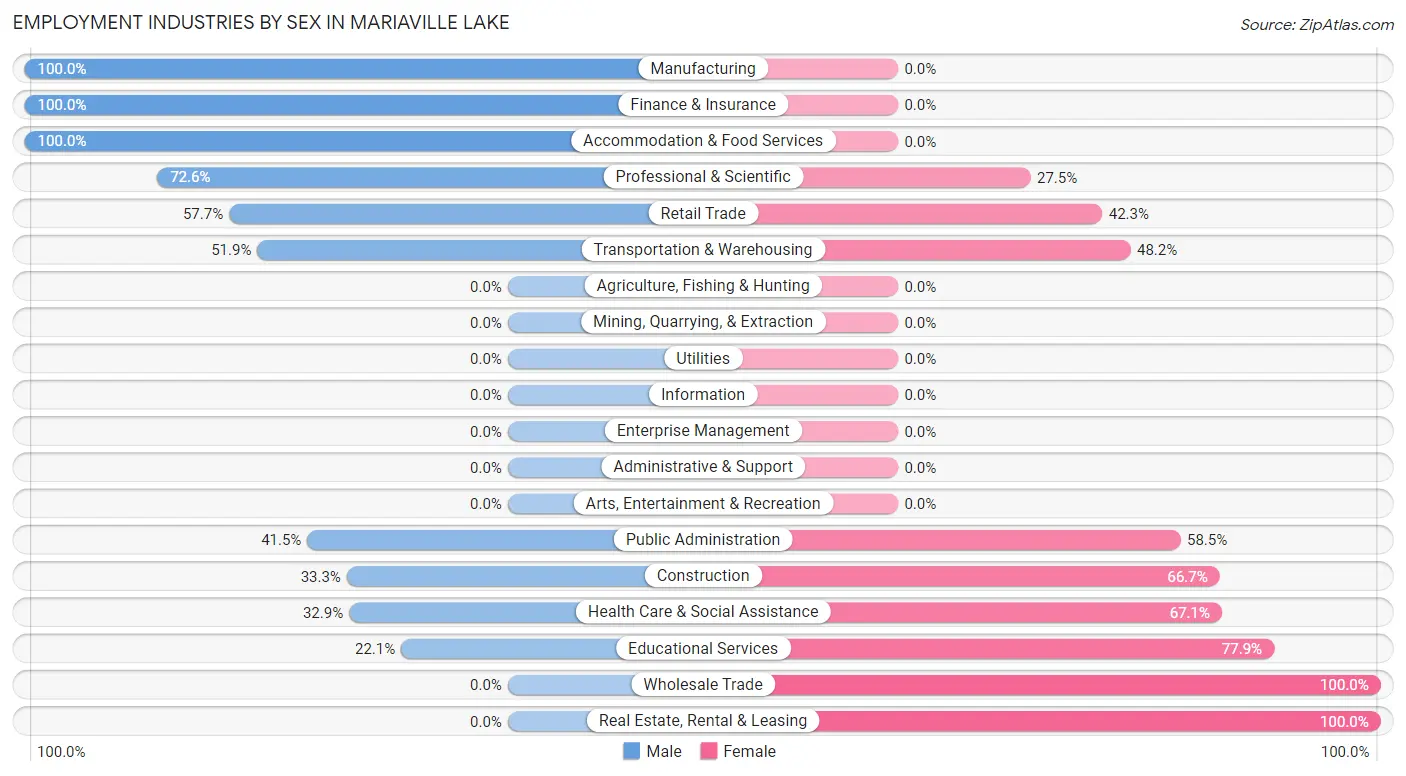
Employment Industries by Sex in Mariaville Lake
The Mariaville Lake industries that see more men than women are Manufacturing (100.0%), Finance & Insurance (100.0%), and Accommodation & Food Services (100.0%), whereas the industries that tend to have a higher number of women are Wholesale Trade (100.0%), Real Estate, Rental & Leasing (100.0%), and Educational Services (77.9%).
| Industry | Male | Female |
| Agriculture, Fishing & Hunting | 0 (0.0%) | 0 (0.0%) |
| Mining, Quarrying, & Extraction | 0 (0.0%) | 0 (0.0%) |
| Construction | 6 (33.3%) | 12 (66.7%) |
| Manufacturing | 5 (100.0%) | 0 (0.0%) |
| Wholesale Trade | 0 (0.0%) | 12 (100.0%) |
| Retail Trade | 15 (57.7%) | 11 (42.3%) |
| Transportation & Warehousing | 14 (51.8%) | 13 (48.1%) |
| Utilities | 0 (0.0%) | 0 (0.0%) |
| Information | 0 (0.0%) | 0 (0.0%) |
| Finance & Insurance | 13 (100.0%) | 0 (0.0%) |
| Real Estate, Rental & Leasing | 0 (0.0%) | 16 (100.0%) |
| Professional & Scientific | 37 (72.6%) | 14 (27.5%) |
| Enterprise Management | 0 (0.0%) | 0 (0.0%) |
| Administrative & Support | 0 (0.0%) | 0 (0.0%) |
| Educational Services | 17 (22.1%) | 60 (77.9%) |
| Health Care & Social Assistance | 23 (32.9%) | 47 (67.1%) |
| Arts, Entertainment & Recreation | 0 (0.0%) | 0 (0.0%) |
| Accommodation & Food Services | 18 (100.0%) | 0 (0.0%) |
| Public Administration | 44 (41.5%) | 62 (58.5%) |
| Total | 192 (43.7%) | 247 (56.3%) |
Education in Mariaville Lake
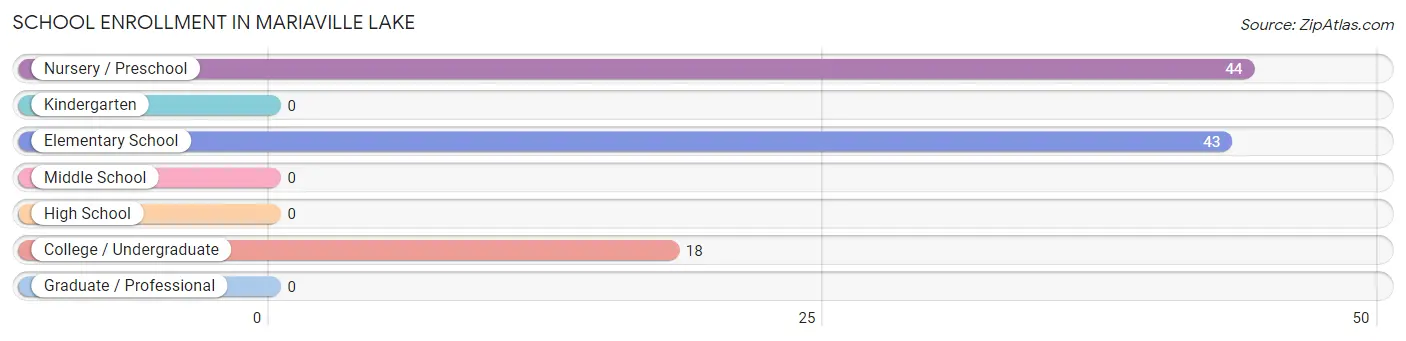
School Enrollment in Mariaville Lake
The most common levels of schooling among the 105 students in Mariaville Lake are nursery / preschool (44 | 41.9%), elementary school (43 | 40.9%), and college / undergraduate (18 | 17.1%).
| School Level | # Students | % Students |
| Nursery / Preschool | 44 | 41.9% |
| Kindergarten | 0 | 0.0% |
| Elementary School | 43 | 40.9% |
| Middle School | 0 | 0.0% |
| High School | 0 | 0.0% |
| College / Undergraduate | 18 | 17.1% |
| Graduate / Professional | 0 | 0.0% |
| Total | 105 | 100.0% |
School Enrollment by Age by Funding Source in Mariaville Lake
Out of a total of 105 students who are enrolled in schools in Mariaville Lake, 57 (54.3%) attend a private institution, while the remaining 48 (45.7%) are enrolled in public schools. The age group of 5 to 9 year old has the highest likelihood of being enrolled in private schools, with 57 (65.5% in the age bracket) enrolled. Conversely, the age group of 20 to 24 year olds has the lowest likelihood of being enrolled in a private school, with 18 (100.0% in the age bracket) attending a public institution.
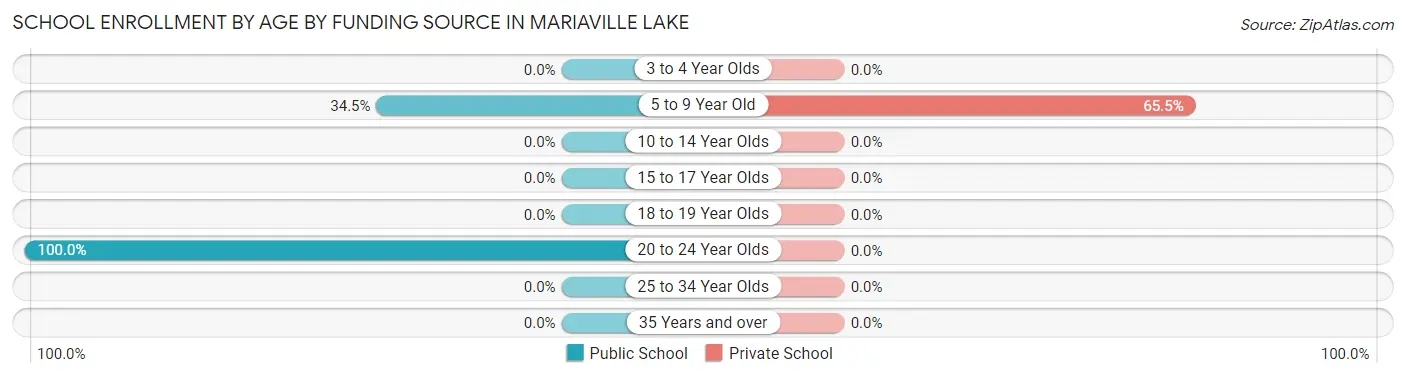
| Age Bracket | Public School | Private School |
| 3 to 4 Year Olds | 0 (0.0%) | 0 (0.0%) |
| 5 to 9 Year Old | 30 (34.5%) | 57 (65.5%) |
| 10 to 14 Year Olds | 0 (0.0%) | 0 (0.0%) |
| 15 to 17 Year Olds | 0 (0.0%) | 0 (0.0%) |
| 18 to 19 Year Olds | 0 (0.0%) | 0 (0.0%) |
| 20 to 24 Year Olds | 18 (100.0%) | 0 (0.0%) |
| 25 to 34 Year Olds | 0 (0.0%) | 0 (0.0%) |
| 35 Years and over | 0 (0.0%) | 0 (0.0%) |
| Total | 48 (45.7%) | 57 (54.3%) |
Educational Attainment by Field of Study in Mariaville Lake
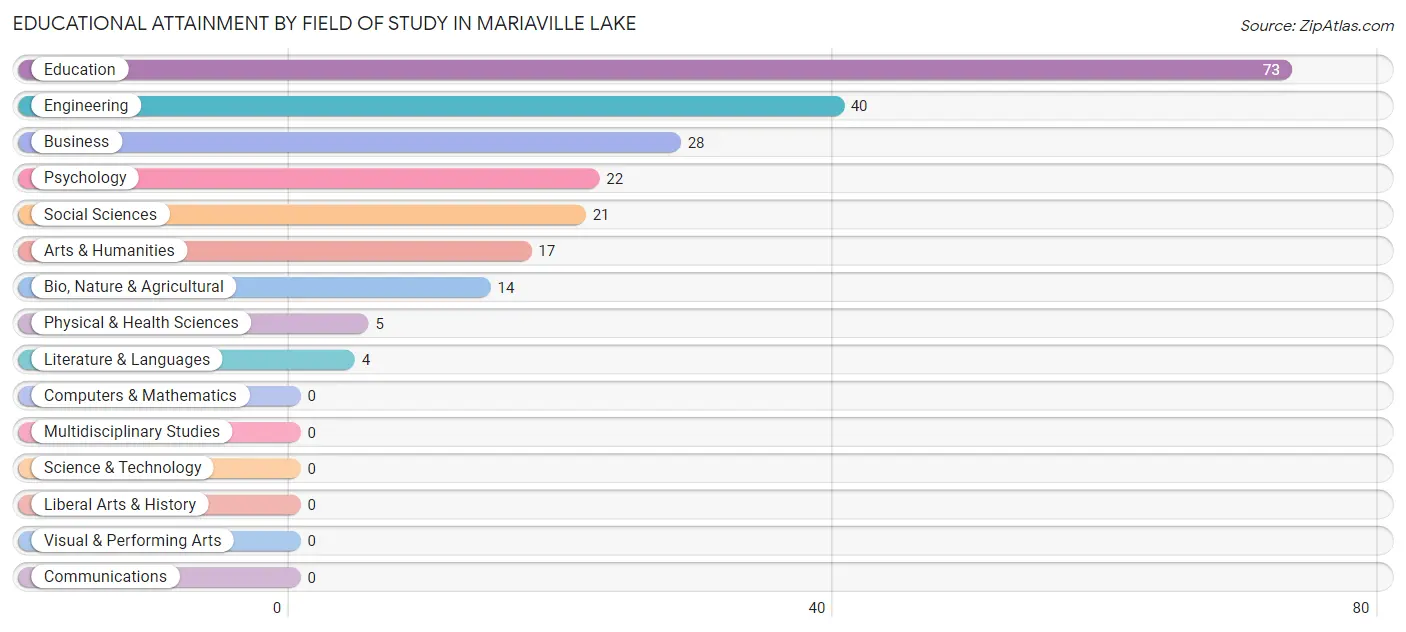
Education (73 | 32.6%), engineering (40 | 17.9%), business (28 | 12.5%), psychology (22 | 9.8%), and social sciences (21 | 9.4%) are the most common fields of study among 224 individuals in Mariaville Lake who have obtained a bachelor's degree or higher.
| Field of Study | # Graduates | % Graduates |
| Computers & Mathematics | 0 | 0.0% |
| Bio, Nature & Agricultural | 14 | 6.2% |
| Physical & Health Sciences | 5 | 2.2% |
| Psychology | 22 | 9.8% |
| Social Sciences | 21 | 9.4% |
| Engineering | 40 | 17.9% |
| Multidisciplinary Studies | 0 | 0.0% |
| Science & Technology | 0 | 0.0% |
| Business | 28 | 12.5% |
| Education | 73 | 32.6% |
| Literature & Languages | 4 | 1.8% |
| Liberal Arts & History | 0 | 0.0% |
| Visual & Performing Arts | 0 | 0.0% |
| Communications | 0 | 0.0% |
| Arts & Humanities | 17 | 7.6% |
| Total | 224 | 100.0% |
Transportation & Commute in Mariaville Lake
Vehicle Availability by Sex in Mariaville Lake
The most prevalent vehicle ownership categories in Mariaville Lake are males with 3 vehicles (90, accounting for 46.9%) and females with 3 vehicles (107, making up 36.4%).
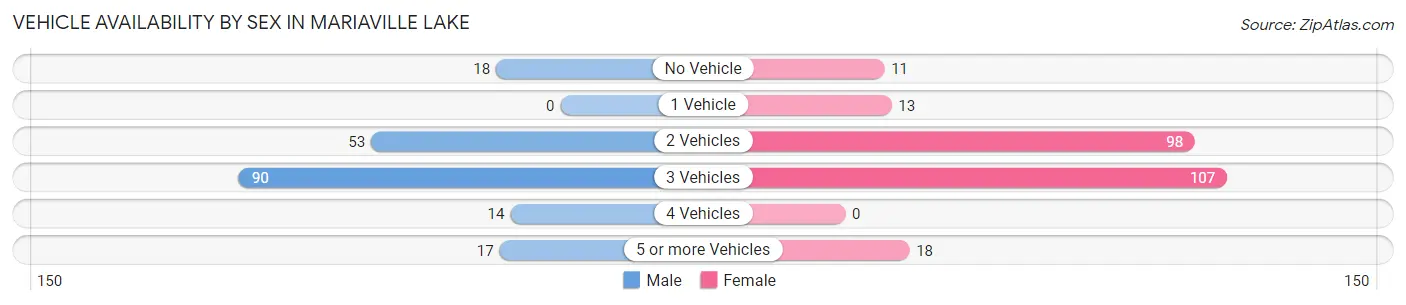
| Vehicles Available | Male | Female |
| No Vehicle | 18 (9.4%) | 11 (4.4%) |
| 1 Vehicle | 0 (0.0%) | 13 (5.3%) |
| 2 Vehicles | 53 (27.6%) | 98 (39.7%) |
| 3 Vehicles | 90 (46.9%) | 107 (43.3%) |
| 4 Vehicles | 14 (7.3%) | 0 (0.0%) |
| 5 or more Vehicles | 17 (8.8%) | 18 (7.3%) |
| Total | 192 (100.0%) | 247 (100.0%) |
Commute Time in Mariaville Lake
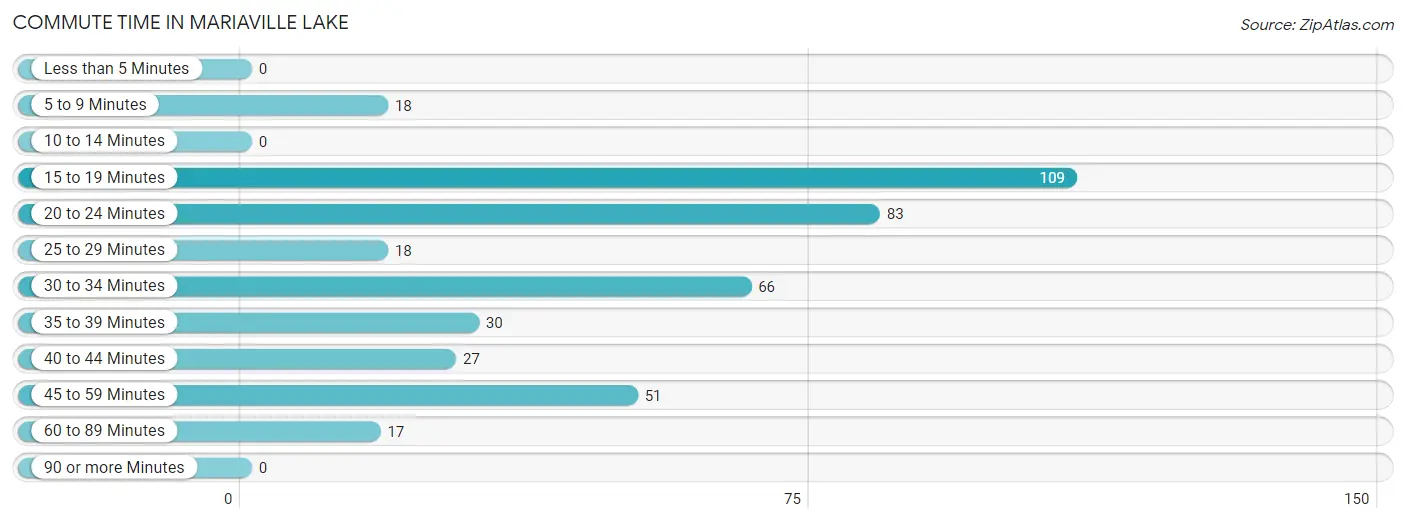
The most frequently occuring commute durations in Mariaville Lake are 15 to 19 minutes (109 commuters, 26.0%), 20 to 24 minutes (83 commuters, 19.8%), and 30 to 34 minutes (66 commuters, 15.8%).
| Commute Time | # Commuters | % Commuters |
| Less than 5 Minutes | 0 | 0.0% |
| 5 to 9 Minutes | 18 | 4.3% |
| 10 to 14 Minutes | 0 | 0.0% |
| 15 to 19 Minutes | 109 | 26.0% |
| 20 to 24 Minutes | 83 | 19.8% |
| 25 to 29 Minutes | 18 | 4.3% |
| 30 to 34 Minutes | 66 | 15.8% |
| 35 to 39 Minutes | 30 | 7.2% |
| 40 to 44 Minutes | 27 | 6.4% |
| 45 to 59 Minutes | 51 | 12.2% |
| 60 to 89 Minutes | 17 | 4.1% |
| 90 or more Minutes | 0 | 0.0% |
Commute Time by Sex in Mariaville Lake
The most common commute times in Mariaville Lake are 20 to 24 minutes (58 commuters, 33.7%) for males and 15 to 19 minutes (109 commuters, 44.1%) for females.
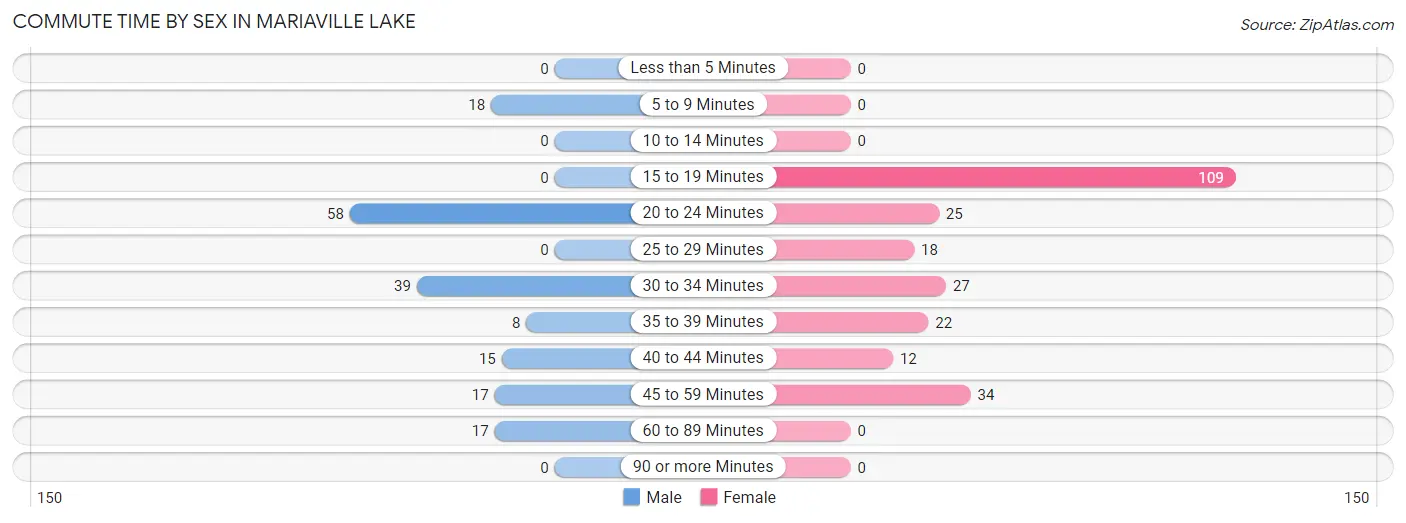
| Commute Time | Male | Female |
| Less than 5 Minutes | 0 (0.0%) | 0 (0.0%) |
| 5 to 9 Minutes | 18 (10.5%) | 0 (0.0%) |
| 10 to 14 Minutes | 0 (0.0%) | 0 (0.0%) |
| 15 to 19 Minutes | 0 (0.0%) | 109 (44.1%) |
| 20 to 24 Minutes | 58 (33.7%) | 25 (10.1%) |
| 25 to 29 Minutes | 0 (0.0%) | 18 (7.3%) |
| 30 to 34 Minutes | 39 (22.7%) | 27 (10.9%) |
| 35 to 39 Minutes | 8 (4.6%) | 22 (8.9%) |
| 40 to 44 Minutes | 15 (8.7%) | 12 (4.9%) |
| 45 to 59 Minutes | 17 (9.9%) | 34 (13.8%) |
| 60 to 89 Minutes | 17 (9.9%) | 0 (0.0%) |
| 90 or more Minutes | 0 (0.0%) | 0 (0.0%) |
Time of Departure to Work by Sex in Mariaville Lake
The most frequent times of departure to work in Mariaville Lake are 8:00 AM to 8:29 AM (44, 25.6%) for males and 6:30 AM to 6:59 AM (72, 29.1%) for females.
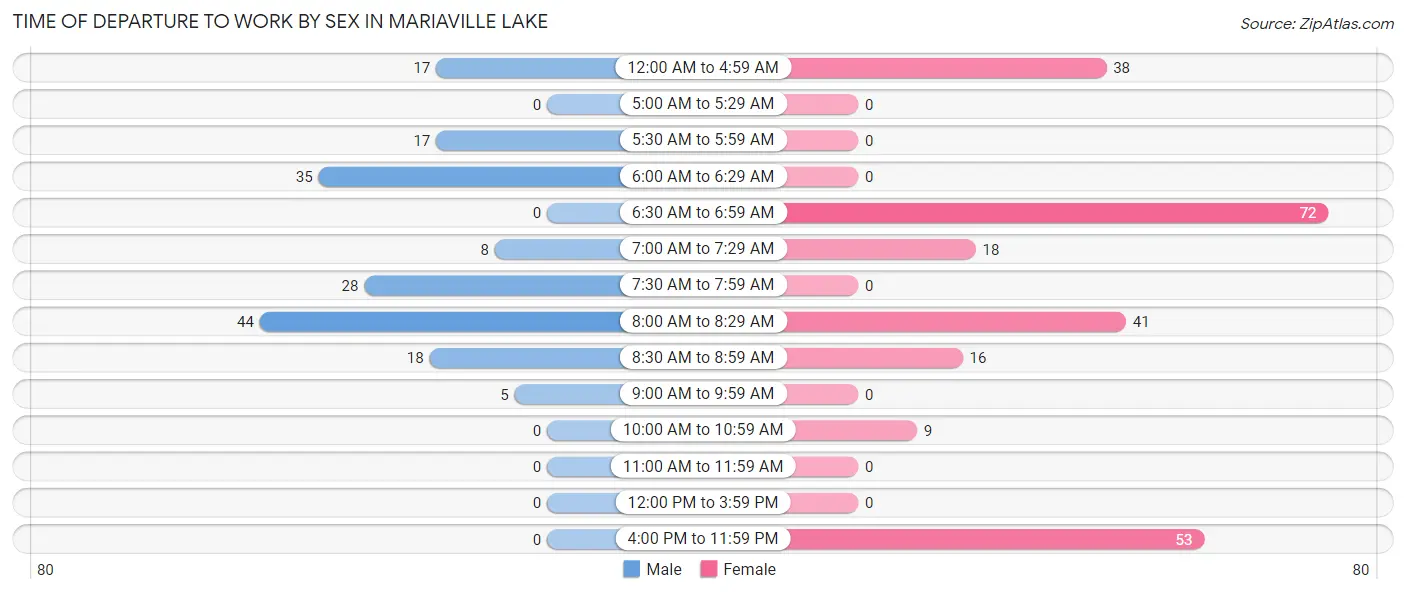
| Time of Departure | Male | Female |
| 12:00 AM to 4:59 AM | 17 (9.9%) | 38 (15.4%) |
| 5:00 AM to 5:29 AM | 0 (0.0%) | 0 (0.0%) |
| 5:30 AM to 5:59 AM | 17 (9.9%) | 0 (0.0%) |
| 6:00 AM to 6:29 AM | 35 (20.3%) | 0 (0.0%) |
| 6:30 AM to 6:59 AM | 0 (0.0%) | 72 (29.1%) |
| 7:00 AM to 7:29 AM | 8 (4.6%) | 18 (7.3%) |
| 7:30 AM to 7:59 AM | 28 (16.3%) | 0 (0.0%) |
| 8:00 AM to 8:29 AM | 44 (25.6%) | 41 (16.6%) |
| 8:30 AM to 8:59 AM | 18 (10.5%) | 16 (6.5%) |
| 9:00 AM to 9:59 AM | 5 (2.9%) | 0 (0.0%) |
| 10:00 AM to 10:59 AM | 0 (0.0%) | 9 (3.6%) |
| 11:00 AM to 11:59 AM | 0 (0.0%) | 0 (0.0%) |
| 12:00 PM to 3:59 PM | 0 (0.0%) | 0 (0.0%) |
| 4:00 PM to 11:59 PM | 0 (0.0%) | 53 (21.5%) |
| Total | 172 (100.0%) | 247 (100.0%) |
Housing Occupancy in Mariaville Lake
Occupancy by Ownership in Mariaville Lake
Of the total 392 dwellings in Mariaville Lake, owner-occupied units account for 271 (69.1%), while renter-occupied units make up 121 (30.9%).
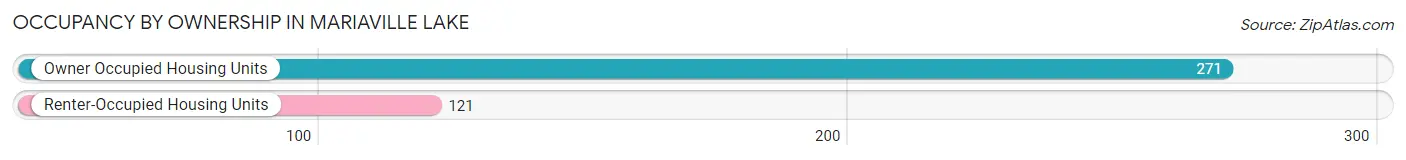
| Occupancy | # Housing Units | % Housing Units |
| Owner Occupied Housing Units | 271 | 69.1% |
| Renter-Occupied Housing Units | 121 | 30.9% |
| Total Occupied Housing Units | 392 | 100.0% |
Occupancy by Household Size in Mariaville Lake
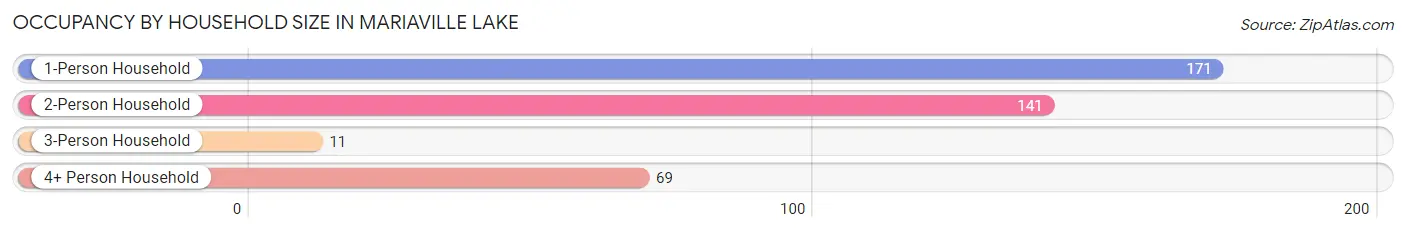
| Household Size | # Housing Units | % Housing Units |
| 1-Person Household | 171 | 43.6% |
| 2-Person Household | 141 | 36.0% |
| 3-Person Household | 11 | 2.8% |
| 4+ Person Household | 69 | 17.6% |
| Total Housing Units | 392 | 100.0% |
Occupancy by Ownership by Household Size in Mariaville Lake
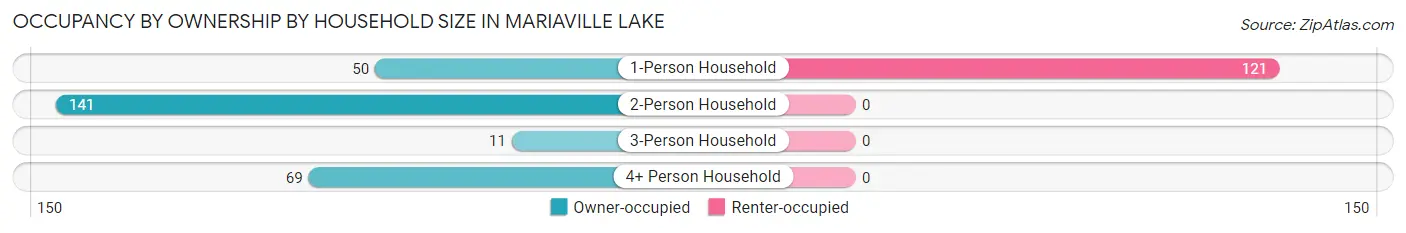
| Household Size | Owner-occupied | Renter-occupied |
| 1-Person Household | 50 (29.2%) | 121 (70.8%) |
| 2-Person Household | 141 (100.0%) | 0 (0.0%) |
| 3-Person Household | 11 (100.0%) | 0 (0.0%) |
| 4+ Person Household | 69 (100.0%) | 0 (0.0%) |
| Total Housing Units | 271 (69.1%) | 121 (30.9%) |
Occupancy by Educational Attainment in Mariaville Lake
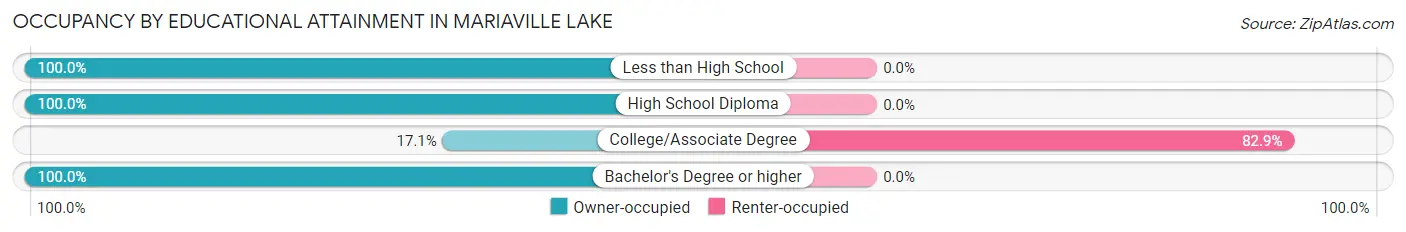
| Household Size | Owner-occupied | Renter-occupied |
| Less than High School | 11 (100.0%) | 0 (0.0%) |
| High School Diploma | 103 (100.0%) | 0 (0.0%) |
| College/Associate Degree | 25 (17.1%) | 121 (82.9%) |
| Bachelor's Degree or higher | 132 (100.0%) | 0 (0.0%) |
Occupancy by Age of Householder in Mariaville Lake
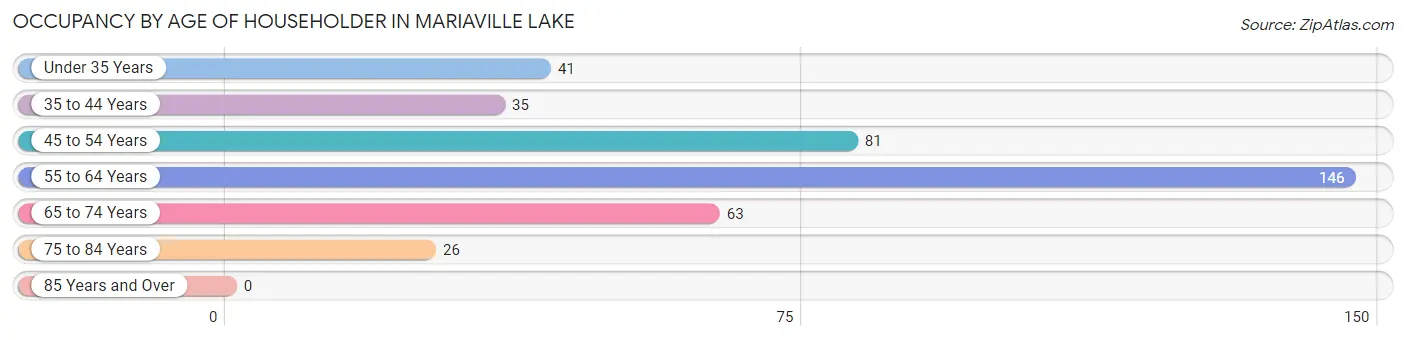
| Age Bracket | # Households | % Households |
| Under 35 Years | 41 | 10.5% |
| 35 to 44 Years | 35 | 8.9% |
| 45 to 54 Years | 81 | 20.7% |
| 55 to 64 Years | 146 | 37.2% |
| 65 to 74 Years | 63 | 16.1% |
| 75 to 84 Years | 26 | 6.6% |
| 85 Years and Over | 0 | 0.0% |
| Total | 392 | 100.0% |
Housing Finances in Mariaville Lake
Median Income by Occupancy in Mariaville Lake
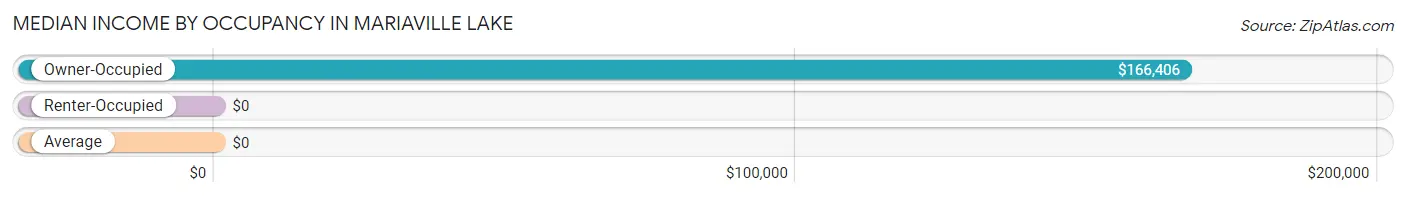
| Occupancy Type | # Households | Median Income |
| Owner-Occupied | 271 (69.1%) | $166,406 |
| Renter-Occupied | 121 (30.9%) | $0 |
| Average | 392 (100.0%) | $0 |
Occupancy by Householder Income Bracket in Mariaville Lake
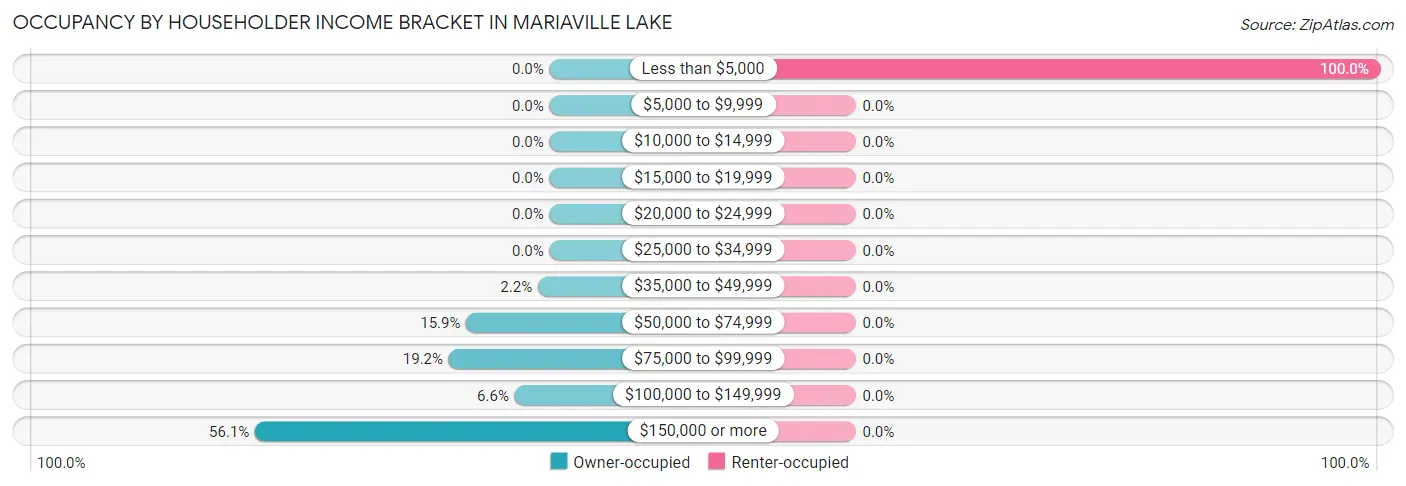
| Income Bracket | Owner-occupied | Renter-occupied |
| Less than $5,000 | 0 (0.0%) | 121 (100.0%) |
| $5,000 to $9,999 | 0 (0.0%) | 0 (0.0%) |
| $10,000 to $14,999 | 0 (0.0%) | 0 (0.0%) |
| $15,000 to $19,999 | 0 (0.0%) | 0 (0.0%) |
| $20,000 to $24,999 | 0 (0.0%) | 0 (0.0%) |
| $25,000 to $34,999 | 0 (0.0%) | 0 (0.0%) |
| $35,000 to $49,999 | 6 (2.2%) | 0 (0.0%) |
| $50,000 to $74,999 | 43 (15.9%) | 0 (0.0%) |
| $75,000 to $99,999 | 52 (19.2%) | 0 (0.0%) |
| $100,000 to $149,999 | 18 (6.6%) | 0 (0.0%) |
| $150,000 or more | 152 (56.1%) | 0 (0.0%) |
| Total | 271 (100.0%) | 121 (100.0%) |
Monthly Housing Cost Tiers in Mariaville Lake
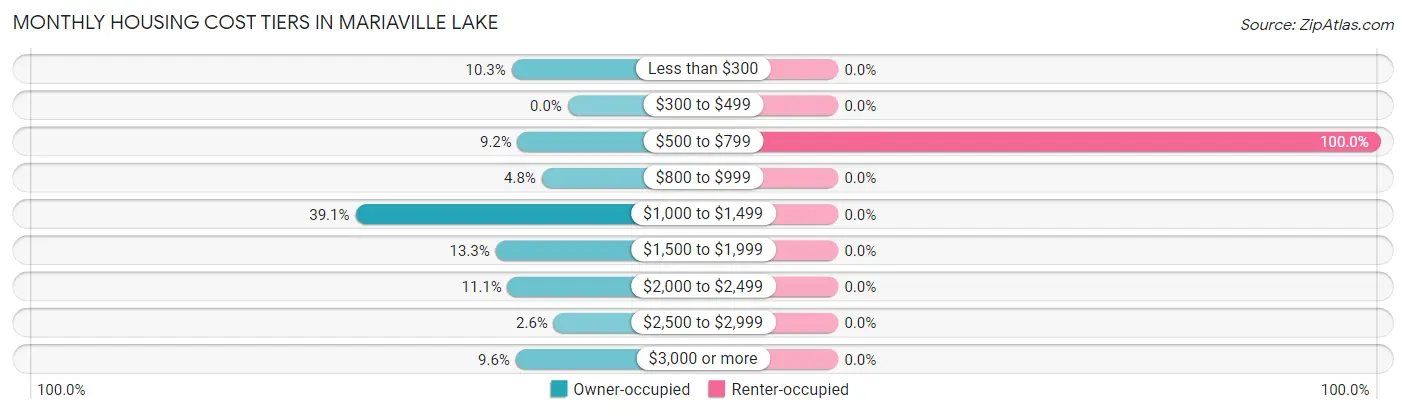
| Monthly Cost | Owner-occupied | Renter-occupied |
| Less than $300 | 28 (10.3%) | 0 (0.0%) |
| $300 to $499 | 0 (0.0%) | 0 (0.0%) |
| $500 to $799 | 25 (9.2%) | 121 (100.0%) |
| $800 to $999 | 13 (4.8%) | 0 (0.0%) |
| $1,000 to $1,499 | 106 (39.1%) | 0 (0.0%) |
| $1,500 to $1,999 | 36 (13.3%) | 0 (0.0%) |
| $2,000 to $2,499 | 30 (11.1%) | 0 (0.0%) |
| $2,500 to $2,999 | 7 (2.6%) | 0 (0.0%) |
| $3,000 or more | 26 (9.6%) | 0 (0.0%) |
| Total | 271 (100.0%) | 121 (100.0%) |
Physical Housing Characteristics in Mariaville Lake
Housing Structures in Mariaville Lake
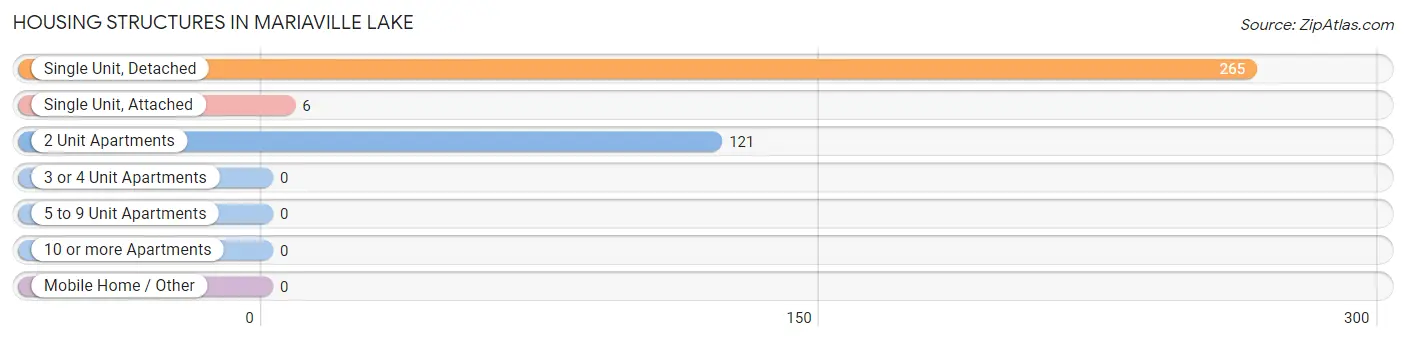
| Structure Type | # Housing Units | % Housing Units |
| Single Unit, Detached | 265 | 67.6% |
| Single Unit, Attached | 6 | 1.5% |
| 2 Unit Apartments | 121 | 30.9% |
| 3 or 4 Unit Apartments | 0 | 0.0% |
| 5 to 9 Unit Apartments | 0 | 0.0% |
| 10 or more Apartments | 0 | 0.0% |
| Mobile Home / Other | 0 | 0.0% |
| Total | 392 | 100.0% |
Housing Structures by Occupancy in Mariaville Lake
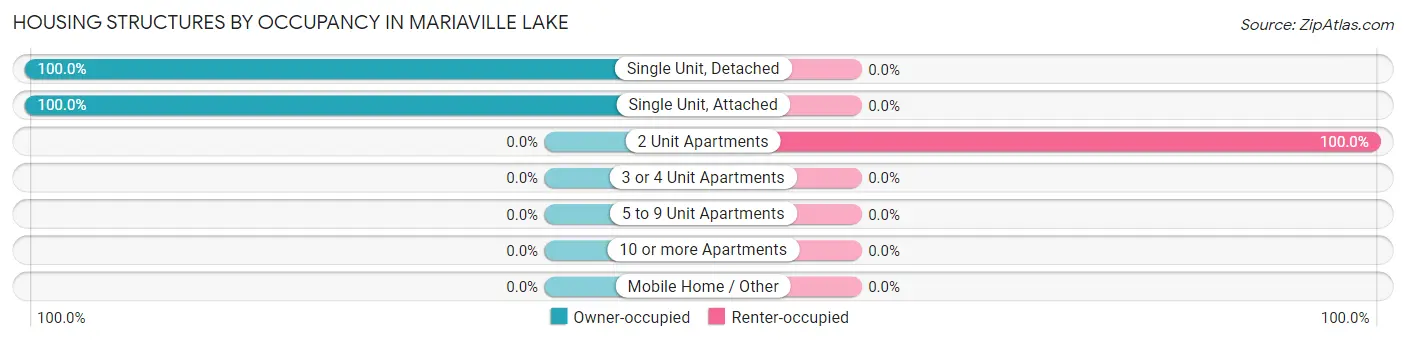
| Structure Type | Owner-occupied | Renter-occupied |
| Single Unit, Detached | 265 (100.0%) | 0 (0.0%) |
| Single Unit, Attached | 6 (100.0%) | 0 (0.0%) |
| 2 Unit Apartments | 0 (0.0%) | 121 (100.0%) |
| 3 or 4 Unit Apartments | 0 (0.0%) | 0 (0.0%) |
| 5 to 9 Unit Apartments | 0 (0.0%) | 0 (0.0%) |
| 10 or more Apartments | 0 (0.0%) | 0 (0.0%) |
| Mobile Home / Other | 0 (0.0%) | 0 (0.0%) |
| Total | 271 (69.1%) | 121 (30.9%) |
Housing Structures by Number of Rooms in Mariaville Lake
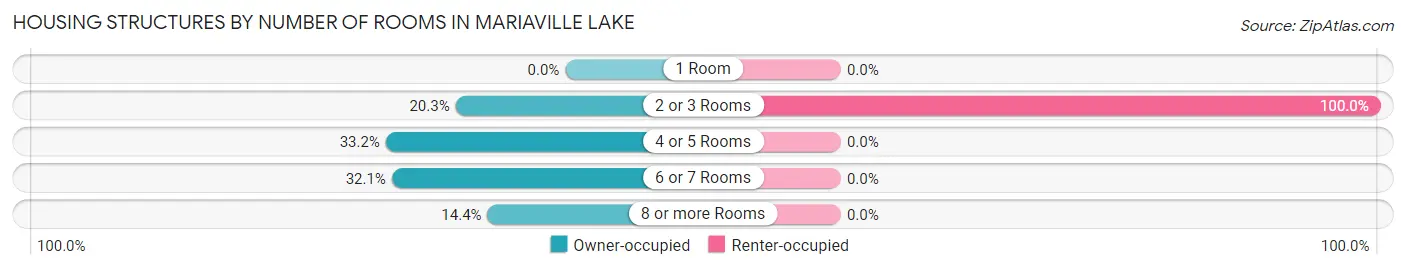
| Number of Rooms | Owner-occupied | Renter-occupied |
| 1 Room | 0 (0.0%) | 0 (0.0%) |
| 2 or 3 Rooms | 55 (20.3%) | 121 (100.0%) |
| 4 or 5 Rooms | 90 (33.2%) | 0 (0.0%) |
| 6 or 7 Rooms | 87 (32.1%) | 0 (0.0%) |
| 8 or more Rooms | 39 (14.4%) | 0 (0.0%) |
| Total | 271 (100.0%) | 121 (100.0%) |
Housing Structure by Heating Type in Mariaville Lake
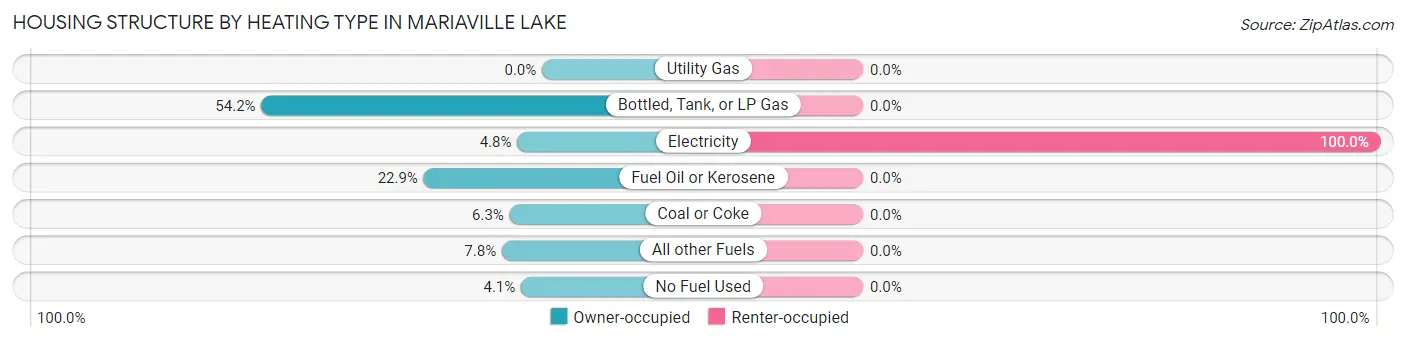
| Heating Type | Owner-occupied | Renter-occupied |
| Utility Gas | 0 (0.0%) | 0 (0.0%) |
| Bottled, Tank, or LP Gas | 147 (54.2%) | 0 (0.0%) |
| Electricity | 13 (4.8%) | 121 (100.0%) |
| Fuel Oil or Kerosene | 62 (22.9%) | 0 (0.0%) |
| Coal or Coke | 17 (6.3%) | 0 (0.0%) |
| All other Fuels | 21 (7.7%) | 0 (0.0%) |
| No Fuel Used | 11 (4.1%) | 0 (0.0%) |
| Total | 271 (100.0%) | 121 (100.0%) |
Household Vehicle Usage in Mariaville Lake
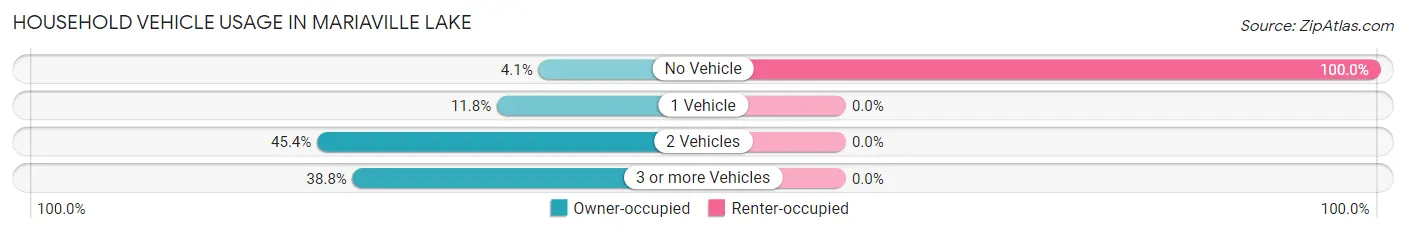
| Vehicles per Household | Owner-occupied | Renter-occupied |
| No Vehicle | 11 (4.1%) | 121 (100.0%) |
| 1 Vehicle | 32 (11.8%) | 0 (0.0%) |
| 2 Vehicles | 123 (45.4%) | 0 (0.0%) |
| 3 or more Vehicles | 105 (38.8%) | 0 (0.0%) |
| Total | 271 (100.0%) | 121 (100.0%) |
Real Estate & Mortgages in Mariaville Lake
Real Estate and Mortgage Overview in Mariaville Lake
| Characteristic | Without Mortgage | With Mortgage |
| Housing Units | 127 | 144 |
| Median Property Value | $285,300 | $226,500 |
| Median Household Income | $127,596 | $101 |
| Monthly Housing Costs | $1,121 | $26 |
| Real Estate Taxes | $6,533 | $0 |
Property Value by Mortgage Status in Mariaville Lake
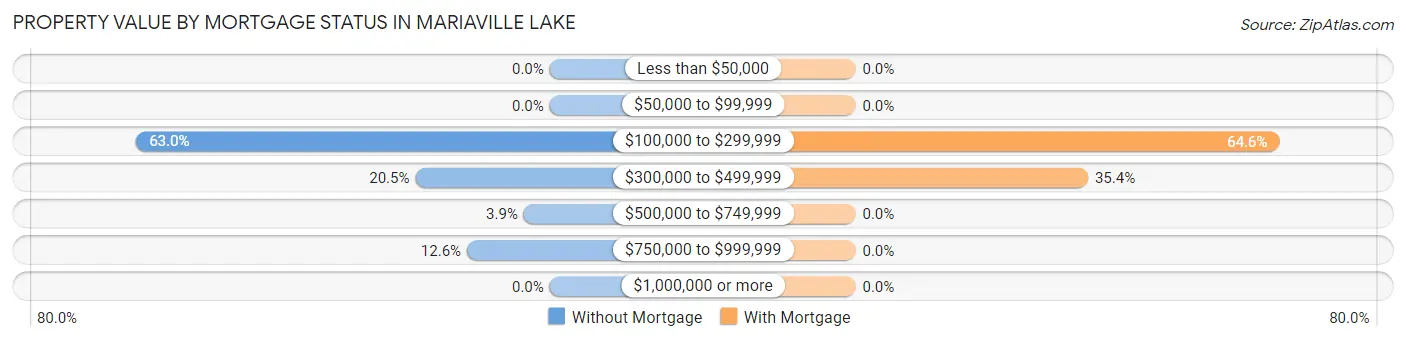
| Property Value | Without Mortgage | With Mortgage |
| Less than $50,000 | 0 (0.0%) | 0 (0.0%) |
| $50,000 to $99,999 | 0 (0.0%) | 0 (0.0%) |
| $100,000 to $299,999 | 80 (63.0%) | 93 (64.6%) |
| $300,000 to $499,999 | 26 (20.5%) | 51 (35.4%) |
| $500,000 to $749,999 | 5 (3.9%) | 0 (0.0%) |
| $750,000 to $999,999 | 16 (12.6%) | 0 (0.0%) |
| $1,000,000 or more | 0 (0.0%) | 0 (0.0%) |
| Total | 127 (100.0%) | 144 (100.0%) |
Household Income by Mortgage Status in Mariaville Lake
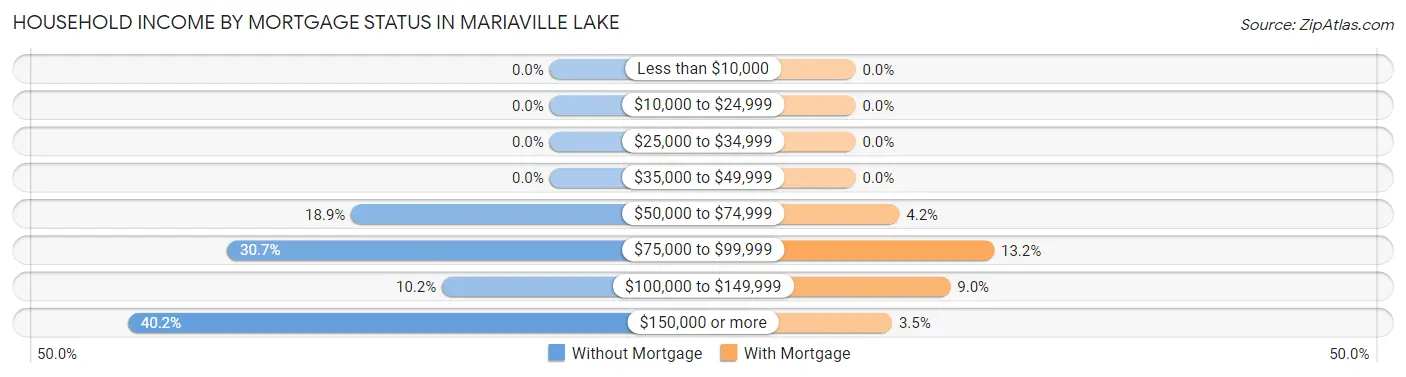
| Household Income | Without Mortgage | With Mortgage |
| Less than $10,000 | 0 (0.0%) | 0 (0.0%) |
| $10,000 to $24,999 | 0 (0.0%) | 0 (0.0%) |
| $25,000 to $34,999 | 0 (0.0%) | 0 (0.0%) |
| $35,000 to $49,999 | 0 (0.0%) | 0 (0.0%) |
| $50,000 to $74,999 | 24 (18.9%) | 6 (4.2%) |
| $75,000 to $99,999 | 39 (30.7%) | 19 (13.2%) |
| $100,000 to $149,999 | 13 (10.2%) | 13 (9.0%) |
| $150,000 or more | 51 (40.2%) | 5 (3.5%) |
| Total | 127 (100.0%) | 144 (100.0%) |
Property Value to Household Income Ratio in Mariaville Lake
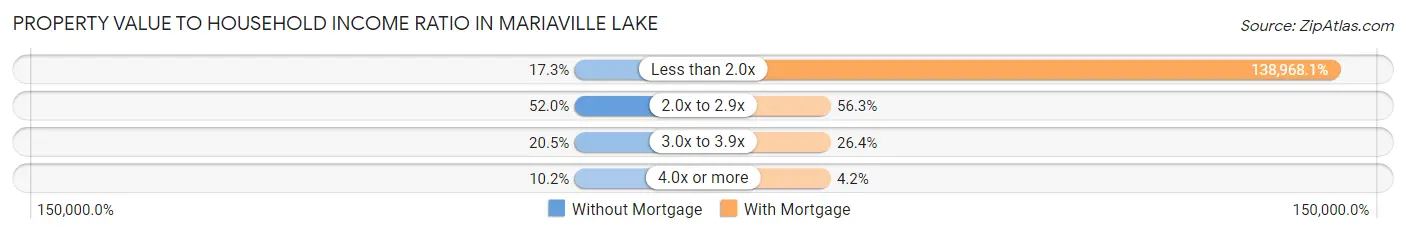
| Value-to-Income Ratio | Without Mortgage | With Mortgage |
| Less than 2.0x | 22 (17.3%) | 200,114 (138,968.1%) |
| 2.0x to 2.9x | 66 (52.0%) | 81 (56.2%) |
| 3.0x to 3.9x | 26 (20.5%) | 38 (26.4%) |
| 4.0x or more | 13 (10.2%) | 6 (4.2%) |
| Total | 127 (100.0%) | 144 (100.0%) |
Real Estate Taxes by Mortgage Status in Mariaville Lake
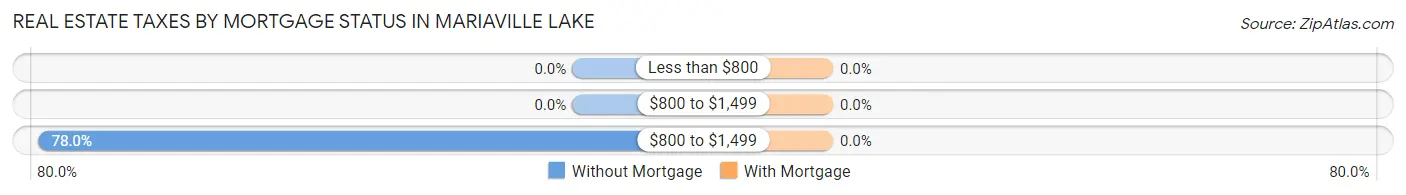
| Property Taxes | Without Mortgage | With Mortgage |
| Less than $800 | 0 (0.0%) | 0 (0.0%) |
| $800 to $1,499 | 0 (0.0%) | 0 (0.0%) |
| $800 to $1,499 | 99 (77.9%) | 0 (0.0%) |
| Total | 127 (100.0%) | 144 (100.0%) |
Health & Disability in Mariaville Lake
Health Insurance Coverage by Age in Mariaville Lake
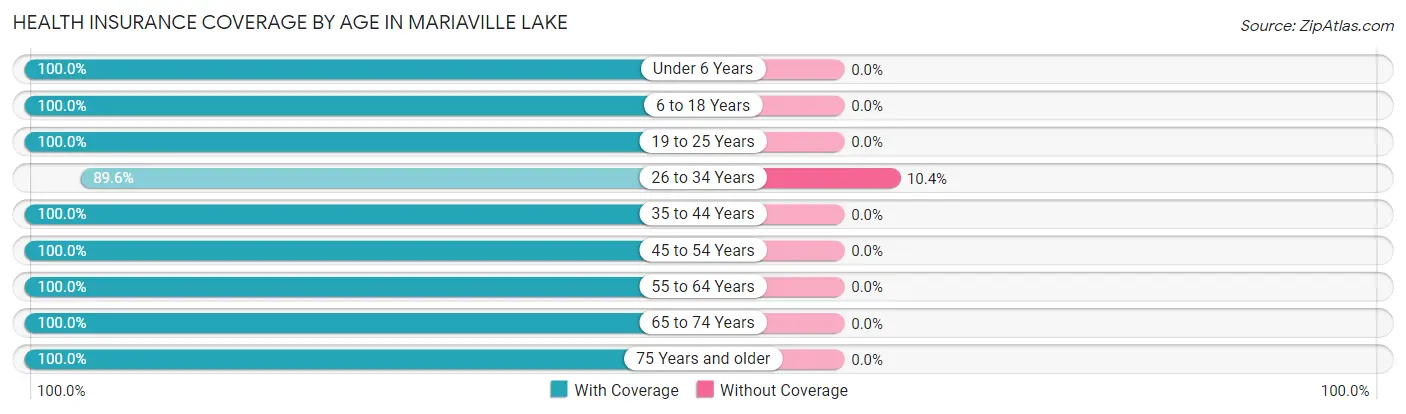
| Age Bracket | With Coverage | Without Coverage |
| Under 6 Years | 44 (100.0%) | 0 (0.0%) |
| 6 to 18 Years | 43 (100.0%) | 0 (0.0%) |
| 19 to 25 Years | 47 (100.0%) | 0 (0.0%) |
| 26 to 34 Years | 95 (89.6%) | 11 (10.4%) |
| 35 to 44 Years | 86 (100.0%) | 0 (0.0%) |
| 45 to 54 Years | 105 (100.0%) | 0 (0.0%) |
| 55 to 64 Years | 216 (100.0%) | 0 (0.0%) |
| 65 to 74 Years | 89 (100.0%) | 0 (0.0%) |
| 75 Years and older | 43 (100.0%) | 0 (0.0%) |
| Total | 768 (98.6%) | 11 (1.4%) |
Health Insurance Coverage by Citizenship Status in Mariaville Lake
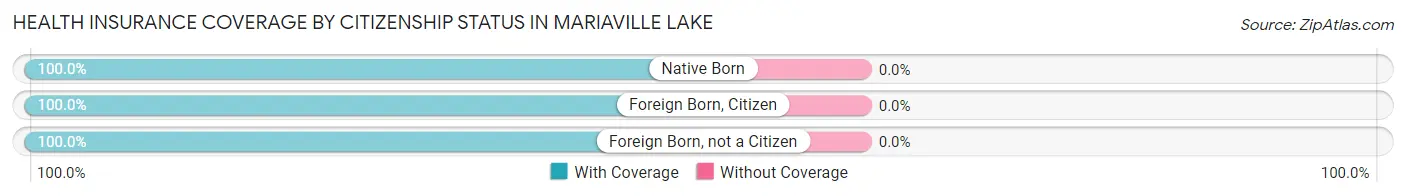
| Citizenship Status | With Coverage | Without Coverage |
| Native Born | 44 (100.0%) | 0 (0.0%) |
| Foreign Born, Citizen | 43 (100.0%) | 0 (0.0%) |
| Foreign Born, not a Citizen | 47 (100.0%) | 0 (0.0%) |
Health Insurance Coverage by Household Income in Mariaville Lake
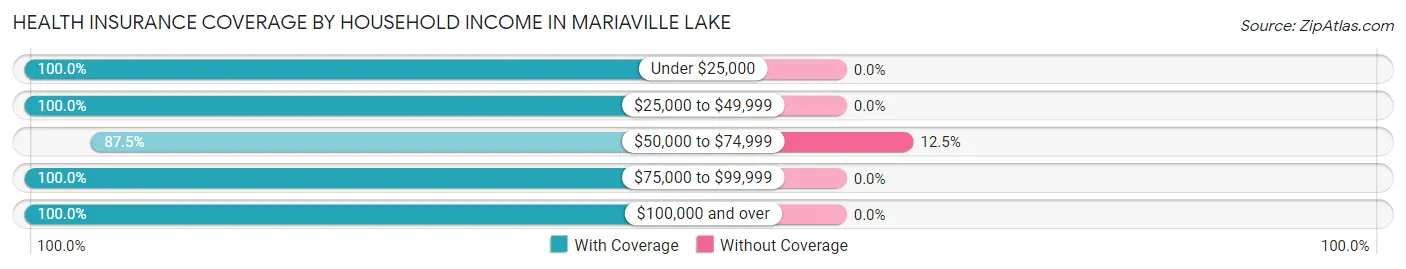
| Household Income | With Coverage | Without Coverage |
| Under $25,000 | 121 (100.0%) | 0 (0.0%) |
| $25,000 to $49,999 | 6 (100.0%) | 0 (0.0%) |
| $50,000 to $74,999 | 77 (87.5%) | 11 (12.5%) |
| $75,000 to $99,999 | 79 (100.0%) | 0 (0.0%) |
| $100,000 and over | 485 (100.0%) | 0 (0.0%) |
Public vs Private Health Insurance Coverage by Age in Mariaville Lake
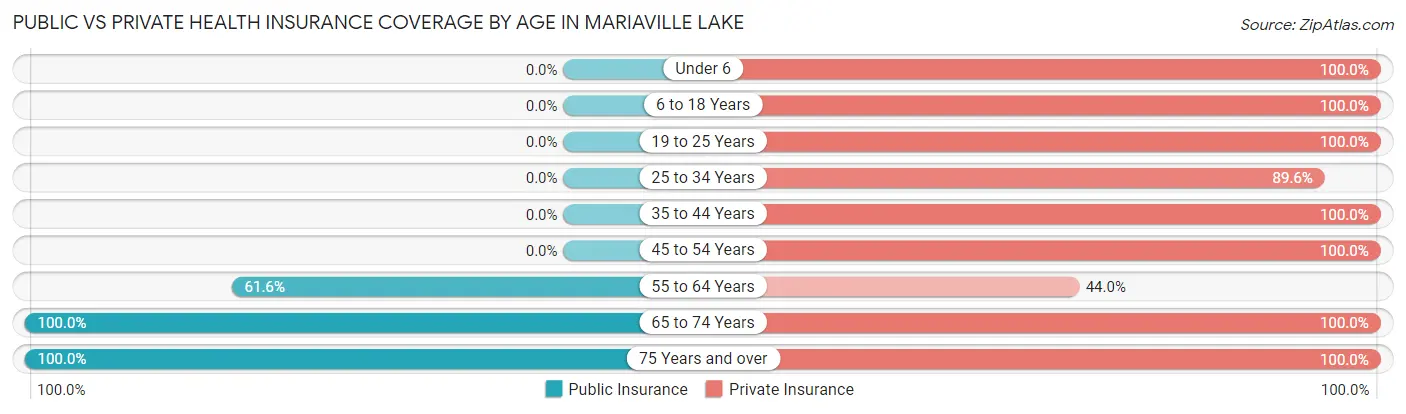
| Age Bracket | Public Insurance | Private Insurance |
| Under 6 | 0 (0.0%) | 44 (100.0%) |
| 6 to 18 Years | 0 (0.0%) | 43 (100.0%) |
| 19 to 25 Years | 0 (0.0%) | 47 (100.0%) |
| 25 to 34 Years | 0 (0.0%) | 95 (89.6%) |
| 35 to 44 Years | 0 (0.0%) | 86 (100.0%) |
| 45 to 54 Years | 0 (0.0%) | 105 (100.0%) |
| 55 to 64 Years | 133 (61.6%) | 95 (44.0%) |
| 65 to 74 Years | 89 (100.0%) | 89 (100.0%) |
| 75 Years and over | 43 (100.0%) | 43 (100.0%) |
| Total | 265 (34.0%) | 647 (83.1%) |
Disability Status by Sex by Age in Mariaville Lake
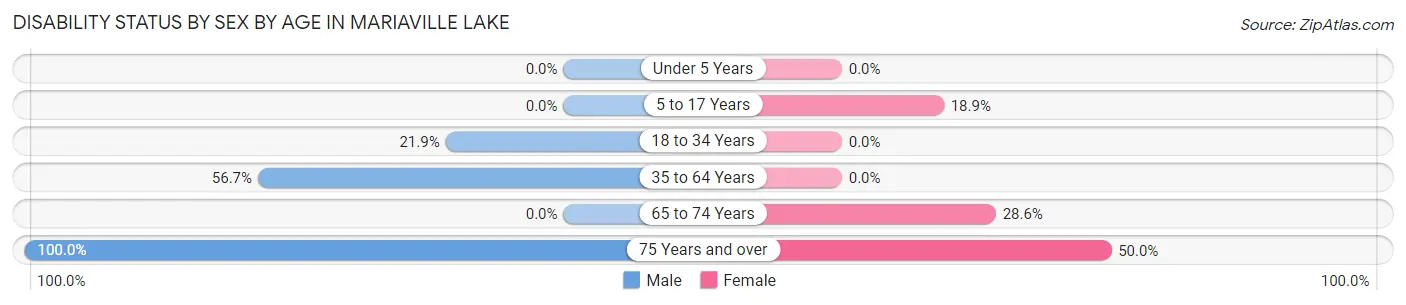
| Age Bracket | Male | Female |
| Under 5 Years | 0 (0.0%) | 0 (0.0%) |
| 5 to 17 Years | 0 (0.0%) | 7 (18.9%) |
| 18 to 34 Years | 14 (21.9%) | 0 (0.0%) |
| 35 to 64 Years | 148 (56.7%) | 0 (0.0%) |
| 65 to 74 Years | 0 (0.0%) | 12 (28.6%) |
| 75 Years and over | 17 (100.0%) | 13 (50.0%) |
Disability Class by Sex by Age in Mariaville Lake
Disability Class: Hearing Difficulty
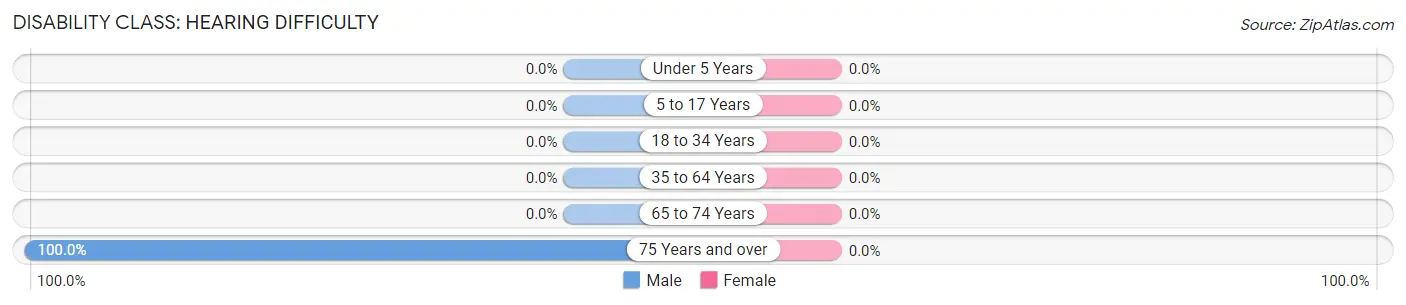
| Age Bracket | Male | Female |
| Under 5 Years | 0 (0.0%) | 0 (0.0%) |
| 5 to 17 Years | 0 (0.0%) | 0 (0.0%) |
| 18 to 34 Years | 0 (0.0%) | 0 (0.0%) |
| 35 to 64 Years | 0 (0.0%) | 0 (0.0%) |
| 65 to 74 Years | 0 (0.0%) | 0 (0.0%) |
| 75 Years and over | 17 (100.0%) | 0 (0.0%) |
Disability Class: Vision Difficulty
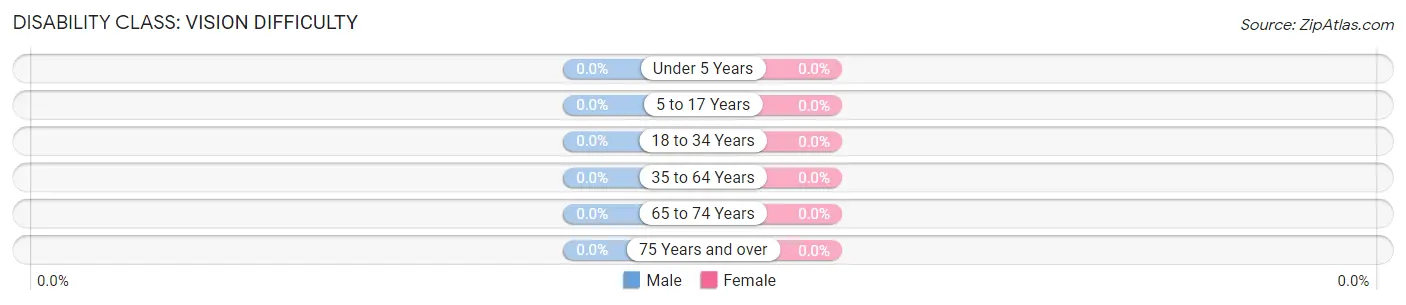
| Age Bracket | Male | Female |
| Under 5 Years | 0 (0.0%) | 0 (0.0%) |
| 5 to 17 Years | 0 (0.0%) | 0 (0.0%) |
| 18 to 34 Years | 0 (0.0%) | 0 (0.0%) |
| 35 to 64 Years | 0 (0.0%) | 0 (0.0%) |
| 65 to 74 Years | 0 (0.0%) | 0 (0.0%) |
| 75 Years and over | 0 (0.0%) | 0 (0.0%) |
Disability Class: Cognitive Difficulty
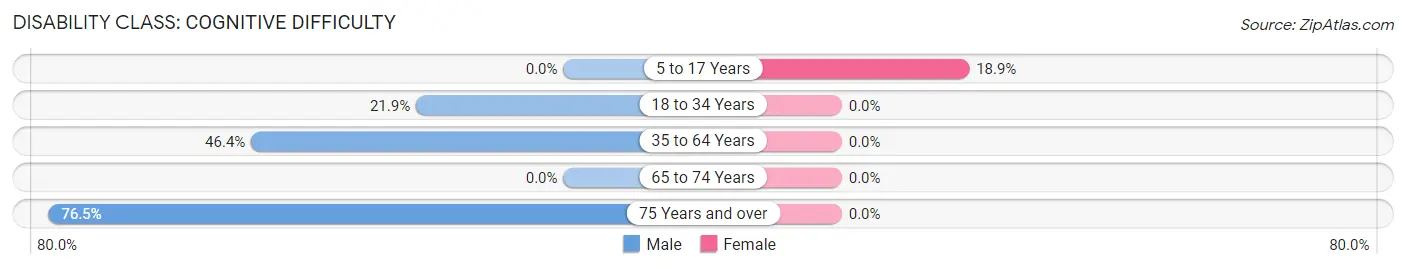
| Age Bracket | Male | Female |
| 5 to 17 Years | 0 (0.0%) | 7 (18.9%) |
| 18 to 34 Years | 14 (21.9%) | 0 (0.0%) |
| 35 to 64 Years | 121 (46.4%) | 0 (0.0%) |
| 65 to 74 Years | 0 (0.0%) | 0 (0.0%) |
| 75 Years and over | 13 (76.5%) | 0 (0.0%) |
Disability Class: Ambulatory Difficulty
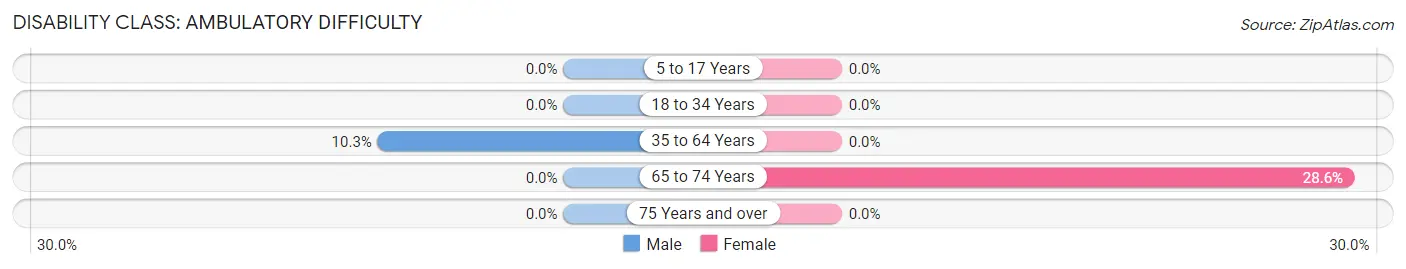
| Age Bracket | Male | Female |
| 5 to 17 Years | 0 (0.0%) | 0 (0.0%) |
| 18 to 34 Years | 0 (0.0%) | 0 (0.0%) |
| 35 to 64 Years | 27 (10.3%) | 0 (0.0%) |
| 65 to 74 Years | 0 (0.0%) | 12 (28.6%) |
| 75 Years and over | 0 (0.0%) | 0 (0.0%) |
Disability Class: Self-Care Difficulty
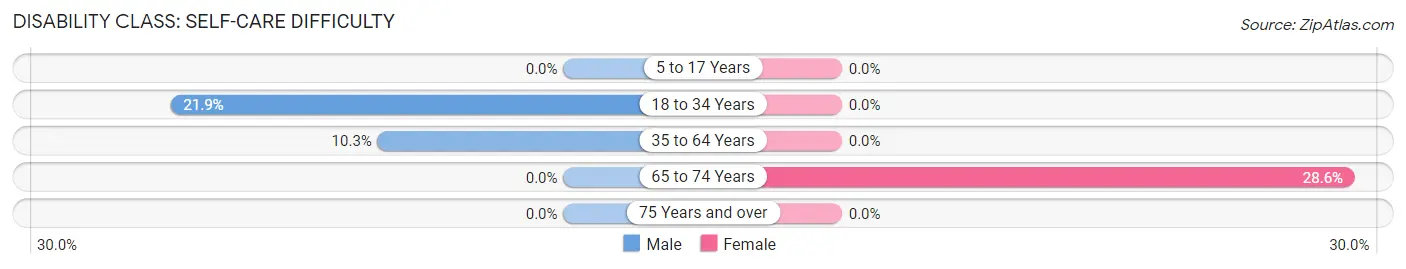
| Age Bracket | Male | Female |
| 5 to 17 Years | 0 (0.0%) | 0 (0.0%) |
| 18 to 34 Years | 14 (21.9%) | 0 (0.0%) |
| 35 to 64 Years | 27 (10.3%) | 0 (0.0%) |
| 65 to 74 Years | 0 (0.0%) | 12 (28.6%) |
| 75 Years and over | 0 (0.0%) | 0 (0.0%) |
Technology Access in Mariaville Lake
Computing Device Access in Mariaville Lake
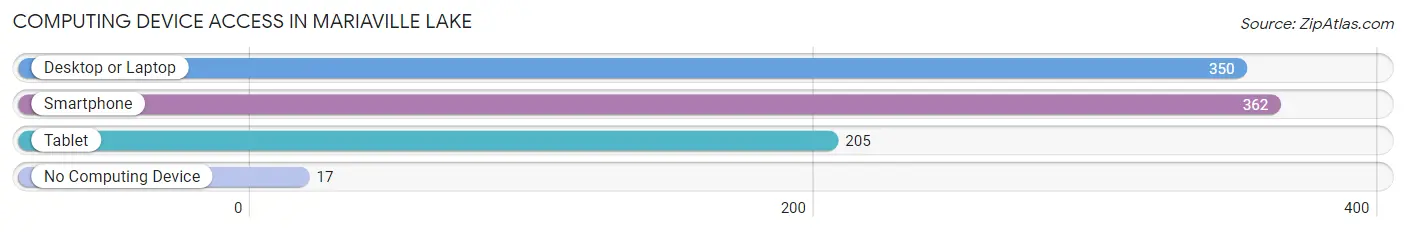
| Device Type | # Households | % Households |
| Desktop or Laptop | 350 | 89.3% |
| Smartphone | 362 | 92.3% |
| Tablet | 205 | 52.3% |
| No Computing Device | 17 | 4.3% |
| Total | 392 | 100.0% |
Internet Access in Mariaville Lake
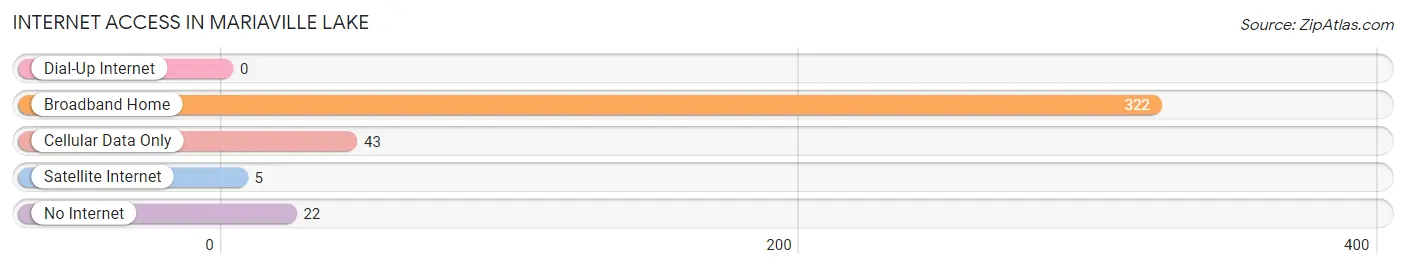
| Internet Type | # Households | % Households |
| Dial-Up Internet | 0 | 0.0% |
| Broadband Home | 322 | 82.1% |
| Cellular Data Only | 43 | 11.0% |
| Satellite Internet | 5 | 1.3% |
| No Internet | 22 | 5.6% |
| Total | 392 | 100.0% |
Mariaville Lake Summary
History
Marville Lake is a small lake located in the town of Duanesburg, New York. It is located in the foothills of the Adirondack Mountains and is part of the Mohawk River watershed. The lake is approximately 1.5 miles long and 0.5 miles wide. It is a popular destination for fishing, swimming, and boating.
The lake was originally known as “Mud Pond” by the local Native American tribes. The lake was first settled by Europeans in the late 1700s. The first settler was a Dutchman named Jacob Marville, who built a log cabin on the lake’s shore. The lake was then named after him.
In the early 1800s, the lake was used for logging and farming. The lake was also used for ice harvesting in the winter months. In the late 1800s, the lake became a popular destination for fishing and recreation. The first hotel was built on the lake in 1891.
In the early 1900s, the lake was used for hydroelectric power. The first dam was built in 1910 and the second in 1915. The dams were used to generate electricity for the local area.
In the 1950s, the lake was used for recreational activities such as swimming, fishing, and boating. The lake was also used for water skiing and jet skiing.
Geography
Marville Lake is located in the town of Duanesburg, New York. It is located in the foothills of the Adirondack Mountains and is part of the Mohawk River watershed. The lake is approximately 1.5 miles long and 0.5 miles wide. It has a maximum depth of 30 feet and an average depth of 15 feet.
The lake is fed by several small streams and is drained by the Mohawk River. The lake is surrounded by a variety of habitats including wetlands, forests, and meadows.
Economy
Marville Lake is a popular destination for fishing, swimming, and boating. The lake is also used for hydroelectric power. The lake is surrounded by several small towns and villages, which provide a variety of services and amenities.
The lake is also home to several marinas, which provide boat rentals, supplies, and services. There are also several restaurants and lodges located on the lake.
Demographics
Marville Lake is located in the town of Duanesburg, New York. According to the 2010 census, the population of the town was 5,945. The median age of the population was 42.7 years. The median household income was $50,945.
The population of the town is predominantly white (94.3%) with a small percentage of African Americans (2.2%) and Hispanics (2.2%). The town has a high rate of homeownership (83.2%) and a low rate of poverty (7.2%).
Conclusion
Marville Lake is a small lake located in the town of Duanesburg, New York. It is located in the foothills of the Adirondack Mountains and is part of the Mohawk River watershed. The lake is a popular destination for fishing, swimming, and boating. It is also used for hydroelectric power. The lake is surrounded by several small towns and villages, which provide a variety of services and amenities. The population of the town is predominantly white with a small percentage of African Americans and Hispanics. The town has a high rate of homeownership and a low rate of poverty.
Common Questions
What is Per Capita Income in Mariaville Lake?
Per Capita income in Mariaville Lake is $54,378.
What is the Median Family Income in Mariaville Lake?
Median Family Income in Mariaville Lake is $181,154.
What is Income or Wage Gap in Mariaville Lake?
Income or Wage Gap in Mariaville Lake is 41.4%.
Women in Mariaville Lake earn 58.6 cents for every dollar earned by a man.
What is Inequality or Gini Index in Mariaville Lake?
Inequality or Gini Index in Mariaville Lake is 0.51.
What is the Total Population of Mariaville Lake?
Total Population of Mariaville Lake is 779.
What is the Total Male Population of Mariaville Lake?
Total Male Population of Mariaville Lake is 439.
What is the Total Female Population of Mariaville Lake?
Total Female Population of Mariaville Lake is 340.
What is the Ratio of Males per 100 Females in Mariaville Lake?
There are 129.12 Males per 100 Females in Mariaville Lake.
What is the Ratio of Females per 100 Males in Mariaville Lake?
There are 77.45 Females per 100 Males in Mariaville Lake.
What is the Median Population Age in Mariaville Lake?
Median Population Age in Mariaville Lake is 54.3 Years.
What is the Average Family Size in Mariaville Lake
Average Family Size in Mariaville Lake is 2.9 People.
What is the Average Household Size in Mariaville Lake
Average Household Size in Mariaville Lake is 2.0 People.
How Large is the Labor Force in Mariaville Lake?
There are 439 People in the Labor Forcein in Mariaville Lake.
What is the Percentage of People in the Labor Force in Mariaville Lake?
63.4% of People are in the Labor Force in Mariaville Lake.