Glasco, NY Map & Demographics
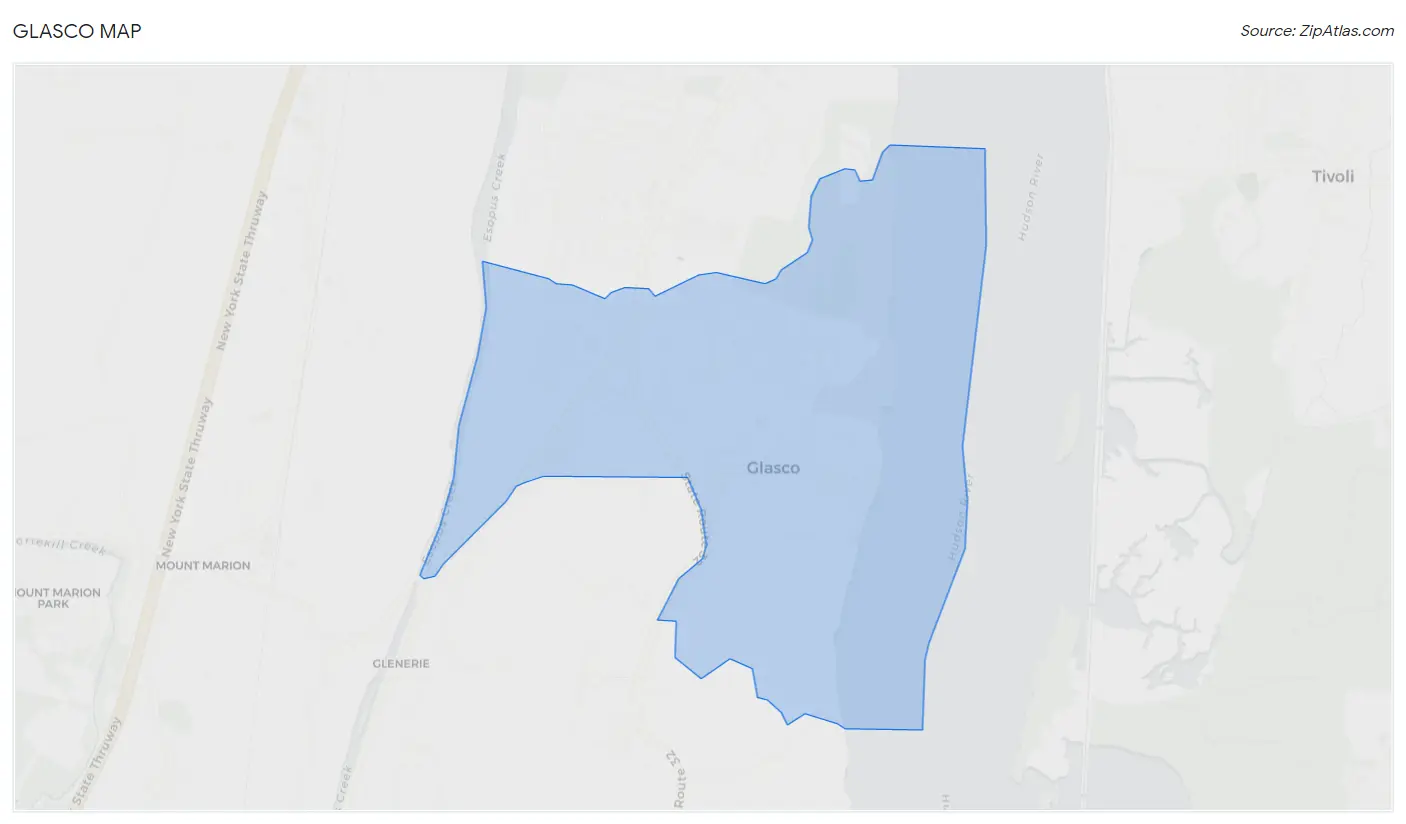
Glasco Map
Glasco Overview
$40,900
PER CAPITA INCOME
$86,250
AVG FAMILY INCOME
$56,875
AVG HOUSEHOLD INCOME
41.1%
WAGE / INCOME GAP [ % ]
58.9¢/ $1
WAGE / INCOME GAP [ $ ]
0.47
INEQUALITY / GINI INDEX
2,134
TOTAL POPULATION
977
MALE POPULATION
1,157
FEMALE POPULATION
84.44
MALES / 100 FEMALES
118.42
FEMALES / 100 MALES
52.8
MEDIAN AGE
2.6
AVG FAMILY SIZE
2.0
AVG HOUSEHOLD SIZE
1,080
LABOR FORCE [ PEOPLE ]
58.4%
PERCENT IN LABOR FORCE
0.3%
UNEMPLOYMENT RATE
Glasco Zip Codes
Glasco Area Codes
Income in Glasco
Income Overview in Glasco
Per Capita Income in Glasco is $40,900, while median incomes of families and households are $86,250 and $56,875 respectively.
| Characteristic | Number | Measure |
| Per Capita Income | 2,134 | $40,900 |
| Median Family Income | 547 | $86,250 |
| Mean Family Income | 547 | $101,147 |
| Median Household Income | 1,008 | $56,875 |
| Mean Household Income | 1,008 | $84,323 |
| Income Deficit | 547 | $0 |
| Wage / Income Gap (%) | 2,134 | 41.11% |
| Wage / Income Gap ($) | 2,134 | 58.89¢ per $1 |
| Gini / Inequality Index | 2,134 | 0.47 |
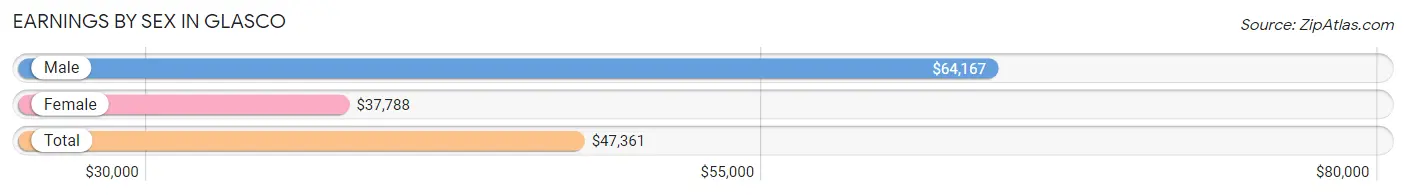
Earnings by Sex in Glasco
Average Earnings in Glasco are $47,361, $64,167 for men and $37,788 for women, a difference of 41.1%.
| Sex | Number | Average Earnings |
| Male | 444 (40.6%) | $64,167 |
| Female | 649 (59.4%) | $37,788 |
| Total | 1,093 (100.0%) | $47,361 |
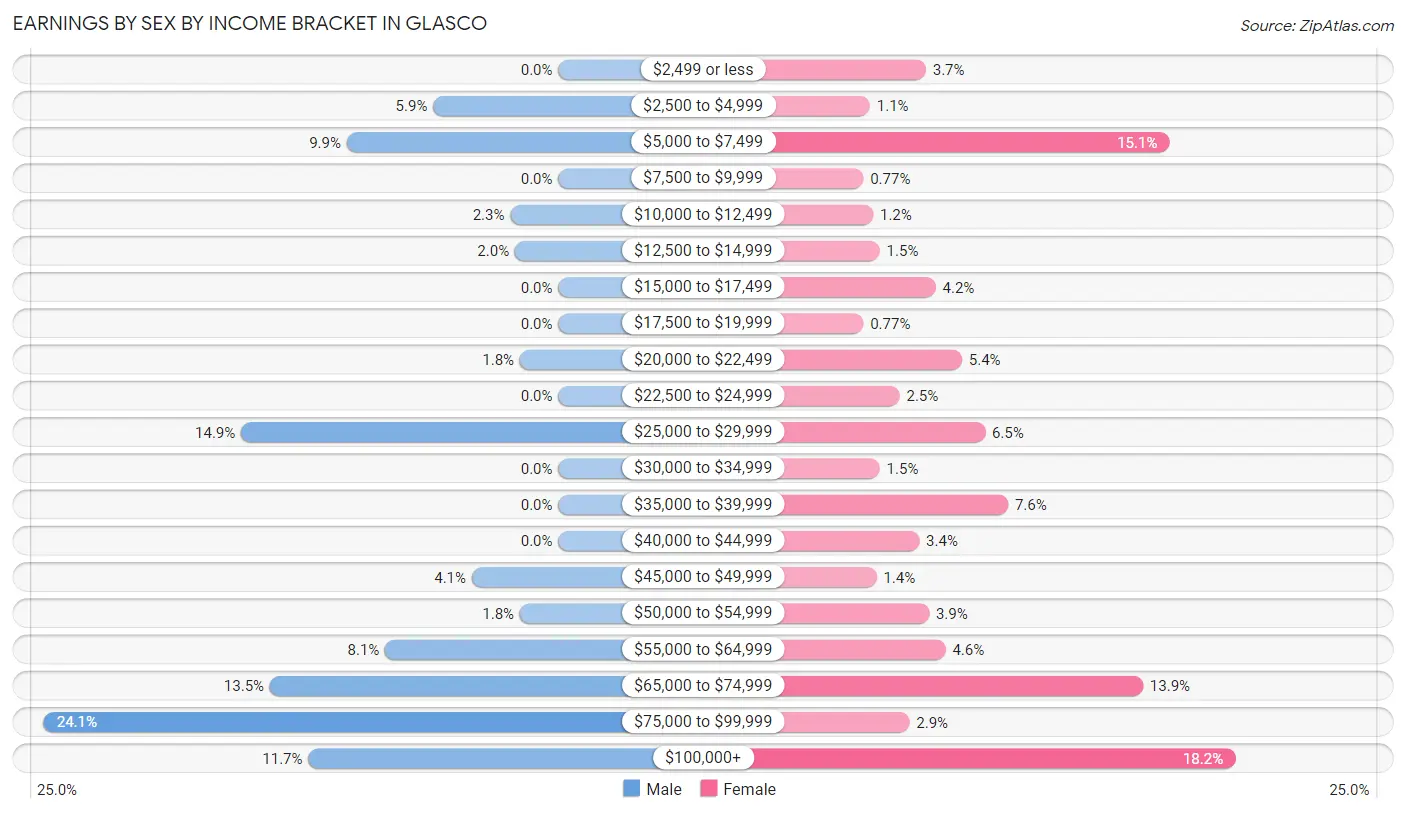
Earnings by Sex by Income Bracket in Glasco
The most common earnings brackets in Glasco are $75,000 to $99,999 for men (107 | 24.1%) and $100,000+ for women (118 | 18.2%).
| Income | Male | Female |
| $2,499 or less | 0 (0.0%) | 24 (3.7%) |
| $2,500 to $4,999 | 26 (5.9%) | 7 (1.1%) |
| $5,000 to $7,499 | 44 (9.9%) | 98 (15.1%) |
| $7,500 to $9,999 | 0 (0.0%) | 5 (0.8%) |
| $10,000 to $12,499 | 10 (2.2%) | 8 (1.2%) |
| $12,500 to $14,999 | 9 (2.0%) | 10 (1.5%) |
| $15,000 to $17,499 | 0 (0.0%) | 27 (4.2%) |
| $17,500 to $19,999 | 0 (0.0%) | 5 (0.8%) |
| $20,000 to $22,499 | 8 (1.8%) | 35 (5.4%) |
| $22,500 to $24,999 | 0 (0.0%) | 16 (2.5%) |
| $25,000 to $29,999 | 66 (14.9%) | 42 (6.5%) |
| $30,000 to $34,999 | 0 (0.0%) | 10 (1.5%) |
| $35,000 to $39,999 | 0 (0.0%) | 49 (7.5%) |
| $40,000 to $44,999 | 0 (0.0%) | 22 (3.4%) |
| $45,000 to $49,999 | 18 (4.1%) | 9 (1.4%) |
| $50,000 to $54,999 | 8 (1.8%) | 25 (3.8%) |
| $55,000 to $64,999 | 36 (8.1%) | 30 (4.6%) |
| $65,000 to $74,999 | 60 (13.5%) | 90 (13.9%) |
| $75,000 to $99,999 | 107 (24.1%) | 19 (2.9%) |
| $100,000+ | 52 (11.7%) | 118 (18.2%) |
| Total | 444 (100.0%) | 649 (100.0%) |
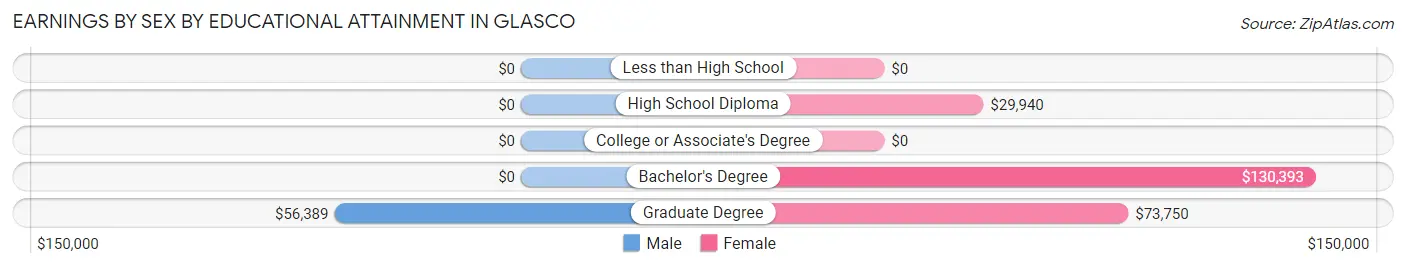
Earnings by Sex by Educational Attainment in Glasco
Average earnings in Glasco are $56,991 for men and $41,875 for women, a difference of 26.5%. Men with an educational attainment of graduate degree enjoy the highest average annual earnings of $56,389, while those with graduate degree education earn the least with $56,389. Women with an educational attainment of bachelor's degree earn the most with the average annual earnings of $130,393, while those with high school diploma education have the smallest earnings of $29,940.
| Educational Attainment | Male Income | Female Income |
| Less than High School | - | - |
| High School Diploma | - | - |
| College or Associate's Degree | - | - |
| Bachelor's Degree | - | - |
| Graduate Degree | $56,389 | $73,750 |
| Total | $56,991 | $41,875 |
Family Income in Glasco
Family Income Brackets in Glasco
According to the Glasco family income data, there are 114 families falling into the $50,000 to $74,999 income range, which is the most common income bracket and makes up 20.8% of all families.
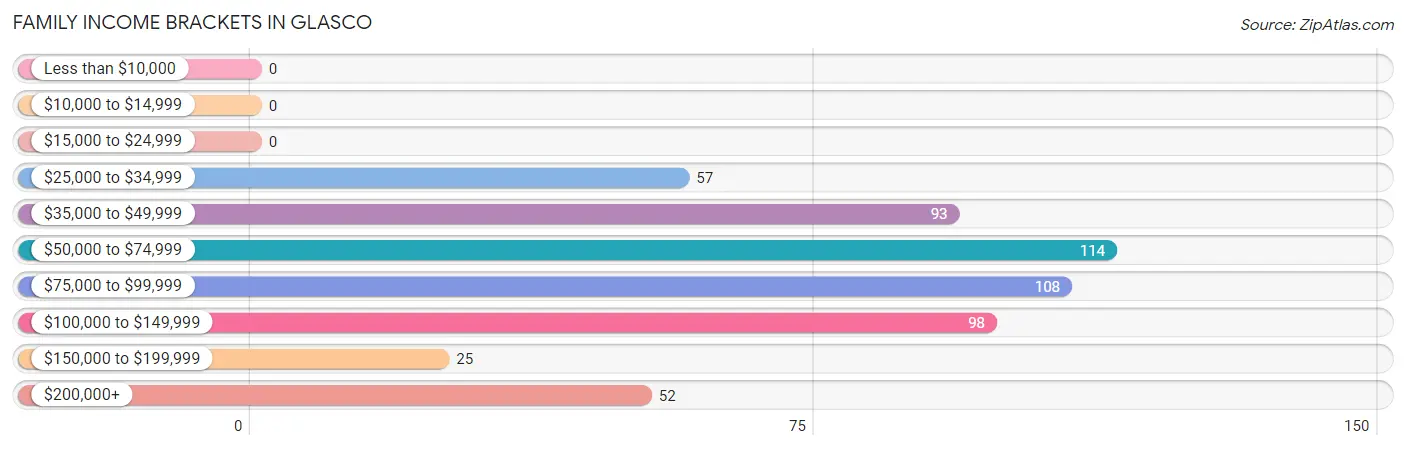
| Income Bracket | # Families | % Families |
| Less than $10,000 | 0 | 0.0% |
| $10,000 to $14,999 | 0 | 0.0% |
| $15,000 to $24,999 | 0 | 0.0% |
| $25,000 to $34,999 | 57 | 10.4% |
| $35,000 to $49,999 | 93 | 17.0% |
| $50,000 to $74,999 | 114 | 20.8% |
| $75,000 to $99,999 | 108 | 19.7% |
| $100,000 to $149,999 | 98 | 17.9% |
| $150,000 to $199,999 | 25 | 4.6% |
| $200,000+ | 52 | 9.5% |
Family Income by Famaliy Size in Glasco
3-person families (56 | 10.2%) account for the highest median family income in Glasco with $120,833 per family, while 3-person families (56 | 10.2%) have the highest median income of $40,278 per family member.
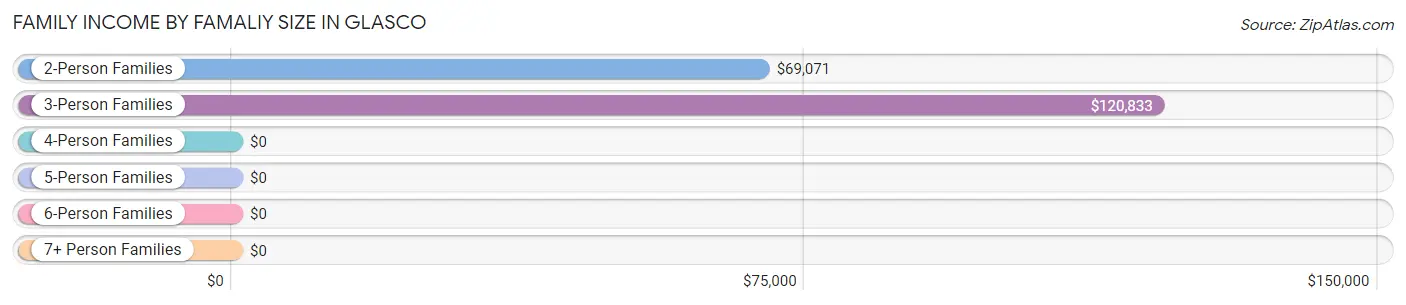
| Income Bracket | # Families | Median Income |
| 2-Person Families | 389 (71.1%) | $69,071 |
| 3-Person Families | 56 (10.2%) | $120,833 |
| 4-Person Families | 81 (14.8%) | $0 |
| 5-Person Families | 14 (2.6%) | $0 |
| 6-Person Families | 7 (1.3%) | $0 |
| 7+ Person Families | 0 (0.0%) | $0 |
| Total | 547 (100.0%) | $86,250 |
Family Income by Number of Earners in Glasco
The median family income in Glasco is $86,250, with families comprising 3+ earners (28) having the highest median family income of $250,001, while families with no earners (106) have the lowest median family income of $42,031, accounting for 5.1% and 19.4% of families, respectively.
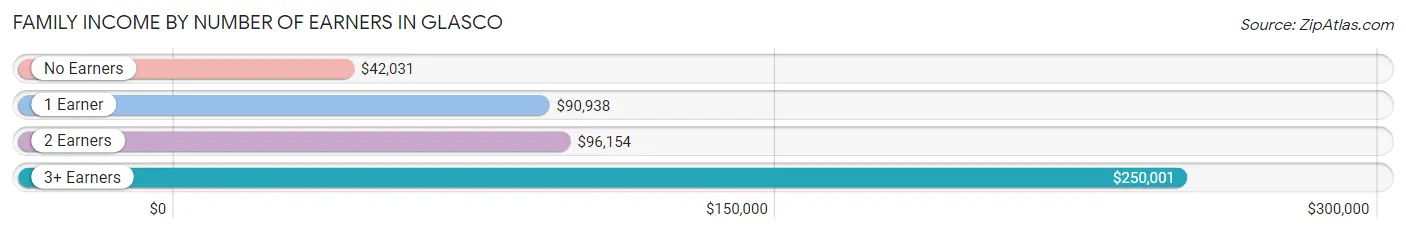
| Number of Earners | # Families | Median Income |
| No Earners | 106 (19.4%) | $42,031 |
| 1 Earner | 125 (22.9%) | $90,938 |
| 2 Earners | 288 (52.6%) | $96,154 |
| 3+ Earners | 28 (5.1%) | $250,001 |
| Total | 547 (100.0%) | $86,250 |
Household Income in Glasco
Household Income Brackets in Glasco
With 196 households falling in the category, the $100,000 to $149,999 income range is the most frequent in Glasco, accounting for 19.4% of all households. In contrast, only 22 households (2.2%) fall into the less than $10,000 income bracket, making it the least populous group.
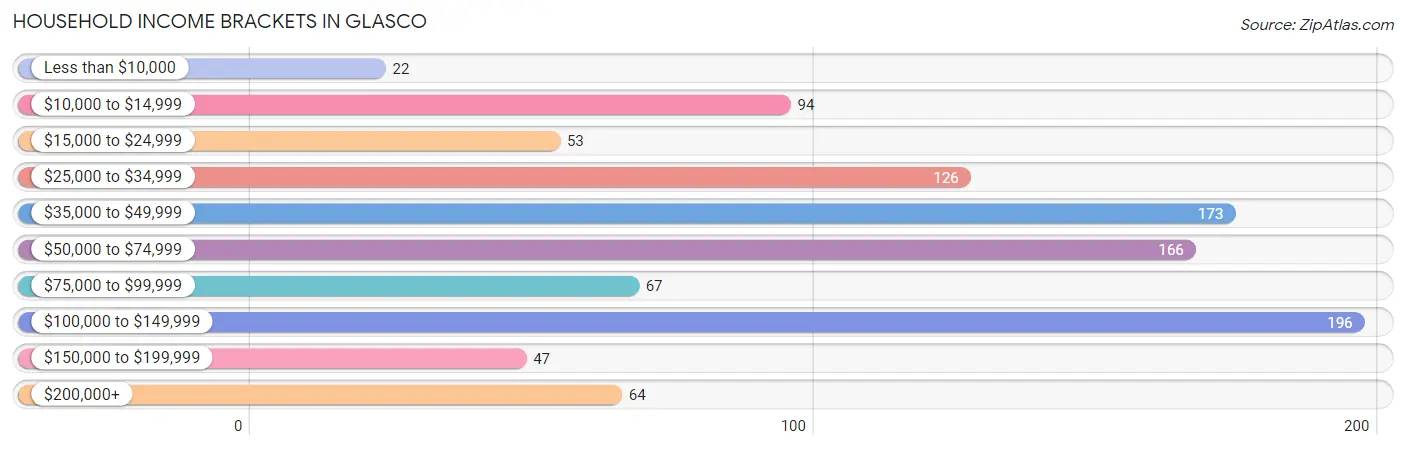
| Income Bracket | # Households | % Households |
| Less than $10,000 | 22 | 2.2% |
| $10,000 to $14,999 | 94 | 9.3% |
| $15,000 to $24,999 | 53 | 5.3% |
| $25,000 to $34,999 | 126 | 12.5% |
| $35,000 to $49,999 | 173 | 17.2% |
| $50,000 to $74,999 | 166 | 16.5% |
| $75,000 to $99,999 | 67 | 6.6% |
| $100,000 to $149,999 | 196 | 19.4% |
| $150,000 to $199,999 | 47 | 4.7% |
| $200,000+ | 64 | 6.3% |
Household Income by Householder Age in Glasco
The median household income in Glasco is $56,875, with the highest median household income of $97,788 found in the 45 to 64 years age bracket for the primary householder. A total of 342 households (33.9%) fall into this category. Meanwhile, the 15 to 24 years age bracket for the primary householder has the lowest median household income of $0, with 36 households (3.6%) in this group.
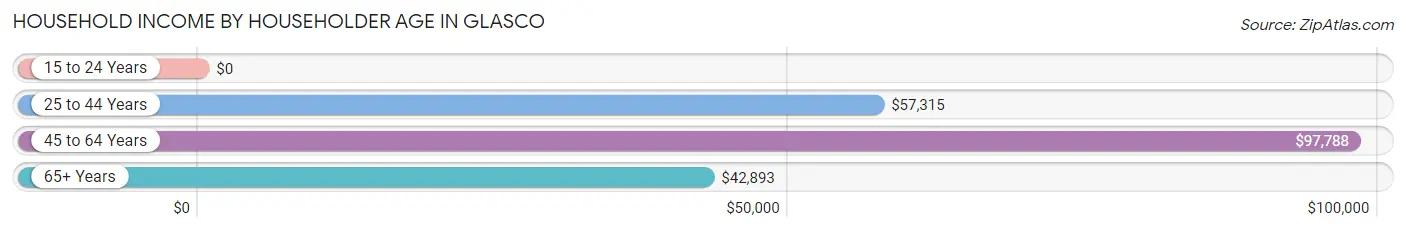
| Income Bracket | # Households | Median Income |
| 15 to 24 Years | 36 (3.6%) | $0 |
| 25 to 44 Years | 172 (17.1%) | $57,315 |
| 45 to 64 Years | 342 (33.9%) | $97,788 |
| 65+ Years | 458 (45.4%) | $42,893 |
| Total | 1,008 (100.0%) | $56,875 |
Poverty in Glasco
Income Below Poverty by Sex and Age in Glasco
With 20.1% poverty level for males and 16.9% for females among the residents of Glasco, 15 year old males and 18 to 24 year old females are the most vulnerable to poverty, with 45 males (100.0%) and 26 females (68.4%) in their respective age groups living below the poverty level.
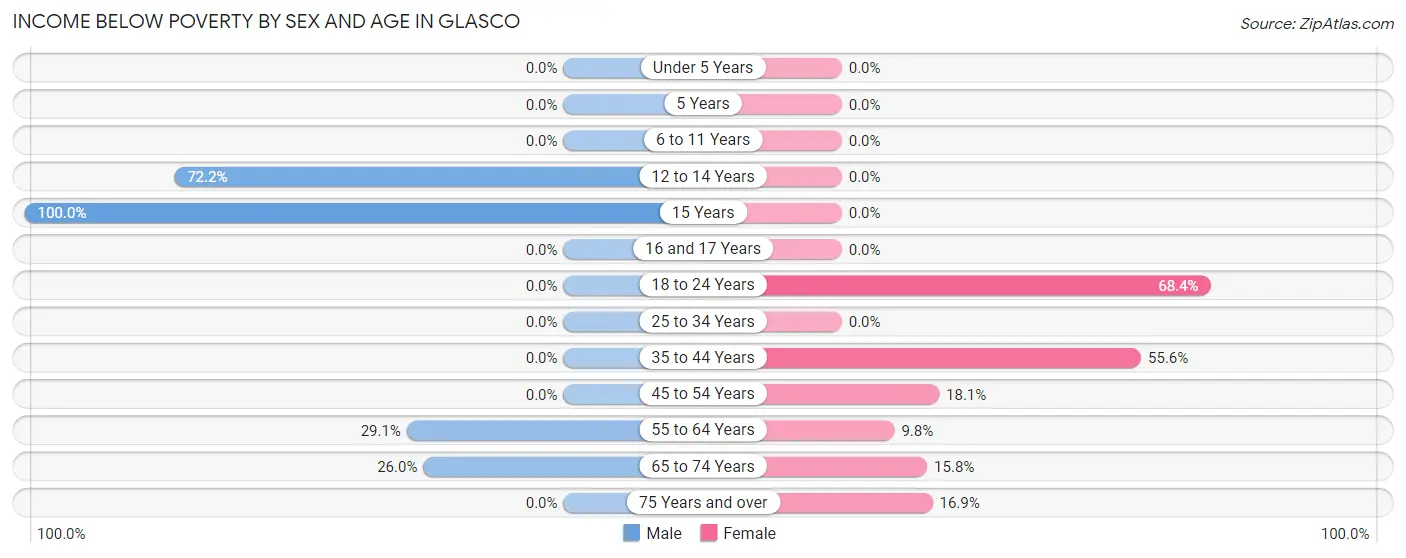
| Age Bracket | Male | Female |
| Under 5 Years | 0 (0.0%) | 0 (0.0%) |
| 5 Years | 0 (0.0%) | 0 (0.0%) |
| 6 to 11 Years | 0 (0.0%) | 0 (0.0%) |
| 12 to 14 Years | 65 (72.2%) | 0 (0.0%) |
| 15 Years | 45 (100.0%) | 0 (0.0%) |
| 16 and 17 Years | 0 (0.0%) | 0 (0.0%) |
| 18 to 24 Years | 0 (0.0%) | 26 (68.4%) |
| 25 to 34 Years | 0 (0.0%) | 0 (0.0%) |
| 35 to 44 Years | 0 (0.0%) | 55 (55.6%) |
| 45 to 54 Years | 0 (0.0%) | 28 (18.1%) |
| 55 to 64 Years | 41 (29.1%) | 22 (9.8%) |
| 65 to 74 Years | 45 (26.0%) | 35 (15.8%) |
| 75 Years and over | 0 (0.0%) | 30 (16.9%) |
| Total | 196 (20.1%) | 196 (16.9%) |
Income Above Poverty by Sex and Age in Glasco
According to the poverty statistics in Glasco, males aged under 5 years and females aged under 5 years are the age groups that are most secure financially, with 100.0% of males and 100.0% of females in these age groups living above the poverty line.
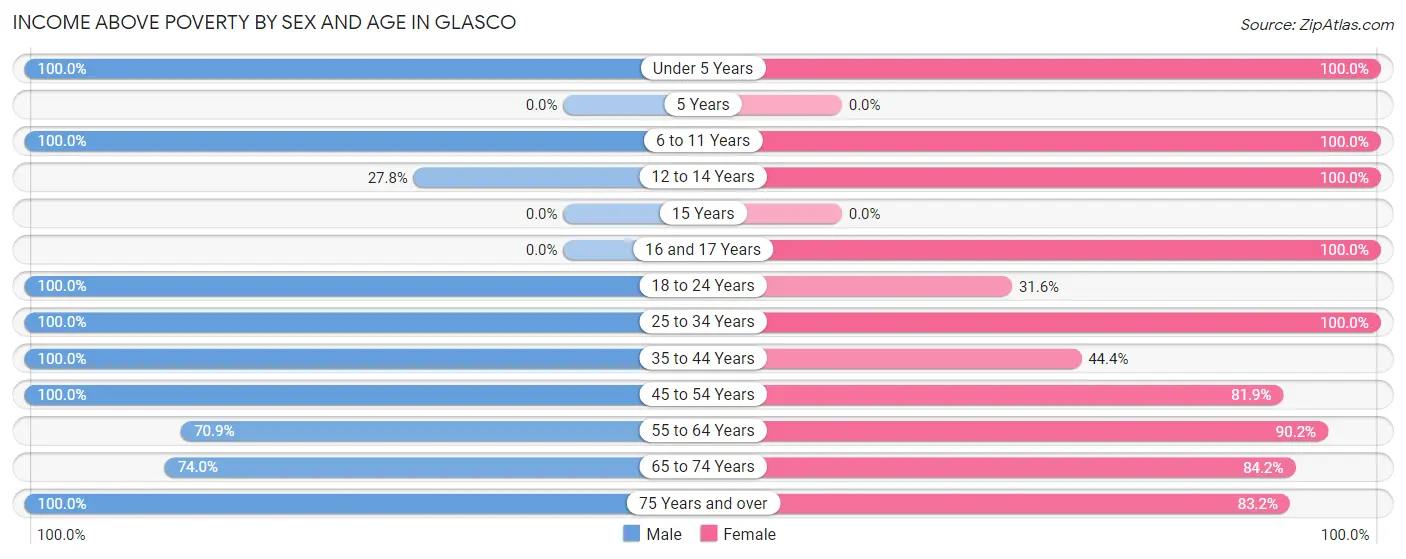
| Age Bracket | Male | Female |
| Under 5 Years | 30 (100.0%) | 11 (100.0%) |
| 5 Years | 0 (0.0%) | 0 (0.0%) |
| 6 to 11 Years | 77 (100.0%) | 24 (100.0%) |
| 12 to 14 Years | 25 (27.8%) | 8 (100.0%) |
| 15 Years | 0 (0.0%) | 0 (0.0%) |
| 16 and 17 Years | 0 (0.0%) | 49 (100.0%) |
| 18 to 24 Years | 123 (100.0%) | 12 (31.6%) |
| 25 to 34 Years | 73 (100.0%) | 149 (100.0%) |
| 35 to 44 Years | 66 (100.0%) | 44 (44.4%) |
| 45 to 54 Years | 60 (100.0%) | 127 (81.9%) |
| 55 to 64 Years | 100 (70.9%) | 203 (90.2%) |
| 65 to 74 Years | 128 (74.0%) | 186 (84.2%) |
| 75 Years and over | 99 (100.0%) | 148 (83.2%) |
| Total | 781 (79.9%) | 961 (83.1%) |
Income Below Poverty Among Married-Couple Families in Glasco
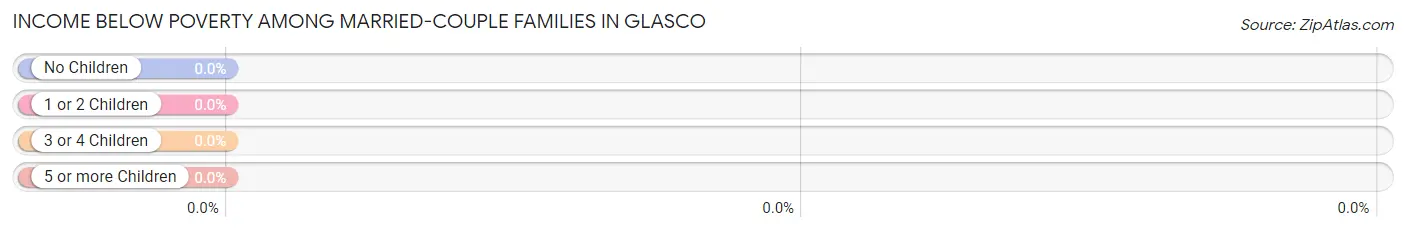
| Children | Above Poverty | Below Poverty |
| No Children | 233 (100.0%) | 0 (0.0%) |
| 1 or 2 Children | 56 (100.0%) | 0 (0.0%) |
| 3 or 4 Children | 15 (100.0%) | 0 (0.0%) |
| 5 or more Children | 0 (0.0%) | 0 (0.0%) |
| Total | 304 (100.0%) | 0 (0.0%) |
Income Below Poverty Among Single-Parent Households in Glasco
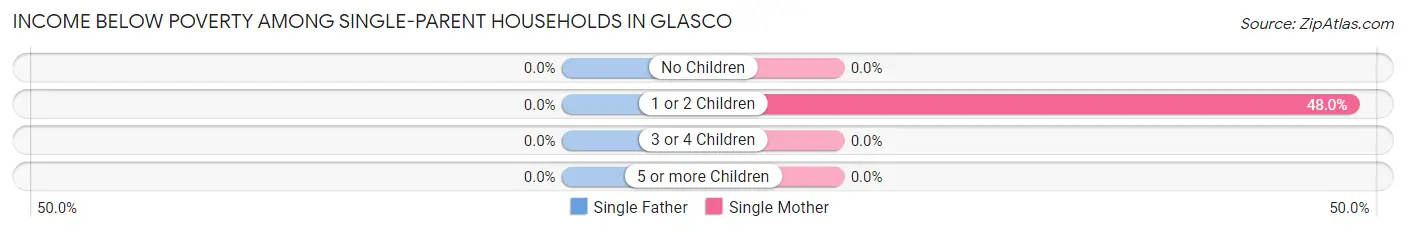
| Children | Single Father | Single Mother |
| No Children | 0 (0.0%) | 0 (0.0%) |
| 1 or 2 Children | 0 (0.0%) | 48 (48.0%) |
| 3 or 4 Children | 0 (0.0%) | 0 (0.0%) |
| 5 or more Children | 0 (0.0%) | 0 (0.0%) |
| Total | 0 (0.0%) | 48 (26.8%) |
Income Below Poverty Among Married-Couple vs Single-Parent Households in Glasco
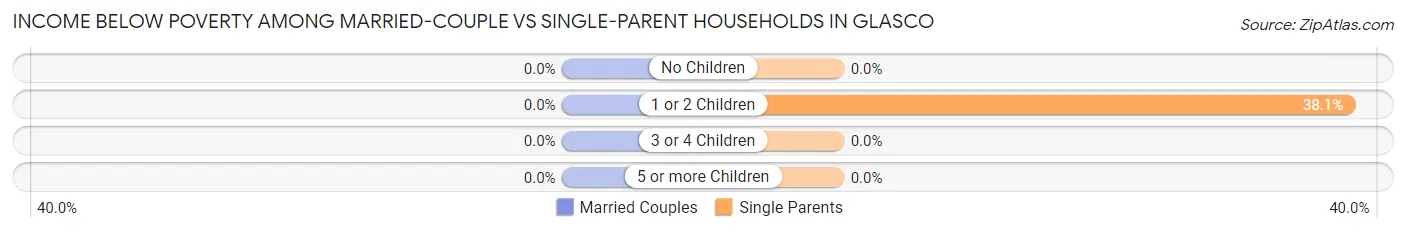
| Children | Married-Couple Families | Single-Parent Households |
| No Children | 0 (0.0%) | 0 (0.0%) |
| 1 or 2 Children | 0 (0.0%) | 48 (38.1%) |
| 3 or 4 Children | 0 (0.0%) | 0 (0.0%) |
| 5 or more Children | 0 (0.0%) | 0 (0.0%) |
| Total | 0 (0.0%) | 48 (19.8%) |
Race in Glasco
The most populous races in Glasco are White / Caucasian (1,664 | 78.0%), Two or more Races (354 | 16.6%), and Hispanic or Latino (241 | 11.3%).
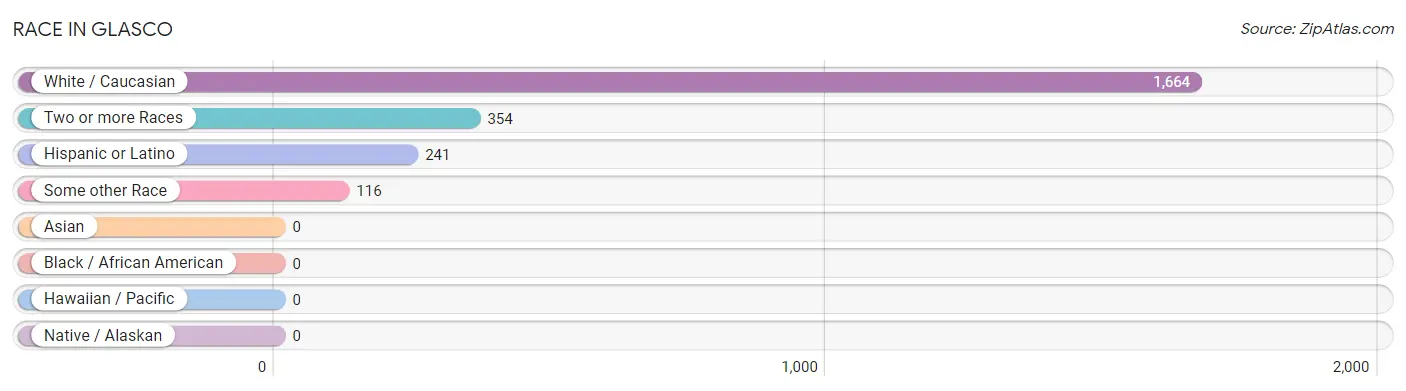
| Race | # Population | % Population |
| Asian | 0 | 0.0% |
| Black / African American | 0 | 0.0% |
| Hawaiian / Pacific | 0 | 0.0% |
| Hispanic or Latino | 241 | 11.3% |
| Native / Alaskan | 0 | 0.0% |
| White / Caucasian | 1,664 | 78.0% |
| Two or more Races | 354 | 16.6% |
| Some other Race | 116 | 5.4% |
| Total | 2,134 | 100.0% |
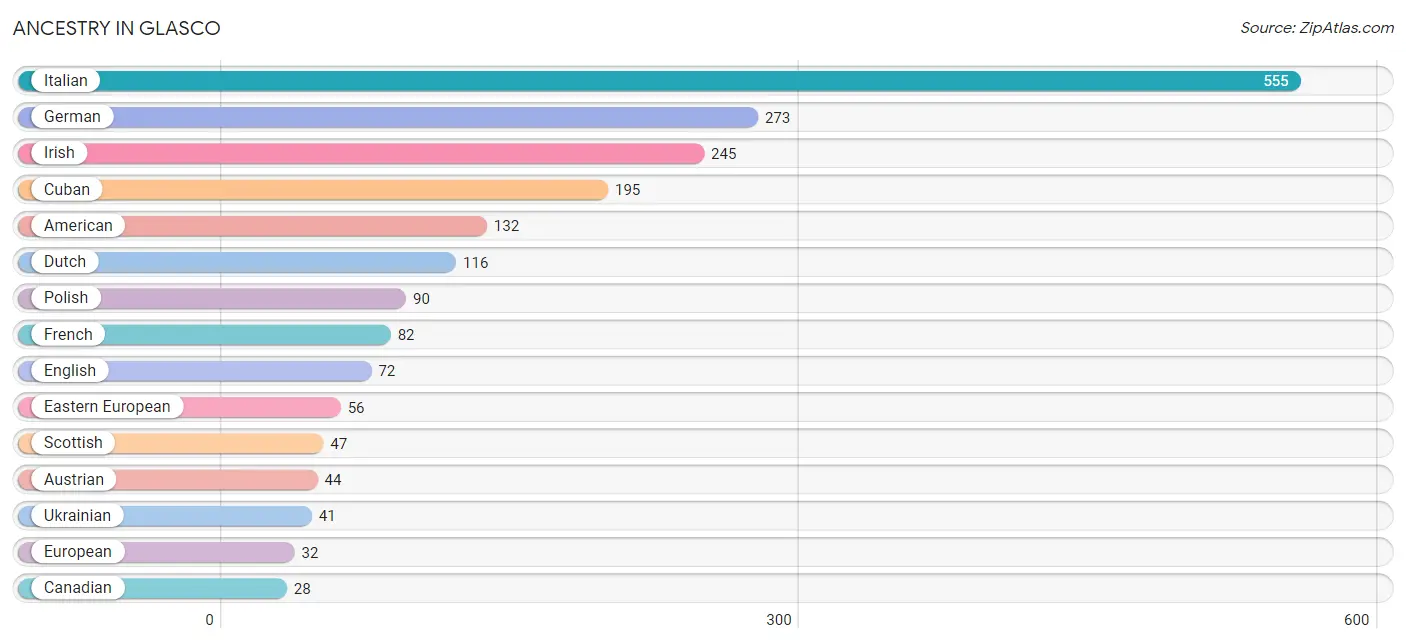
Ancestry in Glasco
The most populous ancestries reported in Glasco are Italian (555 | 26.0%), German (273 | 12.8%), Irish (245 | 11.5%), Cuban (195 | 9.1%), and American (132 | 6.2%), together accounting for 65.6% of all Glasco residents.
| Ancestry | # Population | % Population |
| American | 132 | 6.2% |
| Austrian | 44 | 2.1% |
| Bhutanese | 8 | 0.4% |
| British | 10 | 0.5% |
| Canadian | 28 | 1.3% |
| Cuban | 195 | 9.1% |
| Danish | 8 | 0.4% |
| Dutch | 116 | 5.4% |
| Eastern European | 56 | 2.6% |
| English | 72 | 3.4% |
| European | 32 | 1.5% |
| French | 82 | 3.8% |
| German | 273 | 12.8% |
| Greek | 7 | 0.3% |
| Hungarian | 20 | 0.9% |
| Irish | 245 | 11.5% |
| Iroquois | 6 | 0.3% |
| Italian | 555 | 26.0% |
| Mexican | 28 | 1.3% |
| Nigerian | 15 | 0.7% |
| Polish | 90 | 4.2% |
| Puerto Rican | 18 | 0.8% |
| Russian | 12 | 0.6% |
| Scotch-Irish | 23 | 1.1% |
| Scottish | 47 | 2.2% |
| Subsaharan African | 15 | 0.7% |
| Swedish | 11 | 0.5% |
| Turkish | 14 | 0.7% |
| Ukrainian | 41 | 1.9% |
| Welsh | 9 | 0.4% | View All 30 Rows |
Immigrants in Glasco
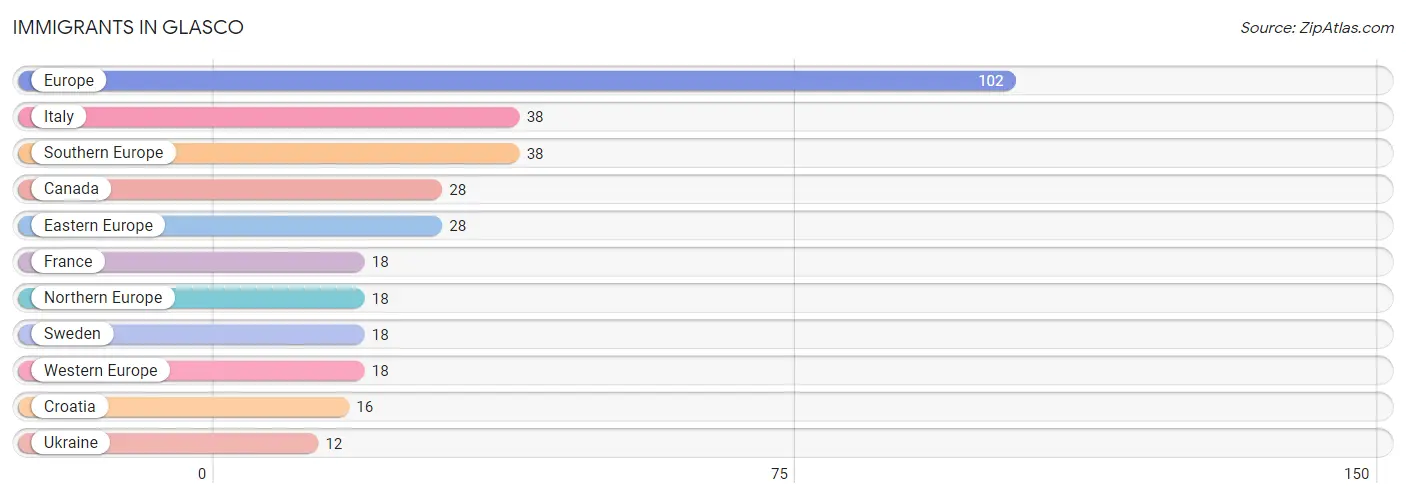
The most numerous immigrant groups reported in Glasco came from Europe (102 | 4.8%), Italy (38 | 1.8%), Southern Europe (38 | 1.8%), Canada (28 | 1.3%), and Eastern Europe (28 | 1.3%), together accounting for 11.0% of all Glasco residents.
| Immigration Origin | # Population | % Population |
| Canada | 28 | 1.3% |
| Croatia | 16 | 0.7% |
| Eastern Europe | 28 | 1.3% |
| Europe | 102 | 4.8% |
| France | 18 | 0.8% |
| Italy | 38 | 1.8% |
| Northern Europe | 18 | 0.8% |
| Southern Europe | 38 | 1.8% |
| Sweden | 18 | 0.8% |
| Ukraine | 12 | 0.6% |
| Western Europe | 18 | 0.8% | View All 11 Rows |
Sex and Age in Glasco
Sex and Age in Glasco
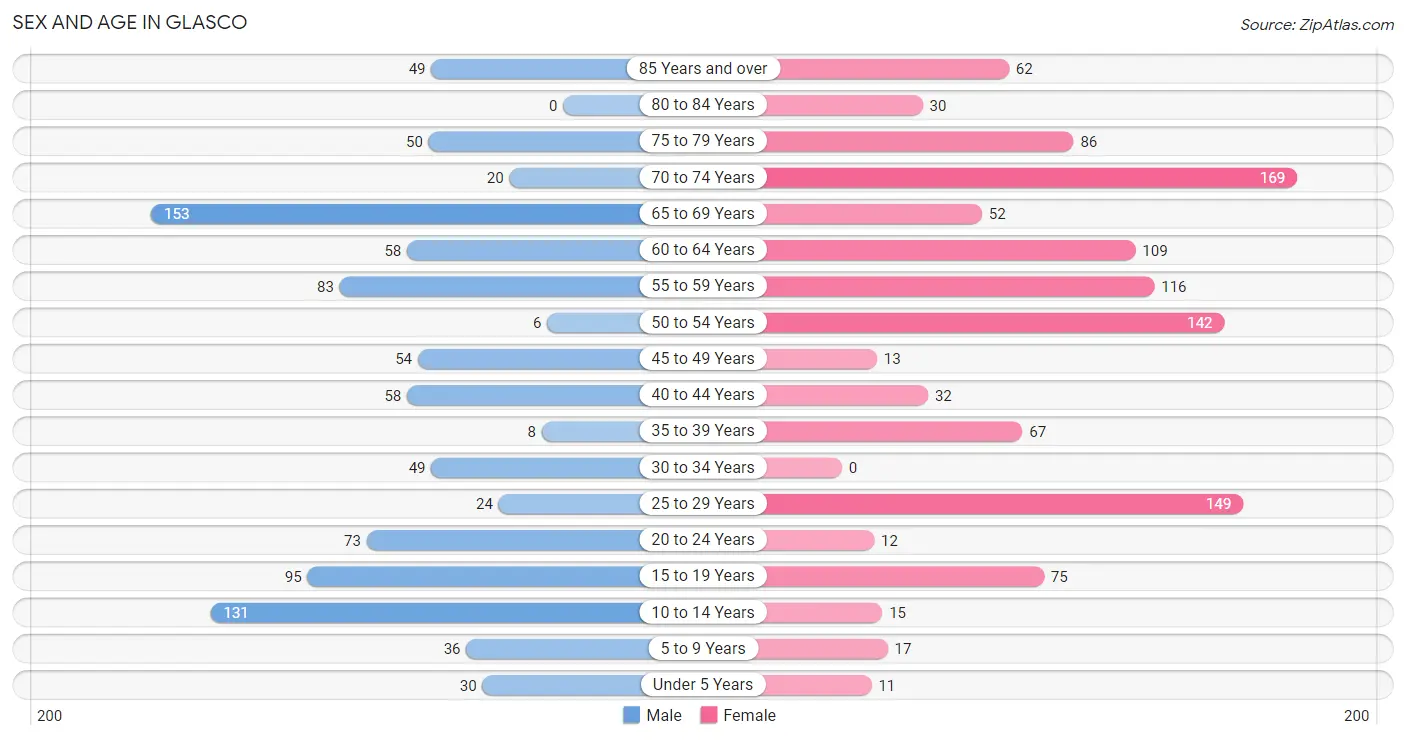
The most populous age groups in Glasco are 65 to 69 Years (153 | 15.7%) for men and 70 to 74 Years (169 | 14.6%) for women.
| Age Bracket | Male | Female |
| Under 5 Years | 30 (3.1%) | 11 (0.9%) |
| 5 to 9 Years | 36 (3.7%) | 17 (1.5%) |
| 10 to 14 Years | 131 (13.4%) | 15 (1.3%) |
| 15 to 19 Years | 95 (9.7%) | 75 (6.5%) |
| 20 to 24 Years | 73 (7.5%) | 12 (1.0%) |
| 25 to 29 Years | 24 (2.5%) | 149 (12.9%) |
| 30 to 34 Years | 49 (5.0%) | 0 (0.0%) |
| 35 to 39 Years | 8 (0.8%) | 67 (5.8%) |
| 40 to 44 Years | 58 (5.9%) | 32 (2.8%) |
| 45 to 49 Years | 54 (5.5%) | 13 (1.1%) |
| 50 to 54 Years | 6 (0.6%) | 142 (12.3%) |
| 55 to 59 Years | 83 (8.5%) | 116 (10.0%) |
| 60 to 64 Years | 58 (5.9%) | 109 (9.4%) |
| 65 to 69 Years | 153 (15.7%) | 52 (4.5%) |
| 70 to 74 Years | 20 (2.1%) | 169 (14.6%) |
| 75 to 79 Years | 50 (5.1%) | 86 (7.4%) |
| 80 to 84 Years | 0 (0.0%) | 30 (2.6%) |
| 85 Years and over | 49 (5.0%) | 62 (5.4%) |
| Total | 977 (100.0%) | 1,157 (100.0%) |
Families and Households in Glasco
Median Family Size in Glasco
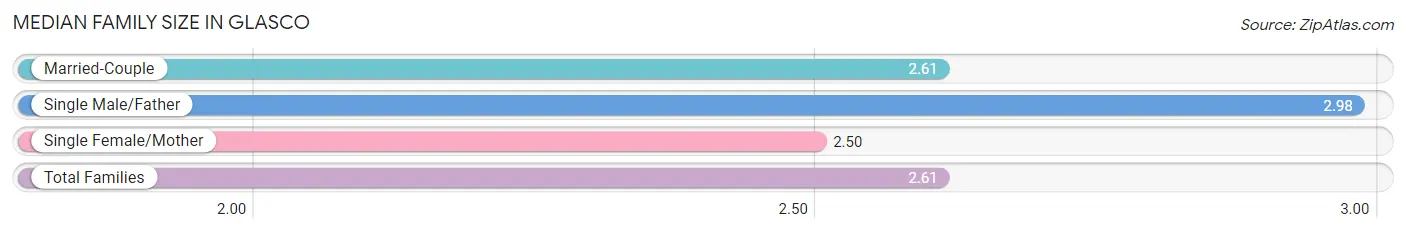
The median family size in Glasco is 2.61 persons per family, with single male/father families (64 | 11.7%) accounting for the largest median family size of 2.98 persons per family. On the other hand, single female/mother families (179 | 32.7%) represent the smallest median family size with 2.50 persons per family.
| Family Type | # Families | Family Size |
| Married-Couple | 304 (55.6%) | 2.61 |
| Single Male/Father | 64 (11.7%) | 2.98 |
| Single Female/Mother | 179 (32.7%) | 2.50 |
| Total Families | 547 (100.0%) | 2.61 |
Median Household Size in Glasco
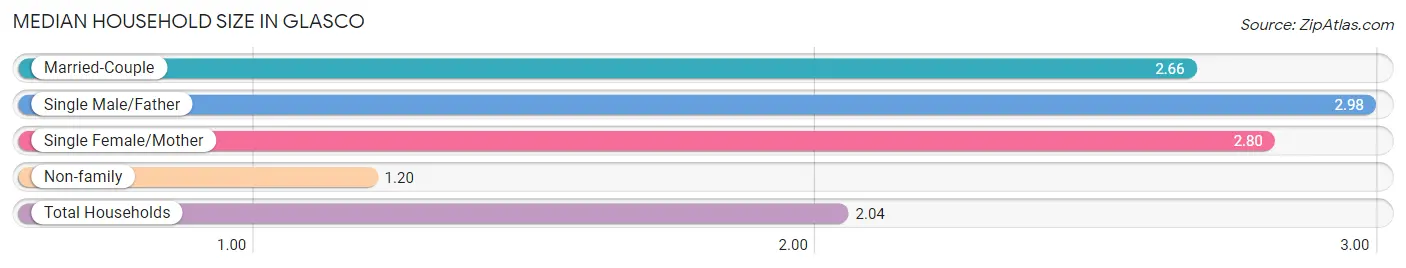
The median household size in Glasco is 2.04 persons per household, with single male/father households (64 | 6.4%) accounting for the largest median household size of 2.98 persons per household. non-family households (461 | 45.7%) represent the smallest median household size with 1.20 persons per household.
| Household Type | # Households | Household Size |
| Married-Couple | 304 (30.2%) | 2.66 |
| Single Male/Father | 64 (6.4%) | 2.98 |
| Single Female/Mother | 179 (17.8%) | 2.80 |
| Non-family | 461 (45.7%) | 1.20 |
| Total Households | 1,008 (100.0%) | 2.04 |
Household Size by Marriage Status in Glasco
Out of a total of 1,008 households in Glasco, 547 (54.3%) are family households, while 461 (45.7%) are nonfamily households. The most numerous type of family households are 2-person households, comprising 314, and the most common type of nonfamily households are 1-person households, comprising 391.
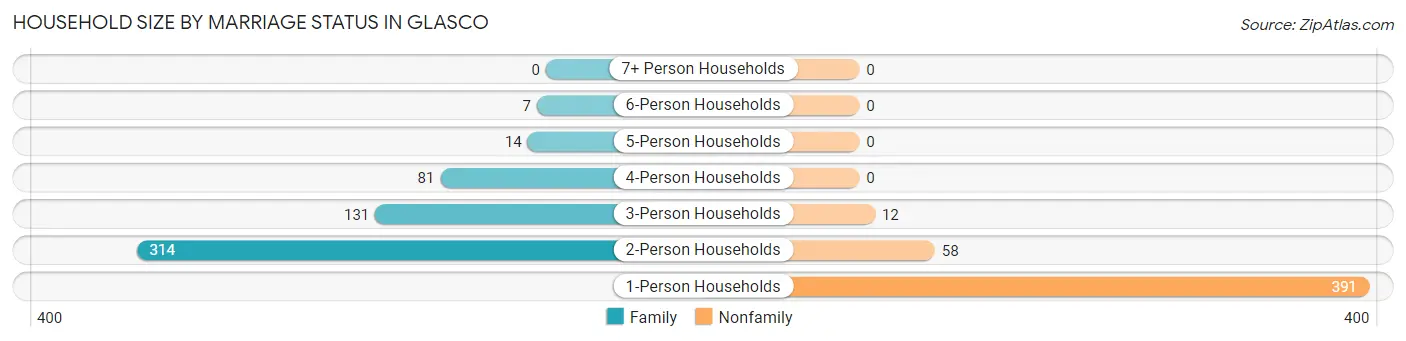
| Household Size | Family Households | Nonfamily Households |
| 1-Person Households | - | 391 (38.8%) |
| 2-Person Households | 314 (31.1%) | 58 (5.8%) |
| 3-Person Households | 131 (13.0%) | 12 (1.2%) |
| 4-Person Households | 81 (8.0%) | 0 (0.0%) |
| 5-Person Households | 14 (1.4%) | 0 (0.0%) |
| 6-Person Households | 7 (0.7%) | 0 (0.0%) |
| 7+ Person Households | 0 (0.0%) | 0 (0.0%) |
| Total | 547 (54.3%) | 461 (45.7%) |
Female Fertility in Glasco
Fertility by Age in Glasco
Average fertility rate in Glasco is 19.0 births per 1,000 women. Women in the age bracket of 20 to 34 years have the highest fertility rate with 50.0 births per 1,000 women. Women in the age bracket of 20 to 34 years acount for 100.0% of all women with births.
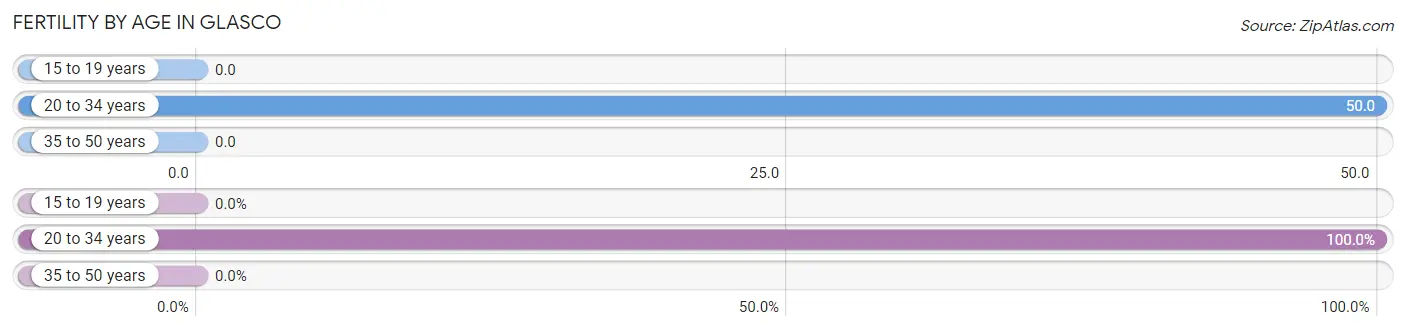
| Age Bracket | Women with Births | Births / 1,000 Women |
| 15 to 19 years | 0 (0.0%) | 0.0 |
| 20 to 34 years | 8 (100.0%) | 50.0 |
| 35 to 50 years | 0 (0.0%) | 0.0 |
| Total | 8 (100.0%) | 19.0 |
Fertility by Age by Marriage Status in Glasco
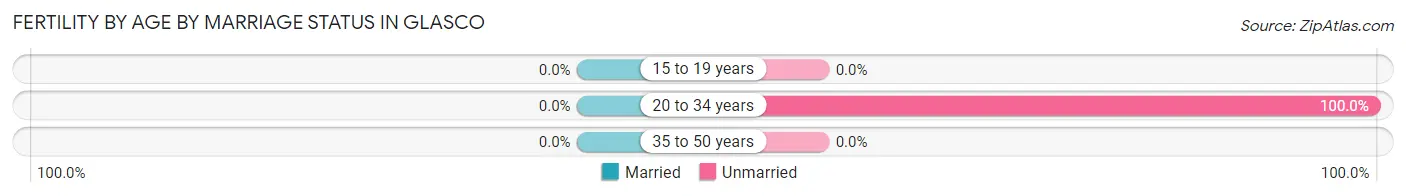
| Age Bracket | Married | Unmarried |
| 15 to 19 years | 0 (0.0%) | 0 (0.0%) |
| 20 to 34 years | 0 (0.0%) | 8 (100.0%) |
| 35 to 50 years | 0 (0.0%) | 0 (0.0%) |
| Total | 0 (0.0%) | 8 (100.0%) |
Fertility by Education in Glasco
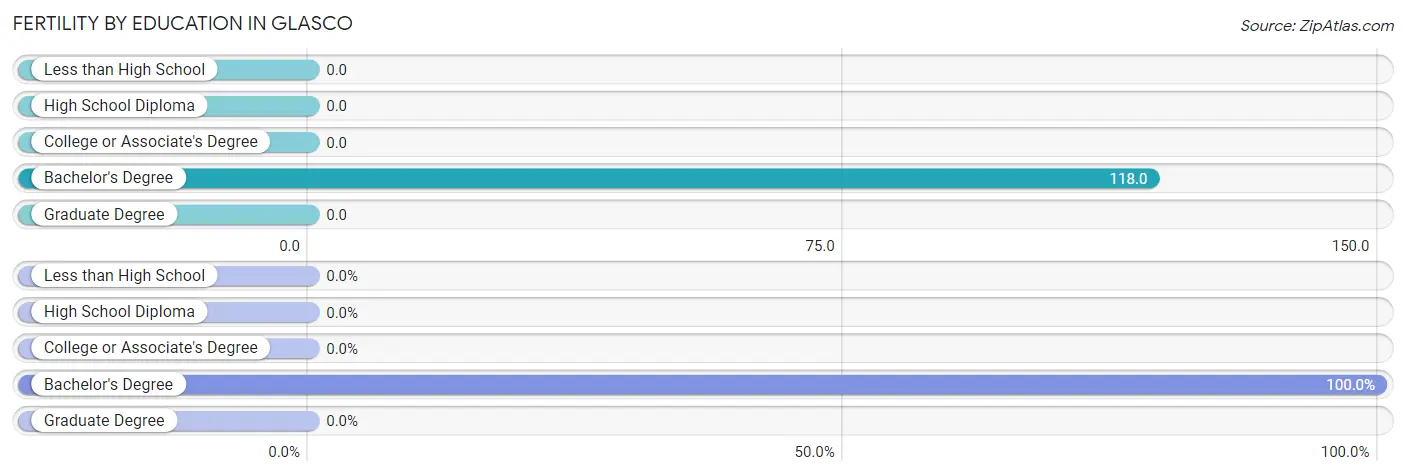
| Educational Attainment | Women with Births | Births / 1,000 Women |
| Less than High School | 0 (0.0%) | 0.0 |
| High School Diploma | 0 (0.0%) | 0.0 |
| College or Associate's Degree | 0 (0.0%) | 0.0 |
| Bachelor's Degree | 8 (100.0%) | 118.0 |
| Graduate Degree | 0 (0.0%) | 0.0 |
| Total | 8 (100.0%) | 19.0 |
Fertility by Education by Marriage Status in Glasco
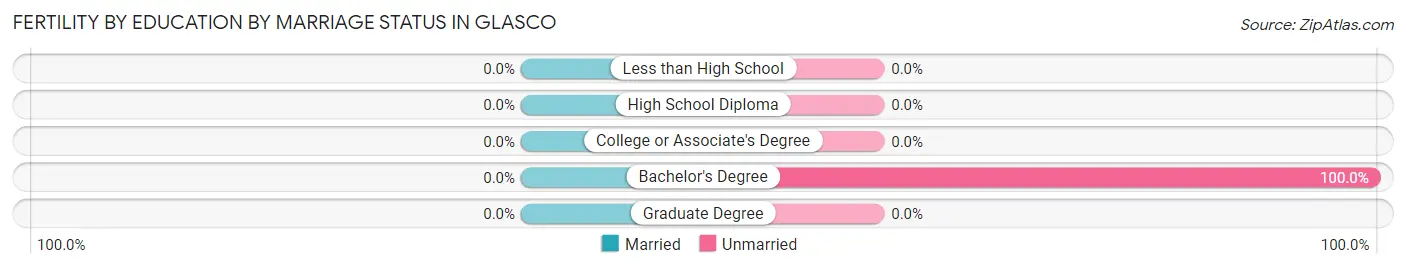
| Educational Attainment | Married | Unmarried |
| Less than High School | 0 (0.0%) | 0 (0.0%) |
| High School Diploma | 0 (0.0%) | 0 (0.0%) |
| College or Associate's Degree | 0 (0.0%) | 0 (0.0%) |
| Bachelor's Degree | 0 (0.0%) | 8 (100.0%) |
| Graduate Degree | 0 (0.0%) | 0 (0.0%) |
| Total | 0 (0.0%) | 8 (100.0%) |
Employment Characteristics in Glasco
Employment by Class of Employer in Glasco
Among the 1,069 employed individuals in Glasco, private company employees (719 | 67.3%), state government employees (119 | 11.1%), and local government employees (106 | 9.9%) make up the most common classes of employment.
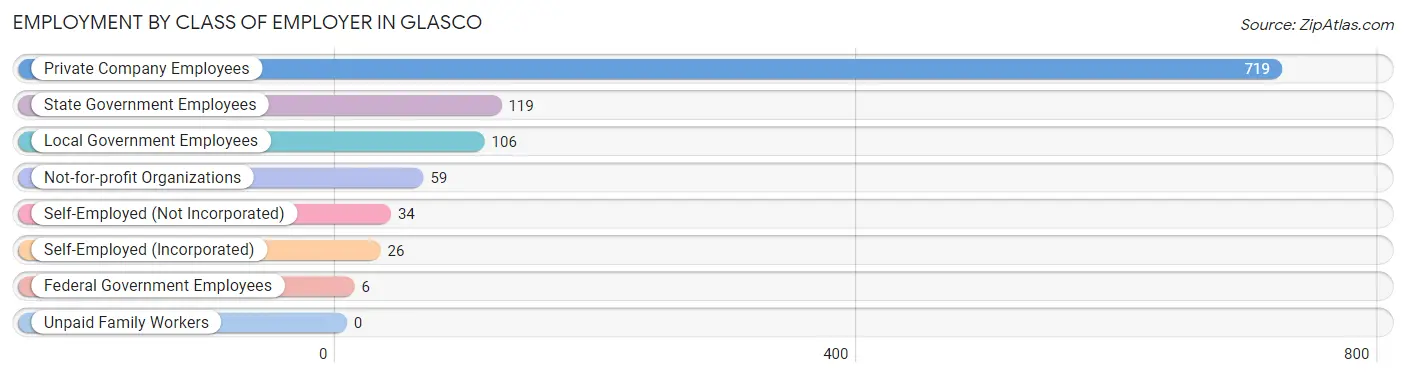
| Employer Class | # Employees | % Employees |
| Private Company Employees | 719 | 67.3% |
| Self-Employed (Incorporated) | 26 | 2.4% |
| Self-Employed (Not Incorporated) | 34 | 3.2% |
| Not-for-profit Organizations | 59 | 5.5% |
| Local Government Employees | 106 | 9.9% |
| State Government Employees | 119 | 11.1% |
| Federal Government Employees | 6 | 0.6% |
| Unpaid Family Workers | 0 | 0.0% |
| Total | 1,069 | 100.0% |
Employment Status by Age in Glasco
According to the labor force statistics for Glasco, out of the total population over 16 years of age (1,849), 58.4% or 1,080 individuals are in the labor force, with 0.3% or 3 of them unemployed. The age group with the highest labor force participation rate is 20 to 24 years, with 100.0% or 85 individuals in the labor force. Within the labor force, the 35 to 44 years age range has the highest percentage of unemployed individuals, with 1.9% or 3 of them being unemployed.
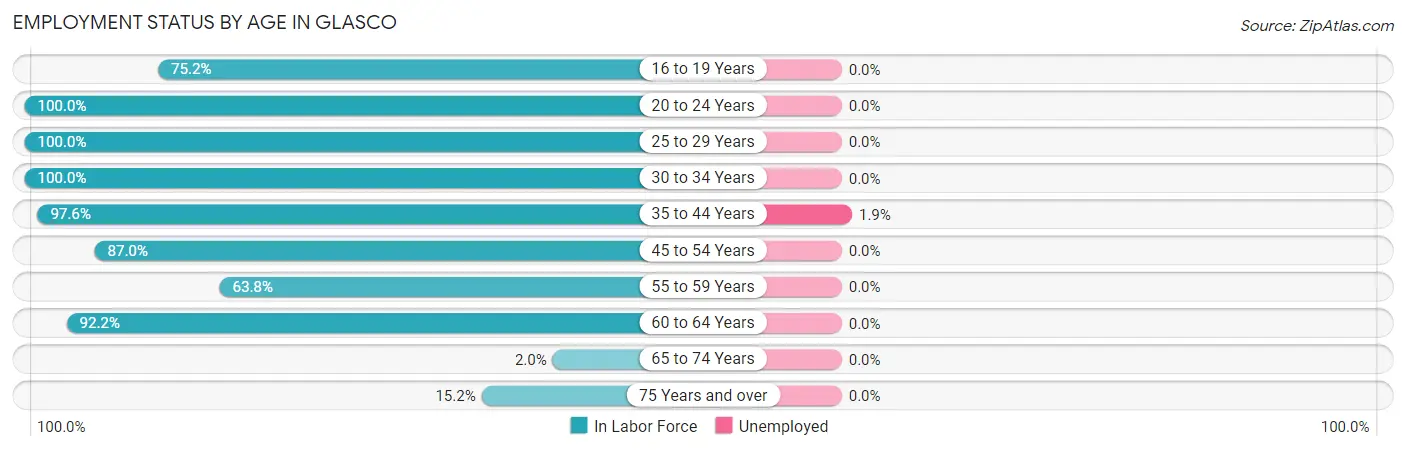
| Age Bracket | In Labor Force | Unemployed |
| 16 to 19 Years | 94 (75.2%) | 0 (0.0%) |
| 20 to 24 Years | 85 (100.0%) | 0 (0.0%) |
| 25 to 29 Years | 173 (100.0%) | 0 (0.0%) |
| 30 to 34 Years | 49 (100.0%) | 0 (0.0%) |
| 35 to 44 Years | 161 (97.6%) | 3 (1.9%) |
| 45 to 54 Years | 187 (87.0%) | 0 (0.0%) |
| 55 to 59 Years | 127 (63.8%) | 0 (0.0%) |
| 60 to 64 Years | 154 (92.2%) | 0 (0.0%) |
| 65 to 74 Years | 8 (2.0%) | 0 (0.0%) |
| 75 Years and over | 42 (15.2%) | 0 (0.0%) |
| Total | 1,080 (58.4%) | 3 (0.3%) |
Employment Status by Educational Attainment in Glasco
According to labor force statistics for Glasco, 87.9% of individuals (851) out of the total population between 25 and 64 years of age (968) are in the labor force, with 0.4% or 3 of them being unemployed. The group with the highest labor force participation rate are those with the educational attainment of college / associate degree, with 100.0% or 285 individuals in the labor force. Within the labor force, individuals with high school diploma education have the highest percentage of unemployment, with 1.5% or 3 of them being unemployed.
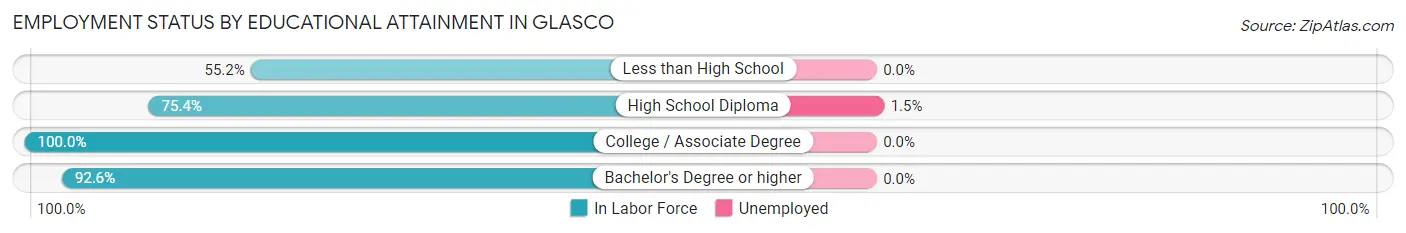
| Educational Attainment | In Labor Force | Unemployed |
| Less than High School | 32 (55.2%) | 0 (0.0%) |
| High School Diploma | 196 (75.4%) | 4 (1.5%) |
| College / Associate Degree | 285 (100.0%) | 0 (0.0%) |
| Bachelor's Degree or higher | 338 (92.6%) | 0 (0.0%) |
| Total | 851 (87.9%) | 4 (0.4%) |
Employment Occupations by Sex in Glasco
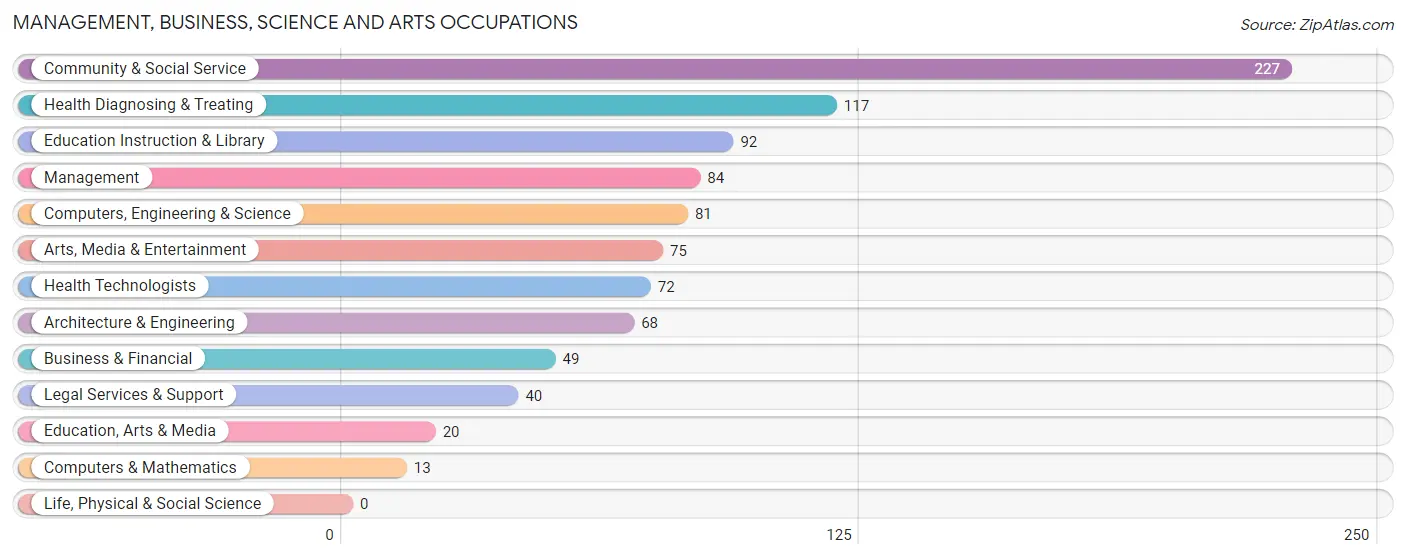
Management, Business, Science and Arts Occupations
The most common Management, Business, Science and Arts occupations in Glasco are Community & Social Service (227 | 21.1%), Health Diagnosing & Treating (117 | 10.9%), Education Instruction & Library (92 | 8.5%), Management (84 | 7.8%), and Computers, Engineering & Science (81 | 7.5%).
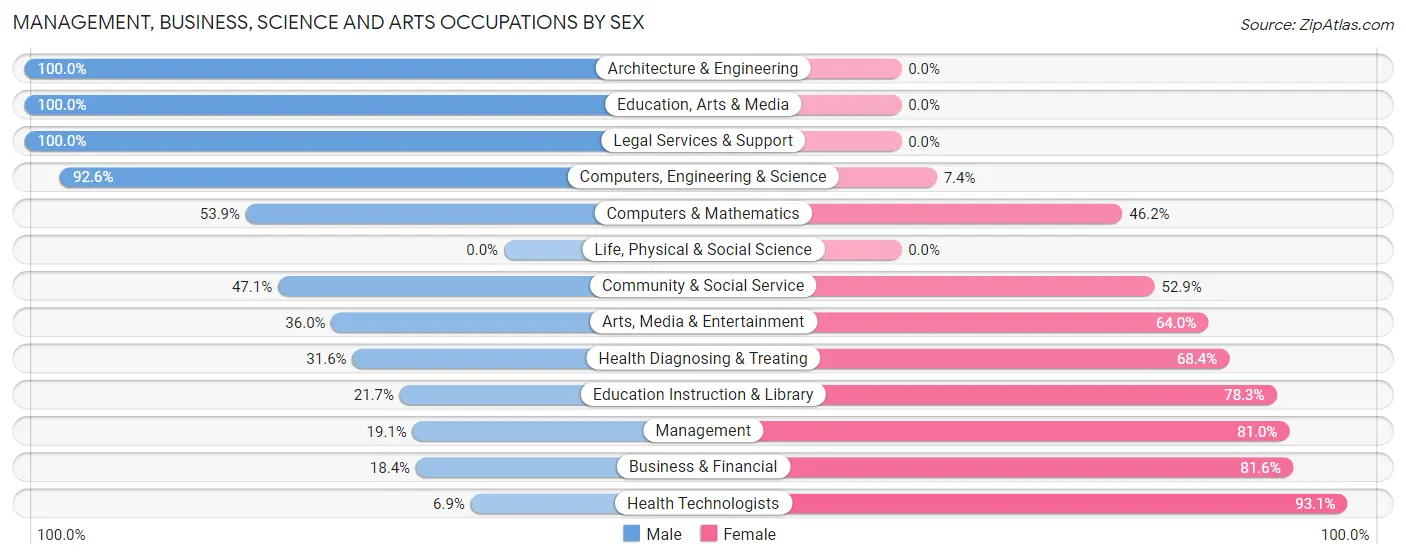
Management, Business, Science and Arts Occupations by Sex
Within the Management, Business, Science and Arts occupations in Glasco, the most male-oriented occupations are Architecture & Engineering (100.0%), Education, Arts & Media (100.0%), and Legal Services & Support (100.0%), while the most female-oriented occupations are Health Technologists (93.1%), Business & Financial (81.6%), and Management (80.9%).
| Occupation | Male | Female |
| Management | 16 (19.1%) | 68 (80.9%) |
| Business & Financial | 9 (18.4%) | 40 (81.6%) |
| Computers, Engineering & Science | 75 (92.6%) | 6 (7.4%) |
| Computers & Mathematics | 7 (53.8%) | 6 (46.2%) |
| Architecture & Engineering | 68 (100.0%) | 0 (0.0%) |
| Life, Physical & Social Science | 0 (0.0%) | 0 (0.0%) |
| Community & Social Service | 107 (47.1%) | 120 (52.9%) |
| Education, Arts & Media | 20 (100.0%) | 0 (0.0%) |
| Legal Services & Support | 40 (100.0%) | 0 (0.0%) |
| Education Instruction & Library | 20 (21.7%) | 72 (78.3%) |
| Arts, Media & Entertainment | 27 (36.0%) | 48 (64.0%) |
| Health Diagnosing & Treating | 37 (31.6%) | 80 (68.4%) |
| Health Technologists | 5 (6.9%) | 67 (93.1%) |
| Total (Category) | 244 (43.7%) | 314 (56.3%) |
| Total (Overall) | 444 (41.2%) | 633 (58.8%) |
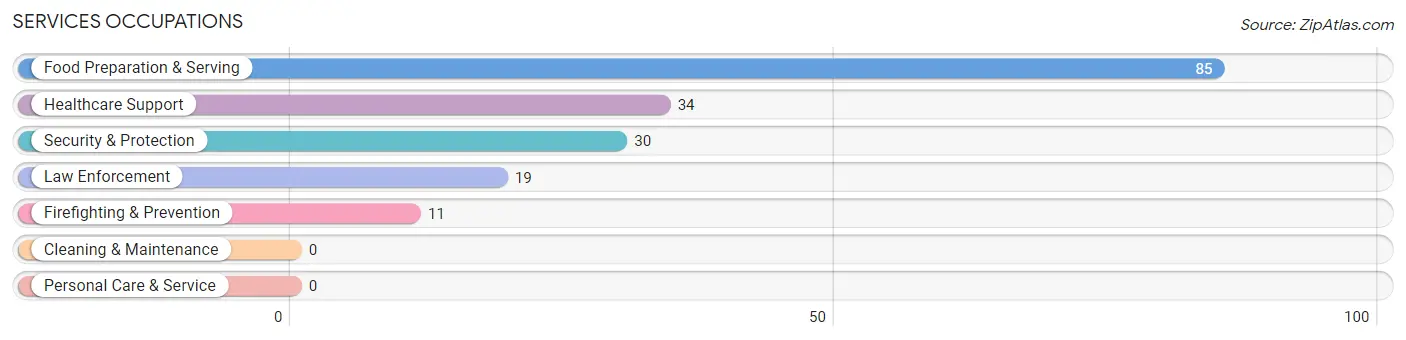
Services Occupations
The most common Services occupations in Glasco are Food Preparation & Serving (85 | 7.9%), Healthcare Support (34 | 3.2%), Security & Protection (30 | 2.8%), Law Enforcement (19 | 1.8%), and Firefighting & Prevention (11 | 1.0%).
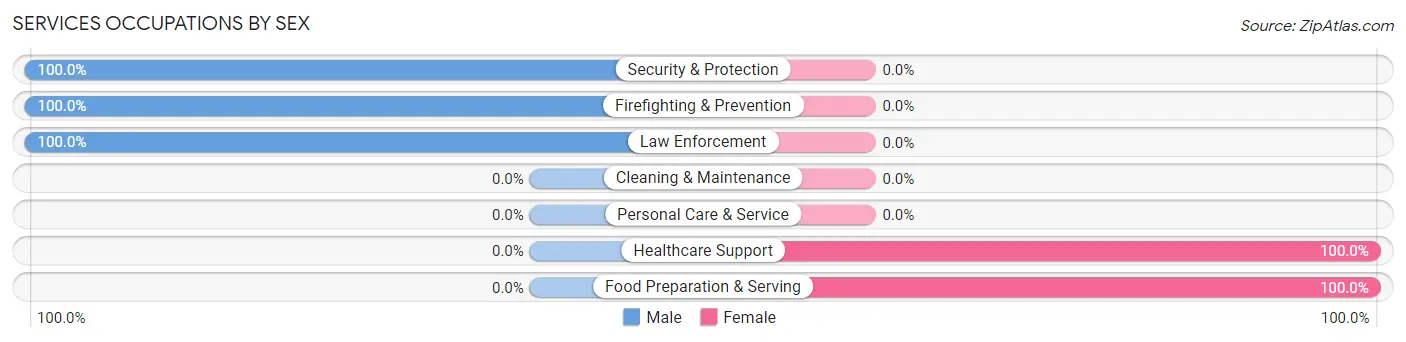
Services Occupations by Sex
Within the Services occupations in Glasco, the most male-oriented occupations are Security & Protection (100.0%), Firefighting & Prevention (100.0%), and Law Enforcement (100.0%), while the most female-oriented occupations are Healthcare Support (100.0%), and Food Preparation & Serving (100.0%).
| Occupation | Male | Female |
| Healthcare Support | 0 (0.0%) | 34 (100.0%) |
| Security & Protection | 30 (100.0%) | 0 (0.0%) |
| Firefighting & Prevention | 11 (100.0%) | 0 (0.0%) |
| Law Enforcement | 19 (100.0%) | 0 (0.0%) |
| Food Preparation & Serving | 0 (0.0%) | 85 (100.0%) |
| Cleaning & Maintenance | 0 (0.0%) | 0 (0.0%) |
| Personal Care & Service | 0 (0.0%) | 0 (0.0%) |
| Total (Category) | 30 (20.1%) | 119 (79.9%) |
| Total (Overall) | 444 (41.2%) | 633 (58.8%) |
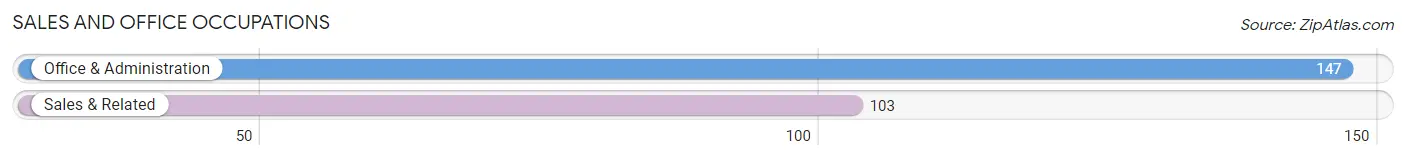
Sales and Office Occupations
The most common Sales and Office occupations in Glasco are Office & Administration (147 | 13.7%), and Sales & Related (103 | 9.6%).
Sales and Office Occupations by Sex
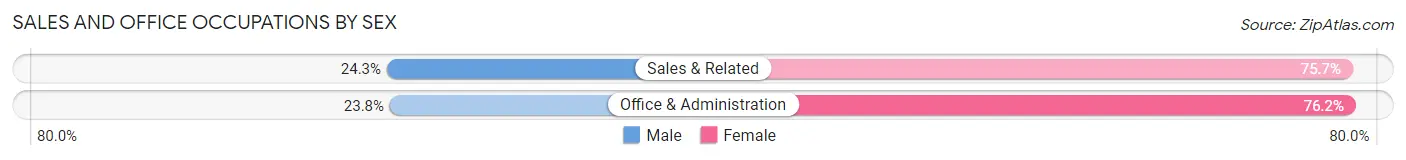
| Occupation | Male | Female |
| Sales & Related | 25 (24.3%) | 78 (75.7%) |
| Office & Administration | 35 (23.8%) | 112 (76.2%) |
| Total (Category) | 60 (24.0%) | 190 (76.0%) |
| Total (Overall) | 444 (41.2%) | 633 (58.8%) |
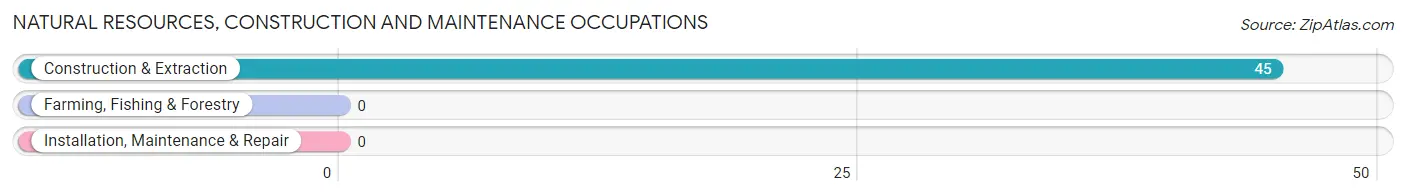
Natural Resources, Construction and Maintenance Occupations
The most common Natural Resources, Construction and Maintenance occupations in Glasco are , and Construction & Extraction (45 | 4.2%).
Natural Resources, Construction and Maintenance Occupations by Sex
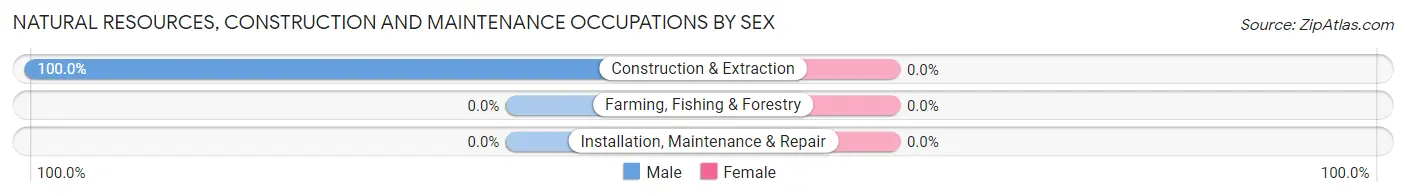
| Occupation | Male | Female |
| Farming, Fishing & Forestry | 0 (0.0%) | 0 (0.0%) |
| Construction & Extraction | 45 (100.0%) | 0 (0.0%) |
| Installation, Maintenance & Repair | 0 (0.0%) | 0 (0.0%) |
| Total (Category) | 45 (100.0%) | 0 (0.0%) |
| Total (Overall) | 444 (41.2%) | 633 (58.8%) |
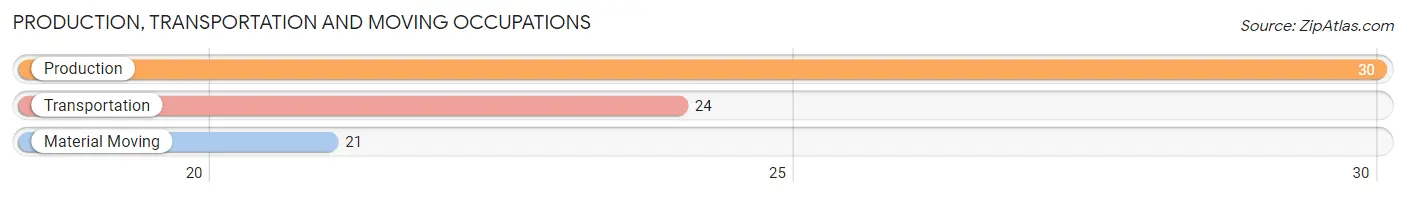
Production, Transportation and Moving Occupations
The most common Production, Transportation and Moving occupations in Glasco are Production (30 | 2.8%), Transportation (24 | 2.2%), and Material Moving (21 | 1.9%).
Production, Transportation and Moving Occupations by Sex
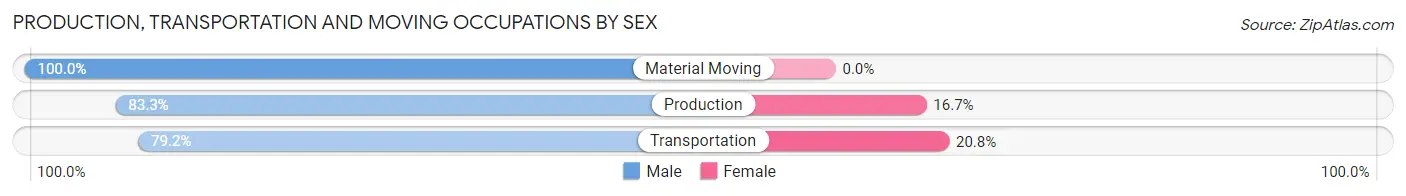
| Occupation | Male | Female |
| Production | 25 (83.3%) | 5 (16.7%) |
| Transportation | 19 (79.2%) | 5 (20.8%) |
| Material Moving | 21 (100.0%) | 0 (0.0%) |
| Total (Category) | 65 (86.7%) | 10 (13.3%) |
| Total (Overall) | 444 (41.2%) | 633 (58.8%) |
Employment Industries by Sex in Glasco
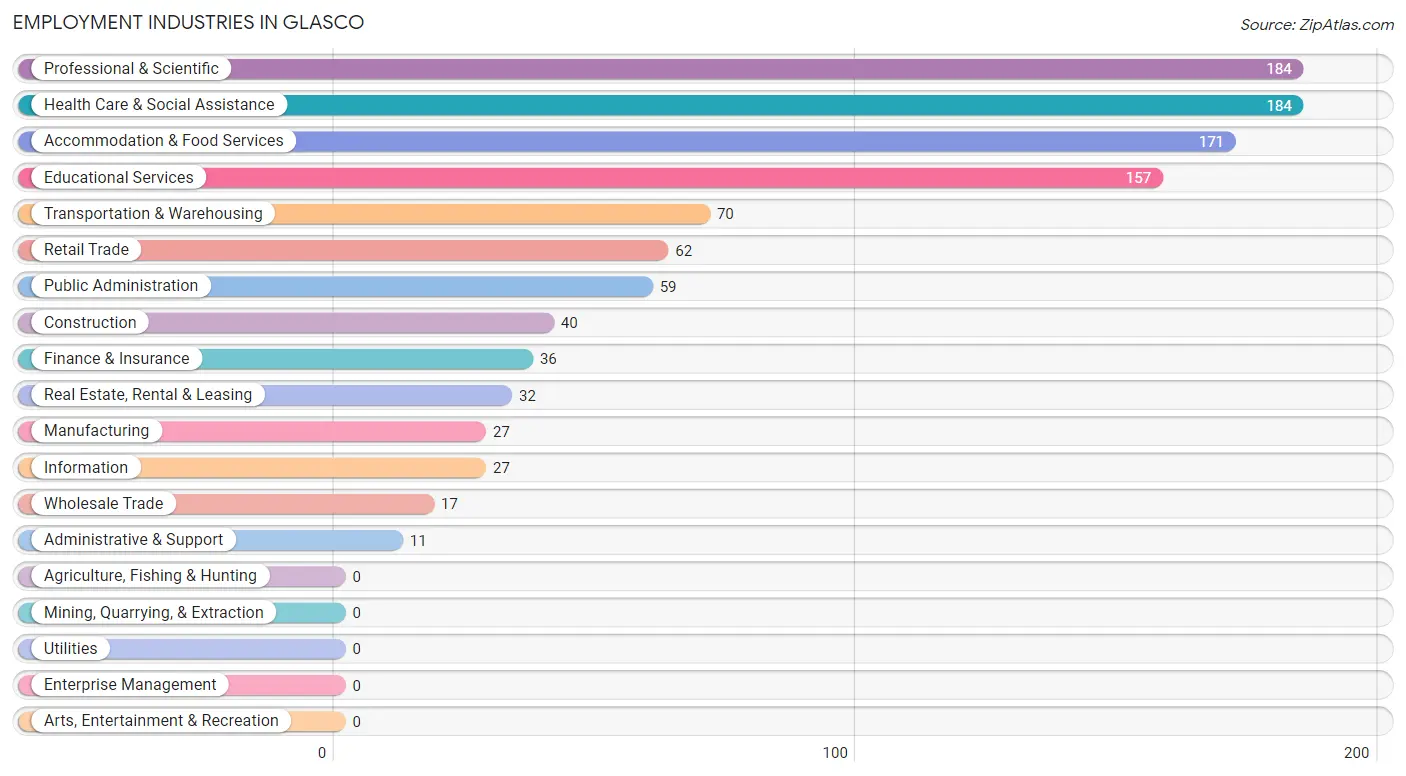
Employment Industries in Glasco
The major employment industries in Glasco include Professional & Scientific (184 | 17.1%), Health Care & Social Assistance (184 | 17.1%), Accommodation & Food Services (171 | 15.9%), Educational Services (157 | 14.6%), and Transportation & Warehousing (70 | 6.5%).
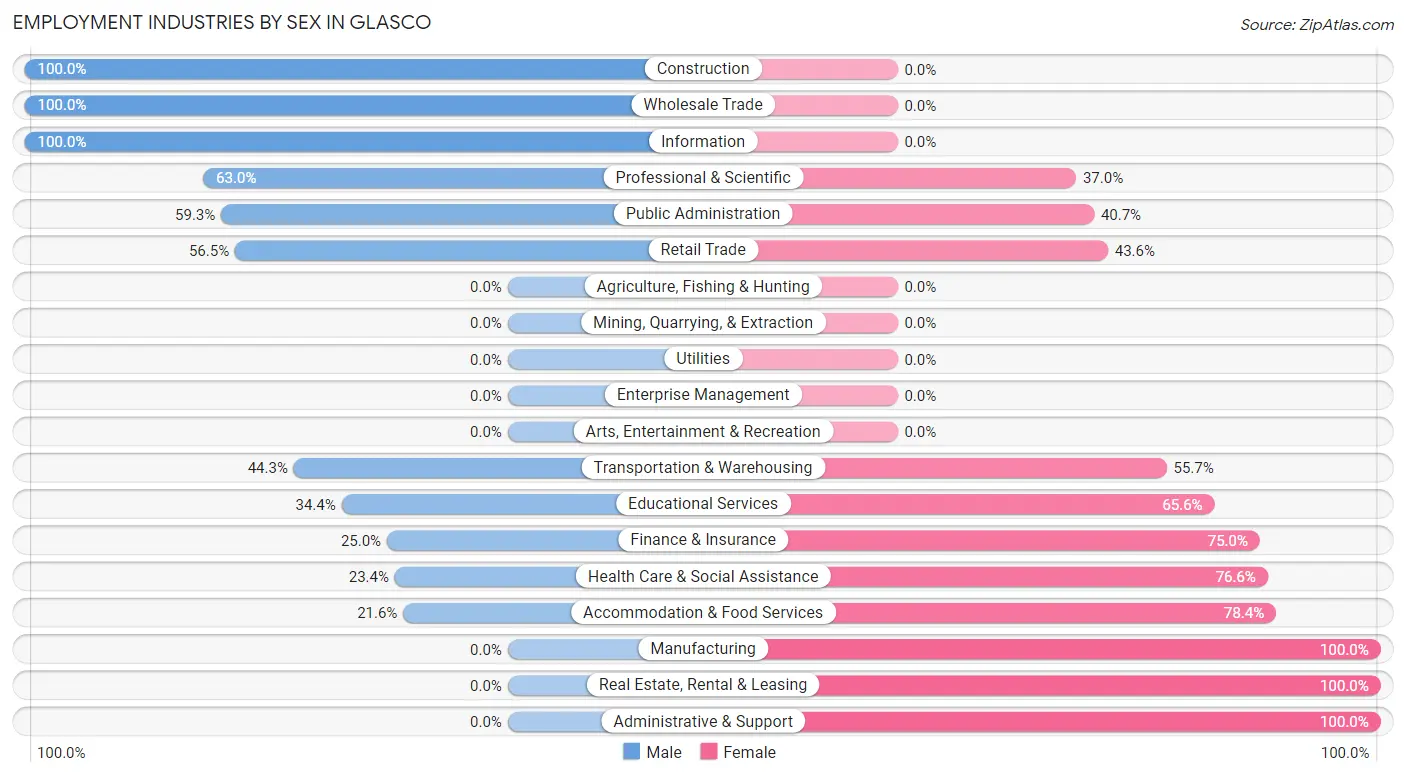
Employment Industries by Sex in Glasco
The Glasco industries that see more men than women are Construction (100.0%), Wholesale Trade (100.0%), and Information (100.0%), whereas the industries that tend to have a higher number of women are Manufacturing (100.0%), Real Estate, Rental & Leasing (100.0%), and Administrative & Support (100.0%).
| Industry | Male | Female |
| Agriculture, Fishing & Hunting | 0 (0.0%) | 0 (0.0%) |
| Mining, Quarrying, & Extraction | 0 (0.0%) | 0 (0.0%) |
| Construction | 40 (100.0%) | 0 (0.0%) |
| Manufacturing | 0 (0.0%) | 27 (100.0%) |
| Wholesale Trade | 17 (100.0%) | 0 (0.0%) |
| Retail Trade | 35 (56.5%) | 27 (43.5%) |
| Transportation & Warehousing | 31 (44.3%) | 39 (55.7%) |
| Utilities | 0 (0.0%) | 0 (0.0%) |
| Information | 27 (100.0%) | 0 (0.0%) |
| Finance & Insurance | 9 (25.0%) | 27 (75.0%) |
| Real Estate, Rental & Leasing | 0 (0.0%) | 32 (100.0%) |
| Professional & Scientific | 116 (63.0%) | 68 (37.0%) |
| Enterprise Management | 0 (0.0%) | 0 (0.0%) |
| Administrative & Support | 0 (0.0%) | 11 (100.0%) |
| Educational Services | 54 (34.4%) | 103 (65.6%) |
| Health Care & Social Assistance | 43 (23.4%) | 141 (76.6%) |
| Arts, Entertainment & Recreation | 0 (0.0%) | 0 (0.0%) |
| Accommodation & Food Services | 37 (21.6%) | 134 (78.4%) |
| Public Administration | 35 (59.3%) | 24 (40.7%) |
| Total | 444 (41.2%) | 633 (58.8%) |
Education in Glasco
School Enrollment in Glasco
The most common levels of schooling among the 342 students in Glasco are high school (153 | 44.7%), middle school (129 | 37.7%), and elementary school (51 | 14.9%).
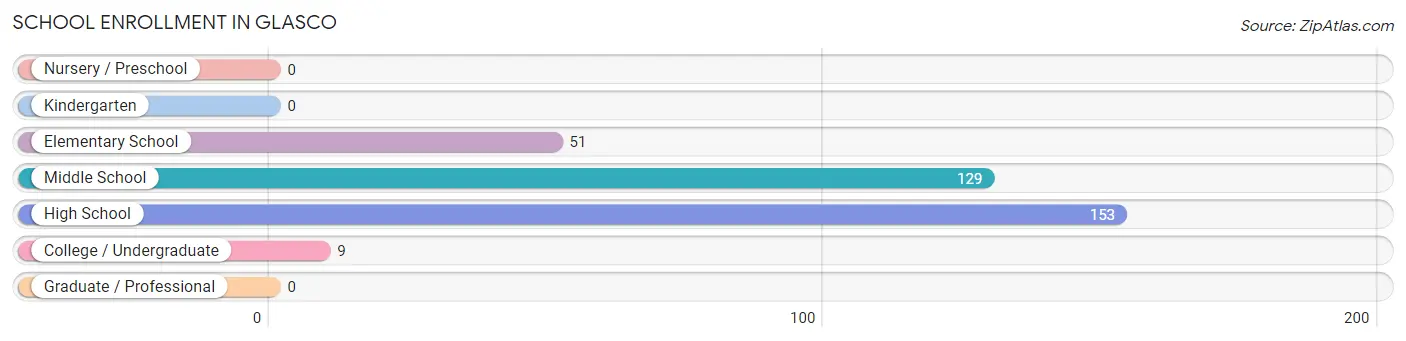
| School Level | # Students | % Students |
| Nursery / Preschool | 0 | 0.0% |
| Kindergarten | 0 | 0.0% |
| Elementary School | 51 | 14.9% |
| Middle School | 129 | 37.7% |
| High School | 153 | 44.7% |
| College / Undergraduate | 9 | 2.6% |
| Graduate / Professional | 0 | 0.0% |
| Total | 342 | 100.0% |
School Enrollment by Age by Funding Source in Glasco
Out of a total of 342 students who are enrolled in schools in Glasco, 42 (12.3%) attend a private institution, while the remaining 300 (87.7%) are enrolled in public schools. The age group of 10 to 14 year olds has the highest likelihood of being enrolled in private schools, with 42 (28.8% in the age bracket) enrolled. Conversely, the age group of 5 to 9 year old has the lowest likelihood of being enrolled in a private school, with 43 (100.0% in the age bracket) attending a public institution.
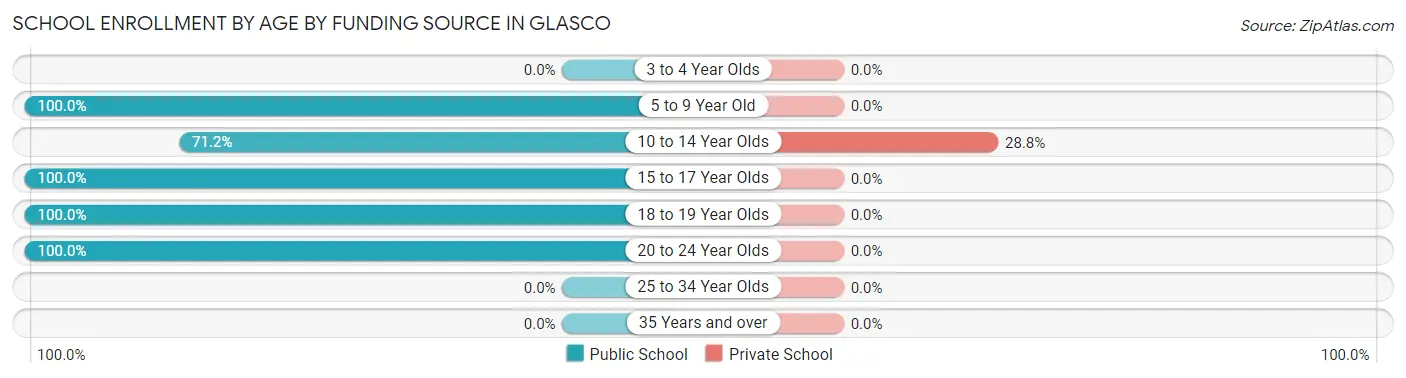
| Age Bracket | Public School | Private School |
| 3 to 4 Year Olds | 0 (0.0%) | 0 (0.0%) |
| 5 to 9 Year Old | 43 (100.0%) | 0 (0.0%) |
| 10 to 14 Year Olds | 104 (71.2%) | 42 (28.8%) |
| 15 to 17 Year Olds | 94 (100.0%) | 0 (0.0%) |
| 18 to 19 Year Olds | 50 (100.0%) | 0 (0.0%) |
| 20 to 24 Year Olds | 9 (100.0%) | 0 (0.0%) |
| 25 to 34 Year Olds | 0 (0.0%) | 0 (0.0%) |
| 35 Years and over | 0 (0.0%) | 0 (0.0%) |
| Total | 300 (87.7%) | 42 (12.3%) |
Educational Attainment by Field of Study in Glasco
Education (148 | 28.9%), science & technology (74 | 14.4%), business (64 | 12.5%), computers & mathematics (50 | 9.8%), and communications (31 | 6.0%) are the most common fields of study among 512 individuals in Glasco who have obtained a bachelor's degree or higher.
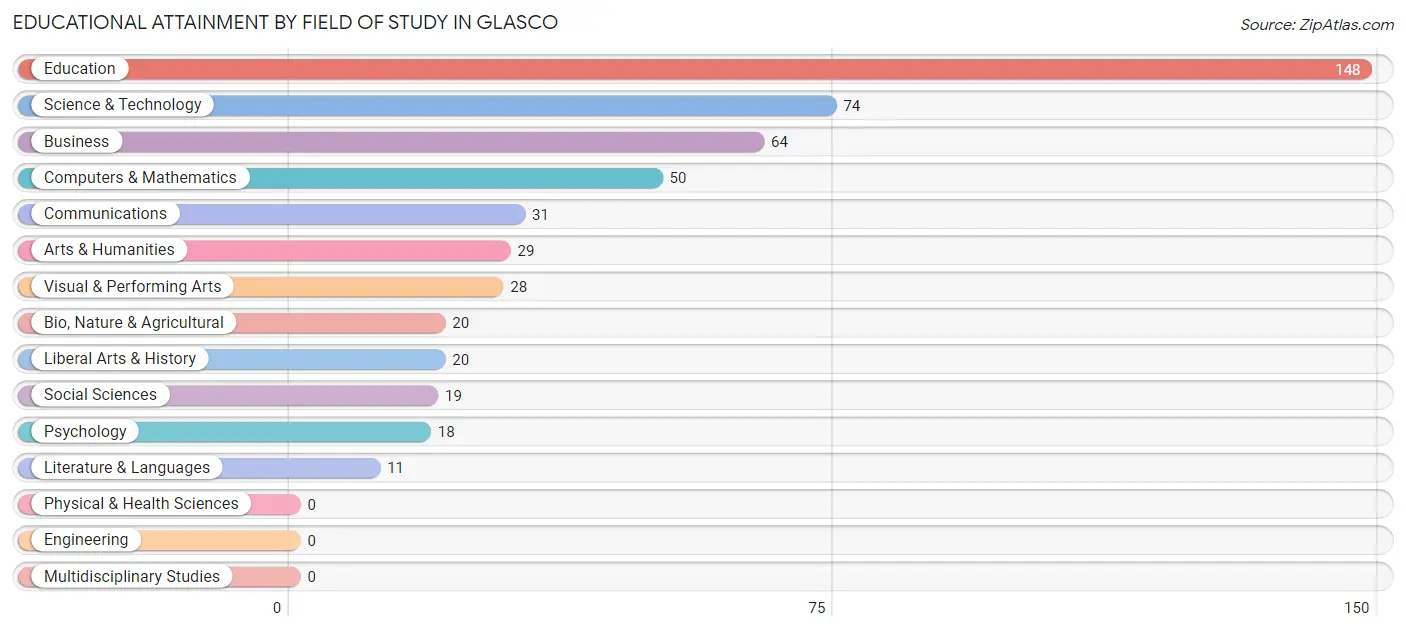
| Field of Study | # Graduates | % Graduates |
| Computers & Mathematics | 50 | 9.8% |
| Bio, Nature & Agricultural | 20 | 3.9% |
| Physical & Health Sciences | 0 | 0.0% |
| Psychology | 18 | 3.5% |
| Social Sciences | 19 | 3.7% |
| Engineering | 0 | 0.0% |
| Multidisciplinary Studies | 0 | 0.0% |
| Science & Technology | 74 | 14.4% |
| Business | 64 | 12.5% |
| Education | 148 | 28.9% |
| Literature & Languages | 11 | 2.1% |
| Liberal Arts & History | 20 | 3.9% |
| Visual & Performing Arts | 28 | 5.5% |
| Communications | 31 | 6.0% |
| Arts & Humanities | 29 | 5.7% |
| Total | 512 | 100.0% |
Transportation & Commute in Glasco
Vehicle Availability by Sex in Glasco
The most prevalent vehicle ownership categories in Glasco are males with 2 vehicles (215, accounting for 50.3%) and females with 2 vehicles (236, making up 34.0%).
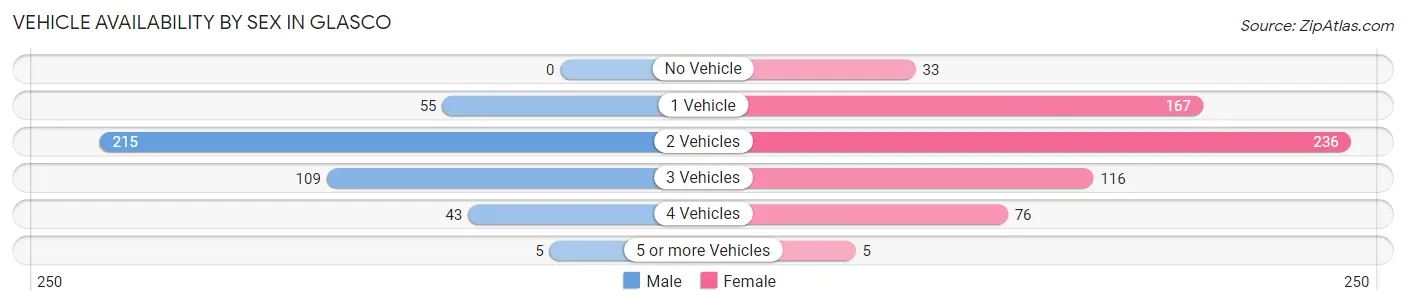
| Vehicles Available | Male | Female |
| No Vehicle | 0 (0.0%) | 33 (5.2%) |
| 1 Vehicle | 55 (12.9%) | 167 (26.4%) |
| 2 Vehicles | 215 (50.3%) | 236 (37.3%) |
| 3 Vehicles | 109 (25.5%) | 116 (18.3%) |
| 4 Vehicles | 43 (10.1%) | 76 (12.0%) |
| 5 or more Vehicles | 5 (1.2%) | 5 (0.8%) |
| Total | 427 (100.0%) | 633 (100.0%) |
Commute Time in Glasco
The most frequently occuring commute durations in Glasco are 10 to 14 minutes (177 commuters, 17.4%), 20 to 24 minutes (141 commuters, 13.9%), and 15 to 19 minutes (132 commuters, 13.0%).
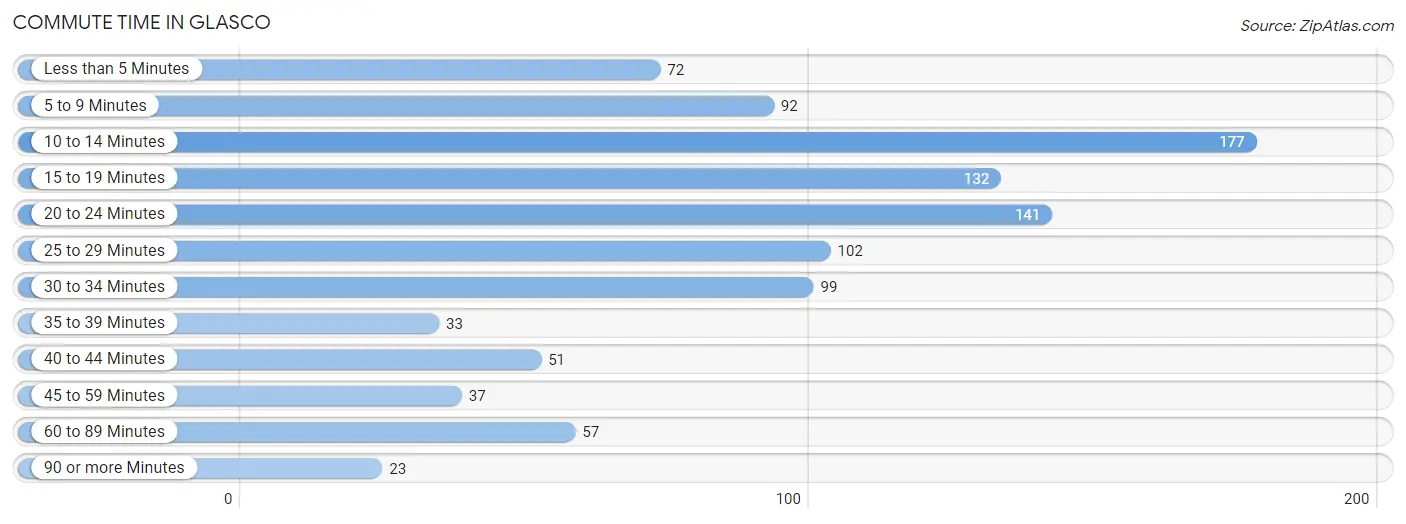
| Commute Time | # Commuters | % Commuters |
| Less than 5 Minutes | 72 | 7.1% |
| 5 to 9 Minutes | 92 | 9.1% |
| 10 to 14 Minutes | 177 | 17.4% |
| 15 to 19 Minutes | 132 | 13.0% |
| 20 to 24 Minutes | 141 | 13.9% |
| 25 to 29 Minutes | 102 | 10.0% |
| 30 to 34 Minutes | 99 | 9.7% |
| 35 to 39 Minutes | 33 | 3.3% |
| 40 to 44 Minutes | 51 | 5.0% |
| 45 to 59 Minutes | 37 | 3.6% |
| 60 to 89 Minutes | 57 | 5.6% |
| 90 or more Minutes | 23 | 2.3% |
Commute Time by Sex in Glasco
The most common commute times in Glasco are 15 to 19 minutes (90 commuters, 21.5%) for males and 10 to 14 minutes (129 commuters, 21.6%) for females.
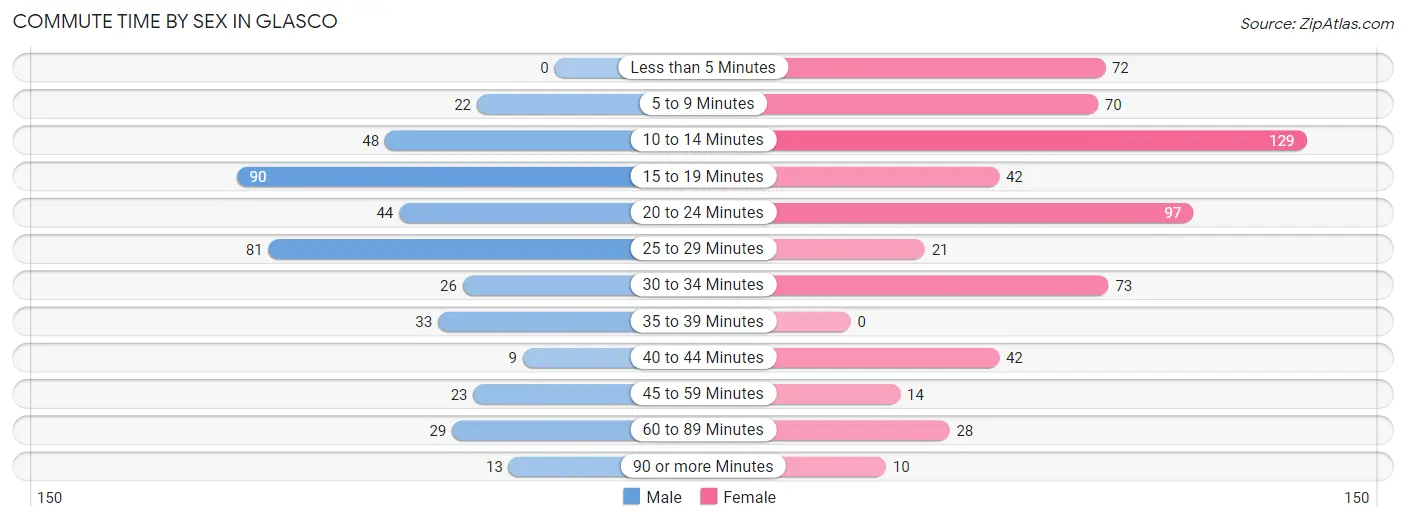
| Commute Time | Male | Female |
| Less than 5 Minutes | 0 (0.0%) | 72 (12.0%) |
| 5 to 9 Minutes | 22 (5.3%) | 70 (11.7%) |
| 10 to 14 Minutes | 48 (11.5%) | 129 (21.6%) |
| 15 to 19 Minutes | 90 (21.5%) | 42 (7.0%) |
| 20 to 24 Minutes | 44 (10.5%) | 97 (16.2%) |
| 25 to 29 Minutes | 81 (19.4%) | 21 (3.5%) |
| 30 to 34 Minutes | 26 (6.2%) | 73 (12.2%) |
| 35 to 39 Minutes | 33 (7.9%) | 0 (0.0%) |
| 40 to 44 Minutes | 9 (2.1%) | 42 (7.0%) |
| 45 to 59 Minutes | 23 (5.5%) | 14 (2.3%) |
| 60 to 89 Minutes | 29 (6.9%) | 28 (4.7%) |
| 90 or more Minutes | 13 (3.1%) | 10 (1.7%) |
Time of Departure to Work by Sex in Glasco
The most frequent times of departure to work in Glasco are 7:00 AM to 7:29 AM (95, 22.7%) for males and 8:00 AM to 8:29 AM (95, 15.9%) for females.
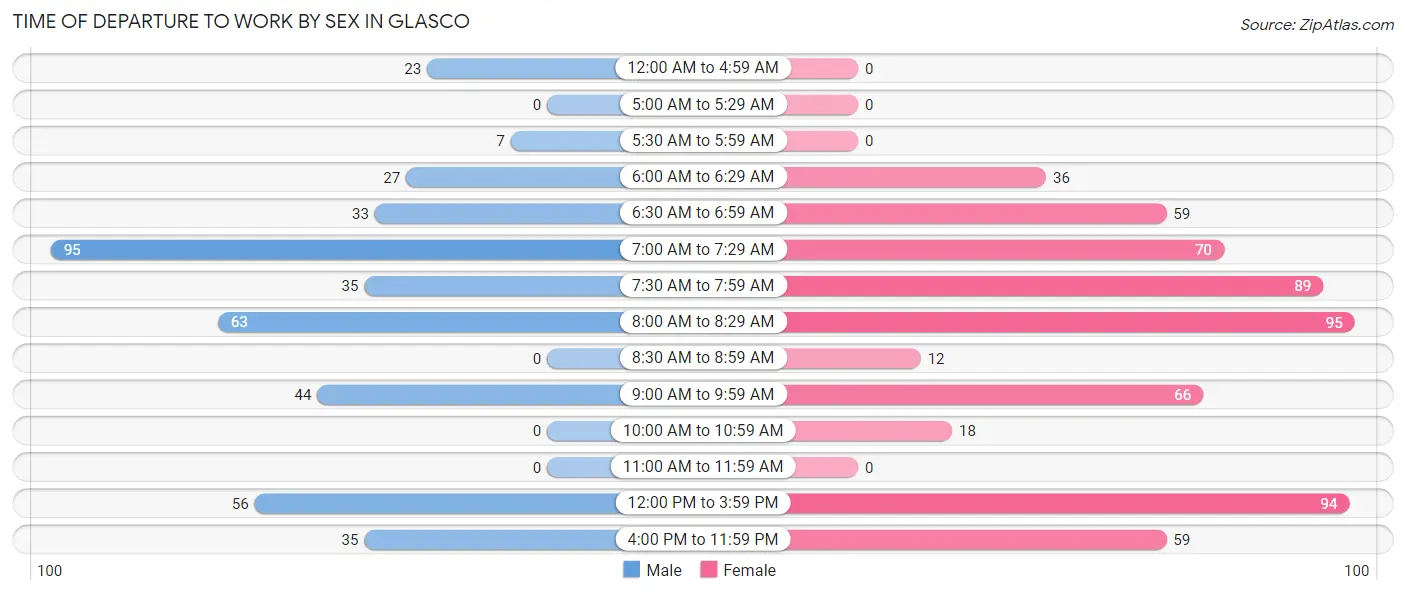
| Time of Departure | Male | Female |
| 12:00 AM to 4:59 AM | 23 (5.5%) | 0 (0.0%) |
| 5:00 AM to 5:29 AM | 0 (0.0%) | 0 (0.0%) |
| 5:30 AM to 5:59 AM | 7 (1.7%) | 0 (0.0%) |
| 6:00 AM to 6:29 AM | 27 (6.5%) | 36 (6.0%) |
| 6:30 AM to 6:59 AM | 33 (7.9%) | 59 (9.9%) |
| 7:00 AM to 7:29 AM | 95 (22.7%) | 70 (11.7%) |
| 7:30 AM to 7:59 AM | 35 (8.4%) | 89 (14.9%) |
| 8:00 AM to 8:29 AM | 63 (15.1%) | 95 (15.9%) |
| 8:30 AM to 8:59 AM | 0 (0.0%) | 12 (2.0%) |
| 9:00 AM to 9:59 AM | 44 (10.5%) | 66 (11.0%) |
| 10:00 AM to 10:59 AM | 0 (0.0%) | 18 (3.0%) |
| 11:00 AM to 11:59 AM | 0 (0.0%) | 0 (0.0%) |
| 12:00 PM to 3:59 PM | 56 (13.4%) | 94 (15.7%) |
| 4:00 PM to 11:59 PM | 35 (8.4%) | 59 (9.9%) |
| Total | 418 (100.0%) | 598 (100.0%) |
Housing Occupancy in Glasco
Occupancy by Ownership in Glasco
Of the total 1,008 dwellings in Glasco, owner-occupied units account for 505 (50.1%), while renter-occupied units make up 503 (49.9%).
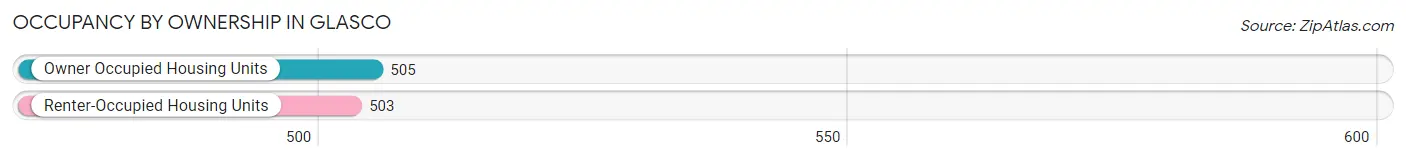
| Occupancy | # Housing Units | % Housing Units |
| Owner Occupied Housing Units | 505 | 50.1% |
| Renter-Occupied Housing Units | 503 | 49.9% |
| Total Occupied Housing Units | 1,008 | 100.0% |
Occupancy by Household Size in Glasco
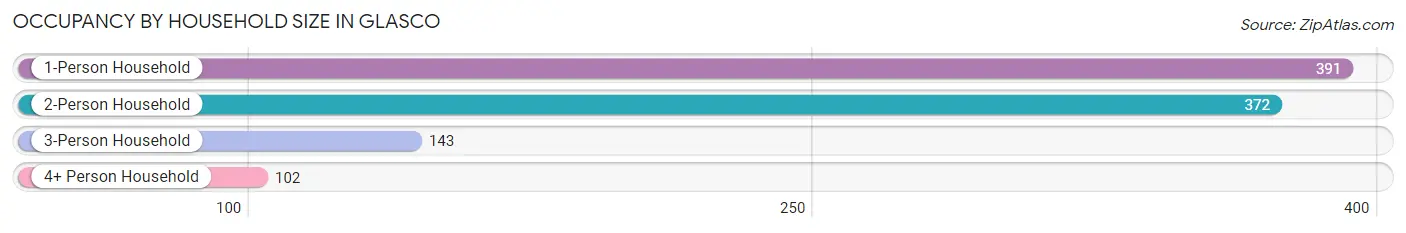
| Household Size | # Housing Units | % Housing Units |
| 1-Person Household | 391 | 38.8% |
| 2-Person Household | 372 | 36.9% |
| 3-Person Household | 143 | 14.2% |
| 4+ Person Household | 102 | 10.1% |
| Total Housing Units | 1,008 | 100.0% |
Occupancy by Ownership by Household Size in Glasco
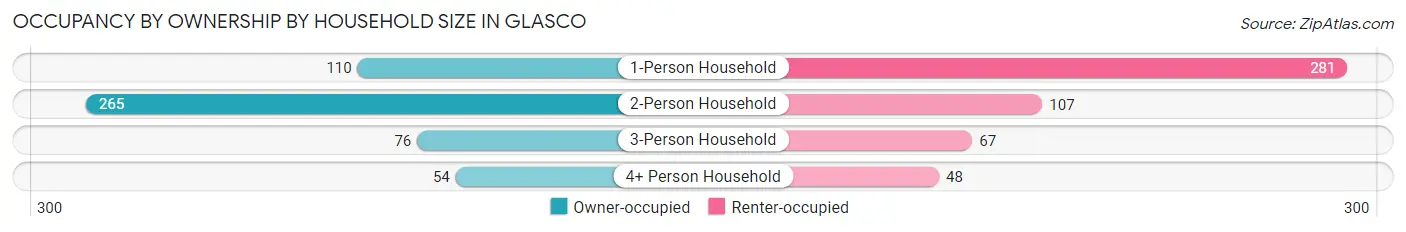
| Household Size | Owner-occupied | Renter-occupied |
| 1-Person Household | 110 (28.1%) | 281 (71.9%) |
| 2-Person Household | 265 (71.2%) | 107 (28.8%) |
| 3-Person Household | 76 (53.1%) | 67 (46.9%) |
| 4+ Person Household | 54 (52.9%) | 48 (47.1%) |
| Total Housing Units | 505 (50.1%) | 503 (49.9%) |
Occupancy by Educational Attainment in Glasco
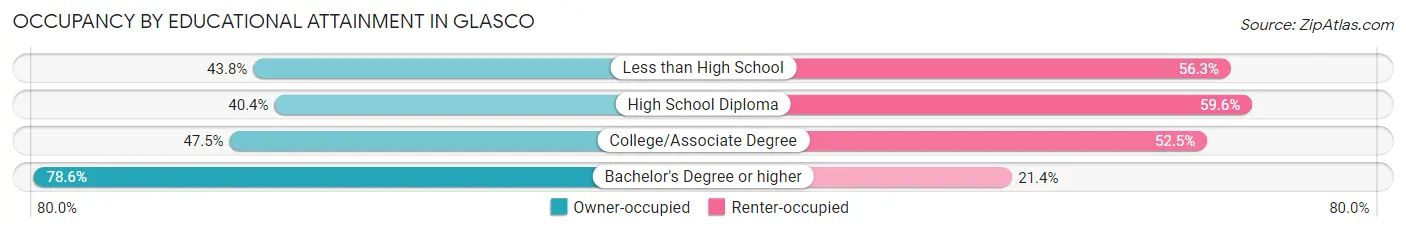
| Household Size | Owner-occupied | Renter-occupied |
| Less than High School | 21 (43.8%) | 27 (56.2%) |
| High School Diploma | 187 (40.4%) | 276 (59.6%) |
| College/Associate Degree | 143 (47.5%) | 158 (52.5%) |
| Bachelor's Degree or higher | 154 (78.6%) | 42 (21.4%) |
Occupancy by Age of Householder in Glasco
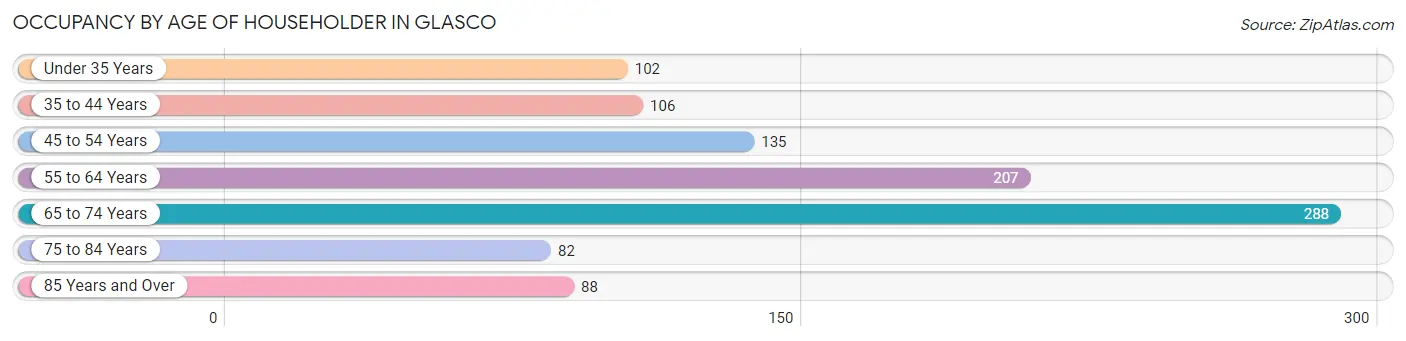
| Age Bracket | # Households | % Households |
| Under 35 Years | 102 | 10.1% |
| 35 to 44 Years | 106 | 10.5% |
| 45 to 54 Years | 135 | 13.4% |
| 55 to 64 Years | 207 | 20.5% |
| 65 to 74 Years | 288 | 28.6% |
| 75 to 84 Years | 82 | 8.1% |
| 85 Years and Over | 88 | 8.7% |
| Total | 1,008 | 100.0% |
Housing Finances in Glasco
Median Income by Occupancy in Glasco
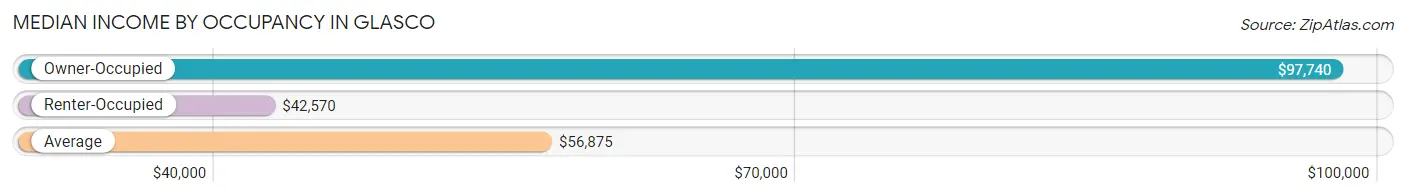
| Occupancy Type | # Households | Median Income |
| Owner-Occupied | 505 (50.1%) | $97,740 |
| Renter-Occupied | 503 (49.9%) | $42,570 |
| Average | 1,008 (100.0%) | $56,875 |
Occupancy by Householder Income Bracket in Glasco
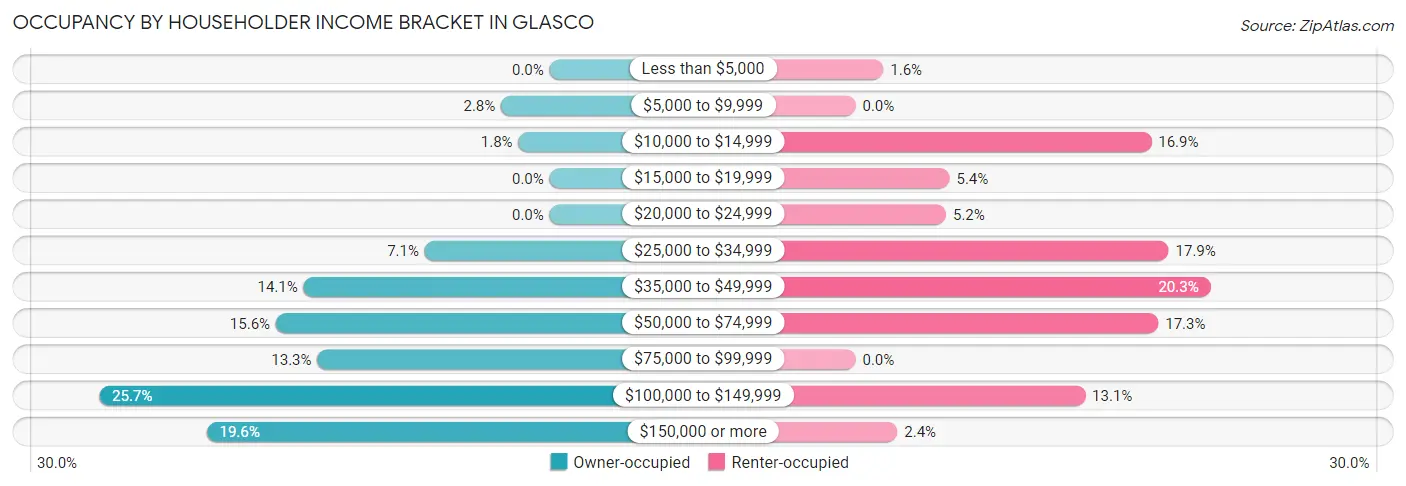
| Income Bracket | Owner-occupied | Renter-occupied |
| Less than $5,000 | 0 (0.0%) | 8 (1.6%) |
| $5,000 to $9,999 | 14 (2.8%) | 0 (0.0%) |
| $10,000 to $14,999 | 9 (1.8%) | 85 (16.9%) |
| $15,000 to $19,999 | 0 (0.0%) | 27 (5.4%) |
| $20,000 to $24,999 | 0 (0.0%) | 26 (5.2%) |
| $25,000 to $34,999 | 36 (7.1%) | 90 (17.9%) |
| $35,000 to $49,999 | 71 (14.1%) | 102 (20.3%) |
| $50,000 to $74,999 | 79 (15.6%) | 87 (17.3%) |
| $75,000 to $99,999 | 67 (13.3%) | 0 (0.0%) |
| $100,000 to $149,999 | 130 (25.7%) | 66 (13.1%) |
| $150,000 or more | 99 (19.6%) | 12 (2.4%) |
| Total | 505 (100.0%) | 503 (100.0%) |
Monthly Housing Cost Tiers in Glasco
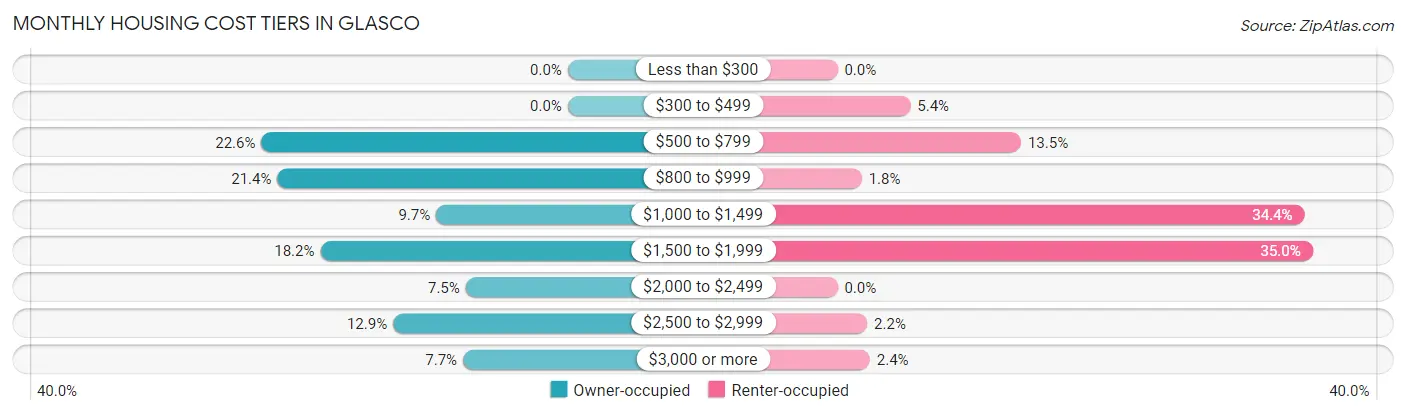
| Monthly Cost | Owner-occupied | Renter-occupied |
| Less than $300 | 0 (0.0%) | 0 (0.0%) |
| $300 to $499 | 0 (0.0%) | 27 (5.4%) |
| $500 to $799 | 114 (22.6%) | 68 (13.5%) |
| $800 to $999 | 108 (21.4%) | 9 (1.8%) |
| $1,000 to $1,499 | 49 (9.7%) | 173 (34.4%) |
| $1,500 to $1,999 | 92 (18.2%) | 176 (35.0%) |
| $2,000 to $2,499 | 38 (7.5%) | 0 (0.0%) |
| $2,500 to $2,999 | 65 (12.9%) | 11 (2.2%) |
| $3,000 or more | 39 (7.7%) | 12 (2.4%) |
| Total | 505 (100.0%) | 503 (100.0%) |
Physical Housing Characteristics in Glasco
Housing Structures in Glasco
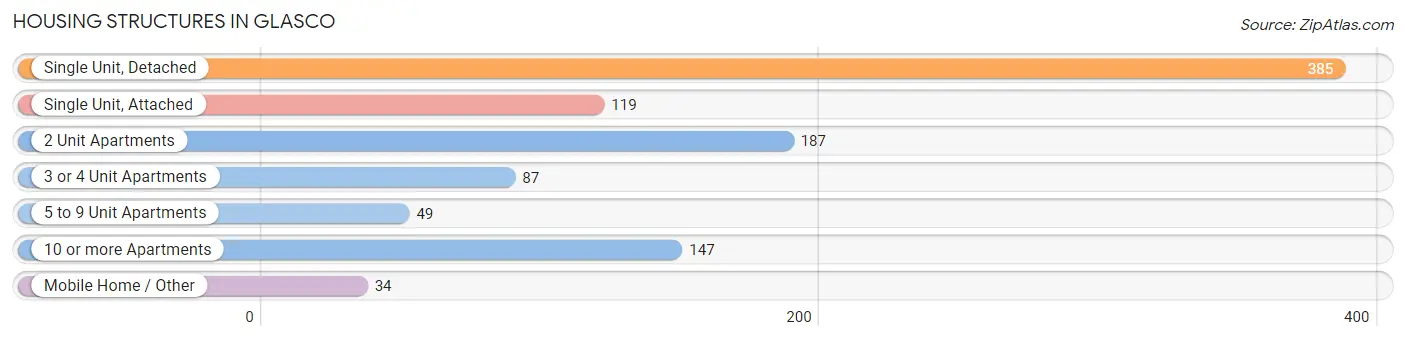
| Structure Type | # Housing Units | % Housing Units |
| Single Unit, Detached | 385 | 38.2% |
| Single Unit, Attached | 119 | 11.8% |
| 2 Unit Apartments | 187 | 18.5% |
| 3 or 4 Unit Apartments | 87 | 8.6% |
| 5 to 9 Unit Apartments | 49 | 4.9% |
| 10 or more Apartments | 147 | 14.6% |
| Mobile Home / Other | 34 | 3.4% |
| Total | 1,008 | 100.0% |
Housing Structures by Occupancy in Glasco
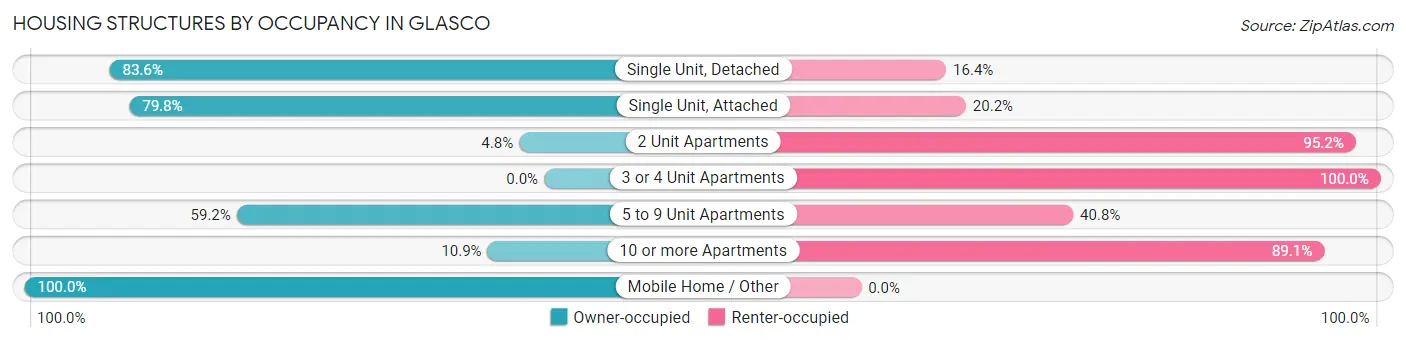
| Structure Type | Owner-occupied | Renter-occupied |
| Single Unit, Detached | 322 (83.6%) | 63 (16.4%) |
| Single Unit, Attached | 95 (79.8%) | 24 (20.2%) |
| 2 Unit Apartments | 9 (4.8%) | 178 (95.2%) |
| 3 or 4 Unit Apartments | 0 (0.0%) | 87 (100.0%) |
| 5 to 9 Unit Apartments | 29 (59.2%) | 20 (40.8%) |
| 10 or more Apartments | 16 (10.9%) | 131 (89.1%) |
| Mobile Home / Other | 34 (100.0%) | 0 (0.0%) |
| Total | 505 (50.1%) | 503 (49.9%) |
Housing Structures by Number of Rooms in Glasco
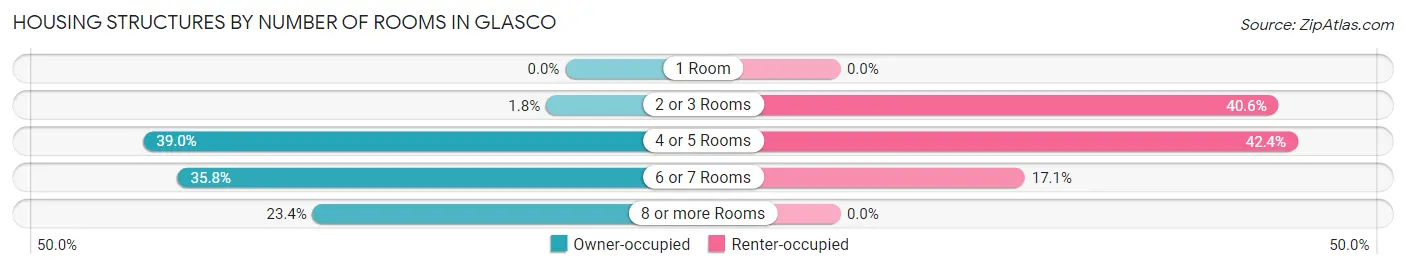
| Number of Rooms | Owner-occupied | Renter-occupied |
| 1 Room | 0 (0.0%) | 0 (0.0%) |
| 2 or 3 Rooms | 9 (1.8%) | 204 (40.6%) |
| 4 or 5 Rooms | 197 (39.0%) | 213 (42.3%) |
| 6 or 7 Rooms | 181 (35.8%) | 86 (17.1%) |
| 8 or more Rooms | 118 (23.4%) | 0 (0.0%) |
| Total | 505 (100.0%) | 503 (100.0%) |
Housing Structure by Heating Type in Glasco
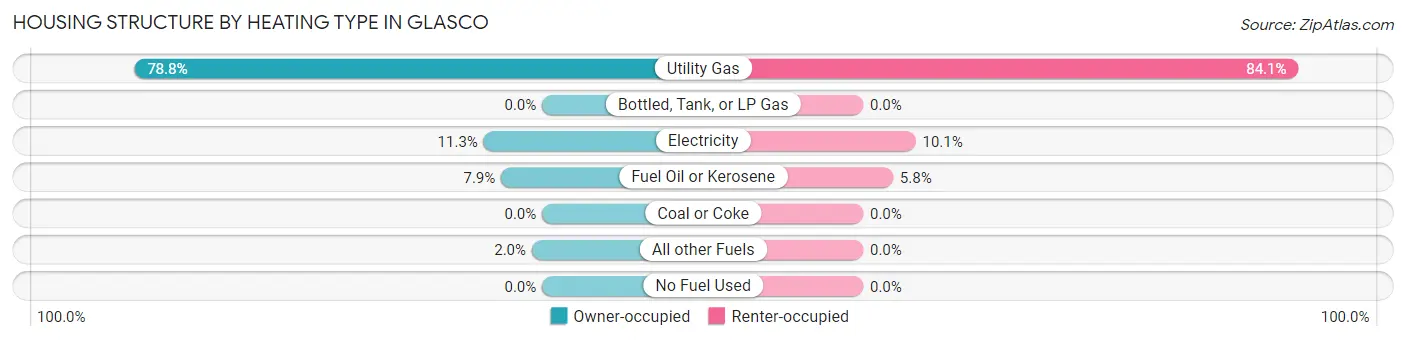
| Heating Type | Owner-occupied | Renter-occupied |
| Utility Gas | 398 (78.8%) | 423 (84.1%) |
| Bottled, Tank, or LP Gas | 0 (0.0%) | 0 (0.0%) |
| Electricity | 57 (11.3%) | 51 (10.1%) |
| Fuel Oil or Kerosene | 40 (7.9%) | 29 (5.8%) |
| Coal or Coke | 0 (0.0%) | 0 (0.0%) |
| All other Fuels | 10 (2.0%) | 0 (0.0%) |
| No Fuel Used | 0 (0.0%) | 0 (0.0%) |
| Total | 505 (100.0%) | 503 (100.0%) |
Household Vehicle Usage in Glasco
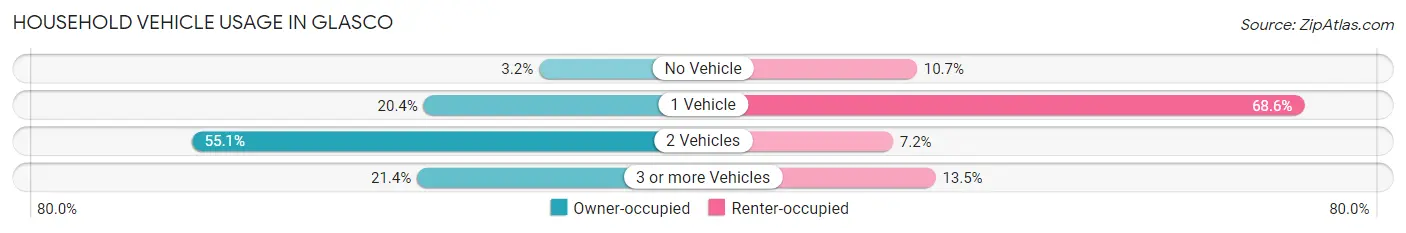
| Vehicles per Household | Owner-occupied | Renter-occupied |
| No Vehicle | 16 (3.2%) | 54 (10.7%) |
| 1 Vehicle | 103 (20.4%) | 345 (68.6%) |
| 2 Vehicles | 278 (55.0%) | 36 (7.2%) |
| 3 or more Vehicles | 108 (21.4%) | 68 (13.5%) |
| Total | 505 (100.0%) | 503 (100.0%) |
Real Estate & Mortgages in Glasco
Real Estate and Mortgage Overview in Glasco
| Characteristic | Without Mortgage | With Mortgage |
| Housing Units | 280 | 225 |
| Median Property Value | $287,100 | $304,500 |
| Median Household Income | $55,926 | $62 |
| Monthly Housing Costs | $902 | $39 |
| Real Estate Taxes | $5,160 | $0 |
Property Value by Mortgage Status in Glasco
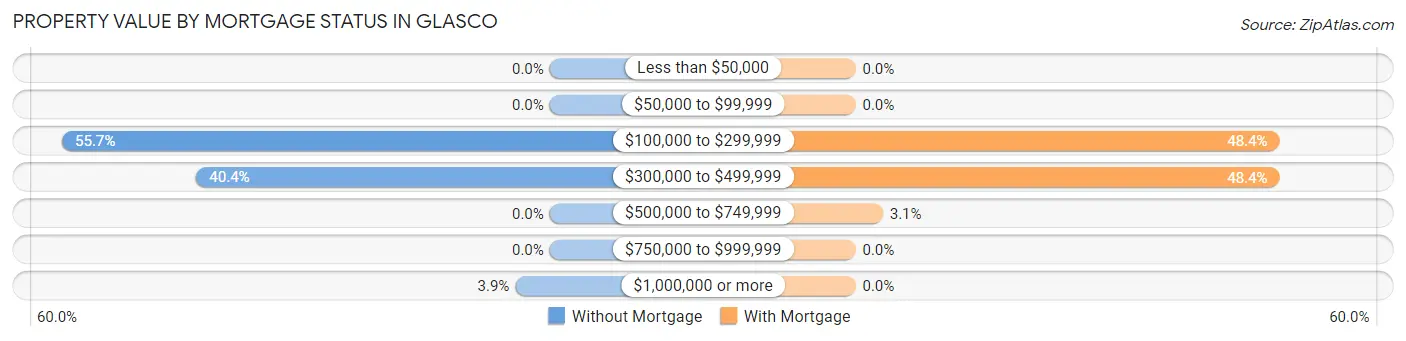
| Property Value | Without Mortgage | With Mortgage |
| Less than $50,000 | 0 (0.0%) | 0 (0.0%) |
| $50,000 to $99,999 | 0 (0.0%) | 0 (0.0%) |
| $100,000 to $299,999 | 156 (55.7%) | 109 (48.4%) |
| $300,000 to $499,999 | 113 (40.4%) | 109 (48.4%) |
| $500,000 to $749,999 | 0 (0.0%) | 7 (3.1%) |
| $750,000 to $999,999 | 0 (0.0%) | 0 (0.0%) |
| $1,000,000 or more | 11 (3.9%) | 0 (0.0%) |
| Total | 280 (100.0%) | 225 (100.0%) |
Household Income by Mortgage Status in Glasco
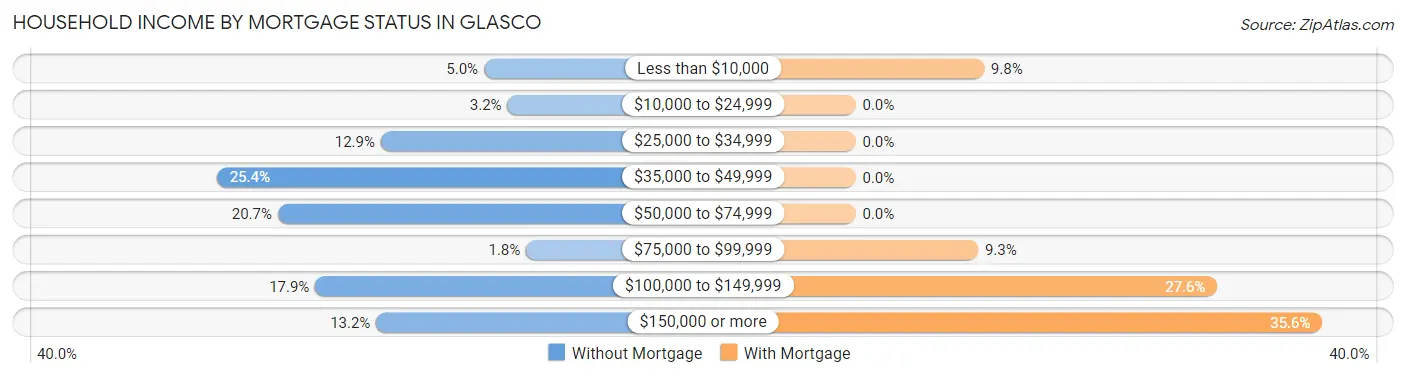
| Household Income | Without Mortgage | With Mortgage |
| Less than $10,000 | 14 (5.0%) | 22 (9.8%) |
| $10,000 to $24,999 | 9 (3.2%) | 0 (0.0%) |
| $25,000 to $34,999 | 36 (12.9%) | 0 (0.0%) |
| $35,000 to $49,999 | 71 (25.4%) | 0 (0.0%) |
| $50,000 to $74,999 | 58 (20.7%) | 0 (0.0%) |
| $75,000 to $99,999 | 5 (1.8%) | 21 (9.3%) |
| $100,000 to $149,999 | 50 (17.9%) | 62 (27.6%) |
| $150,000 or more | 37 (13.2%) | 80 (35.6%) |
| Total | 280 (100.0%) | 225 (100.0%) |
Property Value to Household Income Ratio in Glasco
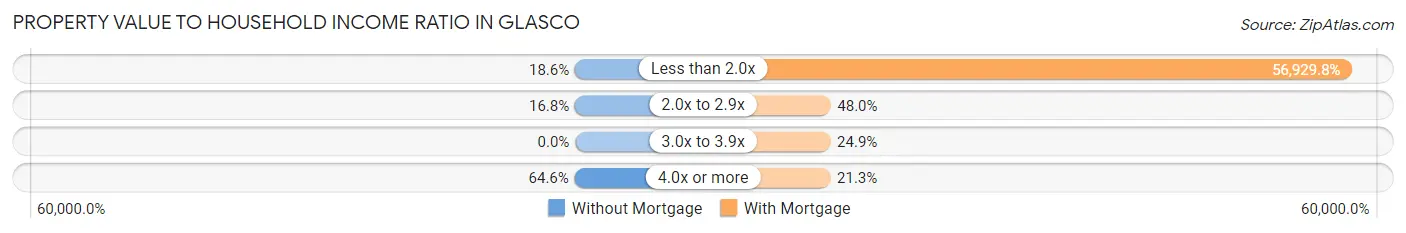
| Value-to-Income Ratio | Without Mortgage | With Mortgage |
| Less than 2.0x | 52 (18.6%) | 128,092 (56,929.8%) |
| 2.0x to 2.9x | 47 (16.8%) | 108 (48.0%) |
| 3.0x to 3.9x | 0 (0.0%) | 56 (24.9%) |
| 4.0x or more | 181 (64.6%) | 48 (21.3%) |
| Total | 280 (100.0%) | 225 (100.0%) |
Real Estate Taxes by Mortgage Status in Glasco
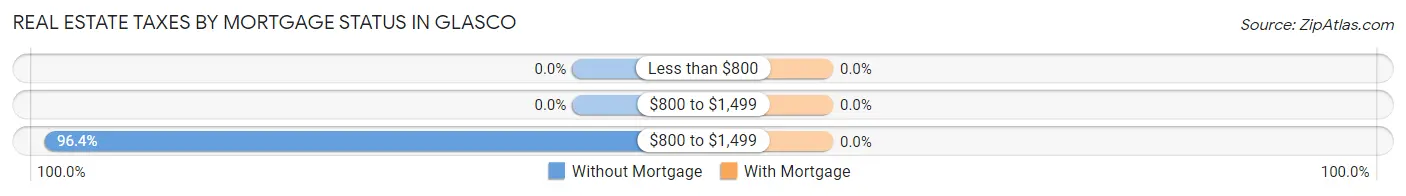
| Property Taxes | Without Mortgage | With Mortgage |
| Less than $800 | 0 (0.0%) | 0 (0.0%) |
| $800 to $1,499 | 0 (0.0%) | 0 (0.0%) |
| $800 to $1,499 | 270 (96.4%) | 0 (0.0%) |
| Total | 280 (100.0%) | 225 (100.0%) |
Health & Disability in Glasco
Health Insurance Coverage by Age in Glasco
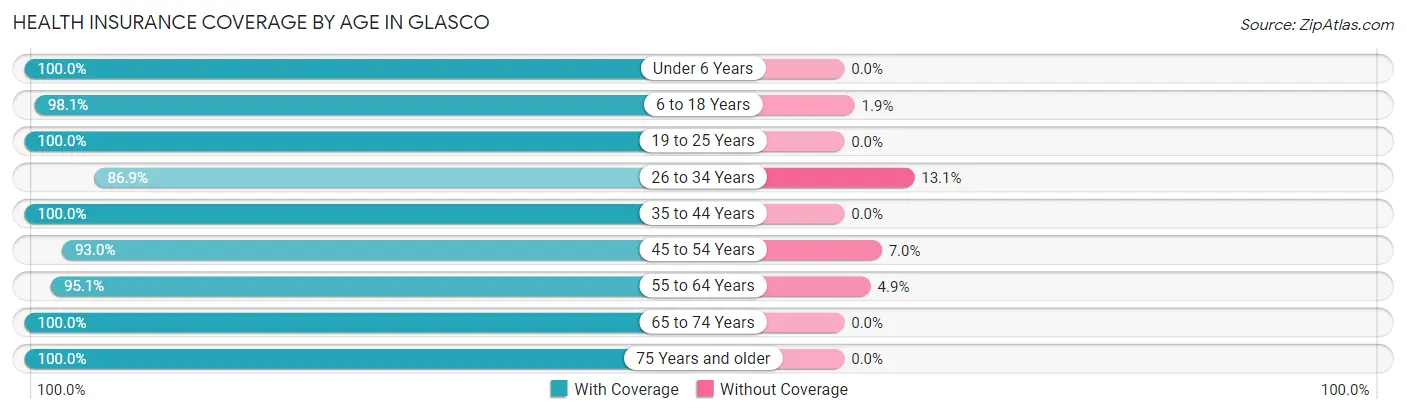
| Age Bracket | With Coverage | Without Coverage |
| Under 6 Years | 41 (100.0%) | 0 (0.0%) |
| 6 to 18 Years | 356 (98.1%) | 7 (1.9%) |
| 19 to 25 Years | 91 (100.0%) | 0 (0.0%) |
| 26 to 34 Years | 193 (86.9%) | 29 (13.1%) |
| 35 to 44 Years | 165 (100.0%) | 0 (0.0%) |
| 45 to 54 Years | 200 (93.0%) | 15 (7.0%) |
| 55 to 64 Years | 348 (95.1%) | 18 (4.9%) |
| 65 to 74 Years | 394 (100.0%) | 0 (0.0%) |
| 75 Years and older | 277 (100.0%) | 0 (0.0%) |
| Total | 2,065 (96.8%) | 69 (3.2%) |
Health Insurance Coverage by Citizenship Status in Glasco
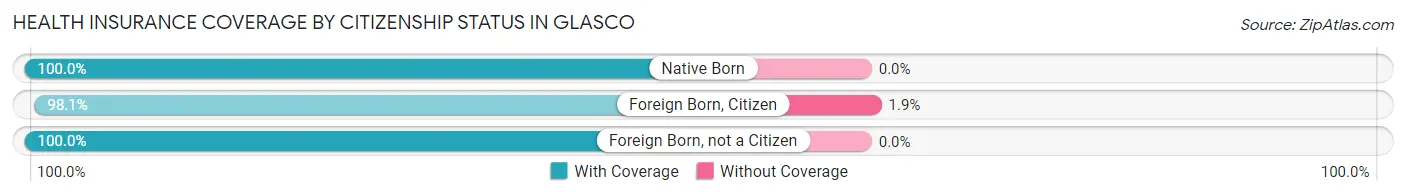
| Citizenship Status | With Coverage | Without Coverage |
| Native Born | 41 (100.0%) | 0 (0.0%) |
| Foreign Born, Citizen | 356 (98.1%) | 7 (1.9%) |
| Foreign Born, not a Citizen | 91 (100.0%) | 0 (0.0%) |
Health Insurance Coverage by Household Income in Glasco
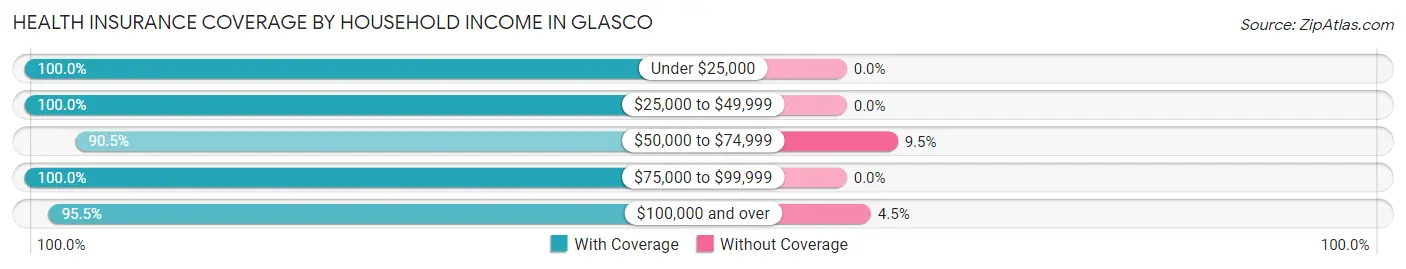
| Household Income | With Coverage | Without Coverage |
| Under $25,000 | 169 (100.0%) | 0 (0.0%) |
| $25,000 to $49,999 | 520 (100.0%) | 0 (0.0%) |
| $50,000 to $74,999 | 275 (90.5%) | 29 (9.5%) |
| $75,000 to $99,999 | 178 (100.0%) | 0 (0.0%) |
| $100,000 and over | 845 (95.5%) | 40 (4.5%) |
Public vs Private Health Insurance Coverage by Age in Glasco
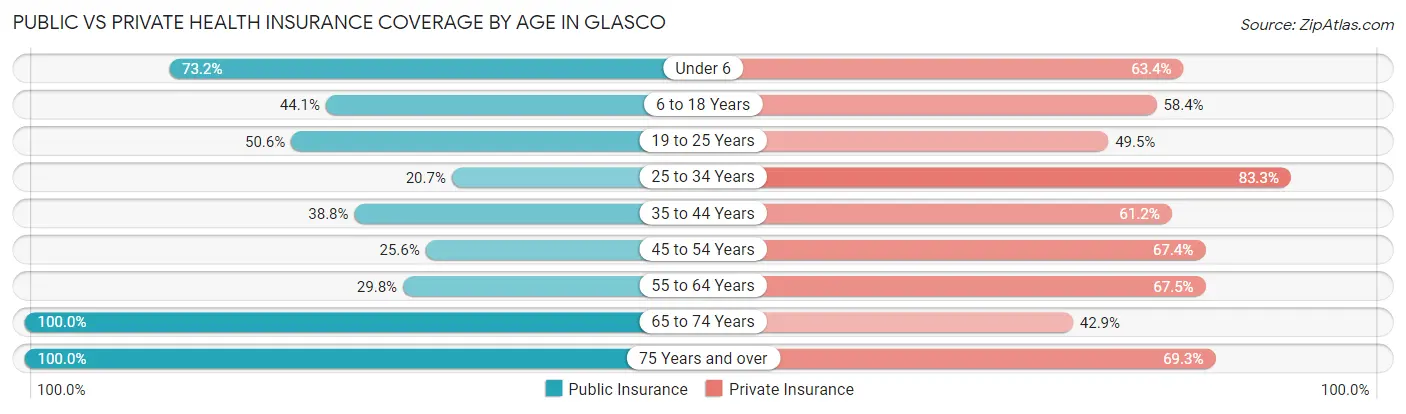
| Age Bracket | Public Insurance | Private Insurance |
| Under 6 | 30 (73.2%) | 26 (63.4%) |
| 6 to 18 Years | 160 (44.1%) | 212 (58.4%) |
| 19 to 25 Years | 46 (50.5%) | 45 (49.4%) |
| 25 to 34 Years | 46 (20.7%) | 185 (83.3%) |
| 35 to 44 Years | 64 (38.8%) | 101 (61.2%) |
| 45 to 54 Years | 55 (25.6%) | 145 (67.4%) |
| 55 to 64 Years | 109 (29.8%) | 247 (67.5%) |
| 65 to 74 Years | 394 (100.0%) | 169 (42.9%) |
| 75 Years and over | 277 (100.0%) | 192 (69.3%) |
| Total | 1,181 (55.3%) | 1,322 (62.0%) |
Disability Status by Sex by Age in Glasco
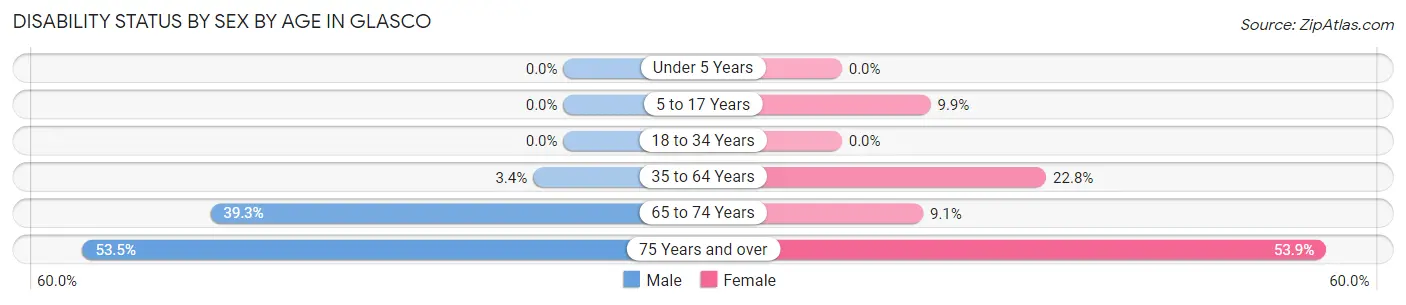
| Age Bracket | Male | Female |
| Under 5 Years | 0 (0.0%) | 0 (0.0%) |
| 5 to 17 Years | 0 (0.0%) | 8 (9.9%) |
| 18 to 34 Years | 0 (0.0%) | 0 (0.0%) |
| 35 to 64 Years | 9 (3.4%) | 109 (22.8%) |
| 65 to 74 Years | 68 (39.3%) | 20 (9.0%) |
| 75 Years and over | 53 (53.5%) | 96 (53.9%) |
Disability Class by Sex by Age in Glasco
Disability Class: Hearing Difficulty
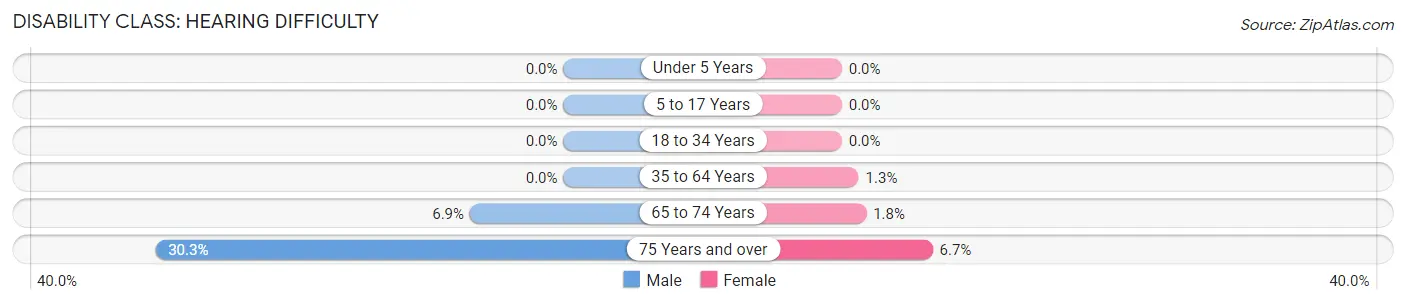
| Age Bracket | Male | Female |
| Under 5 Years | 0 (0.0%) | 0 (0.0%) |
| 5 to 17 Years | 0 (0.0%) | 0 (0.0%) |
| 18 to 34 Years | 0 (0.0%) | 0 (0.0%) |
| 35 to 64 Years | 0 (0.0%) | 6 (1.3%) |
| 65 to 74 Years | 12 (6.9%) | 4 (1.8%) |
| 75 Years and over | 30 (30.3%) | 12 (6.7%) |
Disability Class: Vision Difficulty
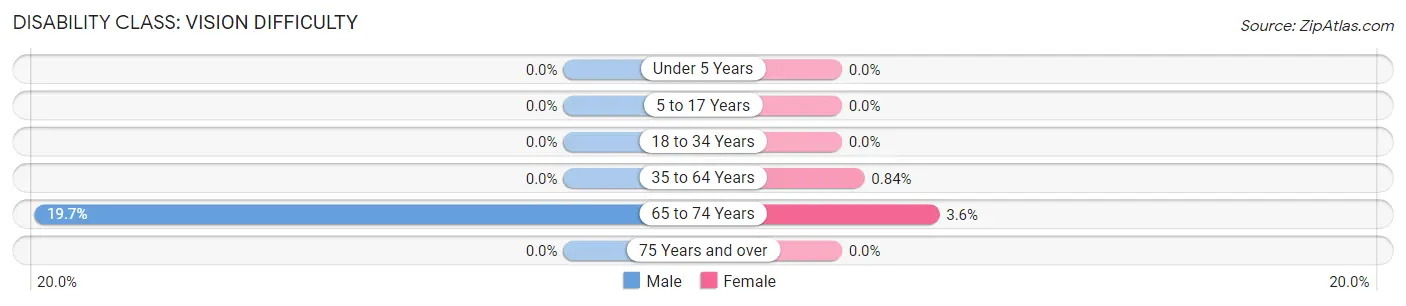
| Age Bracket | Male | Female |
| Under 5 Years | 0 (0.0%) | 0 (0.0%) |
| 5 to 17 Years | 0 (0.0%) | 0 (0.0%) |
| 18 to 34 Years | 0 (0.0%) | 0 (0.0%) |
| 35 to 64 Years | 0 (0.0%) | 4 (0.8%) |
| 65 to 74 Years | 34 (19.7%) | 8 (3.6%) |
| 75 Years and over | 0 (0.0%) | 0 (0.0%) |
Disability Class: Cognitive Difficulty
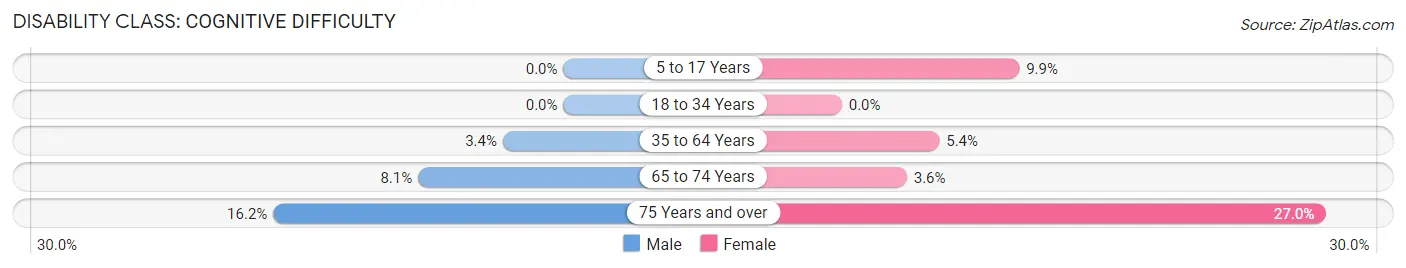
| Age Bracket | Male | Female |
| 5 to 17 Years | 0 (0.0%) | 8 (9.9%) |
| 18 to 34 Years | 0 (0.0%) | 0 (0.0%) |
| 35 to 64 Years | 9 (3.4%) | 26 (5.4%) |
| 65 to 74 Years | 14 (8.1%) | 8 (3.6%) |
| 75 Years and over | 16 (16.2%) | 48 (27.0%) |
Disability Class: Ambulatory Difficulty
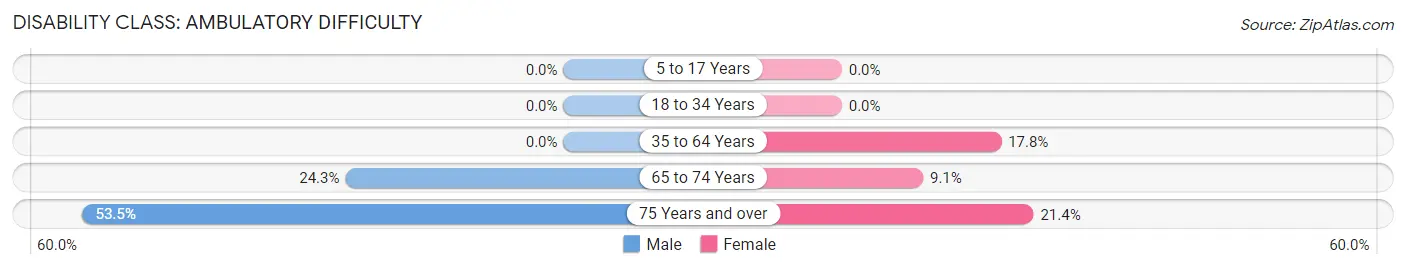
| Age Bracket | Male | Female |
| 5 to 17 Years | 0 (0.0%) | 0 (0.0%) |
| 18 to 34 Years | 0 (0.0%) | 0 (0.0%) |
| 35 to 64 Years | 0 (0.0%) | 85 (17.7%) |
| 65 to 74 Years | 42 (24.3%) | 20 (9.0%) |
| 75 Years and over | 53 (53.5%) | 38 (21.3%) |
Disability Class: Self-Care Difficulty
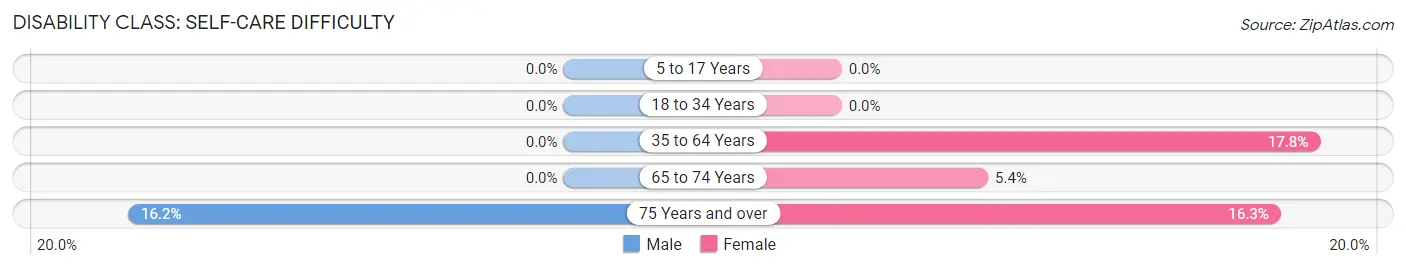
| Age Bracket | Male | Female |
| 5 to 17 Years | 0 (0.0%) | 0 (0.0%) |
| 18 to 34 Years | 0 (0.0%) | 0 (0.0%) |
| 35 to 64 Years | 0 (0.0%) | 85 (17.7%) |
| 65 to 74 Years | 0 (0.0%) | 12 (5.4%) |
| 75 Years and over | 16 (16.2%) | 29 (16.3%) |
Technology Access in Glasco
Computing Device Access in Glasco
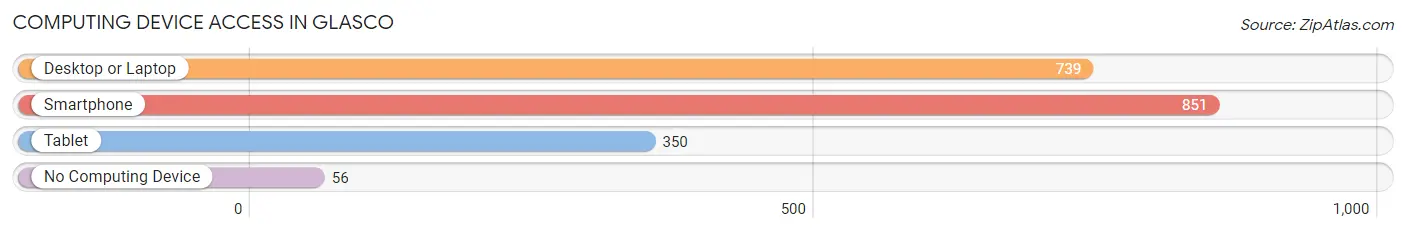
| Device Type | # Households | % Households |
| Desktop or Laptop | 739 | 73.3% |
| Smartphone | 851 | 84.4% |
| Tablet | 350 | 34.7% |
| No Computing Device | 56 | 5.6% |
| Total | 1,008 | 100.0% |
Internet Access in Glasco
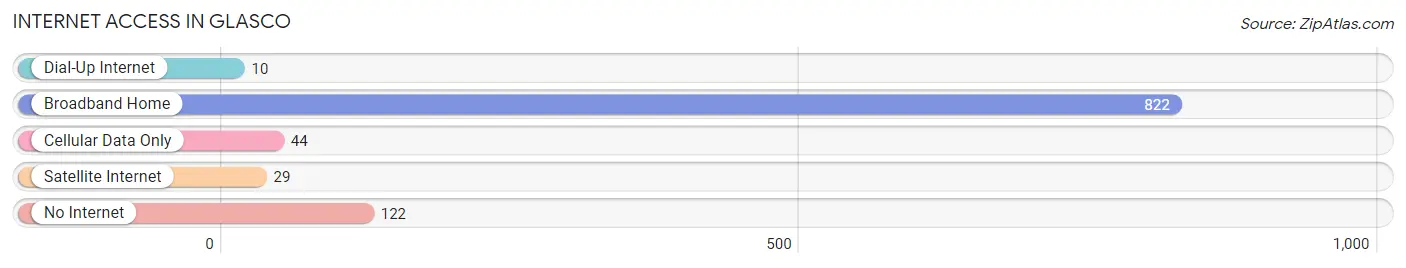
| Internet Type | # Households | % Households |
| Dial-Up Internet | 10 | 1.0% |
| Broadband Home | 822 | 81.6% |
| Cellular Data Only | 44 | 4.4% |
| Satellite Internet | 29 | 2.9% |
| No Internet | 122 | 12.1% |
| Total | 1,008 | 100.0% |
Glasco Summary
Glasco, New York is a small hamlet located in the town of Saugerties in Ulster County, New York. It is situated on the west bank of the Hudson River, approximately 90 miles north of New York City. The hamlet is home to a population of approximately 1,000 people and is a popular destination for tourists and outdoor enthusiasts.
History
The area that is now Glasco was originally inhabited by the Esopus Indians, who were part of the larger Iroquois Confederacy. The first European settlers arrived in the area in the late 17th century, and the hamlet was officially established in 1790. The name Glasco is derived from the Dutch word “glas”, meaning “glass”, and was likely chosen due to the abundance of glass found in the area.
In the 19th century, Glasco was a thriving industrial center, with several glass factories, a paper mill, and a brickyard. The hamlet was also home to a number of other businesses, including a blacksmith, a tannery, and a gristmill. The industrial boom in Glasco ended in the early 20th century, and the hamlet has since become a quiet residential community.
Geography
Glasco is located in the town of Saugerties, in Ulster County, New York. It is situated on the west bank of the Hudson River, approximately 90 miles north of New York City. The hamlet is bordered by the towns of Woodstock to the north, Kingston to the east, and Saugerties to the south and west.
The terrain of Glasco is mostly flat, with some rolling hills in the surrounding area. The hamlet is located in the Catskill Mountains, and is surrounded by forests and farmland. The climate in Glasco is humid continental, with cold winters and warm summers.
Economy
The economy of Glasco is largely based on tourism and outdoor recreation. The hamlet is home to several popular attractions, including the Glasco Gristmill, the Glasco Glassworks Museum, and the Glasco Beach. The hamlet is also home to several restaurants, cafes, and shops.
In addition to tourism, Glasco is home to a number of small businesses, including a hardware store, a gas station, and a grocery store. The hamlet is also home to a number of farms, which produce a variety of fruits and vegetables.
Demographics
As of the 2010 census, the population of Glasco was 1,000. The racial makeup of the hamlet was 94.2% White, 2.2% African American, 0.7% Native American, 0.7% Asian, and 2.2% from other races. The median household income in Glasco was $45,000, and the median home value was $170,000. The unemployment rate in the hamlet was 5.2%.
Conclusion
Glasco, New York is a small hamlet located in the town of Saugerties in Ulster County, New York. It is situated on the west bank of the Hudson River, approximately 90 miles north of New York City. The hamlet is home to a population of approximately 1,000 people and is a popular destination for tourists and outdoor enthusiasts. The economy of Glasco is largely based on tourism and outdoor recreation, and the hamlet is home to several popular attractions, including the Glasco Gristmill, the Glasco Glassworks Museum, and the Glasco Beach. The racial makeup of the hamlet is 94.2% White, 2.2% African American, 0.7% Native American, 0.7% Asian, and 2.2% from other races. The median household income in Glasco was $45,000, and the median home value was $170,000. The unemployment rate in the hamlet was 5.2%.
Common Questions
What is Per Capita Income in Glasco?
Per Capita income in Glasco is $40,900.
What is the Median Family Income in Glasco?
Median Family Income in Glasco is $86,250.
What is the Median Household income in Glasco?
Median Household Income in Glasco is $56,875.
What is Income or Wage Gap in Glasco?
Income or Wage Gap in Glasco is 41.1%.
Women in Glasco earn 58.9 cents for every dollar earned by a man.
What is Inequality or Gini Index in Glasco?
Inequality or Gini Index in Glasco is 0.47.
What is the Total Population of Glasco?
Total Population of Glasco is 2,134.
What is the Total Male Population of Glasco?
Total Male Population of Glasco is 977.
What is the Total Female Population of Glasco?
Total Female Population of Glasco is 1,157.
What is the Ratio of Males per 100 Females in Glasco?
There are 84.44 Males per 100 Females in Glasco.
What is the Ratio of Females per 100 Males in Glasco?
There are 118.42 Females per 100 Males in Glasco.
What is the Median Population Age in Glasco?
Median Population Age in Glasco is 52.8 Years.
What is the Average Family Size in Glasco
Average Family Size in Glasco is 2.6 People.
What is the Average Household Size in Glasco
Average Household Size in Glasco is 2.0 People.
How Large is the Labor Force in Glasco?
There are 1,080 People in the Labor Forcein in Glasco.
What is the Percentage of People in the Labor Force in Glasco?
58.4% of People are in the Labor Force in Glasco.
What is the Unemployment Rate in Glasco?
Unemployment Rate in Glasco is 0.3%.