Zip Codes with the Highest Percentage of Population Employed in Architecture & Engineering in Hempstead, NY
RELATED REPORTS & OPTIONS
Architecture & Engineering
Hempstead
Compare Zip Codes
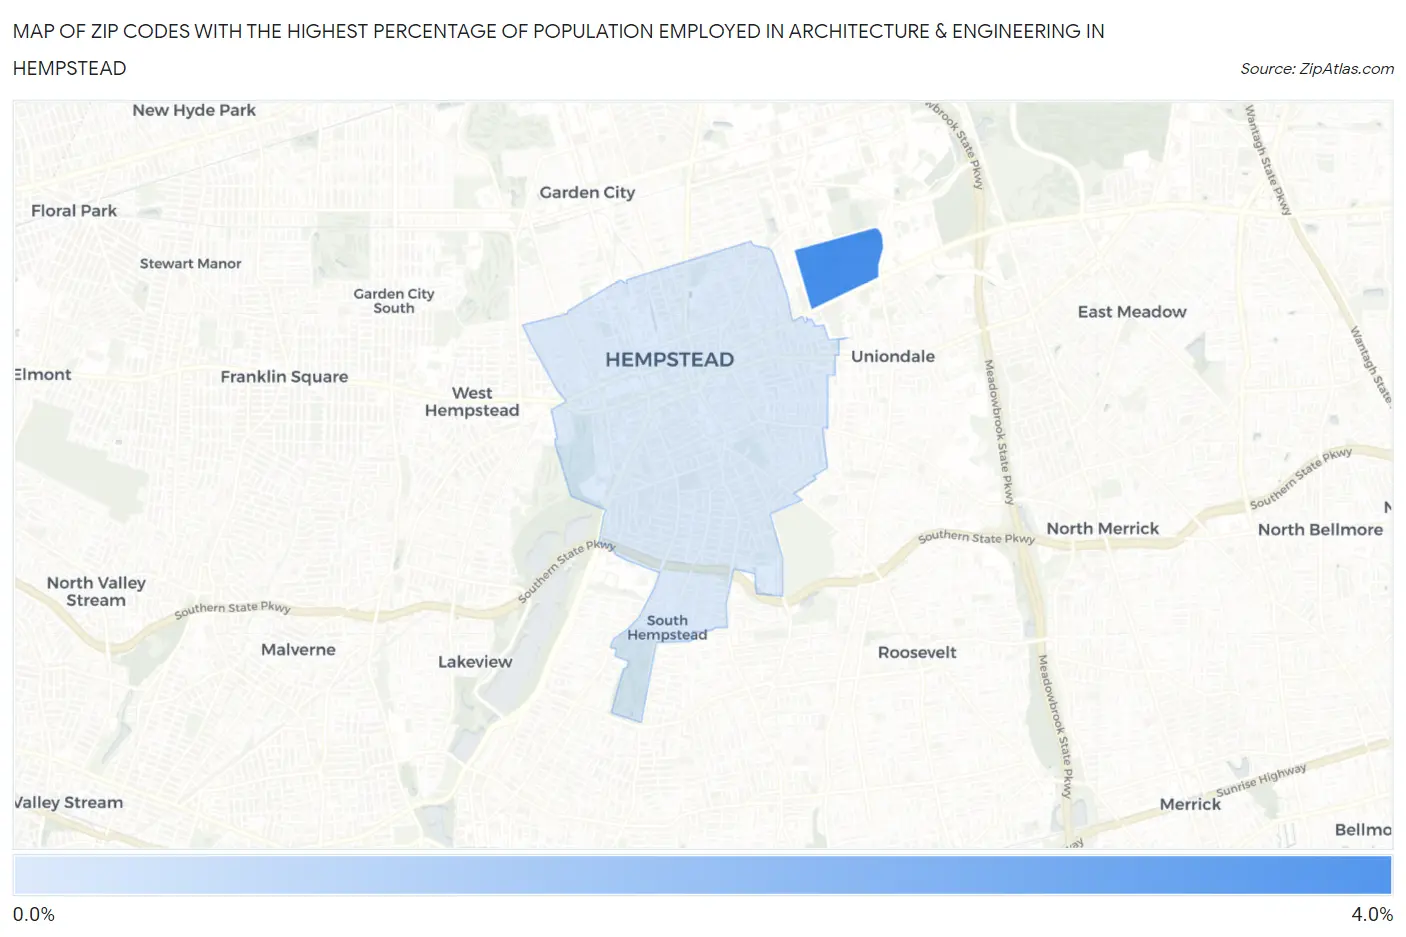
Map of Zip Codes with the Highest Percentage of Population Employed in Architecture & Engineering in Hempstead
0.51%
3.7%
Zip Codes with the Highest Percentage of Population Employed in Architecture & Engineering in Hempstead, NY
| Zip Code | % Employed | vs State | vs National | |
| 1. | 11549 | 3.7% | 1.6%(+2.13)#186 | 2.1%(+1.59)#3,221 |
| 2. | 11550 | 0.51% | 1.6%(-1.11)#1,193 | 2.1%(-1.64)#20,250 |
1
Common Questions
What are the Top Zip Codes with the Highest Percentage of Population Employed in Architecture & Engineering in Hempstead, NY?
Top Zip Codes with the Highest Percentage of Population Employed in Architecture & Engineering in Hempstead, NY are:
What zip code has the Highest Percentage of Population Employed in Architecture & Engineering in Hempstead, NY?
11549 has the Highest Percentage of Population Employed in Architecture & Engineering in Hempstead, NY with 3.7%.
What is the Percentage of Population Employed in Architecture & Engineering in Hempstead, NY?
Percentage of Population Employed in Architecture & Engineering in Hempstead is 0.50%.
What is the Percentage of Population Employed in Architecture & Engineering in New York?
Percentage of Population Employed in Architecture & Engineering in New York is 1.6%.
What is the Percentage of Population Employed in Architecture & Engineering in the United States?
Percentage of Population Employed in Architecture & Engineering in the United States is 2.1%.