Zip Codes with the Highest Percentage of Population Employed in Architecture & Engineering in New York
RELATED REPORTS & OPTIONS
Architecture & Engineering
New York
Compare Zip Codes
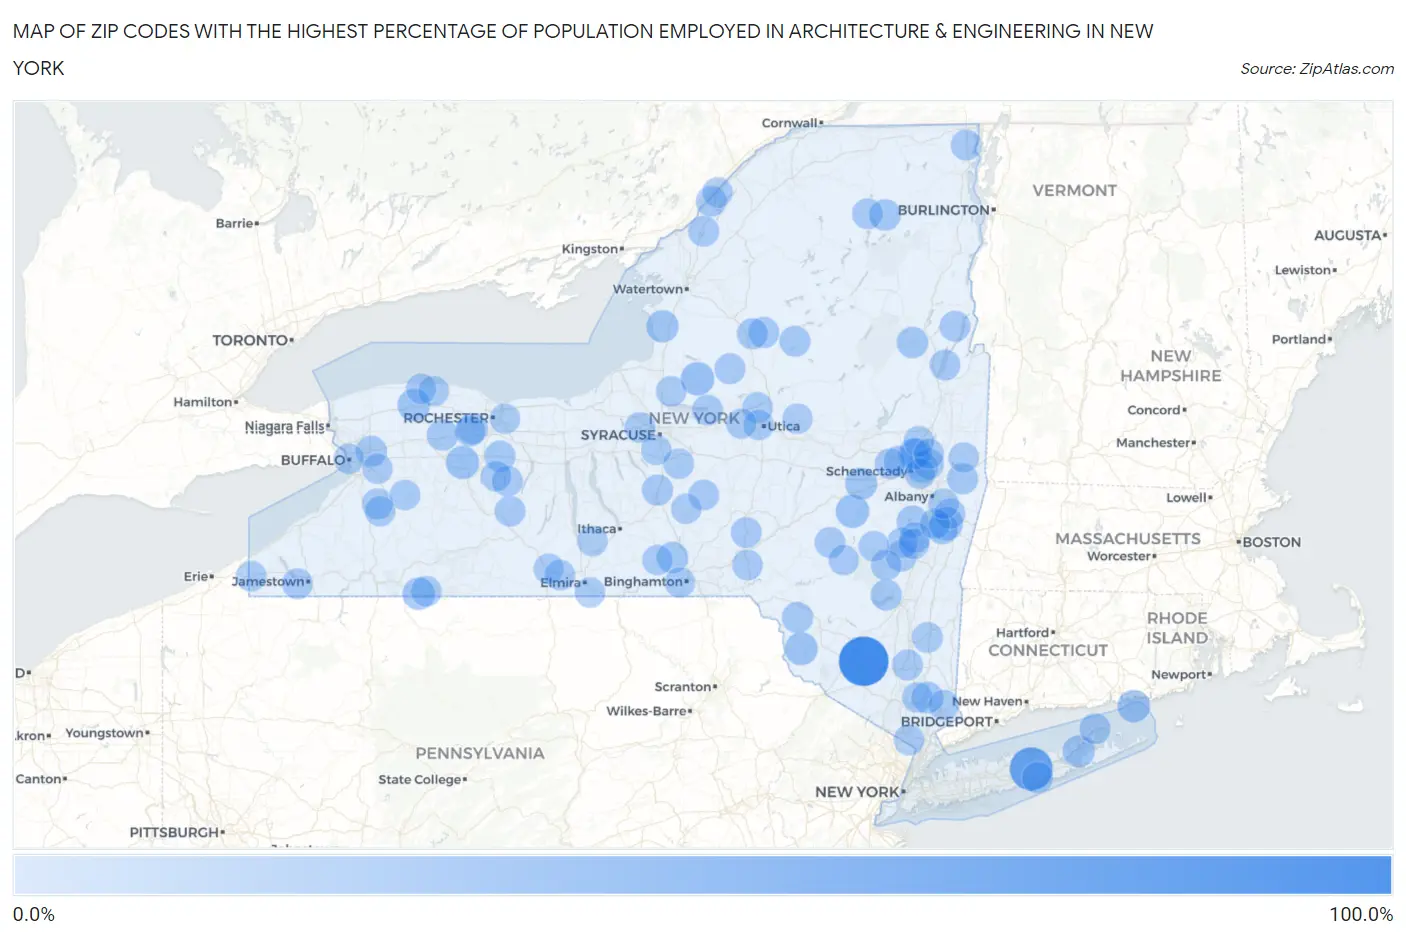
Map of Zip Codes with the Highest Percentage of Population Employed in Architecture & Engineering in New York
0.0%
100.0%
Zip Codes with the Highest Percentage of Population Employed in Architecture & Engineering in New York
| Zip Code | % Employed | vs State | vs National | |
| 1. | 10985 | 100.0% | 1.6%(+98.4)#1 | 2.1%(+97.9)#4 |
| 2. | 11973 | 66.7% | 1.6%(+65.1)#2 | 2.1%(+64.5)#8 |
| 3. | 13483 | 19.6% | 1.6%(+18.0)#3 | 2.1%(+17.5)#98 |
| 4. | 12194 | 19.0% | 1.6%(+17.4)#4 | 2.1%(+16.9)#101 |
| 5. | 12132 | 18.8% | 1.6%(+17.1)#5 | 2.1%(+16.6)#104 |
| 6. | 14592 | 18.6% | 1.6%(+17.0)#6 | 2.1%(+16.5)#105 |
| 7. | 12720 | 17.2% | 1.6%(+15.6)#7 | 2.1%(+15.0)#120 |
| 8. | 06390 | 15.4% | 1.6%(+13.8)#8 | 2.1%(+13.2)#141 |
| 9. | 14479 | 15.2% | 1.6%(+13.6)#9 | 2.1%(+13.1)#143 |
| 10. | 13636 | 14.3% | 1.6%(+12.7)#10 | 2.1%(+12.1)#164 |
| 11. | 14721 | 14.3% | 1.6%(+12.7)#11 | 2.1%(+12.1)#165 |
| 12. | 11956 | 14.2% | 1.6%(+12.6)#12 | 2.1%(+12.0)#169 |
| 13. | 12035 | 12.8% | 1.6%(+11.2)#13 | 2.1%(+10.6)#209 |
| 14. | 12046 | 11.2% | 1.6%(+9.60)#14 | 2.1%(+9.07)#277 |
| 15. | 12939 | 10.6% | 1.6%(+9.03)#15 | 2.1%(+8.49)#303 |
| 16. | 12886 | 10.5% | 1.6%(+8.85)#16 | 2.1%(+8.32)#316 |
| 17. | 10535 | 10.4% | 1.6%(+8.78)#17 | 2.1%(+8.24)#319 |
| 18. | 13802 | 9.7% | 1.6%(+8.10)#18 | 2.1%(+7.57)#363 |
| 19. | 14557 | 9.5% | 1.6%(+7.91)#19 | 2.1%(+7.37)#375 |
| 20. | 12724 | 9.3% | 1.6%(+7.69)#20 | 2.1%(+7.15)#387 |
| 21. | 11955 | 9.3% | 1.6%(+7.69)#21 | 2.1%(+7.15)#388 |
| 22. | 12433 | 9.0% | 1.6%(+7.40)#22 | 2.1%(+6.86)#418 |
| 23. | 14585 | 9.0% | 1.6%(+7.34)#23 | 2.1%(+6.81)#424 |
| 24. | 14514 | 8.9% | 1.6%(+7.31)#24 | 2.1%(+6.77)#430 |
| 25. | 12052 | 8.7% | 1.6%(+7.07)#25 | 2.1%(+6.53)#467 |
| 26. | 13087 | 8.6% | 1.6%(+6.99)#26 | 2.1%(+6.45)#475 |
| 27. | 13312 | 8.6% | 1.6%(+6.98)#27 | 2.1%(+6.44)#476 |
| 28. | 12148 | 8.5% | 1.6%(+6.93)#28 | 2.1%(+6.39)#481 |
| 29. | 12130 | 8.4% | 1.6%(+6.82)#29 | 2.1%(+6.28)#493 |
| 30. | 13345 | 8.3% | 1.6%(+6.72)#30 | 2.1%(+6.18)#514 |
| 31. | 14026 | 8.2% | 1.6%(+6.62)#31 | 2.1%(+6.09)#530 |
| 32. | 12019 | 8.1% | 1.6%(+6.48)#32 | 2.1%(+5.94)#557 |
| 33. | 12027 | 8.0% | 1.6%(+6.41)#33 | 2.1%(+5.88)#568 |
| 34. | 13420 | 7.9% | 1.6%(+6.27)#34 | 2.1%(+5.73)#591 |
| 35. | 11939 | 7.8% | 1.6%(+6.21)#35 | 2.1%(+5.67)#601 |
| 36. | 13489 | 7.7% | 1.6%(+6.11)#36 | 2.1%(+5.57)#618 |
| 37. | 12473 | 7.6% | 1.6%(+6.00)#37 | 2.1%(+5.46)#637 |
| 38. | 12569 | 7.5% | 1.6%(+5.85)#38 | 2.1%(+5.31)#660 |
| 39. | 13164 | 7.4% | 1.6%(+5.83)#39 | 2.1%(+5.29)#662 |
| 40. | 13809 | 7.4% | 1.6%(+5.75)#40 | 2.1%(+5.21)#681 |
| 41. | 12512 | 7.3% | 1.6%(+5.72)#41 | 2.1%(+5.18)#685 |
| 42. | 14069 | 7.3% | 1.6%(+5.72)#42 | 2.1%(+5.18)#686 |
| 43. | 13788 | 7.3% | 1.6%(+5.71)#43 | 2.1%(+5.17)#687 |
| 44. | 12921 | 7.3% | 1.6%(+5.65)#44 | 2.1%(+5.11)#697 |
| 45. | 13679 | 7.3% | 1.6%(+5.65)#45 | 2.1%(+5.11)#699 |
| 46. | 13469 | 7.2% | 1.6%(+5.62)#46 | 2.1%(+5.08)#703 |
| 47. | 12042 | 7.2% | 1.6%(+5.57)#47 | 2.1%(+5.03)#710 |
| 48. | 12431 | 7.2% | 1.6%(+5.57)#48 | 2.1%(+5.03)#711 |
| 49. | 14750 | 6.9% | 1.6%(+5.34)#49 | 2.1%(+4.80)#762 |
| 50. | 12970 | 6.8% | 1.6%(+5.23)#50 | 2.1%(+4.70)#788 |
| 51. | 10962 | 6.8% | 1.6%(+5.21)#51 | 2.1%(+4.67)#795 |
| 52. | 13614 | 6.7% | 1.6%(+5.13)#52 | 2.1%(+4.59)#812 |
| 53. | 12836 | 6.7% | 1.6%(+5.06)#53 | 2.1%(+4.52)#834 |
| 54. | 12058 | 6.6% | 1.6%(+4.97)#54 | 2.1%(+4.43)#856 |
| 55. | 14808 | 6.6% | 1.6%(+4.94)#55 | 2.1%(+4.40)#869 |
| 56. | 13155 | 6.5% | 1.6%(+4.92)#56 | 2.1%(+4.38)#879 |
| 57. | 13157 | 6.4% | 1.6%(+4.82)#57 | 2.1%(+4.28)#915 |
| 58. | 14471 | 6.4% | 1.6%(+4.76)#58 | 2.1%(+4.22)#935 |
| 59. | 12137 | 6.4% | 1.6%(+4.75)#59 | 2.1%(+4.21)#937 |
| 60. | 12844 | 6.4% | 1.6%(+4.75)#60 | 2.1%(+4.21)#939 |
| 61. | 12421 | 6.3% | 1.6%(+4.69)#61 | 2.1%(+4.15)#958 |
| 62. | 12485 | 6.2% | 1.6%(+4.64)#62 | 2.1%(+4.10)#981 |
| 63. | 12065 | 6.2% | 1.6%(+4.55)#63 | 2.1%(+4.01)#1,017 |
| 64. | 10537 | 6.1% | 1.6%(+4.52)#64 | 2.1%(+3.98)#1,028 |
| 65. | 14754 | 6.1% | 1.6%(+4.50)#65 | 2.1%(+3.96)#1,036 |
| 66. | 14830 | 6.1% | 1.6%(+4.48)#66 | 2.1%(+3.94)#1,045 |
| 67. | 13063 | 6.1% | 1.6%(+4.45)#67 | 2.1%(+3.91)#1,054 |
| 68. | 14736 | 6.1% | 1.6%(+4.45)#68 | 2.1%(+3.91)#1,057 |
| 69. | 12123 | 6.0% | 1.6%(+4.40)#69 | 2.1%(+3.86)#1,075 |
| 70. | 12150 | 6.0% | 1.6%(+4.38)#70 | 2.1%(+3.84)#1,086 |
| 71. | 14466 | 6.0% | 1.6%(+4.37)#71 | 2.1%(+3.83)#1,092 |
| 72. | 13804 | 5.9% | 1.6%(+4.27)#72 | 2.1%(+3.73)#1,142 |
| 73. | 12020 | 5.8% | 1.6%(+4.23)#73 | 2.1%(+3.69)#1,161 |
| 74. | 14428 | 5.6% | 1.6%(+3.96)#74 | 2.1%(+3.42)#1,296 |
| 75. | 12496 | 5.6% | 1.6%(+3.95)#75 | 2.1%(+3.41)#1,302 |
| 76. | 13495 | 5.5% | 1.6%(+3.93)#76 | 2.1%(+3.39)#1,310 |
| 77. | 12309 | 5.5% | 1.6%(+3.91)#77 | 2.1%(+3.37)#1,315 |
| 78. | 14082 | 5.5% | 1.6%(+3.88)#78 | 2.1%(+3.34)#1,330 |
| 79. | 14202 | 5.5% | 1.6%(+3.85)#79 | 2.1%(+3.31)#1,353 |
| 80. | 10526 | 5.5% | 1.6%(+3.84)#80 | 2.1%(+3.30)#1,361 |
| 81. | 13167 | 5.4% | 1.6%(+3.77)#81 | 2.1%(+3.23)#1,399 |
| 82. | 12094 | 5.4% | 1.6%(+3.74)#82 | 2.1%(+3.20)#1,422 |
| 83. | 13406 | 5.3% | 1.6%(+3.73)#83 | 2.1%(+3.19)#1,426 |
| 84. | 14870 | 5.3% | 1.6%(+3.72)#84 | 2.1%(+3.18)#1,429 |
| 85. | 14059 | 5.3% | 1.6%(+3.71)#85 | 2.1%(+3.17)#1,432 |
| 86. | 14055 | 5.3% | 1.6%(+3.67)#86 | 2.1%(+3.14)#1,458 |
| 87. | 14805 | 5.3% | 1.6%(+3.67)#87 | 2.1%(+3.13)#1,463 |
| 88. | 13120 | 5.3% | 1.6%(+3.65)#88 | 2.1%(+3.11)#1,471 |
| 89. | 13040 | 5.2% | 1.6%(+3.59)#89 | 2.1%(+3.05)#1,516 |
| 90. | 14477 | 5.2% | 1.6%(+3.58)#90 | 2.1%(+3.04)#1,523 |
| 91. | 12156 | 5.2% | 1.6%(+3.57)#91 | 2.1%(+3.03)#1,531 |
| 92. | 13811 | 5.2% | 1.6%(+3.57)#92 | 2.1%(+3.03)#1,532 |
| 93. | 12061 | 5.2% | 1.6%(+3.56)#93 | 2.1%(+3.02)#1,535 |
| 94. | 13664 | 5.1% | 1.6%(+3.54)#94 | 2.1%(+3.00)#1,563 |
| 95. | 12151 | 5.1% | 1.6%(+3.49)#95 | 2.1%(+2.96)#1,593 |
| 96. | 14571 | 5.1% | 1.6%(+3.48)#96 | 2.1%(+2.94)#1,602 |
| 97. | 13902 | 5.1% | 1.6%(+3.44)#97 | 2.1%(+2.90)#1,628 |
| 98. | 14625 | 5.0% | 1.6%(+3.37)#98 | 2.1%(+2.83)#1,673 |
| 99. | 14894 | 5.0% | 1.6%(+3.35)#99 | 2.1%(+2.81)#1,690 |
| 100. | 13490 | 4.9% | 1.6%(+3.29)#100 | 2.1%(+2.75)#1,734 |
Common Questions
What are the Top 10 Zip Codes with the Highest Percentage of Population Employed in Architecture & Engineering in New York?
Top 10 Zip Codes with the Highest Percentage of Population Employed in Architecture & Engineering in New York are:
What zip code has the Highest Percentage of Population Employed in Architecture & Engineering in New York?
10985 has the Highest Percentage of Population Employed in Architecture & Engineering in New York with 100.0%.
What is the Percentage of Population Employed in Architecture & Engineering in the State of New York?
Percentage of Population Employed in Architecture & Engineering in New York is 1.6%.
What is the Percentage of Population Employed in Architecture & Engineering in the United States?
Percentage of Population Employed in Architecture & Engineering in the United States is 2.1%.