Pultneyville, NY Map & Demographics
Pultneyville Map
Pultneyville Overview
$46,778
PER CAPITA INCOME
$113,906
AVG FAMILY INCOME
$102,083
AVG HOUSEHOLD INCOME
0.25
INEQUALITY / GINI INDEX
678
TOTAL POPULATION
309
MALE POPULATION
369
FEMALE POPULATION
83.74
MALES / 100 FEMALES
119.42
FEMALES / 100 MALES
43.8
MEDIAN AGE
2.6
AVG FAMILY SIZE
2.4
AVG HOUSEHOLD SIZE
359
LABOR FORCE [ PEOPLE ]
62.3%
PERCENT IN LABOR FORCE
2.8%
UNEMPLOYMENT RATE
Pultneyville Area Codes
Income in Pultneyville
Income Overview in Pultneyville
Per Capita Income in Pultneyville is $46,778, while median incomes of families and households are $113,906 and $102,083 respectively.
| Characteristic | Number | Measure |
| Per Capita Income | 678 | $46,778 |
| Median Family Income | 223 | $113,906 |
| Mean Family Income | 223 | $131,609 |
| Median Household Income | 254 | $102,083 |
| Mean Household Income | 254 | $119,883 |
| Income Deficit | 223 | $0 |
| Wage / Income Gap (%) | 678 | 0.00% |
| Wage / Income Gap ($) | 678 | 100.00¢ per $1 |
| Gini / Inequality Index | 678 | 0.25 |
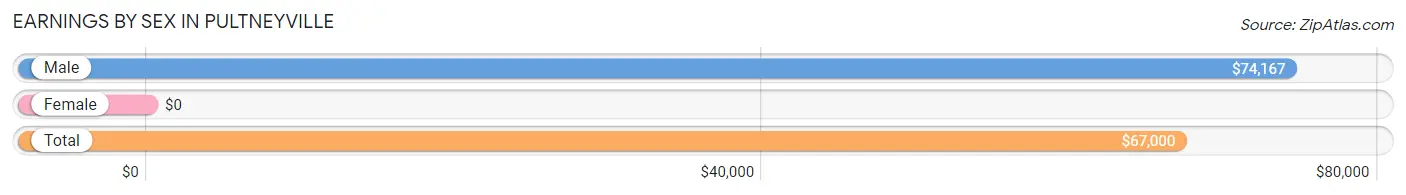
Earnings by Sex in Pultneyville
| Sex | Number | Average Earnings |
| Male | 208 (56.5%) | $74,167 |
| Female | 160 (43.5%) | $0 |
| Total | 368 (100.0%) | $67,000 |
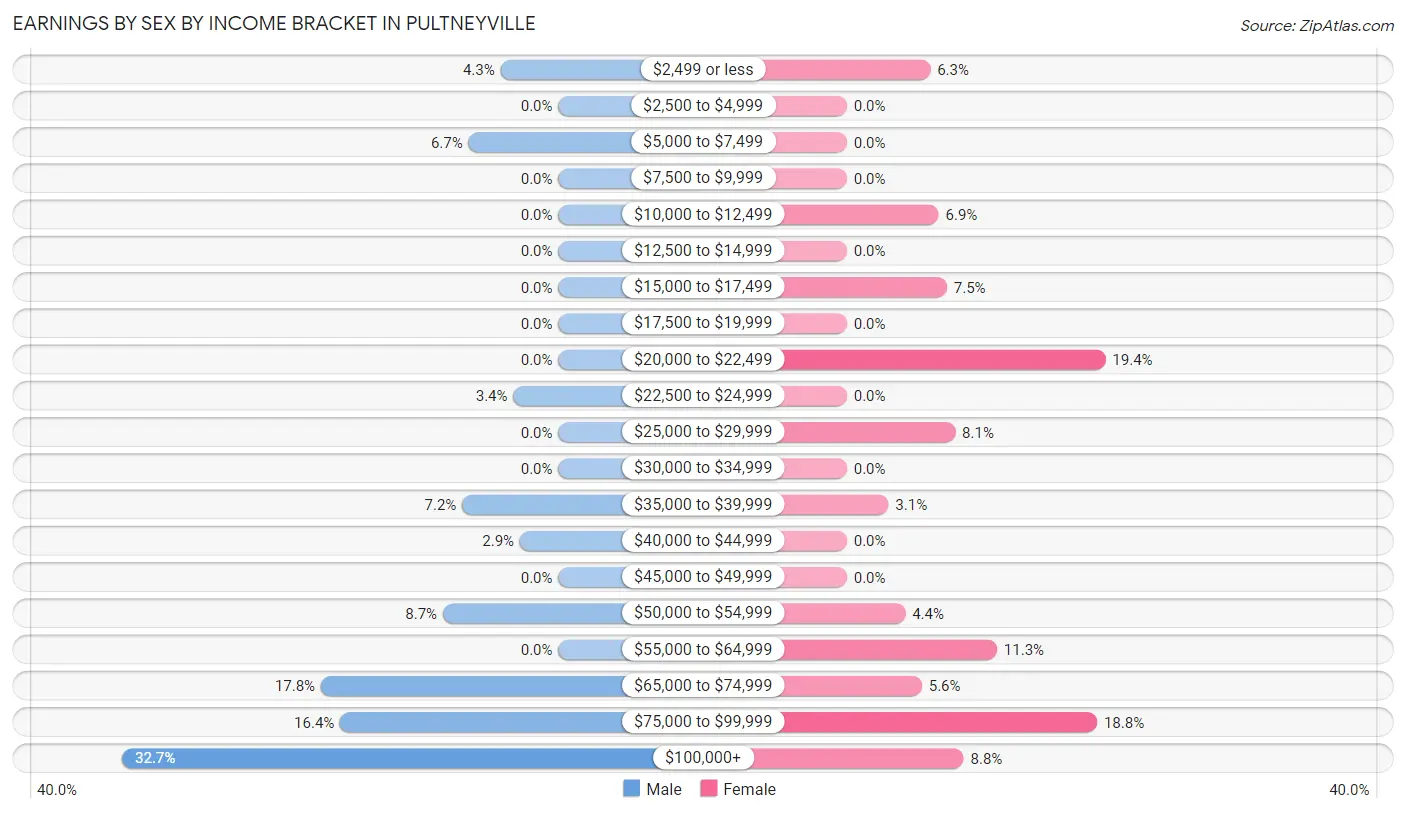
Earnings by Sex by Income Bracket in Pultneyville
The most common earnings brackets in Pultneyville are $100,000+ for men (68 | 32.7%) and $20,000 to $22,499 for women (31 | 19.4%).
| Income | Male | Female |
| $2,499 or less | 9 (4.3%) | 10 (6.2%) |
| $2,500 to $4,999 | 0 (0.0%) | 0 (0.0%) |
| $5,000 to $7,499 | 14 (6.7%) | 0 (0.0%) |
| $7,500 to $9,999 | 0 (0.0%) | 0 (0.0%) |
| $10,000 to $12,499 | 0 (0.0%) | 11 (6.9%) |
| $12,500 to $14,999 | 0 (0.0%) | 0 (0.0%) |
| $15,000 to $17,499 | 0 (0.0%) | 12 (7.5%) |
| $17,500 to $19,999 | 0 (0.0%) | 0 (0.0%) |
| $20,000 to $22,499 | 0 (0.0%) | 31 (19.4%) |
| $22,500 to $24,999 | 7 (3.4%) | 0 (0.0%) |
| $25,000 to $29,999 | 0 (0.0%) | 13 (8.1%) |
| $30,000 to $34,999 | 0 (0.0%) | 0 (0.0%) |
| $35,000 to $39,999 | 15 (7.2%) | 5 (3.1%) |
| $40,000 to $44,999 | 6 (2.9%) | 0 (0.0%) |
| $45,000 to $49,999 | 0 (0.0%) | 0 (0.0%) |
| $50,000 to $54,999 | 18 (8.6%) | 7 (4.4%) |
| $55,000 to $64,999 | 0 (0.0%) | 18 (11.3%) |
| $65,000 to $74,999 | 37 (17.8%) | 9 (5.6%) |
| $75,000 to $99,999 | 34 (16.4%) | 30 (18.8%) |
| $100,000+ | 68 (32.7%) | 14 (8.7%) |
| Total | 208 (100.0%) | 160 (100.0%) |
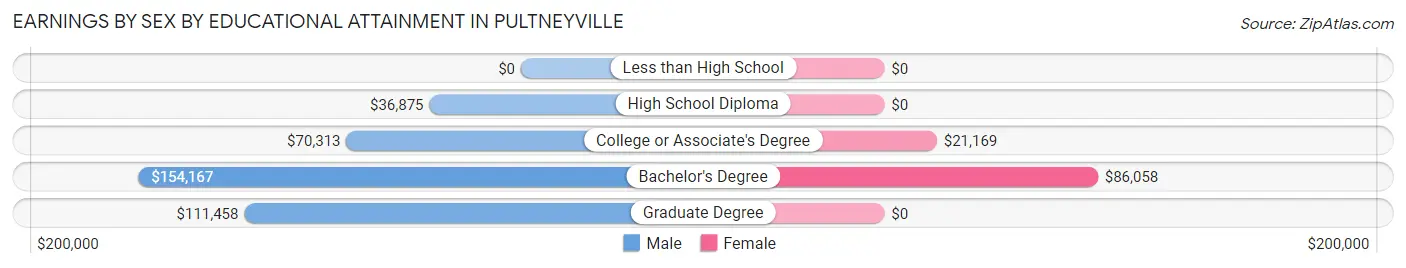
Earnings by Sex by Educational Attainment in Pultneyville
| Educational Attainment | Male Income | Female Income |
| Less than High School | - | - |
| High School Diploma | $36,875 | $0 |
| College or Associate's Degree | $70,313 | $21,169 |
| Bachelor's Degree | $154,167 | $86,058 |
| Graduate Degree | $111,458 | $0 |
| Total | $78,750 | $0 |
Family Income in Pultneyville
Family Income Brackets in Pultneyville
According to the Pultneyville family income data, there are 81 families falling into the $75,000 to $99,999 income range, which is the most common income bracket and makes up 36.3% of all families.
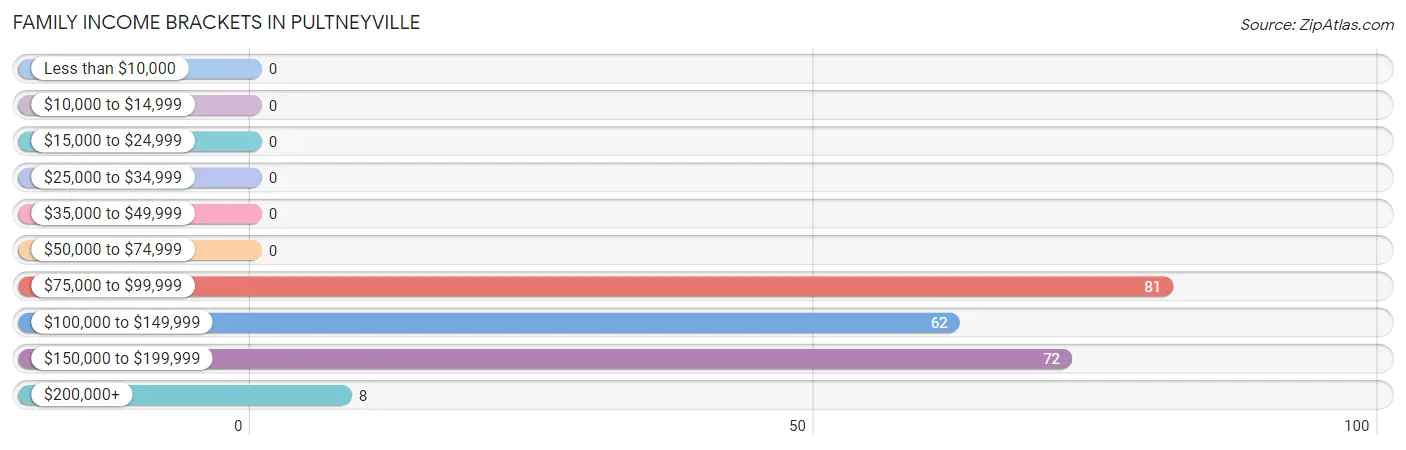
| Income Bracket | # Families | % Families |
| Less than $10,000 | 0 | 0.0% |
| $10,000 to $14,999 | 0 | 0.0% |
| $15,000 to $24,999 | 0 | 0.0% |
| $25,000 to $34,999 | 0 | 0.0% |
| $35,000 to $49,999 | 0 | 0.0% |
| $50,000 to $74,999 | 0 | 0.0% |
| $75,000 to $99,999 | 81 | 36.3% |
| $100,000 to $149,999 | 62 | 27.8% |
| $150,000 to $199,999 | 72 | 32.3% |
| $200,000+ | 8 | 3.6% |
Family Income by Famaliy Size in Pultneyville
2-person families (166 | 74.4%) account for the highest median family income in Pultneyville with $129,583 per family, while 2-person families (166 | 74.4%) have the highest median income of $64,792 per family member.
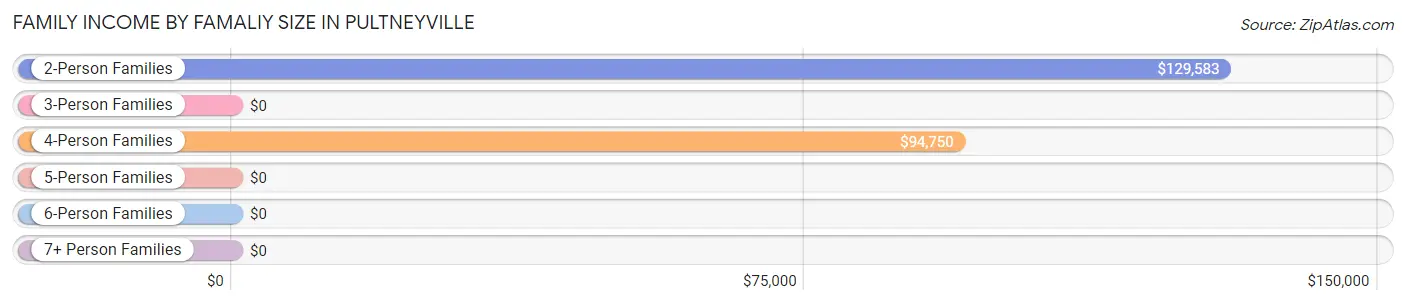
| Income Bracket | # Families | Median Income |
| 2-Person Families | 166 (74.4%) | $129,583 |
| 3-Person Families | 7 (3.1%) | $0 |
| 4-Person Families | 36 (16.1%) | $94,750 |
| 5-Person Families | 0 (0.0%) | $0 |
| 6-Person Families | 14 (6.3%) | $0 |
| 7+ Person Families | 0 (0.0%) | $0 |
| Total | 223 (100.0%) | $113,906 |
Family Income by Number of Earners in Pultneyville
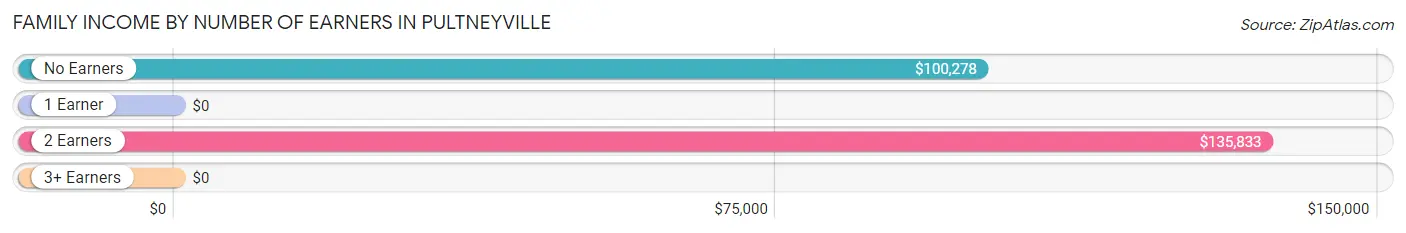
| Number of Earners | # Families | Median Income |
| No Earners | 48 (21.5%) | $100,278 |
| 1 Earner | 57 (25.6%) | $0 |
| 2 Earners | 102 (45.7%) | $135,833 |
| 3+ Earners | 16 (7.2%) | $0 |
| Total | 223 (100.0%) | $113,906 |
Household Income in Pultneyville
Household Income Brackets in Pultneyville
With 81 households falling in the category, the $75,000 to $99,999 income range is the most frequent in Pultneyville, accounting for 31.9% of all households.
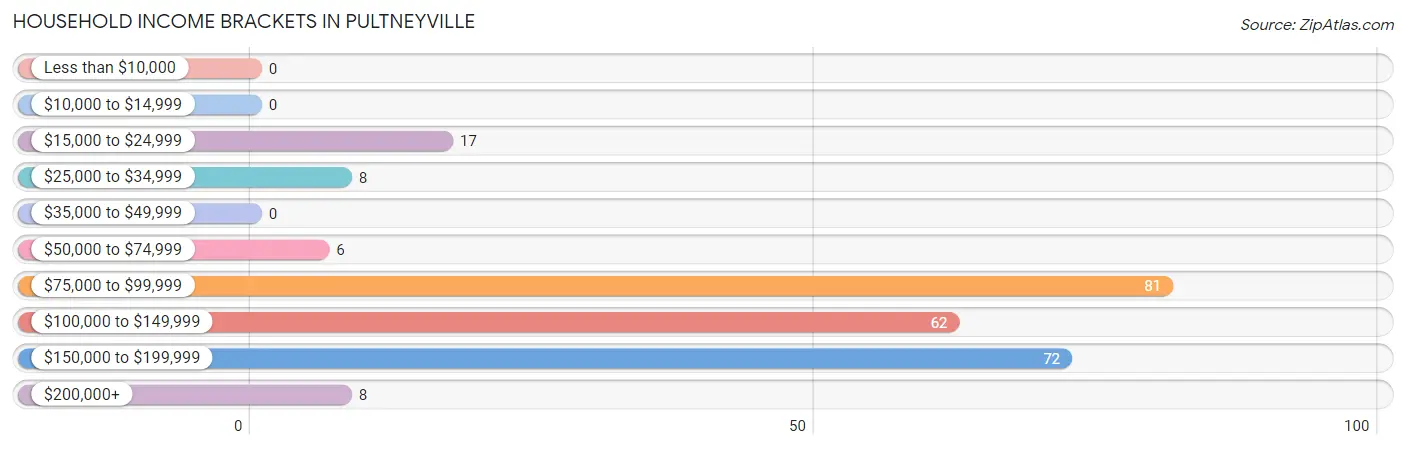
| Income Bracket | # Households | % Households |
| Less than $10,000 | 0 | 0.0% |
| $10,000 to $14,999 | 0 | 0.0% |
| $15,000 to $24,999 | 17 | 6.7% |
| $25,000 to $34,999 | 8 | 3.1% |
| $35,000 to $49,999 | 0 | 0.0% |
| $50,000 to $74,999 | 6 | 2.4% |
| $75,000 to $99,999 | 81 | 31.9% |
| $100,000 to $149,999 | 62 | 24.4% |
| $150,000 to $199,999 | 72 | 28.3% |
| $200,000+ | 8 | 3.1% |
Household Income by Householder Age in Pultneyville
The median household income in Pultneyville is $102,083, with the highest median household income of $136,806 found in the 45 to 64 years age bracket for the primary householder. A total of 119 households (46.9%) fall into this category.
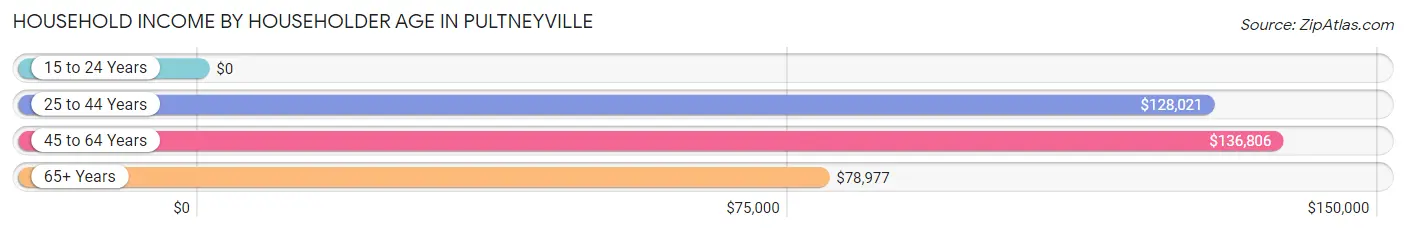
| Income Bracket | # Households | Median Income |
| 15 to 24 Years | 0 (0.0%) | $0 |
| 25 to 44 Years | 65 (25.6%) | $128,021 |
| 45 to 64 Years | 119 (46.9%) | $136,806 |
| 65+ Years | 70 (27.6%) | $78,977 |
| Total | 254 (100.0%) | $102,083 |
Poverty in Pultneyville
Income Below Poverty by Sex and Age in Pultneyville
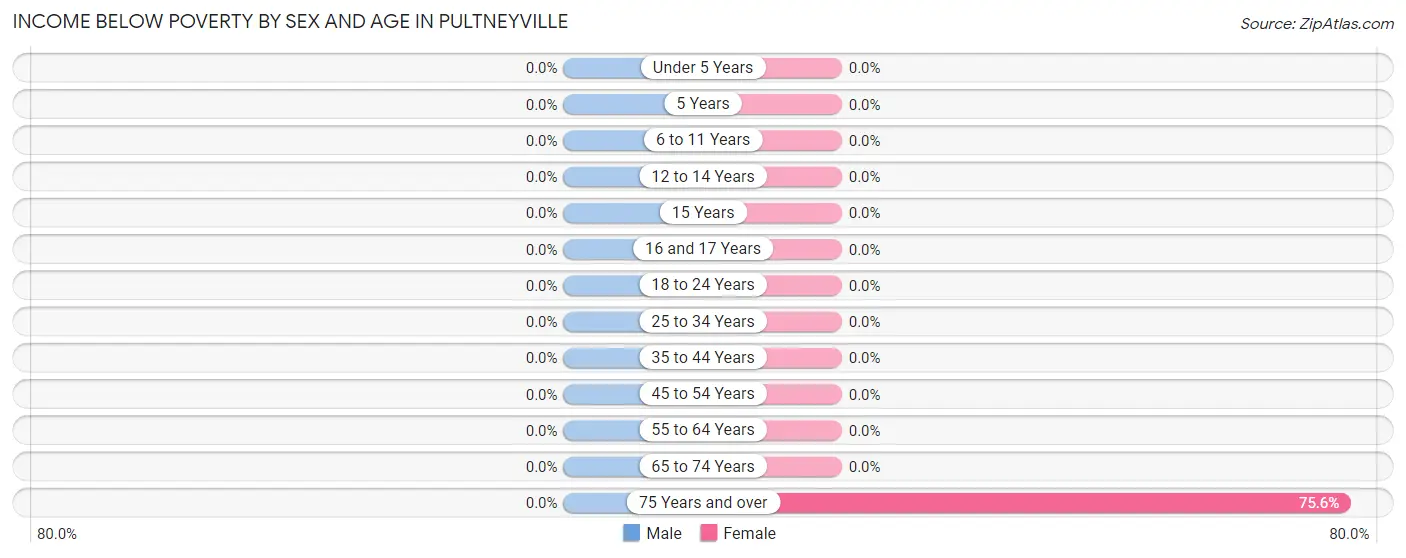
| Age Bracket | Male | Female |
| Under 5 Years | 0 (0.0%) | 0 (0.0%) |
| 5 Years | 0 (0.0%) | 0 (0.0%) |
| 6 to 11 Years | 0 (0.0%) | 0 (0.0%) |
| 12 to 14 Years | 0 (0.0%) | 0 (0.0%) |
| 15 Years | 0 (0.0%) | 0 (0.0%) |
| 16 and 17 Years | 0 (0.0%) | 0 (0.0%) |
| 18 to 24 Years | 0 (0.0%) | 0 (0.0%) |
| 25 to 34 Years | 0 (0.0%) | 0 (0.0%) |
| 35 to 44 Years | 0 (0.0%) | 0 (0.0%) |
| 45 to 54 Years | 0 (0.0%) | 0 (0.0%) |
| 55 to 64 Years | 0 (0.0%) | 0 (0.0%) |
| 65 to 74 Years | 0 (0.0%) | 0 (0.0%) |
| 75 Years and over | 0 (0.0%) | 31 (75.6%) |
| Total | 0 (0.0%) | 31 (8.4%) |
Income Above Poverty by Sex and Age in Pultneyville
According to the poverty statistics in Pultneyville, males aged under 5 years and females aged under 5 years are the age groups that are most secure financially, with 100.0% of males and 100.0% of females in these age groups living above the poverty line.
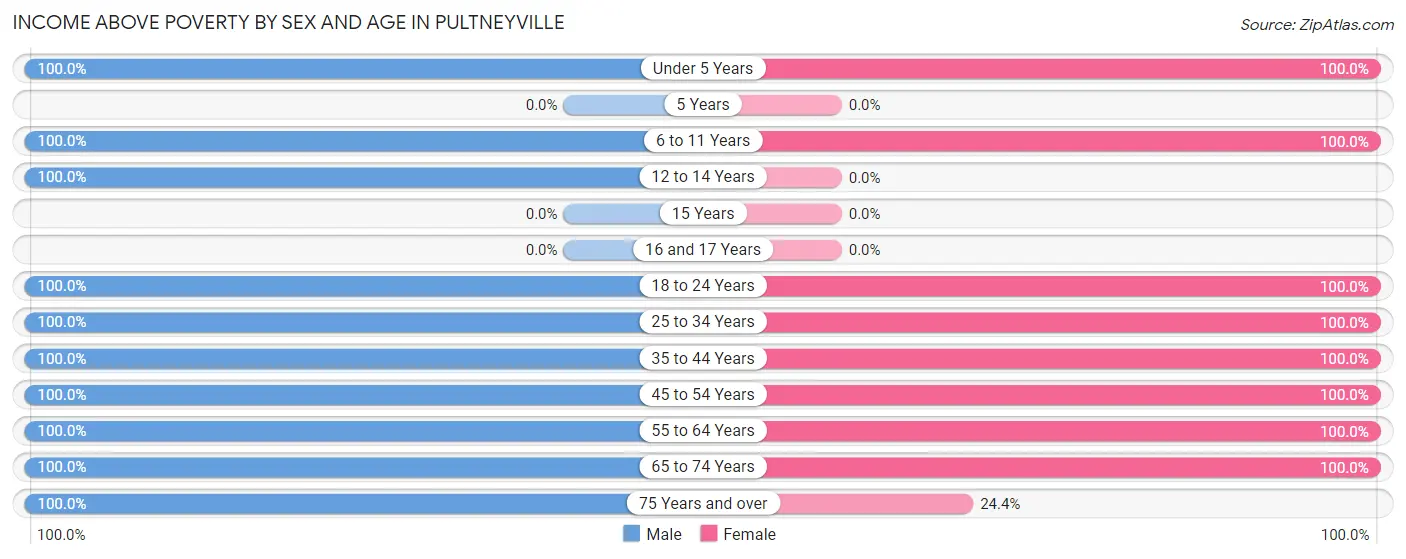
| Age Bracket | Male | Female |
| Under 5 Years | 10 (100.0%) | 51 (100.0%) |
| 5 Years | 0 (0.0%) | 0 (0.0%) |
| 6 to 11 Years | 22 (100.0%) | 8 (100.0%) |
| 12 to 14 Years | 11 (100.0%) | 0 (0.0%) |
| 15 Years | 0 (0.0%) | 0 (0.0%) |
| 16 and 17 Years | 0 (0.0%) | 0 (0.0%) |
| 18 to 24 Years | 22 (100.0%) | 20 (100.0%) |
| 25 to 34 Years | 50 (100.0%) | 51 (100.0%) |
| 35 to 44 Years | 23 (100.0%) | 76 (100.0%) |
| 45 to 54 Years | 59 (100.0%) | 39 (100.0%) |
| 55 to 64 Years | 72 (100.0%) | 35 (100.0%) |
| 65 to 74 Years | 24 (100.0%) | 48 (100.0%) |
| 75 Years and over | 16 (100.0%) | 10 (24.4%) |
| Total | 309 (100.0%) | 338 (91.6%) |
Income Below Poverty Among Married-Couple Families in Pultneyville
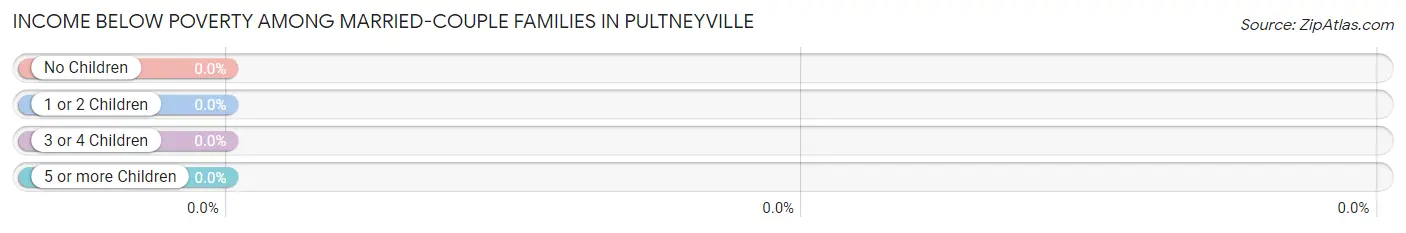
| Children | Above Poverty | Below Poverty |
| No Children | 173 (100.0%) | 0 (0.0%) |
| 1 or 2 Children | 27 (100.0%) | 0 (0.0%) |
| 3 or 4 Children | 0 (0.0%) | 0 (0.0%) |
| 5 or more Children | 0 (0.0%) | 0 (0.0%) |
| Total | 200 (100.0%) | 0 (0.0%) |
Income Below Poverty Among Single-Parent Households in Pultneyville
| Children | Single Father | Single Mother |
| No Children | 0 (0.0%) | 0 (0.0%) |
| 1 or 2 Children | 0 (0.0%) | 0 (0.0%) |
| 3 or 4 Children | 0 (0.0%) | 0 (0.0%) |
| 5 or more Children | 0 (0.0%) | 0 (0.0%) |
| Total | 0 (0.0%) | 0 (0.0%) |
Income Below Poverty Among Married-Couple vs Single-Parent Households in Pultneyville
| Children | Married-Couple Families | Single-Parent Households |
| No Children | 0 (0.0%) | 0 (0.0%) |
| 1 or 2 Children | 0 (0.0%) | 0 (0.0%) |
| 3 or 4 Children | 0 (0.0%) | 0 (0.0%) |
| 5 or more Children | 0 (0.0%) | 0 (0.0%) |
| Total | 0 (0.0%) | 0 (0.0%) |
Race in Pultneyville
The most populous races in Pultneyville are White / Caucasian (618 | 91.1%), and Two or more Races (60 | 8.8%).
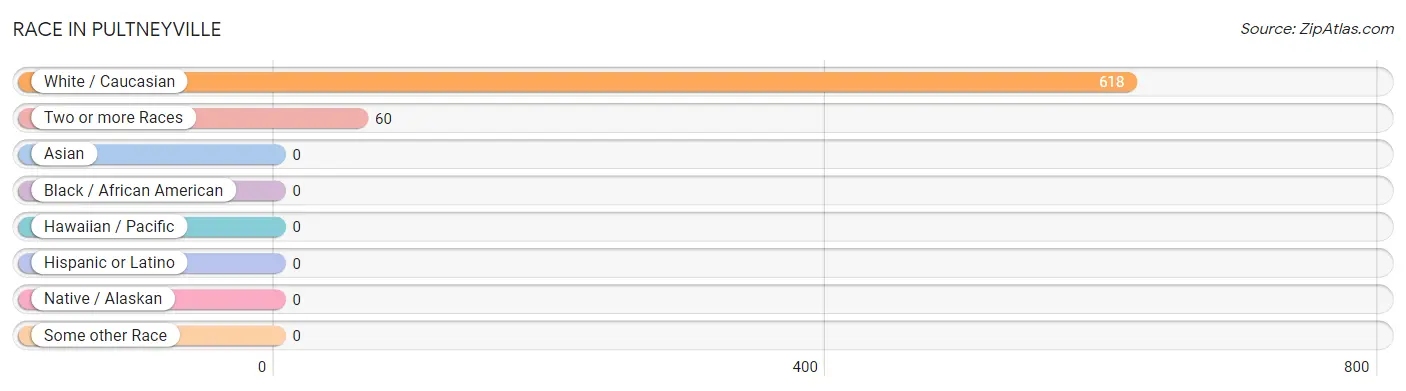
| Race | # Population | % Population |
| Asian | 0 | 0.0% |
| Black / African American | 0 | 0.0% |
| Hawaiian / Pacific | 0 | 0.0% |
| Hispanic or Latino | 0 | 0.0% |
| Native / Alaskan | 0 | 0.0% |
| White / Caucasian | 618 | 91.1% |
| Two or more Races | 60 | 8.8% |
| Some other Race | 0 | 0.0% |
| Total | 678 | 100.0% |
Ancestry in Pultneyville
The most populous ancestries reported in Pultneyville are English (162 | 23.9%), German (155 | 22.9%), Italian (116 | 17.1%), Irish (80 | 11.8%), and Dutch (79 | 11.7%), together accounting for 87.3% of all Pultneyville residents.
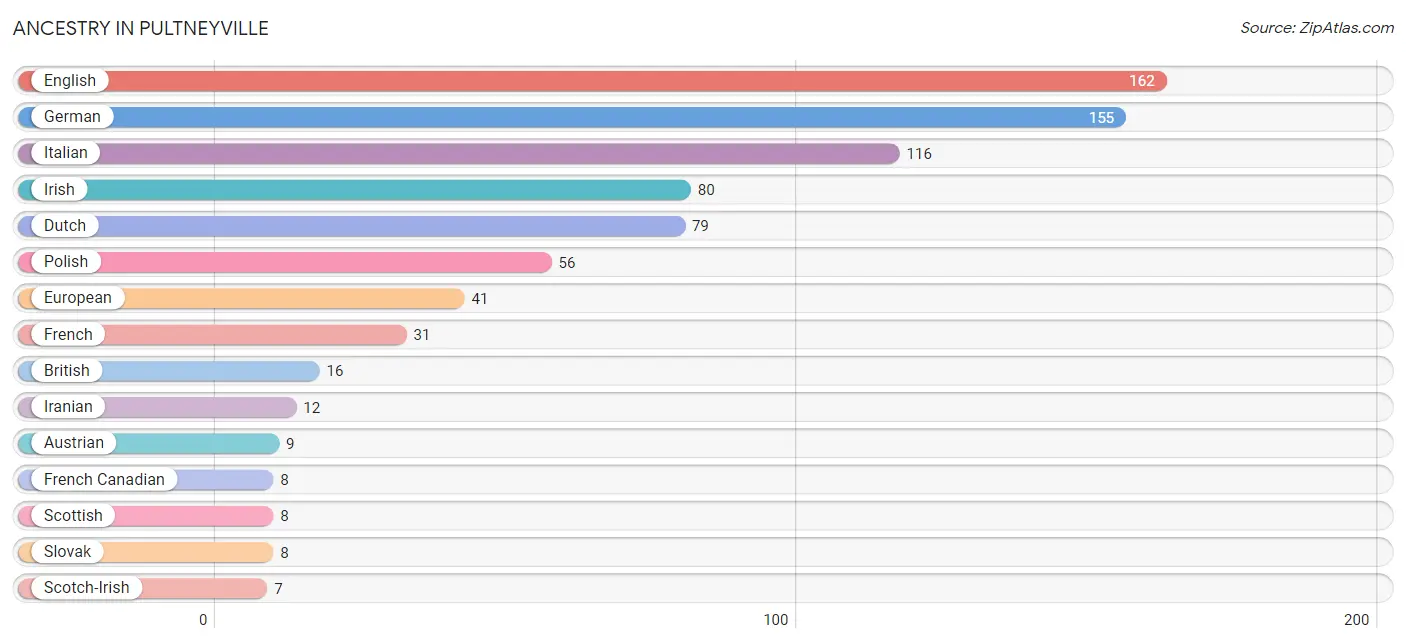
| Ancestry | # Population | % Population |
| Austrian | 9 | 1.3% |
| British | 16 | 2.4% |
| Dutch | 79 | 11.7% |
| English | 162 | 23.9% |
| European | 41 | 6.0% |
| French | 31 | 4.6% |
| French Canadian | 8 | 1.2% |
| German | 155 | 22.9% |
| Iranian | 12 | 1.8% |
| Irish | 80 | 11.8% |
| Italian | 116 | 17.1% |
| Polish | 56 | 8.3% |
| Scotch-Irish | 7 | 1.0% |
| Scottish | 8 | 1.2% |
| Slovak | 8 | 1.2% |
| Swedish | 6 | 0.9% | View All 16 Rows |
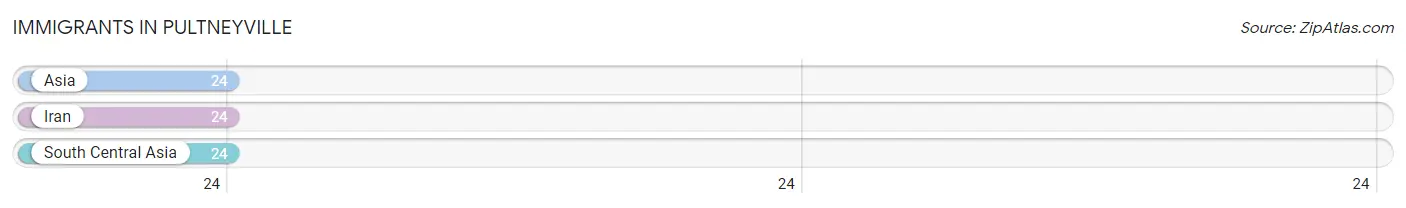
Immigrants in Pultneyville
The most numerous immigrant groups reported in Pultneyville came from Asia (24 | 3.5%), Iran (24 | 3.5%), and South Central Asia (24 | 3.5%), together accounting for 10.6% of all Pultneyville residents.
| Immigration Origin | # Population | % Population |
| Asia | 24 | 3.5% |
| Iran | 24 | 3.5% |
| South Central Asia | 24 | 3.5% | View All 3 Rows |
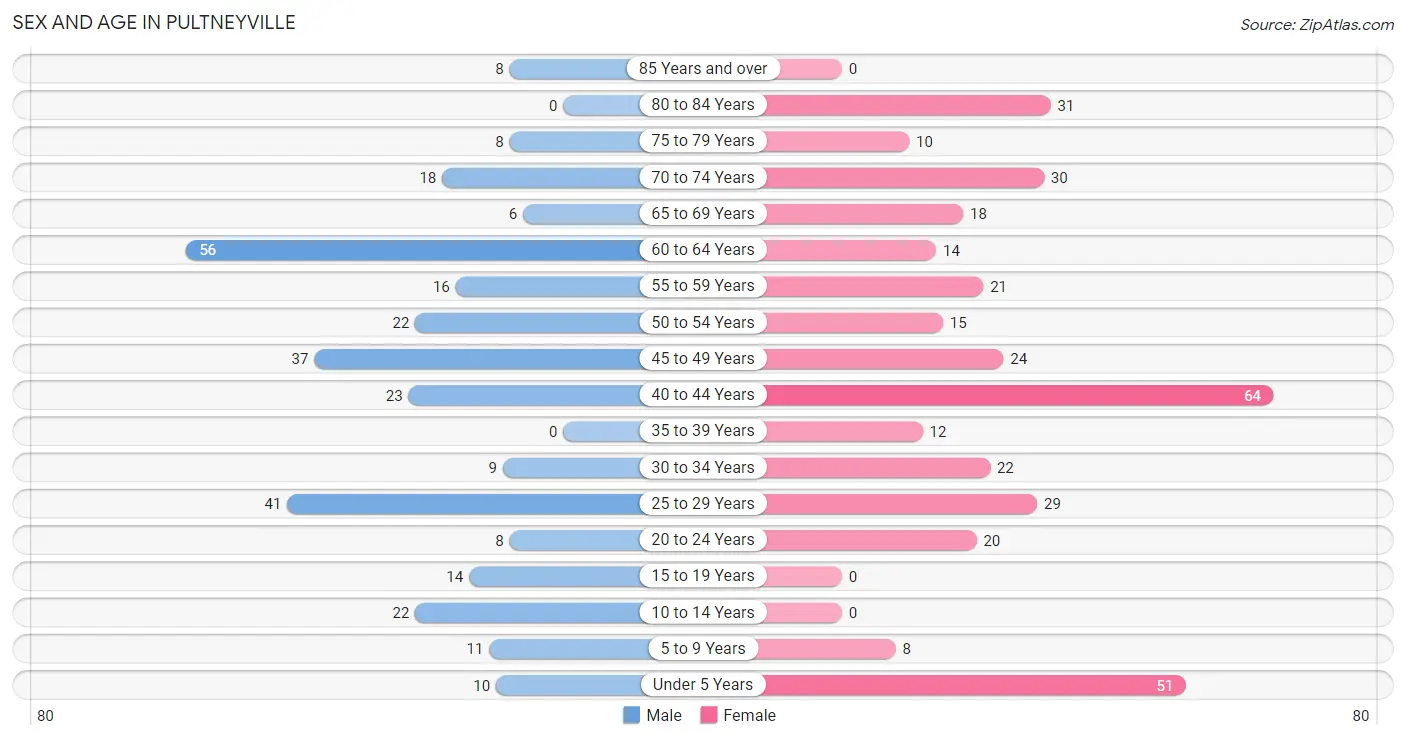
Sex and Age in Pultneyville
Sex and Age in Pultneyville
The most populous age groups in Pultneyville are 60 to 64 Years (56 | 18.1%) for men and 40 to 44 Years (64 | 17.3%) for women.
| Age Bracket | Male | Female |
| Under 5 Years | 10 (3.2%) | 51 (13.8%) |
| 5 to 9 Years | 11 (3.6%) | 8 (2.2%) |
| 10 to 14 Years | 22 (7.1%) | 0 (0.0%) |
| 15 to 19 Years | 14 (4.5%) | 0 (0.0%) |
| 20 to 24 Years | 8 (2.6%) | 20 (5.4%) |
| 25 to 29 Years | 41 (13.3%) | 29 (7.9%) |
| 30 to 34 Years | 9 (2.9%) | 22 (6.0%) |
| 35 to 39 Years | 0 (0.0%) | 12 (3.3%) |
| 40 to 44 Years | 23 (7.4%) | 64 (17.3%) |
| 45 to 49 Years | 37 (12.0%) | 24 (6.5%) |
| 50 to 54 Years | 22 (7.1%) | 15 (4.1%) |
| 55 to 59 Years | 16 (5.2%) | 21 (5.7%) |
| 60 to 64 Years | 56 (18.1%) | 14 (3.8%) |
| 65 to 69 Years | 6 (1.9%) | 18 (4.9%) |
| 70 to 74 Years | 18 (5.8%) | 30 (8.1%) |
| 75 to 79 Years | 8 (2.6%) | 10 (2.7%) |
| 80 to 84 Years | 0 (0.0%) | 31 (8.4%) |
| 85 Years and over | 8 (2.6%) | 0 (0.0%) |
| Total | 309 (100.0%) | 369 (100.0%) |
Families and Households in Pultneyville
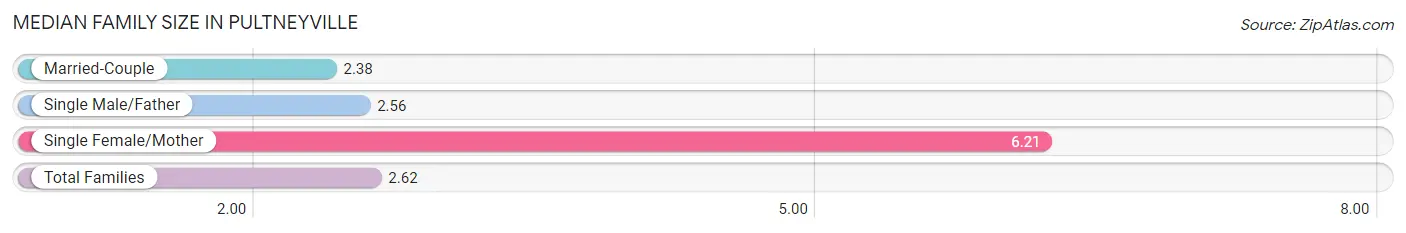
Median Family Size in Pultneyville
The median family size in Pultneyville is 2.62 persons per family, with single female/mother families (14 | 6.3%) accounting for the largest median family size of 6.21 persons per family. On the other hand, married-couple families (200 | 89.7%) represent the smallest median family size with 2.38 persons per family.
| Family Type | # Families | Family Size |
| Married-Couple | 200 (89.7%) | 2.38 |
| Single Male/Father | 9 (4.0%) | 2.56 |
| Single Female/Mother | 14 (6.3%) | 6.21 |
| Total Families | 223 (100.0%) | 2.62 |
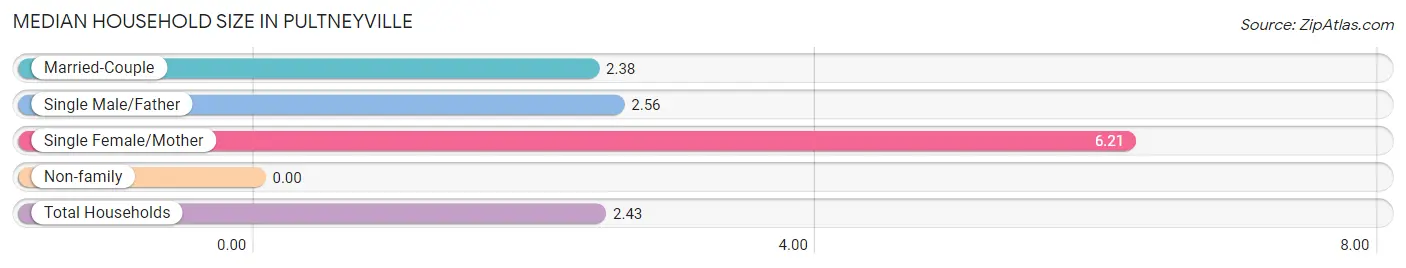
Median Household Size in Pultneyville
| Household Type | # Households | Household Size |
| Married-Couple | 200 (78.7%) | 2.38 |
| Single Male/Father | 9 (3.5%) | 2.56 |
| Single Female/Mother | 14 (5.5%) | 6.21 |
| Non-family | 31 (12.2%) | - |
| Total Households | 254 (100.0%) | 2.43 |
Household Size by Marriage Status in Pultneyville
Out of a total of 254 households in Pultneyville, 223 (87.8%) are family households, while 31 (12.2%) are nonfamily households. The most numerous type of family households are 2-person households, comprising 166, and the most common type of nonfamily households are 1-person households, comprising 31.
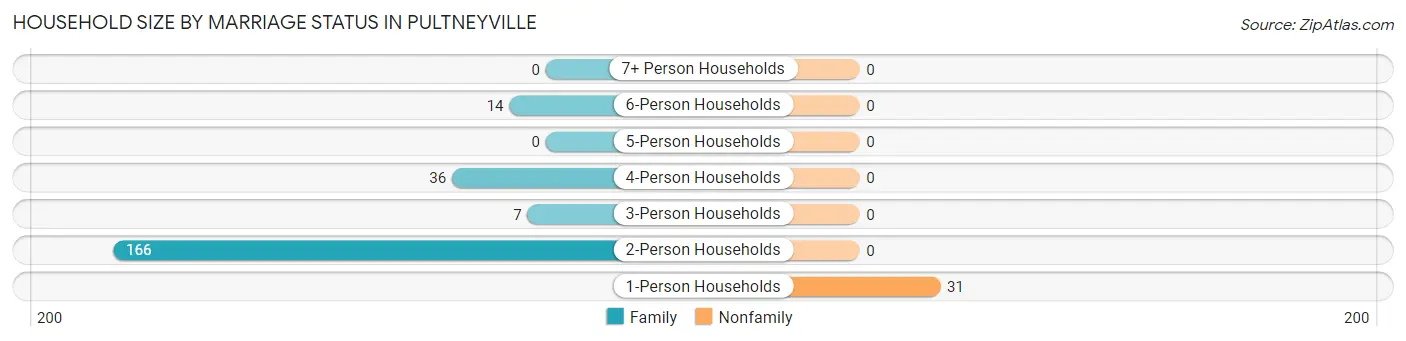
| Household Size | Family Households | Nonfamily Households |
| 1-Person Households | - | 31 (12.2%) |
| 2-Person Households | 166 (65.3%) | 0 (0.0%) |
| 3-Person Households | 7 (2.8%) | 0 (0.0%) |
| 4-Person Households | 36 (14.2%) | 0 (0.0%) |
| 5-Person Households | 0 (0.0%) | 0 (0.0%) |
| 6-Person Households | 14 (5.5%) | 0 (0.0%) |
| 7+ Person Households | 0 (0.0%) | 0 (0.0%) |
| Total | 223 (87.8%) | 31 (12.2%) |
Female Fertility in Pultneyville
Fertility by Age in Pultneyville
Average fertility rate in Pultneyville is 51.0 births per 1,000 women. Women in the age bracket of 20 to 34 years have the highest fertility rate with 127.0 births per 1,000 women. Women in the age bracket of 20 to 34 years acount for 100.0% of all women with births.
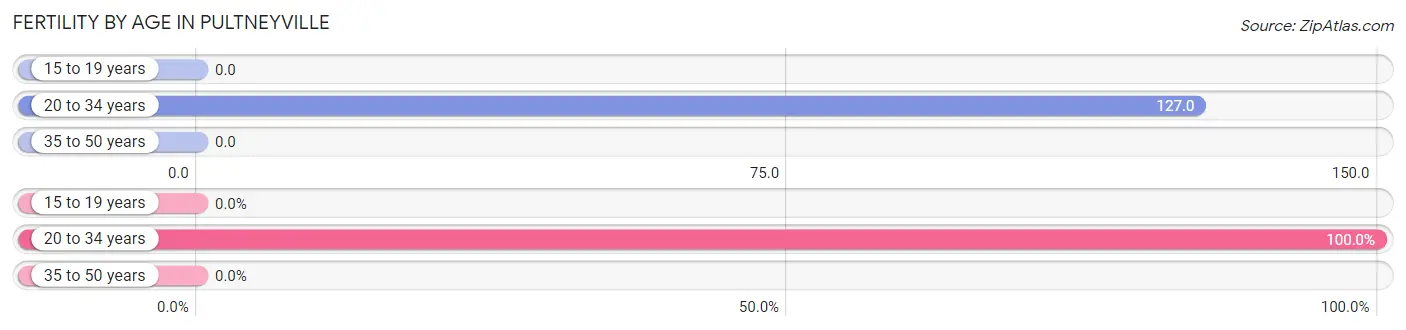
| Age Bracket | Women with Births | Births / 1,000 Women |
| 15 to 19 years | 0 (0.0%) | 0.0 |
| 20 to 34 years | 9 (100.0%) | 127.0 |
| 35 to 50 years | 0 (0.0%) | 0.0 |
| Total | 9 (100.0%) | 51.0 |
Fertility by Age by Marriage Status in Pultneyville
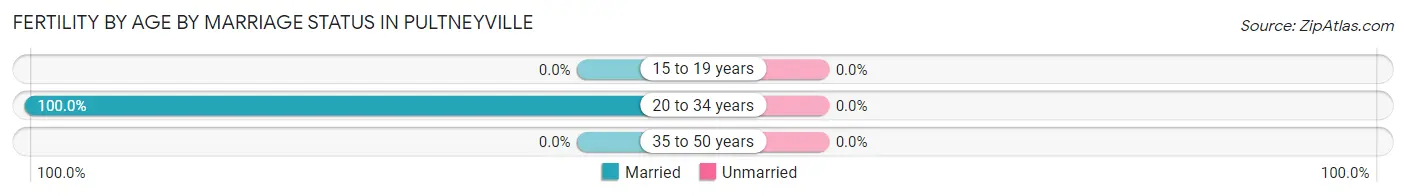
| Age Bracket | Married | Unmarried |
| 15 to 19 years | 0 (0.0%) | 0 (0.0%) |
| 20 to 34 years | 9 (100.0%) | 0 (0.0%) |
| 35 to 50 years | 0 (0.0%) | 0 (0.0%) |
| Total | 9 (100.0%) | 0 (0.0%) |
Fertility by Education in Pultneyville
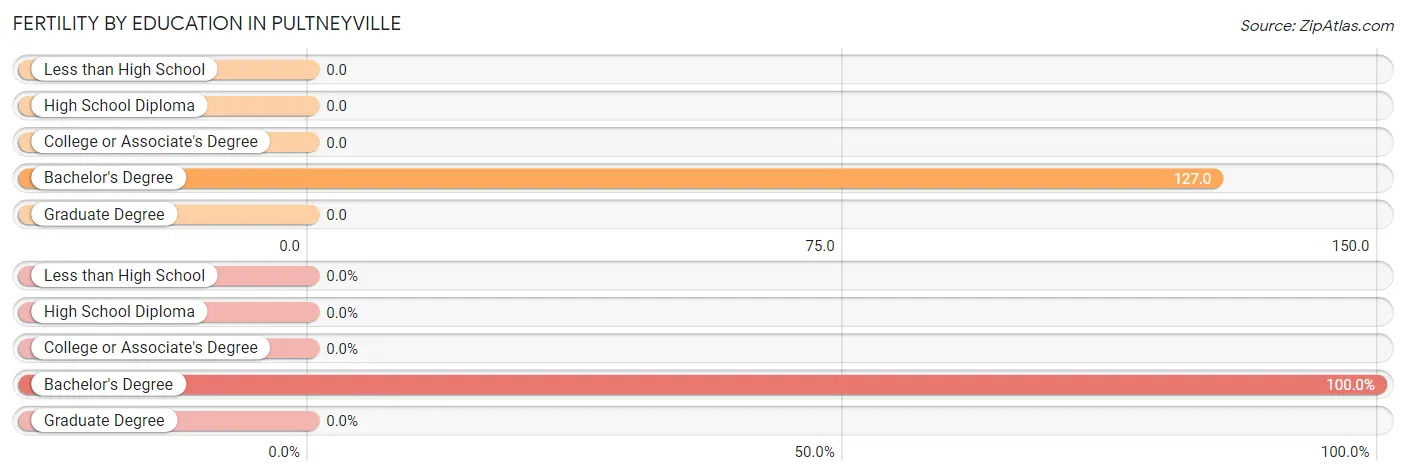
| Educational Attainment | Women with Births | Births / 1,000 Women |
| Less than High School | 0 (0.0%) | 0.0 |
| High School Diploma | 0 (0.0%) | 0.0 |
| College or Associate's Degree | 0 (0.0%) | 0.0 |
| Bachelor's Degree | 9 (100.0%) | 127.0 |
| Graduate Degree | 0 (0.0%) | 0.0 |
| Total | 9 (100.0%) | 51.0 |
Fertility by Education by Marriage Status in Pultneyville
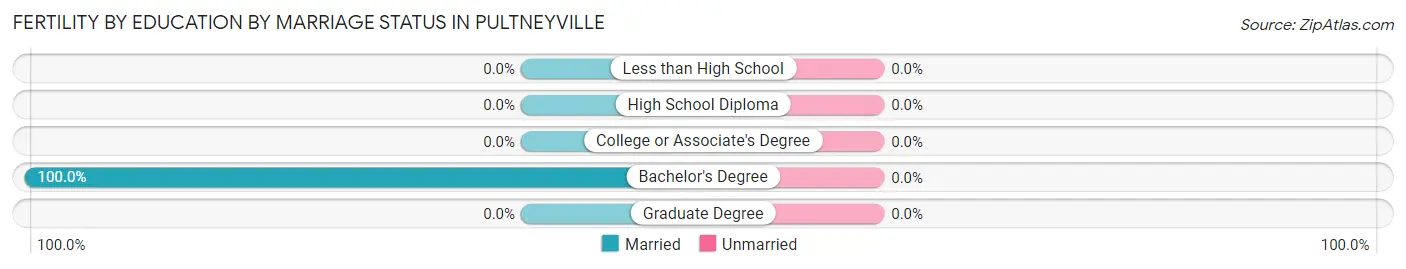
| Educational Attainment | Married | Unmarried |
| Less than High School | 0 (0.0%) | 0 (0.0%) |
| High School Diploma | 0 (0.0%) | 0 (0.0%) |
| College or Associate's Degree | 0 (0.0%) | 0 (0.0%) |
| Bachelor's Degree | 9 (100.0%) | 0 (0.0%) |
| Graduate Degree | 0 (0.0%) | 0 (0.0%) |
| Total | 9 (100.0%) | 0 (0.0%) |
Employment Characteristics in Pultneyville
Employment by Class of Employer in Pultneyville
Among the 349 employed individuals in Pultneyville, private company employees (241 | 69.1%), state government employees (44 | 12.6%), and not-for-profit organizations (42 | 12.0%) make up the most common classes of employment.
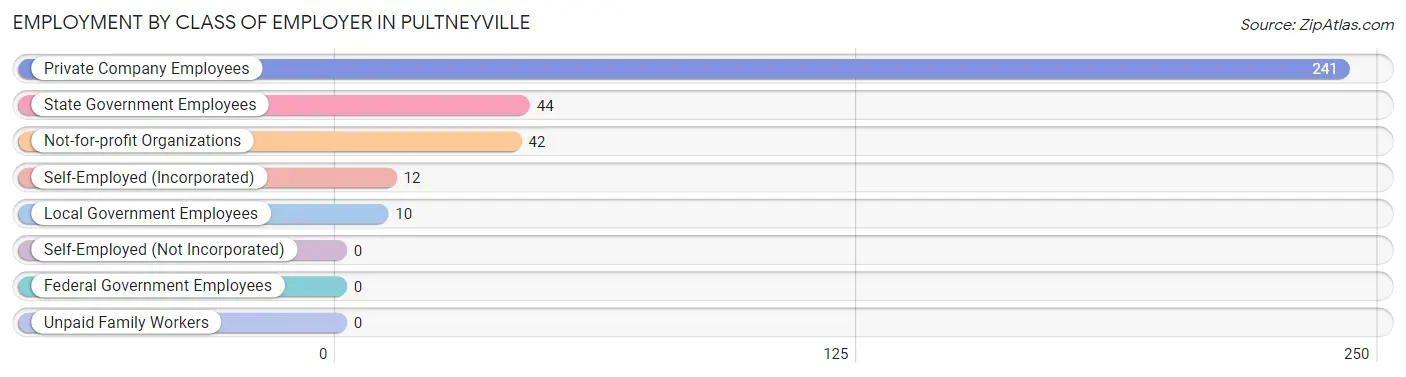
| Employer Class | # Employees | % Employees |
| Private Company Employees | 241 | 69.1% |
| Self-Employed (Incorporated) | 12 | 3.4% |
| Self-Employed (Not Incorporated) | 0 | 0.0% |
| Not-for-profit Organizations | 42 | 12.0% |
| Local Government Employees | 10 | 2.9% |
| State Government Employees | 44 | 12.6% |
| Federal Government Employees | 0 | 0.0% |
| Unpaid Family Workers | 0 | 0.0% |
| Total | 349 | 100.0% |
Employment Status by Age in Pultneyville
According to the labor force statistics for Pultneyville, out of the total population over 16 years of age (576), 62.3% or 359 individuals are in the labor force, with 2.8% or 10 of them unemployed. The age group with the highest labor force participation rate is 16 to 19 years, with 100.0% or 14 individuals in the labor force. Within the labor force, the 20 to 24 years age range has the highest percentage of unemployed individuals, with 35.7% or 10 of them being unemployed.
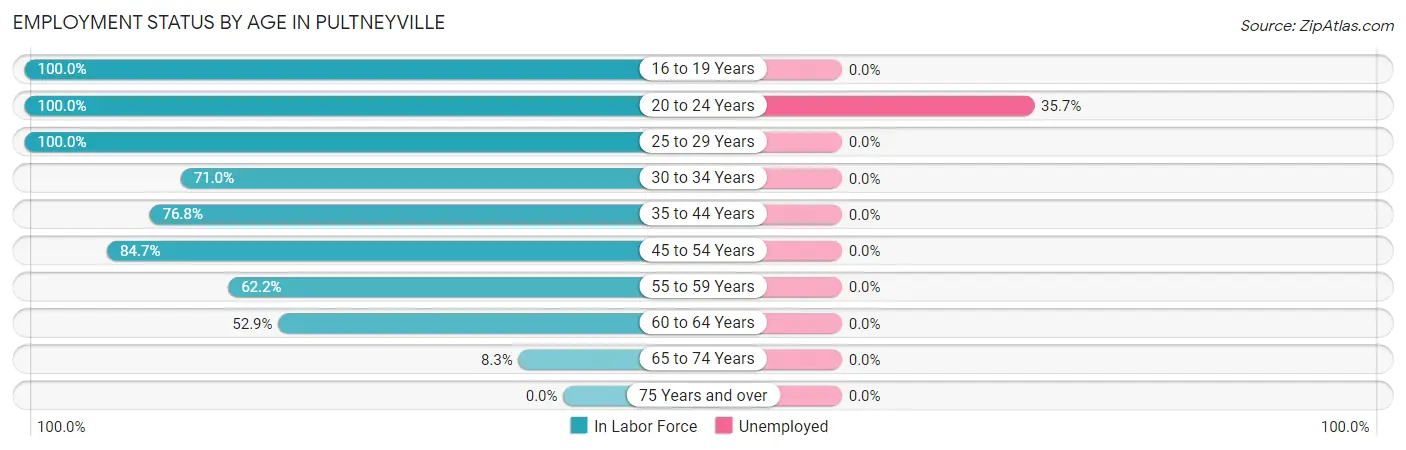
| Age Bracket | In Labor Force | Unemployed |
| 16 to 19 Years | 14 (100.0%) | 0 (0.0%) |
| 20 to 24 Years | 28 (100.0%) | 10 (35.7%) |
| 25 to 29 Years | 70 (100.0%) | 0 (0.0%) |
| 30 to 34 Years | 22 (71.0%) | 0 (0.0%) |
| 35 to 44 Years | 76 (76.8%) | 0 (0.0%) |
| 45 to 54 Years | 83 (84.7%) | 0 (0.0%) |
| 55 to 59 Years | 23 (62.2%) | 0 (0.0%) |
| 60 to 64 Years | 37 (52.9%) | 0 (0.0%) |
| 65 to 74 Years | 6 (8.3%) | 0 (0.0%) |
| 75 Years and over | 0 (0.0%) | 0 (0.0%) |
| Total | 359 (62.3%) | 10 (2.8%) |
Employment Status by Educational Attainment in Pultneyville
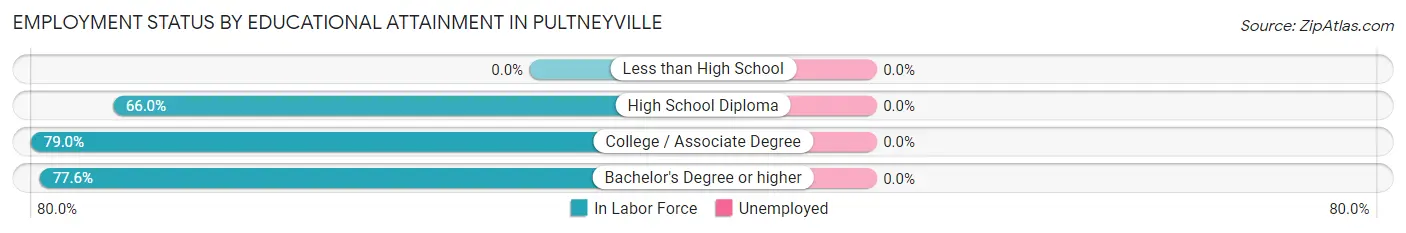
| Educational Attainment | In Labor Force | Unemployed |
| Less than High School | 0 (0.0%) | 0 (0.0%) |
| High School Diploma | 33 (66.0%) | 0 (0.0%) |
| College / Associate Degree | 143 (79.0%) | 0 (0.0%) |
| Bachelor's Degree or higher | 135 (77.6%) | 0 (0.0%) |
| Total | 311 (76.8%) | 0 (0.0%) |
Employment Occupations by Sex in Pultneyville
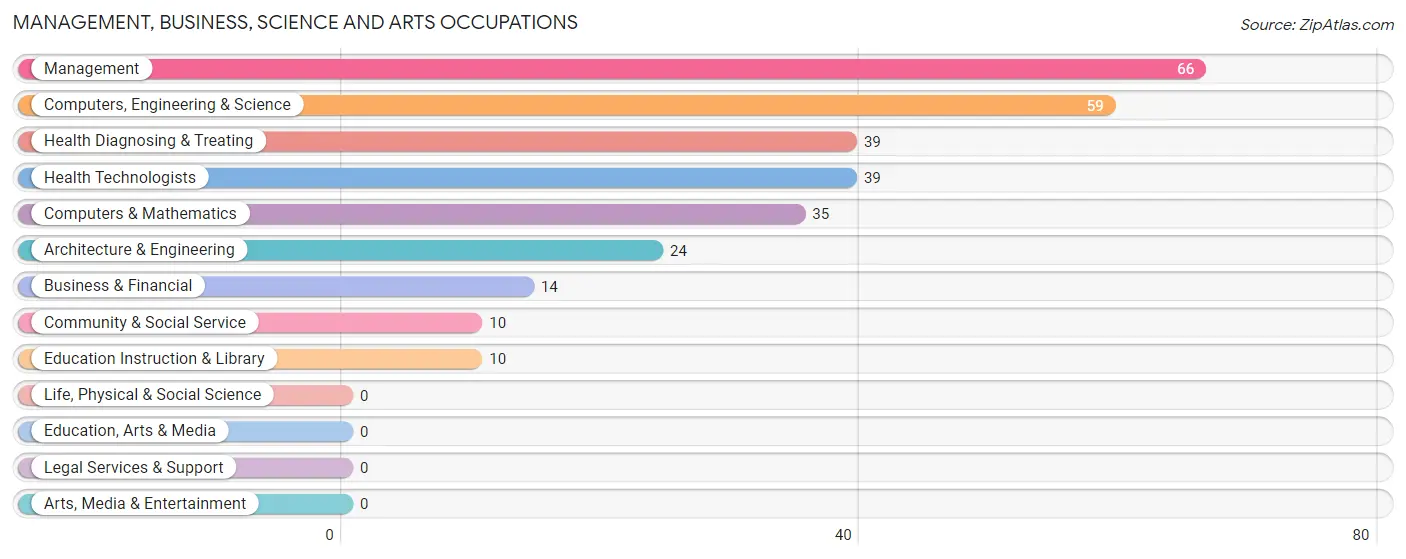
Management, Business, Science and Arts Occupations
The most common Management, Business, Science and Arts occupations in Pultneyville are Management (66 | 18.9%), Computers, Engineering & Science (59 | 16.9%), Health Diagnosing & Treating (39 | 11.2%), Health Technologists (39 | 11.2%), and Computers & Mathematics (35 | 10.0%).
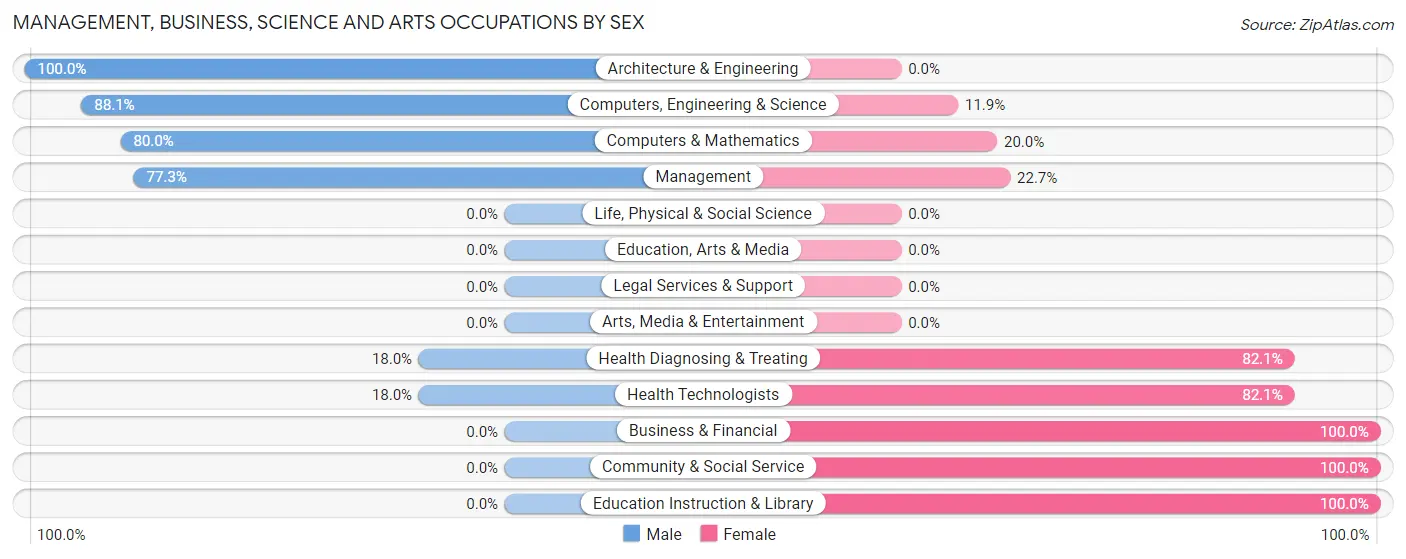
Management, Business, Science and Arts Occupations by Sex
Within the Management, Business, Science and Arts occupations in Pultneyville, the most male-oriented occupations are Architecture & Engineering (100.0%), Computers, Engineering & Science (88.1%), and Computers & Mathematics (80.0%), while the most female-oriented occupations are Business & Financial (100.0%), Community & Social Service (100.0%), and Education Instruction & Library (100.0%).
| Occupation | Male | Female |
| Management | 51 (77.3%) | 15 (22.7%) |
| Business & Financial | 0 (0.0%) | 14 (100.0%) |
| Computers, Engineering & Science | 52 (88.1%) | 7 (11.9%) |
| Computers & Mathematics | 28 (80.0%) | 7 (20.0%) |
| Architecture & Engineering | 24 (100.0%) | 0 (0.0%) |
| Life, Physical & Social Science | 0 (0.0%) | 0 (0.0%) |
| Community & Social Service | 0 (0.0%) | 10 (100.0%) |
| Education, Arts & Media | 0 (0.0%) | 0 (0.0%) |
| Legal Services & Support | 0 (0.0%) | 0 (0.0%) |
| Education Instruction & Library | 0 (0.0%) | 10 (100.0%) |
| Arts, Media & Entertainment | 0 (0.0%) | 0 (0.0%) |
| Health Diagnosing & Treating | 7 (17.9%) | 32 (82.1%) |
| Health Technologists | 7 (17.9%) | 32 (82.1%) |
| Total (Category) | 110 (58.5%) | 78 (41.5%) |
| Total (Overall) | 199 (57.0%) | 150 (43.0%) |
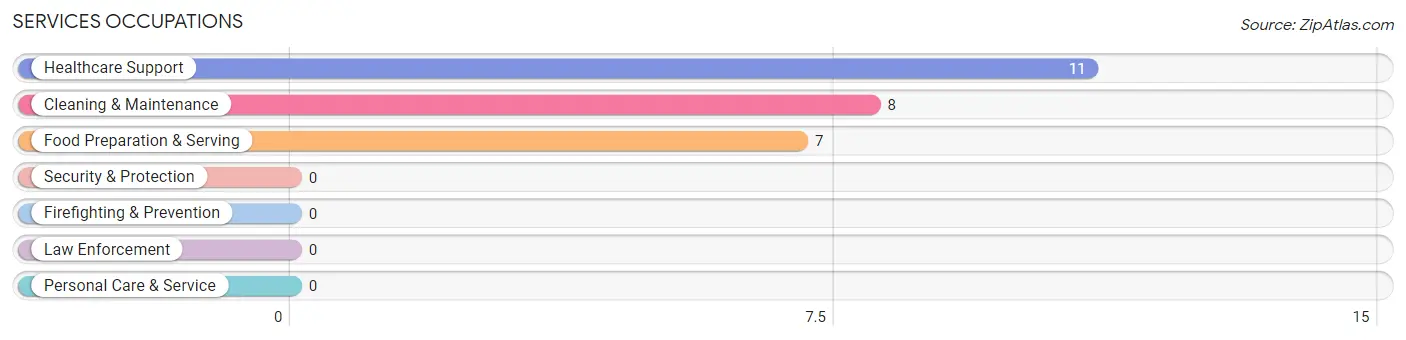
Services Occupations
The most common Services occupations in Pultneyville are Healthcare Support (11 | 3.2%), Cleaning & Maintenance (8 | 2.3%), and Food Preparation & Serving (7 | 2.0%).
Services Occupations by Sex
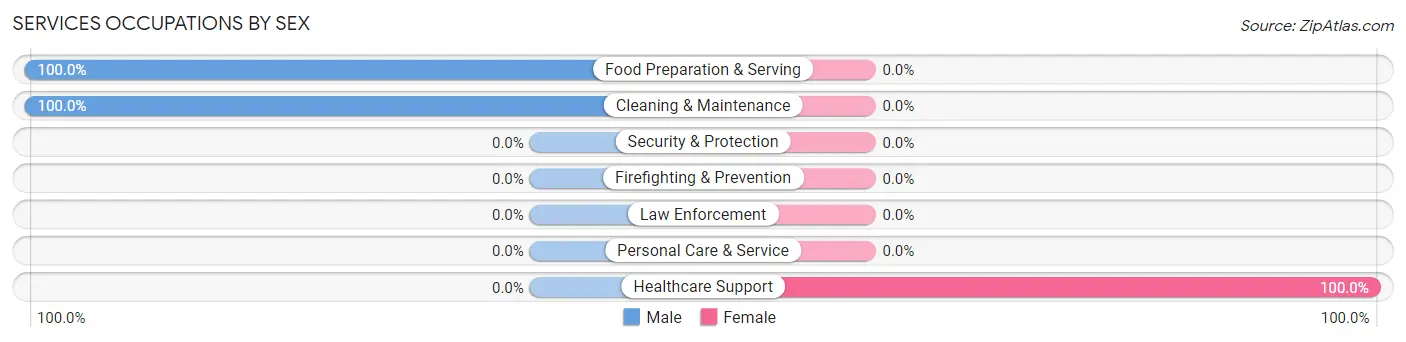
| Occupation | Male | Female |
| Healthcare Support | 0 (0.0%) | 11 (100.0%) |
| Security & Protection | 0 (0.0%) | 0 (0.0%) |
| Firefighting & Prevention | 0 (0.0%) | 0 (0.0%) |
| Law Enforcement | 0 (0.0%) | 0 (0.0%) |
| Food Preparation & Serving | 7 (100.0%) | 0 (0.0%) |
| Cleaning & Maintenance | 8 (100.0%) | 0 (0.0%) |
| Personal Care & Service | 0 (0.0%) | 0 (0.0%) |
| Total (Category) | 15 (57.7%) | 11 (42.3%) |
| Total (Overall) | 199 (57.0%) | 150 (43.0%) |
Sales and Office Occupations
The most common Sales and Office occupations in Pultneyville are Office & Administration (49 | 14.0%), and Sales & Related (26 | 7.4%).
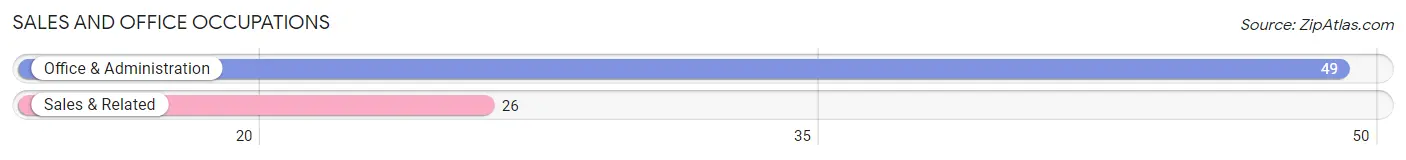
Sales and Office Occupations by Sex
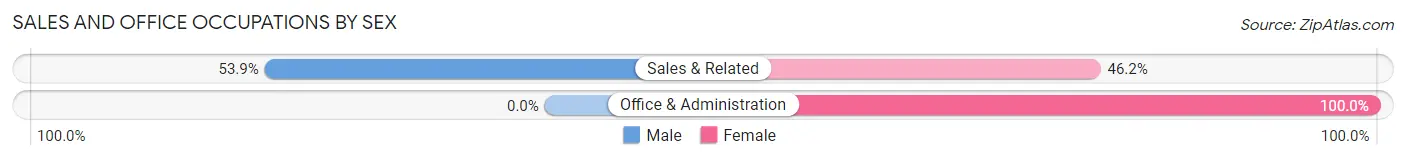
| Occupation | Male | Female |
| Sales & Related | 14 (53.8%) | 12 (46.2%) |
| Office & Administration | 0 (0.0%) | 49 (100.0%) |
| Total (Category) | 14 (18.7%) | 61 (81.3%) |
| Total (Overall) | 199 (57.0%) | 150 (43.0%) |
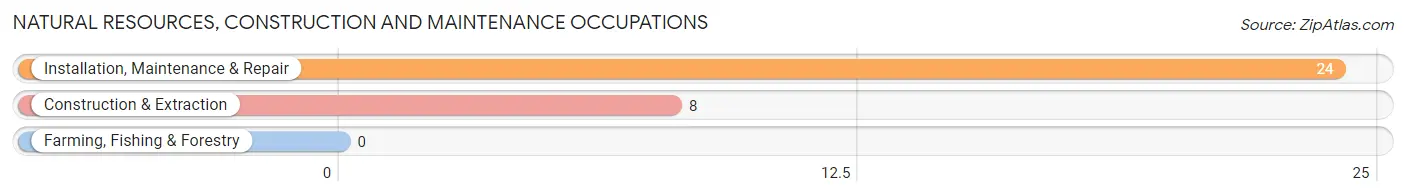
Natural Resources, Construction and Maintenance Occupations
The most common Natural Resources, Construction and Maintenance occupations in Pultneyville are Installation, Maintenance & Repair (24 | 6.9%), and Construction & Extraction (8 | 2.3%).
Natural Resources, Construction and Maintenance Occupations by Sex
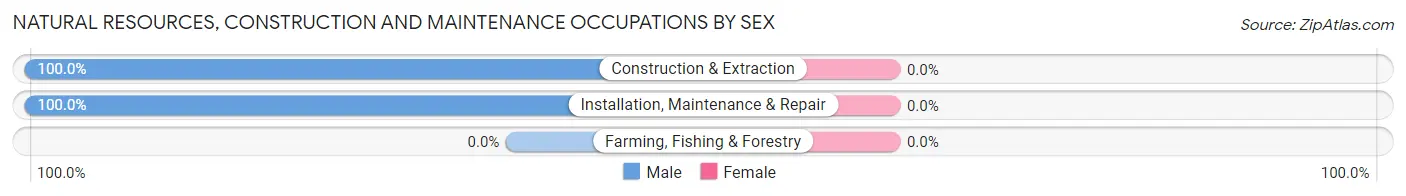
| Occupation | Male | Female |
| Farming, Fishing & Forestry | 0 (0.0%) | 0 (0.0%) |
| Construction & Extraction | 8 (100.0%) | 0 (0.0%) |
| Installation, Maintenance & Repair | 24 (100.0%) | 0 (0.0%) |
| Total (Category) | 32 (100.0%) | 0 (0.0%) |
| Total (Overall) | 199 (57.0%) | 150 (43.0%) |
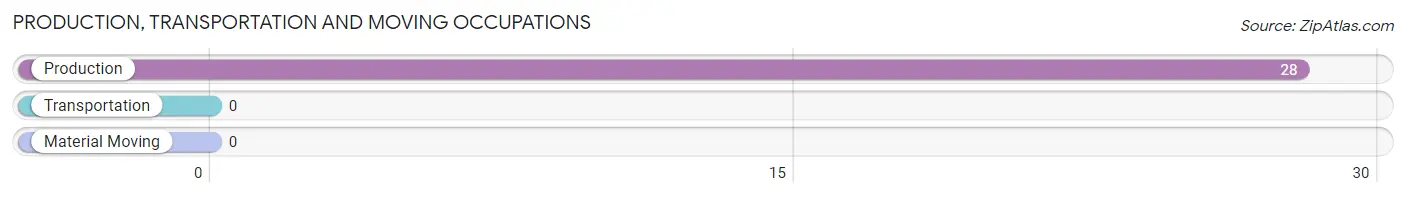
Production, Transportation and Moving Occupations
The most common Production, Transportation and Moving occupations in Pultneyville are , and Production (28 | 8.0%).
Production, Transportation and Moving Occupations by Sex
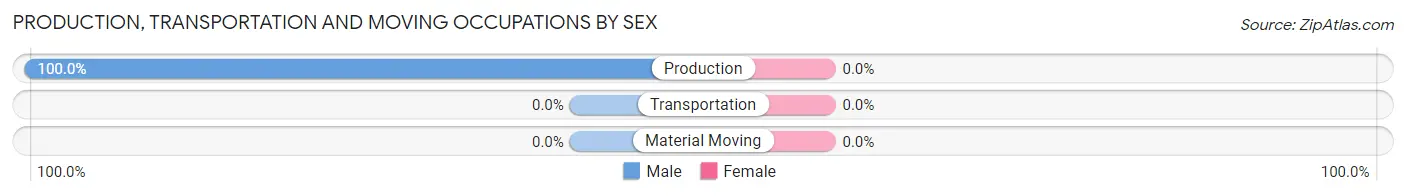
| Occupation | Male | Female |
| Production | 28 (100.0%) | 0 (0.0%) |
| Transportation | 0 (0.0%) | 0 (0.0%) |
| Material Moving | 0 (0.0%) | 0 (0.0%) |
| Total (Category) | 28 (100.0%) | 0 (0.0%) |
| Total (Overall) | 199 (57.0%) | 150 (43.0%) |
Employment Industries by Sex in Pultneyville
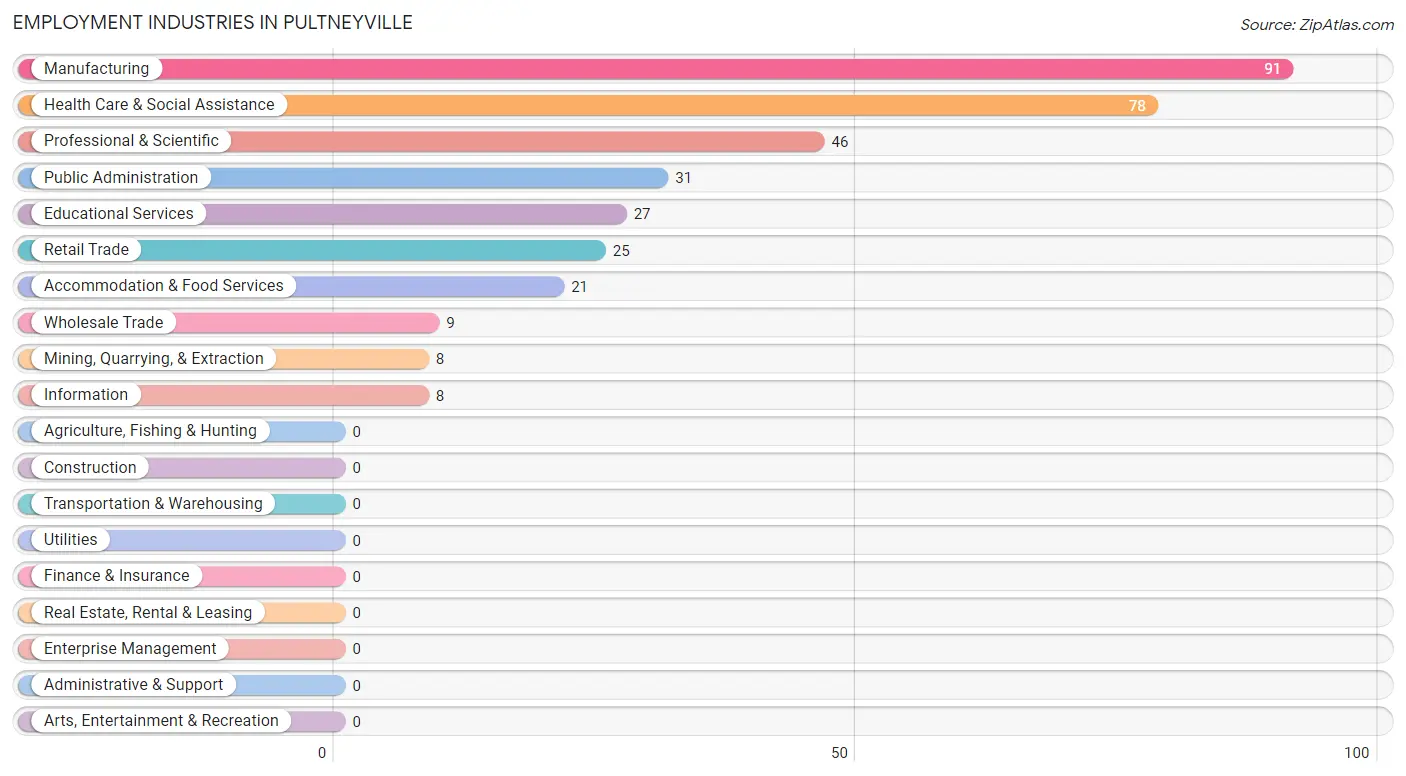
Employment Industries in Pultneyville
The major employment industries in Pultneyville include Manufacturing (91 | 26.1%), Health Care & Social Assistance (78 | 22.4%), Professional & Scientific (46 | 13.2%), Public Administration (31 | 8.9%), and Educational Services (27 | 7.7%).
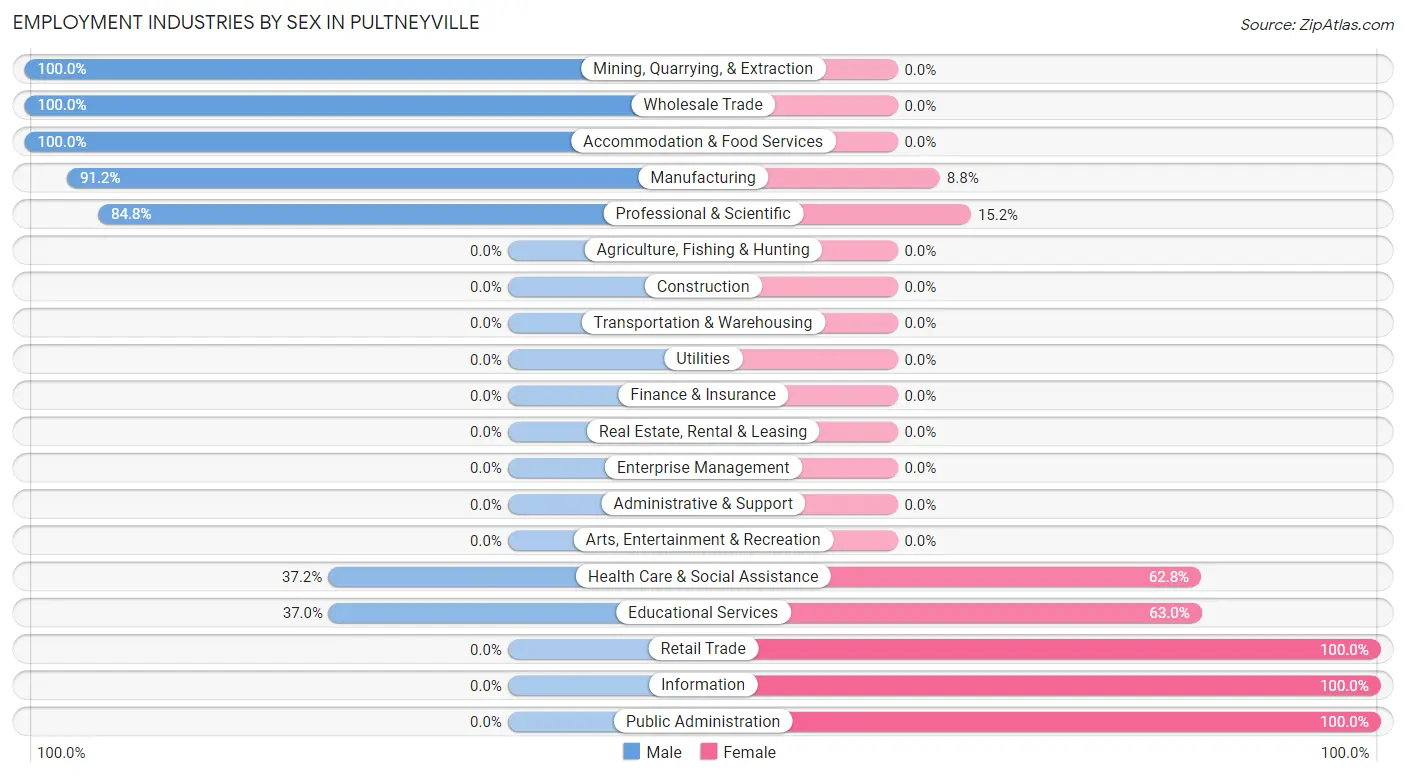
Employment Industries by Sex in Pultneyville
The Pultneyville industries that see more men than women are Mining, Quarrying, & Extraction (100.0%), Wholesale Trade (100.0%), and Accommodation & Food Services (100.0%), whereas the industries that tend to have a higher number of women are Retail Trade (100.0%), Information (100.0%), and Public Administration (100.0%).
| Industry | Male | Female |
| Agriculture, Fishing & Hunting | 0 (0.0%) | 0 (0.0%) |
| Mining, Quarrying, & Extraction | 8 (100.0%) | 0 (0.0%) |
| Construction | 0 (0.0%) | 0 (0.0%) |
| Manufacturing | 83 (91.2%) | 8 (8.8%) |
| Wholesale Trade | 9 (100.0%) | 0 (0.0%) |
| Retail Trade | 0 (0.0%) | 25 (100.0%) |
| Transportation & Warehousing | 0 (0.0%) | 0 (0.0%) |
| Utilities | 0 (0.0%) | 0 (0.0%) |
| Information | 0 (0.0%) | 8 (100.0%) |
| Finance & Insurance | 0 (0.0%) | 0 (0.0%) |
| Real Estate, Rental & Leasing | 0 (0.0%) | 0 (0.0%) |
| Professional & Scientific | 39 (84.8%) | 7 (15.2%) |
| Enterprise Management | 0 (0.0%) | 0 (0.0%) |
| Administrative & Support | 0 (0.0%) | 0 (0.0%) |
| Educational Services | 10 (37.0%) | 17 (63.0%) |
| Health Care & Social Assistance | 29 (37.2%) | 49 (62.8%) |
| Arts, Entertainment & Recreation | 0 (0.0%) | 0 (0.0%) |
| Accommodation & Food Services | 21 (100.0%) | 0 (0.0%) |
| Public Administration | 0 (0.0%) | 31 (100.0%) |
| Total | 199 (57.0%) | 150 (43.0%) |
Education in Pultneyville
School Enrollment in Pultneyville
The most common levels of schooling among the 101 students in Pultneyville are nursery / preschool (34 | 33.7%), elementary school (30 | 29.7%), and college / undergraduate (14 | 13.9%).
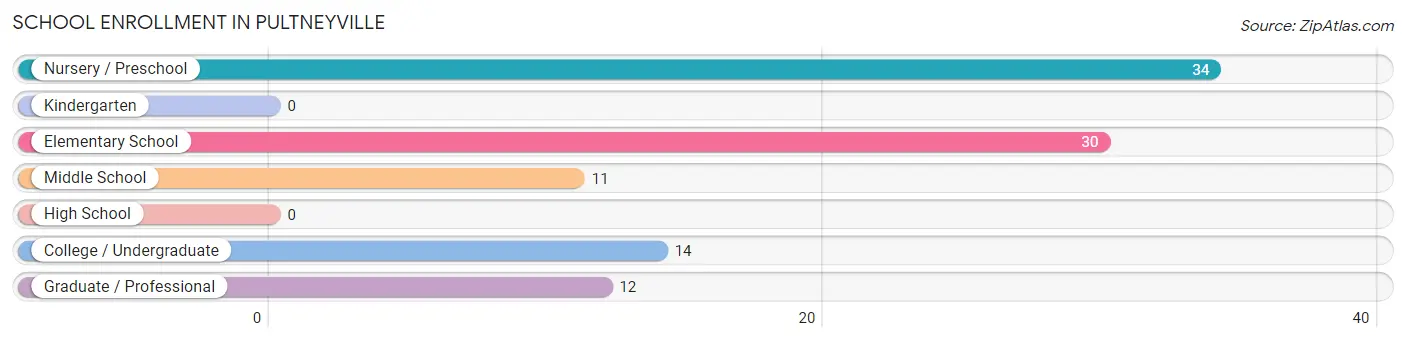
| School Level | # Students | % Students |
| Nursery / Preschool | 34 | 33.7% |
| Kindergarten | 0 | 0.0% |
| Elementary School | 30 | 29.7% |
| Middle School | 11 | 10.9% |
| High School | 0 | 0.0% |
| College / Undergraduate | 14 | 13.9% |
| Graduate / Professional | 12 | 11.9% |
| Total | 101 | 100.0% |
School Enrollment by Age by Funding Source in Pultneyville
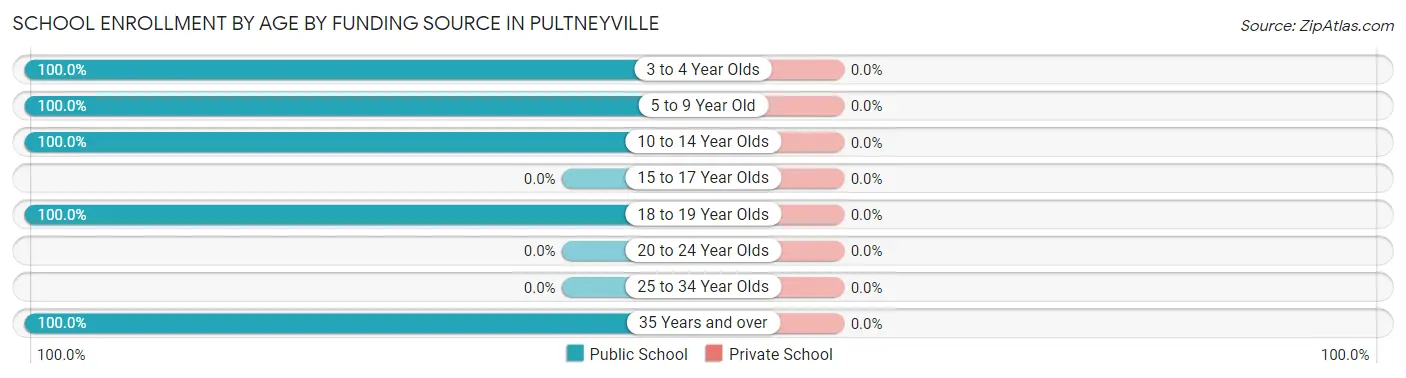
| Age Bracket | Public School | Private School |
| 3 to 4 Year Olds | 34 (100.0%) | 0 (0.0%) |
| 5 to 9 Year Old | 19 (100.0%) | 0 (0.0%) |
| 10 to 14 Year Olds | 22 (100.0%) | 0 (0.0%) |
| 15 to 17 Year Olds | 0 (0.0%) | 0 (0.0%) |
| 18 to 19 Year Olds | 14 (100.0%) | 0 (0.0%) |
| 20 to 24 Year Olds | 0 (0.0%) | 0 (0.0%) |
| 25 to 34 Year Olds | 0 (0.0%) | 0 (0.0%) |
| 35 Years and over | 12 (100.0%) | 0 (0.0%) |
| Total | 101 (100.0%) | 0 (0.0%) |
Educational Attainment by Field of Study in Pultneyville
Social sciences (57 | 22.5%), science & technology (46 | 18.2%), engineering (32 | 12.7%), education (32 | 12.7%), and communications (27 | 10.7%) are the most common fields of study among 253 individuals in Pultneyville who have obtained a bachelor's degree or higher.
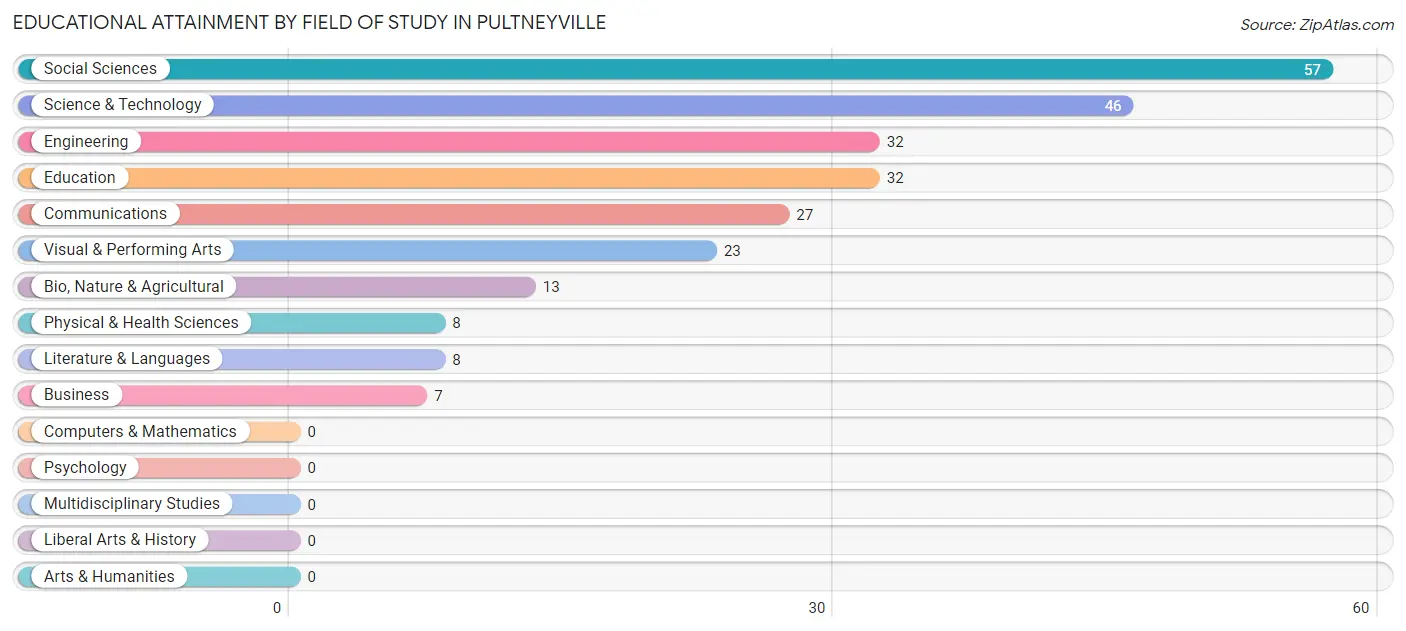
| Field of Study | # Graduates | % Graduates |
| Computers & Mathematics | 0 | 0.0% |
| Bio, Nature & Agricultural | 13 | 5.1% |
| Physical & Health Sciences | 8 | 3.2% |
| Psychology | 0 | 0.0% |
| Social Sciences | 57 | 22.5% |
| Engineering | 32 | 12.7% |
| Multidisciplinary Studies | 0 | 0.0% |
| Science & Technology | 46 | 18.2% |
| Business | 7 | 2.8% |
| Education | 32 | 12.7% |
| Literature & Languages | 8 | 3.2% |
| Liberal Arts & History | 0 | 0.0% |
| Visual & Performing Arts | 23 | 9.1% |
| Communications | 27 | 10.7% |
| Arts & Humanities | 0 | 0.0% |
| Total | 253 | 100.0% |
Transportation & Commute in Pultneyville
Vehicle Availability by Sex in Pultneyville
The most prevalent vehicle ownership categories in Pultneyville are males with 2 vehicles (108, accounting for 54.3%) and females with 2 vehicles (49, making up 90.8%).
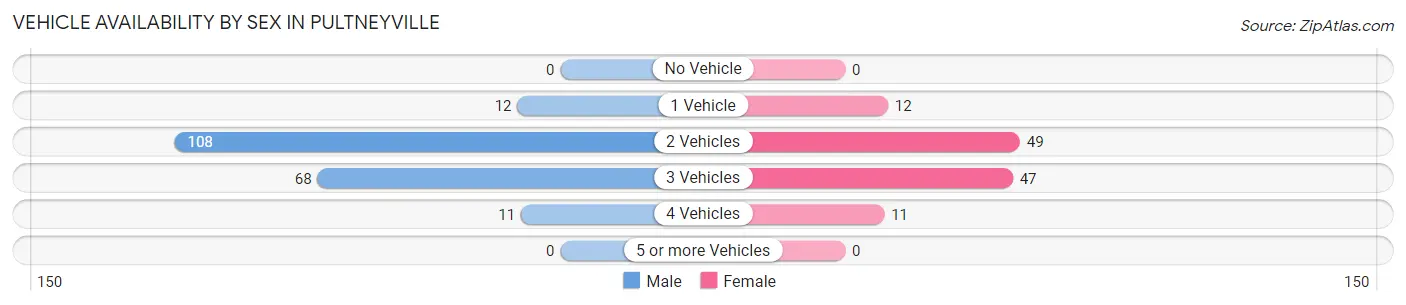
| Vehicles Available | Male | Female |
| No Vehicle | 0 (0.0%) | 0 (0.0%) |
| 1 Vehicle | 12 (6.0%) | 12 (10.1%) |
| 2 Vehicles | 108 (54.3%) | 49 (41.2%) |
| 3 Vehicles | 68 (34.2%) | 47 (39.5%) |
| 4 Vehicles | 11 (5.5%) | 11 (9.2%) |
| 5 or more Vehicles | 0 (0.0%) | 0 (0.0%) |
| Total | 199 (100.0%) | 119 (100.0%) |
Commute Time in Pultneyville
The most frequently occuring commute durations in Pultneyville are 25 to 29 minutes (55 commuters, 16.8%), 30 to 34 minutes (52 commuters, 15.9%), and 35 to 39 minutes (40 commuters, 12.2%).
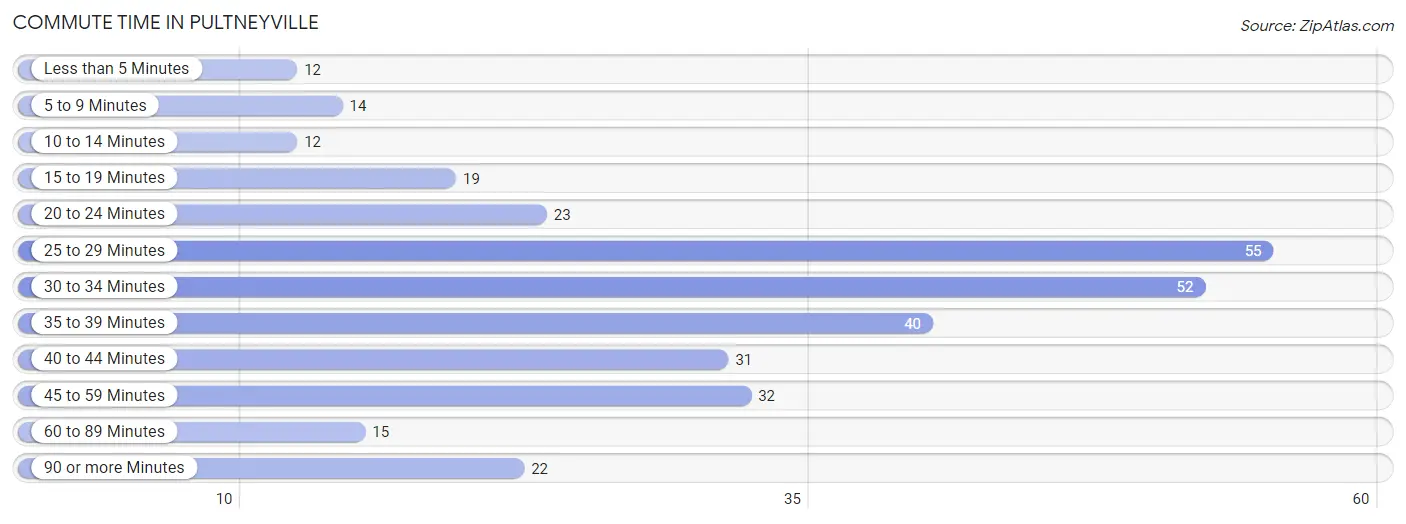
| Commute Time | # Commuters | % Commuters |
| Less than 5 Minutes | 12 | 3.7% |
| 5 to 9 Minutes | 14 | 4.3% |
| 10 to 14 Minutes | 12 | 3.7% |
| 15 to 19 Minutes | 19 | 5.8% |
| 20 to 24 Minutes | 23 | 7.0% |
| 25 to 29 Minutes | 55 | 16.8% |
| 30 to 34 Minutes | 52 | 15.9% |
| 35 to 39 Minutes | 40 | 12.2% |
| 40 to 44 Minutes | 31 | 9.5% |
| 45 to 59 Minutes | 32 | 9.8% |
| 60 to 89 Minutes | 15 | 4.6% |
| 90 or more Minutes | 22 | 6.7% |
Commute Time by Sex in Pultneyville
The most common commute times in Pultneyville are 30 to 34 minutes (43 commuters, 22.4%) for males and 25 to 29 minutes (46 commuters, 34.1%) for females.
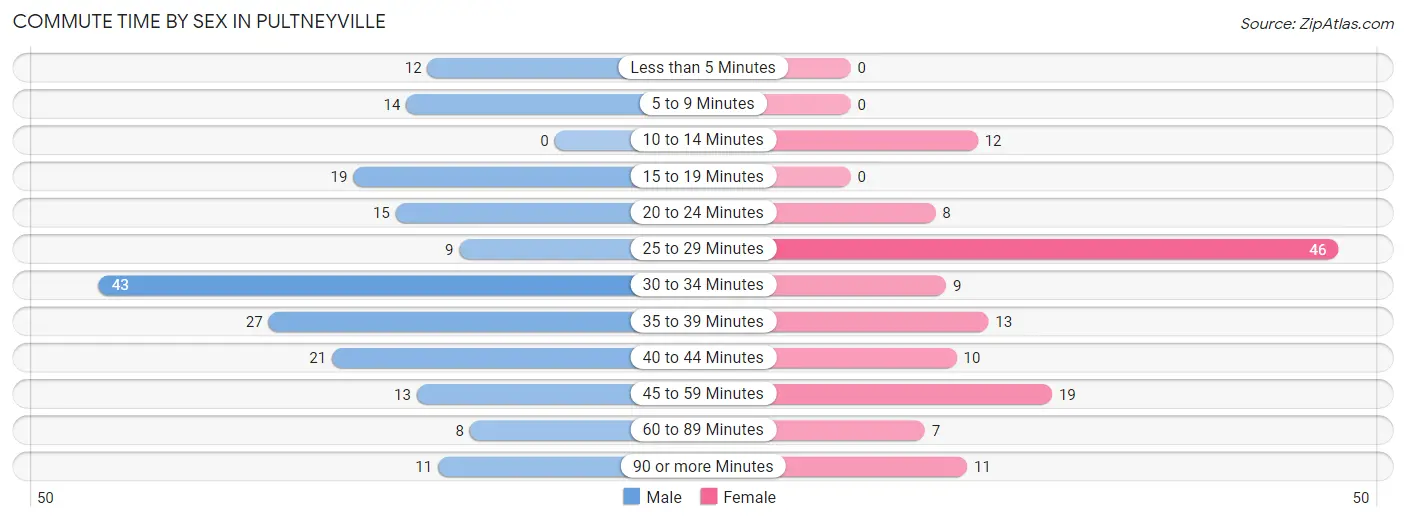
| Commute Time | Male | Female |
| Less than 5 Minutes | 12 (6.2%) | 0 (0.0%) |
| 5 to 9 Minutes | 14 (7.3%) | 0 (0.0%) |
| 10 to 14 Minutes | 0 (0.0%) | 12 (8.9%) |
| 15 to 19 Minutes | 19 (9.9%) | 0 (0.0%) |
| 20 to 24 Minutes | 15 (7.8%) | 8 (5.9%) |
| 25 to 29 Minutes | 9 (4.7%) | 46 (34.1%) |
| 30 to 34 Minutes | 43 (22.4%) | 9 (6.7%) |
| 35 to 39 Minutes | 27 (14.1%) | 13 (9.6%) |
| 40 to 44 Minutes | 21 (10.9%) | 10 (7.4%) |
| 45 to 59 Minutes | 13 (6.8%) | 19 (14.1%) |
| 60 to 89 Minutes | 8 (4.2%) | 7 (5.2%) |
| 90 or more Minutes | 11 (5.7%) | 11 (8.2%) |
Time of Departure to Work by Sex in Pultneyville
The most frequent times of departure to work in Pultneyville are 7:30 AM to 7:59 AM (37, 19.3%) for males and 7:30 AM to 7:59 AM (38, 28.1%) for females.
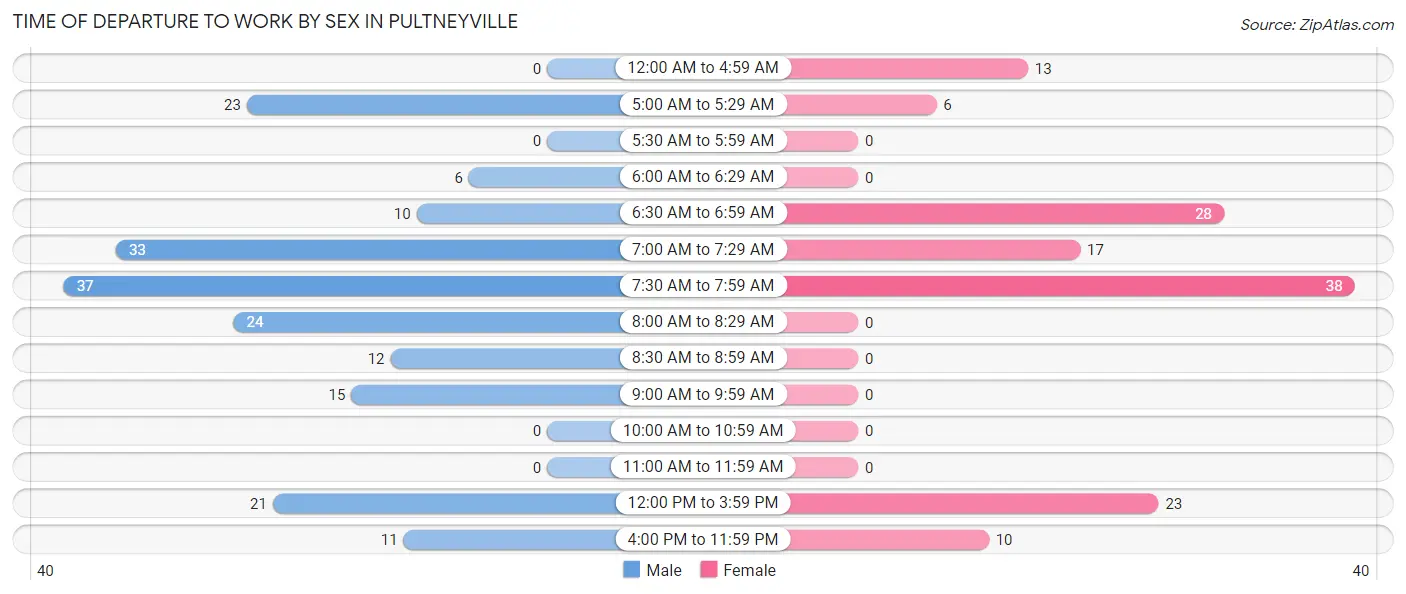
| Time of Departure | Male | Female |
| 12:00 AM to 4:59 AM | 0 (0.0%) | 13 (9.6%) |
| 5:00 AM to 5:29 AM | 23 (12.0%) | 6 (4.4%) |
| 5:30 AM to 5:59 AM | 0 (0.0%) | 0 (0.0%) |
| 6:00 AM to 6:29 AM | 6 (3.1%) | 0 (0.0%) |
| 6:30 AM to 6:59 AM | 10 (5.2%) | 28 (20.7%) |
| 7:00 AM to 7:29 AM | 33 (17.2%) | 17 (12.6%) |
| 7:30 AM to 7:59 AM | 37 (19.3%) | 38 (28.1%) |
| 8:00 AM to 8:29 AM | 24 (12.5%) | 0 (0.0%) |
| 8:30 AM to 8:59 AM | 12 (6.2%) | 0 (0.0%) |
| 9:00 AM to 9:59 AM | 15 (7.8%) | 0 (0.0%) |
| 10:00 AM to 10:59 AM | 0 (0.0%) | 0 (0.0%) |
| 11:00 AM to 11:59 AM | 0 (0.0%) | 0 (0.0%) |
| 12:00 PM to 3:59 PM | 21 (10.9%) | 23 (17.0%) |
| 4:00 PM to 11:59 PM | 11 (5.7%) | 10 (7.4%) |
| Total | 192 (100.0%) | 135 (100.0%) |
Housing Occupancy in Pultneyville
Occupancy by Ownership in Pultneyville
Of the total 254 dwellings in Pultneyville, owner-occupied units account for 242 (95.3%), while renter-occupied units make up 12 (4.7%).
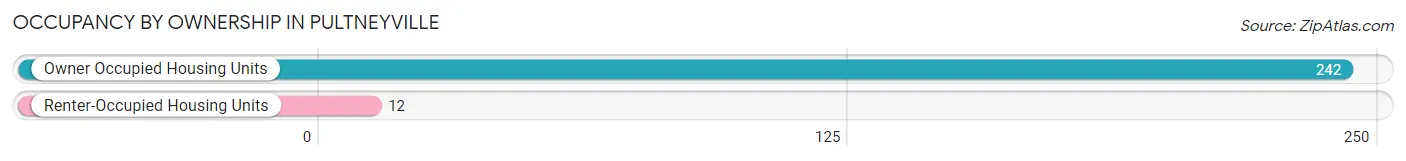
| Occupancy | # Housing Units | % Housing Units |
| Owner Occupied Housing Units | 242 | 95.3% |
| Renter-Occupied Housing Units | 12 | 4.7% |
| Total Occupied Housing Units | 254 | 100.0% |
Occupancy by Household Size in Pultneyville
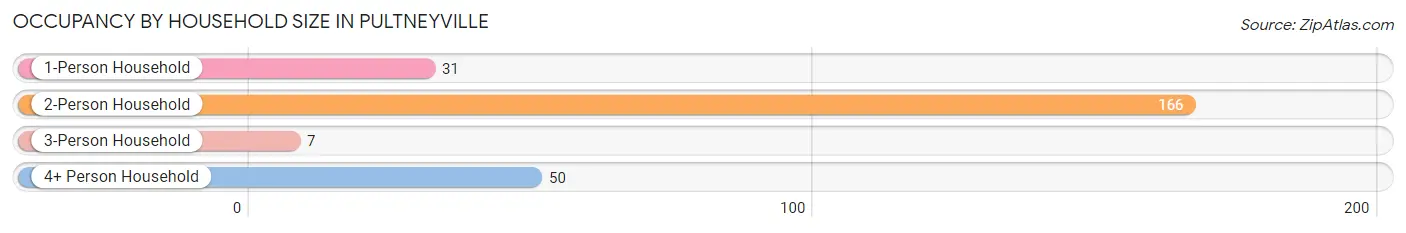
| Household Size | # Housing Units | % Housing Units |
| 1-Person Household | 31 | 12.2% |
| 2-Person Household | 166 | 65.3% |
| 3-Person Household | 7 | 2.8% |
| 4+ Person Household | 50 | 19.7% |
| Total Housing Units | 254 | 100.0% |
Occupancy by Ownership by Household Size in Pultneyville
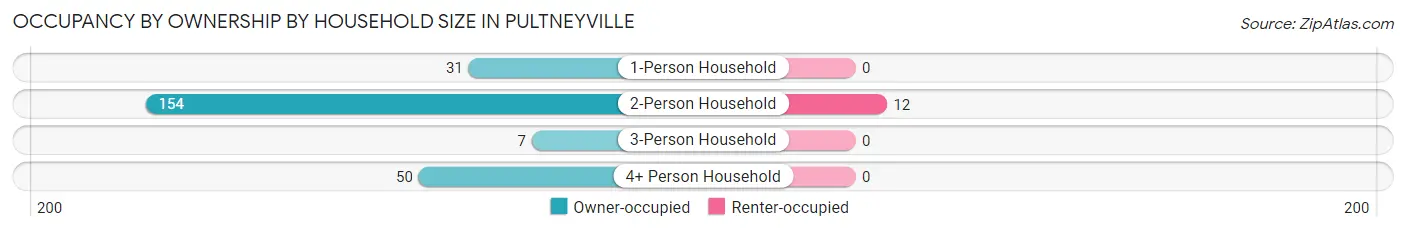
| Household Size | Owner-occupied | Renter-occupied |
| 1-Person Household | 31 (100.0%) | 0 (0.0%) |
| 2-Person Household | 154 (92.8%) | 12 (7.2%) |
| 3-Person Household | 7 (100.0%) | 0 (0.0%) |
| 4+ Person Household | 50 (100.0%) | 0 (0.0%) |
| Total Housing Units | 242 (95.3%) | 12 (4.7%) |
Occupancy by Educational Attainment in Pultneyville
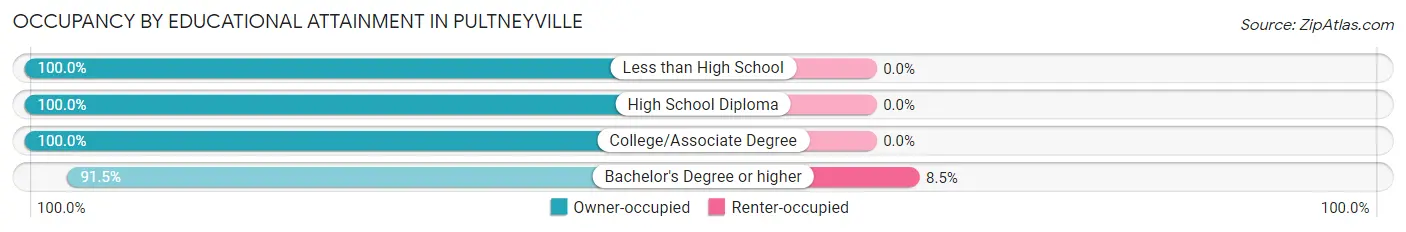
| Household Size | Owner-occupied | Renter-occupied |
| Less than High School | 8 (100.0%) | 0 (0.0%) |
| High School Diploma | 30 (100.0%) | 0 (0.0%) |
| College/Associate Degree | 75 (100.0%) | 0 (0.0%) |
| Bachelor's Degree or higher | 129 (91.5%) | 12 (8.5%) |
Occupancy by Age of Householder in Pultneyville
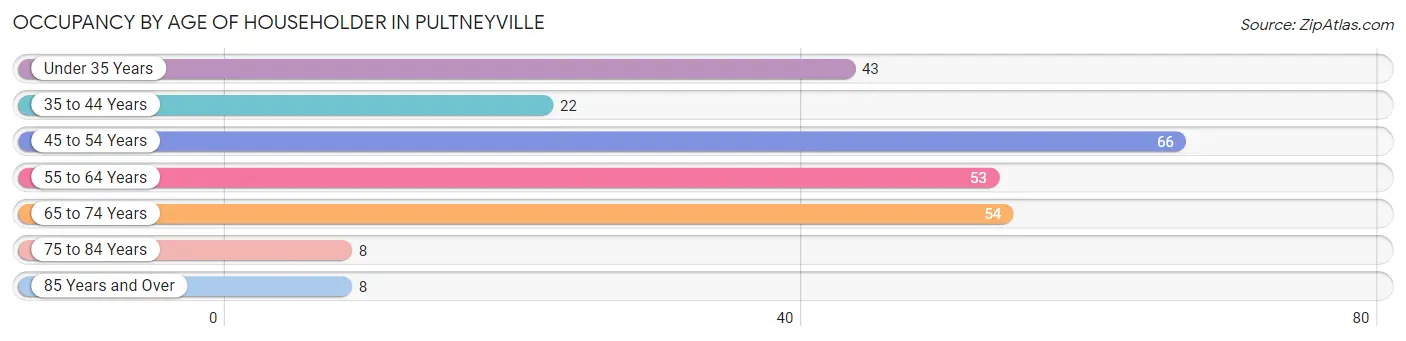
| Age Bracket | # Households | % Households |
| Under 35 Years | 43 | 16.9% |
| 35 to 44 Years | 22 | 8.7% |
| 45 to 54 Years | 66 | 26.0% |
| 55 to 64 Years | 53 | 20.9% |
| 65 to 74 Years | 54 | 21.3% |
| 75 to 84 Years | 8 | 3.2% |
| 85 Years and Over | 8 | 3.2% |
| Total | 254 | 100.0% |
Housing Finances in Pultneyville
Median Income by Occupancy in Pultneyville
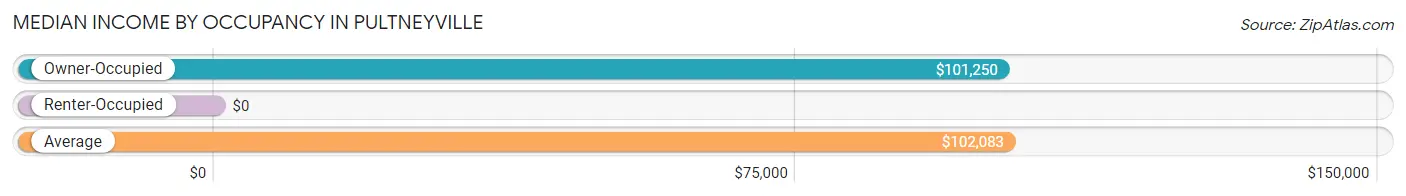
| Occupancy Type | # Households | Median Income |
| Owner-Occupied | 242 (95.3%) | $101,250 |
| Renter-Occupied | 12 (4.7%) | $0 |
| Average | 254 (100.0%) | $102,083 |
Occupancy by Householder Income Bracket in Pultneyville
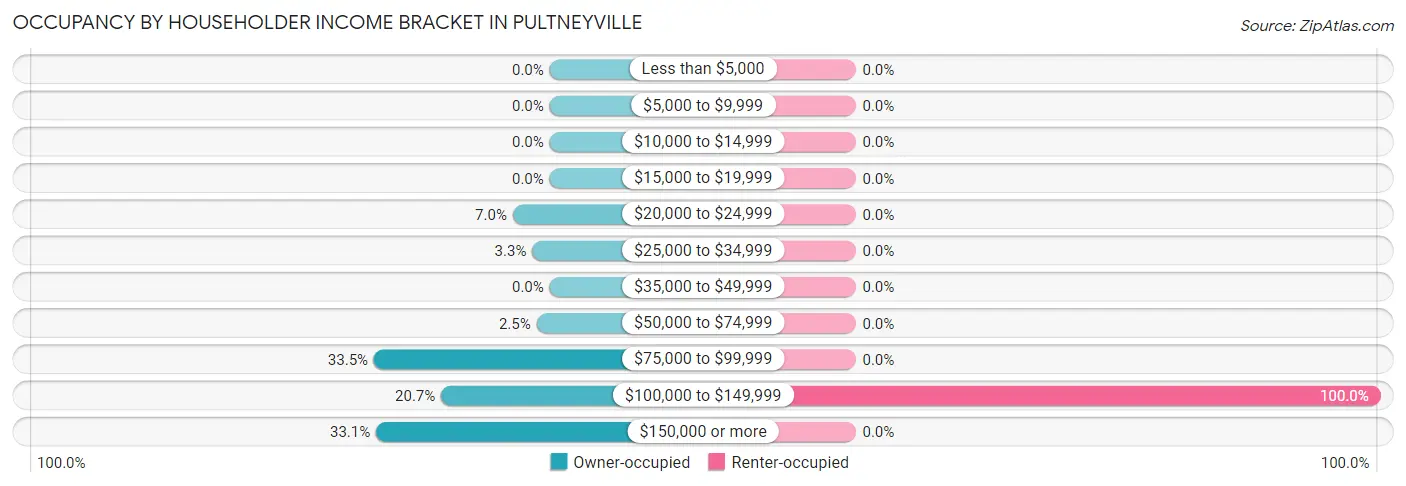
| Income Bracket | Owner-occupied | Renter-occupied |
| Less than $5,000 | 0 (0.0%) | 0 (0.0%) |
| $5,000 to $9,999 | 0 (0.0%) | 0 (0.0%) |
| $10,000 to $14,999 | 0 (0.0%) | 0 (0.0%) |
| $15,000 to $19,999 | 0 (0.0%) | 0 (0.0%) |
| $20,000 to $24,999 | 17 (7.0%) | 0 (0.0%) |
| $25,000 to $34,999 | 8 (3.3%) | 0 (0.0%) |
| $35,000 to $49,999 | 0 (0.0%) | 0 (0.0%) |
| $50,000 to $74,999 | 6 (2.5%) | 0 (0.0%) |
| $75,000 to $99,999 | 81 (33.5%) | 0 (0.0%) |
| $100,000 to $149,999 | 50 (20.7%) | 12 (100.0%) |
| $150,000 or more | 80 (33.1%) | 0 (0.0%) |
| Total | 242 (100.0%) | 12 (100.0%) |
Monthly Housing Cost Tiers in Pultneyville
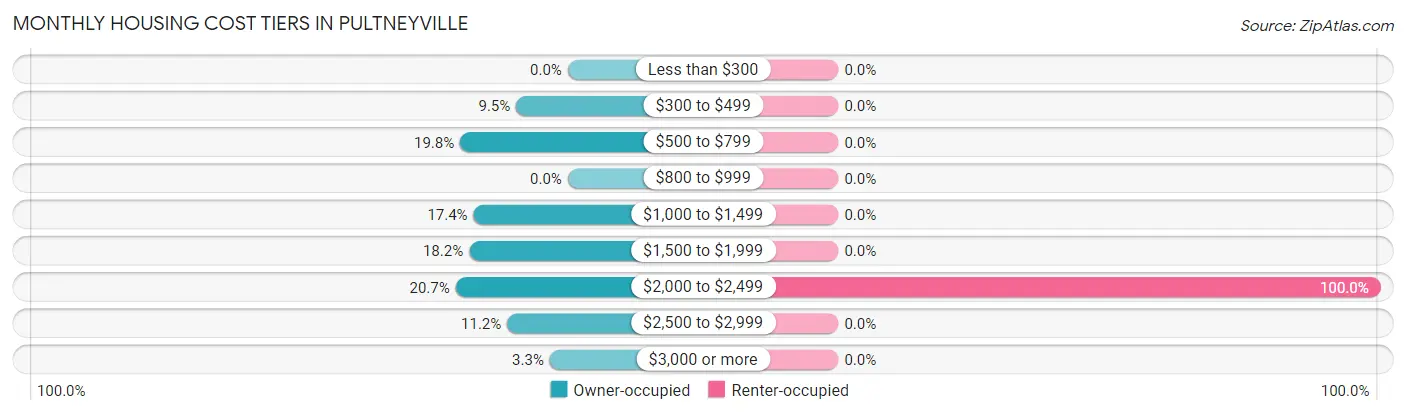
| Monthly Cost | Owner-occupied | Renter-occupied |
| Less than $300 | 0 (0.0%) | 0 (0.0%) |
| $300 to $499 | 23 (9.5%) | 0 (0.0%) |
| $500 to $799 | 48 (19.8%) | 0 (0.0%) |
| $800 to $999 | 0 (0.0%) | 0 (0.0%) |
| $1,000 to $1,499 | 42 (17.4%) | 0 (0.0%) |
| $1,500 to $1,999 | 44 (18.2%) | 0 (0.0%) |
| $2,000 to $2,499 | 50 (20.7%) | 12 (100.0%) |
| $2,500 to $2,999 | 27 (11.2%) | 0 (0.0%) |
| $3,000 or more | 8 (3.3%) | 0 (0.0%) |
| Total | 242 (100.0%) | 12 (100.0%) |
Physical Housing Characteristics in Pultneyville
Housing Structures in Pultneyville
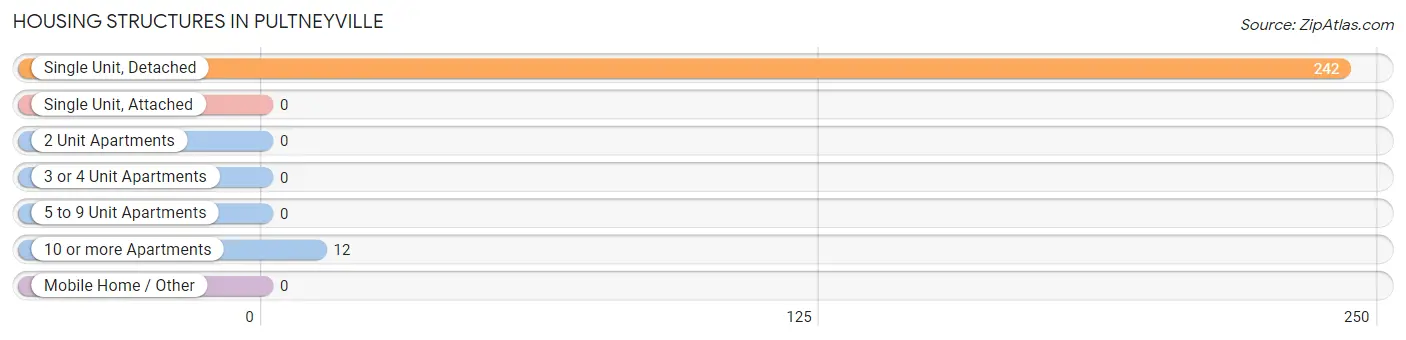
| Structure Type | # Housing Units | % Housing Units |
| Single Unit, Detached | 242 | 95.3% |
| Single Unit, Attached | 0 | 0.0% |
| 2 Unit Apartments | 0 | 0.0% |
| 3 or 4 Unit Apartments | 0 | 0.0% |
| 5 to 9 Unit Apartments | 0 | 0.0% |
| 10 or more Apartments | 12 | 4.7% |
| Mobile Home / Other | 0 | 0.0% |
| Total | 254 | 100.0% |
Housing Structures by Occupancy in Pultneyville
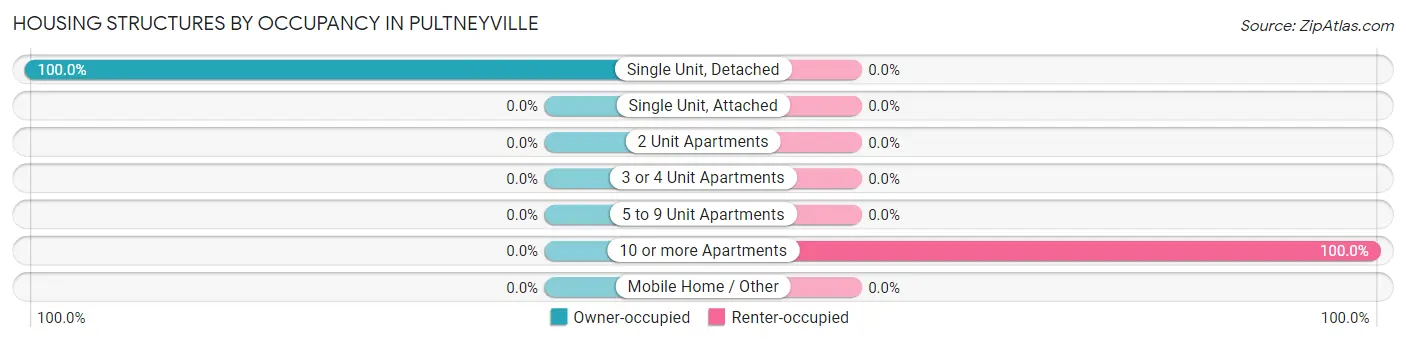
| Structure Type | Owner-occupied | Renter-occupied |
| Single Unit, Detached | 242 (100.0%) | 0 (0.0%) |
| Single Unit, Attached | 0 (0.0%) | 0 (0.0%) |
| 2 Unit Apartments | 0 (0.0%) | 0 (0.0%) |
| 3 or 4 Unit Apartments | 0 (0.0%) | 0 (0.0%) |
| 5 to 9 Unit Apartments | 0 (0.0%) | 0 (0.0%) |
| 10 or more Apartments | 0 (0.0%) | 12 (100.0%) |
| Mobile Home / Other | 0 (0.0%) | 0 (0.0%) |
| Total | 242 (95.3%) | 12 (4.7%) |
Housing Structures by Number of Rooms in Pultneyville
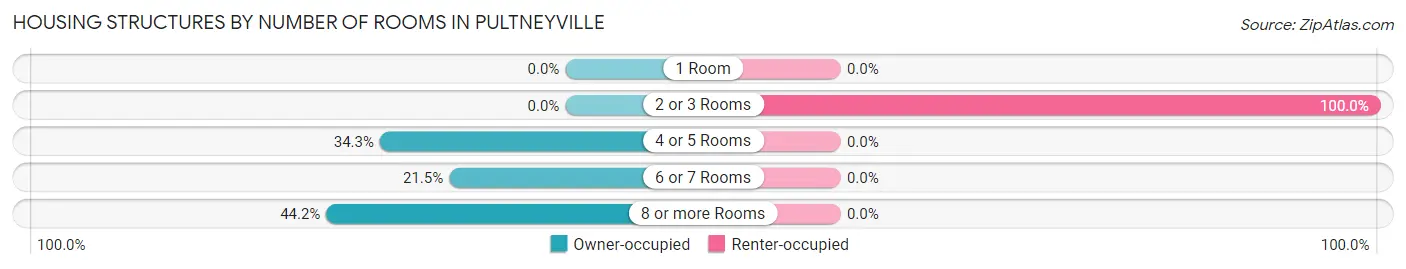
| Number of Rooms | Owner-occupied | Renter-occupied |
| 1 Room | 0 (0.0%) | 0 (0.0%) |
| 2 or 3 Rooms | 0 (0.0%) | 12 (100.0%) |
| 4 or 5 Rooms | 83 (34.3%) | 0 (0.0%) |
| 6 or 7 Rooms | 52 (21.5%) | 0 (0.0%) |
| 8 or more Rooms | 107 (44.2%) | 0 (0.0%) |
| Total | 242 (100.0%) | 12 (100.0%) |
Housing Structure by Heating Type in Pultneyville
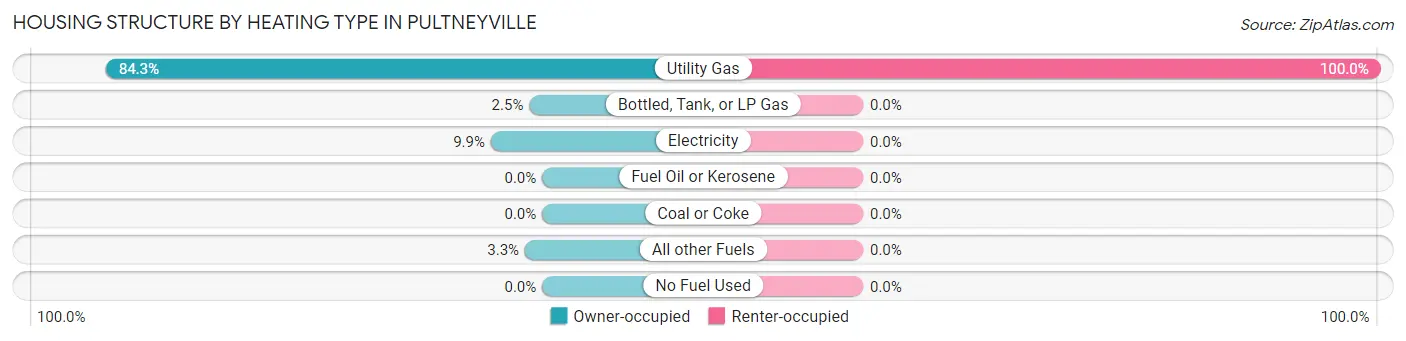
| Heating Type | Owner-occupied | Renter-occupied |
| Utility Gas | 204 (84.3%) | 12 (100.0%) |
| Bottled, Tank, or LP Gas | 6 (2.5%) | 0 (0.0%) |
| Electricity | 24 (9.9%) | 0 (0.0%) |
| Fuel Oil or Kerosene | 0 (0.0%) | 0 (0.0%) |
| Coal or Coke | 0 (0.0%) | 0 (0.0%) |
| All other Fuels | 8 (3.3%) | 0 (0.0%) |
| No Fuel Used | 0 (0.0%) | 0 (0.0%) |
| Total | 242 (100.0%) | 12 (100.0%) |
Household Vehicle Usage in Pultneyville
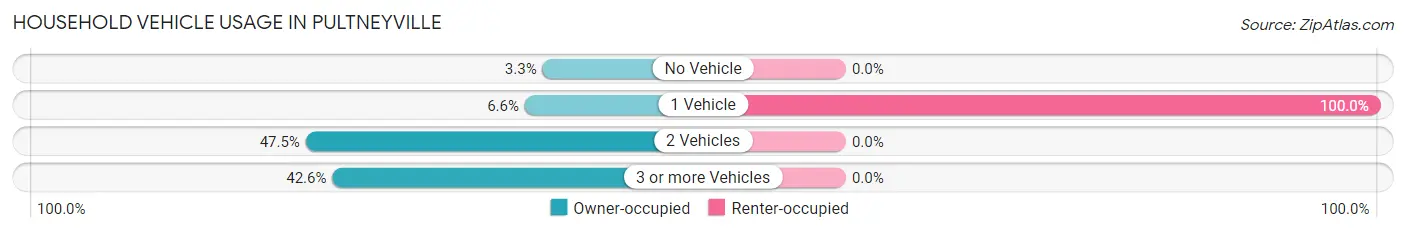
| Vehicles per Household | Owner-occupied | Renter-occupied |
| No Vehicle | 8 (3.3%) | 0 (0.0%) |
| 1 Vehicle | 16 (6.6%) | 12 (100.0%) |
| 2 Vehicles | 115 (47.5%) | 0 (0.0%) |
| 3 or more Vehicles | 103 (42.6%) | 0 (0.0%) |
| Total | 242 (100.0%) | 12 (100.0%) |
Real Estate & Mortgages in Pultneyville
Real Estate and Mortgage Overview in Pultneyville
| Characteristic | Without Mortgage | With Mortgage |
| Housing Units | 63 | 179 |
| Median Property Value | $259,600 | $234,300 |
| Median Household Income | $101,319 | $73 |
| Monthly Housing Costs | $654 | $8 |
| Real Estate Taxes | $4,705 | $7 |
Property Value by Mortgage Status in Pultneyville
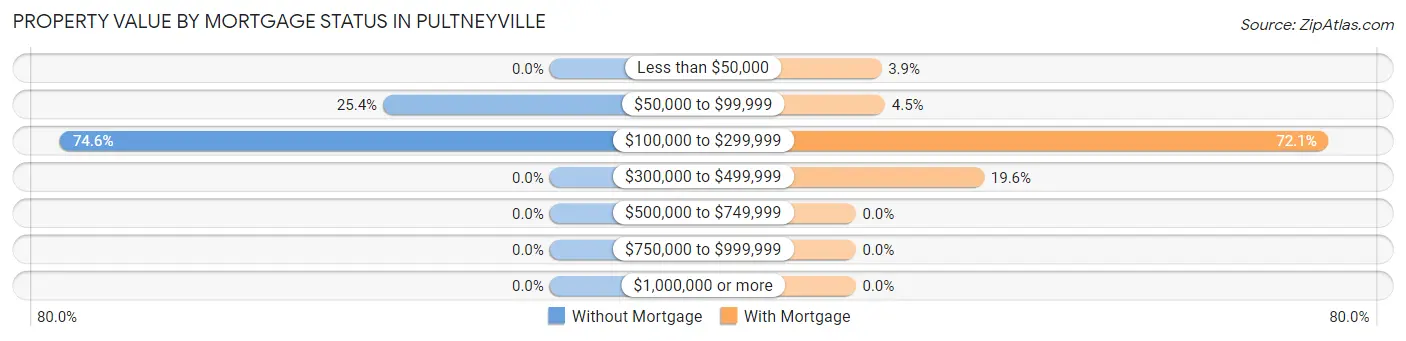
| Property Value | Without Mortgage | With Mortgage |
| Less than $50,000 | 0 (0.0%) | 7 (3.9%) |
| $50,000 to $99,999 | 16 (25.4%) | 8 (4.5%) |
| $100,000 to $299,999 | 47 (74.6%) | 129 (72.1%) |
| $300,000 to $499,999 | 0 (0.0%) | 35 (19.6%) |
| $500,000 to $749,999 | 0 (0.0%) | 0 (0.0%) |
| $750,000 to $999,999 | 0 (0.0%) | 0 (0.0%) |
| $1,000,000 or more | 0 (0.0%) | 0 (0.0%) |
| Total | 63 (100.0%) | 179 (100.0%) |
Household Income by Mortgage Status in Pultneyville
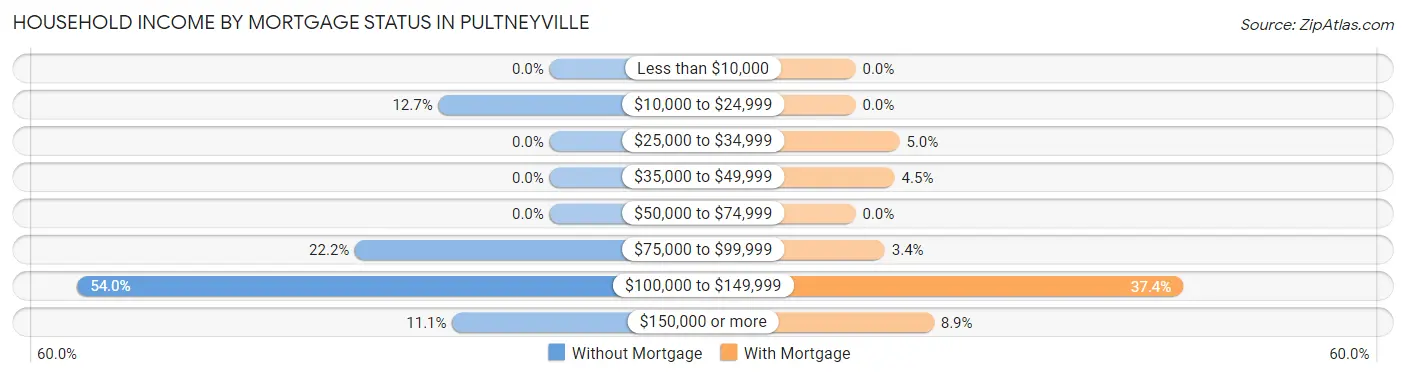
| Household Income | Without Mortgage | With Mortgage |
| Less than $10,000 | 0 (0.0%) | 0 (0.0%) |
| $10,000 to $24,999 | 8 (12.7%) | 0 (0.0%) |
| $25,000 to $34,999 | 0 (0.0%) | 9 (5.0%) |
| $35,000 to $49,999 | 0 (0.0%) | 8 (4.5%) |
| $50,000 to $74,999 | 0 (0.0%) | 0 (0.0%) |
| $75,000 to $99,999 | 14 (22.2%) | 6 (3.4%) |
| $100,000 to $149,999 | 34 (54.0%) | 67 (37.4%) |
| $150,000 or more | 7 (11.1%) | 16 (8.9%) |
| Total | 63 (100.0%) | 179 (100.0%) |
Property Value to Household Income Ratio in Pultneyville
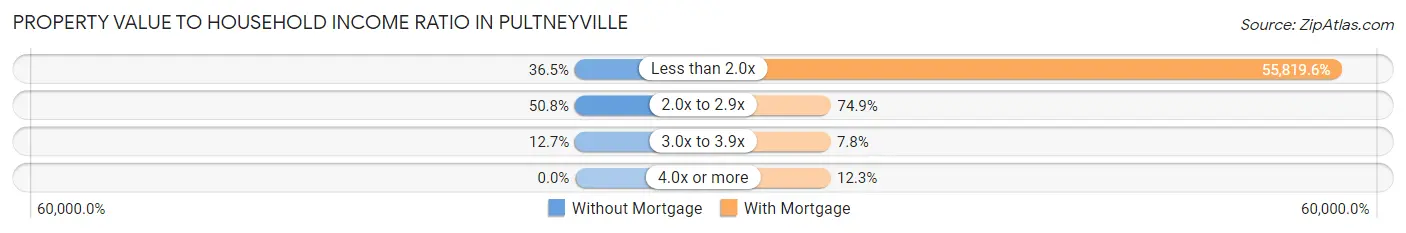
| Value-to-Income Ratio | Without Mortgage | With Mortgage |
| Less than 2.0x | 23 (36.5%) | 99,917 (55,819.6%) |
| 2.0x to 2.9x | 32 (50.8%) | 134 (74.9%) |
| 3.0x to 3.9x | 8 (12.7%) | 14 (7.8%) |
| 4.0x or more | 0 (0.0%) | 22 (12.3%) |
| Total | 63 (100.0%) | 179 (100.0%) |
Real Estate Taxes by Mortgage Status in Pultneyville
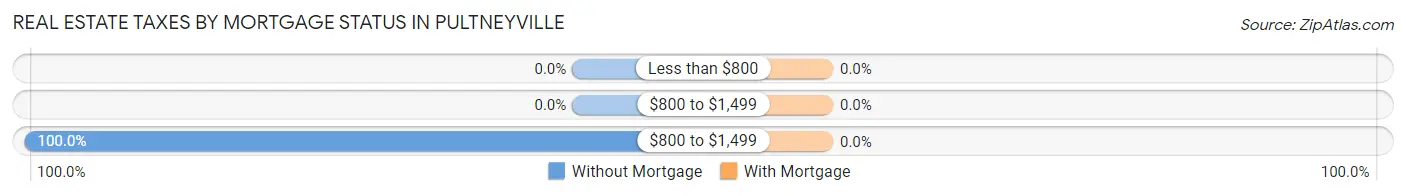
| Property Taxes | Without Mortgage | With Mortgage |
| Less than $800 | 0 (0.0%) | 0 (0.0%) |
| $800 to $1,499 | 0 (0.0%) | 0 (0.0%) |
| $800 to $1,499 | 63 (100.0%) | 0 (0.0%) |
| Total | 63 (100.0%) | 179 (100.0%) |
Health & Disability in Pultneyville
Health Insurance Coverage by Age in Pultneyville
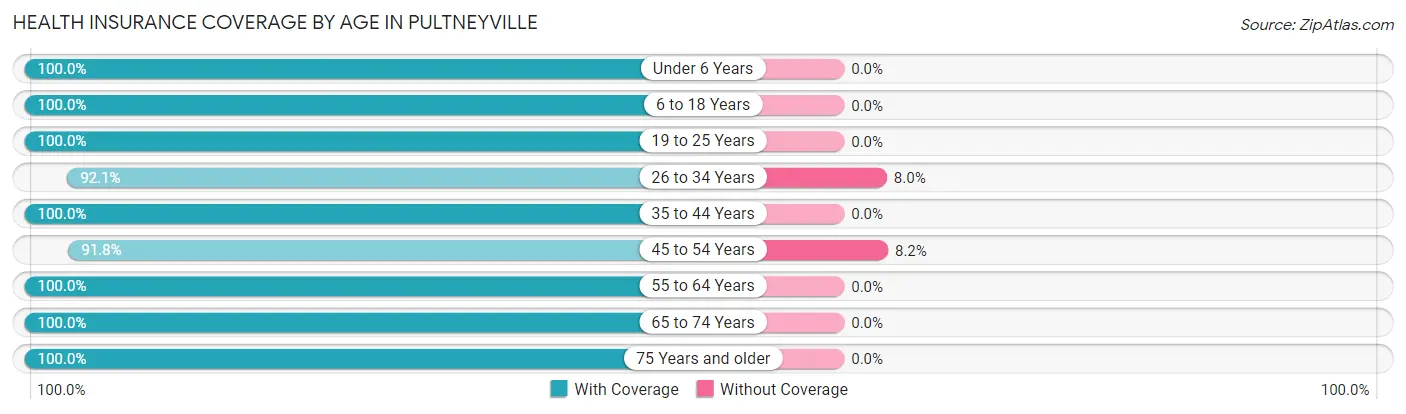
| Age Bracket | With Coverage | Without Coverage |
| Under 6 Years | 61 (100.0%) | 0 (0.0%) |
| 6 to 18 Years | 55 (100.0%) | 0 (0.0%) |
| 19 to 25 Years | 41 (100.0%) | 0 (0.0%) |
| 26 to 34 Years | 81 (92.0%) | 7 (8.0%) |
| 35 to 44 Years | 99 (100.0%) | 0 (0.0%) |
| 45 to 54 Years | 90 (91.8%) | 8 (8.2%) |
| 55 to 64 Years | 107 (100.0%) | 0 (0.0%) |
| 65 to 74 Years | 72 (100.0%) | 0 (0.0%) |
| 75 Years and older | 57 (100.0%) | 0 (0.0%) |
| Total | 663 (97.8%) | 15 (2.2%) |
Health Insurance Coverage by Citizenship Status in Pultneyville
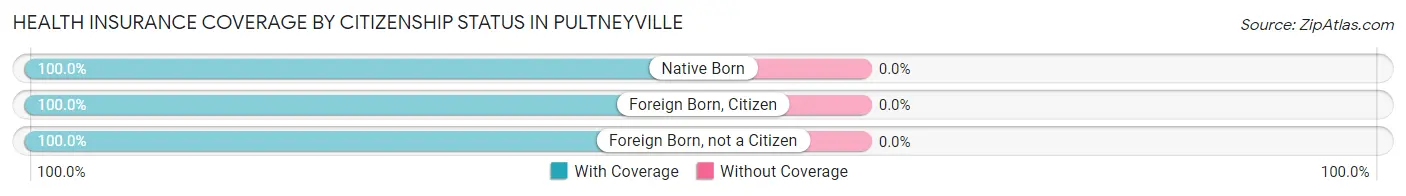
| Citizenship Status | With Coverage | Without Coverage |
| Native Born | 61 (100.0%) | 0 (0.0%) |
| Foreign Born, Citizen | 55 (100.0%) | 0 (0.0%) |
| Foreign Born, not a Citizen | 41 (100.0%) | 0 (0.0%) |
Health Insurance Coverage by Household Income in Pultneyville
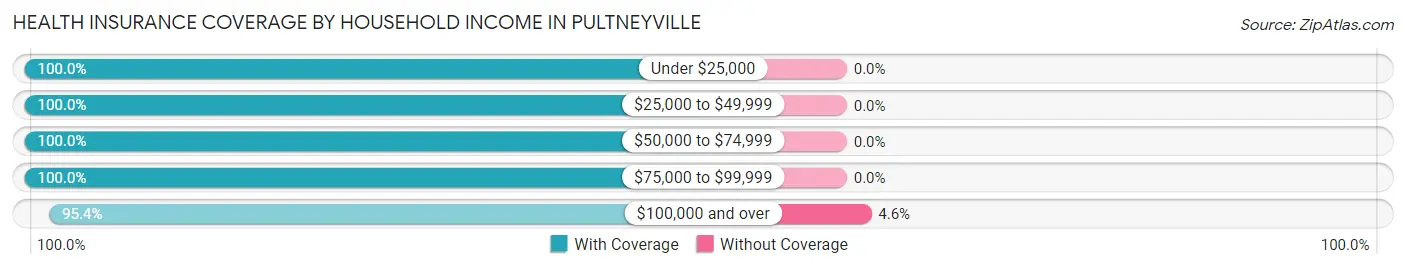
| Household Income | With Coverage | Without Coverage |
| Under $25,000 | 17 (100.0%) | 0 (0.0%) |
| $25,000 to $49,999 | 8 (100.0%) | 0 (0.0%) |
| $50,000 to $74,999 | 6 (100.0%) | 0 (0.0%) |
| $75,000 to $99,999 | 259 (100.0%) | 0 (0.0%) |
| $100,000 and over | 311 (95.4%) | 15 (4.6%) |
Public vs Private Health Insurance Coverage by Age in Pultneyville
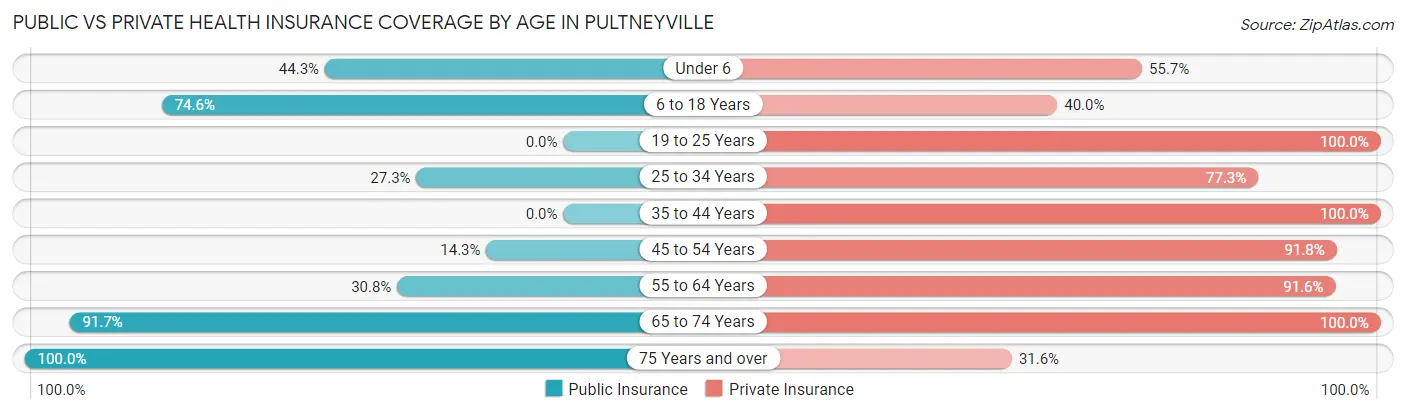
| Age Bracket | Public Insurance | Private Insurance |
| Under 6 | 27 (44.3%) | 34 (55.7%) |
| 6 to 18 Years | 41 (74.6%) | 22 (40.0%) |
| 19 to 25 Years | 0 (0.0%) | 41 (100.0%) |
| 25 to 34 Years | 24 (27.3%) | 68 (77.3%) |
| 35 to 44 Years | 0 (0.0%) | 99 (100.0%) |
| 45 to 54 Years | 14 (14.3%) | 90 (91.8%) |
| 55 to 64 Years | 33 (30.8%) | 98 (91.6%) |
| 65 to 74 Years | 66 (91.7%) | 72 (100.0%) |
| 75 Years and over | 57 (100.0%) | 18 (31.6%) |
| Total | 262 (38.6%) | 542 (79.9%) |
Disability Status by Sex by Age in Pultneyville
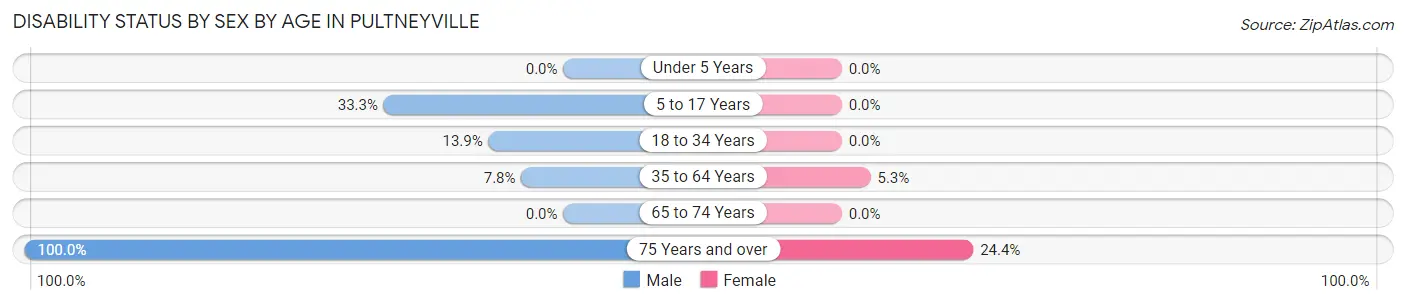
| Age Bracket | Male | Female |
| Under 5 Years | 0 (0.0%) | 0 (0.0%) |
| 5 to 17 Years | 11 (33.3%) | 0 (0.0%) |
| 18 to 34 Years | 10 (13.9%) | 0 (0.0%) |
| 35 to 64 Years | 12 (7.8%) | 8 (5.3%) |
| 65 to 74 Years | 0 (0.0%) | 0 (0.0%) |
| 75 Years and over | 16 (100.0%) | 10 (24.4%) |
Disability Class by Sex by Age in Pultneyville
Disability Class: Hearing Difficulty
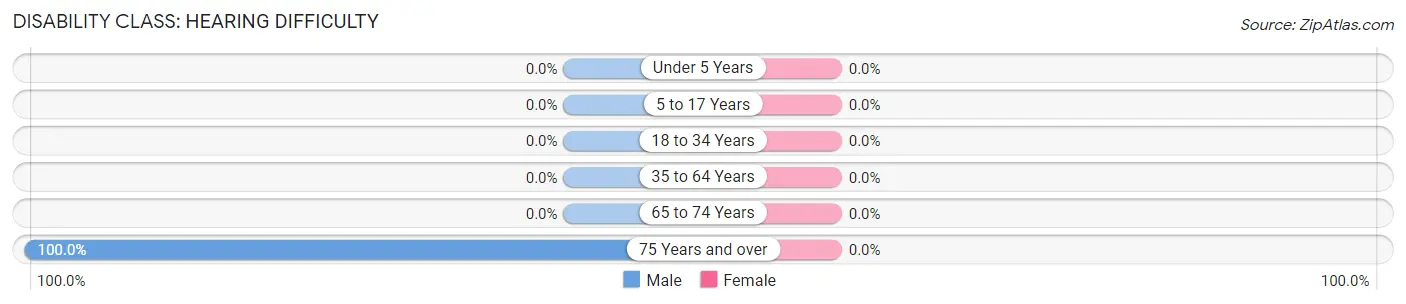
| Age Bracket | Male | Female |
| Under 5 Years | 0 (0.0%) | 0 (0.0%) |
| 5 to 17 Years | 0 (0.0%) | 0 (0.0%) |
| 18 to 34 Years | 0 (0.0%) | 0 (0.0%) |
| 35 to 64 Years | 0 (0.0%) | 0 (0.0%) |
| 65 to 74 Years | 0 (0.0%) | 0 (0.0%) |
| 75 Years and over | 16 (100.0%) | 0 (0.0%) |
Disability Class: Vision Difficulty
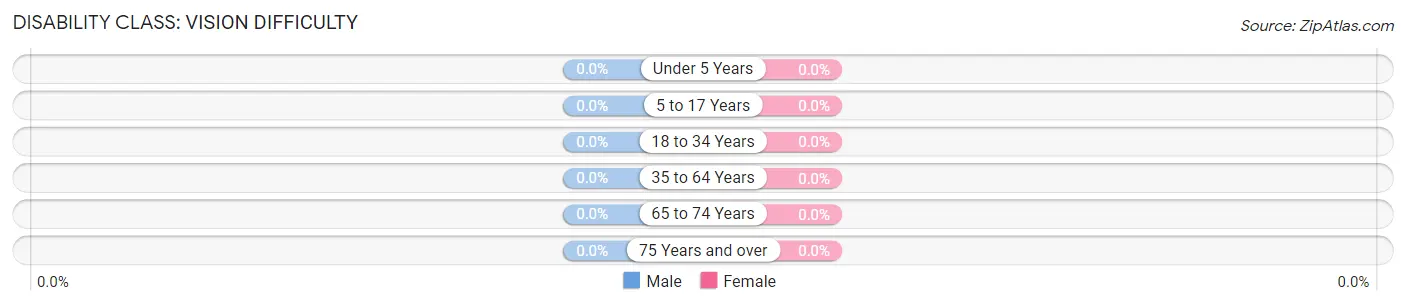
| Age Bracket | Male | Female |
| Under 5 Years | 0 (0.0%) | 0 (0.0%) |
| 5 to 17 Years | 0 (0.0%) | 0 (0.0%) |
| 18 to 34 Years | 0 (0.0%) | 0 (0.0%) |
| 35 to 64 Years | 0 (0.0%) | 0 (0.0%) |
| 65 to 74 Years | 0 (0.0%) | 0 (0.0%) |
| 75 Years and over | 0 (0.0%) | 0 (0.0%) |
Disability Class: Cognitive Difficulty
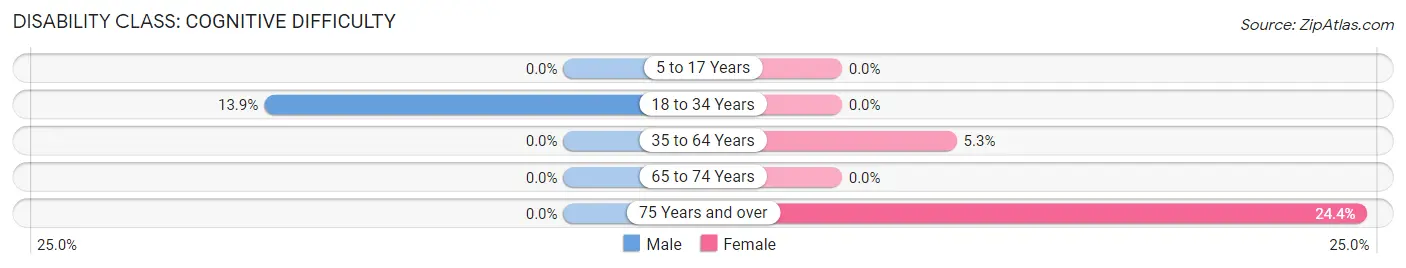
| Age Bracket | Male | Female |
| 5 to 17 Years | 0 (0.0%) | 0 (0.0%) |
| 18 to 34 Years | 10 (13.9%) | 0 (0.0%) |
| 35 to 64 Years | 0 (0.0%) | 8 (5.3%) |
| 65 to 74 Years | 0 (0.0%) | 0 (0.0%) |
| 75 Years and over | 0 (0.0%) | 10 (24.4%) |
Disability Class: Ambulatory Difficulty
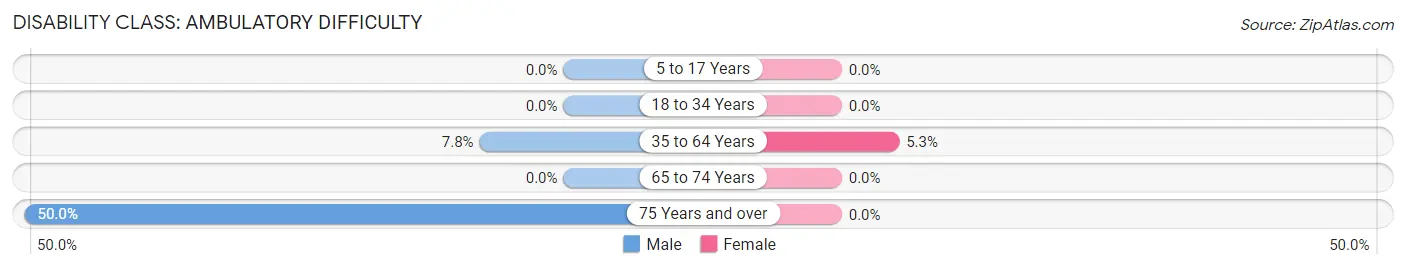
| Age Bracket | Male | Female |
| 5 to 17 Years | 0 (0.0%) | 0 (0.0%) |
| 18 to 34 Years | 0 (0.0%) | 0 (0.0%) |
| 35 to 64 Years | 12 (7.8%) | 8 (5.3%) |
| 65 to 74 Years | 0 (0.0%) | 0 (0.0%) |
| 75 Years and over | 8 (50.0%) | 0 (0.0%) |
Disability Class: Self-Care Difficulty
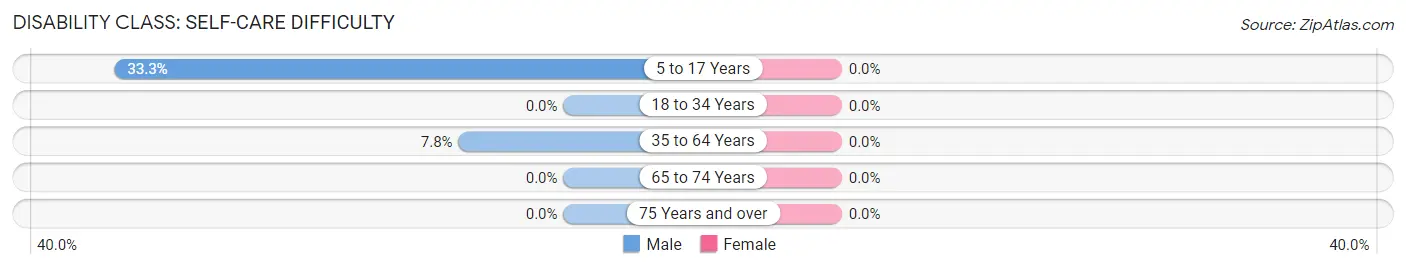
| Age Bracket | Male | Female |
| 5 to 17 Years | 11 (33.3%) | 0 (0.0%) |
| 18 to 34 Years | 0 (0.0%) | 0 (0.0%) |
| 35 to 64 Years | 12 (7.8%) | 0 (0.0%) |
| 65 to 74 Years | 0 (0.0%) | 0 (0.0%) |
| 75 Years and over | 0 (0.0%) | 0 (0.0%) |
Technology Access in Pultneyville
Computing Device Access in Pultneyville
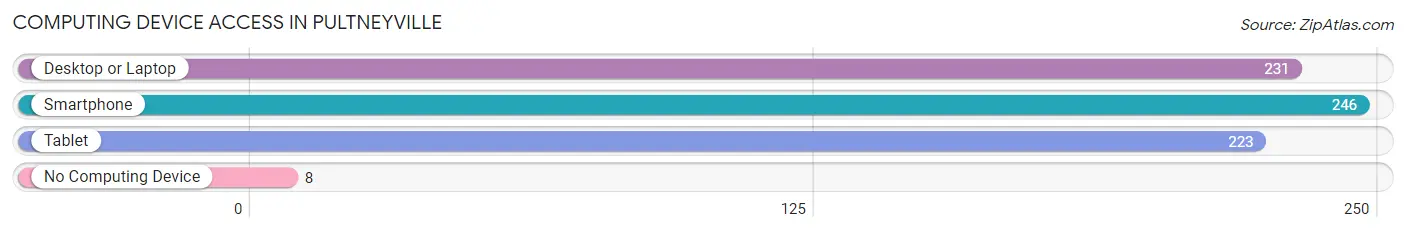
| Device Type | # Households | % Households |
| Desktop or Laptop | 231 | 90.9% |
| Smartphone | 246 | 96.9% |
| Tablet | 223 | 87.8% |
| No Computing Device | 8 | 3.2% |
| Total | 254 | 100.0% |
Internet Access in Pultneyville
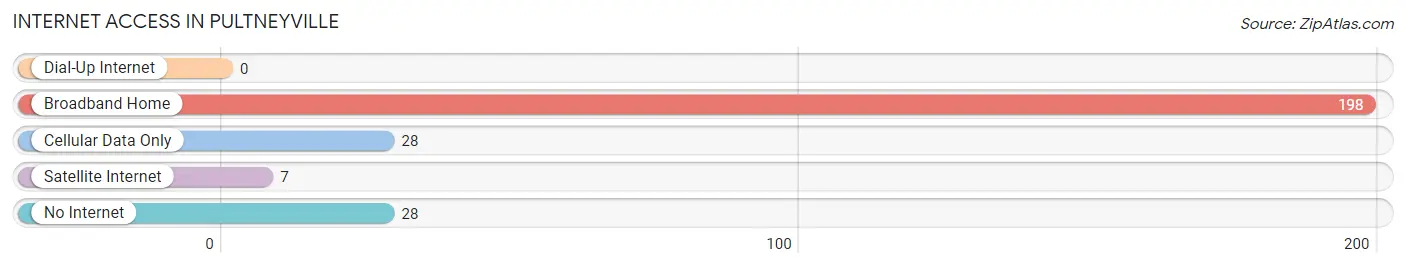
| Internet Type | # Households | % Households |
| Dial-Up Internet | 0 | 0.0% |
| Broadband Home | 198 | 77.9% |
| Cellular Data Only | 28 | 11.0% |
| Satellite Internet | 7 | 2.8% |
| No Internet | 28 | 11.0% |
| Total | 254 | 100.0% |
Pultneyville Summary
Pultneyville is a small hamlet located in the town of Williamson in Wayne County, New York. It is situated on the south shore of Lake Ontario, approximately 25 miles east of Rochester. The hamlet is named after James Pultney, who was an early settler in the area.
History
The area that is now Pultneyville was originally inhabited by the Iroquois and other Native American tribes. The first European settlers arrived in the area in the late 1700s. The first settler was James Pultney, who arrived in 1790 and established a tavern and store. He also built a gristmill and sawmill, which were important to the local economy.
In 1812, the hamlet was officially established and named after James Pultney. The hamlet grew slowly over the next few decades, with the construction of a post office in 1825 and a school in 1835. The hamlet was also home to a number of businesses, including a blacksmith, a tannery, and a cooperage.
In the late 1800s, the hamlet experienced a period of growth and prosperity. The construction of the Erie Canal in 1825 brought increased trade and commerce to the area. The hamlet also became a popular summer resort destination, with several hotels and inns being built.
Geography
Pultneyville is located in the town of Williamson in Wayne County, New York. It is situated on the south shore of Lake Ontario, approximately 25 miles east of Rochester. The hamlet is bordered by the towns of Sodus and Huron to the east, and the towns of Macedon and Walworth to the west.
The hamlet is located in a rural area, with rolling hills and farmland. The terrain is mostly flat, with some areas of higher elevation. The hamlet is located in the Finger Lakes region, and is surrounded by several small lakes and ponds.
Economy
The economy of Pultneyville is largely based on agriculture and tourism. The hamlet is home to several farms, which produce a variety of crops, including corn, soybeans, and hay. The hamlet is also home to several wineries, which produce a variety of wines.
The hamlet is also a popular tourist destination, with several bed and breakfasts, inns, and restaurants. The hamlet is also home to several historic sites, including the Pultneyville Historic District, which is listed on the National Register of Historic Places.
Demographics
As of the 2010 census, the population of Pultneyville was 1,845. The population is largely white (97.2%), with a small percentage of African Americans (1.2%) and Hispanics (1.2%). The median household income is $50,000, and the median home value is $150,000. The unemployment rate is 5.2%.
Conclusion
Pultneyville is a small hamlet located in the town of Williamson in Wayne County, New York. It is situated on the south shore of Lake Ontario, approximately 25 miles east of Rochester. The hamlet is named after James Pultney, who was an early settler in the area. The economy of Pultneyville is largely based on agriculture and tourism, and the population is largely white. The hamlet is also a popular tourist destination, with several bed and breakfasts, inns, and restaurants.
Common Questions
What is Per Capita Income in Pultneyville?
Per Capita income in Pultneyville is $46,778.
What is the Median Family Income in Pultneyville?
Median Family Income in Pultneyville is $113,906.
What is the Median Household income in Pultneyville?
Median Household Income in Pultneyville is $102,083.
What is Inequality or Gini Index in Pultneyville?
Inequality or Gini Index in Pultneyville is 0.25.
What is the Total Population of Pultneyville?
Total Population of Pultneyville is 678.
What is the Total Male Population of Pultneyville?
Total Male Population of Pultneyville is 309.
What is the Total Female Population of Pultneyville?
Total Female Population of Pultneyville is 369.
What is the Ratio of Males per 100 Females in Pultneyville?
There are 83.74 Males per 100 Females in Pultneyville.
What is the Ratio of Females per 100 Males in Pultneyville?
There are 119.42 Females per 100 Males in Pultneyville.
What is the Median Population Age in Pultneyville?
Median Population Age in Pultneyville is 43.8 Years.
What is the Average Family Size in Pultneyville
Average Family Size in Pultneyville is 2.6 People.
What is the Average Household Size in Pultneyville
Average Household Size in Pultneyville is 2.4 People.
How Large is the Labor Force in Pultneyville?
There are 359 People in the Labor Forcein in Pultneyville.
What is the Percentage of People in the Labor Force in Pultneyville?
62.3% of People are in the Labor Force in Pultneyville.
What is the Unemployment Rate in Pultneyville?
Unemployment Rate in Pultneyville is 2.8%.