Zip Codes with the Highest Percentage of Population Employed in Architecture & Engineering in New York, NY

RELATED REPORTS & OPTIONS

Architecture & Engineering
Population
Families and Households
Female Fertility
Female Fertility (Unmarried)
Race (Community Size)
Race (Percentage)
Ancestry (Community Size)
AfghanAfricanAlbanianAlsatianAmericanApacheArabArgentineanArmenianAssyrian / Chaldean / SyriacAustralianAustrianBahamianBarbadianBasqueBelgianBelizeanBermudanBhutaneseBlackfeetBolivianBrazilianBritishBritish West IndianBulgarianBurmeseCajunCambodianCanadianCape VerdeanCarpatho RusynCelticCentral AmericanCentral American IndianCherokeeChickasawChileanChippewaChoctawColombianCosta RicanCreekCroatianCubanCypriotCzechCzechoslovakianDanishDelawareDominicanDutchDutch West IndianEastern EuropeanEcuadorianEgyptianEnglishEstonianEthiopianEuropeanFilipinoFinnishFrenchFrench American IndianFrench CanadianGermanGhanaianGreekGuamanian / ChamorroGuatemalanGuyaneseHaitianHmongHonduranHungarianIcelanderIndian (Asian)IndonesianIranianIraqiIrishIroquoisIsraeliItalianJamaicanJapaneseJordanianKenyanKoreanLaotianLatvianLebaneseLiberianLithuanianLuxembourgerMacedonianMalaysianMalteseMexicanMexican American IndianMongolianMoroccanNative HawaiianNew ZealanderNicaraguanNigerianNorthern EuropeanNorwegianOkinawanPakistaniPalestinianPanamanianParaguayanPennsylvania GermanPeruvianPolishPortuguesePuebloPuerto RicanRomanianRussianSalvadoranSamoanScandinavianScotch-IrishScottishSenegaleseSerbianSierra LeoneanSiouxSlavicSlovakSloveneSomaliSouth AfricanSouth AmericanSouth American IndianSoviet UnionSpaniardSpanishSpanish AmericanSpanish American IndianSri LankanSubsaharan AfricanSudaneseSwedishSwissSyrianThaiTrinidadian and TobagonianTurkishU.S. Virgin IslanderUgandanUkrainianUruguayanVenezuelanVietnameseWelshWest IndianYugoslavianZimbabwean
Ancestry (Percentage)
AfghanAfricanAlbanianAlsatianAmericanApacheArabArgentineanArmenianAssyrian / Chaldean / SyriacAustralianAustrianBahamianBarbadianBasqueBelgianBelizeanBermudanBhutaneseBlackfeetBolivianBrazilianBritishBritish West IndianBulgarianBurmeseCajunCambodianCanadianCape VerdeanCarpatho RusynCelticCentral AmericanCentral American IndianCherokeeChickasawChileanChippewaChoctawColombianCosta RicanCreekCroatianCubanCypriotCzechCzechoslovakianDanishDelawareDominicanDutchDutch West IndianEastern EuropeanEcuadorianEgyptianEnglishEstonianEthiopianEuropeanFilipinoFinnishFrenchFrench American IndianFrench CanadianGermanGhanaianGreekGuamanian / ChamorroGuatemalanGuyaneseHaitianHmongHonduranHungarianIcelanderIndian (Asian)IndonesianIranianIraqiIrishIroquoisIsraeliItalianJamaicanJapaneseJordanianKenyanKoreanLaotianLatvianLebaneseLiberianLithuanianLuxembourgerMacedonianMalaysianMalteseMexicanMexican American IndianMongolianMoroccanNative HawaiianNew ZealanderNicaraguanNigerianNorthern EuropeanNorwegianOkinawanPakistaniPalestinianPanamanianParaguayanPennsylvania GermanPeruvianPolishPortuguesePuebloPuerto RicanRomanianRussianSalvadoranSamoanScandinavianScotch-IrishScottishSenegaleseSerbianSierra LeoneanSiouxSlavicSlovakSloveneSomaliSouth AfricanSouth AmericanSouth American IndianSoviet UnionSpaniardSpanishSpanish AmericanSpanish American IndianSri LankanSubsaharan AfricanSudaneseSwedishSwissSyrianThaiTrinidadian and TobagonianTurkishU.S. Virgin IslanderUgandanUkrainianUruguayanVenezuelanVietnameseWelshWest IndianYugoslavianZimbabwean
Immigrant Origin (Total)
AfghanistanAfricaAlbaniaArgentinaArmeniaAsiaAustraliaAustriaBahamasBangladeshBarbadosBelarusBelgiumBelizeBoliviaBosnia and HerzegovinaBrazilBulgariaBurma / MyanmarCambodiaCameroonCanadaCaribbeanCentral AmericaChileChinaColombiaCongoCosta RicaCroatiaCubaCzechoslovakiaDenmarkDominicaDominican RepublicEastern AfricaEastern AsiaEastern EuropeEcuadorEgyptEl SalvadorEnglandEritreaEthiopiaEuropeFranceGermanyGhanaGreeceGrenadaGuatemalaGuyanaHaitiHondurasHong KongHungaryIndiaIndonesiaIranIraqIrelandIsraelItalyJamaicaJapanJordanKazakhstanKenyaKoreaKuwaitLatin AmericaLatviaLebanonLiberiaLithuaniaMalaysiaMexicoMiddle AfricaMoldovaMoroccoNepalNetherlandsNicaraguaNigeriaNorth MacedoniaNorthern AfricaNorthern EuropeNorwayOceaniaPakistanPanamaPeruPhilippinesPolandPortugalRomaniaRussiaSaudi ArabiaScotlandSenegalSerbiaSierra LeoneSingaporeSomaliaSouth AfricaSouth AmericaSouth Central AsiaSouth Eastern AsiaSouthern EuropeSpainSri LankaSt. Vincent and the GrenadinesSudanSwedenSwitzerlandSyriaTaiwanThailandTrinidad and TobagoTurkeyUgandaUkraineUruguayUzbekistanVenezuelaVietnamWest IndiesWestern AfricaWestern AsiaWestern EuropeYemenZaireZimbabwe
Immigrant Origin (Percentage)
AfghanistanAfricaAlbaniaArgentinaArmeniaAsiaAustraliaAustriaBahamasBangladeshBarbadosBelarusBelgiumBelizeBoliviaBosnia and HerzegovinaBrazilBulgariaBurma / MyanmarCambodiaCameroonCanadaCaribbeanCentral AmericaChileChinaColombiaCongoCosta RicaCroatiaCubaCzechoslovakiaDenmarkDominicaDominican RepublicEastern AfricaEastern AsiaEastern EuropeEcuadorEgyptEl SalvadorEnglandEritreaEthiopiaEuropeFranceGermanyGhanaGreeceGrenadaGuatemalaGuyanaHaitiHondurasHong KongHungaryIndiaIndonesiaIranIraqIrelandIsraelItalyJamaicaJapanJordanKazakhstanKenyaKoreaKuwaitLatin AmericaLatviaLebanonLiberiaLithuaniaMalaysiaMexicoMiddle AfricaMoldovaMoroccoNepalNetherlandsNicaraguaNigeriaNorth MacedoniaNorthern AfricaNorthern EuropeNorwayOceaniaPakistanPanamaPeruPhilippinesPolandPortugalRomaniaRussiaSaudi ArabiaScotlandSenegalSerbiaSierra LeoneSingaporeSomaliaSouth AfricaSouth AmericaSouth Central AsiaSouth Eastern AsiaSouthern EuropeSpainSri LankaSt. Vincent and the GrenadinesSudanSwedenSwitzerlandSyriaTaiwanThailandTrinidad and TobagoTurkeyUgandaUkraineUruguayUzbekistanVenezuelaVietnamWest IndiesWestern AfricaWestern AsiaWestern EuropeYemenZaireZimbabwe
Income
Income (Families)
Income (Households)
Poverty
Poverty (Families)
Unemployment
Employment Occupations
Employment Industries
Employer Class
Commute Time
Commute Means
School Enrollment
Education by Degree Field
Occupancy
Finances
Physical Characteristics
New York
Compare Zip Codes
Comparison Subject

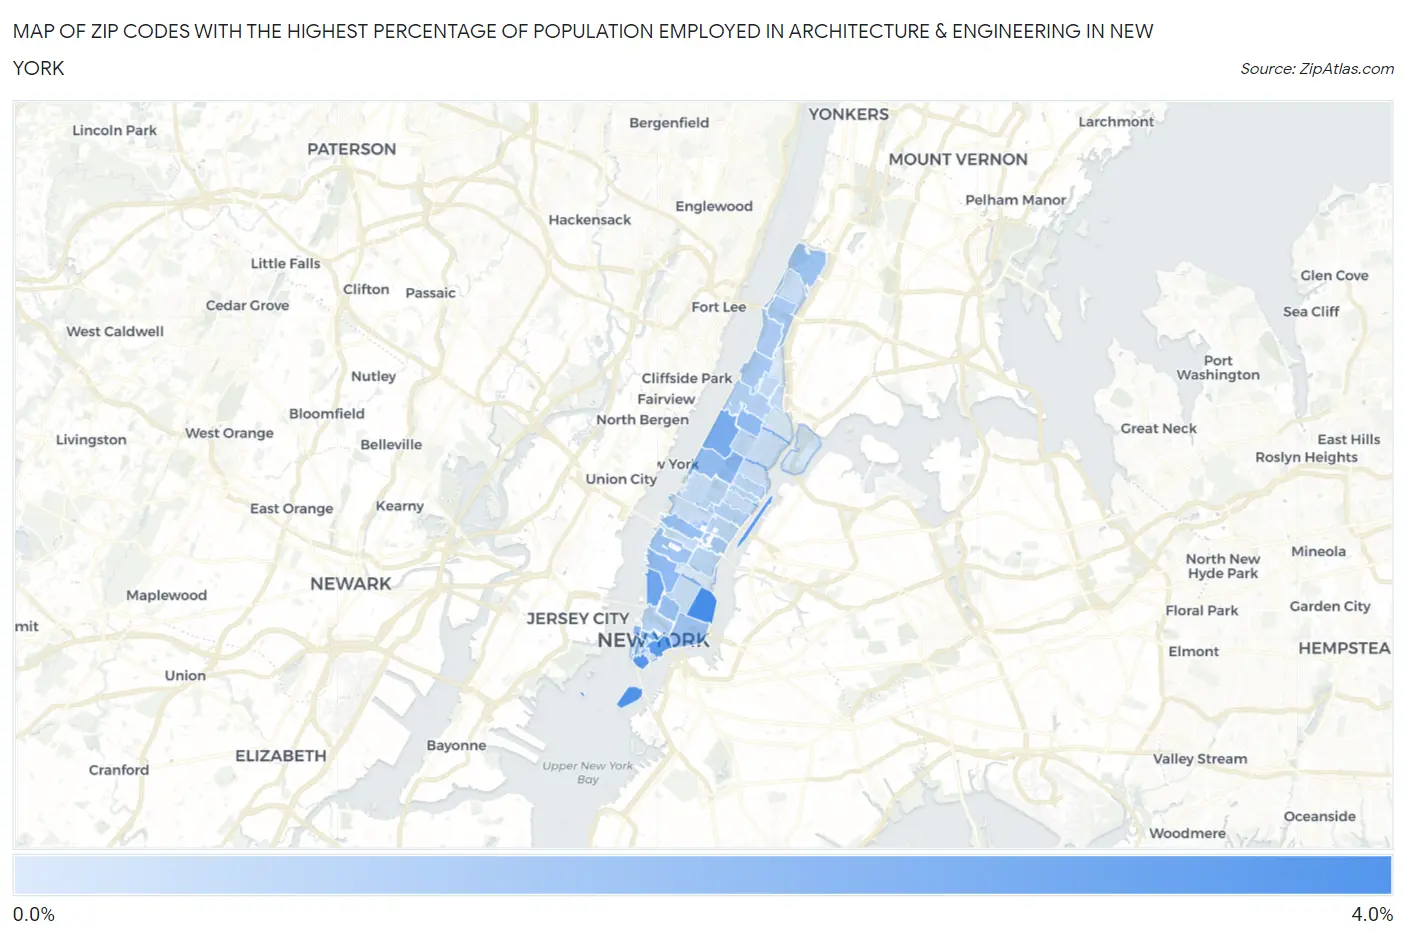
Map of Zip Codes with the Highest Percentage of Population Employed in Architecture & Engineering in New York

0.0%
4.0%
Zip Codes with the Highest Percentage of Population Employed in Architecture & Engineering in New York Map

Zip Codes with the Highest Percentage of Population Employed in Architecture & Engineering in New York, NY

Zip Code % Employed vs State vs National
1.100093.2%1.6%(+1.55)#2642.1%(+1.02)#4,563
2.100042.9%1.6%(+1.27)#3132.1%(+0.730)#5,495
3.100382.8%1.6%(+1.20)#3242.1%(+0.665)#5,739
4.100442.8%1.6%(+1.14)#3442.1%(+0.601)#5,965
5.100142.5%1.6%(+0.841)#4012.1%(+0.302)#7,222
6.100252.2%1.6%(+0.567)#4712.1%(+0.028)#8,612
7.102822.0%1.6%(+0.377)#5292.1%(-0.162)#9,693
8.100071.9%1.6%(+0.327)#5472.1%(-0.212)#9,997
9.100261.8%1.6%(+0.164)#6082.1%(-0.375)#10,984
10.100111.8%1.6%(+0.142)#6192.1%(-0.397)#11,128
11.100241.7%1.6%(+0.113)#6312.1%(-0.425)#11,336
12.100361.7%1.6%(+0.079)#6472.1%(-0.460)#11,582
13.100121.6%1.6%(+0.028)#6662.1%(-0.510)#11,921
14.100011.5%1.6%(-0.109)#7182.1%(-0.648)#12,875
15.100341.5%1.6%(-0.126)#7262.1%(-0.665)#13,001
16.100021.5%1.6%(-0.134)#7332.1%(-0.673)#13,047
17.100171.4%1.6%(-0.196)#7642.1%(-0.735)#13,479
18.100311.3%1.6%(-0.300)#8162.1%(-0.839)#14,246
19.100331.3%1.6%(-0.341)#8422.1%(-0.880)#14,532
20.100321.2%1.6%(-0.391)#8672.1%(-0.930)#14,935
21.100271.1%1.6%(-0.501)#9312.1%(-1.04)#15,780
22.100651.1%1.6%(-0.507)#9362.1%(-1.05)#15,824
23.100131.1%1.6%(-0.548)#9502.1%(-1.09)#16,154
24.100160.97%1.6%(-0.640)#1,0002.1%(-1.18)#16,830
25.100220.97%1.6%(-0.640)#1,0012.1%(-1.18)#16,831
26.100280.97%1.6%(-0.645)#1,0062.1%(-1.18)#16,876
27.100750.96%1.6%(-0.647)#1,0082.1%(-1.19)#16,893
28.100230.81%1.6%(-0.801)#1,0702.1%(-1.34)#18,050
29.100370.80%1.6%(-0.807)#1,0752.1%(-1.35)#18,111
30.100300.79%1.6%(-0.819)#1,0802.1%(-1.36)#18,189
31.100180.78%1.6%(-0.831)#1,0832.1%(-1.37)#18,289
32.100030.75%1.6%(-0.860)#1,0972.1%(-1.40)#18,538
33.101280.72%1.6%(-0.890)#1,1062.1%(-1.43)#18,758
34.100290.70%1.6%(-0.907)#1,1142.1%(-1.45)#18,865
35.100210.70%1.6%(-0.909)#1,1152.1%(-1.45)#18,891
36.100190.70%1.6%(-0.909)#1,1162.1%(-1.45)#18,892
37.100060.66%1.6%(-0.948)#1,1312.1%(-1.49)#19,160
38.100400.66%1.6%(-0.951)#1,1342.1%(-1.49)#19,182
39.100050.57%1.6%(-1.04)#1,1692.1%(-1.58)#19,864
40.102800.46%1.6%(-1.15)#1,2102.1%(-1.69)#20,499
41.100350.44%1.6%(-1.17)#1,2232.1%(-1.71)#20,696
42.100100.41%1.6%(-1.20)#1,2342.1%(-1.73)#20,856
43.100390.33%1.6%(-1.28)#1,2662.1%(-1.82)#21,409

Common Questions

What are the Top 10 Zip Codes with the Highest Percentage of Population Employed in Architecture & Engineering in New York, NY?
Top 10 Zip Codes with the Highest Percentage of Population Employed in Architecture & Engineering in New York, NY are:
#1
3.2%
#2
2.9%
#3
2.8%
#4
2.8%
#5
2.5%
#6
2.2%
#7
2.0%
#8
1.9%
#9
1.8%
#10
1.8%
What zip code has the Highest Percentage of Population Employed in Architecture & Engineering in New York, NY?
10009 has the Highest Percentage of Population Employed in Architecture & Engineering in New York, NY with 3.2%.
What is the Percentage of Population Employed in Architecture & Engineering in New York, NY?
Percentage of Population Employed in Architecture & Engineering in New York is 1.2%.
What is the Percentage of Population Employed in Architecture & Engineering in New York?
Percentage of Population Employed in Architecture & Engineering in New York is 1.6%.
What is the Percentage of Population Employed in Architecture & Engineering in the United States?
Percentage of Population Employed in Architecture & Engineering in the United States is 2.1%.