Tappan, NY Map & Demographics
Tappan Map
Tappan Overview
$66,274
PER CAPITA INCOME
$188,092
AVG FAMILY INCOME
$171,125
AVG HOUSEHOLD INCOME
40.0%
WAGE / INCOME GAP [ % ]
60.0¢/ $1
WAGE / INCOME GAP [ $ ]
0.38
INEQUALITY / GINI INDEX
7,016
TOTAL POPULATION
3,319
MALE POPULATION
3,697
FEMALE POPULATION
89.78
MALES / 100 FEMALES
111.39
FEMALES / 100 MALES
45.9
MEDIAN AGE
3.3
AVG FAMILY SIZE
3.0
AVG HOUSEHOLD SIZE
4,168
LABOR FORCE [ PEOPLE ]
69.5%
PERCENT IN LABOR FORCE
8.4%
UNEMPLOYMENT RATE
Tappan Zip Codes
Tappan Area Codes
Income in Tappan
Income Overview in Tappan
Per Capita Income in Tappan is $66,274, while median incomes of families and households are $188,092 and $171,125 respectively.
| Characteristic | Number | Measure |
| Per Capita Income | 7,016 | $66,274 |
| Median Family Income | 1,985 | $188,092 |
| Mean Family Income | 1,985 | $214,965 |
| Median Household Income | 2,342 | $171,125 |
| Mean Household Income | 2,342 | $194,216 |
| Income Deficit | 1,985 | $0 |
| Wage / Income Gap (%) | 7,016 | 40.03% |
| Wage / Income Gap ($) | 7,016 | 59.97¢ per $1 |
| Gini / Inequality Index | 7,016 | 0.38 |
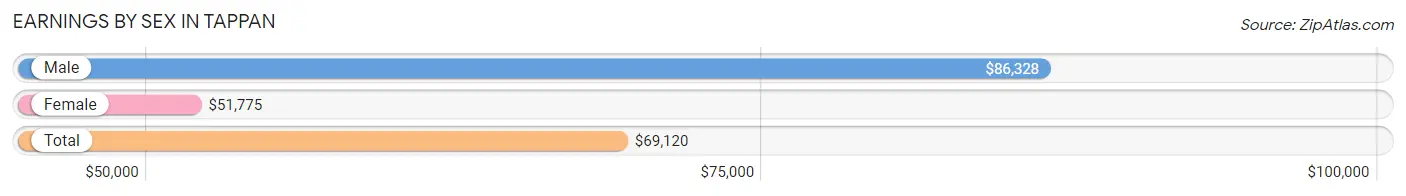
Earnings by Sex in Tappan
Average Earnings in Tappan are $69,120, $86,328 for men and $51,775 for women, a difference of 40.0%.
| Sex | Number | Average Earnings |
| Male | 2,215 (51.7%) | $86,328 |
| Female | 2,065 (48.2%) | $51,775 |
| Total | 4,280 (100.0%) | $69,120 |
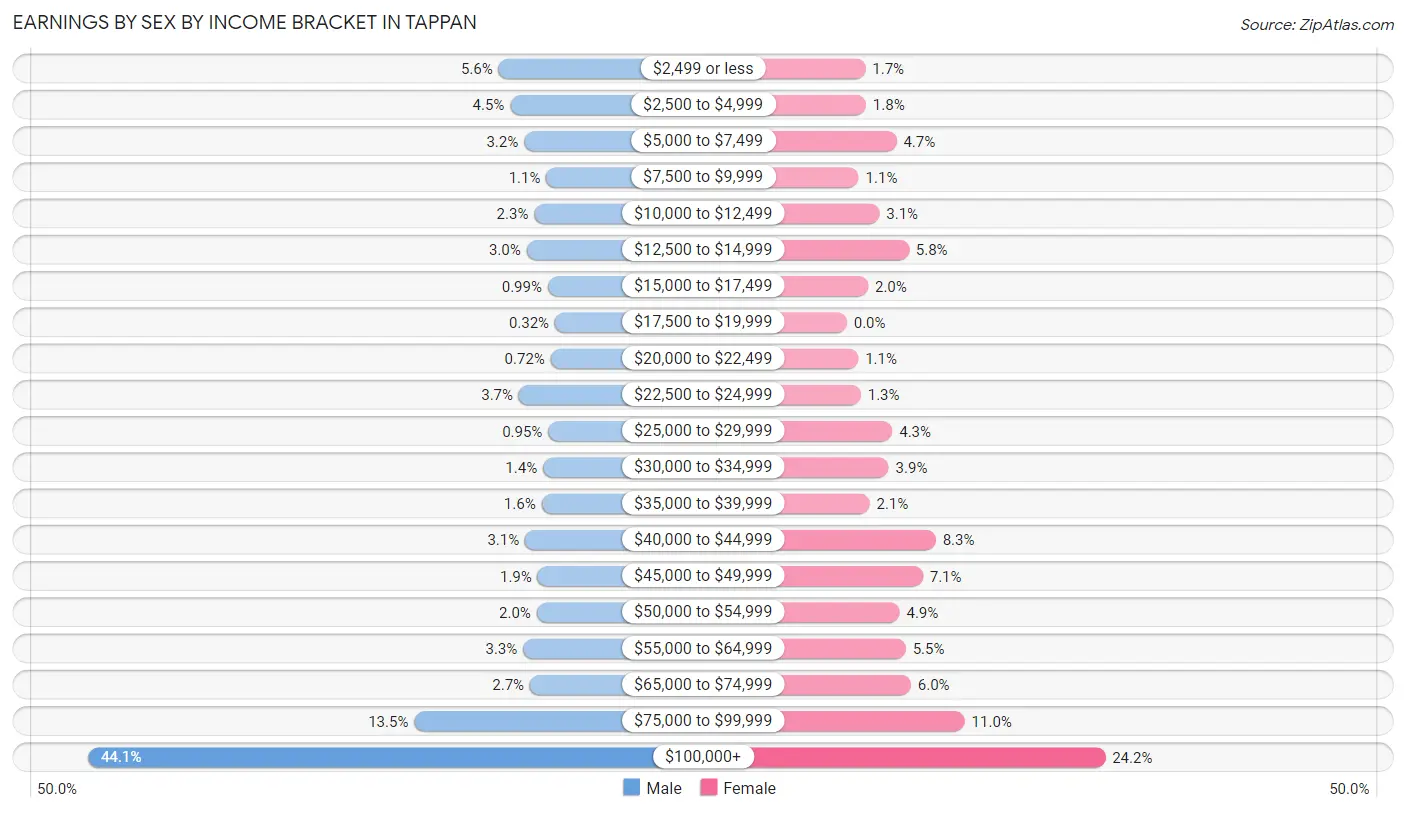
Earnings by Sex by Income Bracket in Tappan
The most common earnings brackets in Tappan are $100,000+ for men (976 | 44.1%) and $100,000+ for women (500 | 24.2%).
| Income | Male | Female |
| $2,499 or less | 124 (5.6%) | 36 (1.7%) |
| $2,500 to $4,999 | 100 (4.5%) | 37 (1.8%) |
| $5,000 to $7,499 | 71 (3.2%) | 96 (4.6%) |
| $7,500 to $9,999 | 25 (1.1%) | 23 (1.1%) |
| $10,000 to $12,499 | 50 (2.3%) | 63 (3.0%) |
| $12,500 to $14,999 | 66 (3.0%) | 120 (5.8%) |
| $15,000 to $17,499 | 22 (1.0%) | 41 (2.0%) |
| $17,500 to $19,999 | 7 (0.3%) | 0 (0.0%) |
| $20,000 to $22,499 | 16 (0.7%) | 22 (1.1%) |
| $22,500 to $24,999 | 82 (3.7%) | 27 (1.3%) |
| $25,000 to $29,999 | 21 (0.9%) | 88 (4.3%) |
| $30,000 to $34,999 | 32 (1.4%) | 81 (3.9%) |
| $35,000 to $39,999 | 35 (1.6%) | 44 (2.1%) |
| $40,000 to $44,999 | 69 (3.1%) | 172 (8.3%) |
| $45,000 to $49,999 | 43 (1.9%) | 147 (7.1%) |
| $50,000 to $54,999 | 45 (2.0%) | 102 (4.9%) |
| $55,000 to $64,999 | 73 (3.3%) | 114 (5.5%) |
| $65,000 to $74,999 | 59 (2.7%) | 124 (6.0%) |
| $75,000 to $99,999 | 299 (13.5%) | 228 (11.0%) |
| $100,000+ | 976 (44.1%) | 500 (24.2%) |
| Total | 2,215 (100.0%) | 2,065 (100.0%) |
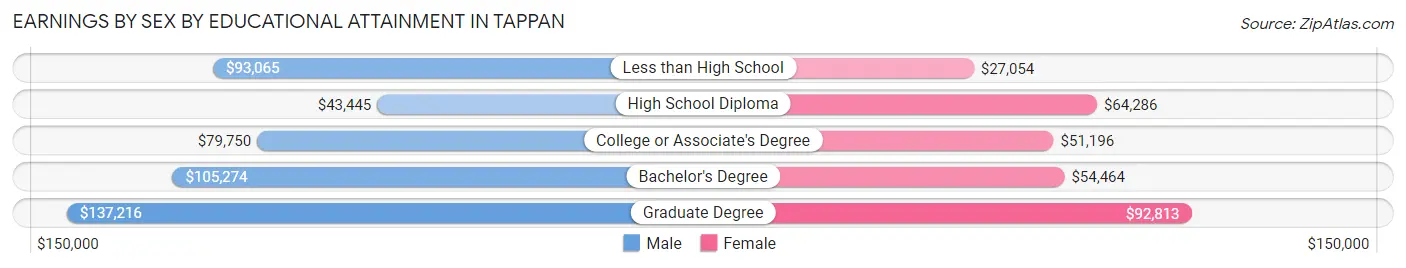
Earnings by Sex by Educational Attainment in Tappan
Average earnings in Tappan are $101,023 for men and $61,685 for women, a difference of 38.9%. Men with an educational attainment of graduate degree enjoy the highest average annual earnings of $137,216, while those with high school diploma education earn the least with $43,445. Women with an educational attainment of graduate degree earn the most with the average annual earnings of $92,813, while those with less than high school education have the smallest earnings of $27,054.
| Educational Attainment | Male Income | Female Income |
| Less than High School | $93,065 | $27,054 |
| High School Diploma | $43,445 | $64,286 |
| College or Associate's Degree | $79,750 | $51,196 |
| Bachelor's Degree | $105,274 | $54,464 |
| Graduate Degree | $137,216 | $92,813 |
| Total | $101,023 | $61,685 |
Family Income in Tappan
Family Income Brackets in Tappan
According to the Tappan family income data, there are 869 families falling into the $200,000+ income range, which is the most common income bracket and makes up 43.8% of all families.
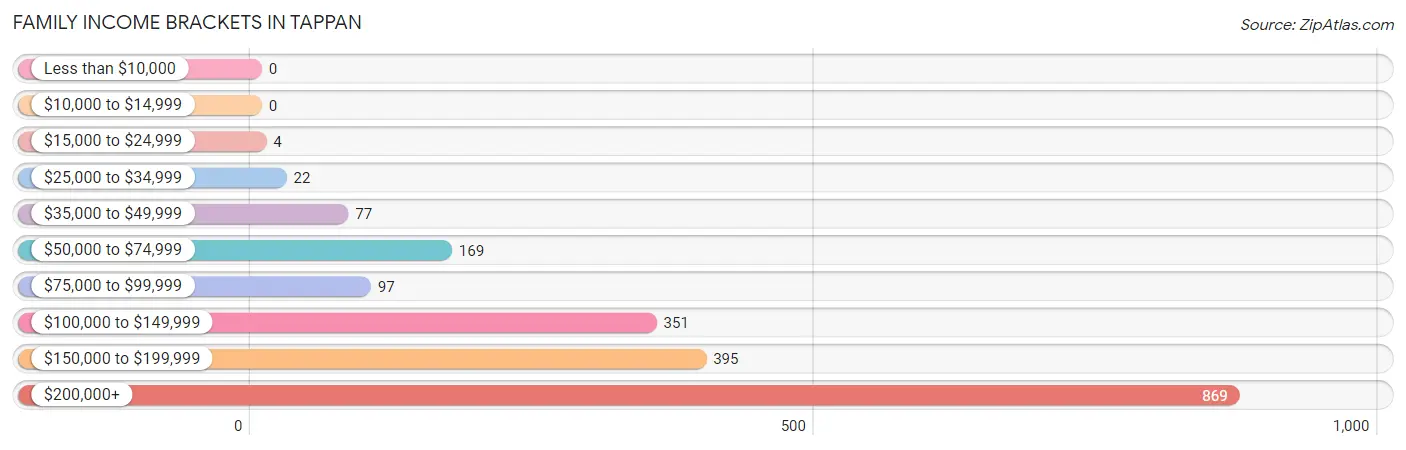
| Income Bracket | # Families | % Families |
| Less than $10,000 | 0 | 0.0% |
| $10,000 to $14,999 | 0 | 0.0% |
| $15,000 to $24,999 | 4 | 0.2% |
| $25,000 to $34,999 | 22 | 1.1% |
| $35,000 to $49,999 | 77 | 3.9% |
| $50,000 to $74,999 | 169 | 8.5% |
| $75,000 to $99,999 | 97 | 4.9% |
| $100,000 to $149,999 | 351 | 17.7% |
| $150,000 to $199,999 | 395 | 19.9% |
| $200,000+ | 869 | 43.8% |
Family Income by Famaliy Size in Tappan
6-person families (54 | 2.7%) account for the highest median family income in Tappan with $219,844 per family, while 2-person families (663 | 33.4%) have the highest median income of $80,772 per family member.
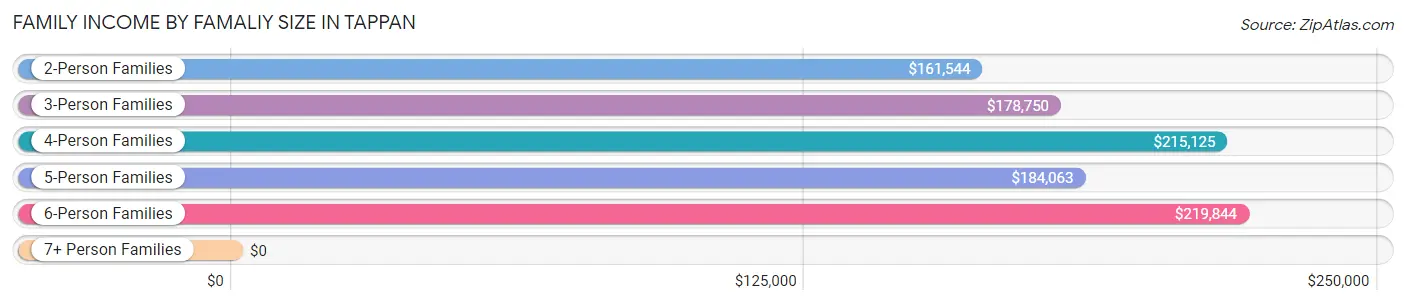
| Income Bracket | # Families | Median Income |
| 2-Person Families | 663 (33.4%) | $161,544 |
| 3-Person Families | 488 (24.6%) | $178,750 |
| 4-Person Families | 586 (29.5%) | $215,125 |
| 5-Person Families | 194 (9.8%) | $184,063 |
| 6-Person Families | 54 (2.7%) | $219,844 |
| 7+ Person Families | 0 (0.0%) | $0 |
| Total | 1,985 (100.0%) | $188,092 |
Family Income by Number of Earners in Tappan
The median family income in Tappan is $188,092, with families comprising 3+ earners (511) having the highest median family income of $230,216, while families with no earners (246) have the lowest median family income of $100,547, accounting for 25.7% and 12.4% of families, respectively.
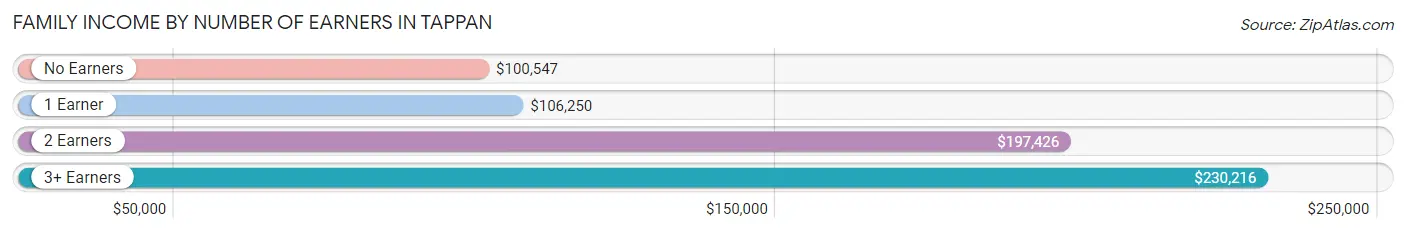
| Number of Earners | # Families | Median Income |
| No Earners | 246 (12.4%) | $100,547 |
| 1 Earner | 245 (12.3%) | $106,250 |
| 2 Earners | 983 (49.5%) | $197,426 |
| 3+ Earners | 511 (25.7%) | $230,216 |
| Total | 1,985 (100.0%) | $188,092 |
Household Income in Tappan
Household Income Brackets in Tappan
With 890 households falling in the category, the $200,000+ income range is the most frequent in Tappan, accounting for 38.0% of all households.
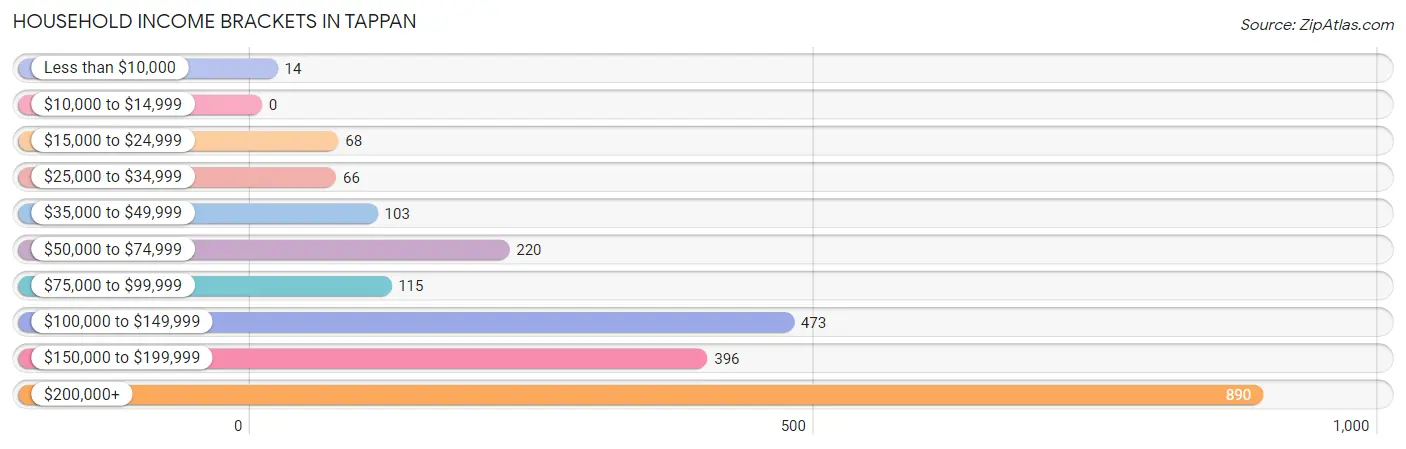
| Income Bracket | # Households | % Households |
| Less than $10,000 | 14 | 0.6% |
| $10,000 to $14,999 | 0 | 0.0% |
| $15,000 to $24,999 | 68 | 2.9% |
| $25,000 to $34,999 | 66 | 2.8% |
| $35,000 to $49,999 | 103 | 4.4% |
| $50,000 to $74,999 | 220 | 9.4% |
| $75,000 to $99,999 | 115 | 4.9% |
| $100,000 to $149,999 | 473 | 20.2% |
| $150,000 to $199,999 | 396 | 16.9% |
| $200,000+ | 890 | 38.0% |
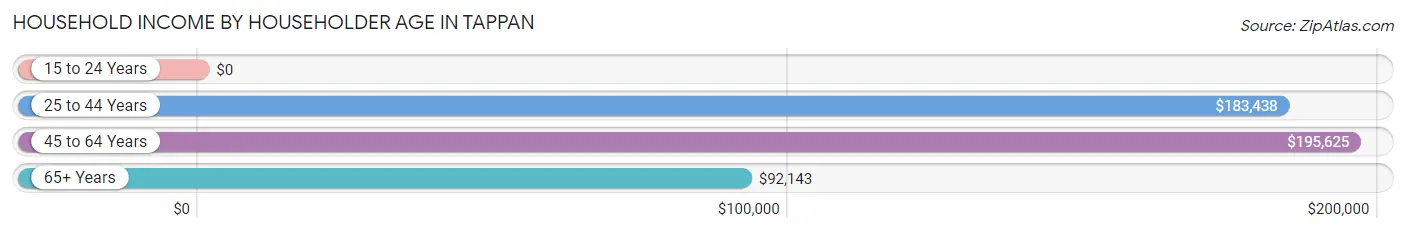
Household Income by Householder Age in Tappan
The median household income in Tappan is $171,125, with the highest median household income of $195,625 found in the 45 to 64 years age bracket for the primary householder. A total of 1,176 households (50.2%) fall into this category.
| Income Bracket | # Households | Median Income |
| 15 to 24 Years | 0 (0.0%) | $0 |
| 25 to 44 Years | 434 (18.5%) | $183,438 |
| 45 to 64 Years | 1,176 (50.2%) | $195,625 |
| 65+ Years | 732 (31.3%) | $92,143 |
| Total | 2,342 (100.0%) | $171,125 |
Poverty in Tappan
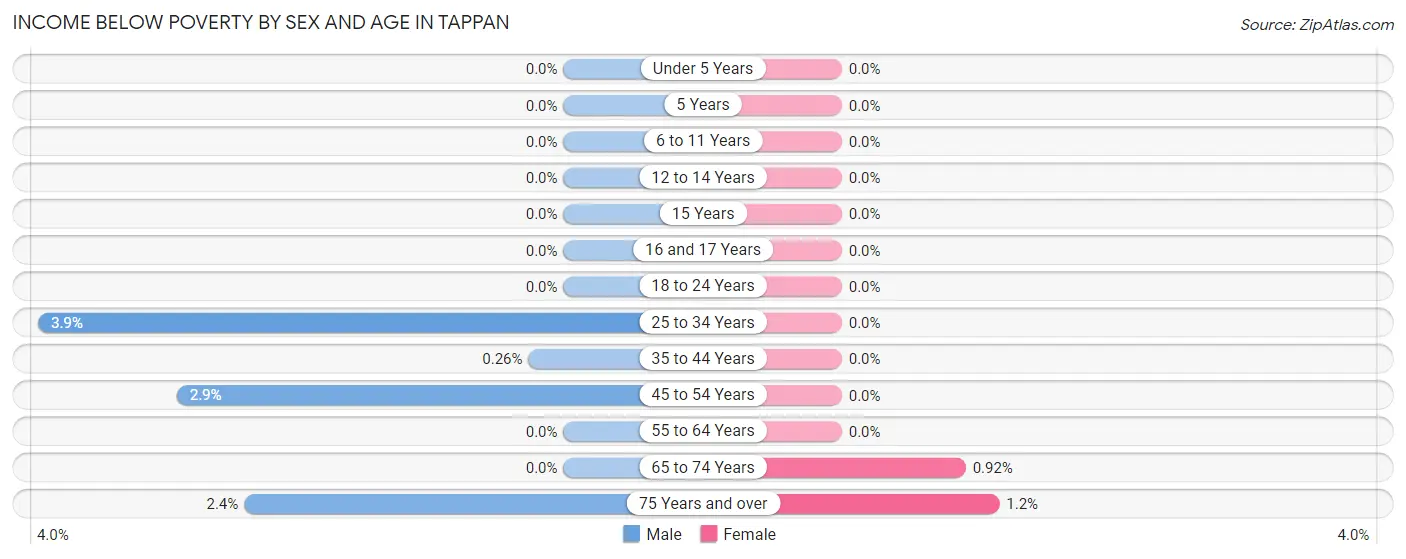
Income Below Poverty by Sex and Age in Tappan
With 1.1% poverty level for males and 0.2% for females among the residents of Tappan, 25 to 34 year old males and 75 year old and over females are the most vulnerable to poverty, with 13 males (3.9%) and 6 females (1.2%) in their respective age groups living below the poverty level.
| Age Bracket | Male | Female |
| Under 5 Years | 0 (0.0%) | 0 (0.0%) |
| 5 Years | 0 (0.0%) | 0 (0.0%) |
| 6 to 11 Years | 0 (0.0%) | 0 (0.0%) |
| 12 to 14 Years | 0 (0.0%) | 0 (0.0%) |
| 15 Years | 0 (0.0%) | 0 (0.0%) |
| 16 and 17 Years | 0 (0.0%) | 0 (0.0%) |
| 18 to 24 Years | 0 (0.0%) | 0 (0.0%) |
| 25 to 34 Years | 13 (3.9%) | 0 (0.0%) |
| 35 to 44 Years | 1 (0.3%) | 0 (0.0%) |
| 45 to 54 Years | 15 (2.9%) | 0 (0.0%) |
| 55 to 64 Years | 0 (0.0%) | 0 (0.0%) |
| 65 to 74 Years | 0 (0.0%) | 3 (0.9%) |
| 75 Years and over | 6 (2.4%) | 6 (1.2%) |
| Total | 35 (1.1%) | 9 (0.2%) |
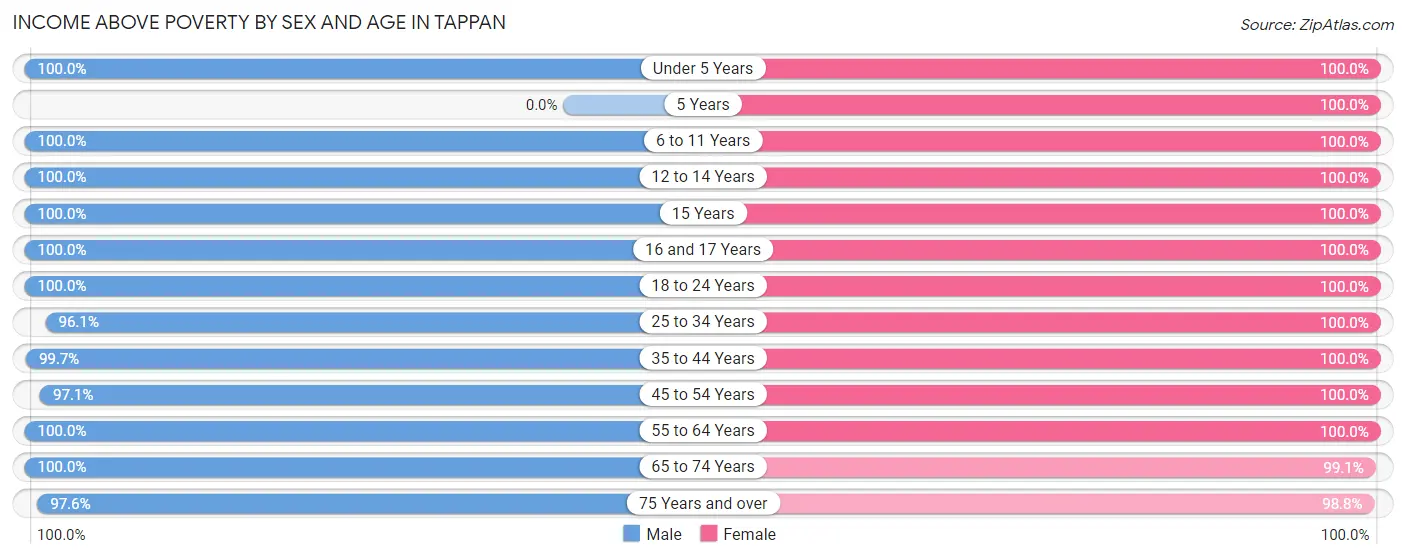
Income Above Poverty by Sex and Age in Tappan
According to the poverty statistics in Tappan, males aged under 5 years and females aged under 5 years are the age groups that are most secure financially, with 100.0% of males and 100.0% of females in these age groups living above the poverty line.
| Age Bracket | Male | Female |
| Under 5 Years | 110 (100.0%) | 63 (100.0%) |
| 5 Years | 0 (0.0%) | 53 (100.0%) |
| 6 to 11 Years | 226 (100.0%) | 220 (100.0%) |
| 12 to 14 Years | 108 (100.0%) | 141 (100.0%) |
| 15 Years | 39 (100.0%) | 41 (100.0%) |
| 16 and 17 Years | 122 (100.0%) | 110 (100.0%) |
| 18 to 24 Years | 325 (100.0%) | 297 (100.0%) |
| 25 to 34 Years | 320 (96.1%) | 360 (100.0%) |
| 35 to 44 Years | 383 (99.7%) | 461 (100.0%) |
| 45 to 54 Years | 507 (97.1%) | 597 (100.0%) |
| 55 to 64 Years | 634 (100.0%) | 499 (100.0%) |
| 65 to 74 Years | 255 (100.0%) | 324 (99.1%) |
| 75 Years and over | 247 (97.6%) | 509 (98.8%) |
| Total | 3,276 (98.9%) | 3,675 (99.8%) |
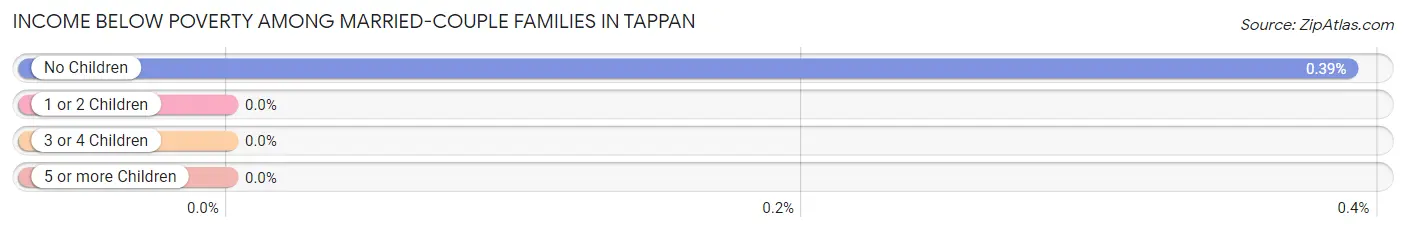
Income Below Poverty Among Married-Couple Families in Tappan
The poverty statistics for married-couple families in Tappan show that 0.2% or 4 of the total 1,775 families live below the poverty line. Families with no children have the highest poverty rate of 0.4%, comprising of 4 families. On the other hand, families with 1 or 2 children have the lowest poverty rate of 0.0%, which includes 0 families.
| Children | Above Poverty | Below Poverty |
| No Children | 1,020 (99.6%) | 4 (0.4%) |
| 1 or 2 Children | 695 (100.0%) | 0 (0.0%) |
| 3 or 4 Children | 56 (100.0%) | 0 (0.0%) |
| 5 or more Children | 0 (0.0%) | 0 (0.0%) |
| Total | 1,771 (99.8%) | 4 (0.2%) |
Income Below Poverty Among Single-Parent Households in Tappan
| Children | Single Father | Single Mother |
| No Children | 0 (0.0%) | 0 (0.0%) |
| 1 or 2 Children | 0 (0.0%) | 0 (0.0%) |
| 3 or 4 Children | 0 (0.0%) | 0 (0.0%) |
| 5 or more Children | 0 (0.0%) | 0 (0.0%) |
| Total | 0 (0.0%) | 0 (0.0%) |
Income Below Poverty Among Married-Couple vs Single-Parent Households in Tappan
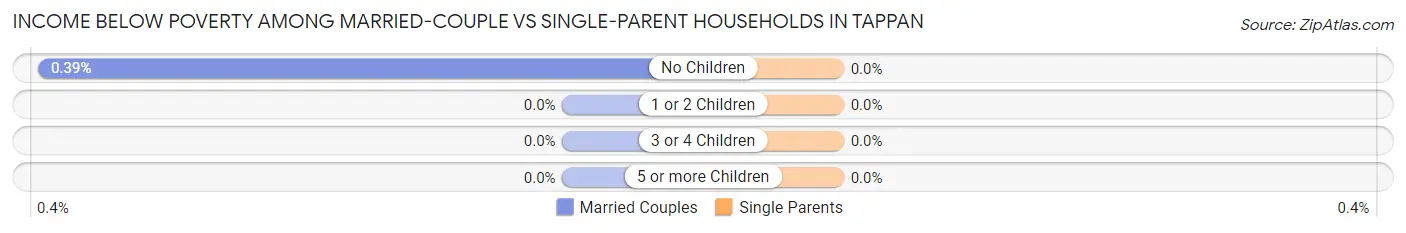
| Children | Married-Couple Families | Single-Parent Households |
| No Children | 4 (0.4%) | 0 (0.0%) |
| 1 or 2 Children | 0 (0.0%) | 0 (0.0%) |
| 3 or 4 Children | 0 (0.0%) | 0 (0.0%) |
| 5 or more Children | 0 (0.0%) | 0 (0.0%) |
| Total | 4 (0.2%) | 0 (0.0%) |
Race in Tappan
The most populous races in Tappan are White / Caucasian (5,069 | 72.3%), Asian (974 | 13.9%), and Hispanic or Latino (779 | 11.1%).
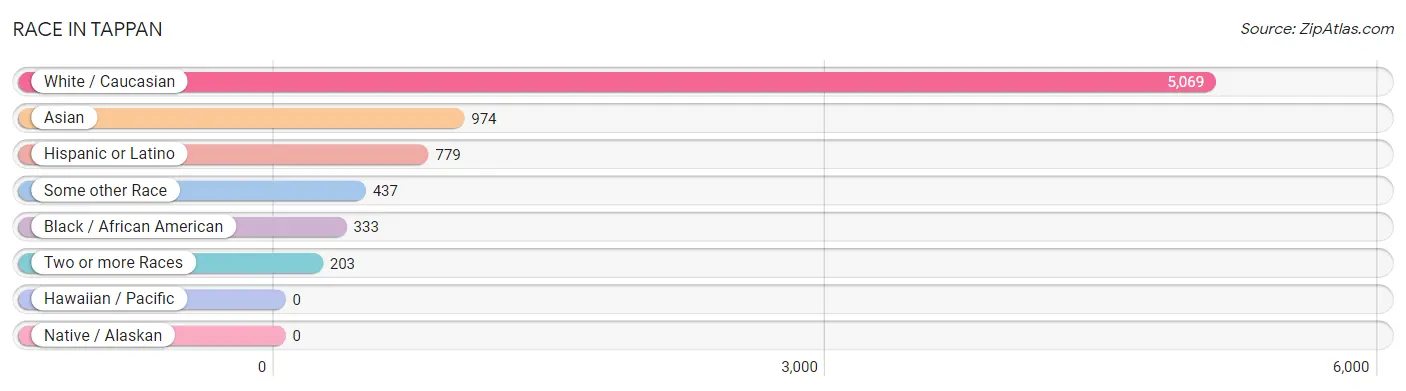
| Race | # Population | % Population |
| Asian | 974 | 13.9% |
| Black / African American | 333 | 4.8% |
| Hawaiian / Pacific | 0 | 0.0% |
| Hispanic or Latino | 779 | 11.1% |
| Native / Alaskan | 0 | 0.0% |
| White / Caucasian | 5,069 | 72.3% |
| Two or more Races | 203 | 2.9% |
| Some other Race | 437 | 6.2% |
| Total | 7,016 | 100.0% |
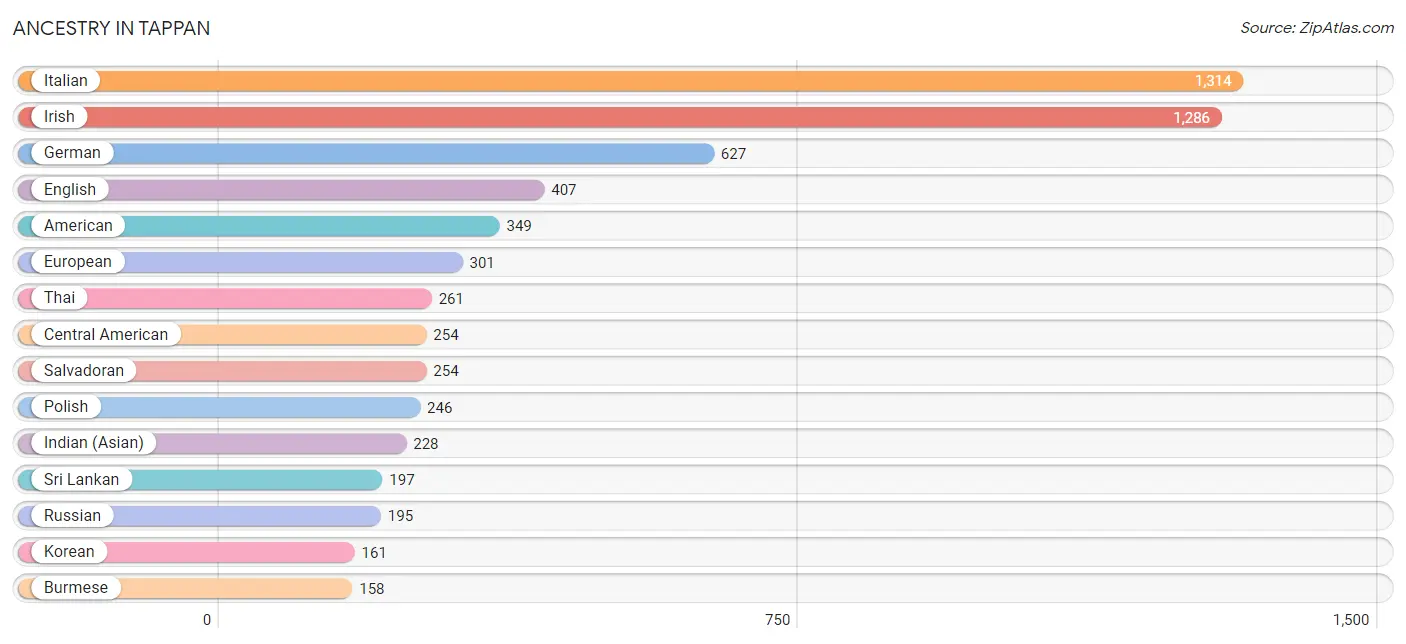
Ancestry in Tappan
The most populous ancestries reported in Tappan are Italian (1,314 | 18.7%), Irish (1,286 | 18.3%), German (627 | 8.9%), English (407 | 5.8%), and American (349 | 5.0%), together accounting for 56.8% of all Tappan residents.
| Ancestry | # Population | % Population |
| Albanian | 99 | 1.4% |
| American | 349 | 5.0% |
| Arab | 30 | 0.4% |
| Armenian | 105 | 1.5% |
| Australian | 11 | 0.2% |
| Austrian | 3 | 0.0% |
| Bolivian | 35 | 0.5% |
| Brazilian | 18 | 0.3% |
| British | 8 | 0.1% |
| Burmese | 158 | 2.2% |
| Canadian | 16 | 0.2% |
| Central American | 254 | 3.6% |
| Colombian | 62 | 0.9% |
| Croatian | 38 | 0.5% |
| Cypriot | 10 | 0.1% |
| Czech | 47 | 0.7% |
| Danish | 14 | 0.2% |
| Dominican | 149 | 2.1% |
| Dutch | 14 | 0.2% |
| Eastern European | 89 | 1.3% |
| Ecuadorian | 29 | 0.4% |
| Egyptian | 2 | 0.0% |
| English | 407 | 5.8% |
| European | 301 | 4.3% |
| French | 50 | 0.7% |
| German | 627 | 8.9% |
| Greek | 89 | 1.3% |
| Haitian | 30 | 0.4% |
| Hungarian | 18 | 0.3% |
| Indian (Asian) | 228 | 3.3% |
| Irish | 1,286 | 18.3% |
| Italian | 1,314 | 18.7% |
| Jamaican | 25 | 0.4% |
| Korean | 161 | 2.3% |
| Lebanese | 20 | 0.3% |
| Mexican | 39 | 0.6% |
| Polish | 246 | 3.5% |
| Portuguese | 43 | 0.6% |
| Puerto Rican | 137 | 1.9% |
| Romanian | 16 | 0.2% |
| Russian | 195 | 2.8% |
| Salvadoran | 254 | 3.6% |
| Scotch-Irish | 44 | 0.6% |
| Scottish | 51 | 0.7% |
| Senegalese | 32 | 0.5% |
| South African | 18 | 0.3% |
| South American | 140 | 2.0% |
| Spanish | 10 | 0.1% |
| Sri Lankan | 197 | 2.8% |
| Subsaharan African | 72 | 1.0% |
| Swedish | 19 | 0.3% |
| Swiss | 14 | 0.2% |
| Syrian | 8 | 0.1% |
| Thai | 261 | 3.7% |
| Turkish | 22 | 0.3% |
| Ukrainian | 9 | 0.1% |
| Venezuelan | 14 | 0.2% | View All 57 Rows |
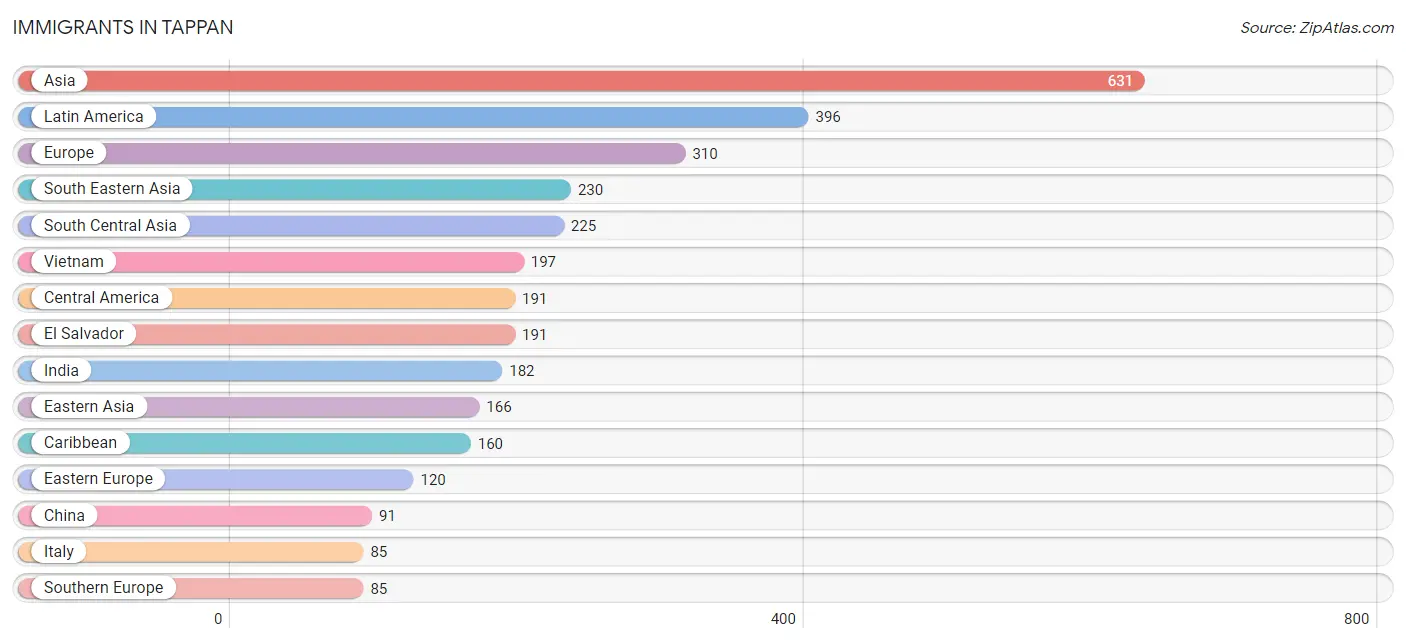
Immigrants in Tappan
The most numerous immigrant groups reported in Tappan came from Asia (631 | 9.0%), Latin America (396 | 5.6%), Europe (310 | 4.4%), South Eastern Asia (230 | 3.3%), and South Central Asia (225 | 3.2%), together accounting for 25.5% of all Tappan residents.
| Immigration Origin | # Population | % Population |
| Africa | 24 | 0.3% |
| Argentina | 12 | 0.2% |
| Asia | 631 | 9.0% |
| Australia | 4 | 0.1% |
| Bolivia | 2 | 0.0% |
| Canada | 65 | 0.9% |
| Caribbean | 160 | 2.3% |
| Central America | 191 | 2.7% |
| China | 91 | 1.3% |
| Colombia | 31 | 0.4% |
| Croatia | 3 | 0.0% |
| Czechoslovakia | 14 | 0.2% |
| Dominican Republic | 83 | 1.2% |
| Eastern Asia | 166 | 2.4% |
| Eastern Europe | 120 | 1.7% |
| Egypt | 6 | 0.1% |
| El Salvador | 191 | 2.7% |
| Europe | 310 | 4.4% |
| France | 17 | 0.2% |
| Germany | 10 | 0.1% |
| Haiti | 64 | 0.9% |
| Hong Kong | 24 | 0.3% |
| India | 182 | 2.6% |
| Indonesia | 27 | 0.4% |
| Ireland | 61 | 0.9% |
| Italy | 85 | 1.2% |
| Jamaica | 13 | 0.2% |
| Korea | 75 | 1.1% |
| Latin America | 396 | 5.6% |
| Nepal | 23 | 0.3% |
| Northern Africa | 6 | 0.1% |
| Northern Europe | 78 | 1.1% |
| Oceania | 4 | 0.1% |
| Pakistan | 20 | 0.3% |
| Philippines | 6 | 0.1% |
| Poland | 34 | 0.5% |
| Russia | 52 | 0.7% |
| South Africa | 18 | 0.3% |
| South America | 45 | 0.6% |
| South Central Asia | 225 | 3.2% |
| South Eastern Asia | 230 | 3.3% |
| Southern Europe | 85 | 1.2% |
| Vietnam | 197 | 2.8% |
| Western Asia | 10 | 0.1% |
| Western Europe | 27 | 0.4% | View All 45 Rows |
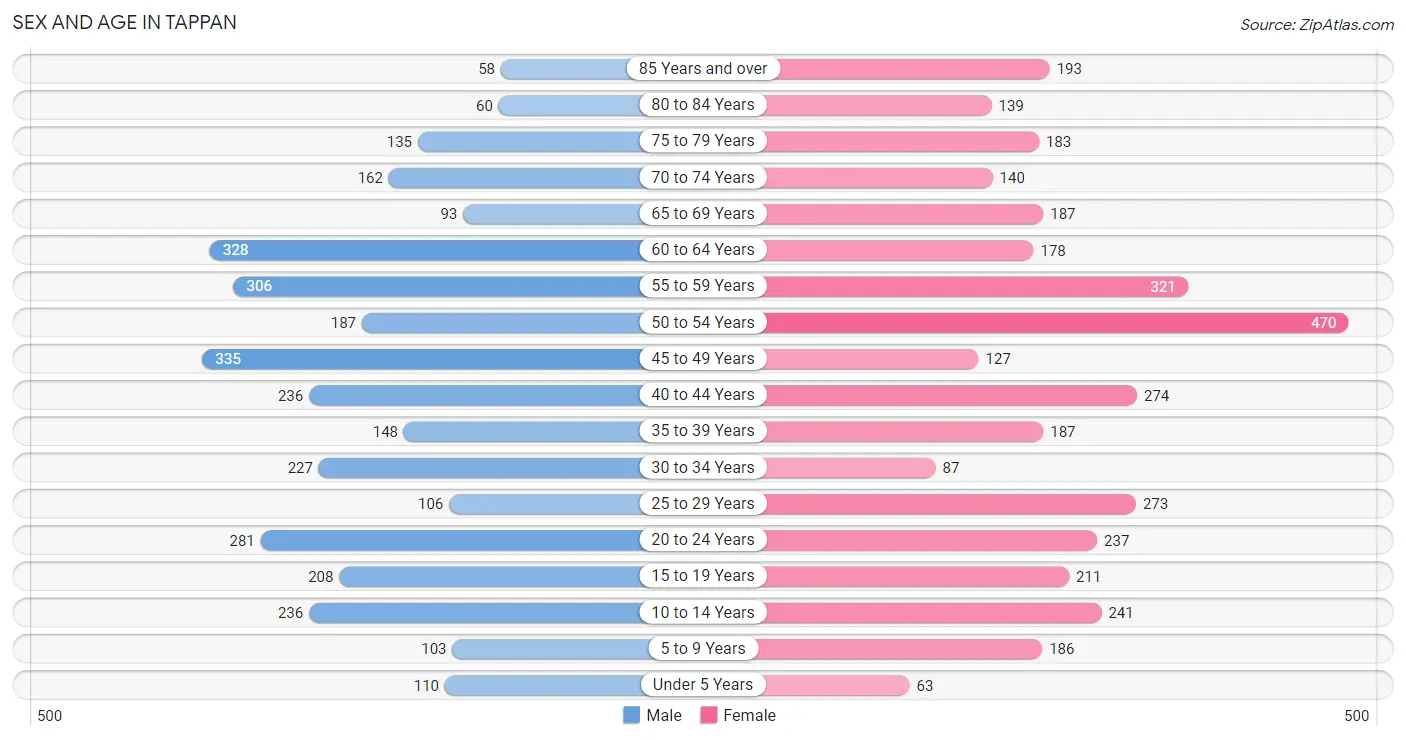
Sex and Age in Tappan
Sex and Age in Tappan
The most populous age groups in Tappan are 45 to 49 Years (335 | 10.1%) for men and 50 to 54 Years (470 | 12.7%) for women.
| Age Bracket | Male | Female |
| Under 5 Years | 110 (3.3%) | 63 (1.7%) |
| 5 to 9 Years | 103 (3.1%) | 186 (5.0%) |
| 10 to 14 Years | 236 (7.1%) | 241 (6.5%) |
| 15 to 19 Years | 208 (6.3%) | 211 (5.7%) |
| 20 to 24 Years | 281 (8.5%) | 237 (6.4%) |
| 25 to 29 Years | 106 (3.2%) | 273 (7.4%) |
| 30 to 34 Years | 227 (6.8%) | 87 (2.4%) |
| 35 to 39 Years | 148 (4.5%) | 187 (5.1%) |
| 40 to 44 Years | 236 (7.1%) | 274 (7.4%) |
| 45 to 49 Years | 335 (10.1%) | 127 (3.4%) |
| 50 to 54 Years | 187 (5.6%) | 470 (12.7%) |
| 55 to 59 Years | 306 (9.2%) | 321 (8.7%) |
| 60 to 64 Years | 328 (9.9%) | 178 (4.8%) |
| 65 to 69 Years | 93 (2.8%) | 187 (5.1%) |
| 70 to 74 Years | 162 (4.9%) | 140 (3.8%) |
| 75 to 79 Years | 135 (4.1%) | 183 (5.0%) |
| 80 to 84 Years | 60 (1.8%) | 139 (3.8%) |
| 85 Years and over | 58 (1.8%) | 193 (5.2%) |
| Total | 3,319 (100.0%) | 3,697 (100.0%) |
Families and Households in Tappan
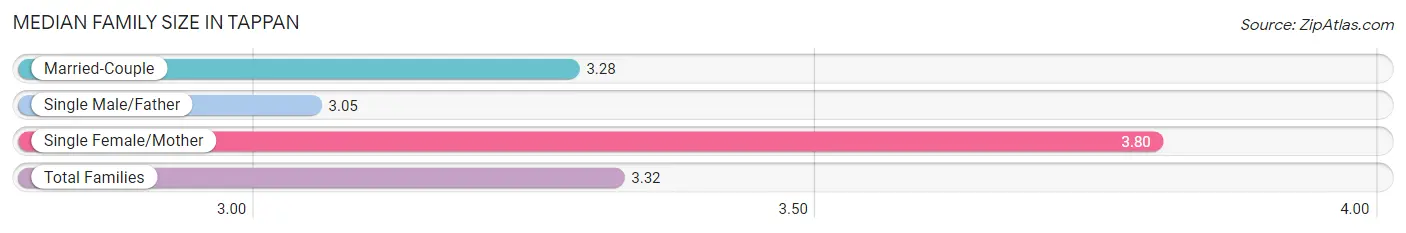
Median Family Size in Tappan
The median family size in Tappan is 3.32 persons per family, with single female/mother families (169 | 8.5%) accounting for the largest median family size of 3.8 persons per family. On the other hand, single male/father families (41 | 2.1%) represent the smallest median family size with 3.05 persons per family.
| Family Type | # Families | Family Size |
| Married-Couple | 1,775 (89.4%) | 3.28 |
| Single Male/Father | 41 (2.1%) | 3.05 |
| Single Female/Mother | 169 (8.5%) | 3.80 |
| Total Families | 1,985 (100.0%) | 3.32 |
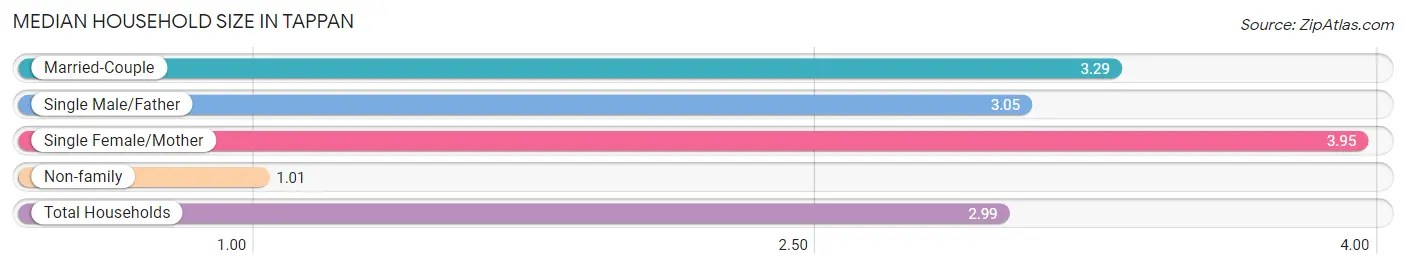
Median Household Size in Tappan
The median household size in Tappan is 2.99 persons per household, with single female/mother households (169 | 7.2%) accounting for the largest median household size of 3.95 persons per household. non-family households (357 | 15.2%) represent the smallest median household size with 1.01 persons per household.
| Household Type | # Households | Household Size |
| Married-Couple | 1,775 (75.8%) | 3.29 |
| Single Male/Father | 41 (1.8%) | 3.05 |
| Single Female/Mother | 169 (7.2%) | 3.95 |
| Non-family | 357 (15.2%) | 1.01 |
| Total Households | 2,342 (100.0%) | 2.99 |
Household Size by Marriage Status in Tappan
Out of a total of 2,342 households in Tappan, 1,985 (84.8%) are family households, while 357 (15.2%) are nonfamily households. The most numerous type of family households are 2-person households, comprising 663, and the most common type of nonfamily households are 1-person households, comprising 355.
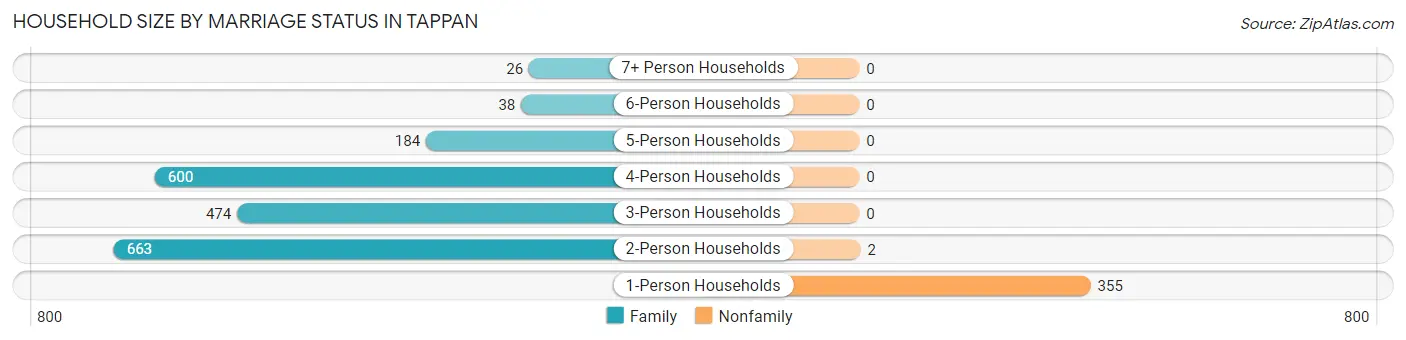
| Household Size | Family Households | Nonfamily Households |
| 1-Person Households | - | 355 (15.2%) |
| 2-Person Households | 663 (28.3%) | 2 (0.1%) |
| 3-Person Households | 474 (20.2%) | 0 (0.0%) |
| 4-Person Households | 600 (25.6%) | 0 (0.0%) |
| 5-Person Households | 184 (7.9%) | 0 (0.0%) |
| 6-Person Households | 38 (1.6%) | 0 (0.0%) |
| 7+ Person Households | 26 (1.1%) | 0 (0.0%) |
| Total | 1,985 (84.8%) | 357 (15.2%) |
Female Fertility in Tappan
Fertility by Age in Tappan
Average fertility rate in Tappan is 22.0 births per 1,000 women. Women in the age bracket of 20 to 34 years have the highest fertility rate with 54.0 births per 1,000 women. Women in the age bracket of 20 to 34 years acount for 100.0% of all women with births.
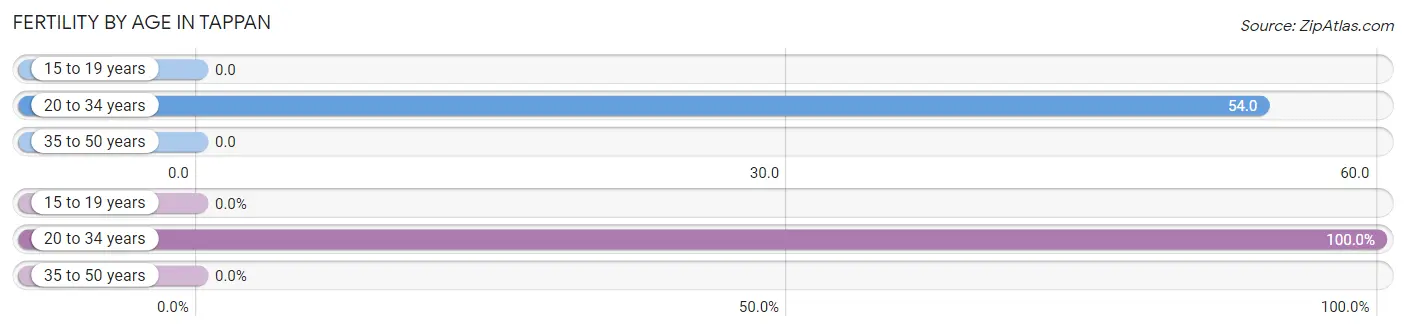
| Age Bracket | Women with Births | Births / 1,000 Women |
| 15 to 19 years | 0 (0.0%) | 0.0 |
| 20 to 34 years | 32 (100.0%) | 54.0 |
| 35 to 50 years | 0 (0.0%) | 0.0 |
| Total | 32 (100.0%) | 22.0 |
Fertility by Age by Marriage Status in Tappan
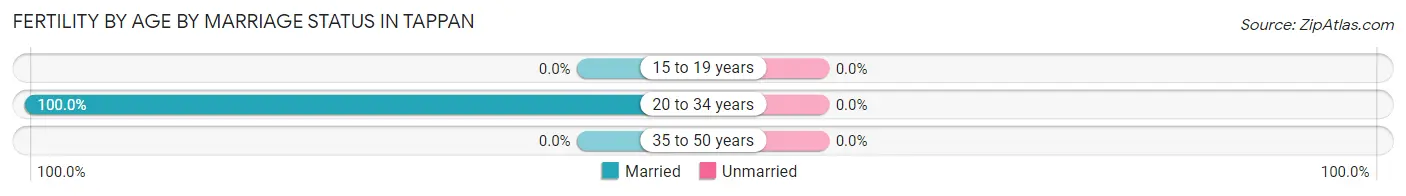
| Age Bracket | Married | Unmarried |
| 15 to 19 years | 0 (0.0%) | 0 (0.0%) |
| 20 to 34 years | 32 (100.0%) | 0 (0.0%) |
| 35 to 50 years | 0 (0.0%) | 0 (0.0%) |
| Total | 32 (100.0%) | 0 (0.0%) |
Fertility by Education in Tappan
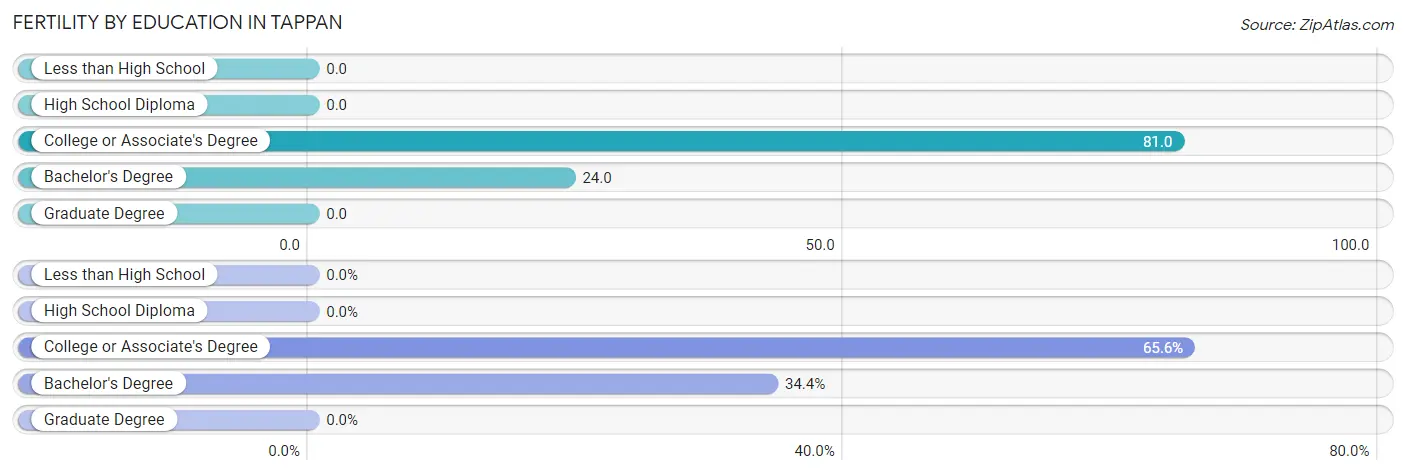
| Educational Attainment | Women with Births | Births / 1,000 Women |
| Less than High School | 0 (0.0%) | 0.0 |
| High School Diploma | 0 (0.0%) | 0.0 |
| College or Associate's Degree | 21 (65.6%) | 81.0 |
| Bachelor's Degree | 11 (34.4%) | 24.0 |
| Graduate Degree | 0 (0.0%) | 0.0 |
| Total | 32 (100.0%) | 22.0 |
Fertility by Education by Marriage Status in Tappan
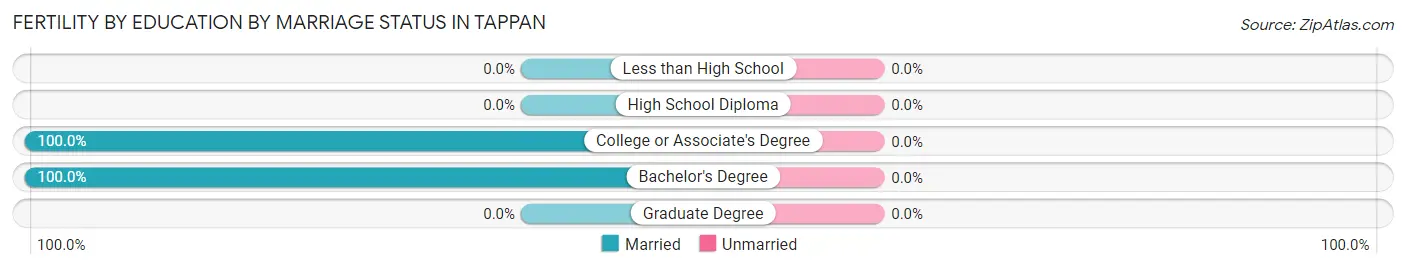
| Educational Attainment | Married | Unmarried |
| Less than High School | 0 (0.0%) | 0 (0.0%) |
| High School Diploma | 0 (0.0%) | 0 (0.0%) |
| College or Associate's Degree | 21 (100.0%) | 0 (0.0%) |
| Bachelor's Degree | 11 (100.0%) | 0 (0.0%) |
| Graduate Degree | 0 (0.0%) | 0 (0.0%) |
| Total | 32 (100.0%) | 0 (0.0%) |
Employment Characteristics in Tappan
Employment by Class of Employer in Tappan
Among the 3,747 employed individuals in Tappan, private company employees (2,290 | 61.1%), local government employees (486 | 13.0%), and not-for-profit organizations (323 | 8.6%) make up the most common classes of employment.
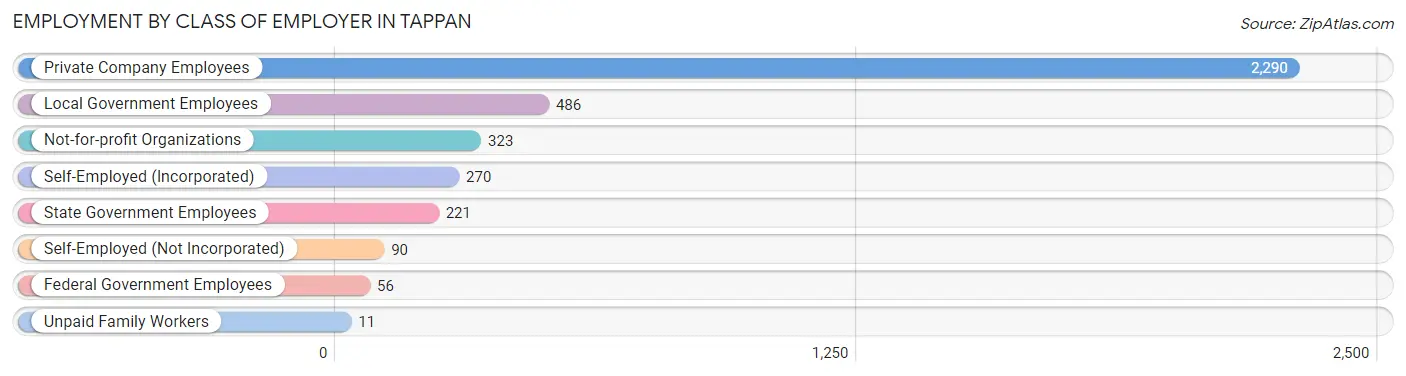
| Employer Class | # Employees | % Employees |
| Private Company Employees | 2,290 | 61.1% |
| Self-Employed (Incorporated) | 270 | 7.2% |
| Self-Employed (Not Incorporated) | 90 | 2.4% |
| Not-for-profit Organizations | 323 | 8.6% |
| Local Government Employees | 486 | 13.0% |
| State Government Employees | 221 | 5.9% |
| Federal Government Employees | 56 | 1.5% |
| Unpaid Family Workers | 11 | 0.3% |
| Total | 3,747 | 100.0% |
Employment Status by Age in Tappan
According to the labor force statistics for Tappan, out of the total population over 16 years of age (5,997), 69.5% or 4,168 individuals are in the labor force, with 8.4% or 350 of them unemployed. The age group with the highest labor force participation rate is 25 to 29 years, with 94.7% or 359 individuals in the labor force. Within the labor force, the 16 to 19 years age range has the highest percentage of unemployed individuals, with 34.9% or 45 of them being unemployed.
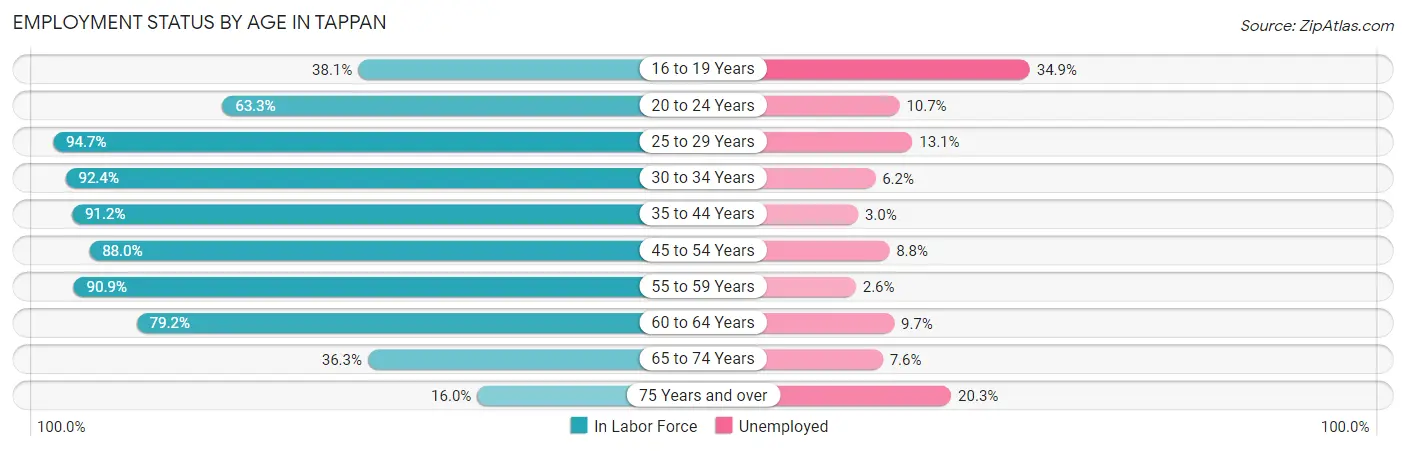
| Age Bracket | In Labor Force | Unemployed |
| 16 to 19 Years | 129 (38.1%) | 45 (34.9%) |
| 20 to 24 Years | 328 (63.3%) | 35 (10.7%) |
| 25 to 29 Years | 359 (94.7%) | 47 (13.1%) |
| 30 to 34 Years | 290 (92.4%) | 18 (6.2%) |
| 35 to 44 Years | 771 (91.2%) | 23 (3.0%) |
| 45 to 54 Years | 985 (88.0%) | 87 (8.8%) |
| 55 to 59 Years | 570 (90.9%) | 15 (2.6%) |
| 60 to 64 Years | 401 (79.2%) | 39 (9.7%) |
| 65 to 74 Years | 211 (36.3%) | 16 (7.6%) |
| 75 Years and over | 123 (16.0%) | 25 (20.3%) |
| Total | 4,168 (69.5%) | 350 (8.4%) |
Employment Status by Educational Attainment in Tappan
According to labor force statistics for Tappan, 89.1% of individuals (3,377) out of the total population between 25 and 64 years of age (3,790) are in the labor force, with 6.8% or 230 of them being unemployed. The group with the highest labor force participation rate are those with the educational attainment of bachelor's degree or higher, with 94.3% or 2,364 individuals in the labor force. Within the labor force, individuals with high school diploma education have the highest percentage of unemployment, with 26.6% or 85 of them being unemployed.
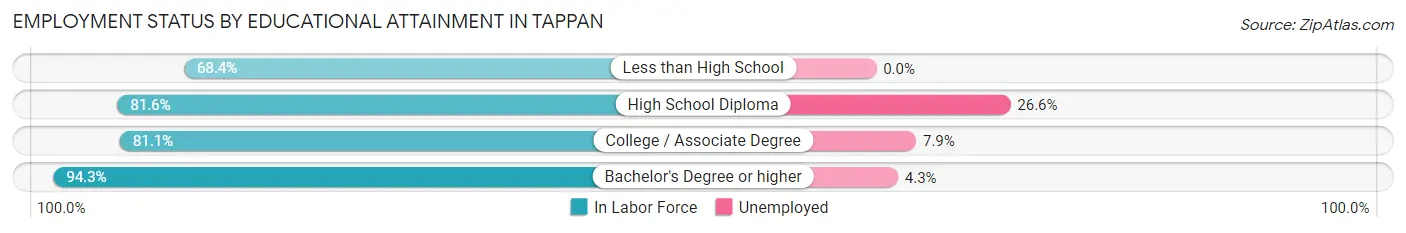
| Educational Attainment | In Labor Force | Unemployed |
| Less than High School | 158 (68.4%) | 0 (0.0%) |
| High School Diploma | 320 (81.6%) | 104 (26.6%) |
| College / Associate Degree | 535 (81.1%) | 52 (7.9%) |
| Bachelor's Degree or higher | 2,364 (94.3%) | 108 (4.3%) |
| Total | 3,377 (89.1%) | 258 (6.8%) |
Employment Occupations by Sex in Tappan
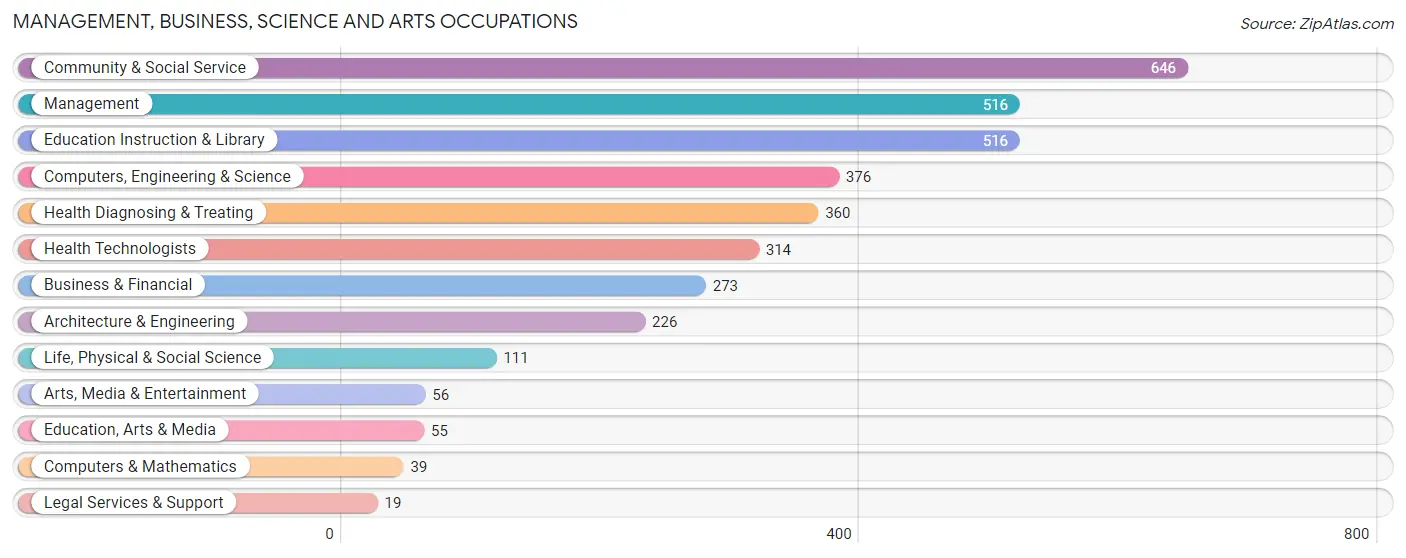
Management, Business, Science and Arts Occupations
The most common Management, Business, Science and Arts occupations in Tappan are Community & Social Service (646 | 16.9%), Management (516 | 13.5%), Education Instruction & Library (516 | 13.5%), Computers, Engineering & Science (376 | 9.9%), and Health Diagnosing & Treating (360 | 9.4%).
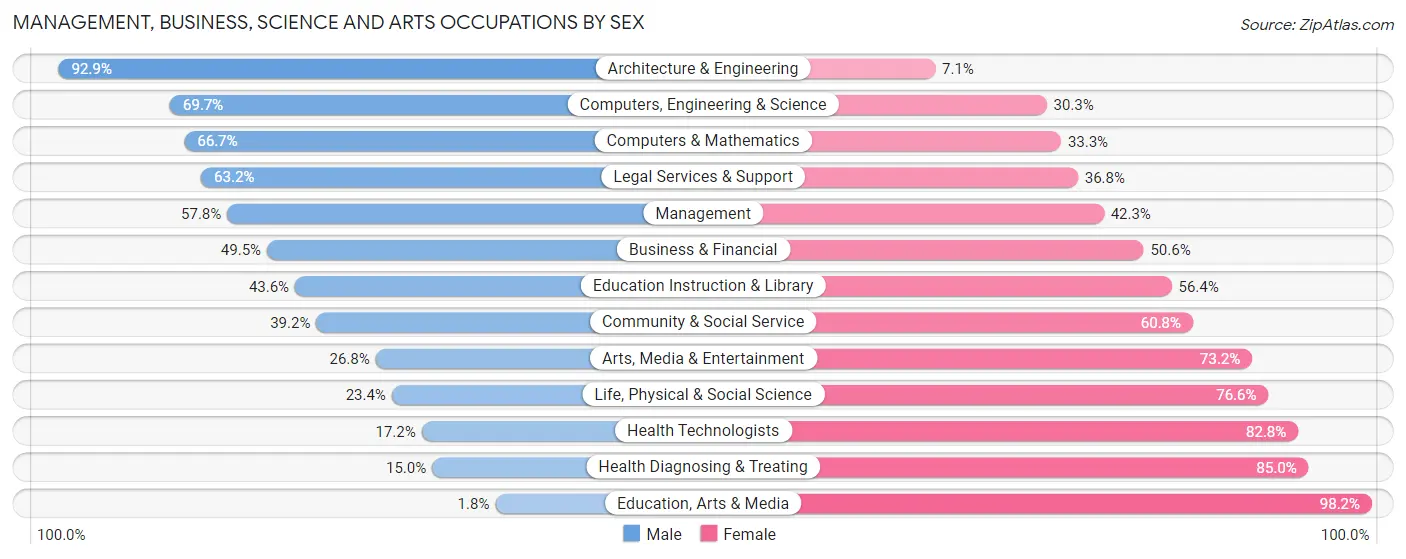
Management, Business, Science and Arts Occupations by Sex
Within the Management, Business, Science and Arts occupations in Tappan, the most male-oriented occupations are Architecture & Engineering (92.9%), Computers, Engineering & Science (69.7%), and Computers & Mathematics (66.7%), while the most female-oriented occupations are Education, Arts & Media (98.2%), Health Diagnosing & Treating (85.0%), and Health Technologists (82.8%).
| Occupation | Male | Female |
| Management | 298 (57.8%) | 218 (42.2%) |
| Business & Financial | 135 (49.4%) | 138 (50.5%) |
| Computers, Engineering & Science | 262 (69.7%) | 114 (30.3%) |
| Computers & Mathematics | 26 (66.7%) | 13 (33.3%) |
| Architecture & Engineering | 210 (92.9%) | 16 (7.1%) |
| Life, Physical & Social Science | 26 (23.4%) | 85 (76.6%) |
| Community & Social Service | 253 (39.2%) | 393 (60.8%) |
| Education, Arts & Media | 1 (1.8%) | 54 (98.2%) |
| Legal Services & Support | 12 (63.2%) | 7 (36.8%) |
| Education Instruction & Library | 225 (43.6%) | 291 (56.4%) |
| Arts, Media & Entertainment | 15 (26.8%) | 41 (73.2%) |
| Health Diagnosing & Treating | 54 (15.0%) | 306 (85.0%) |
| Health Technologists | 54 (17.2%) | 260 (82.8%) |
| Total (Category) | 1,002 (46.2%) | 1,169 (53.8%) |
| Total (Overall) | 1,953 (51.2%) | 1,864 (48.8%) |
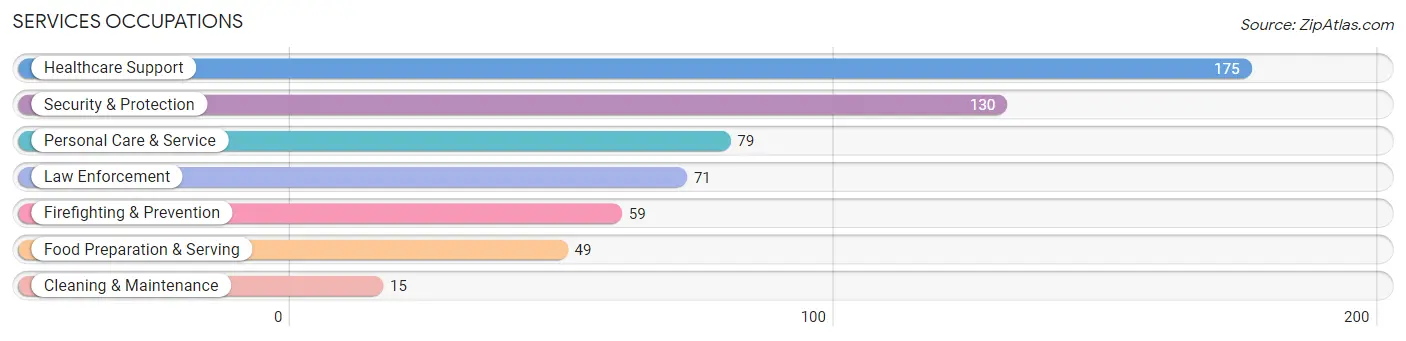
Services Occupations
The most common Services occupations in Tappan are Healthcare Support (175 | 4.6%), Security & Protection (130 | 3.4%), Personal Care & Service (79 | 2.1%), Law Enforcement (71 | 1.9%), and Firefighting & Prevention (59 | 1.5%).
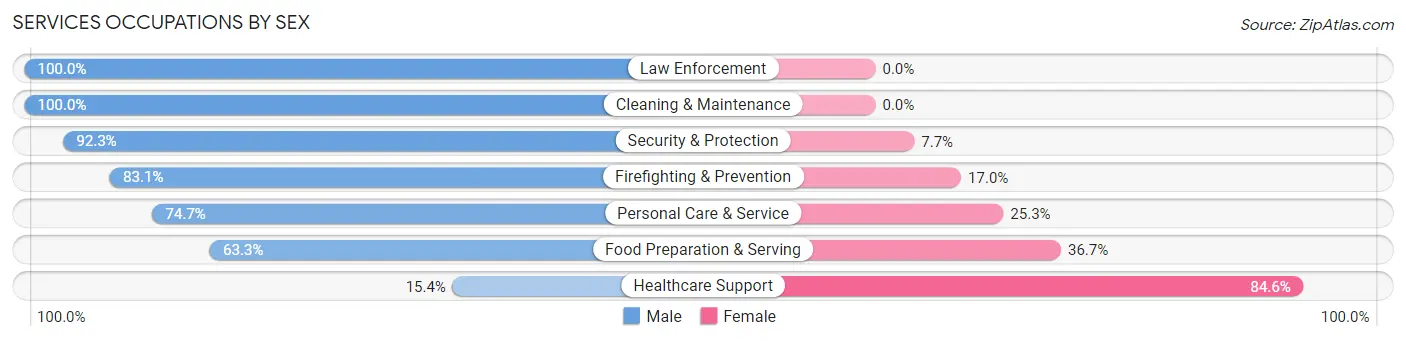
Services Occupations by Sex
Within the Services occupations in Tappan, the most male-oriented occupations are Law Enforcement (100.0%), Cleaning & Maintenance (100.0%), and Security & Protection (92.3%), while the most female-oriented occupations are Healthcare Support (84.6%), Food Preparation & Serving (36.7%), and Personal Care & Service (25.3%).
| Occupation | Male | Female |
| Healthcare Support | 27 (15.4%) | 148 (84.6%) |
| Security & Protection | 120 (92.3%) | 10 (7.7%) |
| Firefighting & Prevention | 49 (83.1%) | 10 (17.0%) |
| Law Enforcement | 71 (100.0%) | 0 (0.0%) |
| Food Preparation & Serving | 31 (63.3%) | 18 (36.7%) |
| Cleaning & Maintenance | 15 (100.0%) | 0 (0.0%) |
| Personal Care & Service | 59 (74.7%) | 20 (25.3%) |
| Total (Category) | 252 (56.2%) | 196 (43.8%) |
| Total (Overall) | 1,953 (51.2%) | 1,864 (48.8%) |
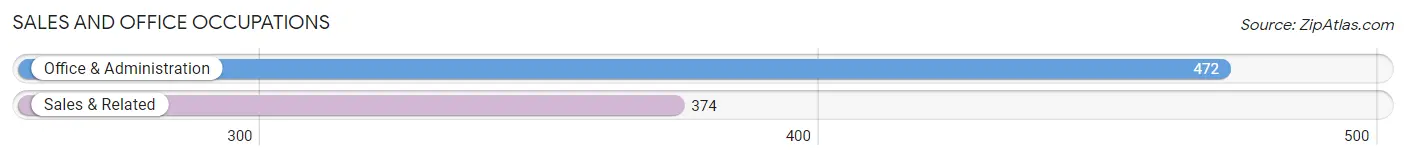
Sales and Office Occupations
The most common Sales and Office occupations in Tappan are Office & Administration (472 | 12.4%), and Sales & Related (374 | 9.8%).
Sales and Office Occupations by Sex
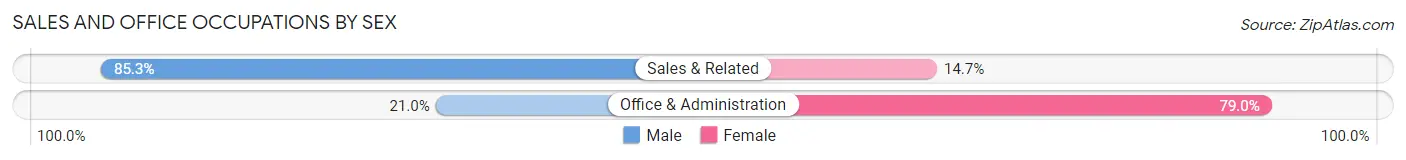
| Occupation | Male | Female |
| Sales & Related | 319 (85.3%) | 55 (14.7%) |
| Office & Administration | 99 (21.0%) | 373 (79.0%) |
| Total (Category) | 418 (49.4%) | 428 (50.6%) |
| Total (Overall) | 1,953 (51.2%) | 1,864 (48.8%) |
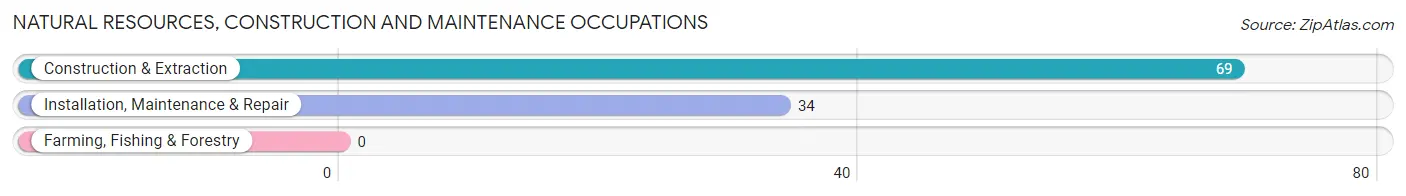
Natural Resources, Construction and Maintenance Occupations
The most common Natural Resources, Construction and Maintenance occupations in Tappan are Construction & Extraction (69 | 1.8%), and Installation, Maintenance & Repair (34 | 0.9%).
Natural Resources, Construction and Maintenance Occupations by Sex
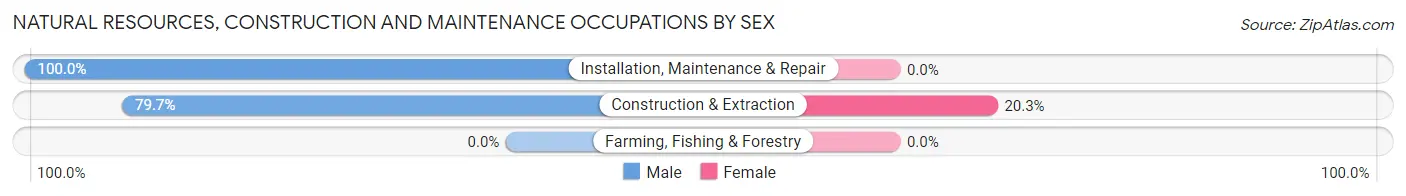
| Occupation | Male | Female |
| Farming, Fishing & Forestry | 0 (0.0%) | 0 (0.0%) |
| Construction & Extraction | 55 (79.7%) | 14 (20.3%) |
| Installation, Maintenance & Repair | 34 (100.0%) | 0 (0.0%) |
| Total (Category) | 89 (86.4%) | 14 (13.6%) |
| Total (Overall) | 1,953 (51.2%) | 1,864 (48.8%) |
Production, Transportation and Moving Occupations
The most common Production, Transportation and Moving occupations in Tappan are Production (127 | 3.3%), Transportation (68 | 1.8%), and Material Moving (54 | 1.4%).
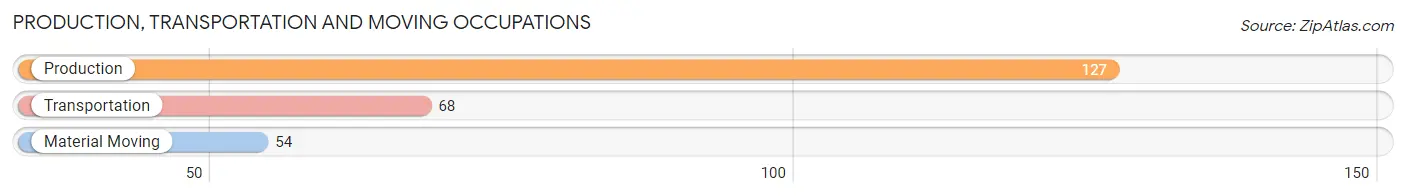
Production, Transportation and Moving Occupations by Sex
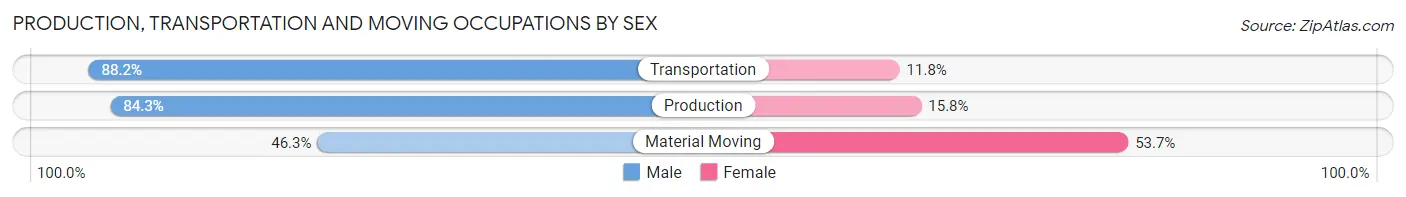
| Occupation | Male | Female |
| Production | 107 (84.3%) | 20 (15.8%) |
| Transportation | 60 (88.2%) | 8 (11.8%) |
| Material Moving | 25 (46.3%) | 29 (53.7%) |
| Total (Category) | 192 (77.1%) | 57 (22.9%) |
| Total (Overall) | 1,953 (51.2%) | 1,864 (48.8%) |
Employment Industries by Sex in Tappan
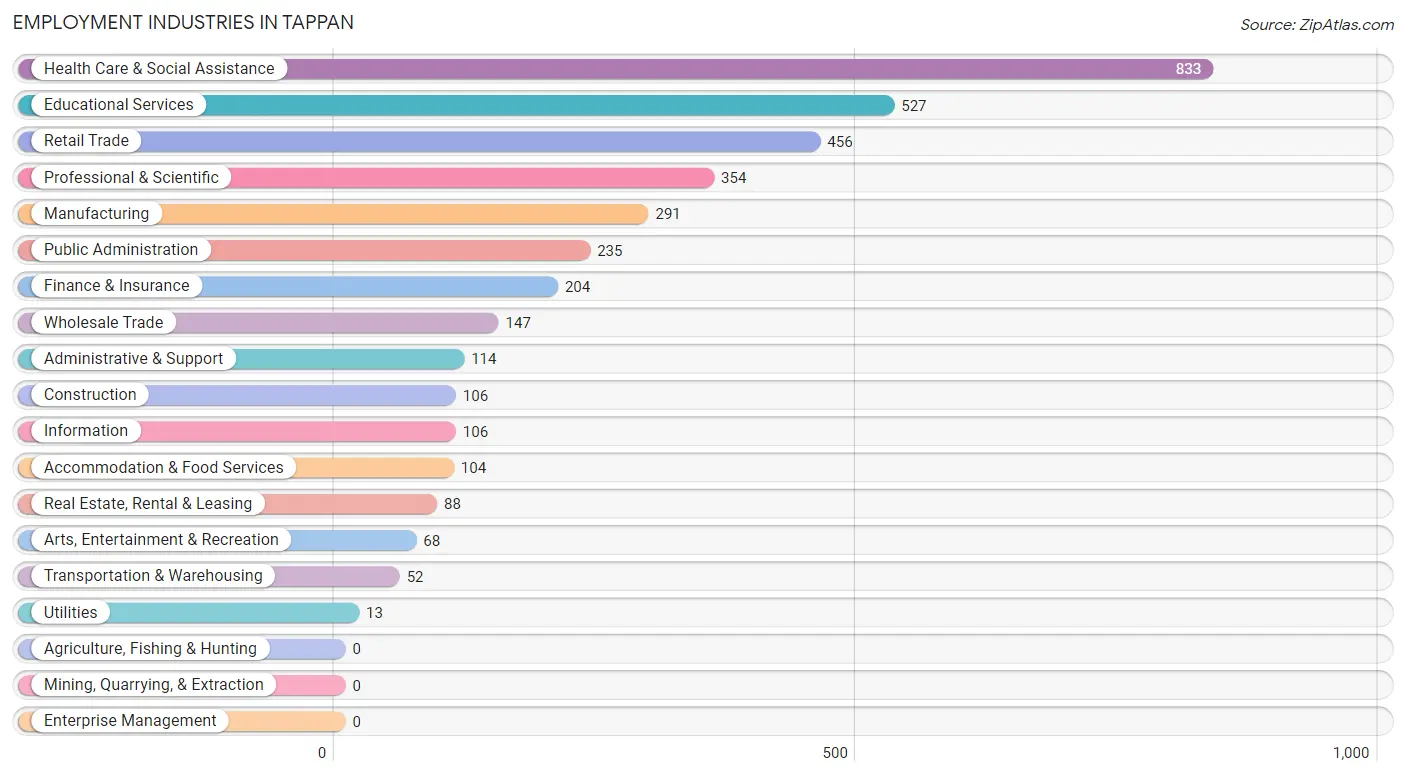
Employment Industries in Tappan
The major employment industries in Tappan include Health Care & Social Assistance (833 | 21.8%), Educational Services (527 | 13.8%), Retail Trade (456 | 11.9%), Professional & Scientific (354 | 9.3%), and Manufacturing (291 | 7.6%).
Employment Industries by Sex in Tappan
The Tappan industries that see more men than women are Construction (100.0%), Utilities (100.0%), and Public Administration (90.2%), whereas the industries that tend to have a higher number of women are Health Care & Social Assistance (75.9%), Administrative & Support (67.5%), and Educational Services (67.0%).
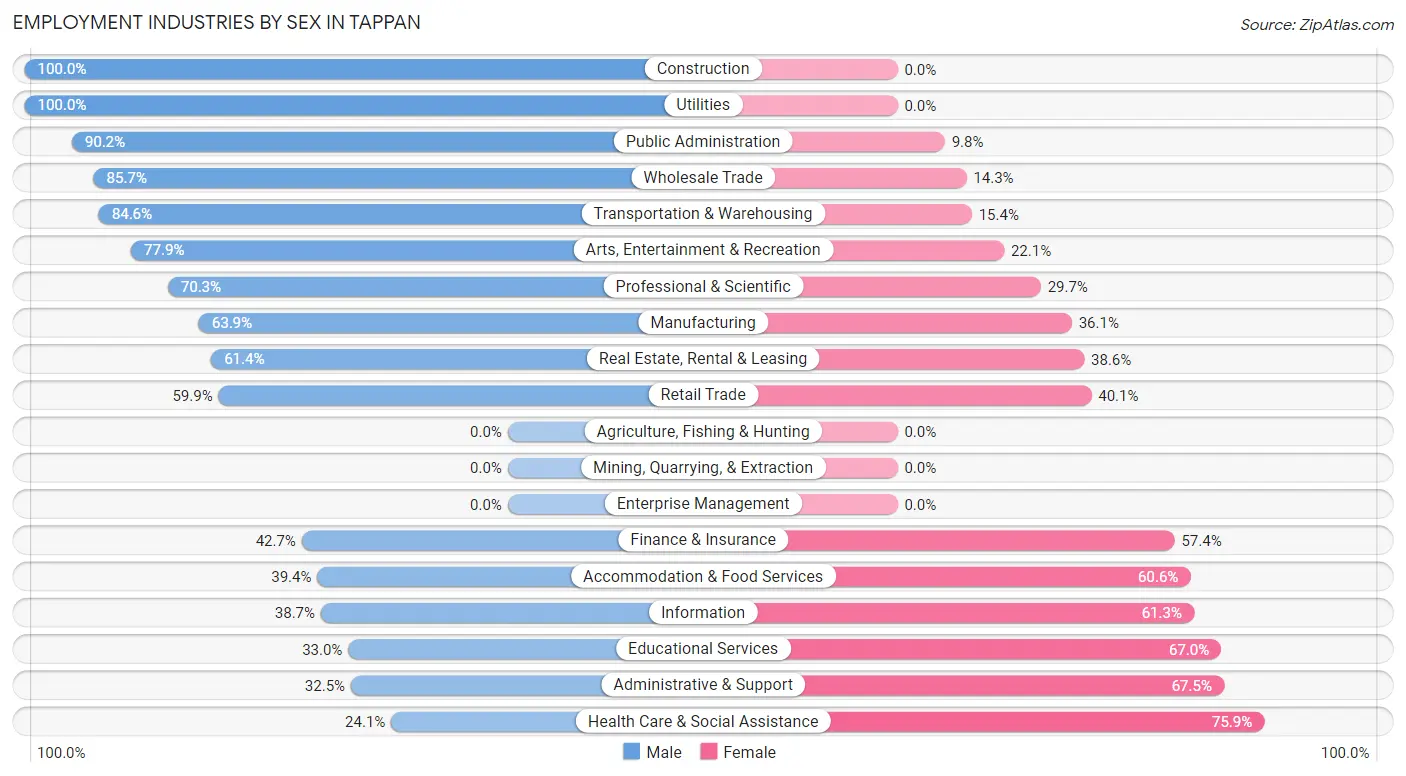
| Industry | Male | Female |
| Agriculture, Fishing & Hunting | 0 (0.0%) | 0 (0.0%) |
| Mining, Quarrying, & Extraction | 0 (0.0%) | 0 (0.0%) |
| Construction | 106 (100.0%) | 0 (0.0%) |
| Manufacturing | 186 (63.9%) | 105 (36.1%) |
| Wholesale Trade | 126 (85.7%) | 21 (14.3%) |
| Retail Trade | 273 (59.9%) | 183 (40.1%) |
| Transportation & Warehousing | 44 (84.6%) | 8 (15.4%) |
| Utilities | 13 (100.0%) | 0 (0.0%) |
| Information | 41 (38.7%) | 65 (61.3%) |
| Finance & Insurance | 87 (42.6%) | 117 (57.4%) |
| Real Estate, Rental & Leasing | 54 (61.4%) | 34 (38.6%) |
| Professional & Scientific | 249 (70.3%) | 105 (29.7%) |
| Enterprise Management | 0 (0.0%) | 0 (0.0%) |
| Administrative & Support | 37 (32.5%) | 77 (67.5%) |
| Educational Services | 174 (33.0%) | 353 (67.0%) |
| Health Care & Social Assistance | 201 (24.1%) | 632 (75.9%) |
| Arts, Entertainment & Recreation | 53 (77.9%) | 15 (22.1%) |
| Accommodation & Food Services | 41 (39.4%) | 63 (60.6%) |
| Public Administration | 212 (90.2%) | 23 (9.8%) |
| Total | 1,953 (51.2%) | 1,864 (48.8%) |
Education in Tappan
School Enrollment in Tappan
The most common levels of schooling among the 1,773 students in Tappan are high school (467 | 26.3%), college / undergraduate (411 | 23.2%), and elementary school (288 | 16.2%).
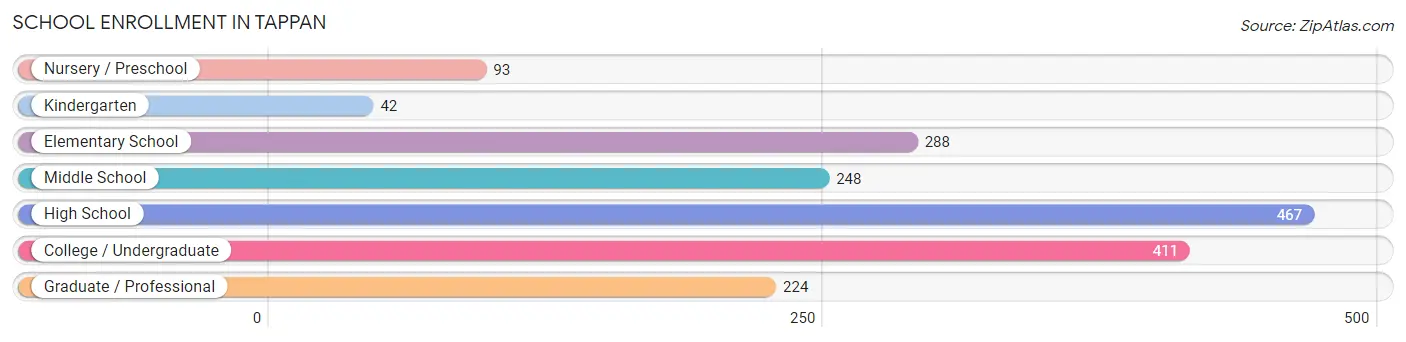
| School Level | # Students | % Students |
| Nursery / Preschool | 93 | 5.2% |
| Kindergarten | 42 | 2.4% |
| Elementary School | 288 | 16.2% |
| Middle School | 248 | 14.0% |
| High School | 467 | 26.3% |
| College / Undergraduate | 411 | 23.2% |
| Graduate / Professional | 224 | 12.6% |
| Total | 1,773 | 100.0% |
School Enrollment by Age by Funding Source in Tappan
Out of a total of 1,773 students who are enrolled in schools in Tappan, 349 (19.7%) attend a private institution, while the remaining 1,424 (80.3%) are enrolled in public schools. The age group of 25 to 34 year olds has the highest likelihood of being enrolled in private schools, with 139 (65.9% in the age bracket) enrolled. Conversely, the age group of 10 to 14 year olds has the lowest likelihood of being enrolled in a private school, with 472 (99.0% in the age bracket) attending a public institution.
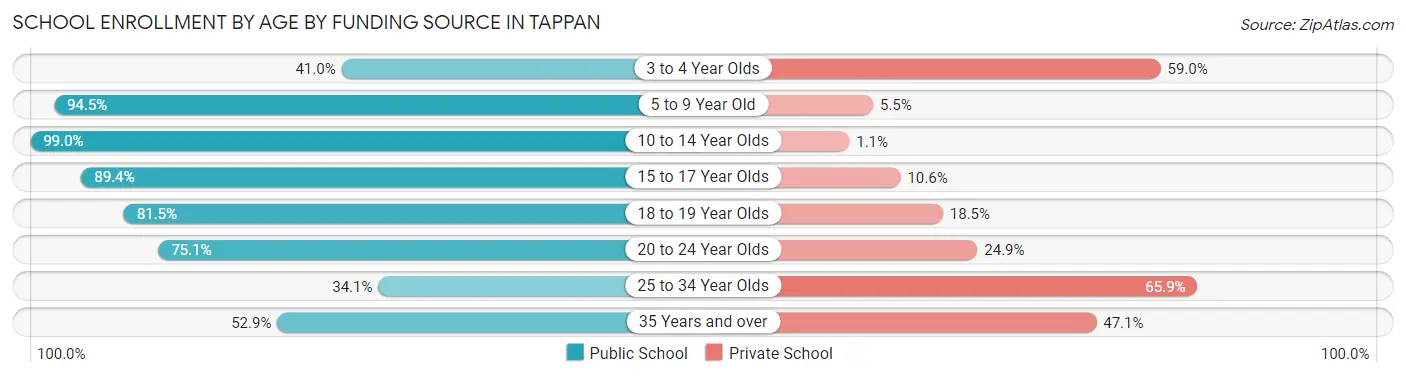
| Age Bracket | Public School | Private School |
| 3 to 4 Year Olds | 25 (41.0%) | 36 (59.0%) |
| 5 to 9 Year Old | 259 (94.5%) | 15 (5.5%) |
| 10 to 14 Year Olds | 472 (99.0%) | 5 (1.1%) |
| 15 to 17 Year Olds | 279 (89.4%) | 33 (10.6%) |
| 18 to 19 Year Olds | 75 (81.5%) | 17 (18.5%) |
| 20 to 24 Year Olds | 196 (75.1%) | 65 (24.9%) |
| 25 to 34 Year Olds | 72 (34.1%) | 139 (65.9%) |
| 35 Years and over | 45 (52.9%) | 40 (47.1%) |
| Total | 1,424 (80.3%) | 349 (19.7%) |
Educational Attainment by Field of Study in Tappan
Business (687 | 21.3%), social sciences (360 | 11.2%), visual & performing arts (254 | 7.9%), science & technology (252 | 7.8%), and liberal arts & history (247 | 7.7%) are the most common fields of study among 3,226 individuals in Tappan who have obtained a bachelor's degree or higher.
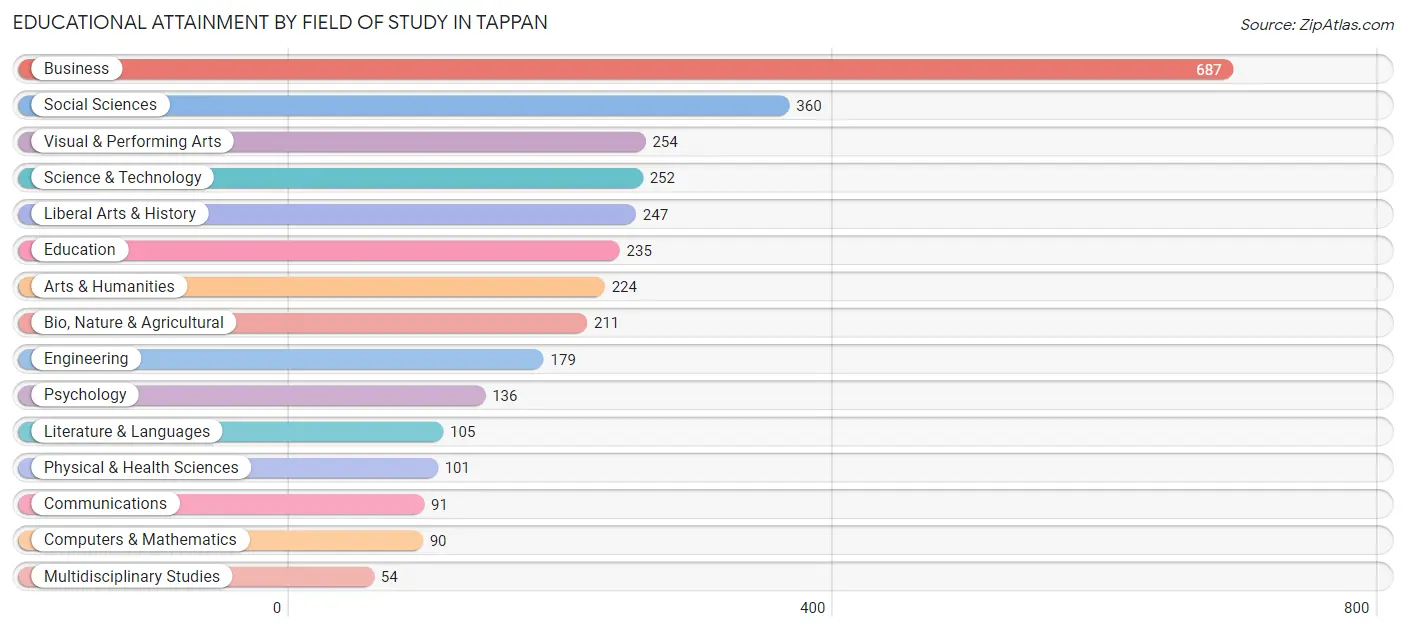
| Field of Study | # Graduates | % Graduates |
| Computers & Mathematics | 90 | 2.8% |
| Bio, Nature & Agricultural | 211 | 6.5% |
| Physical & Health Sciences | 101 | 3.1% |
| Psychology | 136 | 4.2% |
| Social Sciences | 360 | 11.2% |
| Engineering | 179 | 5.6% |
| Multidisciplinary Studies | 54 | 1.7% |
| Science & Technology | 252 | 7.8% |
| Business | 687 | 21.3% |
| Education | 235 | 7.3% |
| Literature & Languages | 105 | 3.3% |
| Liberal Arts & History | 247 | 7.7% |
| Visual & Performing Arts | 254 | 7.9% |
| Communications | 91 | 2.8% |
| Arts & Humanities | 224 | 6.9% |
| Total | 3,226 | 100.0% |
Transportation & Commute in Tappan
Vehicle Availability by Sex in Tappan
The most prevalent vehicle ownership categories in Tappan are males with 2 vehicles (857, accounting for 44.5%) and females with 2 vehicles (959, making up 47.1%).
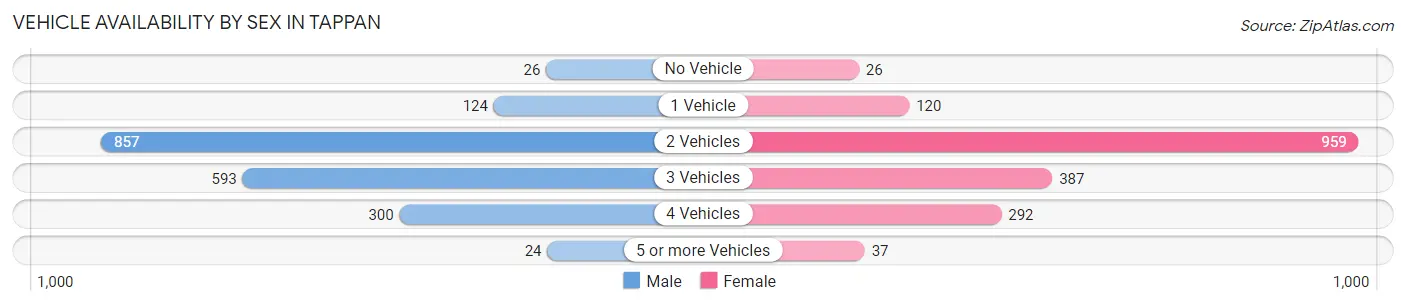
| Vehicles Available | Male | Female |
| No Vehicle | 26 (1.3%) | 26 (1.4%) |
| 1 Vehicle | 124 (6.4%) | 120 (6.6%) |
| 2 Vehicles | 857 (44.5%) | 959 (52.7%) |
| 3 Vehicles | 593 (30.8%) | 387 (21.2%) |
| 4 Vehicles | 300 (15.6%) | 292 (16.0%) |
| 5 or more Vehicles | 24 (1.3%) | 37 (2.0%) |
| Total | 1,924 (100.0%) | 1,821 (100.0%) |
Commute Time in Tappan
The most frequently occuring commute durations in Tappan are 10 to 14 minutes (448 commuters, 13.5%), 20 to 24 minutes (445 commuters, 13.4%), and 30 to 34 minutes (411 commuters, 12.4%).
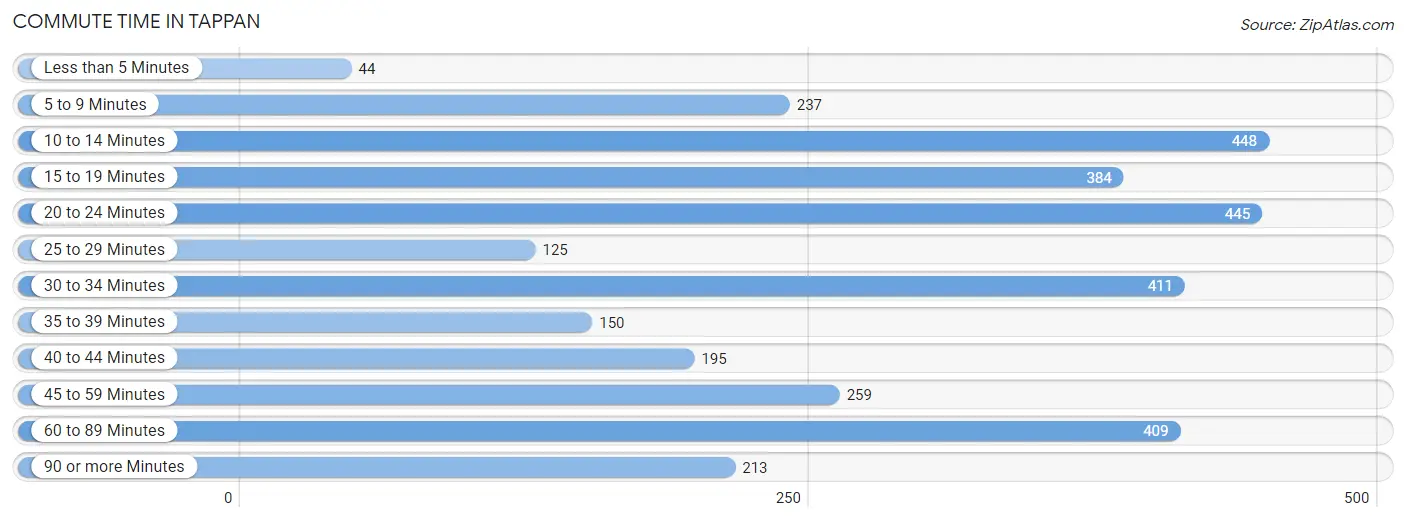
| Commute Time | # Commuters | % Commuters |
| Less than 5 Minutes | 44 | 1.3% |
| 5 to 9 Minutes | 237 | 7.1% |
| 10 to 14 Minutes | 448 | 13.5% |
| 15 to 19 Minutes | 384 | 11.6% |
| 20 to 24 Minutes | 445 | 13.4% |
| 25 to 29 Minutes | 125 | 3.8% |
| 30 to 34 Minutes | 411 | 12.4% |
| 35 to 39 Minutes | 150 | 4.5% |
| 40 to 44 Minutes | 195 | 5.9% |
| 45 to 59 Minutes | 259 | 7.8% |
| 60 to 89 Minutes | 409 | 12.3% |
| 90 or more Minutes | 213 | 6.4% |
Commute Time by Sex in Tappan
The most common commute times in Tappan are 60 to 89 minutes (294 commuters, 17.1%) for males and 15 to 19 minutes (276 commuters, 17.2%) for females.
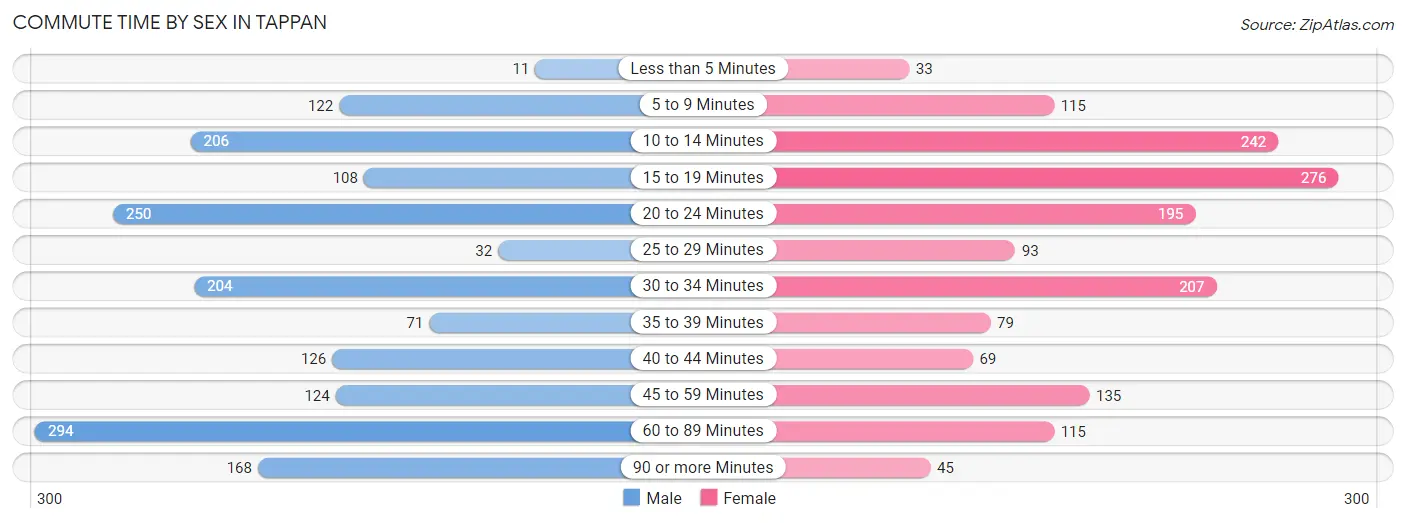
| Commute Time | Male | Female |
| Less than 5 Minutes | 11 (0.6%) | 33 (2.1%) |
| 5 to 9 Minutes | 122 (7.1%) | 115 (7.2%) |
| 10 to 14 Minutes | 206 (12.0%) | 242 (15.1%) |
| 15 to 19 Minutes | 108 (6.3%) | 276 (17.2%) |
| 20 to 24 Minutes | 250 (14.6%) | 195 (12.2%) |
| 25 to 29 Minutes | 32 (1.9%) | 93 (5.8%) |
| 30 to 34 Minutes | 204 (11.9%) | 207 (12.9%) |
| 35 to 39 Minutes | 71 (4.1%) | 79 (4.9%) |
| 40 to 44 Minutes | 126 (7.3%) | 69 (4.3%) |
| 45 to 59 Minutes | 124 (7.2%) | 135 (8.4%) |
| 60 to 89 Minutes | 294 (17.1%) | 115 (7.2%) |
| 90 or more Minutes | 168 (9.8%) | 45 (2.8%) |
Time of Departure to Work by Sex in Tappan
The most frequent times of departure to work in Tappan are 8:00 AM to 8:29 AM (319, 18.6%) for males and 8:30 AM to 8:59 AM (256, 16.0%) for females.
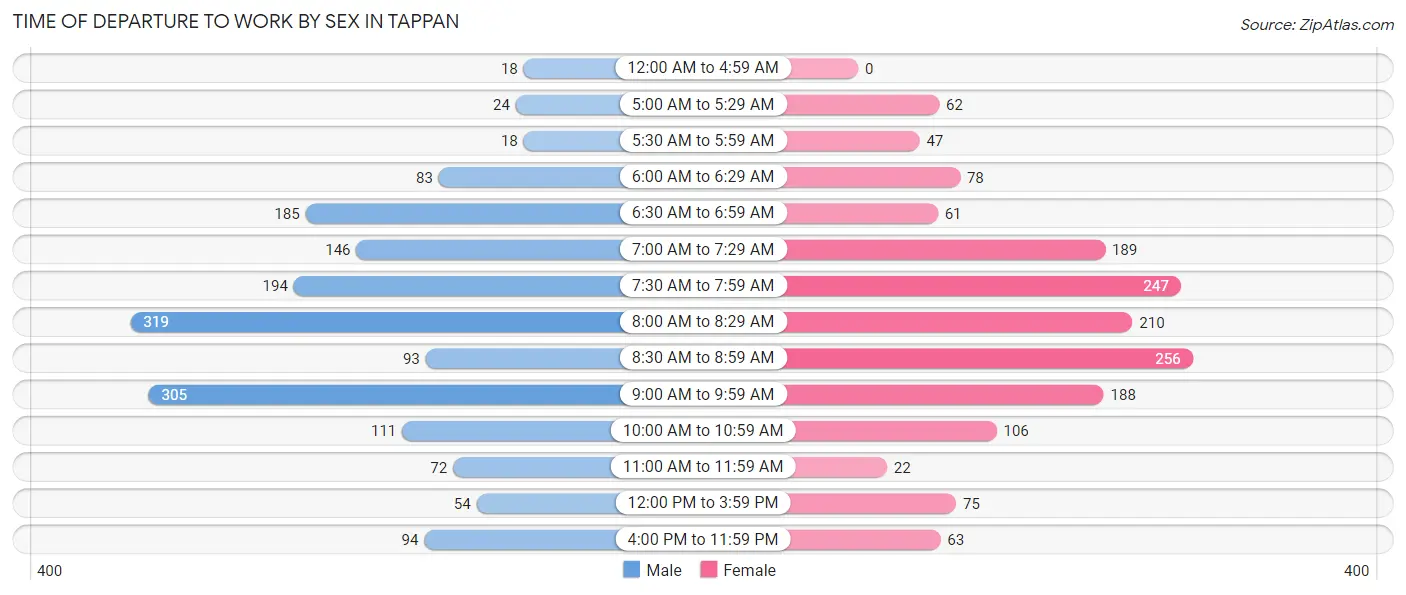
| Time of Departure | Male | Female |
| 12:00 AM to 4:59 AM | 18 (1.1%) | 0 (0.0%) |
| 5:00 AM to 5:29 AM | 24 (1.4%) | 62 (3.9%) |
| 5:30 AM to 5:59 AM | 18 (1.1%) | 47 (2.9%) |
| 6:00 AM to 6:29 AM | 83 (4.8%) | 78 (4.9%) |
| 6:30 AM to 6:59 AM | 185 (10.8%) | 61 (3.8%) |
| 7:00 AM to 7:29 AM | 146 (8.5%) | 189 (11.8%) |
| 7:30 AM to 7:59 AM | 194 (11.3%) | 247 (15.4%) |
| 8:00 AM to 8:29 AM | 319 (18.6%) | 210 (13.1%) |
| 8:30 AM to 8:59 AM | 93 (5.4%) | 256 (16.0%) |
| 9:00 AM to 9:59 AM | 305 (17.8%) | 188 (11.7%) |
| 10:00 AM to 10:59 AM | 111 (6.5%) | 106 (6.6%) |
| 11:00 AM to 11:59 AM | 72 (4.2%) | 22 (1.4%) |
| 12:00 PM to 3:59 PM | 54 (3.2%) | 75 (4.7%) |
| 4:00 PM to 11:59 PM | 94 (5.5%) | 63 (3.9%) |
| Total | 1,716 (100.0%) | 1,604 (100.0%) |
Housing Occupancy in Tappan
Occupancy by Ownership in Tappan
Of the total 2,342 dwellings in Tappan, owner-occupied units account for 2,198 (93.9%), while renter-occupied units make up 144 (6.1%).
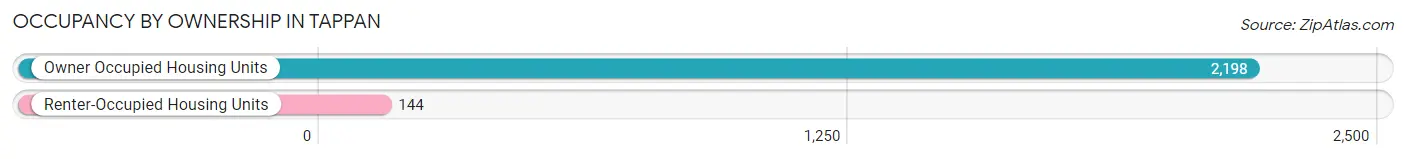
| Occupancy | # Housing Units | % Housing Units |
| Owner Occupied Housing Units | 2,198 | 93.9% |
| Renter-Occupied Housing Units | 144 | 6.1% |
| Total Occupied Housing Units | 2,342 | 100.0% |
Occupancy by Household Size in Tappan
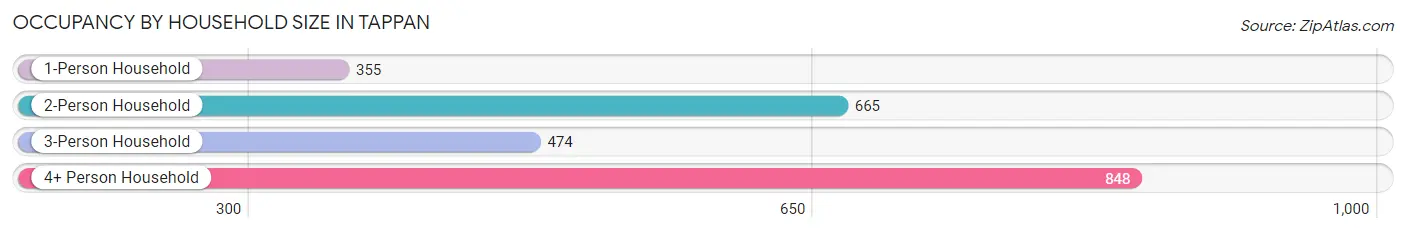
| Household Size | # Housing Units | % Housing Units |
| 1-Person Household | 355 | 15.2% |
| 2-Person Household | 665 | 28.4% |
| 3-Person Household | 474 | 20.2% |
| 4+ Person Household | 848 | 36.2% |
| Total Housing Units | 2,342 | 100.0% |
Occupancy by Ownership by Household Size in Tappan
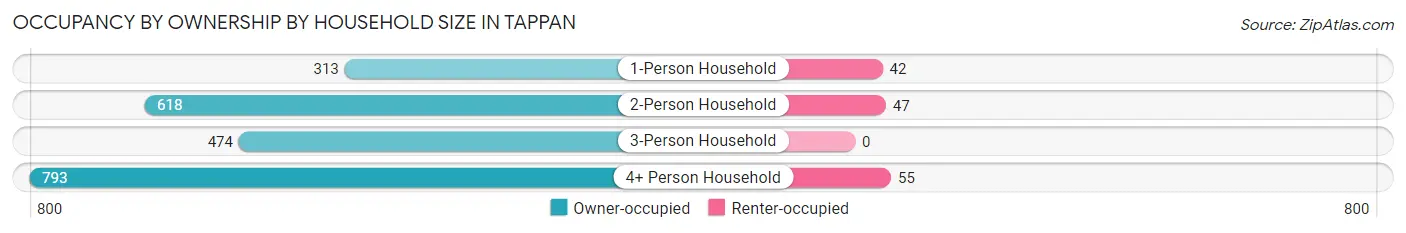
| Household Size | Owner-occupied | Renter-occupied |
| 1-Person Household | 313 (88.2%) | 42 (11.8%) |
| 2-Person Household | 618 (92.9%) | 47 (7.1%) |
| 3-Person Household | 474 (100.0%) | 0 (0.0%) |
| 4+ Person Household | 793 (93.5%) | 55 (6.5%) |
| Total Housing Units | 2,198 (93.9%) | 144 (6.1%) |
Occupancy by Educational Attainment in Tappan
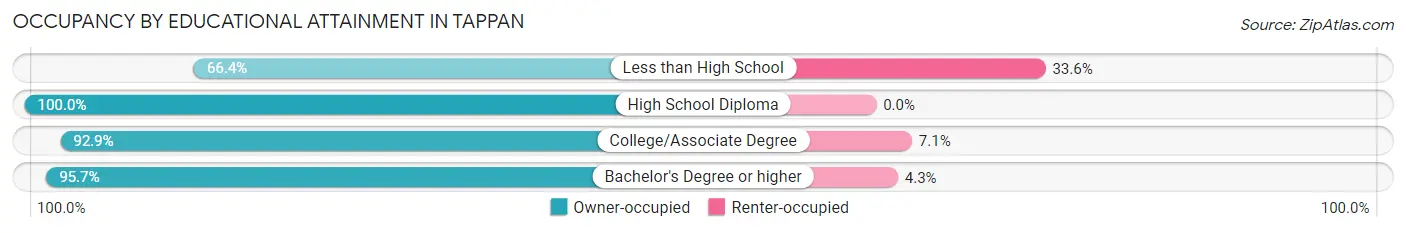
| Household Size | Owner-occupied | Renter-occupied |
| Less than High School | 93 (66.4%) | 47 (33.6%) |
| High School Diploma | 203 (100.0%) | 0 (0.0%) |
| College/Associate Degree | 367 (92.9%) | 28 (7.1%) |
| Bachelor's Degree or higher | 1,535 (95.7%) | 69 (4.3%) |
Occupancy by Age of Householder in Tappan
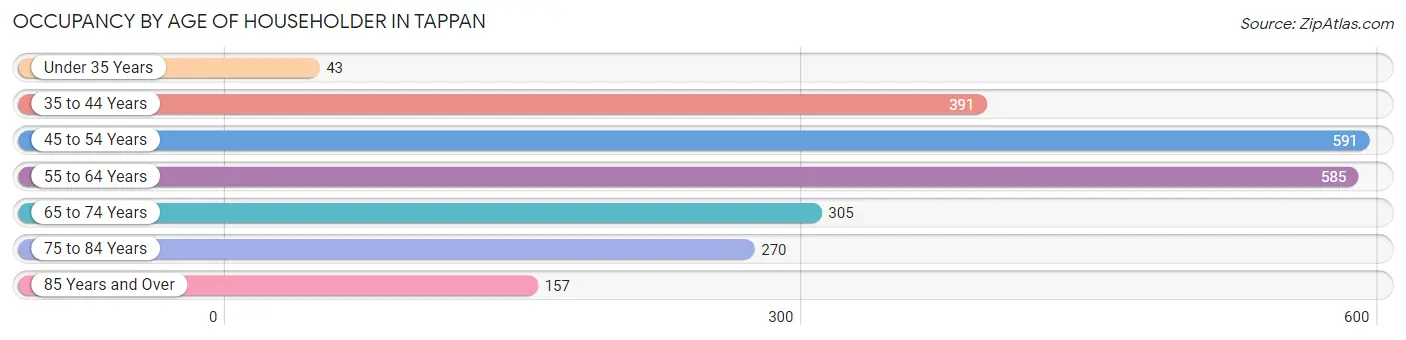
| Age Bracket | # Households | % Households |
| Under 35 Years | 43 | 1.8% |
| 35 to 44 Years | 391 | 16.7% |
| 45 to 54 Years | 591 | 25.2% |
| 55 to 64 Years | 585 | 25.0% |
| 65 to 74 Years | 305 | 13.0% |
| 75 to 84 Years | 270 | 11.5% |
| 85 Years and Over | 157 | 6.7% |
| Total | 2,342 | 100.0% |
Housing Finances in Tappan
Median Income by Occupancy in Tappan
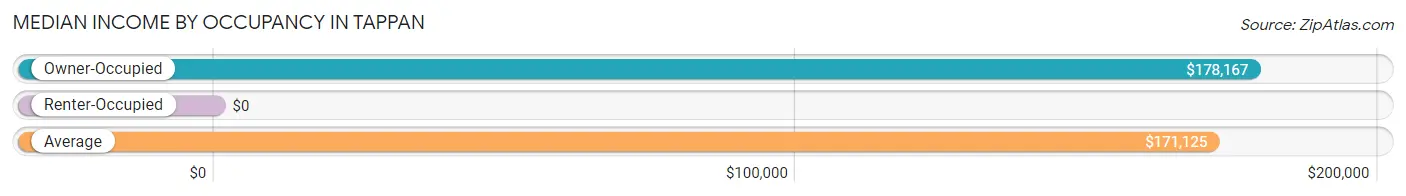
| Occupancy Type | # Households | Median Income |
| Owner-Occupied | 2,198 (93.9%) | $178,167 |
| Renter-Occupied | 144 (6.1%) | $0 |
| Average | 2,342 (100.0%) | $171,125 |
Occupancy by Householder Income Bracket in Tappan
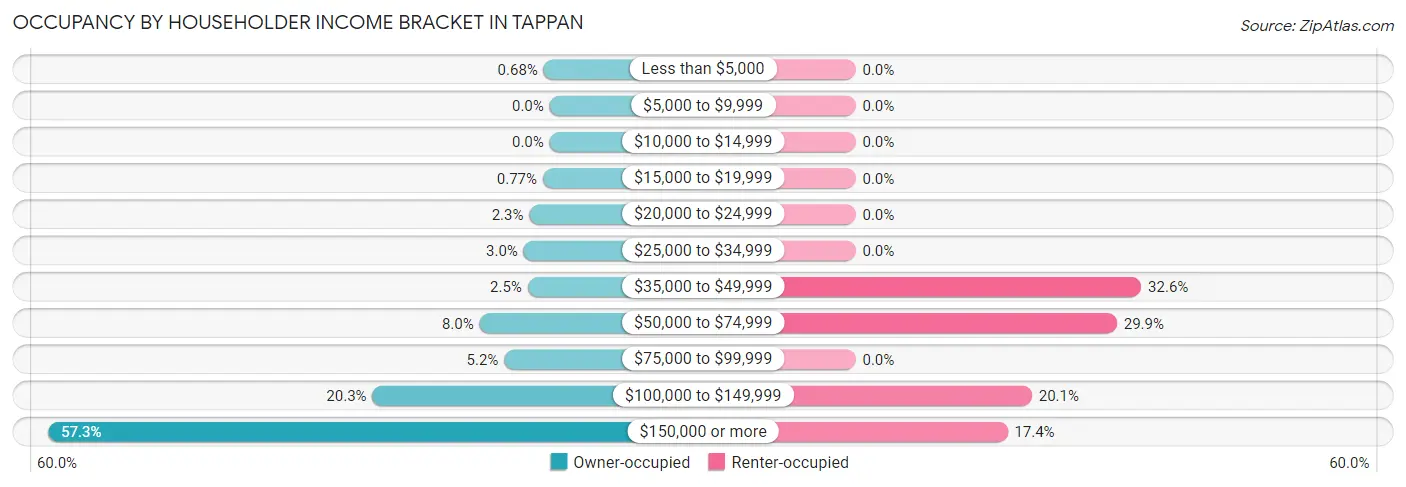
| Income Bracket | Owner-occupied | Renter-occupied |
| Less than $5,000 | 15 (0.7%) | 0 (0.0%) |
| $5,000 to $9,999 | 0 (0.0%) | 0 (0.0%) |
| $10,000 to $14,999 | 0 (0.0%) | 0 (0.0%) |
| $15,000 to $19,999 | 17 (0.8%) | 0 (0.0%) |
| $20,000 to $24,999 | 51 (2.3%) | 0 (0.0%) |
| $25,000 to $34,999 | 65 (3.0%) | 0 (0.0%) |
| $35,000 to $49,999 | 55 (2.5%) | 47 (32.6%) |
| $50,000 to $74,999 | 176 (8.0%) | 43 (29.9%) |
| $75,000 to $99,999 | 114 (5.2%) | 0 (0.0%) |
| $100,000 to $149,999 | 445 (20.3%) | 29 (20.1%) |
| $150,000 or more | 1,260 (57.3%) | 25 (17.4%) |
| Total | 2,198 (100.0%) | 144 (100.0%) |
Monthly Housing Cost Tiers in Tappan
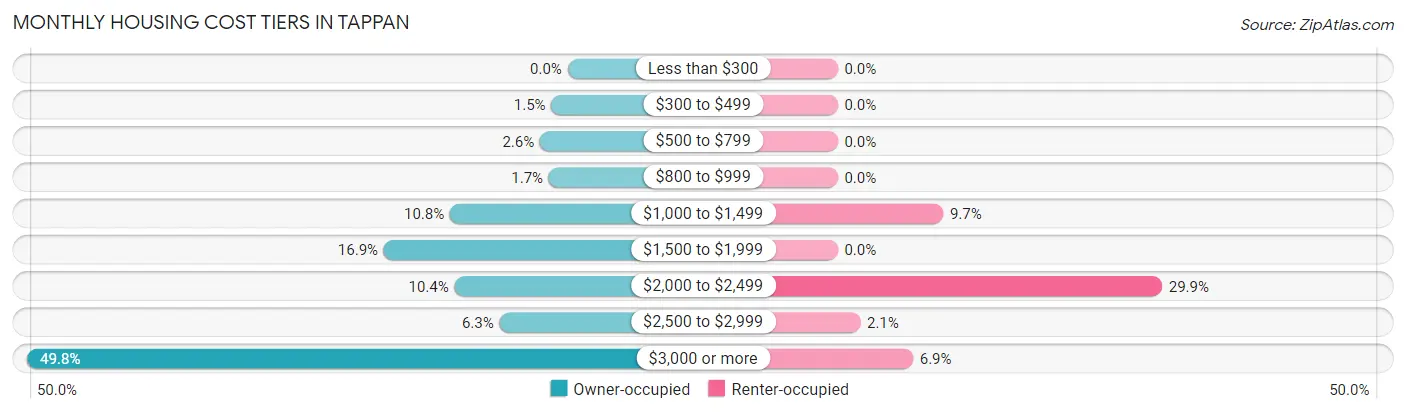
| Monthly Cost | Owner-occupied | Renter-occupied |
| Less than $300 | 0 (0.0%) | 0 (0.0%) |
| $300 to $499 | 33 (1.5%) | 0 (0.0%) |
| $500 to $799 | 56 (2.5%) | 0 (0.0%) |
| $800 to $999 | 38 (1.7%) | 0 (0.0%) |
| $1,000 to $1,499 | 238 (10.8%) | 14 (9.7%) |
| $1,500 to $1,999 | 372 (16.9%) | 0 (0.0%) |
| $2,000 to $2,499 | 229 (10.4%) | 43 (29.9%) |
| $2,500 to $2,999 | 138 (6.3%) | 3 (2.1%) |
| $3,000 or more | 1,094 (49.8%) | 10 (6.9%) |
| Total | 2,198 (100.0%) | 144 (100.0%) |
Physical Housing Characteristics in Tappan
Housing Structures in Tappan
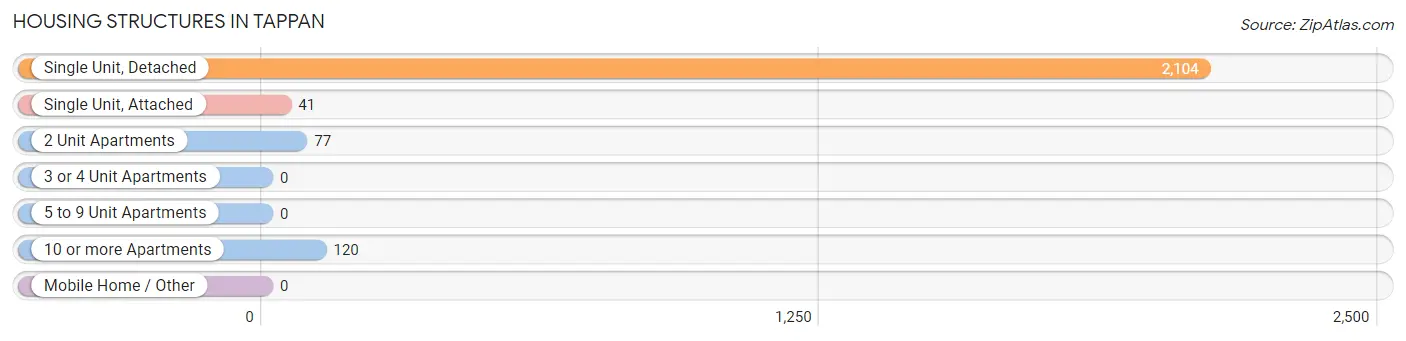
| Structure Type | # Housing Units | % Housing Units |
| Single Unit, Detached | 2,104 | 89.8% |
| Single Unit, Attached | 41 | 1.8% |
| 2 Unit Apartments | 77 | 3.3% |
| 3 or 4 Unit Apartments | 0 | 0.0% |
| 5 to 9 Unit Apartments | 0 | 0.0% |
| 10 or more Apartments | 120 | 5.1% |
| Mobile Home / Other | 0 | 0.0% |
| Total | 2,342 | 100.0% |
Housing Structures by Occupancy in Tappan
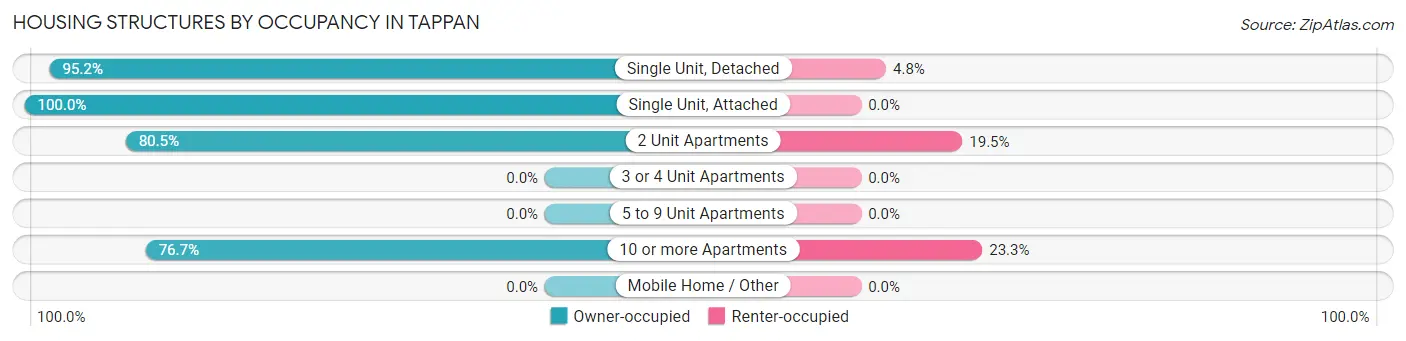
| Structure Type | Owner-occupied | Renter-occupied |
| Single Unit, Detached | 2,003 (95.2%) | 101 (4.8%) |
| Single Unit, Attached | 41 (100.0%) | 0 (0.0%) |
| 2 Unit Apartments | 62 (80.5%) | 15 (19.5%) |
| 3 or 4 Unit Apartments | 0 (0.0%) | 0 (0.0%) |
| 5 to 9 Unit Apartments | 0 (0.0%) | 0 (0.0%) |
| 10 or more Apartments | 92 (76.7%) | 28 (23.3%) |
| Mobile Home / Other | 0 (0.0%) | 0 (0.0%) |
| Total | 2,198 (93.9%) | 144 (6.1%) |
Housing Structures by Number of Rooms in Tappan
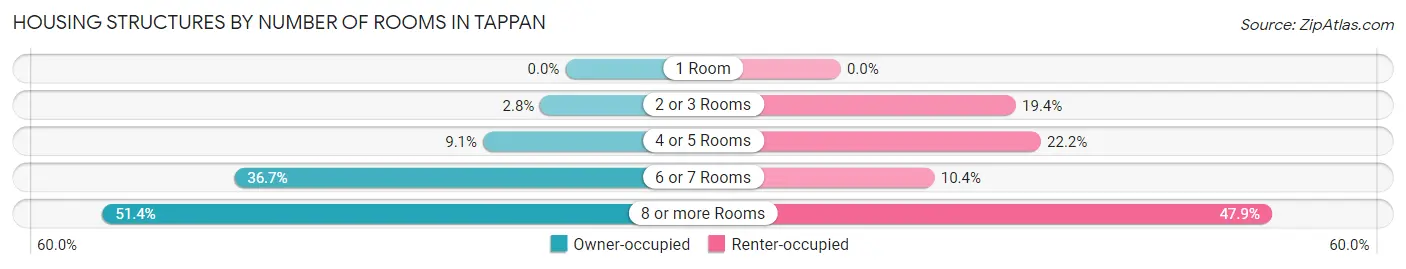
| Number of Rooms | Owner-occupied | Renter-occupied |
| 1 Room | 0 (0.0%) | 0 (0.0%) |
| 2 or 3 Rooms | 61 (2.8%) | 28 (19.4%) |
| 4 or 5 Rooms | 201 (9.1%) | 32 (22.2%) |
| 6 or 7 Rooms | 807 (36.7%) | 15 (10.4%) |
| 8 or more Rooms | 1,129 (51.4%) | 69 (47.9%) |
| Total | 2,198 (100.0%) | 144 (100.0%) |
Housing Structure by Heating Type in Tappan
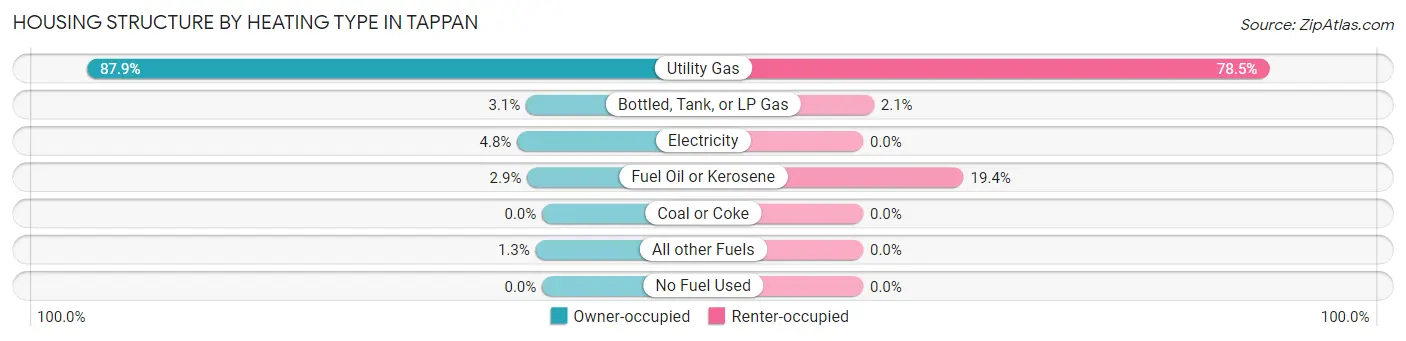
| Heating Type | Owner-occupied | Renter-occupied |
| Utility Gas | 1,933 (87.9%) | 113 (78.5%) |
| Bottled, Tank, or LP Gas | 68 (3.1%) | 3 (2.1%) |
| Electricity | 106 (4.8%) | 0 (0.0%) |
| Fuel Oil or Kerosene | 63 (2.9%) | 28 (19.4%) |
| Coal or Coke | 0 (0.0%) | 0 (0.0%) |
| All other Fuels | 28 (1.3%) | 0 (0.0%) |
| No Fuel Used | 0 (0.0%) | 0 (0.0%) |
| Total | 2,198 (100.0%) | 144 (100.0%) |
Household Vehicle Usage in Tappan
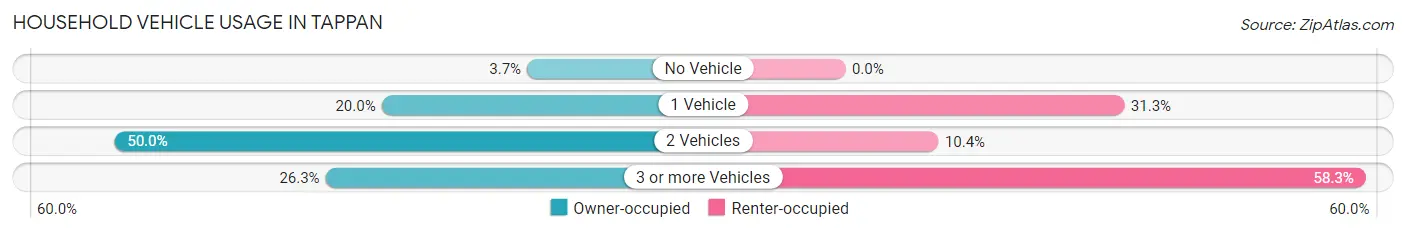
| Vehicles per Household | Owner-occupied | Renter-occupied |
| No Vehicle | 82 (3.7%) | 0 (0.0%) |
| 1 Vehicle | 440 (20.0%) | 45 (31.2%) |
| 2 Vehicles | 1,098 (49.9%) | 15 (10.4%) |
| 3 or more Vehicles | 578 (26.3%) | 84 (58.3%) |
| Total | 2,198 (100.0%) | 144 (100.0%) |
Real Estate & Mortgages in Tappan
Real Estate and Mortgage Overview in Tappan
| Characteristic | Without Mortgage | With Mortgage |
| Housing Units | 766 | 1,432 |
| Median Property Value | $565,200 | $600,400 |
| Median Household Income | $137,500 | $903 |
| Monthly Housing Costs | $1,501 | $1,057 |
| Real Estate Taxes | $10,001 | $0 |
Property Value by Mortgage Status in Tappan
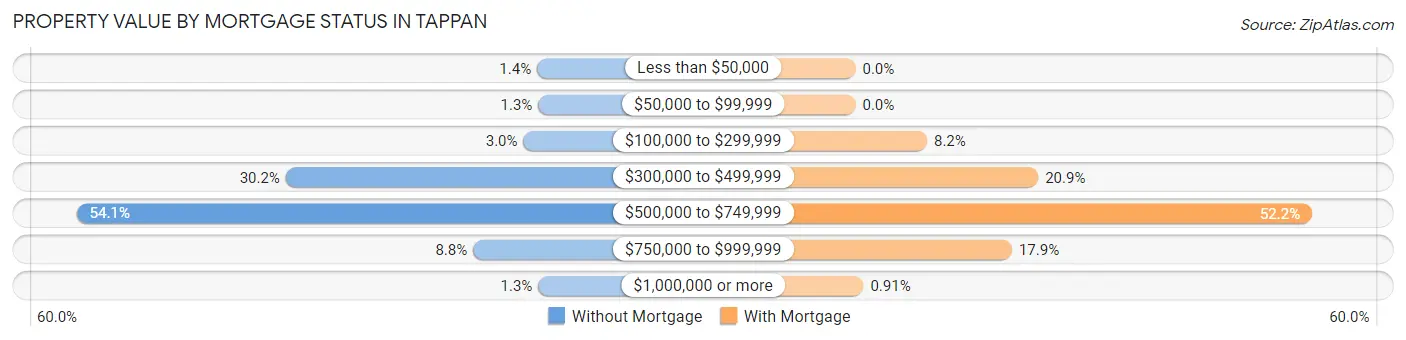
| Property Value | Without Mortgage | With Mortgage |
| Less than $50,000 | 11 (1.4%) | 0 (0.0%) |
| $50,000 to $99,999 | 10 (1.3%) | 0 (0.0%) |
| $100,000 to $299,999 | 23 (3.0%) | 117 (8.2%) |
| $300,000 to $499,999 | 231 (30.2%) | 299 (20.9%) |
| $500,000 to $749,999 | 414 (54.0%) | 747 (52.2%) |
| $750,000 to $999,999 | 67 (8.7%) | 256 (17.9%) |
| $1,000,000 or more | 10 (1.3%) | 13 (0.9%) |
| Total | 766 (100.0%) | 1,432 (100.0%) |
Household Income by Mortgage Status in Tappan
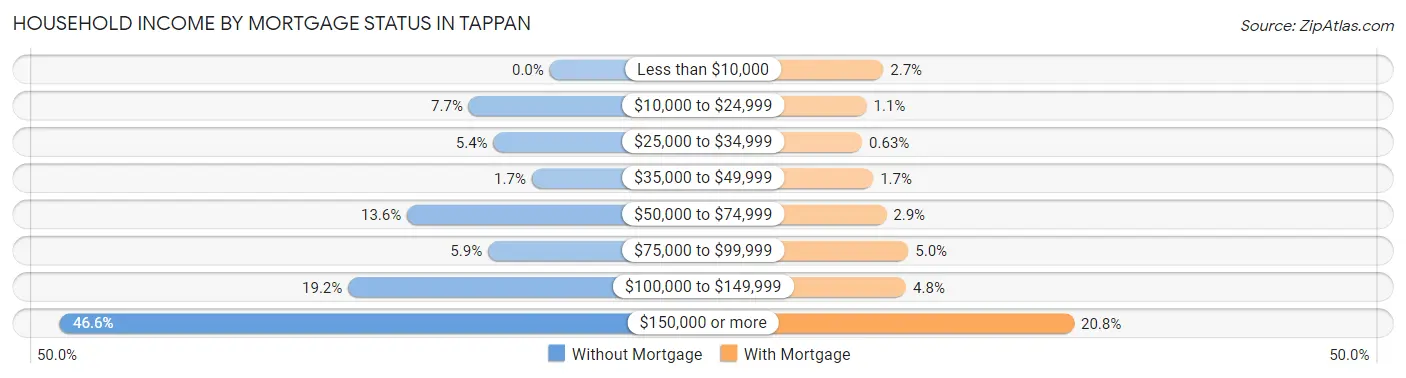
| Household Income | Without Mortgage | With Mortgage |
| Less than $10,000 | 0 (0.0%) | 38 (2.6%) |
| $10,000 to $24,999 | 59 (7.7%) | 15 (1.1%) |
| $25,000 to $34,999 | 41 (5.3%) | 9 (0.6%) |
| $35,000 to $49,999 | 13 (1.7%) | 24 (1.7%) |
| $50,000 to $74,999 | 104 (13.6%) | 42 (2.9%) |
| $75,000 to $99,999 | 45 (5.9%) | 72 (5.0%) |
| $100,000 to $149,999 | 147 (19.2%) | 69 (4.8%) |
| $150,000 or more | 357 (46.6%) | 298 (20.8%) |
| Total | 766 (100.0%) | 1,432 (100.0%) |
Property Value to Household Income Ratio in Tappan
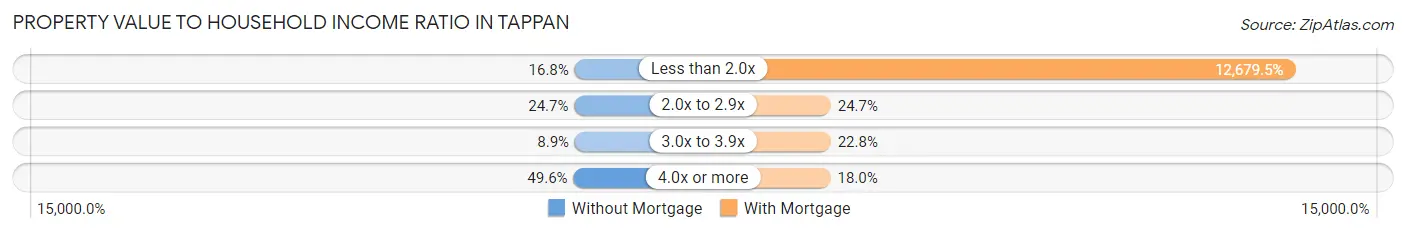
| Value-to-Income Ratio | Without Mortgage | With Mortgage |
| Less than 2.0x | 129 (16.8%) | 181,571 (12,679.5%) |
| 2.0x to 2.9x | 189 (24.7%) | 353 (24.6%) |
| 3.0x to 3.9x | 68 (8.9%) | 327 (22.8%) |
| 4.0x or more | 380 (49.6%) | 257 (17.9%) |
| Total | 766 (100.0%) | 1,432 (100.0%) |
Real Estate Taxes by Mortgage Status in Tappan
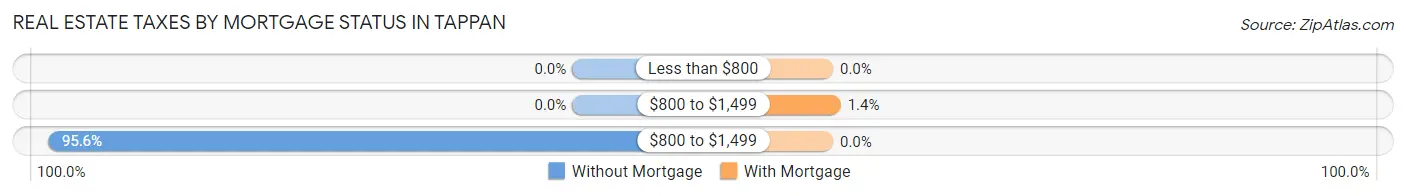
| Property Taxes | Without Mortgage | With Mortgage |
| Less than $800 | 0 (0.0%) | 0 (0.0%) |
| $800 to $1,499 | 0 (0.0%) | 20 (1.4%) |
| $800 to $1,499 | 732 (95.6%) | 0 (0.0%) |
| Total | 766 (100.0%) | 1,432 (100.0%) |
Health & Disability in Tappan
Health Insurance Coverage by Age in Tappan
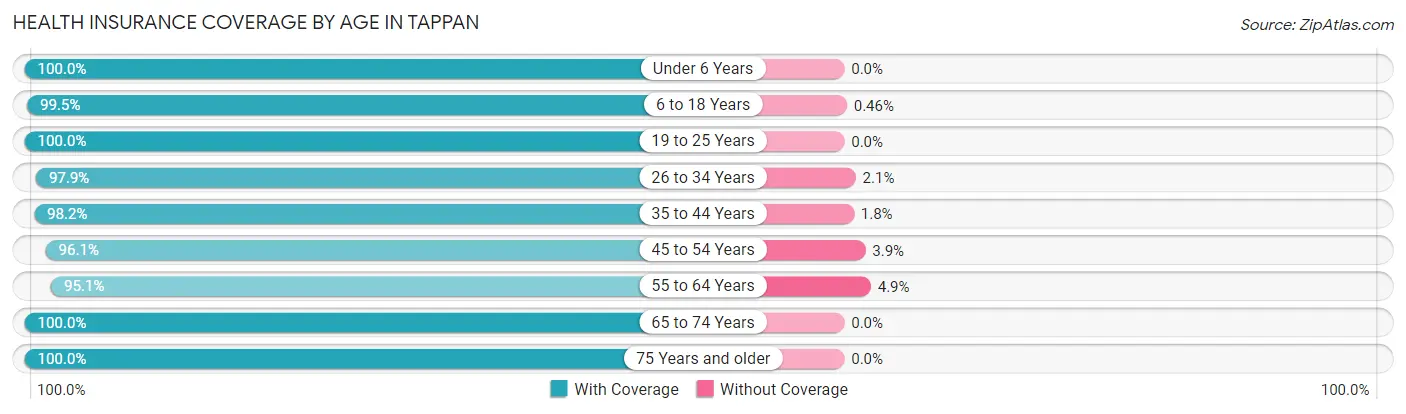
| Age Bracket | With Coverage | Without Coverage |
| Under 6 Years | 238 (100.0%) | 0 (0.0%) |
| 6 to 18 Years | 1,077 (99.5%) | 5 (0.5%) |
| 19 to 25 Years | 630 (100.0%) | 0 (0.0%) |
| 26 to 34 Years | 600 (97.9%) | 13 (2.1%) |
| 35 to 44 Years | 830 (98.2%) | 15 (1.8%) |
| 45 to 54 Years | 1,075 (96.1%) | 44 (3.9%) |
| 55 to 64 Years | 1,077 (95.1%) | 56 (4.9%) |
| 65 to 74 Years | 582 (100.0%) | 0 (0.0%) |
| 75 Years and older | 768 (100.0%) | 0 (0.0%) |
| Total | 6,877 (98.1%) | 133 (1.9%) |
Health Insurance Coverage by Citizenship Status in Tappan
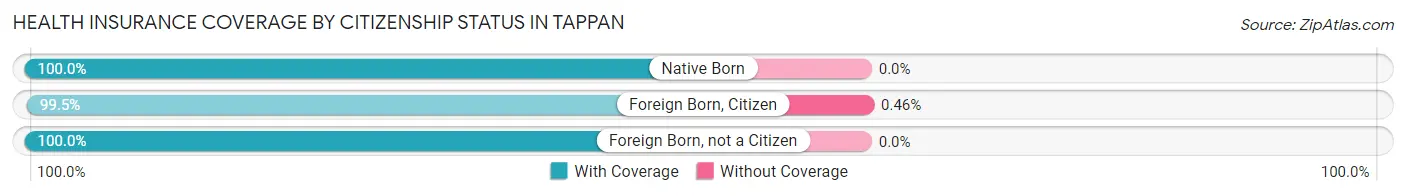
| Citizenship Status | With Coverage | Without Coverage |
| Native Born | 238 (100.0%) | 0 (0.0%) |
| Foreign Born, Citizen | 1,077 (99.5%) | 5 (0.5%) |
| Foreign Born, not a Citizen | 630 (100.0%) | 0 (0.0%) |
Health Insurance Coverage by Household Income in Tappan
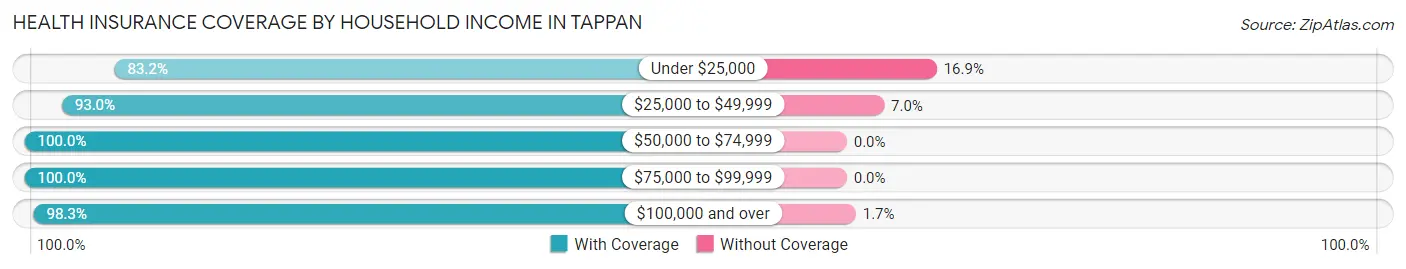
| Household Income | With Coverage | Without Coverage |
| Under $25,000 | 74 (83.2%) | 15 (16.9%) |
| $25,000 to $49,999 | 266 (93.0%) | 20 (7.0%) |
| $50,000 to $74,999 | 472 (100.0%) | 0 (0.0%) |
| $75,000 to $99,999 | 344 (100.0%) | 0 (0.0%) |
| $100,000 and over | 5,711 (98.3%) | 98 (1.7%) |
Public vs Private Health Insurance Coverage by Age in Tappan
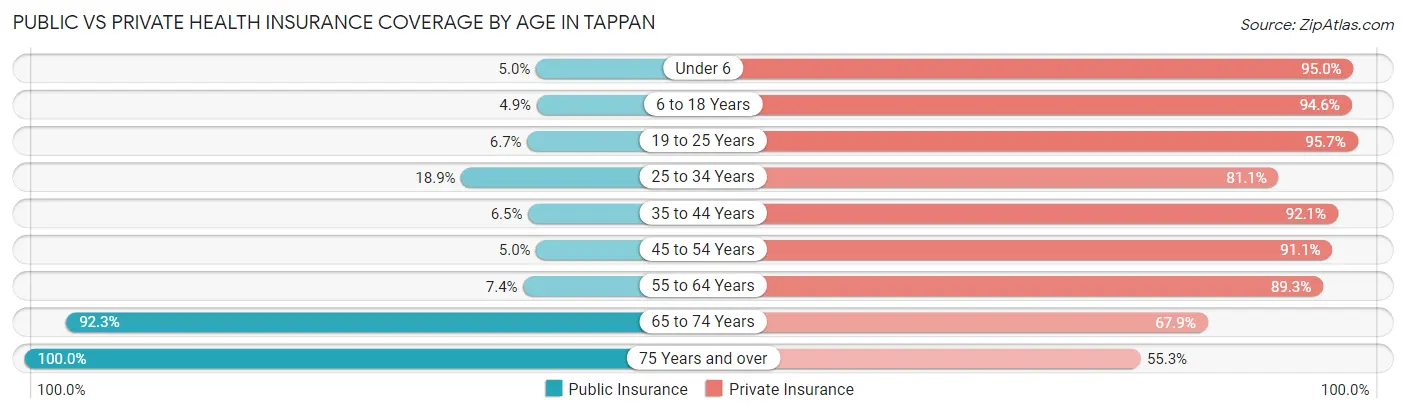
| Age Bracket | Public Insurance | Private Insurance |
| Under 6 | 12 (5.0%) | 226 (95.0%) |
| 6 to 18 Years | 53 (4.9%) | 1,024 (94.6%) |
| 19 to 25 Years | 42 (6.7%) | 603 (95.7%) |
| 25 to 34 Years | 116 (18.9%) | 497 (81.1%) |
| 35 to 44 Years | 55 (6.5%) | 778 (92.1%) |
| 45 to 54 Years | 56 (5.0%) | 1,019 (91.1%) |
| 55 to 64 Years | 84 (7.4%) | 1,012 (89.3%) |
| 65 to 74 Years | 537 (92.3%) | 395 (67.9%) |
| 75 Years and over | 768 (100.0%) | 425 (55.3%) |
| Total | 1,723 (24.6%) | 5,979 (85.3%) |
Disability Status by Sex by Age in Tappan
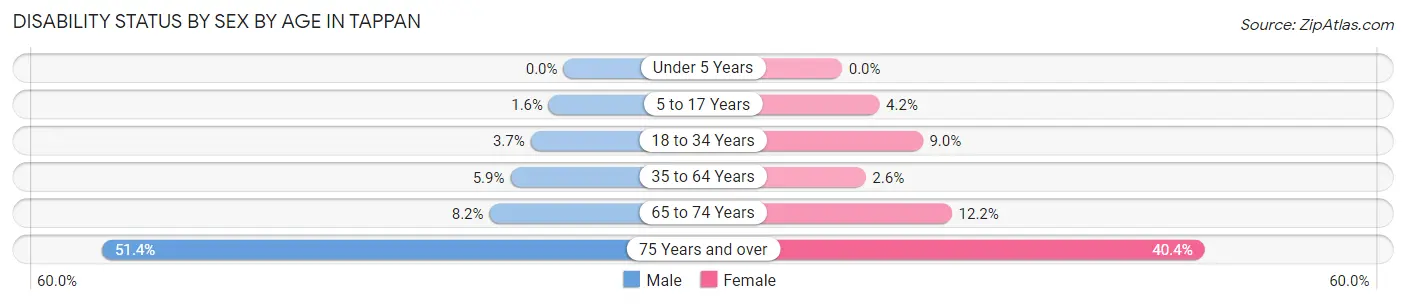
| Age Bracket | Male | Female |
| Under 5 Years | 0 (0.0%) | 0 (0.0%) |
| 5 to 17 Years | 8 (1.6%) | 24 (4.2%) |
| 18 to 34 Years | 24 (3.6%) | 59 (9.0%) |
| 35 to 64 Years | 91 (5.9%) | 41 (2.6%) |
| 65 to 74 Years | 21 (8.2%) | 40 (12.2%) |
| 75 Years and over | 130 (51.4%) | 208 (40.4%) |
Disability Class by Sex by Age in Tappan
Disability Class: Hearing Difficulty
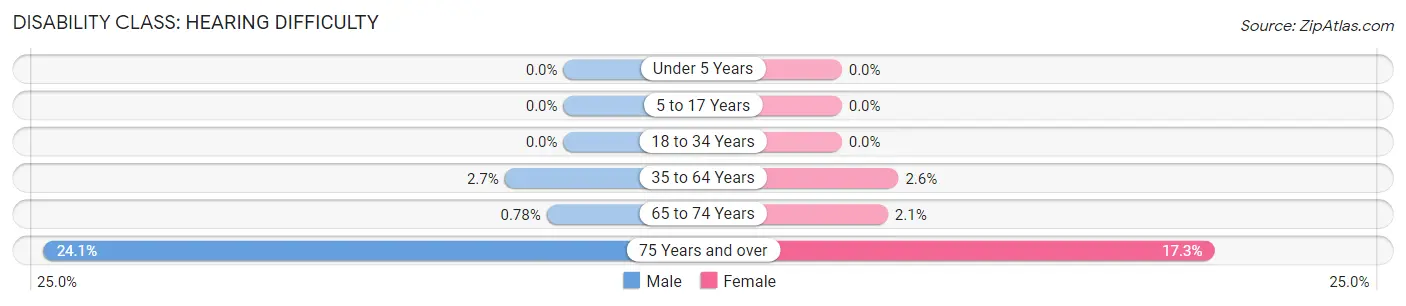
| Age Bracket | Male | Female |
| Under 5 Years | 0 (0.0%) | 0 (0.0%) |
| 5 to 17 Years | 0 (0.0%) | 0 (0.0%) |
| 18 to 34 Years | 0 (0.0%) | 0 (0.0%) |
| 35 to 64 Years | 42 (2.7%) | 41 (2.6%) |
| 65 to 74 Years | 2 (0.8%) | 7 (2.1%) |
| 75 Years and over | 61 (24.1%) | 89 (17.3%) |
Disability Class: Vision Difficulty
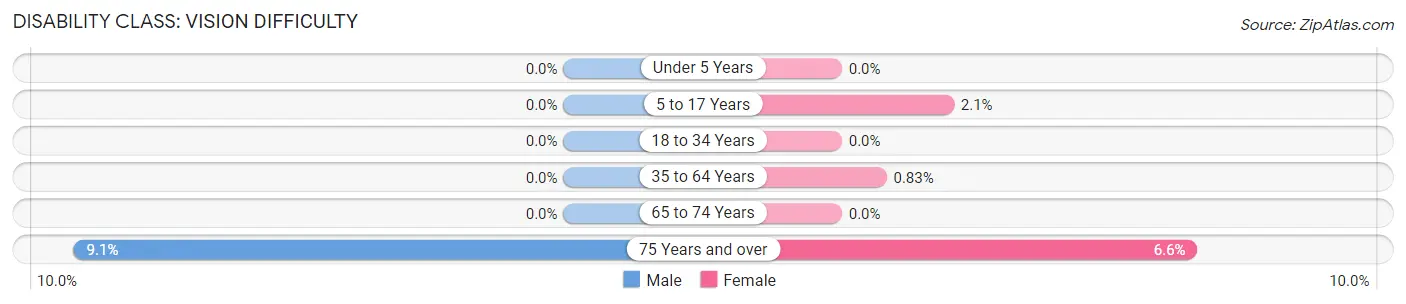
| Age Bracket | Male | Female |
| Under 5 Years | 0 (0.0%) | 0 (0.0%) |
| 5 to 17 Years | 0 (0.0%) | 12 (2.1%) |
| 18 to 34 Years | 0 (0.0%) | 0 (0.0%) |
| 35 to 64 Years | 0 (0.0%) | 13 (0.8%) |
| 65 to 74 Years | 0 (0.0%) | 0 (0.0%) |
| 75 Years and over | 23 (9.1%) | 34 (6.6%) |
Disability Class: Cognitive Difficulty
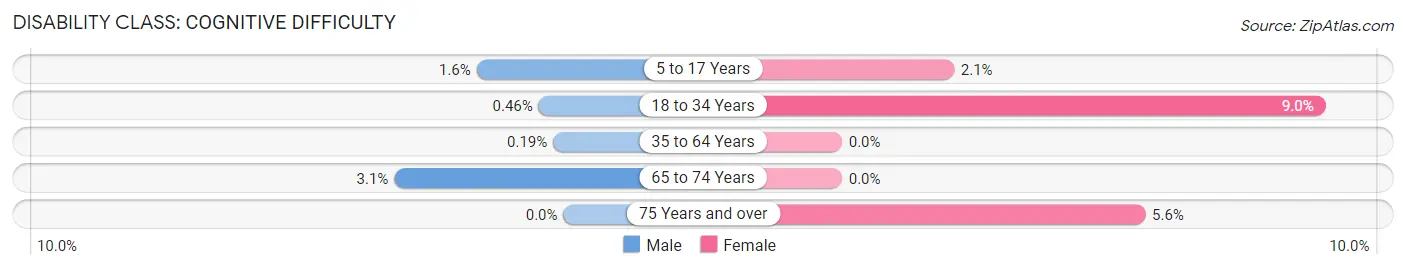
| Age Bracket | Male | Female |
| 5 to 17 Years | 8 (1.6%) | 12 (2.1%) |
| 18 to 34 Years | 3 (0.5%) | 59 (9.0%) |
| 35 to 64 Years | 3 (0.2%) | 0 (0.0%) |
| 65 to 74 Years | 8 (3.1%) | 0 (0.0%) |
| 75 Years and over | 0 (0.0%) | 29 (5.6%) |
Disability Class: Ambulatory Difficulty
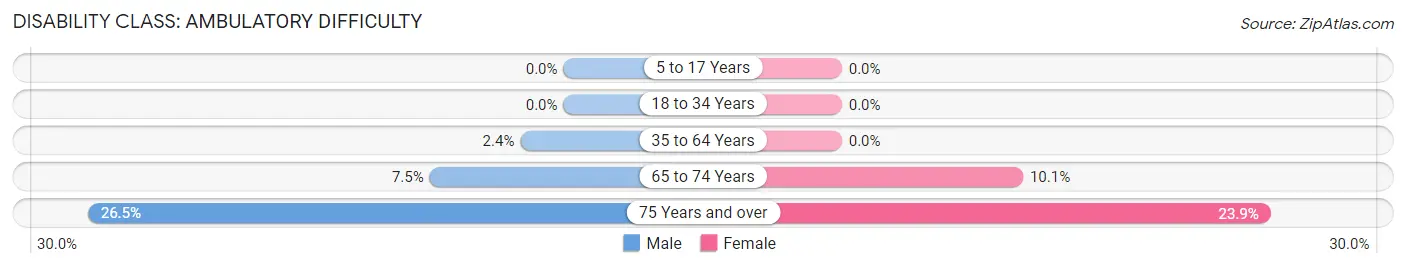
| Age Bracket | Male | Female |
| 5 to 17 Years | 0 (0.0%) | 0 (0.0%) |
| 18 to 34 Years | 0 (0.0%) | 0 (0.0%) |
| 35 to 64 Years | 37 (2.4%) | 0 (0.0%) |
| 65 to 74 Years | 19 (7.4%) | 33 (10.1%) |
| 75 Years and over | 67 (26.5%) | 123 (23.9%) |
Disability Class: Self-Care Difficulty
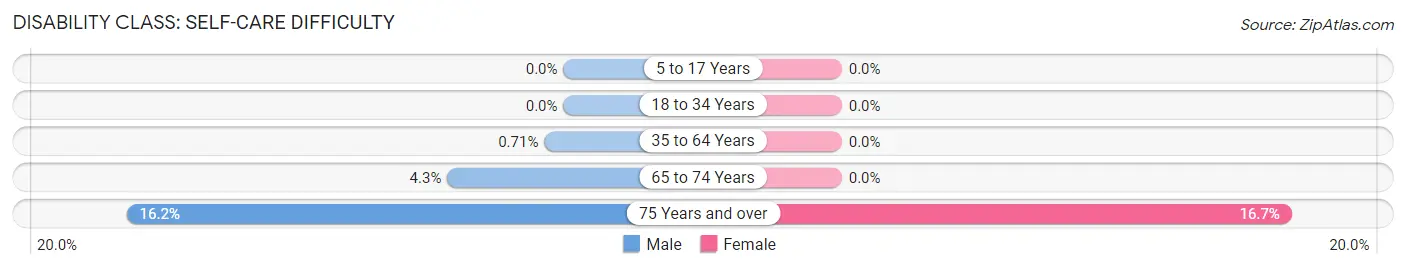
| Age Bracket | Male | Female |
| 5 to 17 Years | 0 (0.0%) | 0 (0.0%) |
| 18 to 34 Years | 0 (0.0%) | 0 (0.0%) |
| 35 to 64 Years | 11 (0.7%) | 0 (0.0%) |
| 65 to 74 Years | 11 (4.3%) | 0 (0.0%) |
| 75 Years and over | 41 (16.2%) | 86 (16.7%) |
Technology Access in Tappan
Computing Device Access in Tappan
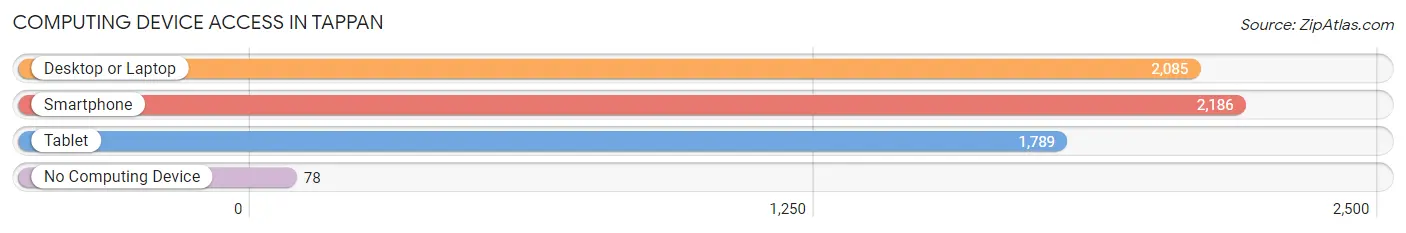
| Device Type | # Households | % Households |
| Desktop or Laptop | 2,085 | 89.0% |
| Smartphone | 2,186 | 93.3% |
| Tablet | 1,789 | 76.4% |
| No Computing Device | 78 | 3.3% |
| Total | 2,342 | 100.0% |
Internet Access in Tappan
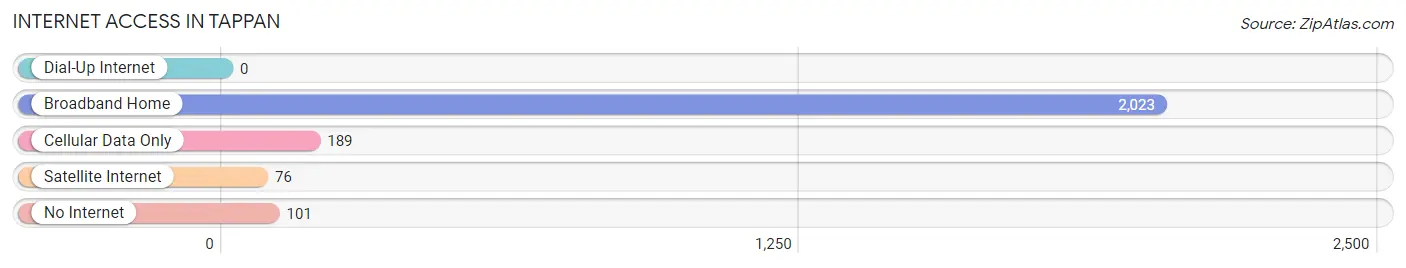
| Internet Type | # Households | % Households |
| Dial-Up Internet | 0 | 0.0% |
| Broadband Home | 2,023 | 86.4% |
| Cellular Data Only | 189 | 8.1% |
| Satellite Internet | 76 | 3.3% |
| No Internet | 101 | 4.3% |
| Total | 2,342 | 100.0% |
Tappan Summary
Tappan is a hamlet located in the town of Orangetown in Rockland County, New York. It is located on the west bank of the Hudson River, about 20 miles north of New York City. The hamlet is bordered by the towns of Clarkstown to the north, Orangetown to the east, and the village of Piermont to the south.
History
Tappan was originally inhabited by the Lenape Native Americans. The area was first settled by Europeans in 1686, when a group of Dutch settlers purchased land from the local Native Americans. The hamlet was named after the Tappan tribe, a sub-tribe of the Lenape. The hamlet was part of the original Orange County, which was established in 1683.
In 1776, during the Revolutionary War, the hamlet was the site of the Battle of Tappan. The battle was a major victory for the American forces, and it helped to turn the tide of the war in favor of the Americans.
In the 19th century, Tappan was a popular summer resort for wealthy New Yorkers. The hamlet was home to several large estates, including the estate of industrialist Cornelius Vanderbilt.
Geography
Tappan is located in the town of Orangetown in Rockland County, New York. It is situated on the west bank of the Hudson River, about 20 miles north of New York City. The hamlet is bordered by the towns of Clarkstown to the north, Orangetown to the east, and the village of Piermont to the south.
The hamlet has a total area of 1.3 square miles, all of which is land. The terrain is mostly flat, with some rolling hills. The highest point in the hamlet is the summit of Tappan Hill, which is approximately 200 feet above sea level.
Economy
Tappan has a small but vibrant economy. The hamlet is home to several small businesses, including restaurants, retail stores, and professional services. The hamlet is also home to several large corporations, including the pharmaceutical company Pfizer and the financial services company UBS.
The hamlet is also home to several educational institutions, including the Tappan Free Library, the Tappan Hill School, and the Tappan Zee Bridge Institute.
Demographics
As of the 2010 census, the population of Tappan was 5,811. The racial makeup of the hamlet was 87.3% White, 5.2% African American, 0.3% Native American, 3.2% Asian, and 3.9% from other races. Hispanic or Latino of any race were 8.3% of the population.
The median household income in Tappan was $90,945, and the median family income was $103,945. The per capita income was $41,945. About 4.2% of families and 5.7% of the population were below the poverty line.
Common Questions
What is Per Capita Income in Tappan?
Per Capita income in Tappan is $66,274.
What is the Median Family Income in Tappan?
Median Family Income in Tappan is $188,092.
What is the Median Household income in Tappan?
Median Household Income in Tappan is $171,125.
What is Income or Wage Gap in Tappan?
Income or Wage Gap in Tappan is 40.0%.
Women in Tappan earn 60.0 cents for every dollar earned by a man.
What is Inequality or Gini Index in Tappan?
Inequality or Gini Index in Tappan is 0.38.
What is the Total Population of Tappan?
Total Population of Tappan is 7,016.
What is the Total Male Population of Tappan?
Total Male Population of Tappan is 3,319.
What is the Total Female Population of Tappan?
Total Female Population of Tappan is 3,697.
What is the Ratio of Males per 100 Females in Tappan?
There are 89.78 Males per 100 Females in Tappan.
What is the Ratio of Females per 100 Males in Tappan?
There are 111.39 Females per 100 Males in Tappan.
What is the Median Population Age in Tappan?
Median Population Age in Tappan is 45.9 Years.
What is the Average Family Size in Tappan
Average Family Size in Tappan is 3.3 People.
What is the Average Household Size in Tappan
Average Household Size in Tappan is 3.0 People.
How Large is the Labor Force in Tappan?
There are 4,168 People in the Labor Forcein in Tappan.
What is the Percentage of People in the Labor Force in Tappan?
69.5% of People are in the Labor Force in Tappan.
What is the Unemployment Rate in Tappan?
Unemployment Rate in Tappan is 8.4%.