Middleville, NY Map & Demographics
Middleville Map
Middleville Overview
$24,440
PER CAPITA INCOME
$92,500
AVG FAMILY INCOME
$76,458
AVG HOUSEHOLD INCOME
0.34
INEQUALITY / GINI INDEX
622
TOTAL POPULATION
301
MALE POPULATION
321
FEMALE POPULATION
93.77
MALES / 100 FEMALES
106.64
FEMALES / 100 MALES
32.3
MEDIAN AGE
3.7
AVG FAMILY SIZE
3.0
AVG HOUSEHOLD SIZE
256
LABOR FORCE [ PEOPLE ]
59.4%
PERCENT IN LABOR FORCE
6.6%
UNEMPLOYMENT RATE
Middleville Zip Codes
Middleville Area Codes
Income in Middleville
Income Overview in Middleville
Per Capita Income in Middleville is $24,440, while median incomes of families and households are $92,500 and $76,458 respectively.
| Characteristic | Number | Measure |
| Per Capita Income | 622 | $24,440 |
| Median Family Income | 144 | $92,500 |
| Mean Family Income | 144 | $89,401 |
| Median Household Income | 203 | $76,458 |
| Mean Household Income | 203 | $73,461 |
| Income Deficit | 144 | $0 |
| Wage / Income Gap (%) | 622 | 0.00% |
| Wage / Income Gap ($) | 622 | 100.00¢ per $1 |
| Gini / Inequality Index | 622 | 0.34 |
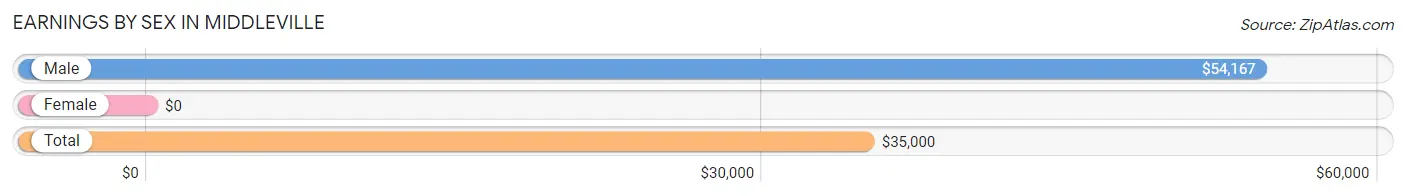
Earnings by Sex in Middleville
| Sex | Number | Average Earnings |
| Male | 146 (55.7%) | $54,167 |
| Female | 116 (44.3%) | $0 |
| Total | 262 (100.0%) | $35,000 |
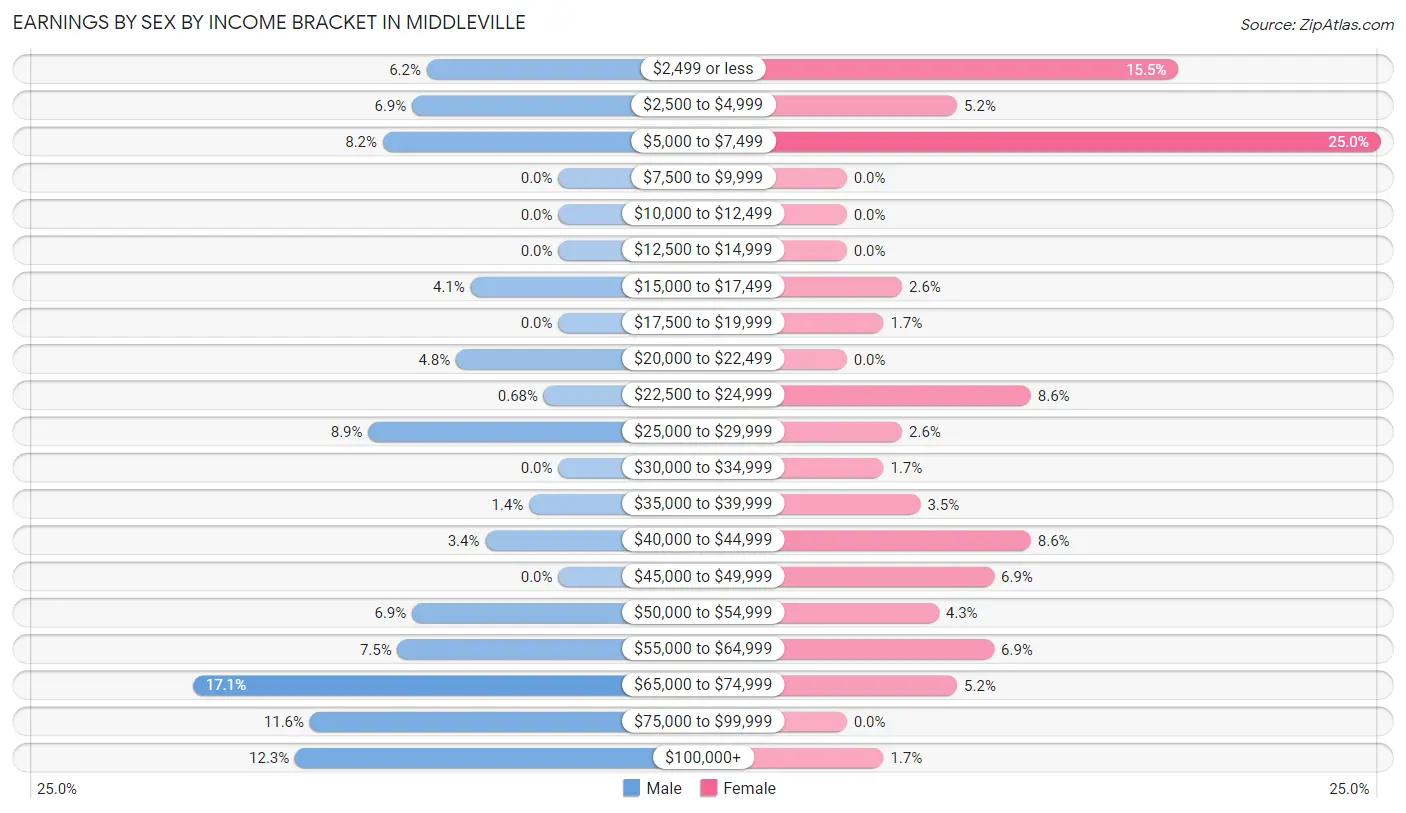
Earnings by Sex by Income Bracket in Middleville
The most common earnings brackets in Middleville are $65,000 to $74,999 for men (25 | 17.1%) and $5,000 to $7,499 for women (29 | 25.0%).
| Income | Male | Female |
| $2,499 or less | 9 (6.2%) | 18 (15.5%) |
| $2,500 to $4,999 | 10 (6.9%) | 6 (5.2%) |
| $5,000 to $7,499 | 12 (8.2%) | 29 (25.0%) |
| $7,500 to $9,999 | 0 (0.0%) | 0 (0.0%) |
| $10,000 to $12,499 | 0 (0.0%) | 0 (0.0%) |
| $12,500 to $14,999 | 0 (0.0%) | 0 (0.0%) |
| $15,000 to $17,499 | 6 (4.1%) | 3 (2.6%) |
| $17,500 to $19,999 | 0 (0.0%) | 2 (1.7%) |
| $20,000 to $22,499 | 7 (4.8%) | 0 (0.0%) |
| $22,500 to $24,999 | 1 (0.7%) | 10 (8.6%) |
| $25,000 to $29,999 | 13 (8.9%) | 3 (2.6%) |
| $30,000 to $34,999 | 0 (0.0%) | 2 (1.7%) |
| $35,000 to $39,999 | 2 (1.4%) | 4 (3.5%) |
| $40,000 to $44,999 | 5 (3.4%) | 10 (8.6%) |
| $45,000 to $49,999 | 0 (0.0%) | 8 (6.9%) |
| $50,000 to $54,999 | 10 (6.9%) | 5 (4.3%) |
| $55,000 to $64,999 | 11 (7.5%) | 8 (6.9%) |
| $65,000 to $74,999 | 25 (17.1%) | 6 (5.2%) |
| $75,000 to $99,999 | 17 (11.6%) | 0 (0.0%) |
| $100,000+ | 18 (12.3%) | 2 (1.7%) |
| Total | 146 (100.0%) | 116 (100.0%) |
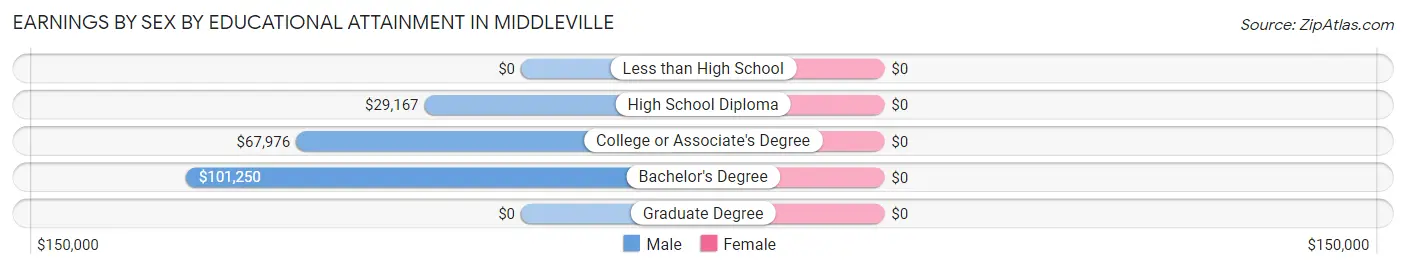
Earnings by Sex by Educational Attainment in Middleville
| Educational Attainment | Male Income | Female Income |
| Less than High School | - | - |
| High School Diploma | $29,167 | $0 |
| College or Associate's Degree | $67,976 | $0 |
| Bachelor's Degree | $101,250 | $0 |
| Graduate Degree | - | - |
| Total | $57,813 | $30,000 |
Family Income in Middleville
Family Income Brackets in Middleville
According to the Middleville family income data, there are 48 families falling into the $100,000 to $149,999 income range, which is the most common income bracket and makes up 33.3% of all families.
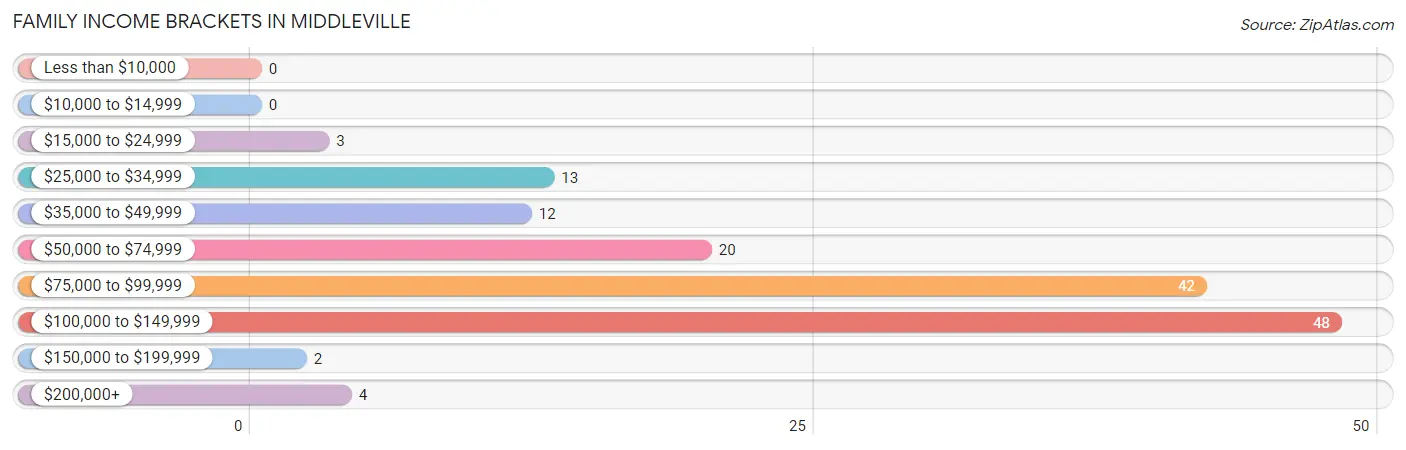
| Income Bracket | # Families | % Families |
| Less than $10,000 | 0 | 0.0% |
| $10,000 to $14,999 | 0 | 0.0% |
| $15,000 to $24,999 | 3 | 2.1% |
| $25,000 to $34,999 | 13 | 9.0% |
| $35,000 to $49,999 | 12 | 8.3% |
| $50,000 to $74,999 | 20 | 13.9% |
| $75,000 to $99,999 | 42 | 29.2% |
| $100,000 to $149,999 | 48 | 33.3% |
| $150,000 to $199,999 | 2 | 1.4% |
| $200,000+ | 4 | 2.8% |
Family Income by Famaliy Size in Middleville
3-person families (19 | 13.2%) account for the highest median family income in Middleville with $95,972 per family, while 2-person families (84 | 58.3%) have the highest median income of $38,334 per family member.
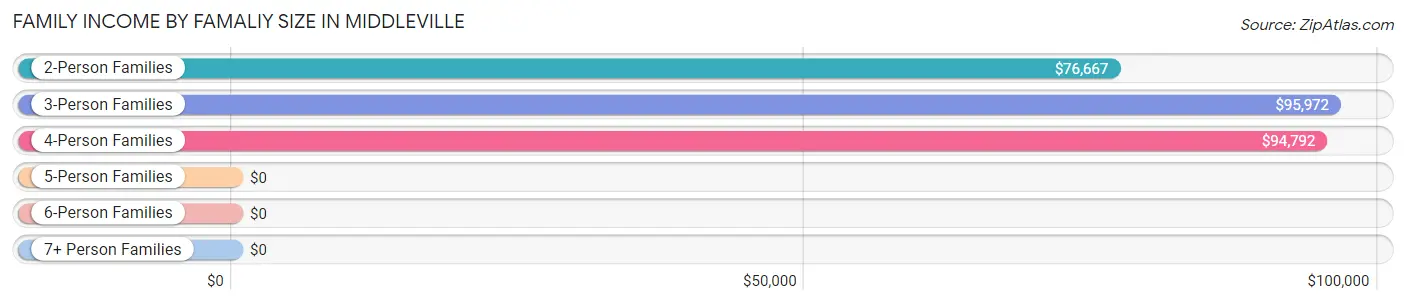
| Income Bracket | # Families | Median Income |
| 2-Person Families | 84 (58.3%) | $76,667 |
| 3-Person Families | 19 (13.2%) | $95,972 |
| 4-Person Families | 19 (13.2%) | $94,792 |
| 5-Person Families | 7 (4.9%) | $0 |
| 6-Person Families | 0 (0.0%) | $0 |
| 7+ Person Families | 15 (10.4%) | $0 |
| Total | 144 (100.0%) | $92,500 |
Family Income by Number of Earners in Middleville
The median family income in Middleville is $92,500, with families comprising 3+ earners (25) having the highest median family income of $123,583, while families with no earners (19) have the lowest median family income of $61,458, accounting for 17.4% and 13.2% of families, respectively.
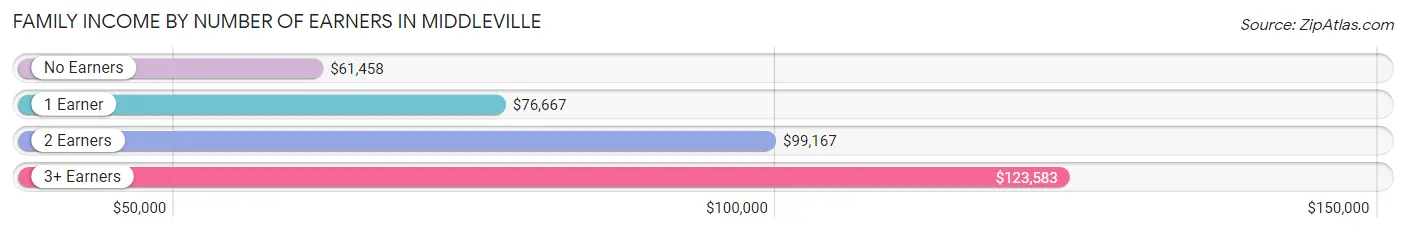
| Number of Earners | # Families | Median Income |
| No Earners | 19 (13.2%) | $61,458 |
| 1 Earner | 50 (34.7%) | $76,667 |
| 2 Earners | 50 (34.7%) | $99,167 |
| 3+ Earners | 25 (17.4%) | $123,583 |
| Total | 144 (100.0%) | $92,500 |
Household Income in Middleville
Household Income Brackets in Middleville
With 50 households falling in the category, the $100,000 to $149,999 income range is the most frequent in Middleville, accounting for 24.6% of all households.
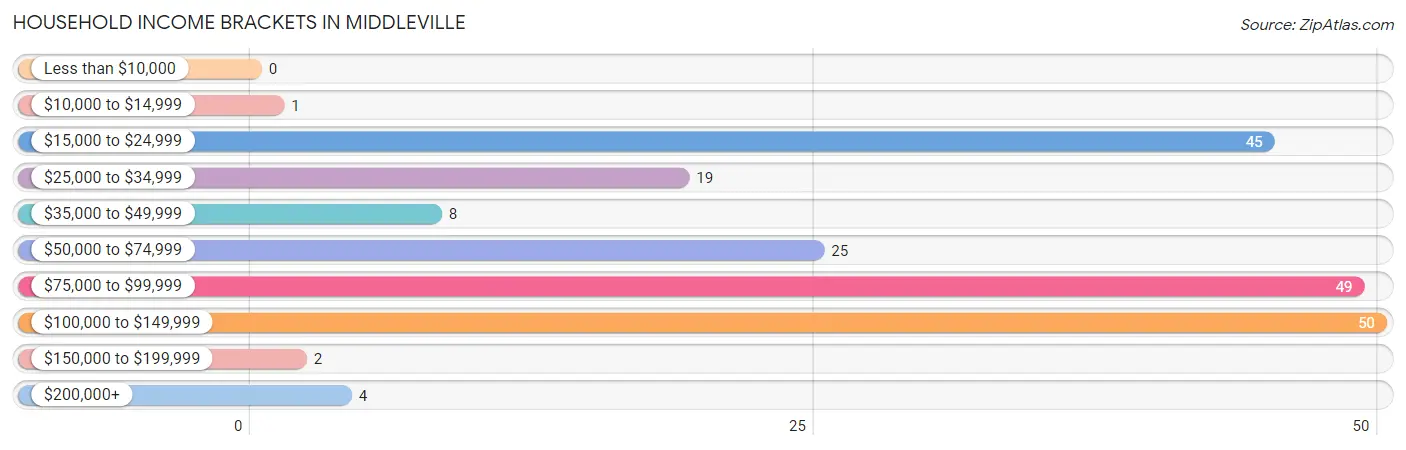
| Income Bracket | # Households | % Households |
| Less than $10,000 | 0 | 0.0% |
| $10,000 to $14,999 | 1 | 0.5% |
| $15,000 to $24,999 | 45 | 22.2% |
| $25,000 to $34,999 | 19 | 9.4% |
| $35,000 to $49,999 | 8 | 3.9% |
| $50,000 to $74,999 | 25 | 12.3% |
| $75,000 to $99,999 | 49 | 24.1% |
| $100,000 to $149,999 | 50 | 24.6% |
| $150,000 to $199,999 | 2 | 1.0% |
| $200,000+ | 4 | 2.0% |
Household Income by Householder Age in Middleville
The median household income in Middleville is $76,458, with the highest median household income of $103,500 found in the 15 to 24 years age bracket for the primary householder. A total of 10 households (4.9%) fall into this category. Meanwhile, the 65+ years age bracket for the primary householder has the lowest median household income of $0, with 70 households (34.5%) in this group.
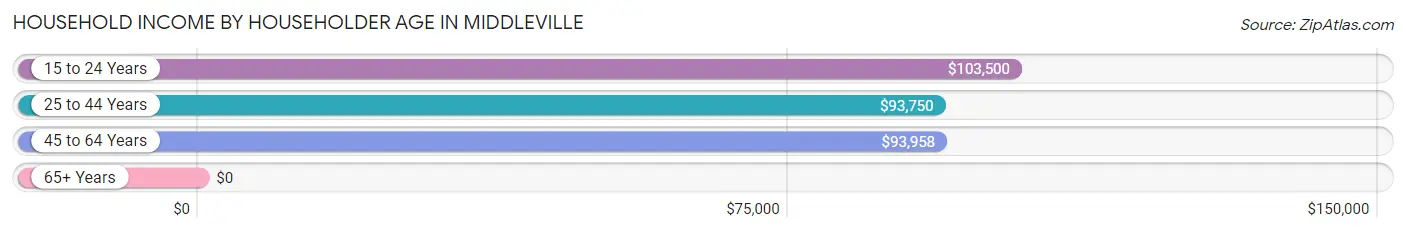
| Income Bracket | # Households | Median Income |
| 15 to 24 Years | 10 (4.9%) | $103,500 |
| 25 to 44 Years | 48 (23.6%) | $93,750 |
| 45 to 64 Years | 75 (36.9%) | $93,958 |
| 65+ Years | 70 (34.5%) | $0 |
| Total | 203 (100.0%) | $76,458 |
Poverty in Middleville
Income Below Poverty by Sex and Age in Middleville
With 2.0% poverty level for males and 10.3% for females among the residents of Middleville, 45 to 54 year old males and 25 to 34 year old females are the most vulnerable to poverty, with 3 males (7.7%) and 9 females (31.0%) in their respective age groups living below the poverty level.
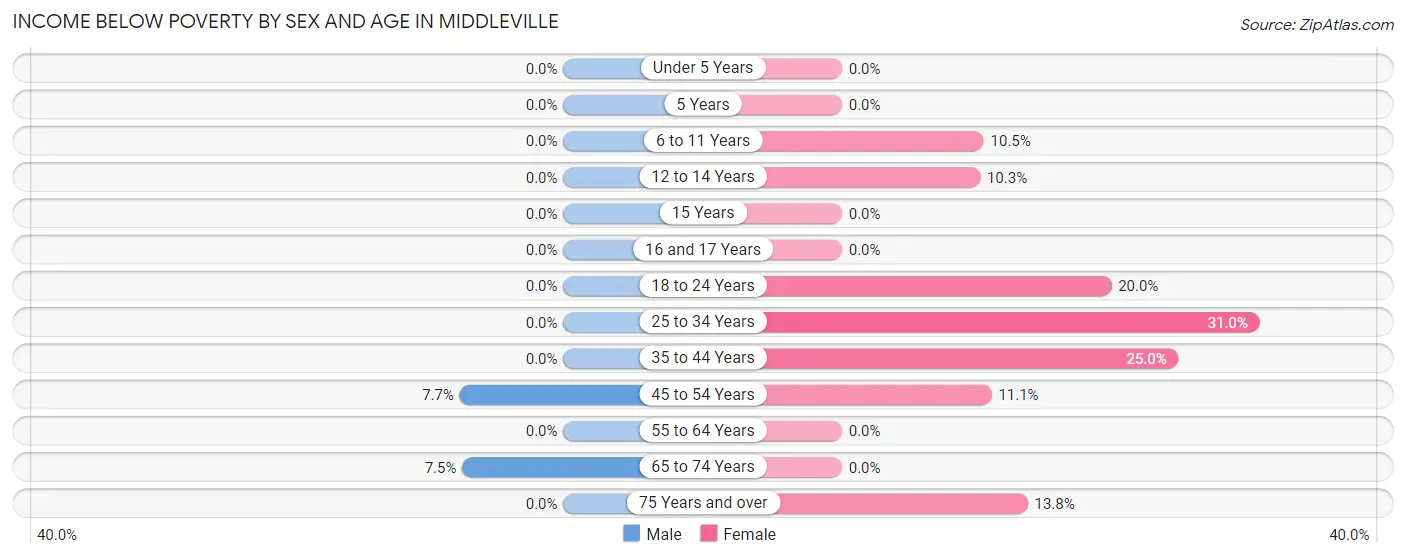
| Age Bracket | Male | Female |
| Under 5 Years | 0 (0.0%) | 0 (0.0%) |
| 5 Years | 0 (0.0%) | 0 (0.0%) |
| 6 to 11 Years | 0 (0.0%) | 4 (10.5%) |
| 12 to 14 Years | 0 (0.0%) | 4 (10.3%) |
| 15 Years | 0 (0.0%) | 0 (0.0%) |
| 16 and 17 Years | 0 (0.0%) | 0 (0.0%) |
| 18 to 24 Years | 0 (0.0%) | 6 (20.0%) |
| 25 to 34 Years | 0 (0.0%) | 9 (31.0%) |
| 35 to 44 Years | 0 (0.0%) | 3 (25.0%) |
| 45 to 54 Years | 3 (7.7%) | 3 (11.1%) |
| 55 to 64 Years | 0 (0.0%) | 0 (0.0%) |
| 65 to 74 Years | 3 (7.5%) | 0 (0.0%) |
| 75 Years and over | 0 (0.0%) | 4 (13.8%) |
| Total | 6 (2.0%) | 33 (10.3%) |
Income Above Poverty by Sex and Age in Middleville
According to the poverty statistics in Middleville, males aged under 5 years and females aged under 5 years are the age groups that are most secure financially, with 100.0% of males and 100.0% of females in these age groups living above the poverty line.
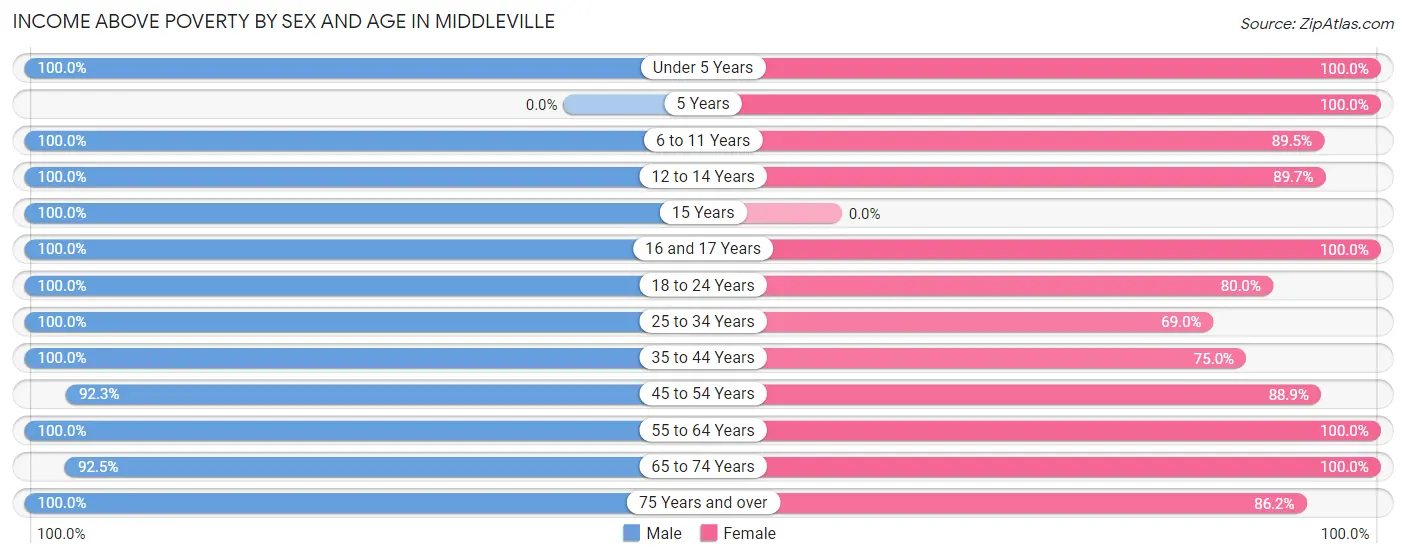
| Age Bracket | Male | Female |
| Under 5 Years | 11 (100.0%) | 47 (100.0%) |
| 5 Years | 0 (0.0%) | 24 (100.0%) |
| 6 to 11 Years | 19 (100.0%) | 34 (89.5%) |
| 12 to 14 Years | 7 (100.0%) | 35 (89.7%) |
| 15 Years | 6 (100.0%) | 0 (0.0%) |
| 16 and 17 Years | 10 (100.0%) | 5 (100.0%) |
| 18 to 24 Years | 12 (100.0%) | 24 (80.0%) |
| 25 to 34 Years | 49 (100.0%) | 20 (69.0%) |
| 35 to 44 Years | 30 (100.0%) | 9 (75.0%) |
| 45 to 54 Years | 36 (92.3%) | 24 (88.9%) |
| 55 to 64 Years | 45 (100.0%) | 25 (100.0%) |
| 65 to 74 Years | 37 (92.5%) | 16 (100.0%) |
| 75 Years and over | 33 (100.0%) | 25 (86.2%) |
| Total | 295 (98.0%) | 288 (89.7%) |
Income Below Poverty Among Married-Couple Families in Middleville
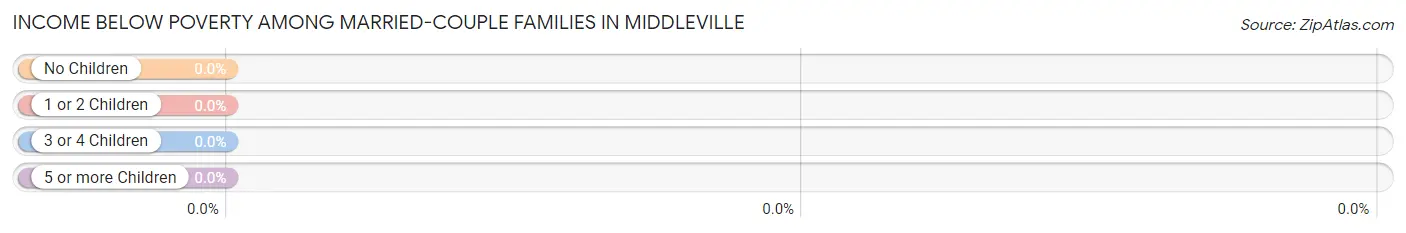
| Children | Above Poverty | Below Poverty |
| No Children | 61 (100.0%) | 0 (0.0%) |
| 1 or 2 Children | 24 (100.0%) | 0 (0.0%) |
| 3 or 4 Children | 15 (100.0%) | 0 (0.0%) |
| 5 or more Children | 0 (0.0%) | 0 (0.0%) |
| Total | 100 (100.0%) | 0 (0.0%) |
Income Below Poverty Among Single-Parent Households in Middleville

| Children | Single Father | Single Mother |
| No Children | 0 (0.0%) | 0 (0.0%) |
| 1 or 2 Children | 0 (0.0%) | 3 (25.0%) |
| 3 or 4 Children | 0 (0.0%) | 0 (0.0%) |
| 5 or more Children | 0 (0.0%) | 0 (0.0%) |
| Total | 0 (0.0%) | 3 (23.1%) |
Income Below Poverty Among Married-Couple vs Single-Parent Households in Middleville
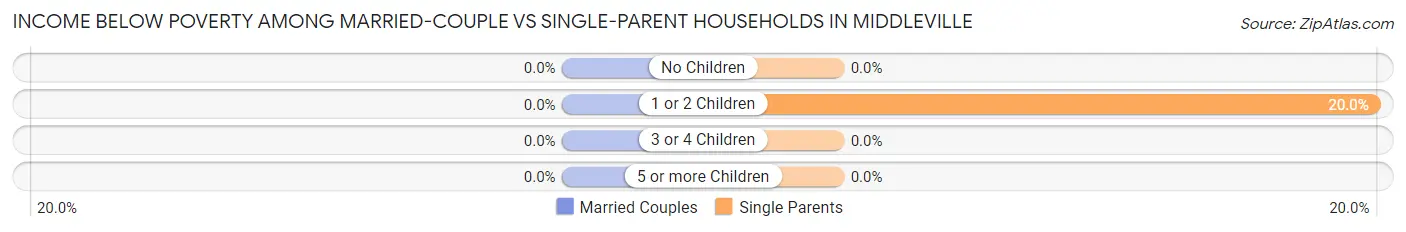
| Children | Married-Couple Families | Single-Parent Households |
| No Children | 0 (0.0%) | 0 (0.0%) |
| 1 or 2 Children | 0 (0.0%) | 3 (20.0%) |
| 3 or 4 Children | 0 (0.0%) | 0 (0.0%) |
| 5 or more Children | 0 (0.0%) | 0 (0.0%) |
| Total | 0 (0.0%) | 3 (6.8%) |
Race in Middleville
The most populous races in Middleville are White / Caucasian (607 | 97.6%), Two or more Races (10 | 1.6%), and Black / African American (5 | 0.8%).
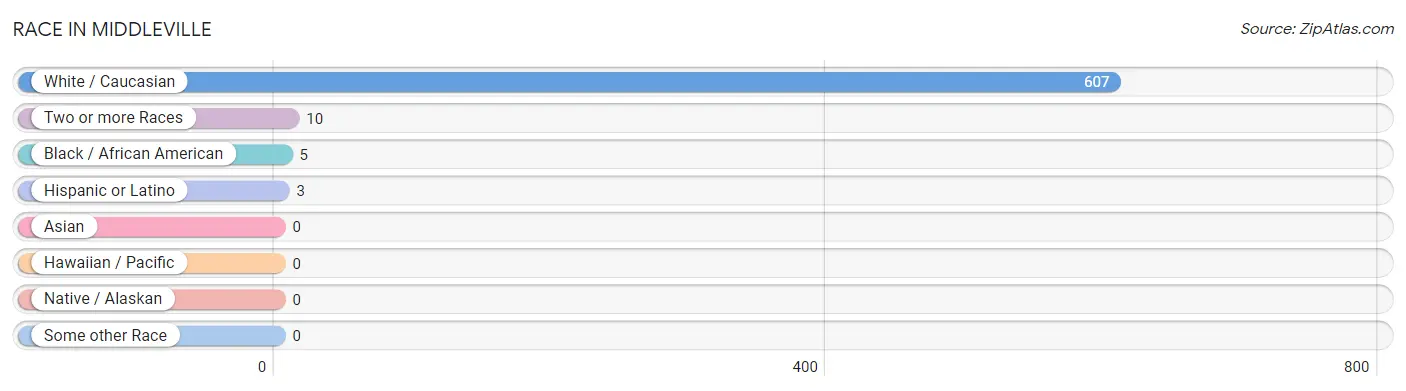
| Race | # Population | % Population |
| Asian | 0 | 0.0% |
| Black / African American | 5 | 0.8% |
| Hawaiian / Pacific | 0 | 0.0% |
| Hispanic or Latino | 3 | 0.5% |
| Native / Alaskan | 0 | 0.0% |
| White / Caucasian | 607 | 97.6% |
| Two or more Races | 10 | 1.6% |
| Some other Race | 0 | 0.0% |
| Total | 622 | 100.0% |
Ancestry in Middleville
The most populous ancestries reported in Middleville are German (290 | 46.6%), Irish (217 | 34.9%), Polish (69 | 11.1%), Italian (59 | 9.5%), and Yugoslavian (53 | 8.5%), together accounting for 110.6% of all Middleville residents.
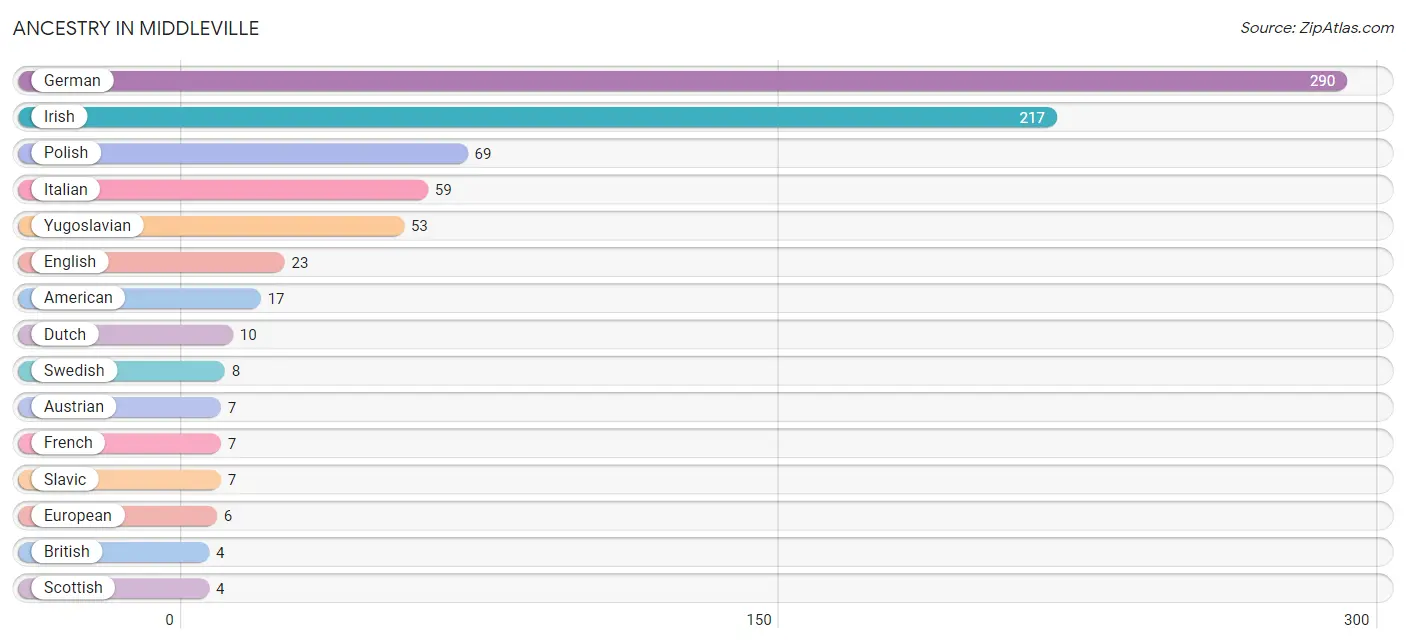
| Ancestry | # Population | % Population |
| American | 17 | 2.7% |
| Apache | 3 | 0.5% |
| Austrian | 7 | 1.1% |
| British | 4 | 0.6% |
| Dutch | 10 | 1.6% |
| English | 23 | 3.7% |
| European | 6 | 1.0% |
| French | 7 | 1.1% |
| German | 290 | 46.6% |
| Haitian | 2 | 0.3% |
| Irish | 217 | 34.9% |
| Iroquois | 3 | 0.5% |
| Italian | 59 | 9.5% |
| Mexican | 3 | 0.5% |
| Polish | 69 | 11.1% |
| Scottish | 4 | 0.6% |
| Slavic | 7 | 1.1% |
| Swedish | 8 | 1.3% |
| Ukrainian | 3 | 0.5% |
| Welsh | 4 | 0.6% |
| Yugoslavian | 53 | 8.5% | View All 21 Rows |
Immigrants in Middleville

| Immigration Origin | # Population | % Population | View All 0 Rows |
Sex and Age in Middleville
Sex and Age in Middleville
The most populous age groups in Middleville are 55 to 59 Years (42 | 14.0%) for men and 5 to 9 Years (62 | 19.3%) for women.
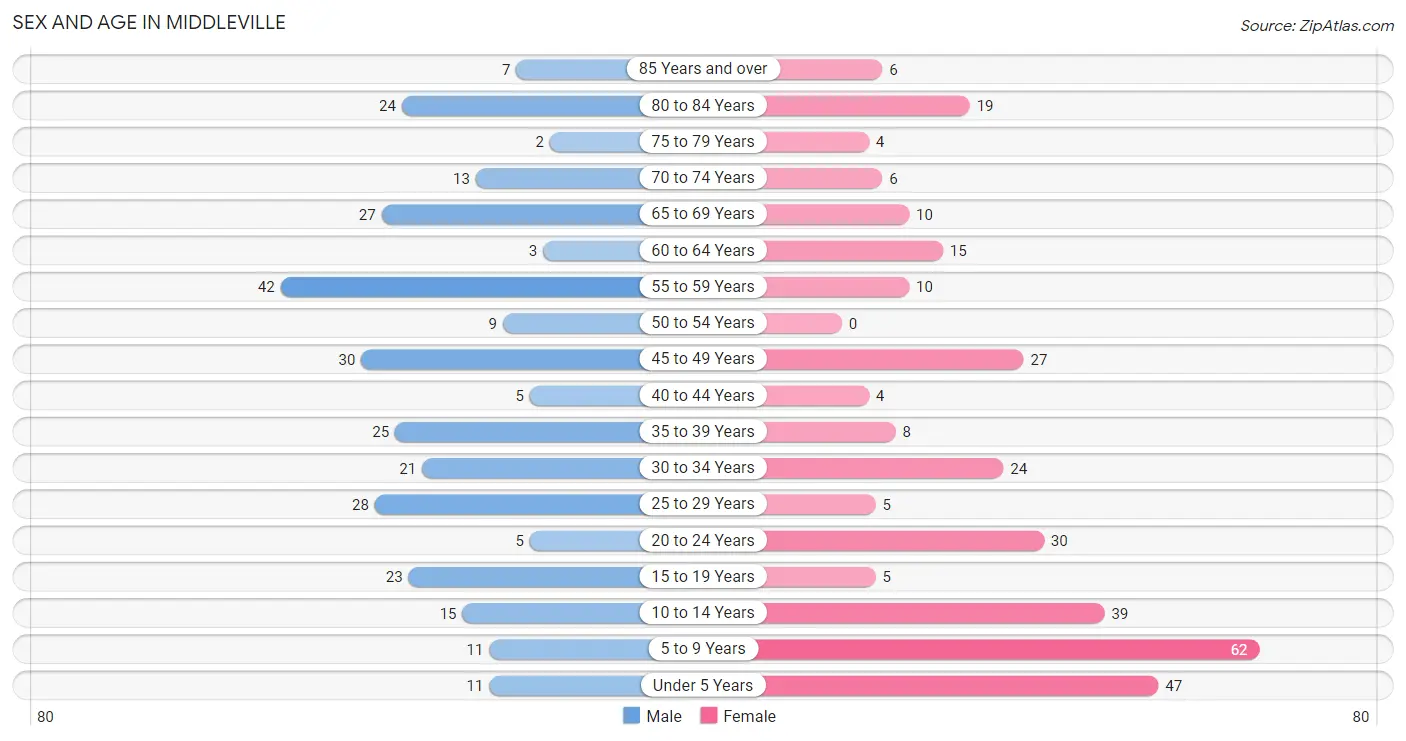
| Age Bracket | Male | Female |
| Under 5 Years | 11 (3.6%) | 47 (14.6%) |
| 5 to 9 Years | 11 (3.6%) | 62 (19.3%) |
| 10 to 14 Years | 15 (5.0%) | 39 (12.1%) |
| 15 to 19 Years | 23 (7.6%) | 5 (1.6%) |
| 20 to 24 Years | 5 (1.7%) | 30 (9.3%) |
| 25 to 29 Years | 28 (9.3%) | 5 (1.6%) |
| 30 to 34 Years | 21 (7.0%) | 24 (7.5%) |
| 35 to 39 Years | 25 (8.3%) | 8 (2.5%) |
| 40 to 44 Years | 5 (1.7%) | 4 (1.3%) |
| 45 to 49 Years | 30 (10.0%) | 27 (8.4%) |
| 50 to 54 Years | 9 (3.0%) | 0 (0.0%) |
| 55 to 59 Years | 42 (14.0%) | 10 (3.1%) |
| 60 to 64 Years | 3 (1.0%) | 15 (4.7%) |
| 65 to 69 Years | 27 (9.0%) | 10 (3.1%) |
| 70 to 74 Years | 13 (4.3%) | 6 (1.9%) |
| 75 to 79 Years | 2 (0.7%) | 4 (1.3%) |
| 80 to 84 Years | 24 (8.0%) | 19 (5.9%) |
| 85 Years and over | 7 (2.3%) | 6 (1.9%) |
| Total | 301 (100.0%) | 321 (100.0%) |
Families and Households in Middleville
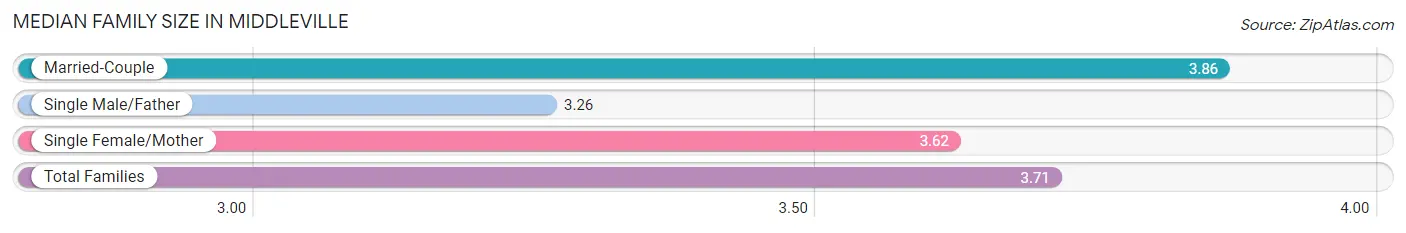
Median Family Size in Middleville
The median family size in Middleville is 3.71 persons per family, with married-couple families (100 | 69.4%) accounting for the largest median family size of 3.86 persons per family. On the other hand, single male/father families (31 | 21.5%) represent the smallest median family size with 3.26 persons per family.
| Family Type | # Families | Family Size |
| Married-Couple | 100 (69.4%) | 3.86 |
| Single Male/Father | 31 (21.5%) | 3.26 |
| Single Female/Mother | 13 (9.0%) | 3.62 |
| Total Families | 144 (100.0%) | 3.71 |
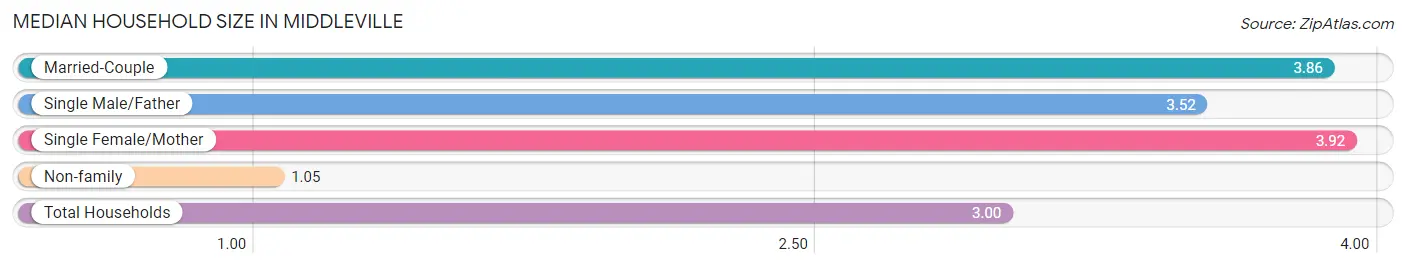
Median Household Size in Middleville
The median household size in Middleville is 3.00 persons per household, with single female/mother households (13 | 6.4%) accounting for the largest median household size of 3.92 persons per household. non-family households (59 | 29.1%) represent the smallest median household size with 1.05 persons per household.
| Household Type | # Households | Household Size |
| Married-Couple | 100 (49.3%) | 3.86 |
| Single Male/Father | 31 (15.3%) | 3.52 |
| Single Female/Mother | 13 (6.4%) | 3.92 |
| Non-family | 59 (29.1%) | 1.05 |
| Total Households | 203 (100.0%) | 3.00 |
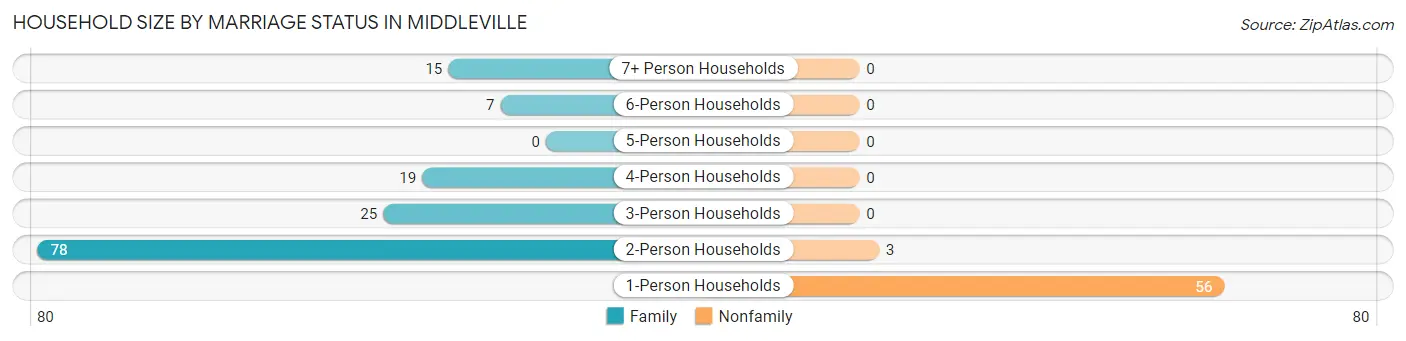
Household Size by Marriage Status in Middleville
Out of a total of 203 households in Middleville, 144 (70.9%) are family households, while 59 (29.1%) are nonfamily households. The most numerous type of family households are 2-person households, comprising 78, and the most common type of nonfamily households are 1-person households, comprising 56.
| Household Size | Family Households | Nonfamily Households |
| 1-Person Households | - | 56 (27.6%) |
| 2-Person Households | 78 (38.4%) | 3 (1.5%) |
| 3-Person Households | 25 (12.3%) | 0 (0.0%) |
| 4-Person Households | 19 (9.4%) | 0 (0.0%) |
| 5-Person Households | 0 (0.0%) | 0 (0.0%) |
| 6-Person Households | 7 (3.5%) | 0 (0.0%) |
| 7+ Person Households | 15 (7.4%) | 0 (0.0%) |
| Total | 144 (70.9%) | 59 (29.1%) |
Female Fertility in Middleville
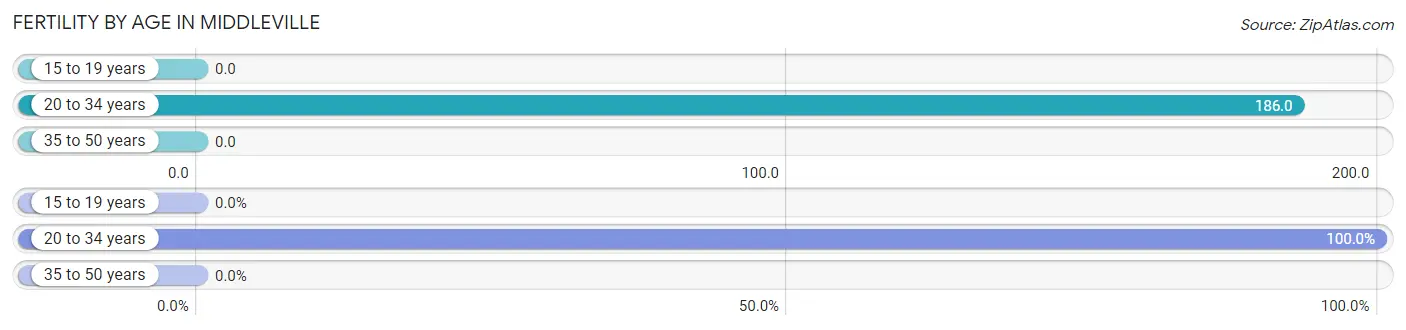
Fertility by Age in Middleville
Average fertility rate in Middleville is 107.0 births per 1,000 women. Women in the age bracket of 20 to 34 years have the highest fertility rate with 186.0 births per 1,000 women. Women in the age bracket of 20 to 34 years acount for 100.0% of all women with births.
| Age Bracket | Women with Births | Births / 1,000 Women |
| 15 to 19 years | 0 (0.0%) | 0.0 |
| 20 to 34 years | 11 (100.0%) | 186.0 |
| 35 to 50 years | 0 (0.0%) | 0.0 |
| Total | 11 (100.0%) | 107.0 |
Fertility by Age by Marriage Status in Middleville
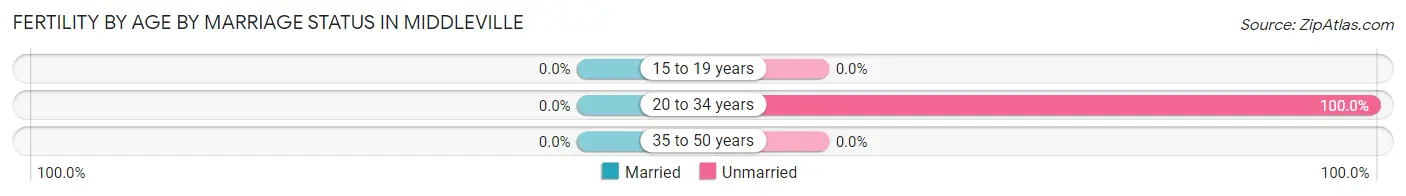
| Age Bracket | Married | Unmarried |
| 15 to 19 years | 0 (0.0%) | 0 (0.0%) |
| 20 to 34 years | 0 (0.0%) | 11 (100.0%) |
| 35 to 50 years | 0 (0.0%) | 0 (0.0%) |
| Total | 0 (0.0%) | 11 (100.0%) |
Fertility by Education in Middleville
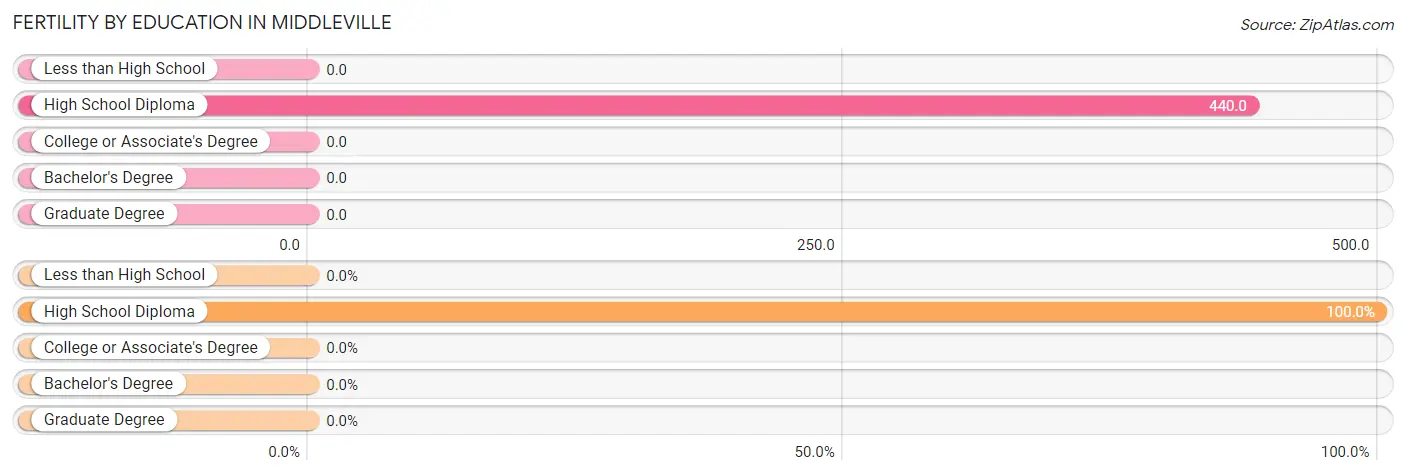
| Educational Attainment | Women with Births | Births / 1,000 Women |
| Less than High School | 0 (0.0%) | 0.0 |
| High School Diploma | 11 (100.0%) | 440.0 |
| College or Associate's Degree | 0 (0.0%) | 0.0 |
| Bachelor's Degree | 0 (0.0%) | 0.0 |
| Graduate Degree | 0 (0.0%) | 0.0 |
| Total | 11 (100.0%) | 107.0 |
Fertility by Education by Marriage Status in Middleville
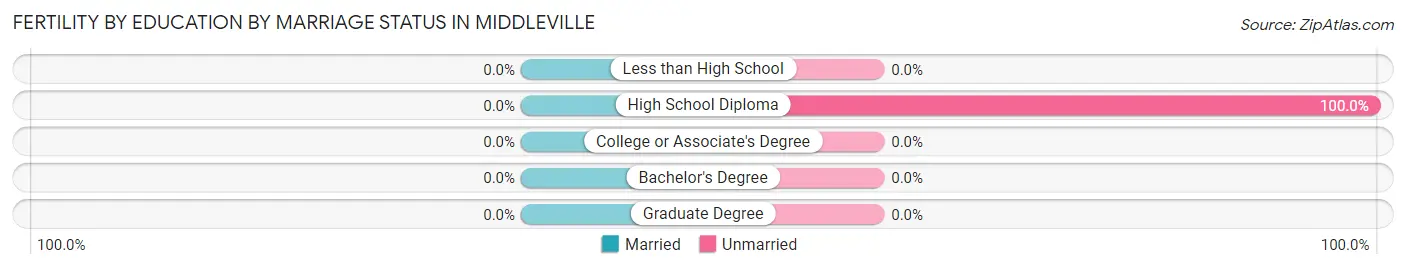
| Educational Attainment | Married | Unmarried |
| Less than High School | 0 (0.0%) | 0 (0.0%) |
| High School Diploma | 0 (0.0%) | 11 (100.0%) |
| College or Associate's Degree | 0 (0.0%) | 0 (0.0%) |
| Bachelor's Degree | 0 (0.0%) | 0 (0.0%) |
| Graduate Degree | 0 (0.0%) | 0 (0.0%) |
| Total | 0 (0.0%) | 11 (100.0%) |
Employment Characteristics in Middleville
Employment by Class of Employer in Middleville
Among the 237 employed individuals in Middleville, private company employees (149 | 62.9%), not-for-profit organizations (55 | 23.2%), and local government employees (15 | 6.3%) make up the most common classes of employment.
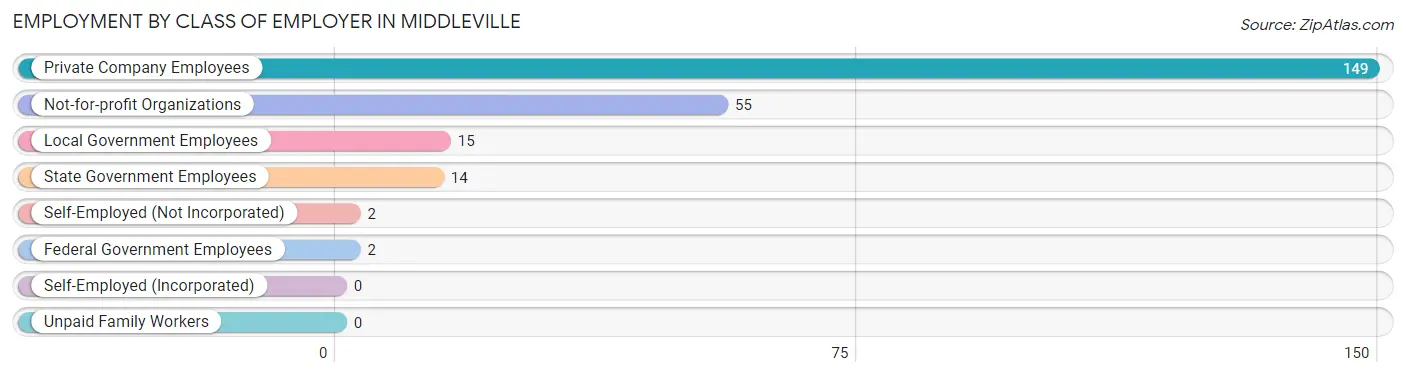
| Employer Class | # Employees | % Employees |
| Private Company Employees | 149 | 62.9% |
| Self-Employed (Incorporated) | 0 | 0.0% |
| Self-Employed (Not Incorporated) | 2 | 0.8% |
| Not-for-profit Organizations | 55 | 23.2% |
| Local Government Employees | 15 | 6.3% |
| State Government Employees | 14 | 5.9% |
| Federal Government Employees | 2 | 0.8% |
| Unpaid Family Workers | 0 | 0.0% |
| Total | 237 | 100.0% |
Employment Status by Age in Middleville
According to the labor force statistics for Middleville, out of the total population over 16 years of age (431), 59.4% or 256 individuals are in the labor force, with 6.6% or 17 of them unemployed. The age group with the highest labor force participation rate is 35 to 44 years, with 97.6% or 41 individuals in the labor force. Within the labor force, the 30 to 34 years age range has the highest percentage of unemployed individuals, with 27.8% or 10 of them being unemployed.
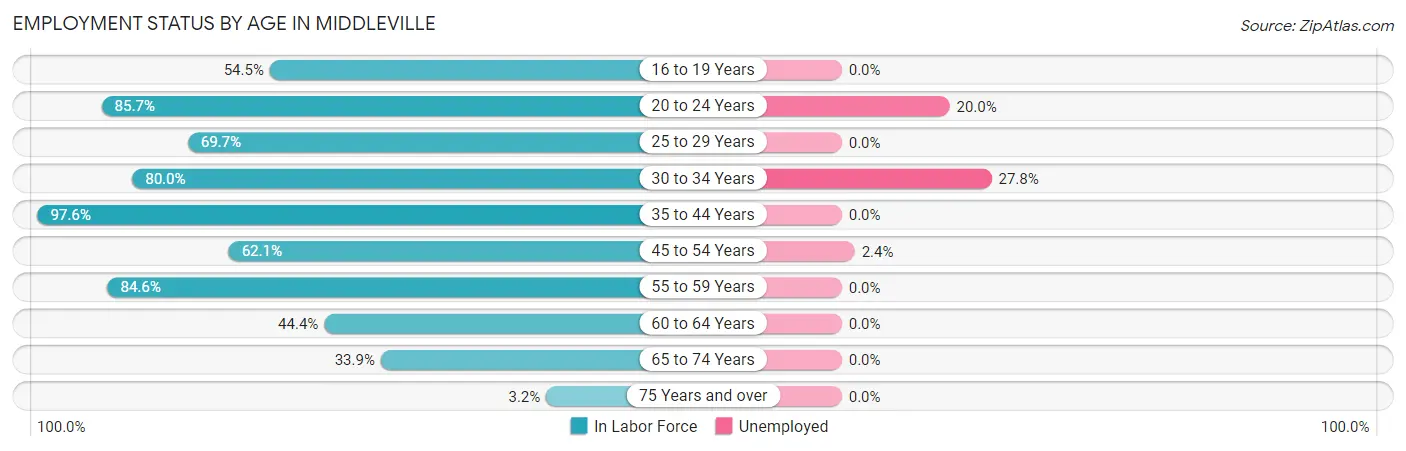
| Age Bracket | In Labor Force | Unemployed |
| 16 to 19 Years | 12 (54.5%) | 0 (0.0%) |
| 20 to 24 Years | 30 (85.7%) | 6 (20.0%) |
| 25 to 29 Years | 23 (69.7%) | 0 (0.0%) |
| 30 to 34 Years | 36 (80.0%) | 10 (27.8%) |
| 35 to 44 Years | 41 (97.6%) | 0 (0.0%) |
| 45 to 54 Years | 41 (62.1%) | 1 (2.4%) |
| 55 to 59 Years | 44 (84.6%) | 0 (0.0%) |
| 60 to 64 Years | 8 (44.4%) | 0 (0.0%) |
| 65 to 74 Years | 19 (33.9%) | 0 (0.0%) |
| 75 Years and over | 2 (3.2%) | 0 (0.0%) |
| Total | 256 (59.4%) | 17 (6.6%) |
Employment Status by Educational Attainment in Middleville
According to labor force statistics for Middleville, 75.4% of individuals (193) out of the total population between 25 and 64 years of age (256) are in the labor force, with 5.7% or 11 of them being unemployed. The group with the highest labor force participation rate are those with the educational attainment of bachelor's degree or higher, with 90.0% or 36 individuals in the labor force. Within the labor force, individuals with college / associate degree education have the highest percentage of unemployment, with 10.6% or 10 of them being unemployed.
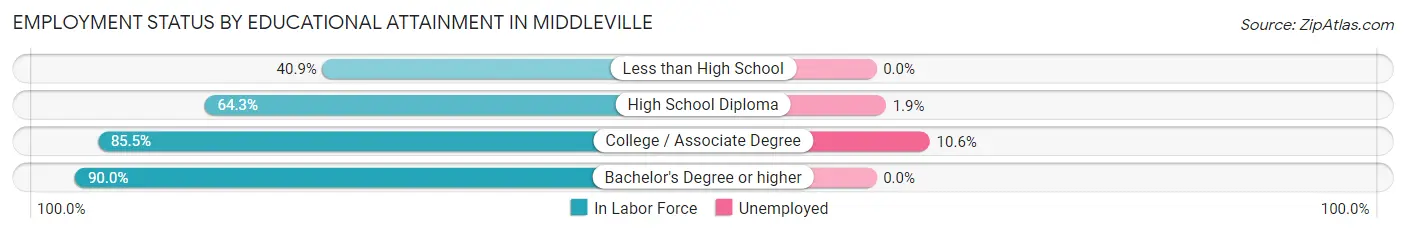
| Educational Attainment | In Labor Force | Unemployed |
| Less than High School | 9 (40.9%) | 0 (0.0%) |
| High School Diploma | 54 (64.3%) | 2 (1.9%) |
| College / Associate Degree | 94 (85.5%) | 12 (10.6%) |
| Bachelor's Degree or higher | 36 (90.0%) | 0 (0.0%) |
| Total | 193 (75.4%) | 15 (5.7%) |
Employment Occupations by Sex in Middleville
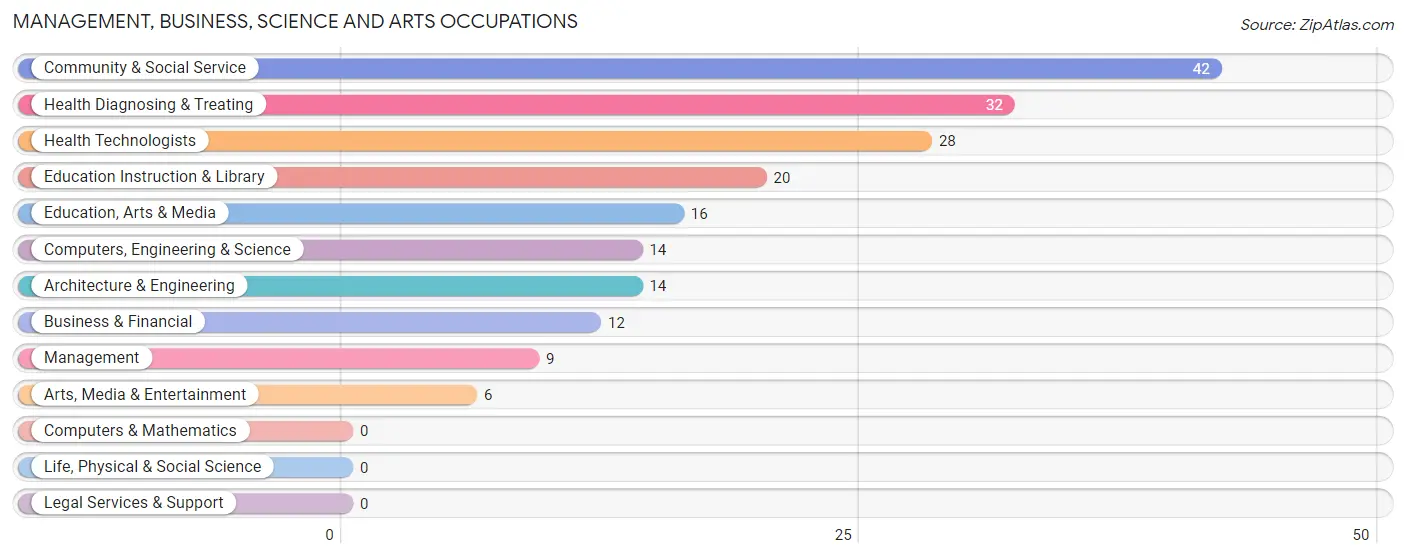
Management, Business, Science and Arts Occupations
The most common Management, Business, Science and Arts occupations in Middleville are Community & Social Service (42 | 17.6%), Health Diagnosing & Treating (32 | 13.4%), Health Technologists (28 | 11.7%), Education Instruction & Library (20 | 8.4%), and Education, Arts & Media (16 | 6.7%).
Management, Business, Science and Arts Occupations by Sex
Within the Management, Business, Science and Arts occupations in Middleville, the most male-oriented occupations are Computers, Engineering & Science (100.0%), Architecture & Engineering (100.0%), and Education, Arts & Media (100.0%), while the most female-oriented occupations are Education Instruction & Library (100.0%), Business & Financial (83.3%), and Health Diagnosing & Treating (65.6%).
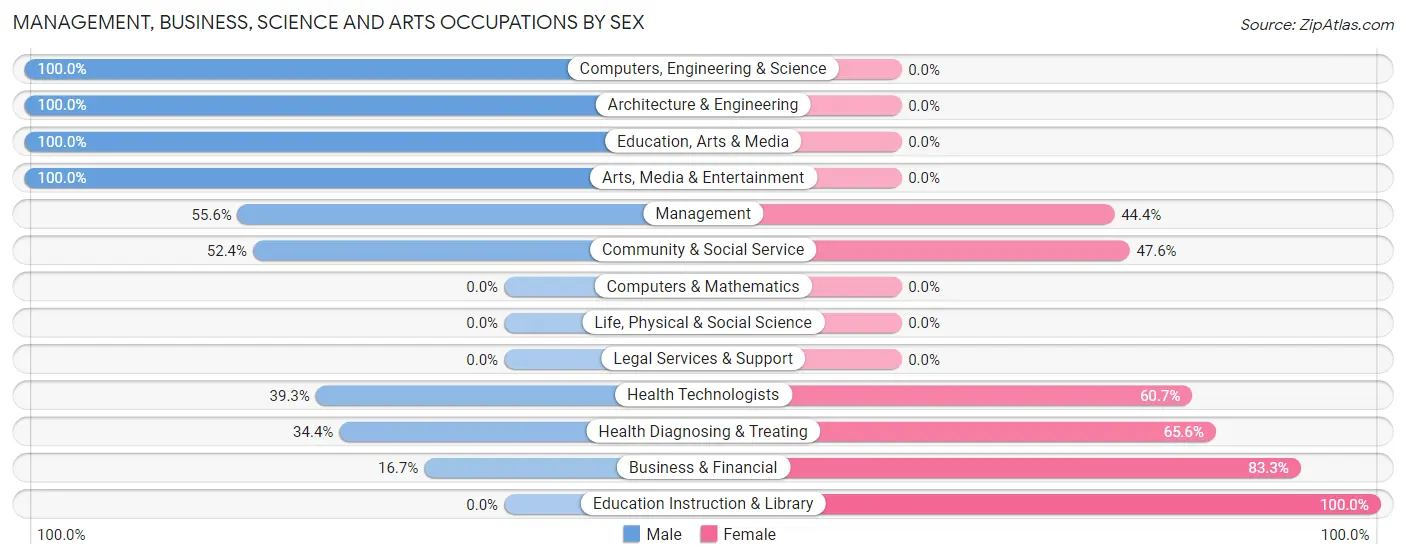
| Occupation | Male | Female |
| Management | 5 (55.6%) | 4 (44.4%) |
| Business & Financial | 2 (16.7%) | 10 (83.3%) |
| Computers, Engineering & Science | 14 (100.0%) | 0 (0.0%) |
| Computers & Mathematics | 0 (0.0%) | 0 (0.0%) |
| Architecture & Engineering | 14 (100.0%) | 0 (0.0%) |
| Life, Physical & Social Science | 0 (0.0%) | 0 (0.0%) |
| Community & Social Service | 22 (52.4%) | 20 (47.6%) |
| Education, Arts & Media | 16 (100.0%) | 0 (0.0%) |
| Legal Services & Support | 0 (0.0%) | 0 (0.0%) |
| Education Instruction & Library | 0 (0.0%) | 20 (100.0%) |
| Arts, Media & Entertainment | 6 (100.0%) | 0 (0.0%) |
| Health Diagnosing & Treating | 11 (34.4%) | 21 (65.6%) |
| Health Technologists | 11 (39.3%) | 17 (60.7%) |
| Total (Category) | 54 (49.5%) | 55 (50.5%) |
| Total (Overall) | 140 (58.6%) | 99 (41.4%) |
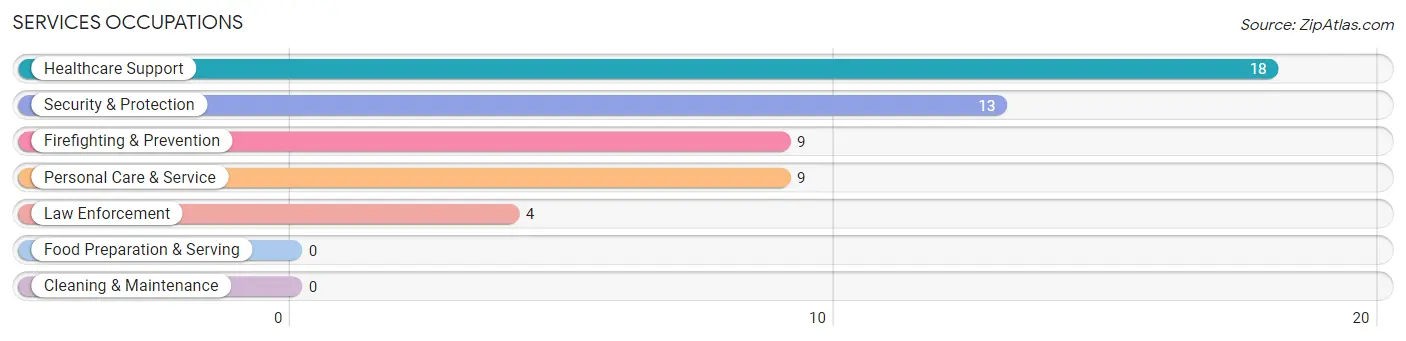
Services Occupations
The most common Services occupations in Middleville are Healthcare Support (18 | 7.5%), Security & Protection (13 | 5.4%), Firefighting & Prevention (9 | 3.8%), Personal Care & Service (9 | 3.8%), and Law Enforcement (4 | 1.7%).
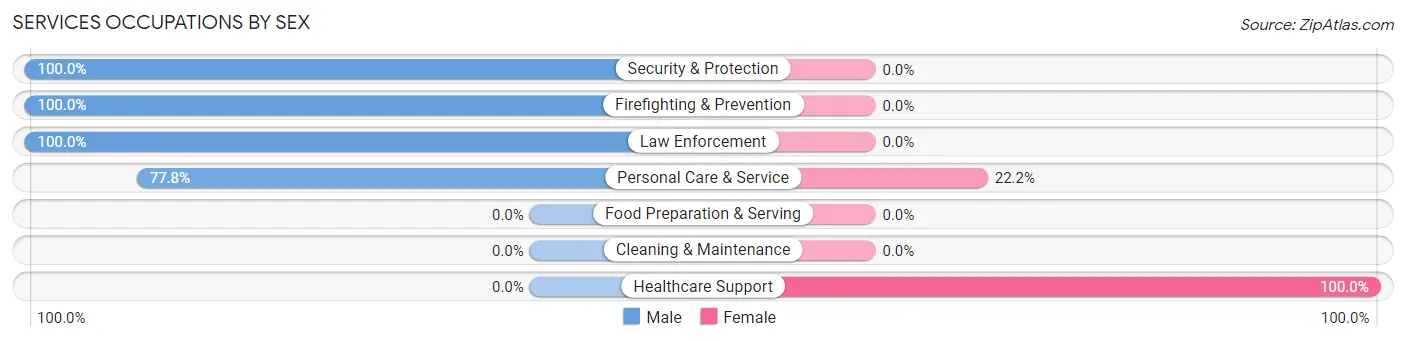
Services Occupations by Sex
Within the Services occupations in Middleville, the most male-oriented occupations are Security & Protection (100.0%), Firefighting & Prevention (100.0%), and Law Enforcement (100.0%), while the most female-oriented occupations are Healthcare Support (100.0%), and Personal Care & Service (22.2%).
| Occupation | Male | Female |
| Healthcare Support | 0 (0.0%) | 18 (100.0%) |
| Security & Protection | 13 (100.0%) | 0 (0.0%) |
| Firefighting & Prevention | 9 (100.0%) | 0 (0.0%) |
| Law Enforcement | 4 (100.0%) | 0 (0.0%) |
| Food Preparation & Serving | 0 (0.0%) | 0 (0.0%) |
| Cleaning & Maintenance | 0 (0.0%) | 0 (0.0%) |
| Personal Care & Service | 7 (77.8%) | 2 (22.2%) |
| Total (Category) | 20 (50.0%) | 20 (50.0%) |
| Total (Overall) | 140 (58.6%) | 99 (41.4%) |
Sales and Office Occupations
The most common Sales and Office occupations in Middleville are Office & Administration (18 | 7.5%), and Sales & Related (17 | 7.1%).

Sales and Office Occupations by Sex

| Occupation | Male | Female |
| Sales & Related | 9 (52.9%) | 8 (47.1%) |
| Office & Administration | 2 (11.1%) | 16 (88.9%) |
| Total (Category) | 11 (31.4%) | 24 (68.6%) |
| Total (Overall) | 140 (58.6%) | 99 (41.4%) |
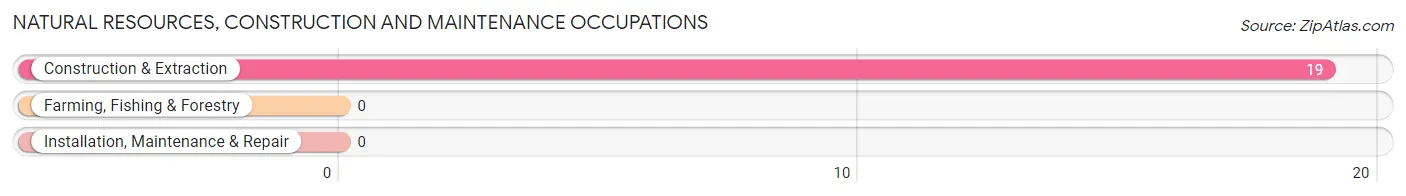
Natural Resources, Construction and Maintenance Occupations
The most common Natural Resources, Construction and Maintenance occupations in Middleville are , and Construction & Extraction (19 | 8.0%).
Natural Resources, Construction and Maintenance Occupations by Sex

| Occupation | Male | Female |
| Farming, Fishing & Forestry | 0 (0.0%) | 0 (0.0%) |
| Construction & Extraction | 19 (100.0%) | 0 (0.0%) |
| Installation, Maintenance & Repair | 0 (0.0%) | 0 (0.0%) |
| Total (Category) | 19 (100.0%) | 0 (0.0%) |
| Total (Overall) | 140 (58.6%) | 99 (41.4%) |
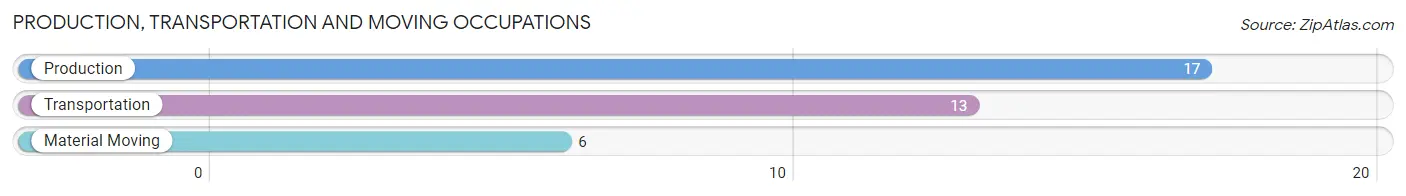
Production, Transportation and Moving Occupations
The most common Production, Transportation and Moving occupations in Middleville are Production (17 | 7.1%), Transportation (13 | 5.4%), and Material Moving (6 | 2.5%).
Production, Transportation and Moving Occupations by Sex
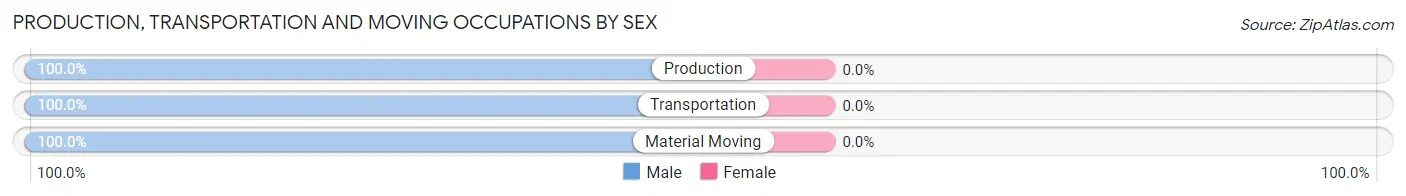
| Occupation | Male | Female |
| Production | 17 (100.0%) | 0 (0.0%) |
| Transportation | 13 (100.0%) | 0 (0.0%) |
| Material Moving | 6 (100.0%) | 0 (0.0%) |
| Total (Category) | 36 (100.0%) | 0 (0.0%) |
| Total (Overall) | 140 (58.6%) | 99 (41.4%) |
Employment Industries by Sex in Middleville
Employment Industries in Middleville
The major employment industries in Middleville include Health Care & Social Assistance (64 | 26.8%), Manufacturing (29 | 12.1%), Construction (28 | 11.7%), Retail Trade (21 | 8.8%), and Finance & Insurance (17 | 7.1%).
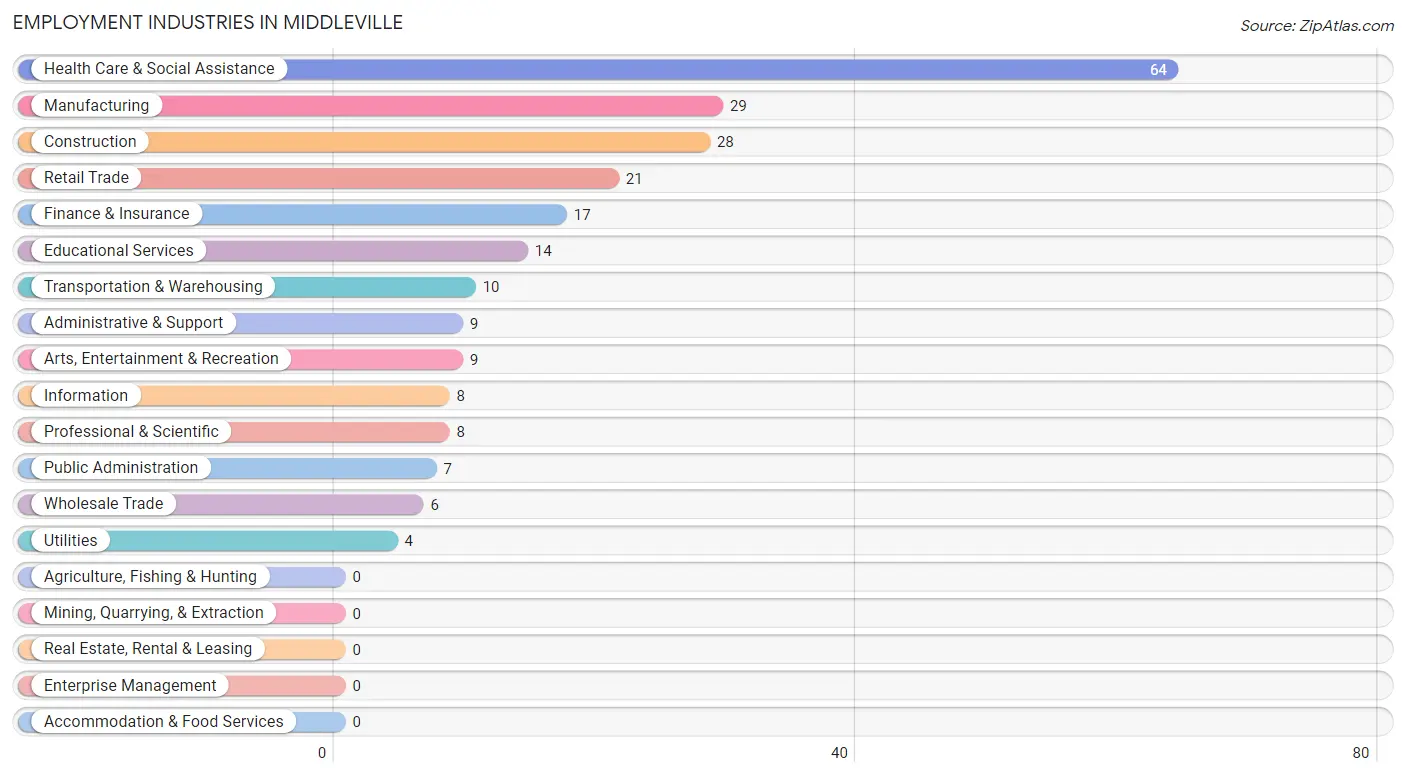
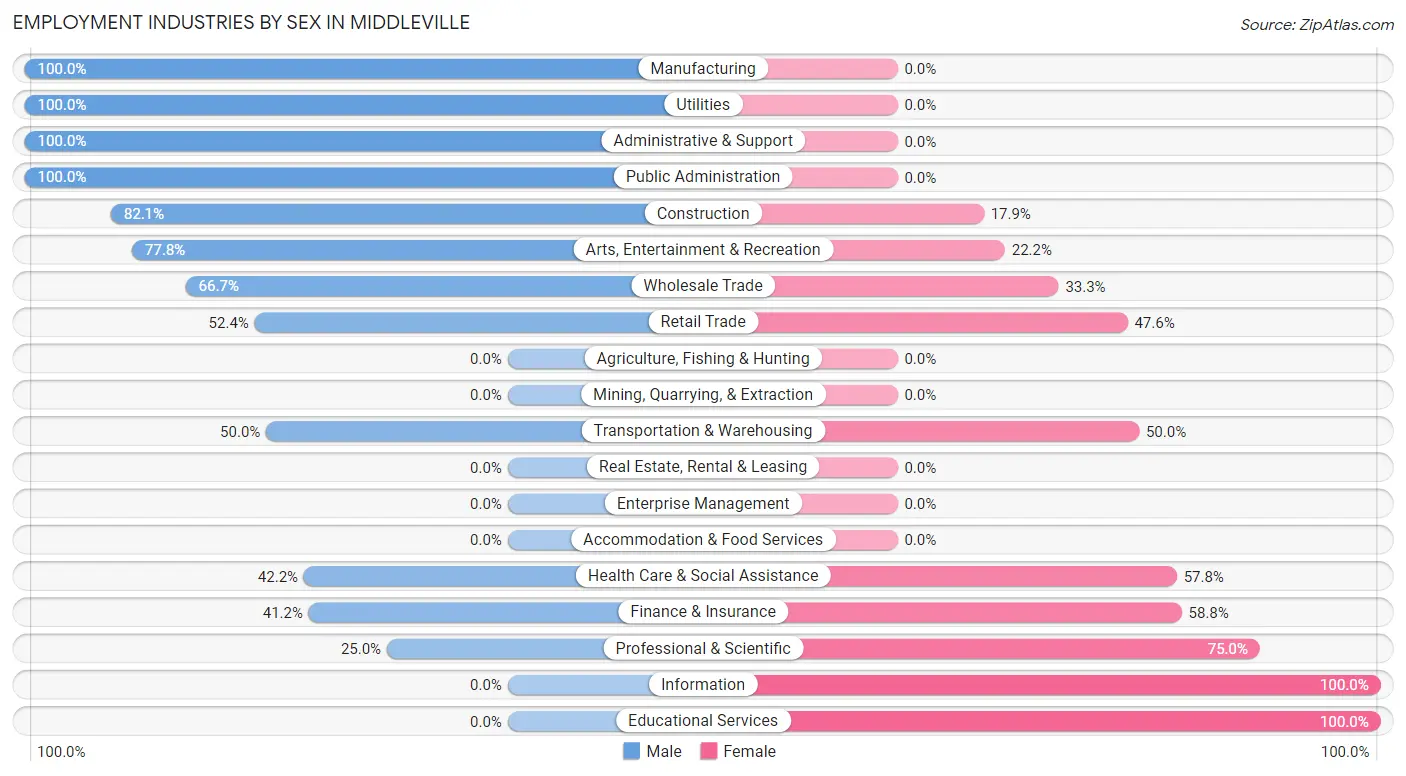
Employment Industries by Sex in Middleville
The Middleville industries that see more men than women are Manufacturing (100.0%), Utilities (100.0%), and Administrative & Support (100.0%), whereas the industries that tend to have a higher number of women are Information (100.0%), Educational Services (100.0%), and Professional & Scientific (75.0%).
| Industry | Male | Female |
| Agriculture, Fishing & Hunting | 0 (0.0%) | 0 (0.0%) |
| Mining, Quarrying, & Extraction | 0 (0.0%) | 0 (0.0%) |
| Construction | 23 (82.1%) | 5 (17.9%) |
| Manufacturing | 29 (100.0%) | 0 (0.0%) |
| Wholesale Trade | 4 (66.7%) | 2 (33.3%) |
| Retail Trade | 11 (52.4%) | 10 (47.6%) |
| Transportation & Warehousing | 5 (50.0%) | 5 (50.0%) |
| Utilities | 4 (100.0%) | 0 (0.0%) |
| Information | 0 (0.0%) | 8 (100.0%) |
| Finance & Insurance | 7 (41.2%) | 10 (58.8%) |
| Real Estate, Rental & Leasing | 0 (0.0%) | 0 (0.0%) |
| Professional & Scientific | 2 (25.0%) | 6 (75.0%) |
| Enterprise Management | 0 (0.0%) | 0 (0.0%) |
| Administrative & Support | 9 (100.0%) | 0 (0.0%) |
| Educational Services | 0 (0.0%) | 14 (100.0%) |
| Health Care & Social Assistance | 27 (42.2%) | 37 (57.8%) |
| Arts, Entertainment & Recreation | 7 (77.8%) | 2 (22.2%) |
| Accommodation & Food Services | 0 (0.0%) | 0 (0.0%) |
| Public Administration | 7 (100.0%) | 0 (0.0%) |
| Total | 140 (58.6%) | 99 (41.4%) |
Education in Middleville
School Enrollment in Middleville
The most common levels of schooling among the 164 students in Middleville are high school (57 | 34.8%), elementary school (49 | 29.9%), and kindergarten (24 | 14.6%).
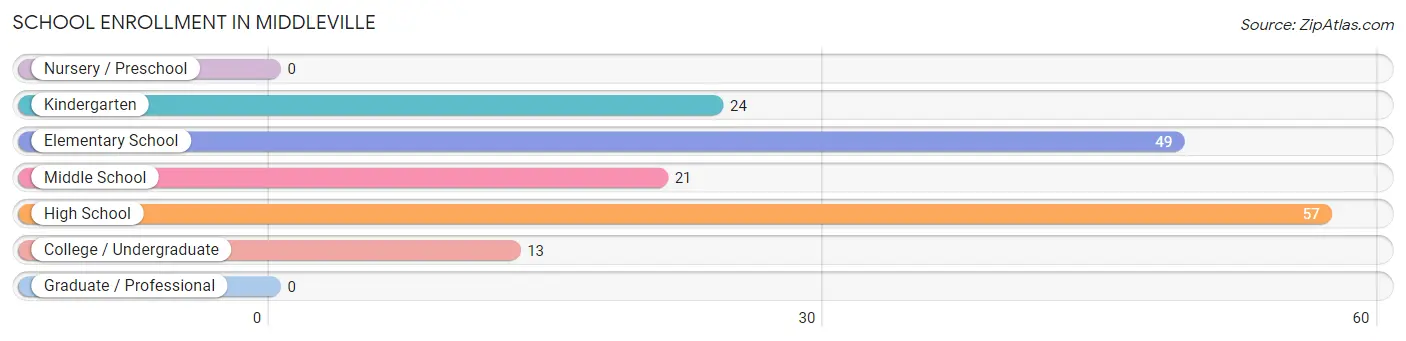
| School Level | # Students | % Students |
| Nursery / Preschool | 0 | 0.0% |
| Kindergarten | 24 | 14.6% |
| Elementary School | 49 | 29.9% |
| Middle School | 21 | 12.8% |
| High School | 57 | 34.8% |
| College / Undergraduate | 13 | 7.9% |
| Graduate / Professional | 0 | 0.0% |
| Total | 164 | 100.0% |
School Enrollment by Age by Funding Source in Middleville
Out of a total of 164 students who are enrolled in schools in Middleville, 7 (4.3%) attend a private institution, while the remaining 157 (95.7%) are enrolled in public schools. The age group of 18 to 19 year olds has the highest likelihood of being enrolled in private schools, with 7 (100.0% in the age bracket) enrolled. Conversely, the age group of 5 to 9 year old has the lowest likelihood of being enrolled in a private school, with 73 (100.0% in the age bracket) attending a public institution.
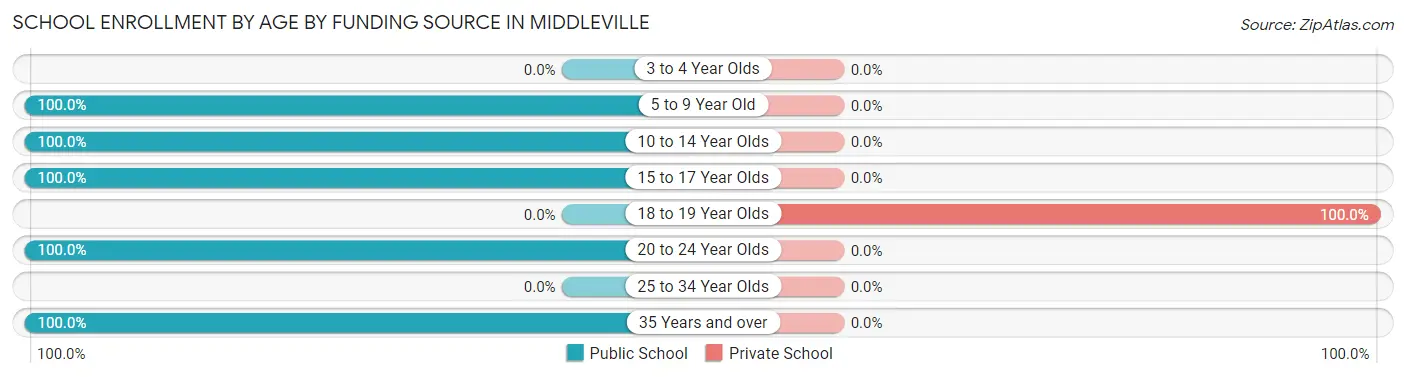
| Age Bracket | Public School | Private School |
| 3 to 4 Year Olds | 0 (0.0%) | 0 (0.0%) |
| 5 to 9 Year Old | 73 (100.0%) | 0 (0.0%) |
| 10 to 14 Year Olds | 54 (100.0%) | 0 (0.0%) |
| 15 to 17 Year Olds | 21 (100.0%) | 0 (0.0%) |
| 18 to 19 Year Olds | 0 (0.0%) | 7 (100.0%) |
| 20 to 24 Year Olds | 6 (100.0%) | 0 (0.0%) |
| 25 to 34 Year Olds | 0 (0.0%) | 0 (0.0%) |
| 35 Years and over | 3 (100.0%) | 0 (0.0%) |
| Total | 157 (95.7%) | 7 (4.3%) |
Educational Attainment by Field of Study in Middleville
Education (19 | 35.2%), bio, nature & agricultural (12 | 22.2%), business (7 | 13.0%), science & technology (6 | 11.1%), and psychology (4 | 7.4%) are the most common fields of study among 54 individuals in Middleville who have obtained a bachelor's degree or higher.
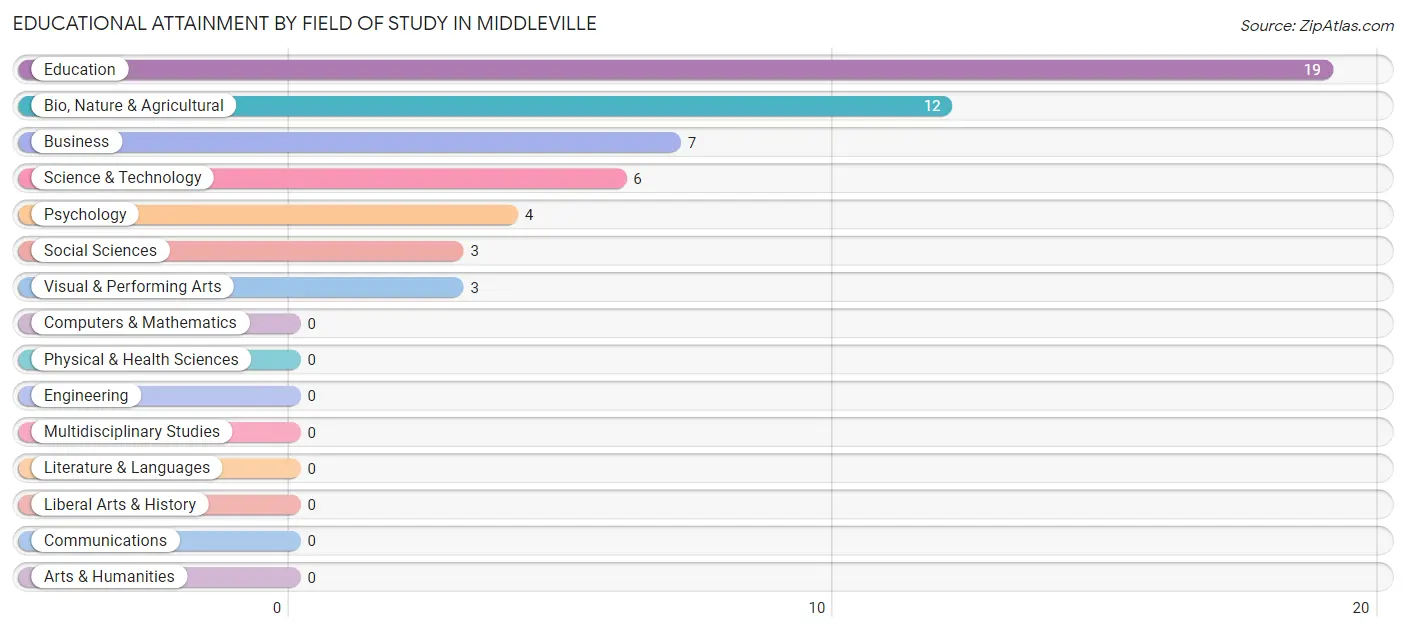
| Field of Study | # Graduates | % Graduates |
| Computers & Mathematics | 0 | 0.0% |
| Bio, Nature & Agricultural | 12 | 22.2% |
| Physical & Health Sciences | 0 | 0.0% |
| Psychology | 4 | 7.4% |
| Social Sciences | 3 | 5.6% |
| Engineering | 0 | 0.0% |
| Multidisciplinary Studies | 0 | 0.0% |
| Science & Technology | 6 | 11.1% |
| Business | 7 | 13.0% |
| Education | 19 | 35.2% |
| Literature & Languages | 0 | 0.0% |
| Liberal Arts & History | 0 | 0.0% |
| Visual & Performing Arts | 3 | 5.6% |
| Communications | 0 | 0.0% |
| Arts & Humanities | 0 | 0.0% |
| Total | 54 | 100.0% |
Transportation & Commute in Middleville
Vehicle Availability by Sex in Middleville
The most prevalent vehicle ownership categories in Middleville are males with 2 vehicles (47, accounting for 33.6%) and females with 2 vehicles (29, making up 50.0%).
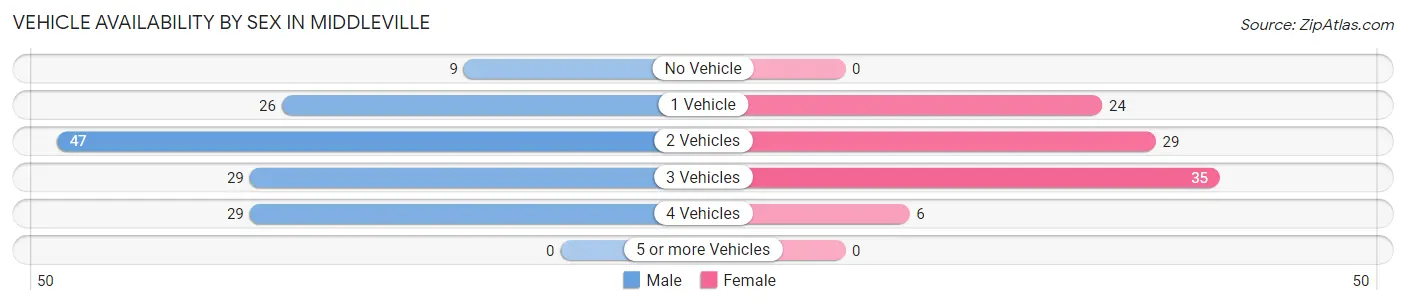
| Vehicles Available | Male | Female |
| No Vehicle | 9 (6.4%) | 0 (0.0%) |
| 1 Vehicle | 26 (18.6%) | 24 (25.5%) |
| 2 Vehicles | 47 (33.6%) | 29 (30.8%) |
| 3 Vehicles | 29 (20.7%) | 35 (37.2%) |
| 4 Vehicles | 29 (20.7%) | 6 (6.4%) |
| 5 or more Vehicles | 0 (0.0%) | 0 (0.0%) |
| Total | 140 (100.0%) | 94 (100.0%) |
Commute Time in Middleville
The most frequently occuring commute durations in Middleville are 10 to 14 minutes (48 commuters, 21.6%), 30 to 34 minutes (46 commuters, 20.7%), and 25 to 29 minutes (37 commuters, 16.7%).
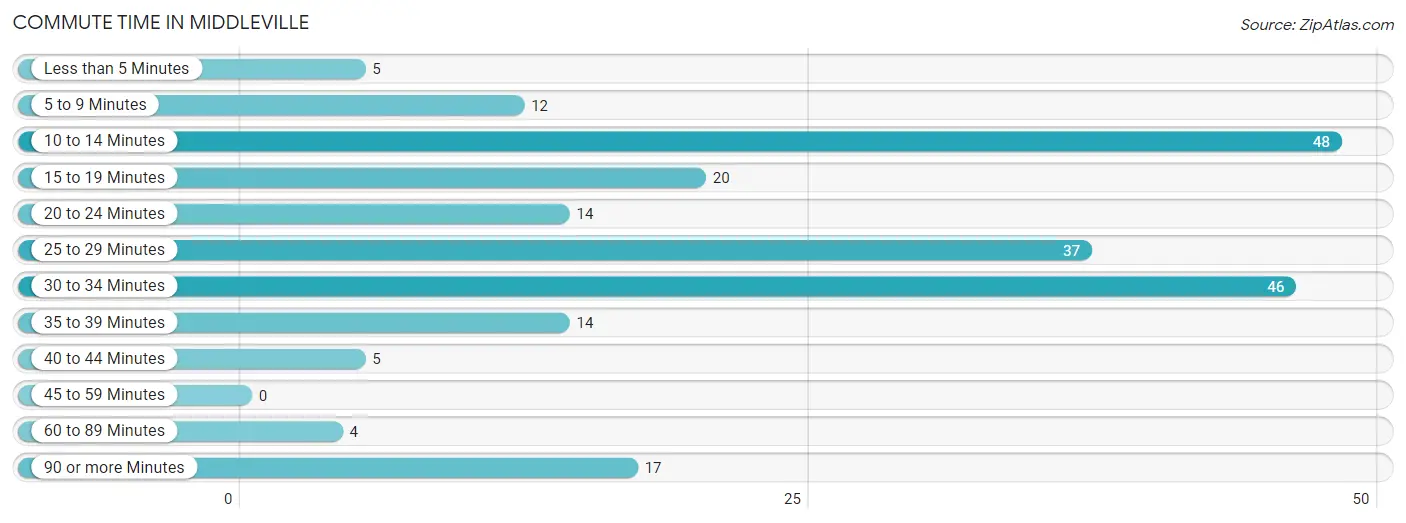
| Commute Time | # Commuters | % Commuters |
| Less than 5 Minutes | 5 | 2.2% |
| 5 to 9 Minutes | 12 | 5.4% |
| 10 to 14 Minutes | 48 | 21.6% |
| 15 to 19 Minutes | 20 | 9.0% |
| 20 to 24 Minutes | 14 | 6.3% |
| 25 to 29 Minutes | 37 | 16.7% |
| 30 to 34 Minutes | 46 | 20.7% |
| 35 to 39 Minutes | 14 | 6.3% |
| 40 to 44 Minutes | 5 | 2.2% |
| 45 to 59 Minutes | 0 | 0.0% |
| 60 to 89 Minutes | 4 | 1.8% |
| 90 or more Minutes | 17 | 7.7% |
Commute Time by Sex in Middleville
The most common commute times in Middleville are 30 to 34 minutes (27 commuters, 20.6%) for males and 10 to 14 minutes (32 commuters, 35.2%) for females.
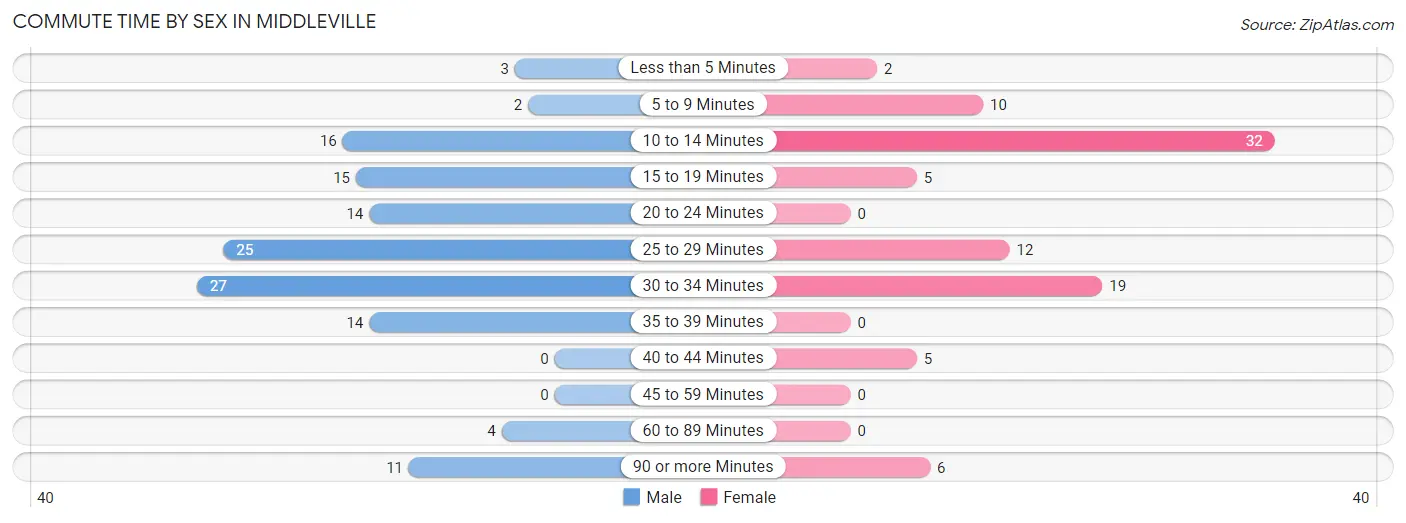
| Commute Time | Male | Female |
| Less than 5 Minutes | 3 (2.3%) | 2 (2.2%) |
| 5 to 9 Minutes | 2 (1.5%) | 10 (11.0%) |
| 10 to 14 Minutes | 16 (12.2%) | 32 (35.2%) |
| 15 to 19 Minutes | 15 (11.5%) | 5 (5.5%) |
| 20 to 24 Minutes | 14 (10.7%) | 0 (0.0%) |
| 25 to 29 Minutes | 25 (19.1%) | 12 (13.2%) |
| 30 to 34 Minutes | 27 (20.6%) | 19 (20.9%) |
| 35 to 39 Minutes | 14 (10.7%) | 0 (0.0%) |
| 40 to 44 Minutes | 0 (0.0%) | 5 (5.5%) |
| 45 to 59 Minutes | 0 (0.0%) | 0 (0.0%) |
| 60 to 89 Minutes | 4 (3.0%) | 0 (0.0%) |
| 90 or more Minutes | 11 (8.4%) | 6 (6.6%) |
Time of Departure to Work by Sex in Middleville
The most frequent times of departure to work in Middleville are 5:30 AM to 5:59 AM (33, 25.2%) for males and 7:30 AM to 7:59 AM (18, 19.8%) for females.
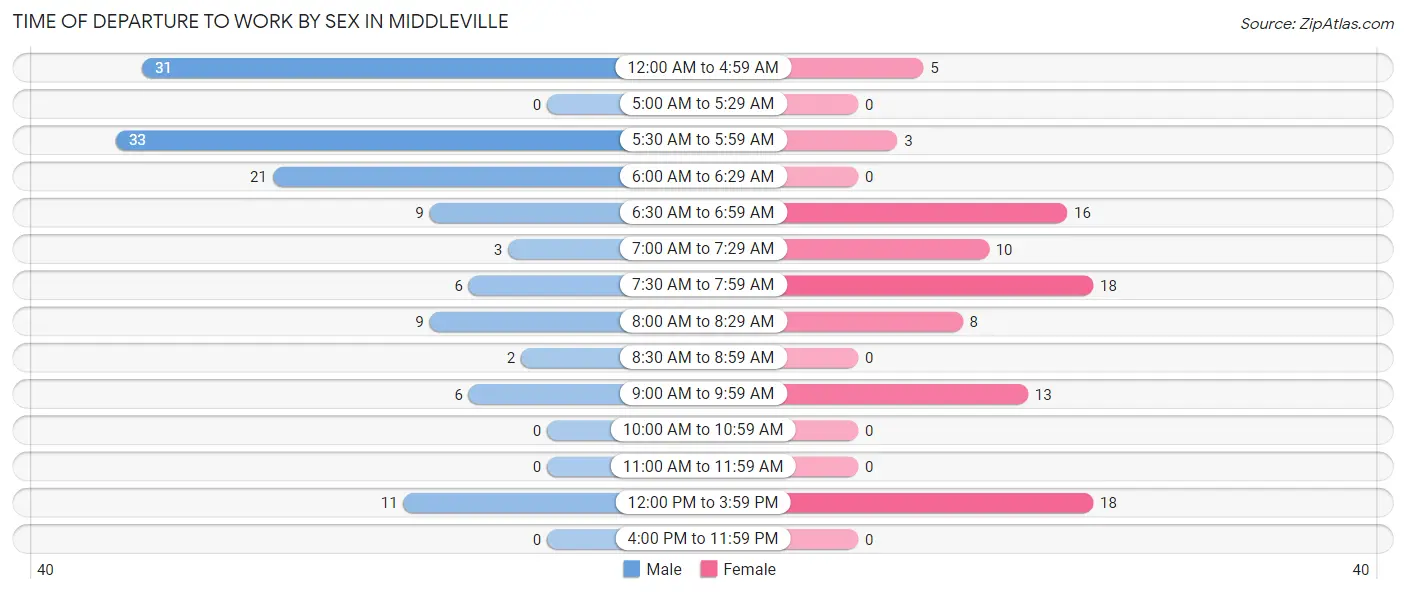
| Time of Departure | Male | Female |
| 12:00 AM to 4:59 AM | 31 (23.7%) | 5 (5.5%) |
| 5:00 AM to 5:29 AM | 0 (0.0%) | 0 (0.0%) |
| 5:30 AM to 5:59 AM | 33 (25.2%) | 3 (3.3%) |
| 6:00 AM to 6:29 AM | 21 (16.0%) | 0 (0.0%) |
| 6:30 AM to 6:59 AM | 9 (6.9%) | 16 (17.6%) |
| 7:00 AM to 7:29 AM | 3 (2.3%) | 10 (11.0%) |
| 7:30 AM to 7:59 AM | 6 (4.6%) | 18 (19.8%) |
| 8:00 AM to 8:29 AM | 9 (6.9%) | 8 (8.8%) |
| 8:30 AM to 8:59 AM | 2 (1.5%) | 0 (0.0%) |
| 9:00 AM to 9:59 AM | 6 (4.6%) | 13 (14.3%) |
| 10:00 AM to 10:59 AM | 0 (0.0%) | 0 (0.0%) |
| 11:00 AM to 11:59 AM | 0 (0.0%) | 0 (0.0%) |
| 12:00 PM to 3:59 PM | 11 (8.4%) | 18 (19.8%) |
| 4:00 PM to 11:59 PM | 0 (0.0%) | 0 (0.0%) |
| Total | 131 (100.0%) | 91 (100.0%) |
Housing Occupancy in Middleville
Occupancy by Ownership in Middleville
Of the total 203 dwellings in Middleville, owner-occupied units account for 195 (96.1%), while renter-occupied units make up 8 (3.9%).
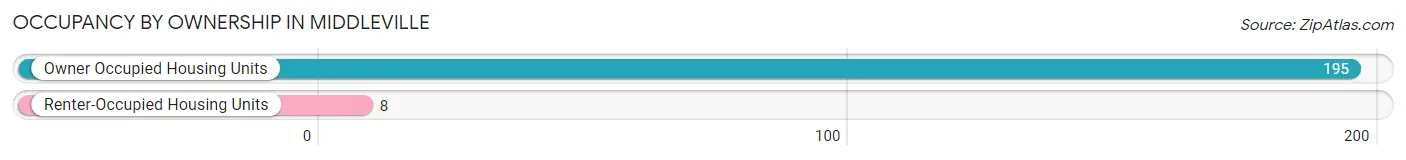
| Occupancy | # Housing Units | % Housing Units |
| Owner Occupied Housing Units | 195 | 96.1% |
| Renter-Occupied Housing Units | 8 | 3.9% |
| Total Occupied Housing Units | 203 | 100.0% |
Occupancy by Household Size in Middleville
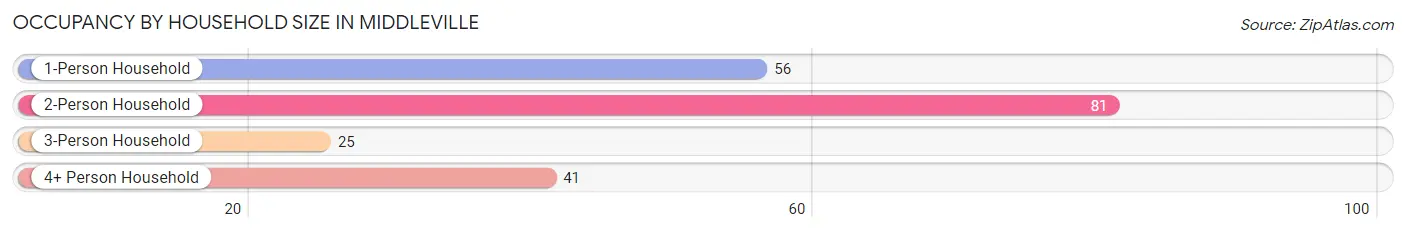
| Household Size | # Housing Units | % Housing Units |
| 1-Person Household | 56 | 27.6% |
| 2-Person Household | 81 | 39.9% |
| 3-Person Household | 25 | 12.3% |
| 4+ Person Household | 41 | 20.2% |
| Total Housing Units | 203 | 100.0% |
Occupancy by Ownership by Household Size in Middleville
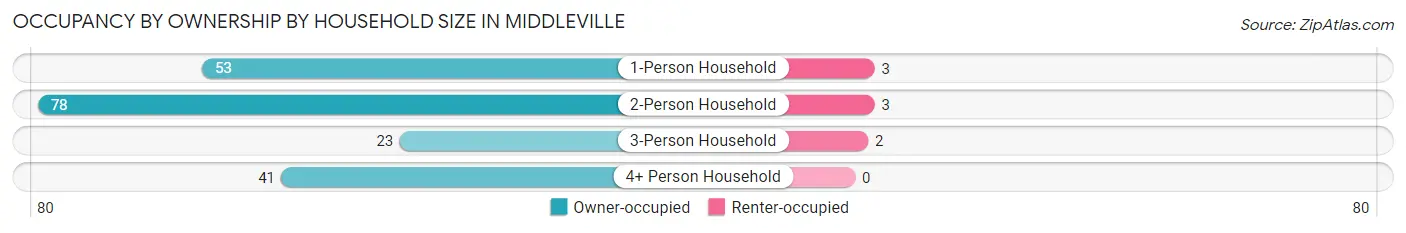
| Household Size | Owner-occupied | Renter-occupied |
| 1-Person Household | 53 (94.6%) | 3 (5.4%) |
| 2-Person Household | 78 (96.3%) | 3 (3.7%) |
| 3-Person Household | 23 (92.0%) | 2 (8.0%) |
| 4+ Person Household | 41 (100.0%) | 0 (0.0%) |
| Total Housing Units | 195 (96.1%) | 8 (3.9%) |
Occupancy by Educational Attainment in Middleville
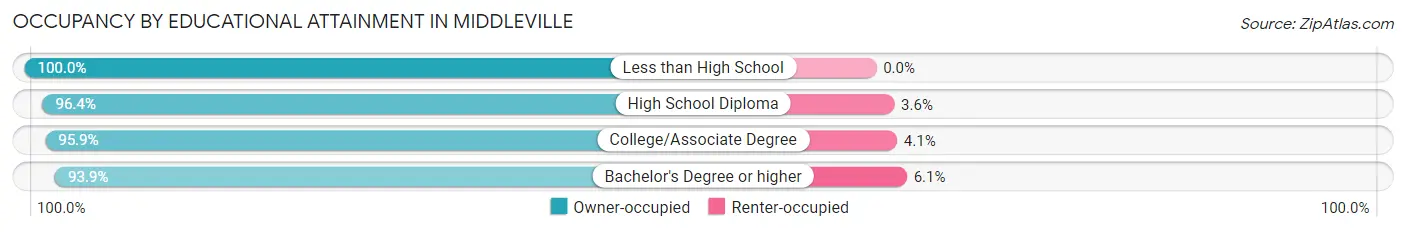
| Household Size | Owner-occupied | Renter-occupied |
| Less than High School | 13 (100.0%) | 0 (0.0%) |
| High School Diploma | 81 (96.4%) | 3 (3.6%) |
| College/Associate Degree | 70 (95.9%) | 3 (4.1%) |
| Bachelor's Degree or higher | 31 (93.9%) | 2 (6.1%) |
Occupancy by Age of Householder in Middleville
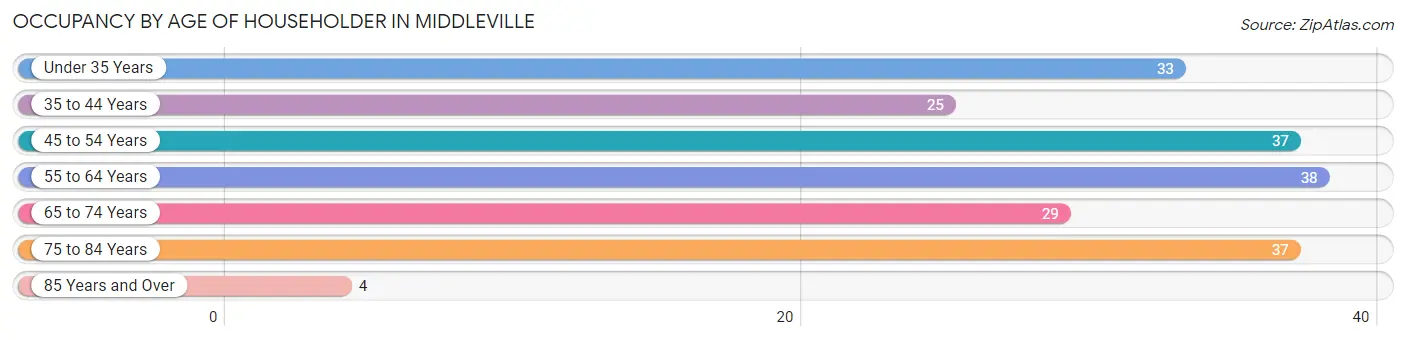
| Age Bracket | # Households | % Households |
| Under 35 Years | 33 | 16.3% |
| 35 to 44 Years | 25 | 12.3% |
| 45 to 54 Years | 37 | 18.2% |
| 55 to 64 Years | 38 | 18.7% |
| 65 to 74 Years | 29 | 14.3% |
| 75 to 84 Years | 37 | 18.2% |
| 85 Years and Over | 4 | 2.0% |
| Total | 203 | 100.0% |
Housing Finances in Middleville
Median Income by Occupancy in Middleville
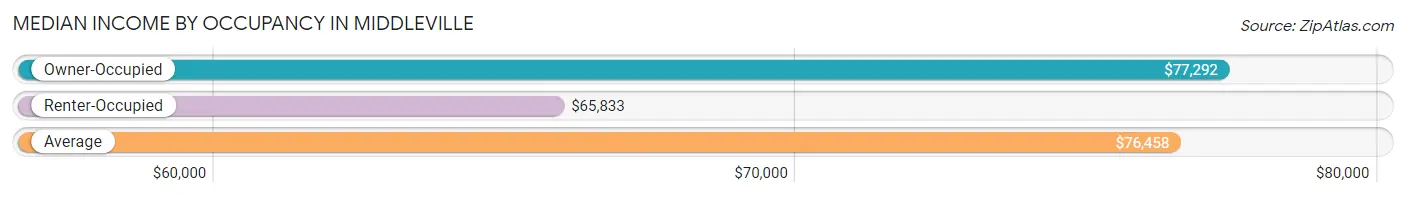
| Occupancy Type | # Households | Median Income |
| Owner-Occupied | 195 (96.1%) | $77,292 |
| Renter-Occupied | 8 (3.9%) | $65,833 |
| Average | 203 (100.0%) | $76,458 |
Occupancy by Householder Income Bracket in Middleville
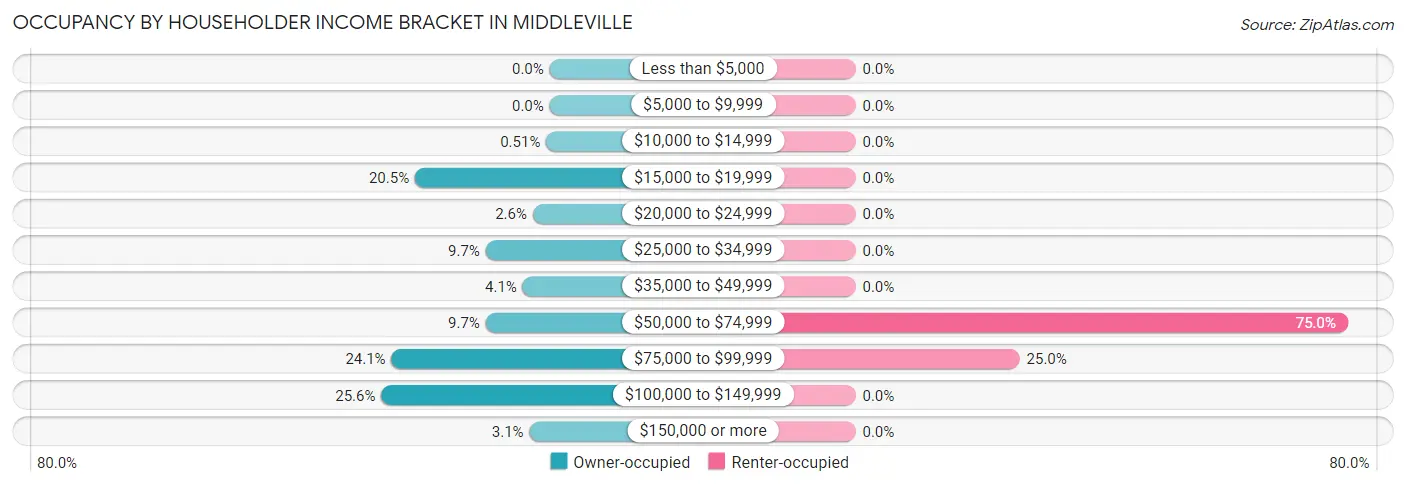
| Income Bracket | Owner-occupied | Renter-occupied |
| Less than $5,000 | 0 (0.0%) | 0 (0.0%) |
| $5,000 to $9,999 | 0 (0.0%) | 0 (0.0%) |
| $10,000 to $14,999 | 1 (0.5%) | 0 (0.0%) |
| $15,000 to $19,999 | 40 (20.5%) | 0 (0.0%) |
| $20,000 to $24,999 | 5 (2.6%) | 0 (0.0%) |
| $25,000 to $34,999 | 19 (9.7%) | 0 (0.0%) |
| $35,000 to $49,999 | 8 (4.1%) | 0 (0.0%) |
| $50,000 to $74,999 | 19 (9.7%) | 6 (75.0%) |
| $75,000 to $99,999 | 47 (24.1%) | 2 (25.0%) |
| $100,000 to $149,999 | 50 (25.6%) | 0 (0.0%) |
| $150,000 or more | 6 (3.1%) | 0 (0.0%) |
| Total | 195 (100.0%) | 8 (100.0%) |
Monthly Housing Cost Tiers in Middleville
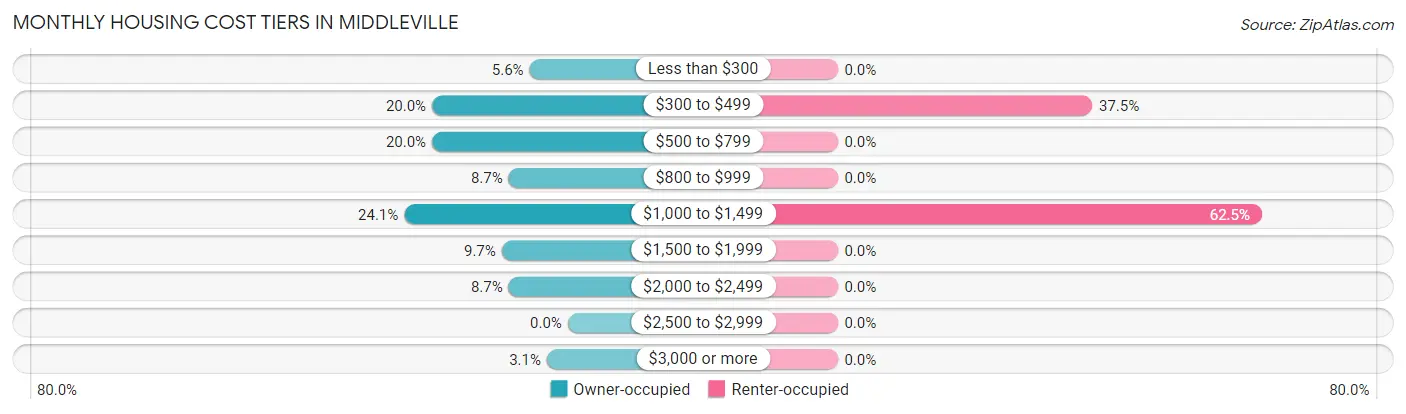
| Monthly Cost | Owner-occupied | Renter-occupied |
| Less than $300 | 11 (5.6%) | 0 (0.0%) |
| $300 to $499 | 39 (20.0%) | 3 (37.5%) |
| $500 to $799 | 39 (20.0%) | 0 (0.0%) |
| $800 to $999 | 17 (8.7%) | 0 (0.0%) |
| $1,000 to $1,499 | 47 (24.1%) | 5 (62.5%) |
| $1,500 to $1,999 | 19 (9.7%) | 0 (0.0%) |
| $2,000 to $2,499 | 17 (8.7%) | 0 (0.0%) |
| $2,500 to $2,999 | 0 (0.0%) | 0 (0.0%) |
| $3,000 or more | 6 (3.1%) | 0 (0.0%) |
| Total | 195 (100.0%) | 8 (100.0%) |
Physical Housing Characteristics in Middleville
Housing Structures in Middleville
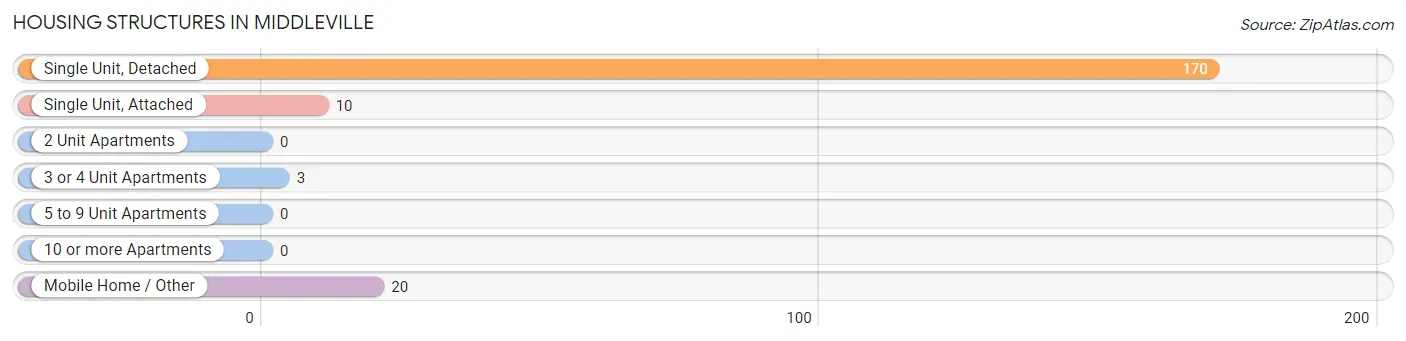
| Structure Type | # Housing Units | % Housing Units |
| Single Unit, Detached | 170 | 83.7% |
| Single Unit, Attached | 10 | 4.9% |
| 2 Unit Apartments | 0 | 0.0% |
| 3 or 4 Unit Apartments | 3 | 1.5% |
| 5 to 9 Unit Apartments | 0 | 0.0% |
| 10 or more Apartments | 0 | 0.0% |
| Mobile Home / Other | 20 | 9.9% |
| Total | 203 | 100.0% |
Housing Structures by Occupancy in Middleville
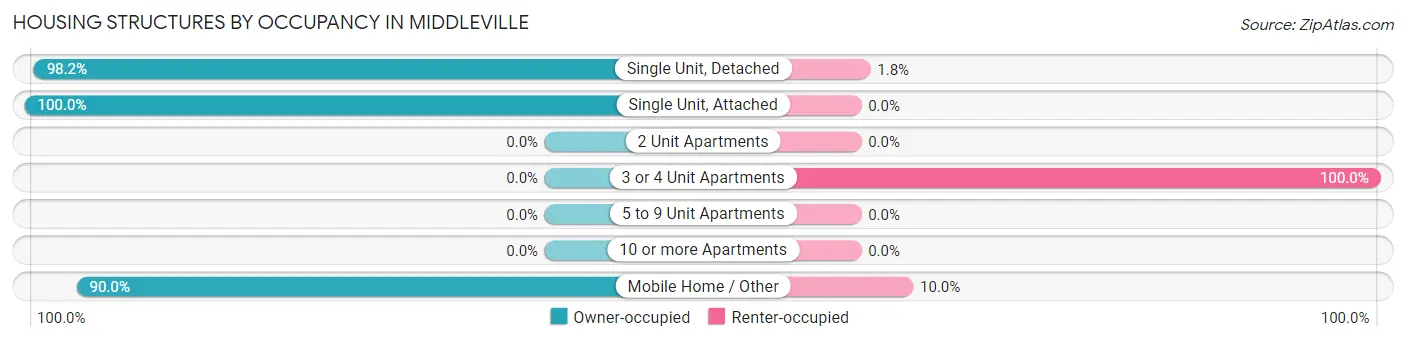
| Structure Type | Owner-occupied | Renter-occupied |
| Single Unit, Detached | 167 (98.2%) | 3 (1.8%) |
| Single Unit, Attached | 10 (100.0%) | 0 (0.0%) |
| 2 Unit Apartments | 0 (0.0%) | 0 (0.0%) |
| 3 or 4 Unit Apartments | 0 (0.0%) | 3 (100.0%) |
| 5 to 9 Unit Apartments | 0 (0.0%) | 0 (0.0%) |
| 10 or more Apartments | 0 (0.0%) | 0 (0.0%) |
| Mobile Home / Other | 18 (90.0%) | 2 (10.0%) |
| Total | 195 (96.1%) | 8 (3.9%) |
Housing Structures by Number of Rooms in Middleville
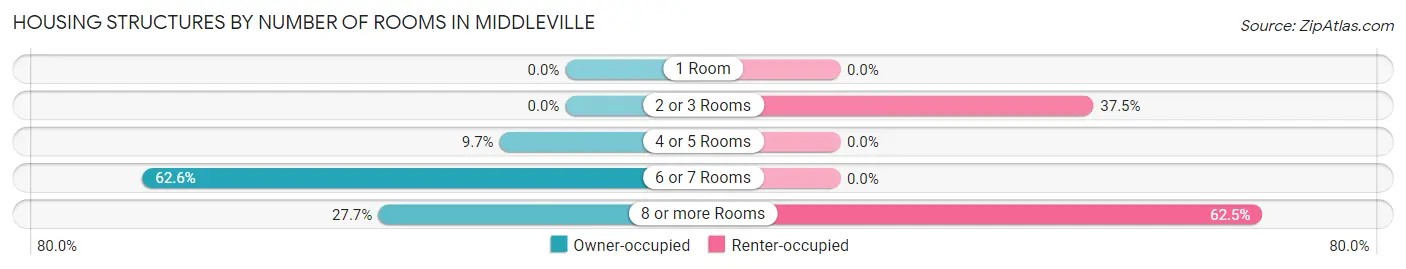
| Number of Rooms | Owner-occupied | Renter-occupied |
| 1 Room | 0 (0.0%) | 0 (0.0%) |
| 2 or 3 Rooms | 0 (0.0%) | 3 (37.5%) |
| 4 or 5 Rooms | 19 (9.7%) | 0 (0.0%) |
| 6 or 7 Rooms | 122 (62.6%) | 0 (0.0%) |
| 8 or more Rooms | 54 (27.7%) | 5 (62.5%) |
| Total | 195 (100.0%) | 8 (100.0%) |
Housing Structure by Heating Type in Middleville
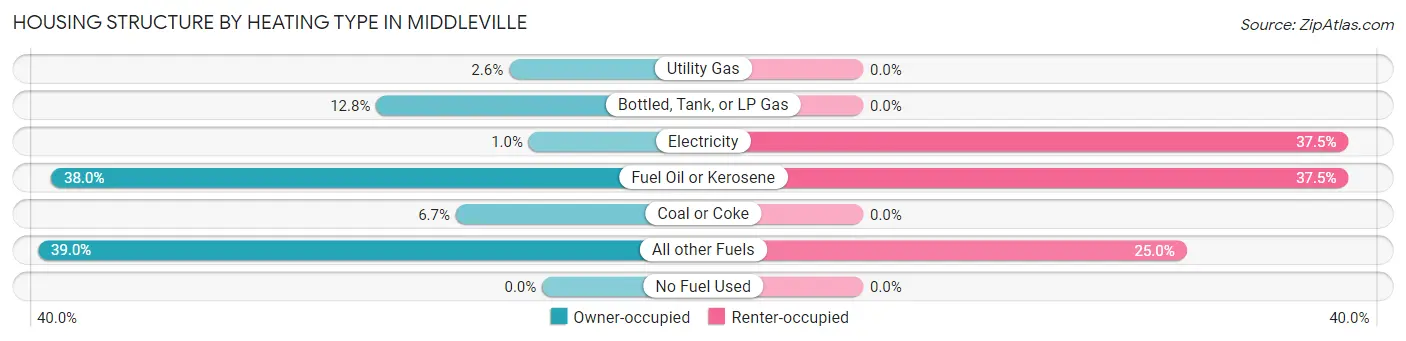
| Heating Type | Owner-occupied | Renter-occupied |
| Utility Gas | 5 (2.6%) | 0 (0.0%) |
| Bottled, Tank, or LP Gas | 25 (12.8%) | 0 (0.0%) |
| Electricity | 2 (1.0%) | 3 (37.5%) |
| Fuel Oil or Kerosene | 74 (38.0%) | 3 (37.5%) |
| Coal or Coke | 13 (6.7%) | 0 (0.0%) |
| All other Fuels | 76 (39.0%) | 2 (25.0%) |
| No Fuel Used | 0 (0.0%) | 0 (0.0%) |
| Total | 195 (100.0%) | 8 (100.0%) |
Household Vehicle Usage in Middleville
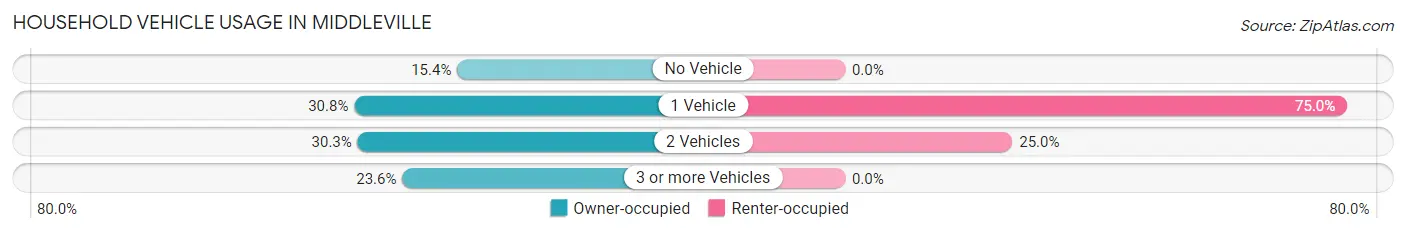
| Vehicles per Household | Owner-occupied | Renter-occupied |
| No Vehicle | 30 (15.4%) | 0 (0.0%) |
| 1 Vehicle | 60 (30.8%) | 6 (75.0%) |
| 2 Vehicles | 59 (30.3%) | 2 (25.0%) |
| 3 or more Vehicles | 46 (23.6%) | 0 (0.0%) |
| Total | 195 (100.0%) | 8 (100.0%) |
Real Estate & Mortgages in Middleville
Real Estate and Mortgage Overview in Middleville
| Characteristic | Without Mortgage | With Mortgage |
| Housing Units | 92 | 103 |
| Median Property Value | $127,500 | $134,100 |
| Median Household Income | - | - |
| Monthly Housing Costs | $443 | $6 |
| Real Estate Taxes | $1,682 | $7 |
Property Value by Mortgage Status in Middleville
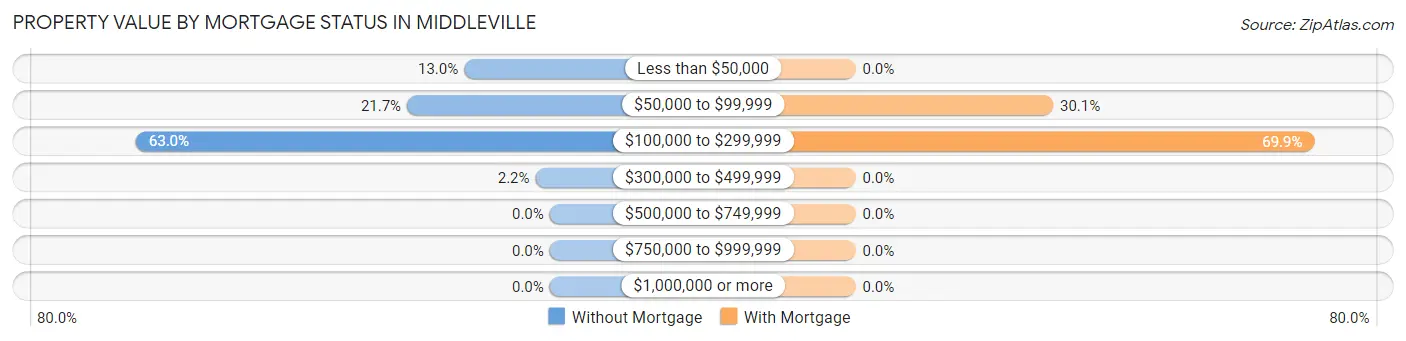
| Property Value | Without Mortgage | With Mortgage |
| Less than $50,000 | 12 (13.0%) | 0 (0.0%) |
| $50,000 to $99,999 | 20 (21.7%) | 31 (30.1%) |
| $100,000 to $299,999 | 58 (63.0%) | 72 (69.9%) |
| $300,000 to $499,999 | 2 (2.2%) | 0 (0.0%) |
| $500,000 to $749,999 | 0 (0.0%) | 0 (0.0%) |
| $750,000 to $999,999 | 0 (0.0%) | 0 (0.0%) |
| $1,000,000 or more | 0 (0.0%) | 0 (0.0%) |
| Total | 92 (100.0%) | 103 (100.0%) |
Household Income by Mortgage Status in Middleville
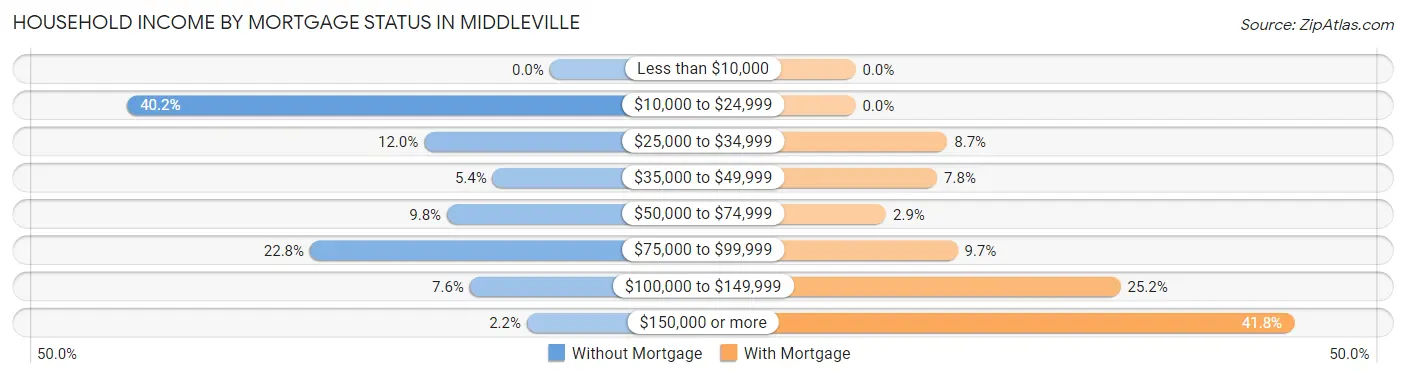
| Household Income | Without Mortgage | With Mortgage |
| Less than $10,000 | 0 (0.0%) | 0 (0.0%) |
| $10,000 to $24,999 | 37 (40.2%) | 0 (0.0%) |
| $25,000 to $34,999 | 11 (12.0%) | 9 (8.7%) |
| $35,000 to $49,999 | 5 (5.4%) | 8 (7.8%) |
| $50,000 to $74,999 | 9 (9.8%) | 3 (2.9%) |
| $75,000 to $99,999 | 21 (22.8%) | 10 (9.7%) |
| $100,000 to $149,999 | 7 (7.6%) | 26 (25.2%) |
| $150,000 or more | 2 (2.2%) | 43 (41.7%) |
| Total | 92 (100.0%) | 103 (100.0%) |
Property Value to Household Income Ratio in Middleville
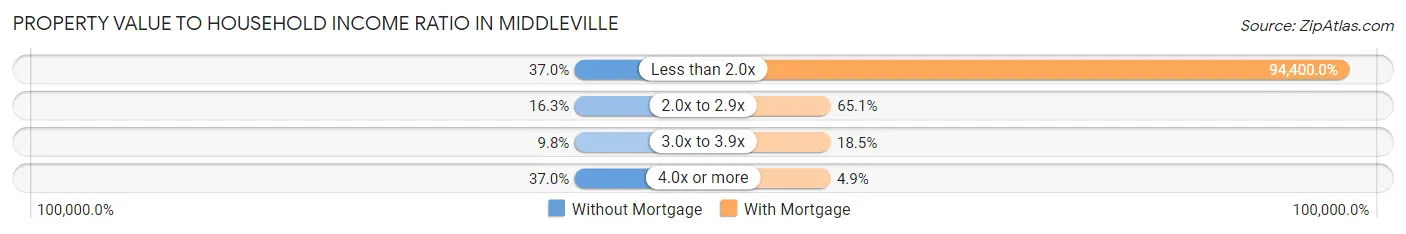
| Value-to-Income Ratio | Without Mortgage | With Mortgage |
| Less than 2.0x | 34 (37.0%) | 97,232 (94,400.0%) |
| 2.0x to 2.9x | 15 (16.3%) | 67 (65.0%) |
| 3.0x to 3.9x | 9 (9.8%) | 19 (18.4%) |
| 4.0x or more | 34 (37.0%) | 5 (4.9%) |
| Total | 92 (100.0%) | 103 (100.0%) |
Real Estate Taxes by Mortgage Status in Middleville
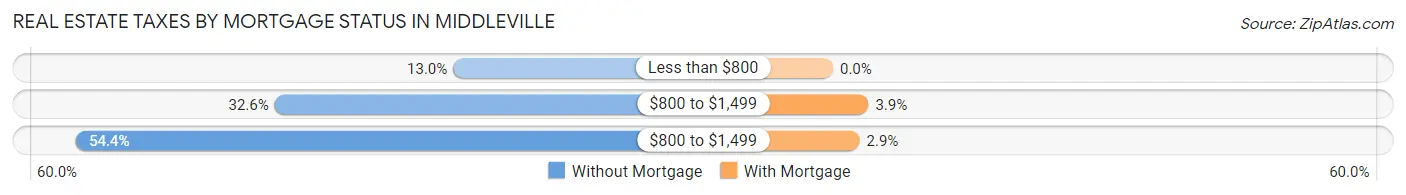
| Property Taxes | Without Mortgage | With Mortgage |
| Less than $800 | 12 (13.0%) | 0 (0.0%) |
| $800 to $1,499 | 30 (32.6%) | 4 (3.9%) |
| $800 to $1,499 | 50 (54.3%) | 3 (2.9%) |
| Total | 92 (100.0%) | 103 (100.0%) |
Health & Disability in Middleville
Health Insurance Coverage by Age in Middleville
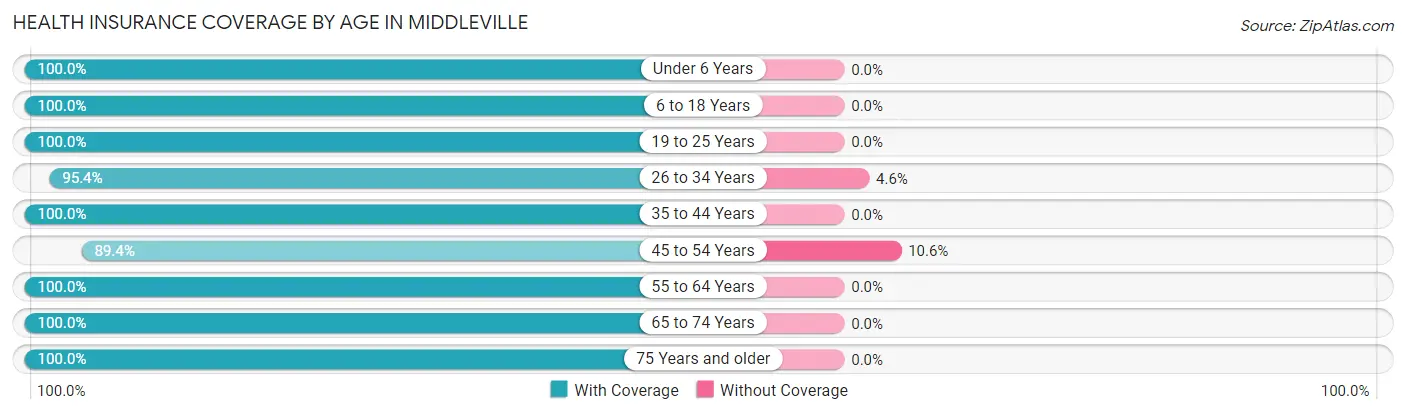
| Age Bracket | With Coverage | Without Coverage |
| Under 6 Years | 82 (100.0%) | 0 (0.0%) |
| 6 to 18 Years | 124 (100.0%) | 0 (0.0%) |
| 19 to 25 Years | 55 (100.0%) | 0 (0.0%) |
| 26 to 34 Years | 62 (95.4%) | 3 (4.6%) |
| 35 to 44 Years | 42 (100.0%) | 0 (0.0%) |
| 45 to 54 Years | 59 (89.4%) | 7 (10.6%) |
| 55 to 64 Years | 70 (100.0%) | 0 (0.0%) |
| 65 to 74 Years | 56 (100.0%) | 0 (0.0%) |
| 75 Years and older | 62 (100.0%) | 0 (0.0%) |
| Total | 612 (98.4%) | 10 (1.6%) |
Health Insurance Coverage by Citizenship Status in Middleville
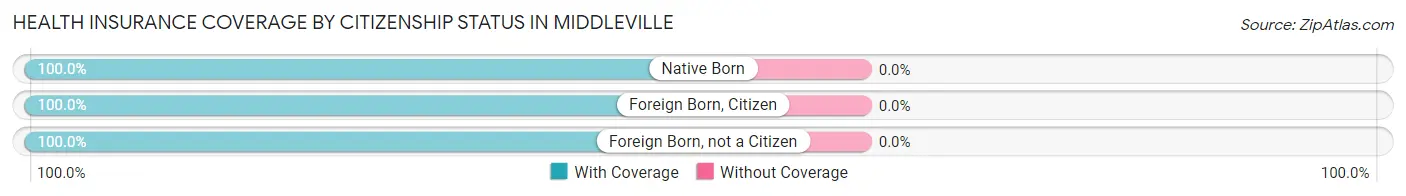
| Citizenship Status | With Coverage | Without Coverage |
| Native Born | 82 (100.0%) | 0 (0.0%) |
| Foreign Born, Citizen | 124 (100.0%) | 0 (0.0%) |
| Foreign Born, not a Citizen | 55 (100.0%) | 0 (0.0%) |
Health Insurance Coverage by Household Income in Middleville
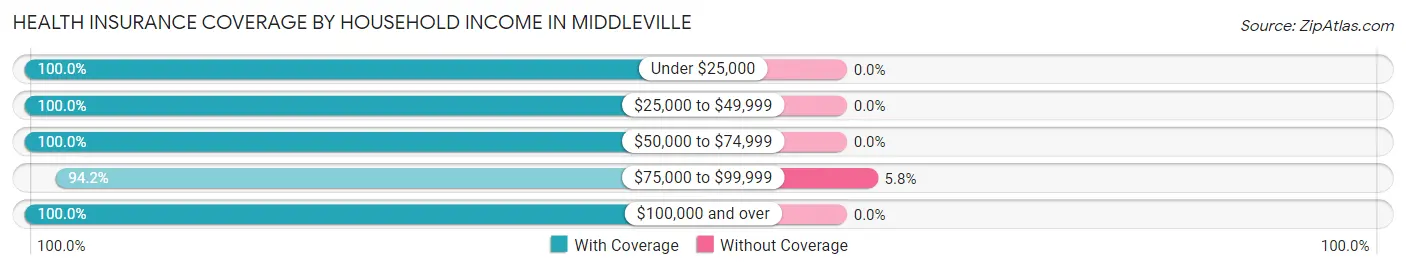
| Household Income | With Coverage | Without Coverage |
| Under $25,000 | 48 (100.0%) | 0 (0.0%) |
| $25,000 to $49,999 | 56 (100.0%) | 0 (0.0%) |
| $50,000 to $74,999 | 61 (100.0%) | 0 (0.0%) |
| $75,000 to $99,999 | 163 (94.2%) | 10 (5.8%) |
| $100,000 and over | 270 (100.0%) | 0 (0.0%) |
Public vs Private Health Insurance Coverage by Age in Middleville
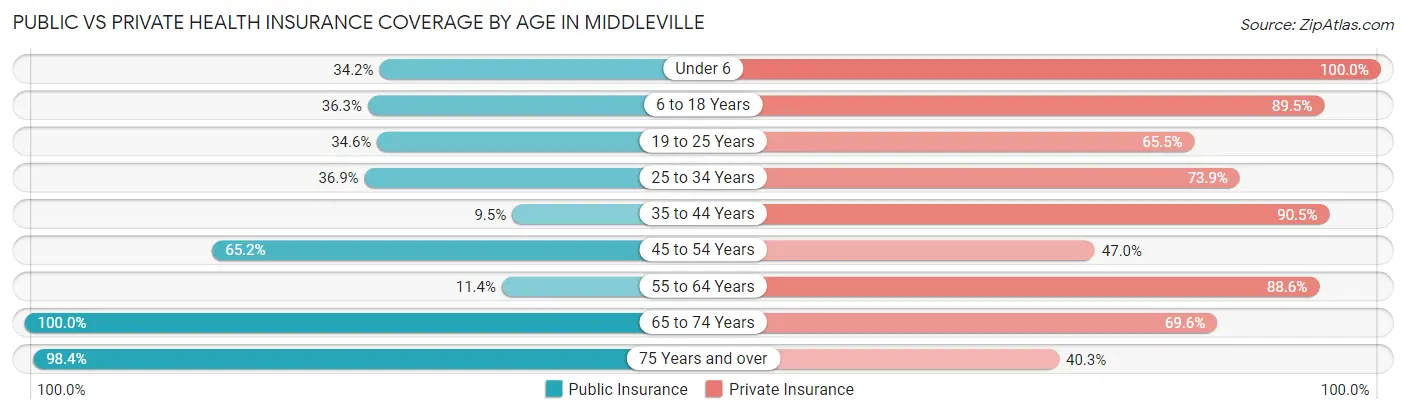
| Age Bracket | Public Insurance | Private Insurance |
| Under 6 | 28 (34.2%) | 82 (100.0%) |
| 6 to 18 Years | 45 (36.3%) | 111 (89.5%) |
| 19 to 25 Years | 19 (34.5%) | 36 (65.4%) |
| 25 to 34 Years | 24 (36.9%) | 48 (73.9%) |
| 35 to 44 Years | 4 (9.5%) | 38 (90.5%) |
| 45 to 54 Years | 43 (65.1%) | 31 (47.0%) |
| 55 to 64 Years | 8 (11.4%) | 62 (88.6%) |
| 65 to 74 Years | 56 (100.0%) | 39 (69.6%) |
| 75 Years and over | 61 (98.4%) | 25 (40.3%) |
| Total | 288 (46.3%) | 472 (75.9%) |
Disability Status by Sex by Age in Middleville
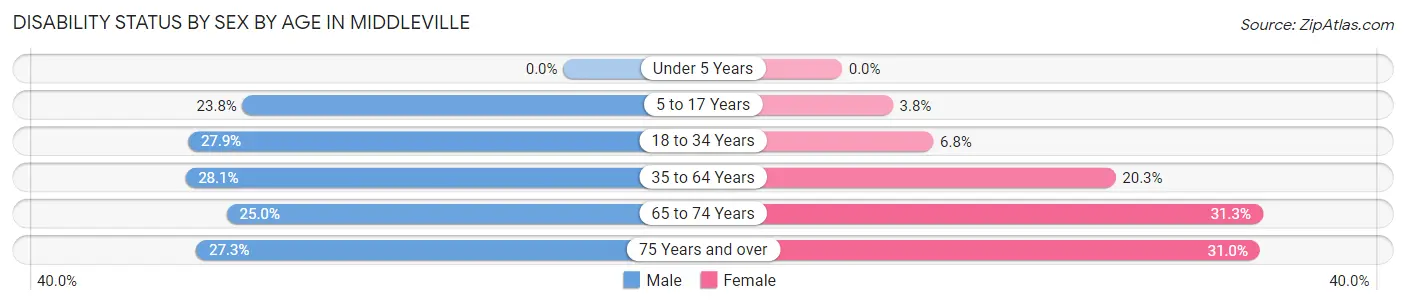
| Age Bracket | Male | Female |
| Under 5 Years | 0 (0.0%) | 0 (0.0%) |
| 5 to 17 Years | 10 (23.8%) | 4 (3.8%) |
| 18 to 34 Years | 17 (27.9%) | 4 (6.8%) |
| 35 to 64 Years | 32 (28.1%) | 13 (20.3%) |
| 65 to 74 Years | 10 (25.0%) | 5 (31.2%) |
| 75 Years and over | 9 (27.3%) | 9 (31.0%) |
Disability Class by Sex by Age in Middleville
Disability Class: Hearing Difficulty
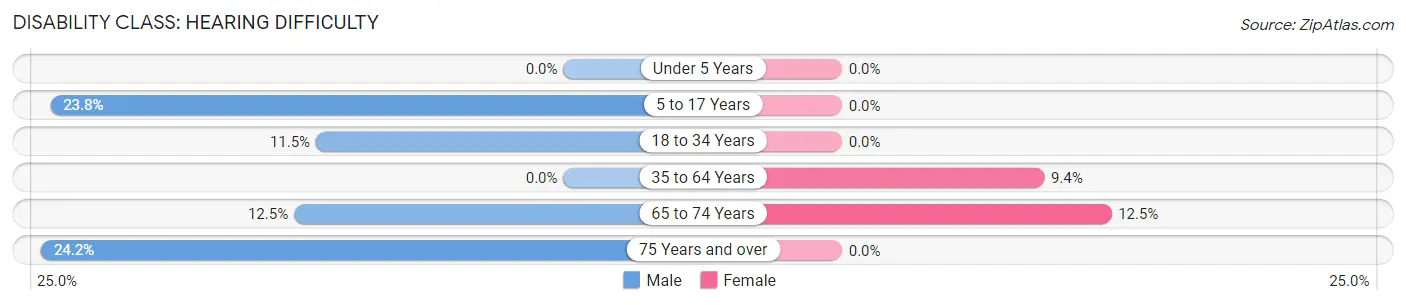
| Age Bracket | Male | Female |
| Under 5 Years | 0 (0.0%) | 0 (0.0%) |
| 5 to 17 Years | 10 (23.8%) | 0 (0.0%) |
| 18 to 34 Years | 7 (11.5%) | 0 (0.0%) |
| 35 to 64 Years | 0 (0.0%) | 6 (9.4%) |
| 65 to 74 Years | 5 (12.5%) | 2 (12.5%) |
| 75 Years and over | 8 (24.2%) | 0 (0.0%) |
Disability Class: Vision Difficulty
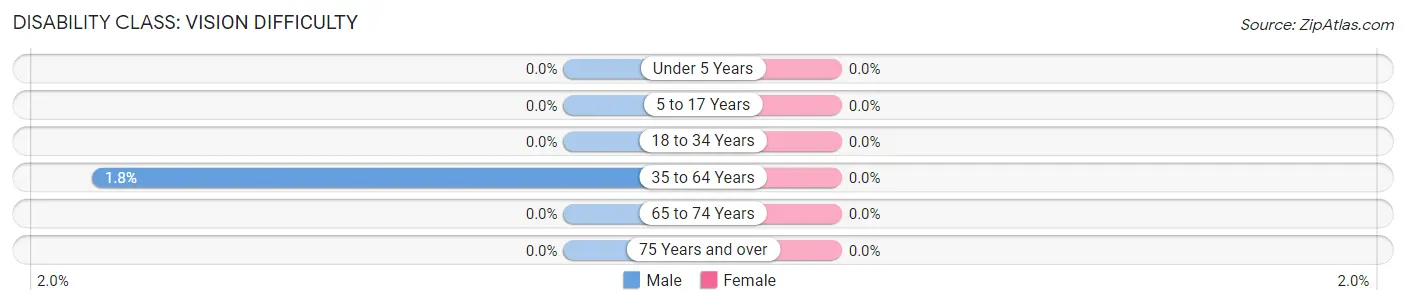
| Age Bracket | Male | Female |
| Under 5 Years | 0 (0.0%) | 0 (0.0%) |
| 5 to 17 Years | 0 (0.0%) | 0 (0.0%) |
| 18 to 34 Years | 0 (0.0%) | 0 (0.0%) |
| 35 to 64 Years | 2 (1.8%) | 0 (0.0%) |
| 65 to 74 Years | 0 (0.0%) | 0 (0.0%) |
| 75 Years and over | 0 (0.0%) | 0 (0.0%) |
Disability Class: Cognitive Difficulty
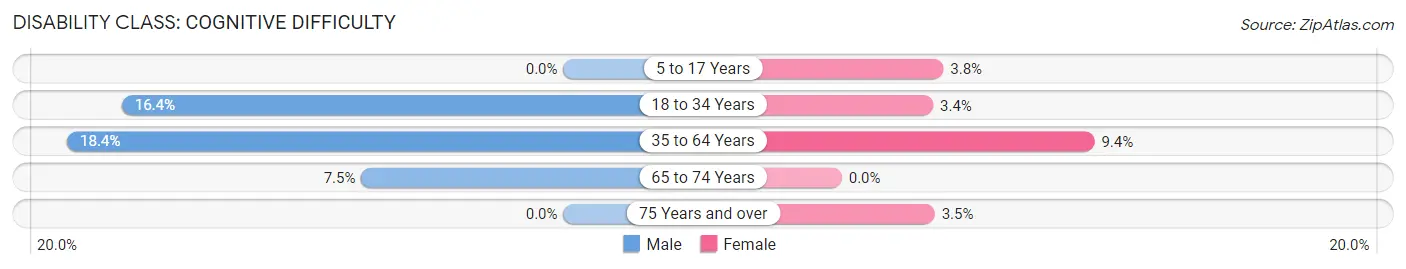
| Age Bracket | Male | Female |
| 5 to 17 Years | 0 (0.0%) | 4 (3.8%) |
| 18 to 34 Years | 10 (16.4%) | 2 (3.4%) |
| 35 to 64 Years | 21 (18.4%) | 6 (9.4%) |
| 65 to 74 Years | 3 (7.5%) | 0 (0.0%) |
| 75 Years and over | 0 (0.0%) | 1 (3.5%) |
Disability Class: Ambulatory Difficulty
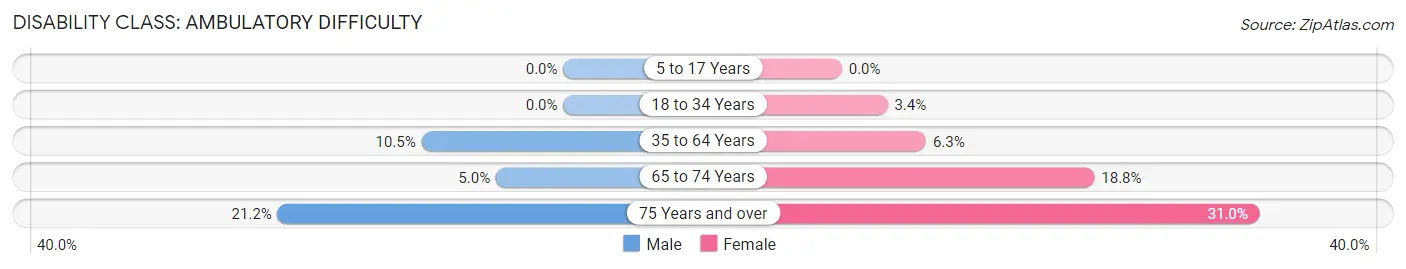
| Age Bracket | Male | Female |
| 5 to 17 Years | 0 (0.0%) | 0 (0.0%) |
| 18 to 34 Years | 0 (0.0%) | 2 (3.4%) |
| 35 to 64 Years | 12 (10.5%) | 4 (6.2%) |
| 65 to 74 Years | 2 (5.0%) | 3 (18.8%) |
| 75 Years and over | 7 (21.2%) | 9 (31.0%) |
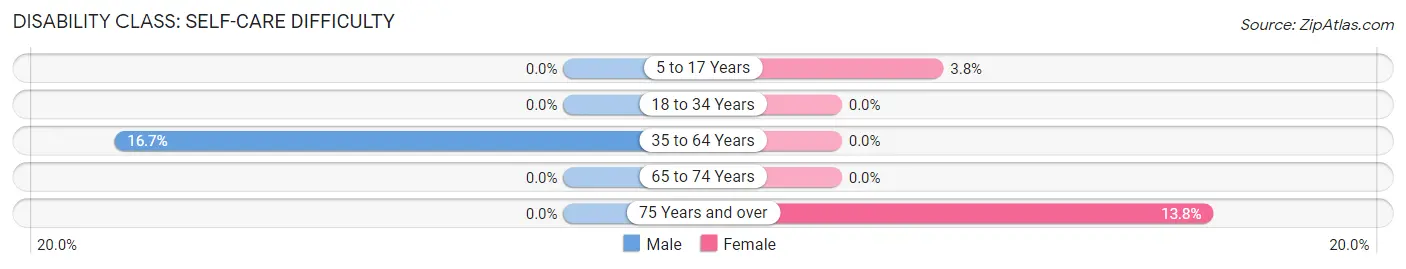
Disability Class: Self-Care Difficulty
| Age Bracket | Male | Female |
| 5 to 17 Years | 0 (0.0%) | 4 (3.8%) |
| 18 to 34 Years | 0 (0.0%) | 0 (0.0%) |
| 35 to 64 Years | 19 (16.7%) | 0 (0.0%) |
| 65 to 74 Years | 0 (0.0%) | 0 (0.0%) |
| 75 Years and over | 0 (0.0%) | 4 (13.8%) |
Technology Access in Middleville
Computing Device Access in Middleville
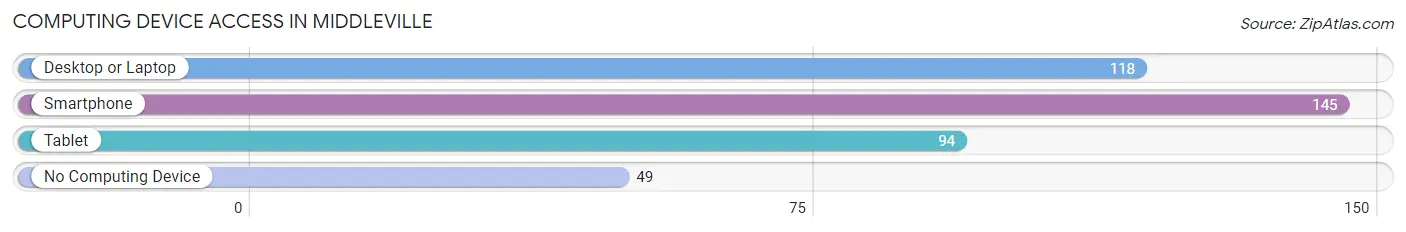
| Device Type | # Households | % Households |
| Desktop or Laptop | 118 | 58.1% |
| Smartphone | 145 | 71.4% |
| Tablet | 94 | 46.3% |
| No Computing Device | 49 | 24.1% |
| Total | 203 | 100.0% |
Internet Access in Middleville
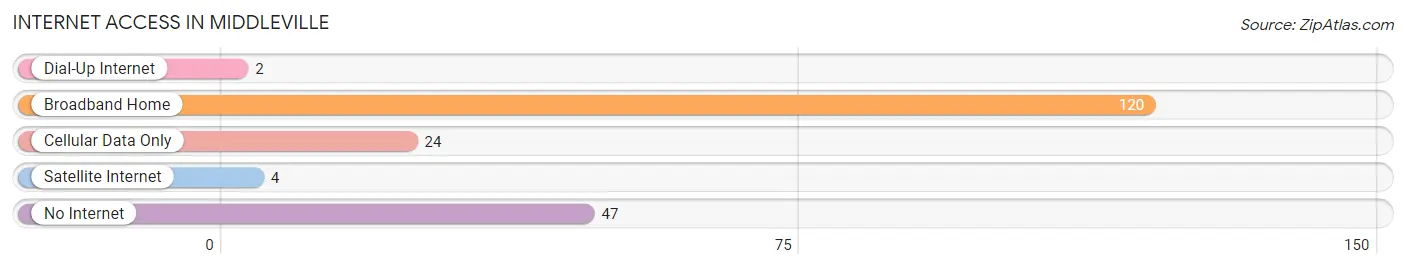
| Internet Type | # Households | % Households |
| Dial-Up Internet | 2 | 1.0% |
| Broadband Home | 120 | 59.1% |
| Cellular Data Only | 24 | 11.8% |
| Satellite Internet | 4 | 2.0% |
| No Internet | 47 | 23.2% |
| Total | 203 | 100.0% |
Middleville Summary
History
The small town of Middleville, New York is located in the Finger Lakes region of the state. It is situated in the town of Seneca, which is part of Ontario County. The town was first settled in the late 1700s by a group of settlers from Connecticut. The town was originally known as “Middlefield”, but the name was changed to Middleville in 1820.
The town was an important stop on the Underground Railroad, as it was a safe haven for escaped slaves. The town was also home to a number of prominent abolitionists, including the Reverend John Rankin and his family. Rankin was a Presbyterian minister who was an outspoken advocate for the abolition of slavery. He and his family provided shelter and assistance to many escaped slaves on their journey to freedom.
The town was also home to a number of other prominent figures, including the first woman to be elected to the New York State Assembly, Mary Ann Moseley. Moseley was a strong advocate for women’s rights and was instrumental in the passage of the Married Women’s Property Act of 1848.
The town was also home to a number of prominent businesses, including the Middleville Woolen Mill, which was established in 1845. The mill was one of the first in the area to produce woolen fabrics and was an important part of the local economy.
Geography
Middleville is located in the Finger Lakes region of New York, in the town of Seneca. The town is situated on the eastern shore of Seneca Lake, which is the largest of the Finger Lakes. The town is bordered by the towns of Geneva to the north, Waterloo to the east, and Romulus to the south.
The town is located in a rural area, with rolling hills and farmland. The terrain is mostly flat, with some areas of higher elevation. The town is home to a number of small lakes and ponds, as well as several creeks and streams.
Economy
The economy of Middleville is largely based on agriculture and tourism. The town is home to a number of small farms, which produce a variety of crops, including corn, soybeans, and hay. The town is also home to a number of wineries, which produce a variety of wines.
The town is also home to a number of small businesses, including restaurants, shops, and other services. The town is also home to a number of bed and breakfasts, which attract tourists from all over the world.
Demographics
As of the 2010 census, the population of Middleville was 1,845. The population is largely white, with a small percentage of African Americans, Hispanics, and other minorities. The median household income is $45,000, and the median home value is $150,000. The town has a low unemployment rate, and the majority of the population is employed in the agricultural and tourism industries.
Common Questions
What is Per Capita Income in Middleville?
Per Capita income in Middleville is $24,440.
What is the Median Family Income in Middleville?
Median Family Income in Middleville is $92,500.
What is the Median Household income in Middleville?
Median Household Income in Middleville is $76,458.
What is Inequality or Gini Index in Middleville?
Inequality or Gini Index in Middleville is 0.34.
What is the Total Population of Middleville?
Total Population of Middleville is 622.
What is the Total Male Population of Middleville?
Total Male Population of Middleville is 301.
What is the Total Female Population of Middleville?
Total Female Population of Middleville is 321.
What is the Ratio of Males per 100 Females in Middleville?
There are 93.77 Males per 100 Females in Middleville.
What is the Ratio of Females per 100 Males in Middleville?
There are 106.64 Females per 100 Males in Middleville.
What is the Median Population Age in Middleville?
Median Population Age in Middleville is 32.3 Years.
What is the Average Family Size in Middleville
Average Family Size in Middleville is 3.7 People.
What is the Average Household Size in Middleville
Average Household Size in Middleville is 3.0 People.
How Large is the Labor Force in Middleville?
There are 256 People in the Labor Forcein in Middleville.
What is the Percentage of People in the Labor Force in Middleville?
59.4% of People are in the Labor Force in Middleville.
What is the Unemployment Rate in Middleville?
Unemployment Rate in Middleville is 6.6%.