Lewiston, NY Map & Demographics
Lewiston Map
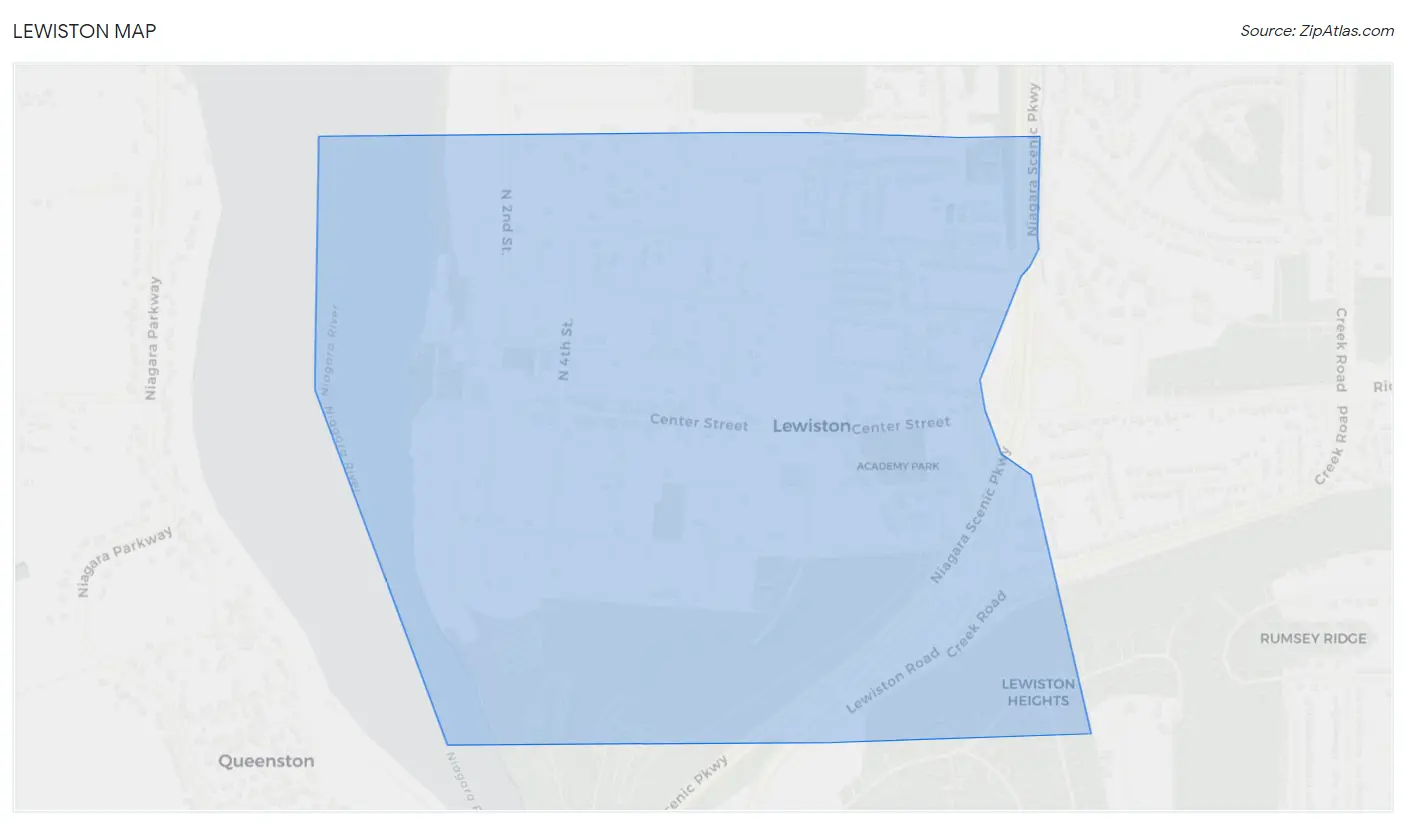
Lewiston Overview
$50,391
PER CAPITA INCOME
$140,000
AVG FAMILY INCOME
$65,563
AVG HOUSEHOLD INCOME
38.2%
WAGE / INCOME GAP [ % ]
61.8¢/ $1
WAGE / INCOME GAP [ $ ]
0.49
INEQUALITY / GINI INDEX
2,541
TOTAL POPULATION
1,181
MALE POPULATION
1,360
FEMALE POPULATION
86.84
MALES / 100 FEMALES
115.16
FEMALES / 100 MALES
50.6
MEDIAN AGE
2.9
AVG FAMILY SIZE
1.9
AVG HOUSEHOLD SIZE
1,388
LABOR FORCE [ PEOPLE ]
60.1%
PERCENT IN LABOR FORCE
4.1%
UNEMPLOYMENT RATE
Lewiston Zip Codes
Lewiston Area Codes
Income in Lewiston
Income Overview in Lewiston
Per Capita Income in Lewiston is $50,391, while median incomes of families and households are $140,000 and $65,563 respectively.
| Characteristic | Number | Measure |
| Per Capita Income | 2,541 | $50,391 |
| Median Family Income | 584 | $140,000 |
| Mean Family Income | 584 | $156,837 |
| Median Household Income | 1,307 | $65,563 |
| Mean Household Income | 1,307 | $98,642 |
| Income Deficit | 584 | $0 |
| Wage / Income Gap (%) | 2,541 | 38.23% |
| Wage / Income Gap ($) | 2,541 | 61.77¢ per $1 |
| Gini / Inequality Index | 2,541 | 0.49 |
Earnings by Sex in Lewiston
Average Earnings in Lewiston are $38,578, $48,458 for men and $29,933 for women, a difference of 38.2%.
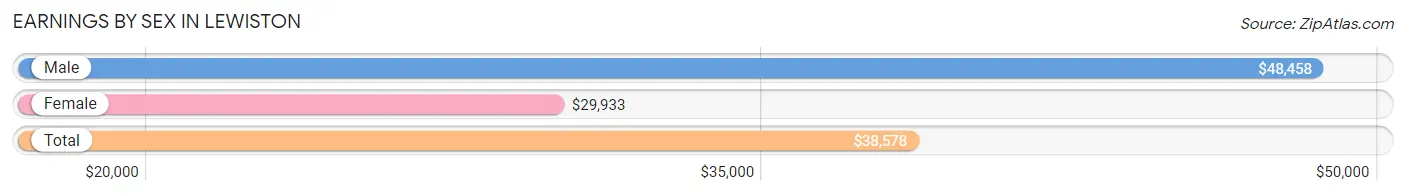
| Sex | Number | Average Earnings |
| Male | 749 (49.5%) | $48,458 |
| Female | 764 (50.5%) | $29,933 |
| Total | 1,513 (100.0%) | $38,578 |
Earnings by Sex by Income Bracket in Lewiston
The most common earnings brackets in Lewiston are $100,000+ for men (199 | 26.6%) and $25,000 to $29,999 for women (123 | 16.1%).
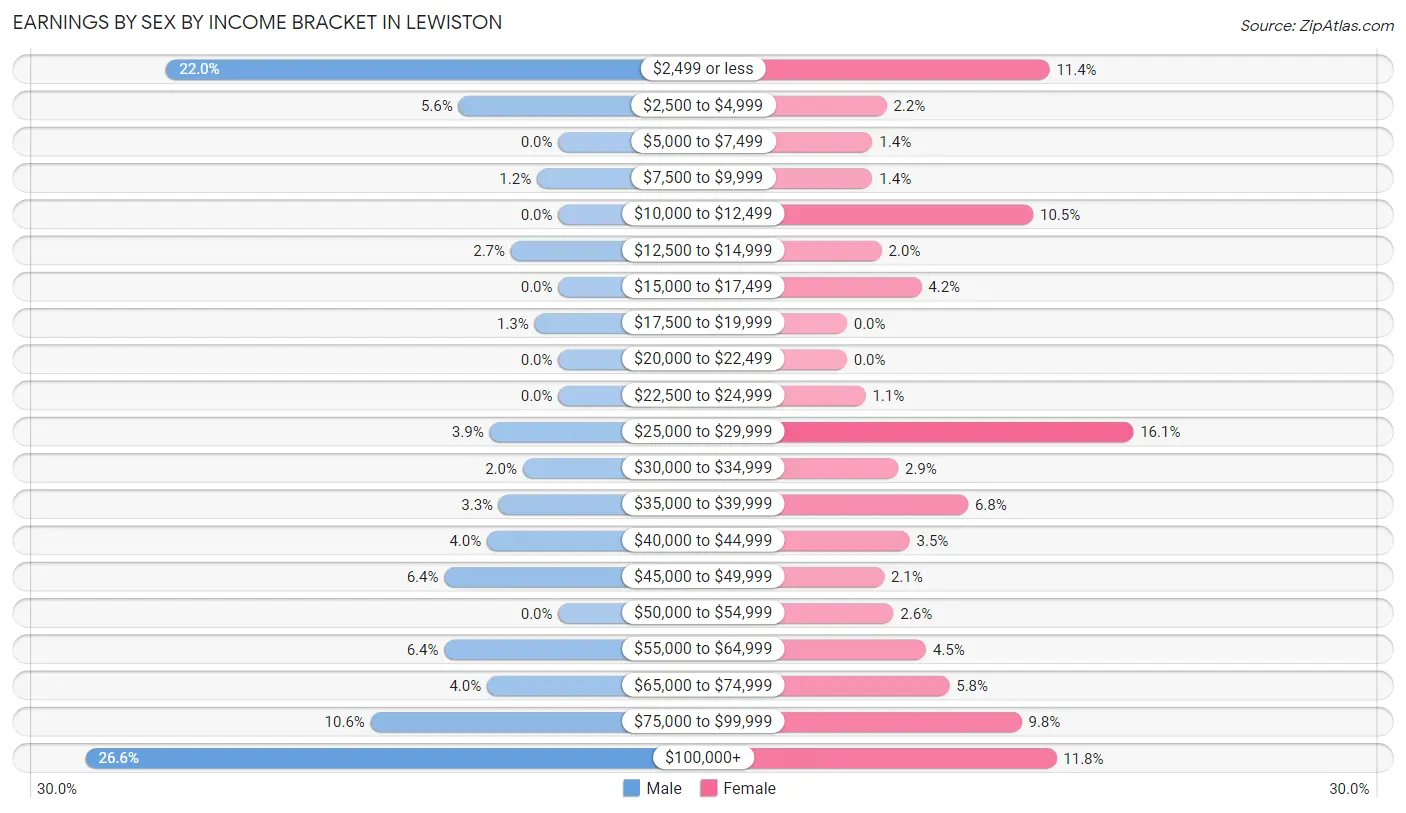
| Income | Male | Female |
| $2,499 or less | 165 (22.0%) | 87 (11.4%) |
| $2,500 to $4,999 | 42 (5.6%) | 17 (2.2%) |
| $5,000 to $7,499 | 0 (0.0%) | 11 (1.4%) |
| $7,500 to $9,999 | 9 (1.2%) | 11 (1.4%) |
| $10,000 to $12,499 | 0 (0.0%) | 80 (10.5%) |
| $12,500 to $14,999 | 20 (2.7%) | 15 (2.0%) |
| $15,000 to $17,499 | 0 (0.0%) | 32 (4.2%) |
| $17,500 to $19,999 | 10 (1.3%) | 0 (0.0%) |
| $20,000 to $22,499 | 0 (0.0%) | 0 (0.0%) |
| $22,500 to $24,999 | 0 (0.0%) | 8 (1.1%) |
| $25,000 to $29,999 | 29 (3.9%) | 123 (16.1%) |
| $30,000 to $34,999 | 15 (2.0%) | 22 (2.9%) |
| $35,000 to $39,999 | 25 (3.3%) | 52 (6.8%) |
| $40,000 to $44,999 | 30 (4.0%) | 27 (3.5%) |
| $45,000 to $49,999 | 48 (6.4%) | 16 (2.1%) |
| $50,000 to $54,999 | 0 (0.0%) | 20 (2.6%) |
| $55,000 to $64,999 | 48 (6.4%) | 34 (4.4%) |
| $65,000 to $74,999 | 30 (4.0%) | 44 (5.8%) |
| $75,000 to $99,999 | 79 (10.5%) | 75 (9.8%) |
| $100,000+ | 199 (26.6%) | 90 (11.8%) |
| Total | 749 (100.0%) | 764 (100.0%) |
Earnings by Sex by Educational Attainment in Lewiston
Average earnings in Lewiston are $71,250 for men and $37,841 for women, a difference of 46.9%. Men with an educational attainment of bachelor's degree enjoy the highest average annual earnings of $106,250, while those with college or associate's degree education earn the least with $48,458. Women with an educational attainment of graduate degree earn the most with the average annual earnings of $81,591, while those with college or associate's degree education have the smallest earnings of $29,534.
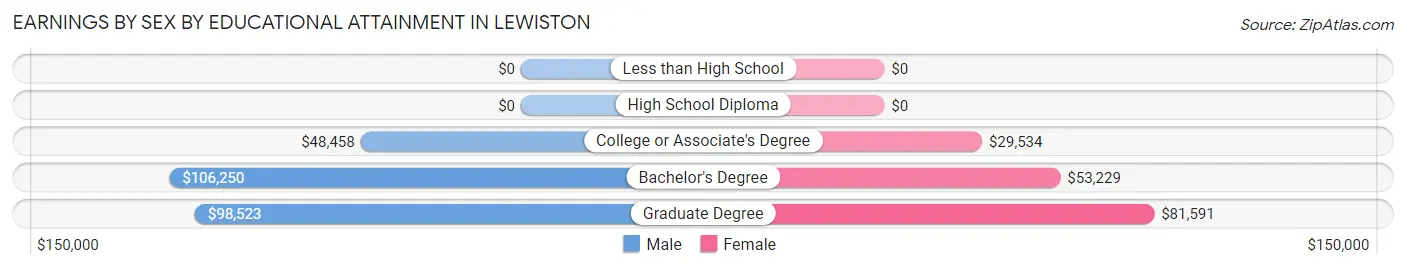
| Educational Attainment | Male Income | Female Income |
| Less than High School | - | - |
| High School Diploma | - | - |
| College or Associate's Degree | $48,458 | $29,534 |
| Bachelor's Degree | $106,250 | $53,229 |
| Graduate Degree | $98,523 | $81,591 |
| Total | $71,250 | $37,841 |
Family Income in Lewiston
Family Income Brackets in Lewiston
According to the Lewiston family income data, there are 140 families falling into the $200,000+ income range, which is the most common income bracket and makes up 24.0% of all families.
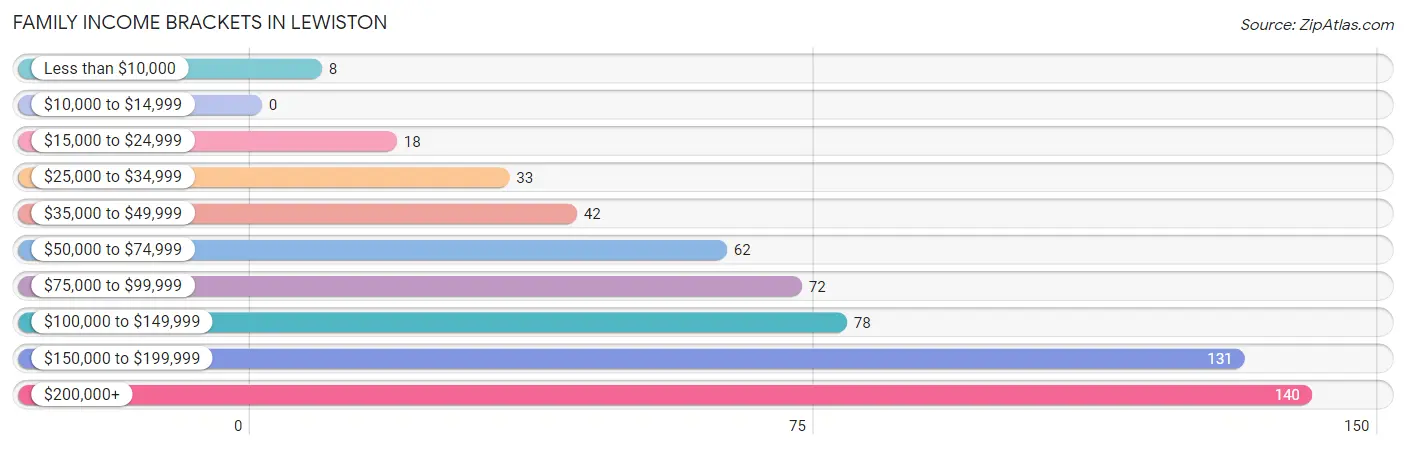
| Income Bracket | # Families | % Families |
| Less than $10,000 | 8 | 1.4% |
| $10,000 to $14,999 | 0 | 0.0% |
| $15,000 to $24,999 | 18 | 3.1% |
| $25,000 to $34,999 | 33 | 5.7% |
| $35,000 to $49,999 | 42 | 7.2% |
| $50,000 to $74,999 | 62 | 10.6% |
| $75,000 to $99,999 | 72 | 12.3% |
| $100,000 to $149,999 | 78 | 13.4% |
| $150,000 to $199,999 | 131 | 22.4% |
| $200,000+ | 140 | 24.0% |
Family Income by Famaliy Size in Lewiston
4-person families (97 | 16.6%) account for the highest median family income in Lewiston with $223,977 per family, while 3-person families (254 | 43.5%) have the highest median income of $56,140 per family member.
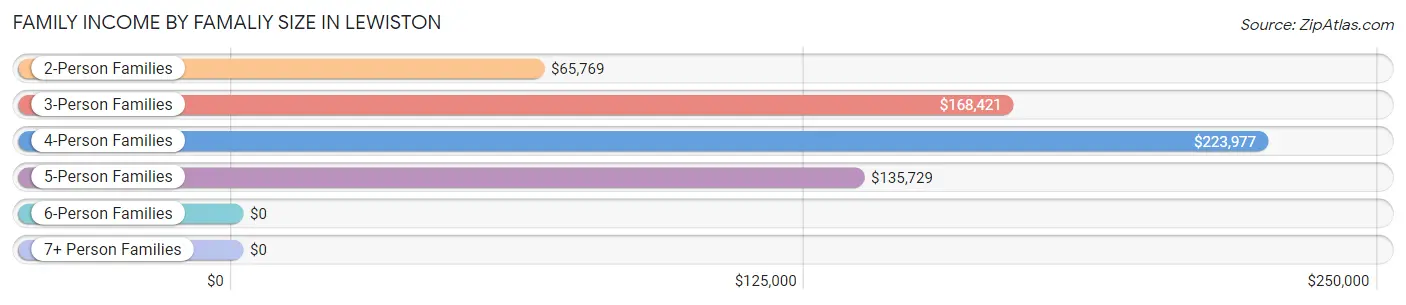
| Income Bracket | # Families | Median Income |
| 2-Person Families | 202 (34.6%) | $65,769 |
| 3-Person Families | 254 (43.5%) | $168,421 |
| 4-Person Families | 97 (16.6%) | $223,977 |
| 5-Person Families | 31 (5.3%) | $135,729 |
| 6-Person Families | 0 (0.0%) | $0 |
| 7+ Person Families | 0 (0.0%) | $0 |
| Total | 584 (100.0%) | $140,000 |
Family Income by Number of Earners in Lewiston
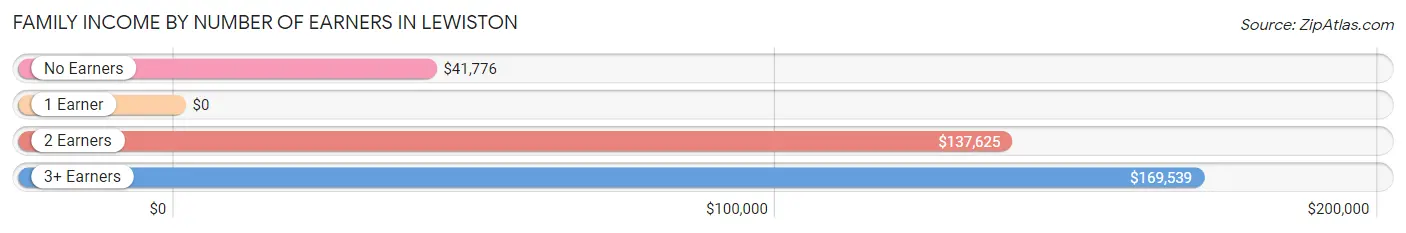
| Number of Earners | # Families | Median Income |
| No Earners | 105 (18.0%) | $41,776 |
| 1 Earner | 108 (18.5%) | $0 |
| 2 Earners | 211 (36.1%) | $137,625 |
| 3+ Earners | 160 (27.4%) | $169,539 |
| Total | 584 (100.0%) | $140,000 |
Household Income in Lewiston
Household Income Brackets in Lewiston
With 190 households falling in the category, the $50,000 to $74,999 income range is the most frequent in Lewiston, accounting for 14.5% of all households. In contrast, only 34 households (2.6%) fall into the less than $10,000 income bracket, making it the least populous group.
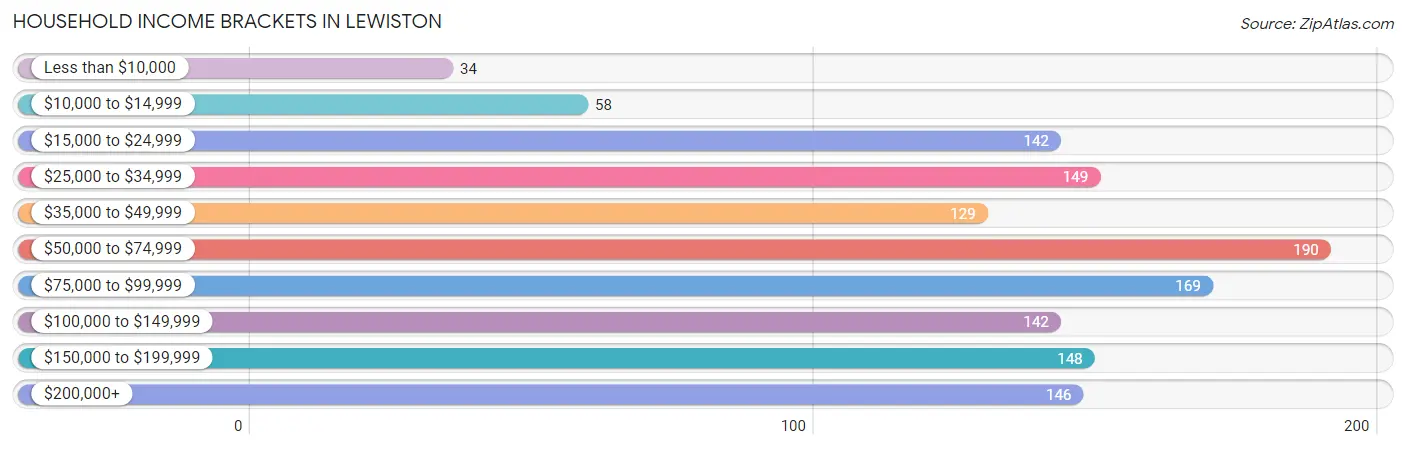
| Income Bracket | # Households | % Households |
| Less than $10,000 | 34 | 2.6% |
| $10,000 to $14,999 | 58 | 4.4% |
| $15,000 to $24,999 | 142 | 10.9% |
| $25,000 to $34,999 | 149 | 11.4% |
| $35,000 to $49,999 | 129 | 9.9% |
| $50,000 to $74,999 | 190 | 14.5% |
| $75,000 to $99,999 | 169 | 12.9% |
| $100,000 to $149,999 | 142 | 10.9% |
| $150,000 to $199,999 | 148 | 11.3% |
| $200,000+ | 146 | 11.2% |
Household Income by Householder Age in Lewiston
The median household income in Lewiston is $65,563, with the highest median household income of $108,229 found in the 25 to 44 years age bracket for the primary householder. A total of 329 households (25.2%) fall into this category. Meanwhile, the 15 to 24 years age bracket for the primary householder has the lowest median household income of $0, with 37 households (2.8%) in this group.
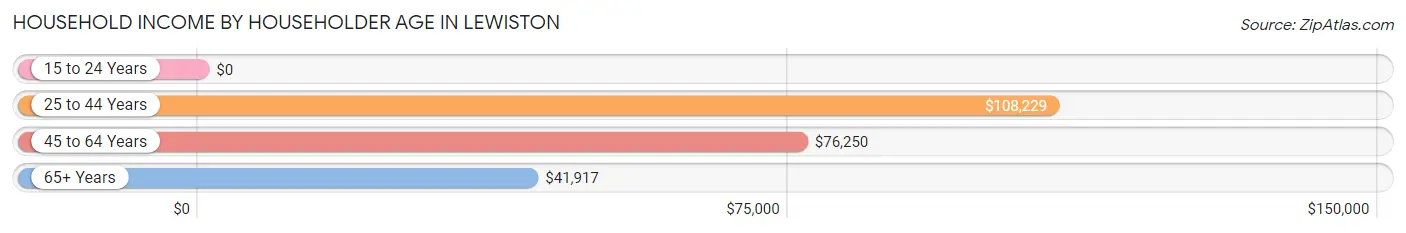
| Income Bracket | # Households | Median Income |
| 15 to 24 Years | 37 (2.8%) | $0 |
| 25 to 44 Years | 329 (25.2%) | $108,229 |
| 45 to 64 Years | 428 (32.8%) | $76,250 |
| 65+ Years | 513 (39.3%) | $41,917 |
| Total | 1,307 (100.0%) | $65,563 |
Poverty in Lewiston
Income Below Poverty by Sex and Age in Lewiston
With 3.9% poverty level for males and 8.9% for females among the residents of Lewiston, 55 to 64 year old males and 12 to 14 year old females are the most vulnerable to poverty, with 33 males (17.6%) and 11 females (100.0%) in their respective age groups living below the poverty level.
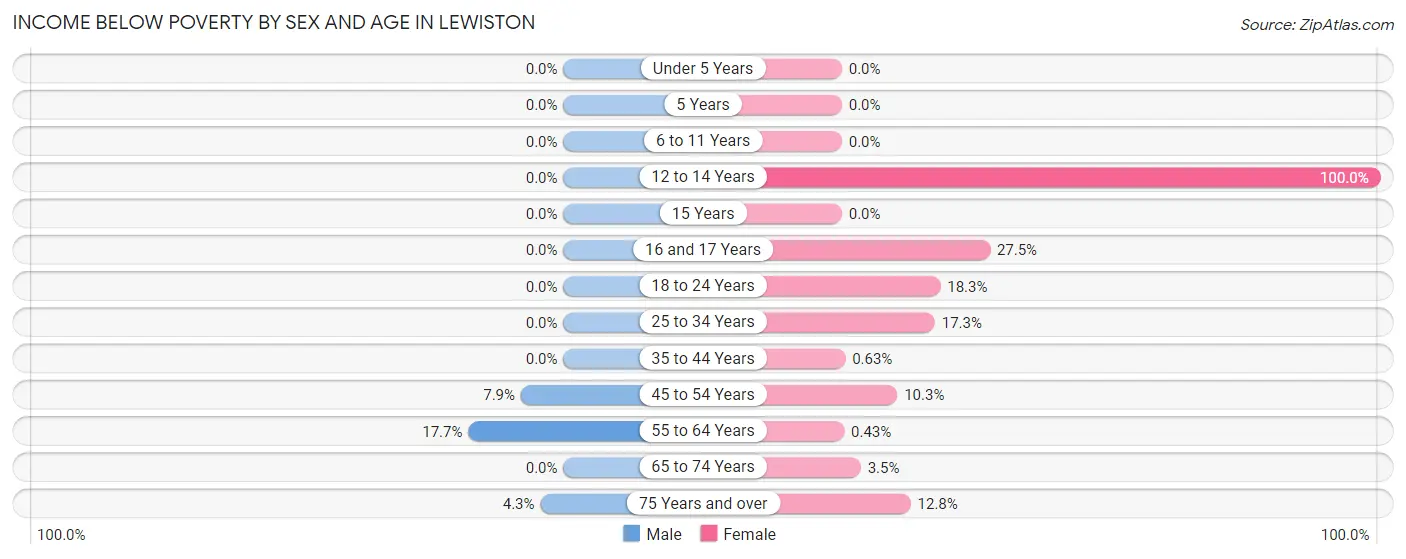
| Age Bracket | Male | Female |
| Under 5 Years | 0 (0.0%) | 0 (0.0%) |
| 5 Years | 0 (0.0%) | 0 (0.0%) |
| 6 to 11 Years | 0 (0.0%) | 0 (0.0%) |
| 12 to 14 Years | 0 (0.0%) | 11 (100.0%) |
| 15 Years | 0 (0.0%) | 0 (0.0%) |
| 16 and 17 Years | 0 (0.0%) | 11 (27.5%) |
| 18 to 24 Years | 0 (0.0%) | 17 (18.3%) |
| 25 to 34 Years | 0 (0.0%) | 24 (17.3%) |
| 35 to 44 Years | 0 (0.0%) | 1 (0.6%) |
| 45 to 54 Years | 9 (7.9%) | 14 (10.3%) |
| 55 to 64 Years | 33 (17.6%) | 1 (0.4%) |
| 65 to 74 Years | 0 (0.0%) | 6 (3.5%) |
| 75 Years and over | 4 (4.3%) | 36 (12.8%) |
| Total | 46 (3.9%) | 121 (8.9%) |
Income Above Poverty by Sex and Age in Lewiston
According to the poverty statistics in Lewiston, males aged under 5 years and females aged under 5 years are the age groups that are most secure financially, with 100.0% of males and 100.0% of females in these age groups living above the poverty line.
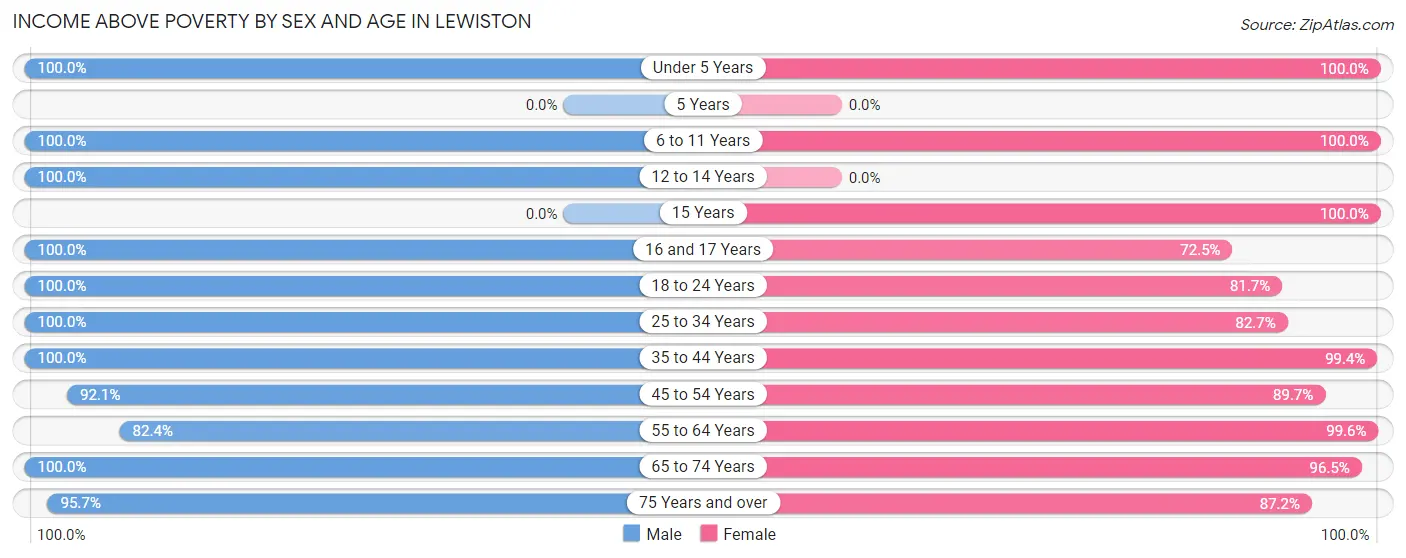
| Age Bracket | Male | Female |
| Under 5 Years | 35 (100.0%) | 14 (100.0%) |
| 5 Years | 0 (0.0%) | 0 (0.0%) |
| 6 to 11 Years | 59 (100.0%) | 56 (100.0%) |
| 12 to 14 Years | 30 (100.0%) | 0 (0.0%) |
| 15 Years | 0 (0.0%) | 26 (100.0%) |
| 16 and 17 Years | 42 (100.0%) | 29 (72.5%) |
| 18 to 24 Years | 134 (100.0%) | 76 (81.7%) |
| 25 to 34 Years | 112 (100.0%) | 115 (82.7%) |
| 35 to 44 Years | 190 (100.0%) | 158 (99.4%) |
| 45 to 54 Years | 105 (92.1%) | 122 (89.7%) |
| 55 to 64 Years | 154 (82.4%) | 232 (99.6%) |
| 65 to 74 Years | 184 (100.0%) | 165 (96.5%) |
| 75 Years and over | 90 (95.7%) | 246 (87.2%) |
| Total | 1,135 (96.1%) | 1,239 (91.1%) |
Income Below Poverty Among Married-Couple Families in Lewiston
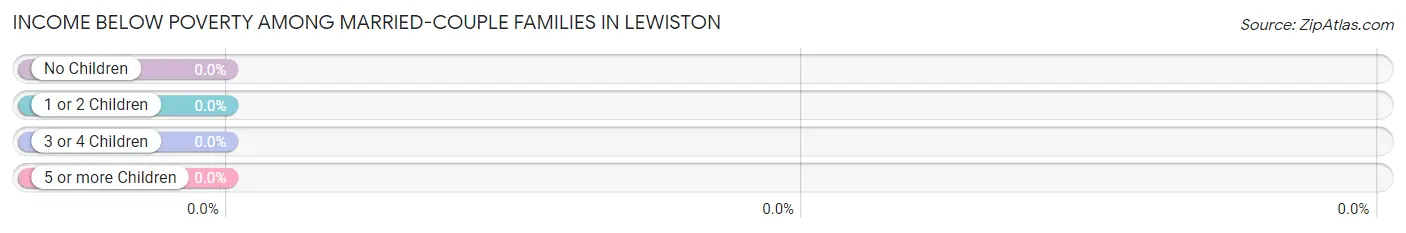
| Children | Above Poverty | Below Poverty |
| No Children | 350 (100.0%) | 0 (0.0%) |
| 1 or 2 Children | 92 (100.0%) | 0 (0.0%) |
| 3 or 4 Children | 31 (100.0%) | 0 (0.0%) |
| 5 or more Children | 0 (0.0%) | 0 (0.0%) |
| Total | 473 (100.0%) | 0 (0.0%) |
Income Below Poverty Among Single-Parent Households in Lewiston
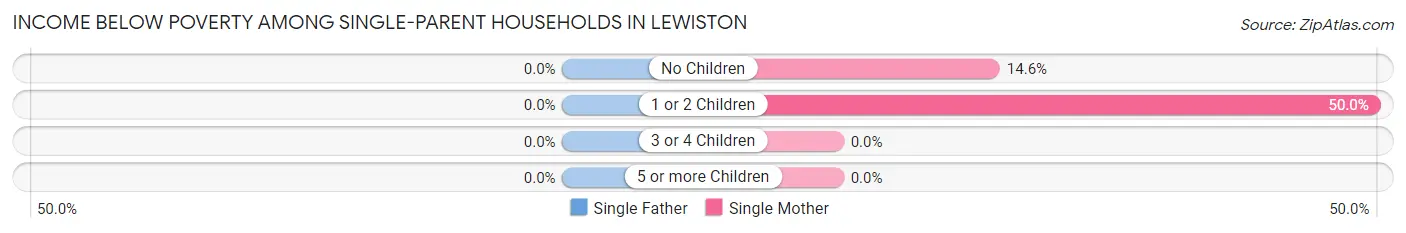
| Children | Single Father | Single Mother |
| No Children | 0 (0.0%) | 8 (14.5%) |
| 1 or 2 Children | 0 (0.0%) | 11 (50.0%) |
| 3 or 4 Children | 0 (0.0%) | 0 (0.0%) |
| 5 or more Children | 0 (0.0%) | 0 (0.0%) |
| Total | 0 (0.0%) | 19 (24.7%) |
Income Below Poverty Among Married-Couple vs Single-Parent Households in Lewiston
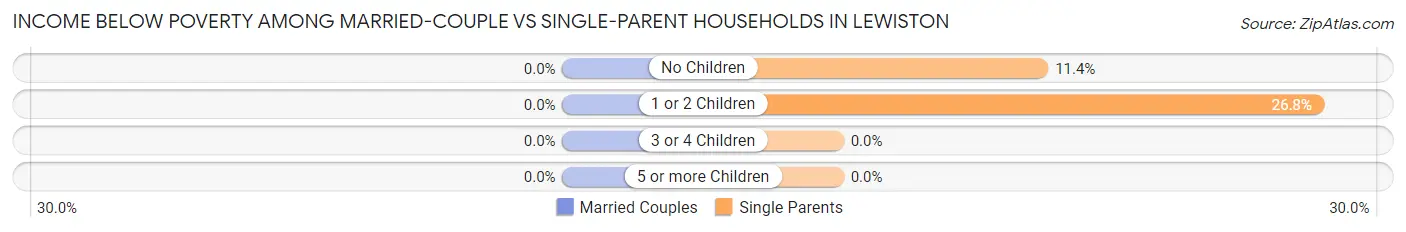
| Children | Married-Couple Families | Single-Parent Households |
| No Children | 0 (0.0%) | 8 (11.4%) |
| 1 or 2 Children | 0 (0.0%) | 11 (26.8%) |
| 3 or 4 Children | 0 (0.0%) | 0 (0.0%) |
| 5 or more Children | 0 (0.0%) | 0 (0.0%) |
| Total | 0 (0.0%) | 19 (17.1%) |
Race in Lewiston
The most populous races in Lewiston are White / Caucasian (2,516 | 99.0%), Asian (22 | 0.9%), and Black / African American (3 | 0.1%).
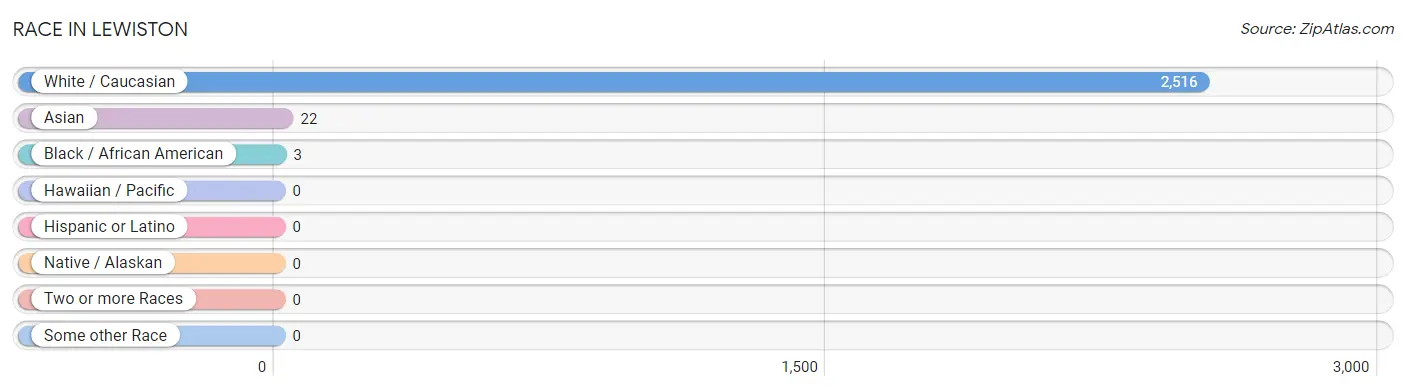
| Race | # Population | % Population |
| Asian | 22 | 0.9% |
| Black / African American | 3 | 0.1% |
| Hawaiian / Pacific | 0 | 0.0% |
| Hispanic or Latino | 0 | 0.0% |
| Native / Alaskan | 0 | 0.0% |
| White / Caucasian | 2,516 | 99.0% |
| Two or more Races | 0 | 0.0% |
| Some other Race | 0 | 0.0% |
| Total | 2,541 | 100.0% |
Ancestry in Lewiston
The most populous ancestries reported in Lewiston are Italian (649 | 25.5%), German (510 | 20.1%), Irish (422 | 16.6%), Polish (371 | 14.6%), and English (359 | 14.1%), together accounting for 90.9% of all Lewiston residents.
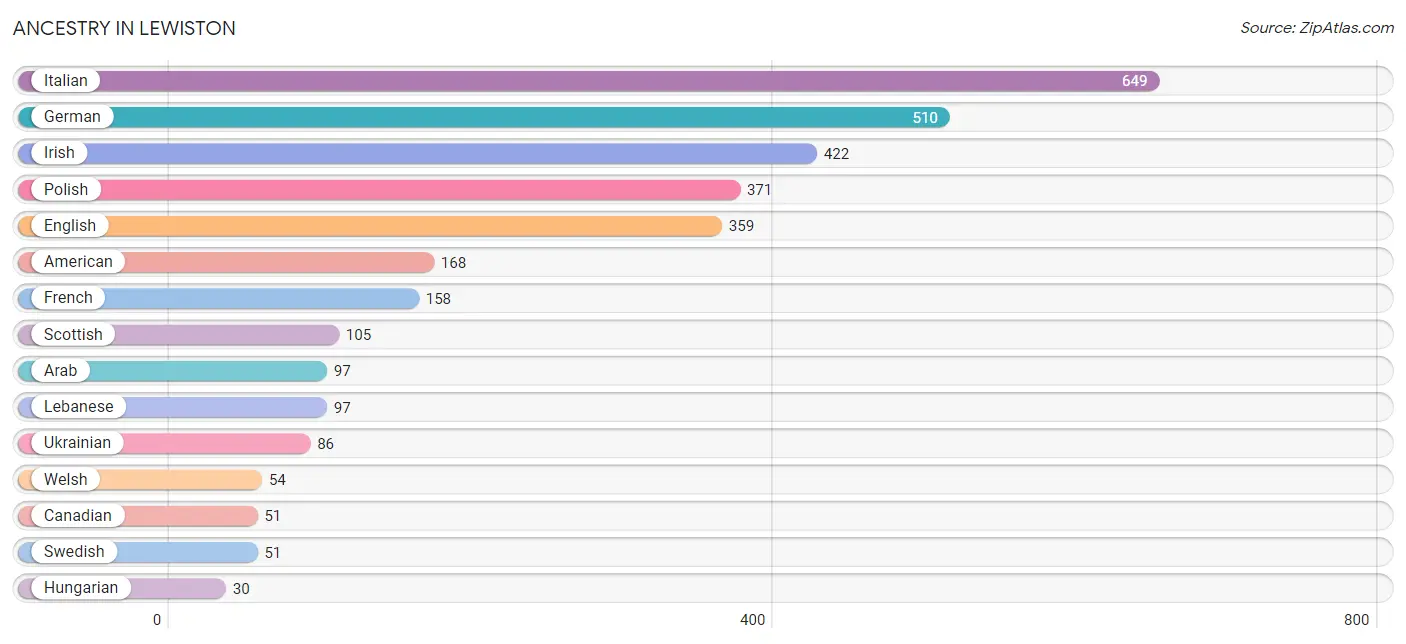
| Ancestry | # Population | % Population |
| American | 168 | 6.6% |
| Arab | 97 | 3.8% |
| Canadian | 51 | 2.0% |
| Celtic | 8 | 0.3% |
| Czechoslovakian | 12 | 0.5% |
| Dutch | 12 | 0.5% |
| Eastern European | 8 | 0.3% |
| English | 359 | 14.1% |
| French | 158 | 6.2% |
| French Canadian | 9 | 0.4% |
| German | 510 | 20.1% |
| Greek | 7 | 0.3% |
| Hungarian | 30 | 1.2% |
| Indian (Asian) | 22 | 0.9% |
| Irish | 422 | 16.6% |
| Italian | 649 | 25.5% |
| Lebanese | 97 | 3.8% |
| Northern European | 8 | 0.3% |
| Polish | 371 | 14.6% |
| Portuguese | 6 | 0.2% |
| Russian | 10 | 0.4% |
| Scottish | 105 | 4.1% |
| Swedish | 51 | 2.0% |
| Ukrainian | 86 | 3.4% |
| Welsh | 54 | 2.1% | View All 25 Rows |
Immigrants in Lewiston
The most numerous immigrant groups reported in Lewiston came from Europe (250 | 9.8%), Germany (216 | 8.5%), Western Europe (216 | 8.5%), Canada (36 | 1.4%), and Asia (22 | 0.9%), together accounting for 29.1% of all Lewiston residents.
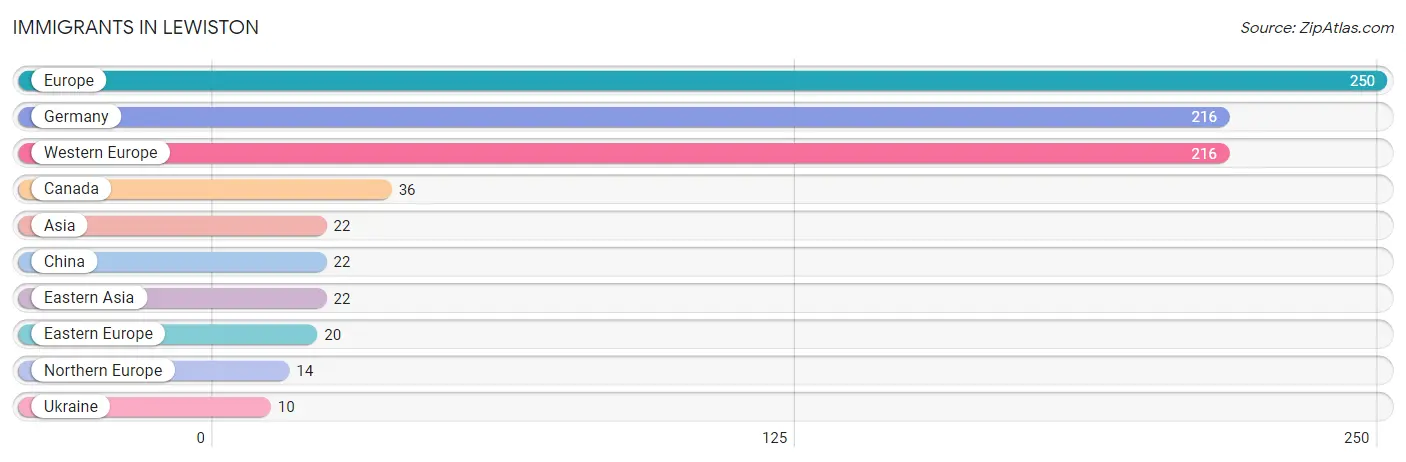
| Immigration Origin | # Population | % Population |
| Asia | 22 | 0.9% |
| Canada | 36 | 1.4% |
| China | 22 | 0.9% |
| Eastern Asia | 22 | 0.9% |
| Eastern Europe | 20 | 0.8% |
| Europe | 250 | 9.8% |
| Germany | 216 | 8.5% |
| Northern Europe | 14 | 0.5% |
| Ukraine | 10 | 0.4% |
| Western Europe | 216 | 8.5% | View All 10 Rows |
Sex and Age in Lewiston
Sex and Age in Lewiston
The most populous age groups in Lewiston are 15 to 19 Years (157 | 13.3%) for men and 60 to 64 Years (150 | 11.0%) for women.
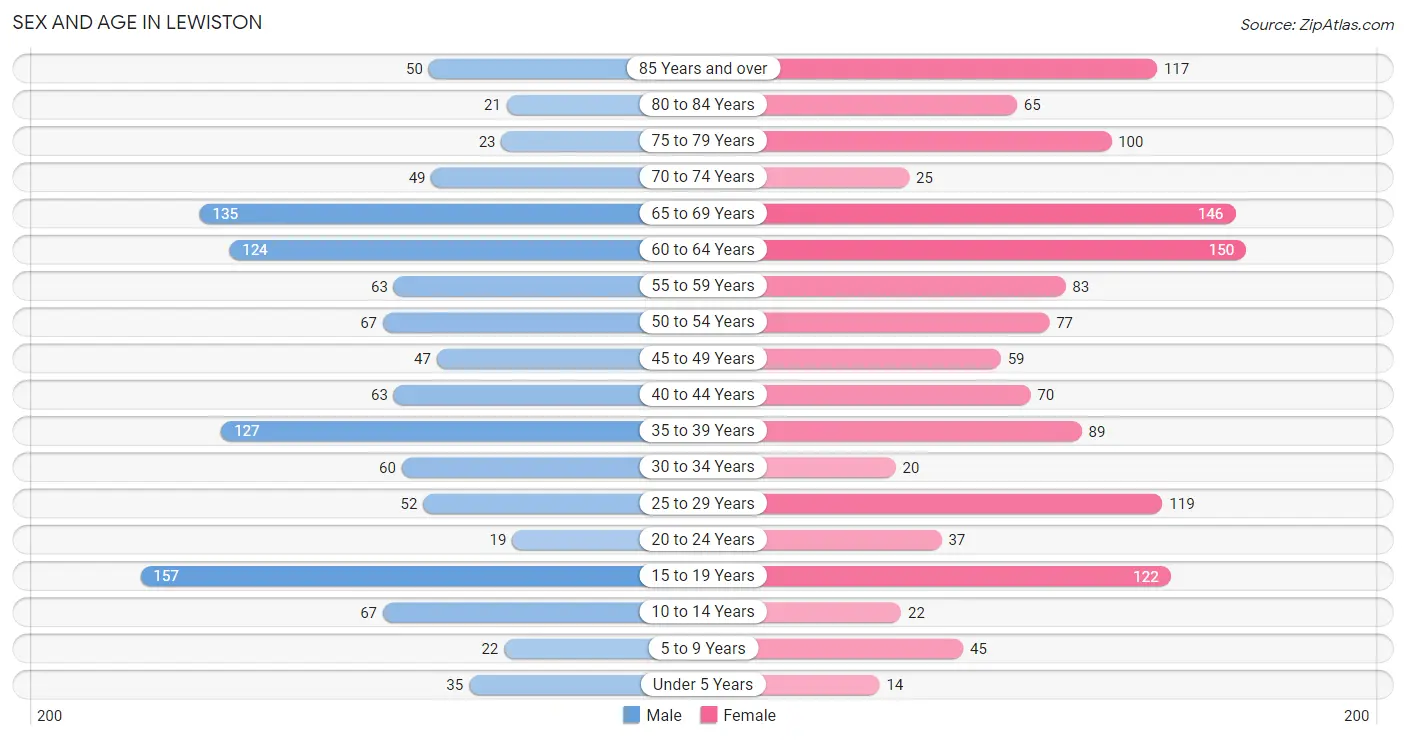
| Age Bracket | Male | Female |
| Under 5 Years | 35 (3.0%) | 14 (1.0%) |
| 5 to 9 Years | 22 (1.9%) | 45 (3.3%) |
| 10 to 14 Years | 67 (5.7%) | 22 (1.6%) |
| 15 to 19 Years | 157 (13.3%) | 122 (9.0%) |
| 20 to 24 Years | 19 (1.6%) | 37 (2.7%) |
| 25 to 29 Years | 52 (4.4%) | 119 (8.7%) |
| 30 to 34 Years | 60 (5.1%) | 20 (1.5%) |
| 35 to 39 Years | 127 (10.7%) | 89 (6.5%) |
| 40 to 44 Years | 63 (5.3%) | 70 (5.1%) |
| 45 to 49 Years | 47 (4.0%) | 59 (4.3%) |
| 50 to 54 Years | 67 (5.7%) | 77 (5.7%) |
| 55 to 59 Years | 63 (5.3%) | 83 (6.1%) |
| 60 to 64 Years | 124 (10.5%) | 150 (11.0%) |
| 65 to 69 Years | 135 (11.4%) | 146 (10.7%) |
| 70 to 74 Years | 49 (4.2%) | 25 (1.8%) |
| 75 to 79 Years | 23 (1.9%) | 100 (7.3%) |
| 80 to 84 Years | 21 (1.8%) | 65 (4.8%) |
| 85 Years and over | 50 (4.2%) | 117 (8.6%) |
| Total | 1,181 (100.0%) | 1,360 (100.0%) |
Families and Households in Lewiston
Median Family Size in Lewiston
The median family size in Lewiston is 2.92 persons per family, with married-couple families (473 | 81.0%) accounting for the largest median family size of 3.06 persons per family. On the other hand, single male/father families (34 | 5.8%) represent the smallest median family size with 2.29 persons per family.
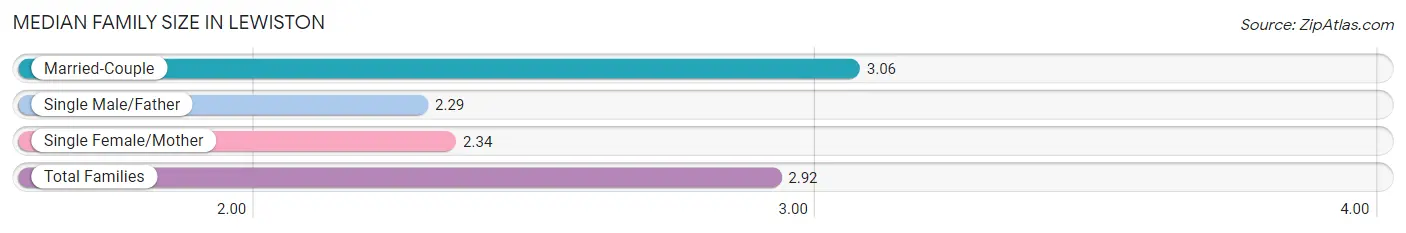
| Family Type | # Families | Family Size |
| Married-Couple | 473 (81.0%) | 3.06 |
| Single Male/Father | 34 (5.8%) | 2.29 |
| Single Female/Mother | 77 (13.2%) | 2.34 |
| Total Families | 584 (100.0%) | 2.92 |
Median Household Size in Lewiston
The median household size in Lewiston is 1.93 persons per household, with married-couple households (473 | 36.2%) accounting for the largest median household size of 3.06 persons per household. non-family households (723 | 55.3%) represent the smallest median household size with 1.13 persons per household.
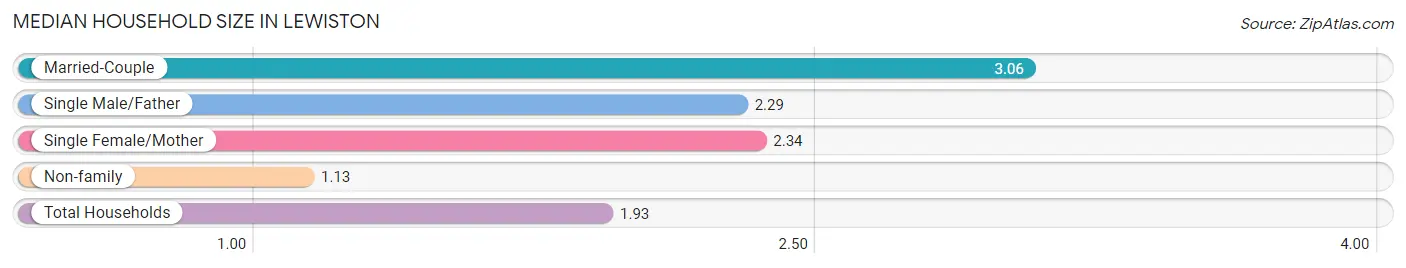
| Household Type | # Households | Household Size |
| Married-Couple | 473 (36.2%) | 3.06 |
| Single Male/Father | 34 (2.6%) | 2.29 |
| Single Female/Mother | 77 (5.9%) | 2.34 |
| Non-family | 723 (55.3%) | 1.13 |
| Total Households | 1,307 (100.0%) | 1.93 |
Household Size by Marriage Status in Lewiston
Out of a total of 1,307 households in Lewiston, 584 (44.7%) are family households, while 723 (55.3%) are nonfamily households. The most numerous type of family households are 3-person households, comprising 254, and the most common type of nonfamily households are 1-person households, comprising 615.
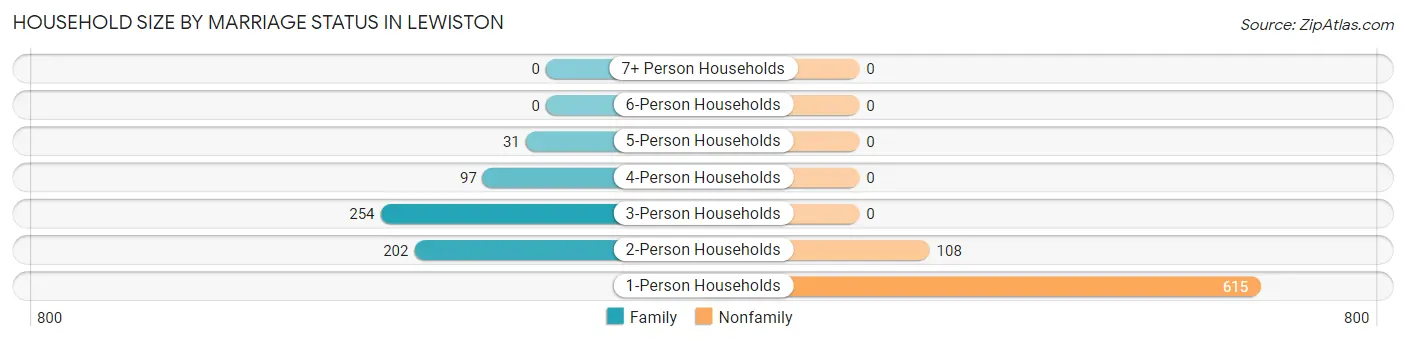
| Household Size | Family Households | Nonfamily Households |
| 1-Person Households | - | 615 (47.0%) |
| 2-Person Households | 202 (15.5%) | 108 (8.3%) |
| 3-Person Households | 254 (19.4%) | 0 (0.0%) |
| 4-Person Households | 97 (7.4%) | 0 (0.0%) |
| 5-Person Households | 31 (2.4%) | 0 (0.0%) |
| 6-Person Households | 0 (0.0%) | 0 (0.0%) |
| 7+ Person Households | 0 (0.0%) | 0 (0.0%) |
| Total | 584 (44.7%) | 723 (55.3%) |
Female Fertility in Lewiston
Fertility by Age in Lewiston
| Age Bracket | Women with Births | Births / 1,000 Women |
| 15 to 19 years | 0 (0.0%) | 0.0 |
| 20 to 34 years | 0 (0.0%) | 0.0 |
| 35 to 50 years | 0 (0.0%) | 0.0 |
| Total | 0 (0.0%) | 0.0 |
Fertility by Age by Marriage Status in Lewiston
| Age Bracket | Married | Unmarried |
| 15 to 19 years | 0 (0.0%) | 0 (0.0%) |
| 20 to 34 years | 0 (0.0%) | 0 (0.0%) |
| 35 to 50 years | 0 (0.0%) | 0 (0.0%) |
| Total | 0 (0.0%) | 0 (0.0%) |
Fertility by Education in Lewiston
| Educational Attainment | Women with Births | Births / 1,000 Women |
| Less than High School | 0 (0.0%) | 0.0 |
| High School Diploma | 0 (0.0%) | 0.0 |
| College or Associate's Degree | 0 (0.0%) | 0.0 |
| Bachelor's Degree | 0 (0.0%) | 0.0 |
| Graduate Degree | 0 (0.0%) | 0.0 |
| Total | 0 (0.0%) | 0.0 |
Fertility by Education by Marriage Status in Lewiston
| Educational Attainment | Married | Unmarried |
| Less than High School | 0 (0.0%) | 0 (0.0%) |
| High School Diploma | 0 (0.0%) | 0 (0.0%) |
| College or Associate's Degree | 0 (0.0%) | 0 (0.0%) |
| Bachelor's Degree | 0 (0.0%) | 0 (0.0%) |
| Graduate Degree | 0 (0.0%) | 0 (0.0%) |
| Total | 0 (0.0%) | 0 (0.0%) |
Employment Characteristics in Lewiston
Employment by Class of Employer in Lewiston
Among the 1,303 employed individuals in Lewiston, private company employees (824 | 63.2%), not-for-profit organizations (158 | 12.1%), and local government employees (142 | 10.9%) make up the most common classes of employment.
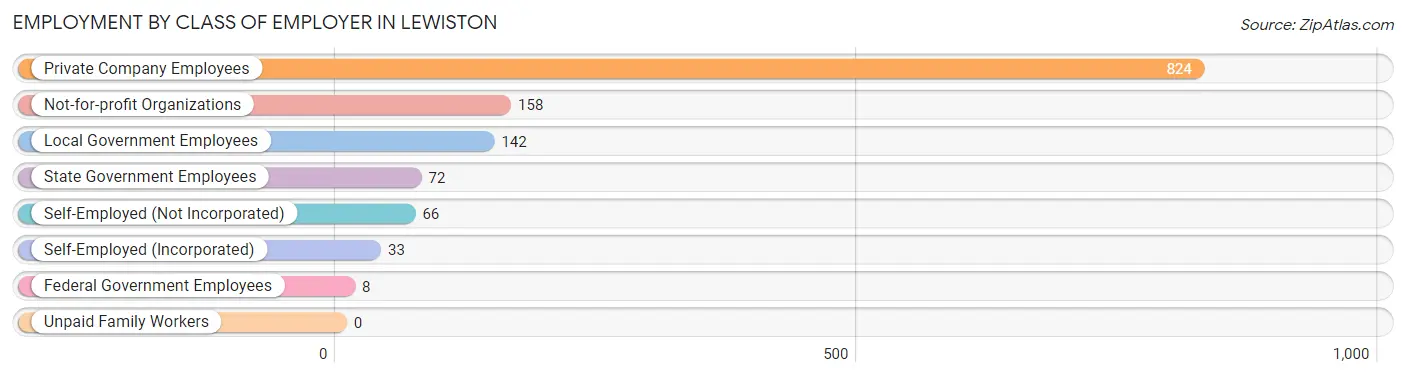
| Employer Class | # Employees | % Employees |
| Private Company Employees | 824 | 63.2% |
| Self-Employed (Incorporated) | 33 | 2.5% |
| Self-Employed (Not Incorporated) | 66 | 5.1% |
| Not-for-profit Organizations | 158 | 12.1% |
| Local Government Employees | 142 | 10.9% |
| State Government Employees | 72 | 5.5% |
| Federal Government Employees | 8 | 0.6% |
| Unpaid Family Workers | 0 | 0.0% |
| Total | 1,303 | 100.0% |
Employment Status by Age in Lewiston
According to the labor force statistics for Lewiston, out of the total population over 16 years of age (2,310), 60.1% or 1,388 individuals are in the labor force, with 4.1% or 57 of them unemployed. The age group with the highest labor force participation rate is 55 to 59 years, with 93.8% or 137 individuals in the labor force. Within the labor force, the 16 to 19 years age range has the highest percentage of unemployed individuals, with 16.4% or 37 of them being unemployed.
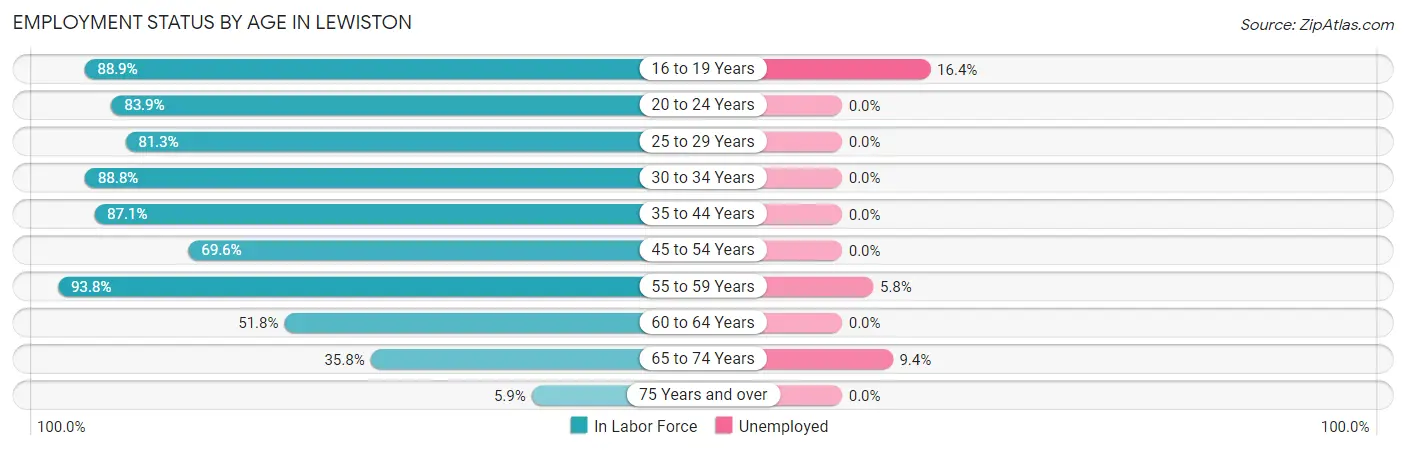
| Age Bracket | In Labor Force | Unemployed |
| 16 to 19 Years | 225 (88.9%) | 37 (16.4%) |
| 20 to 24 Years | 47 (83.9%) | 0 (0.0%) |
| 25 to 29 Years | 139 (81.3%) | 0 (0.0%) |
| 30 to 34 Years | 71 (88.8%) | 0 (0.0%) |
| 35 to 44 Years | 304 (87.1%) | 0 (0.0%) |
| 45 to 54 Years | 174 (69.6%) | 0 (0.0%) |
| 55 to 59 Years | 137 (93.8%) | 8 (5.8%) |
| 60 to 64 Years | 142 (51.8%) | 0 (0.0%) |
| 65 to 74 Years | 127 (35.8%) | 12 (9.4%) |
| 75 Years and over | 22 (5.9%) | 0 (0.0%) |
| Total | 1,388 (60.1%) | 57 (4.1%) |
Employment Status by Educational Attainment in Lewiston
According to labor force statistics for Lewiston, 76.1% of individuals (966) out of the total population between 25 and 64 years of age (1,270) are in the labor force, with 0.8% or 8 of them being unemployed. The group with the highest labor force participation rate are those with the educational attainment of high school diploma, with 89.9% or 80 individuals in the labor force. Within the labor force, individuals with college / associate degree education have the highest percentage of unemployment, with 2.5% or 8 of them being unemployed.
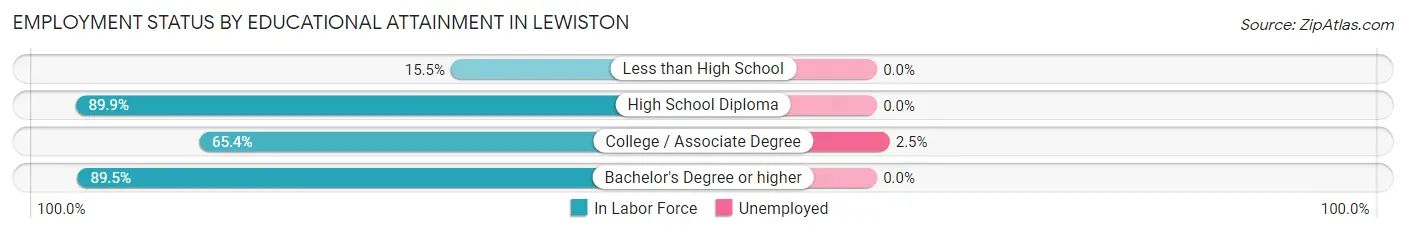
| Educational Attainment | In Labor Force | Unemployed |
| Less than High School | 11 (15.5%) | 0 (0.0%) |
| High School Diploma | 80 (89.9%) | 0 (0.0%) |
| College / Associate Degree | 320 (65.4%) | 12 (2.5%) |
| Bachelor's Degree or higher | 556 (89.5%) | 0 (0.0%) |
| Total | 966 (76.1%) | 10 (0.8%) |
Employment Occupations by Sex in Lewiston
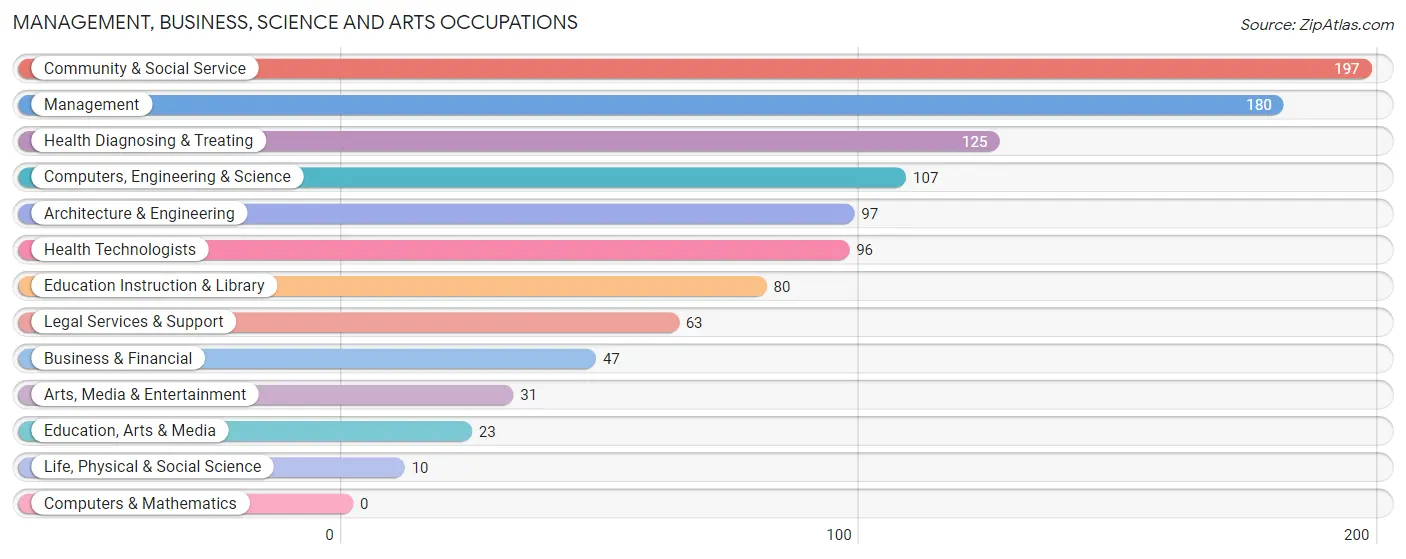
Management, Business, Science and Arts Occupations
The most common Management, Business, Science and Arts occupations in Lewiston are Community & Social Service (197 | 14.8%), Management (180 | 13.5%), Health Diagnosing & Treating (125 | 9.4%), Computers, Engineering & Science (107 | 8.0%), and Architecture & Engineering (97 | 7.3%).
Management, Business, Science and Arts Occupations by Sex
Within the Management, Business, Science and Arts occupations in Lewiston, the most male-oriented occupations are Life, Physical & Social Science (100.0%), Arts, Media & Entertainment (67.7%), and Management (67.2%), while the most female-oriented occupations are Education, Arts & Media (100.0%), Education Instruction & Library (87.5%), and Health Diagnosing & Treating (86.4%).
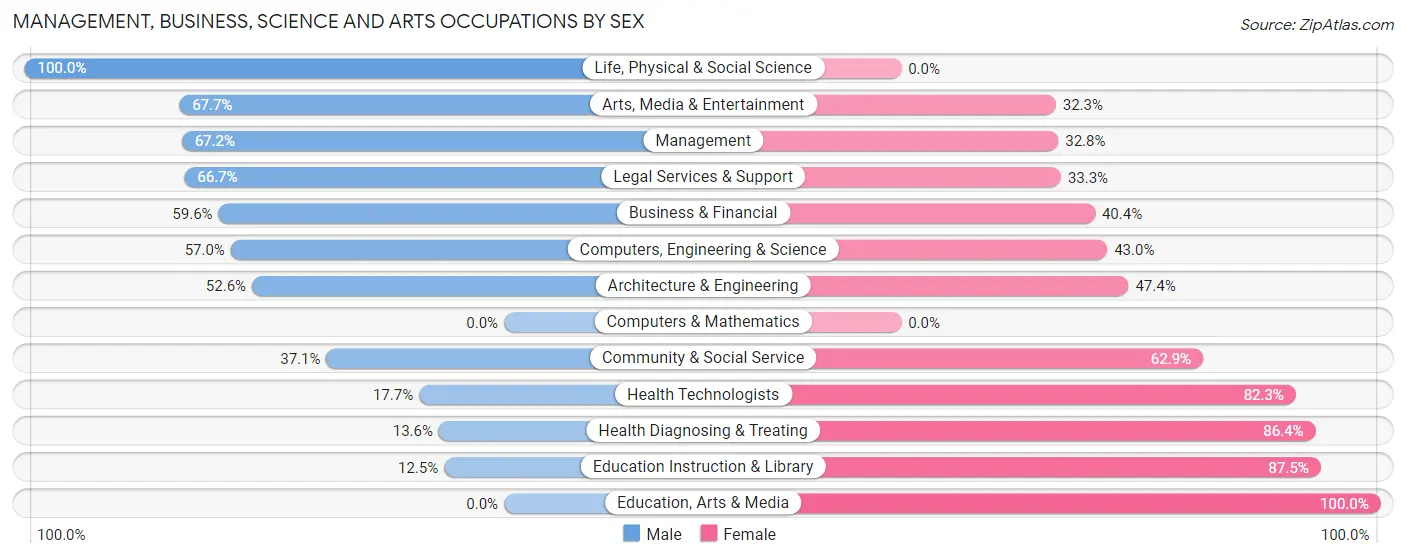
| Occupation | Male | Female |
| Management | 121 (67.2%) | 59 (32.8%) |
| Business & Financial | 28 (59.6%) | 19 (40.4%) |
| Computers, Engineering & Science | 61 (57.0%) | 46 (43.0%) |
| Computers & Mathematics | 0 (0.0%) | 0 (0.0%) |
| Architecture & Engineering | 51 (52.6%) | 46 (47.4%) |
| Life, Physical & Social Science | 10 (100.0%) | 0 (0.0%) |
| Community & Social Service | 73 (37.1%) | 124 (62.9%) |
| Education, Arts & Media | 0 (0.0%) | 23 (100.0%) |
| Legal Services & Support | 42 (66.7%) | 21 (33.3%) |
| Education Instruction & Library | 10 (12.5%) | 70 (87.5%) |
| Arts, Media & Entertainment | 21 (67.7%) | 10 (32.3%) |
| Health Diagnosing & Treating | 17 (13.6%) | 108 (86.4%) |
| Health Technologists | 17 (17.7%) | 79 (82.3%) |
| Total (Category) | 300 (45.7%) | 356 (54.3%) |
| Total (Overall) | 703 (52.8%) | 628 (47.2%) |
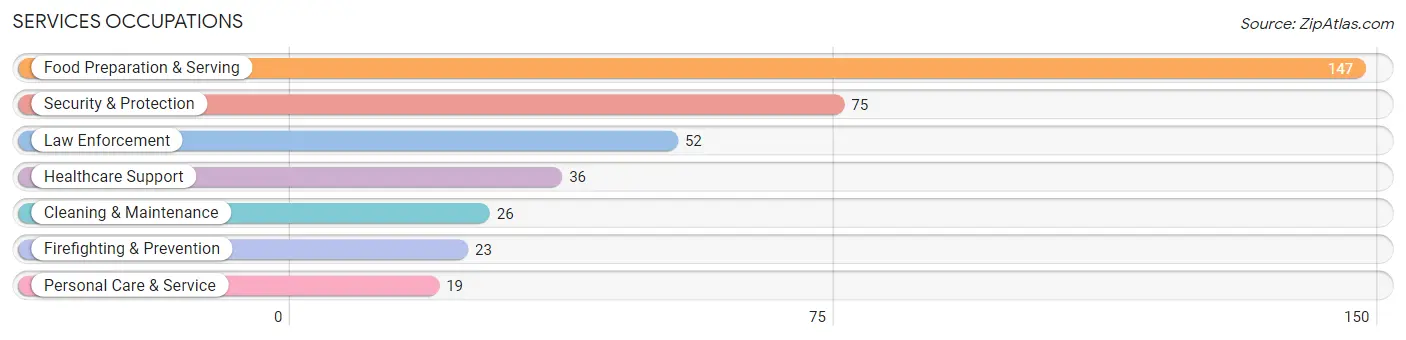
Services Occupations
The most common Services occupations in Lewiston are Food Preparation & Serving (147 | 11.0%), Security & Protection (75 | 5.6%), Law Enforcement (52 | 3.9%), Healthcare Support (36 | 2.7%), and Cleaning & Maintenance (26 | 1.9%).
Services Occupations by Sex
Within the Services occupations in Lewiston, the most male-oriented occupations are Firefighting & Prevention (100.0%), Food Preparation & Serving (85.7%), and Cleaning & Maintenance (65.4%), while the most female-oriented occupations are Healthcare Support (100.0%), Personal Care & Service (100.0%), and Law Enforcement (59.6%).
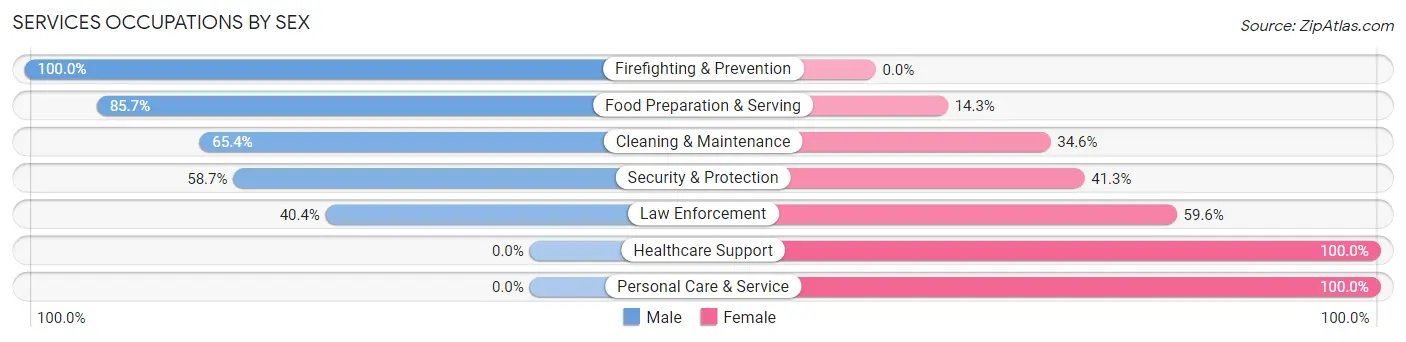
| Occupation | Male | Female |
| Healthcare Support | 0 (0.0%) | 36 (100.0%) |
| Security & Protection | 44 (58.7%) | 31 (41.3%) |
| Firefighting & Prevention | 23 (100.0%) | 0 (0.0%) |
| Law Enforcement | 21 (40.4%) | 31 (59.6%) |
| Food Preparation & Serving | 126 (85.7%) | 21 (14.3%) |
| Cleaning & Maintenance | 17 (65.4%) | 9 (34.6%) |
| Personal Care & Service | 0 (0.0%) | 19 (100.0%) |
| Total (Category) | 187 (61.7%) | 116 (38.3%) |
| Total (Overall) | 703 (52.8%) | 628 (47.2%) |
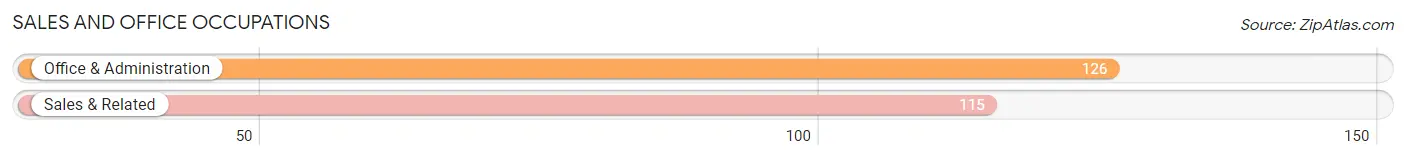
Sales and Office Occupations
The most common Sales and Office occupations in Lewiston are Office & Administration (126 | 9.5%), and Sales & Related (115 | 8.6%).
Sales and Office Occupations by Sex
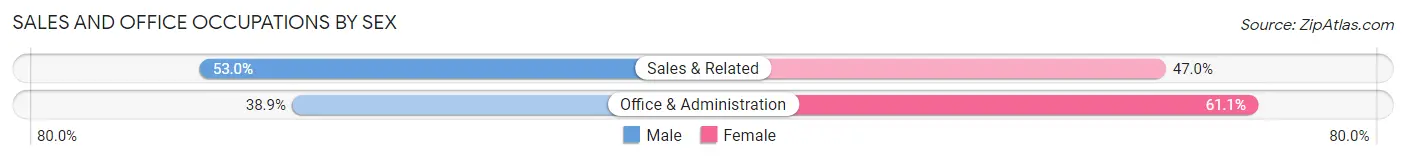
| Occupation | Male | Female |
| Sales & Related | 61 (53.0%) | 54 (47.0%) |
| Office & Administration | 49 (38.9%) | 77 (61.1%) |
| Total (Category) | 110 (45.6%) | 131 (54.4%) |
| Total (Overall) | 703 (52.8%) | 628 (47.2%) |
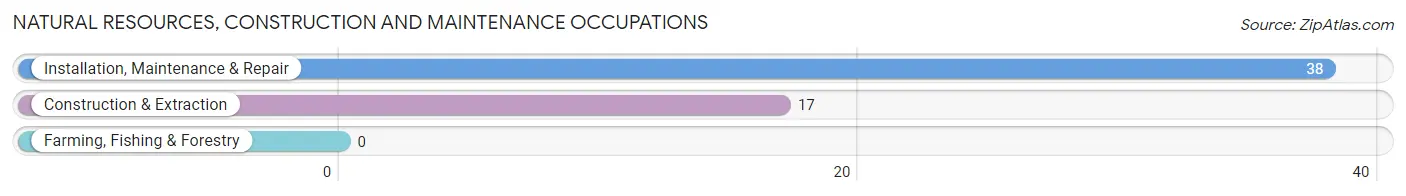
Natural Resources, Construction and Maintenance Occupations
The most common Natural Resources, Construction and Maintenance occupations in Lewiston are Installation, Maintenance & Repair (38 | 2.9%), and Construction & Extraction (17 | 1.3%).
Natural Resources, Construction and Maintenance Occupations by Sex
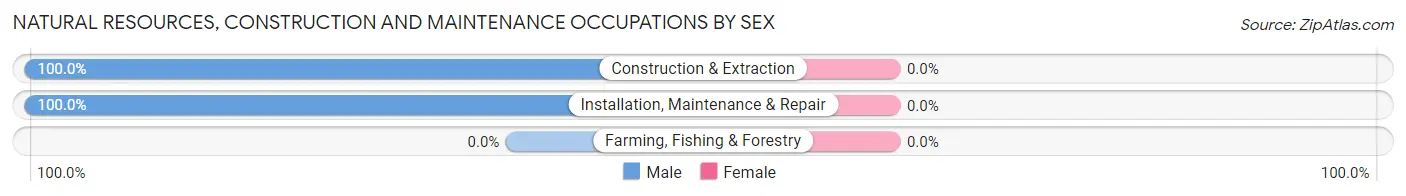
| Occupation | Male | Female |
| Farming, Fishing & Forestry | 0 (0.0%) | 0 (0.0%) |
| Construction & Extraction | 17 (100.0%) | 0 (0.0%) |
| Installation, Maintenance & Repair | 38 (100.0%) | 0 (0.0%) |
| Total (Category) | 55 (100.0%) | 0 (0.0%) |
| Total (Overall) | 703 (52.8%) | 628 (47.2%) |
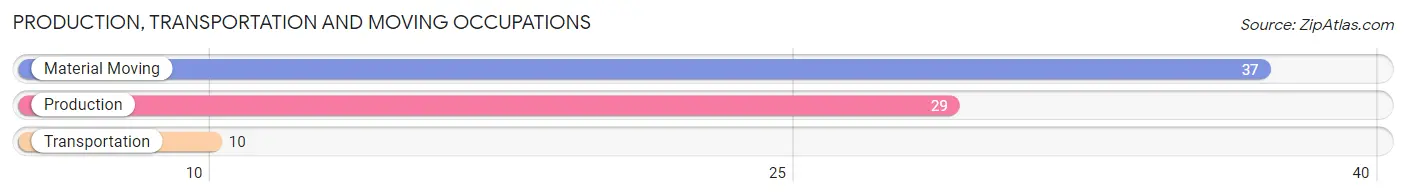
Production, Transportation and Moving Occupations
The most common Production, Transportation and Moving occupations in Lewiston are Material Moving (37 | 2.8%), Production (29 | 2.2%), and Transportation (10 | 0.7%).
Production, Transportation and Moving Occupations by Sex
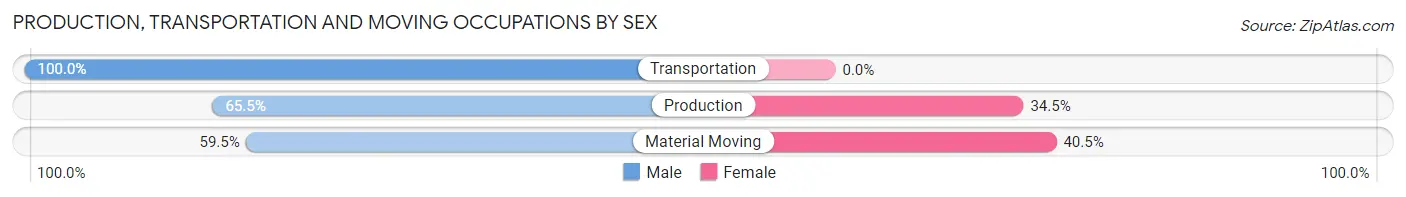
| Occupation | Male | Female |
| Production | 19 (65.5%) | 10 (34.5%) |
| Transportation | 10 (100.0%) | 0 (0.0%) |
| Material Moving | 22 (59.5%) | 15 (40.5%) |
| Total (Category) | 51 (67.1%) | 25 (32.9%) |
| Total (Overall) | 703 (52.8%) | 628 (47.2%) |
Employment Industries by Sex in Lewiston
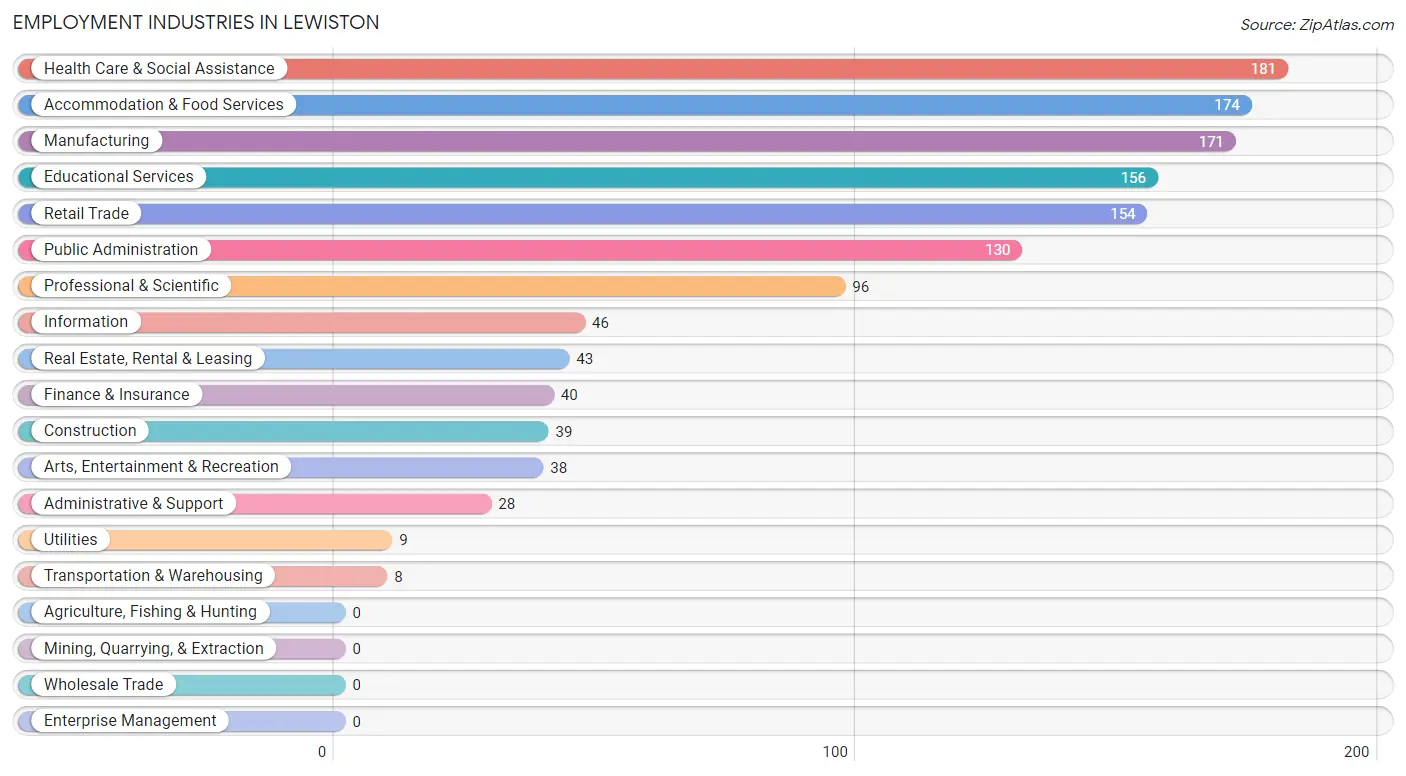
Employment Industries in Lewiston
The major employment industries in Lewiston include Health Care & Social Assistance (181 | 13.6%), Accommodation & Food Services (174 | 13.1%), Manufacturing (171 | 12.9%), Educational Services (156 | 11.7%), and Retail Trade (154 | 11.6%).
Employment Industries by Sex in Lewiston
The Lewiston industries that see more men than women are Construction (100.0%), Transportation & Warehousing (100.0%), and Utilities (100.0%), whereas the industries that tend to have a higher number of women are Health Care & Social Assistance (82.3%), Information (80.4%), and Educational Services (76.3%).
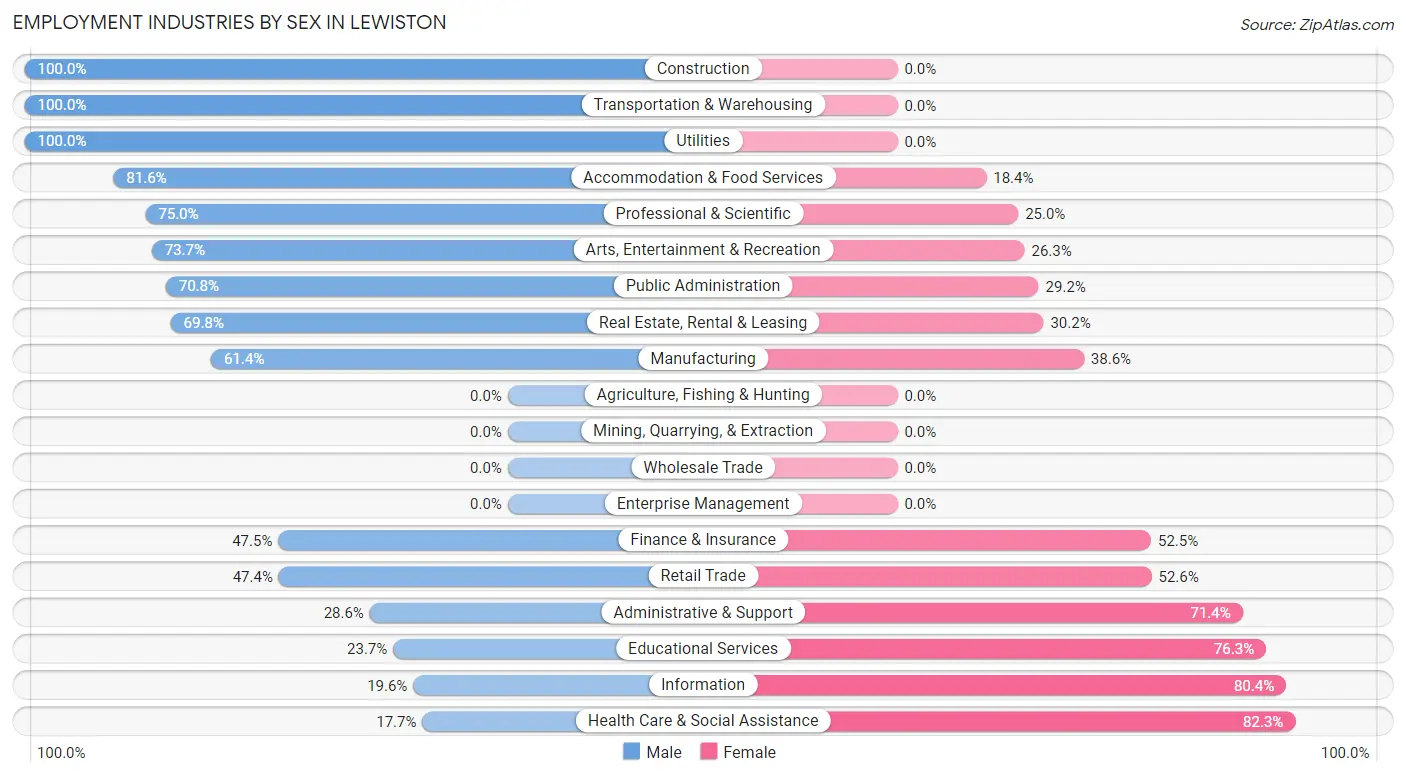
| Industry | Male | Female |
| Agriculture, Fishing & Hunting | 0 (0.0%) | 0 (0.0%) |
| Mining, Quarrying, & Extraction | 0 (0.0%) | 0 (0.0%) |
| Construction | 39 (100.0%) | 0 (0.0%) |
| Manufacturing | 105 (61.4%) | 66 (38.6%) |
| Wholesale Trade | 0 (0.0%) | 0 (0.0%) |
| Retail Trade | 73 (47.4%) | 81 (52.6%) |
| Transportation & Warehousing | 8 (100.0%) | 0 (0.0%) |
| Utilities | 9 (100.0%) | 0 (0.0%) |
| Information | 9 (19.6%) | 37 (80.4%) |
| Finance & Insurance | 19 (47.5%) | 21 (52.5%) |
| Real Estate, Rental & Leasing | 30 (69.8%) | 13 (30.2%) |
| Professional & Scientific | 72 (75.0%) | 24 (25.0%) |
| Enterprise Management | 0 (0.0%) | 0 (0.0%) |
| Administrative & Support | 8 (28.6%) | 20 (71.4%) |
| Educational Services | 37 (23.7%) | 119 (76.3%) |
| Health Care & Social Assistance | 32 (17.7%) | 149 (82.3%) |
| Arts, Entertainment & Recreation | 28 (73.7%) | 10 (26.3%) |
| Accommodation & Food Services | 142 (81.6%) | 32 (18.4%) |
| Public Administration | 92 (70.8%) | 38 (29.2%) |
| Total | 703 (52.8%) | 628 (47.2%) |
Education in Lewiston
School Enrollment in Lewiston
The most common levels of schooling among the 522 students in Lewiston are college / undergraduate (214 | 41.0%), high school (146 | 28.0%), and middle school (70 | 13.4%).
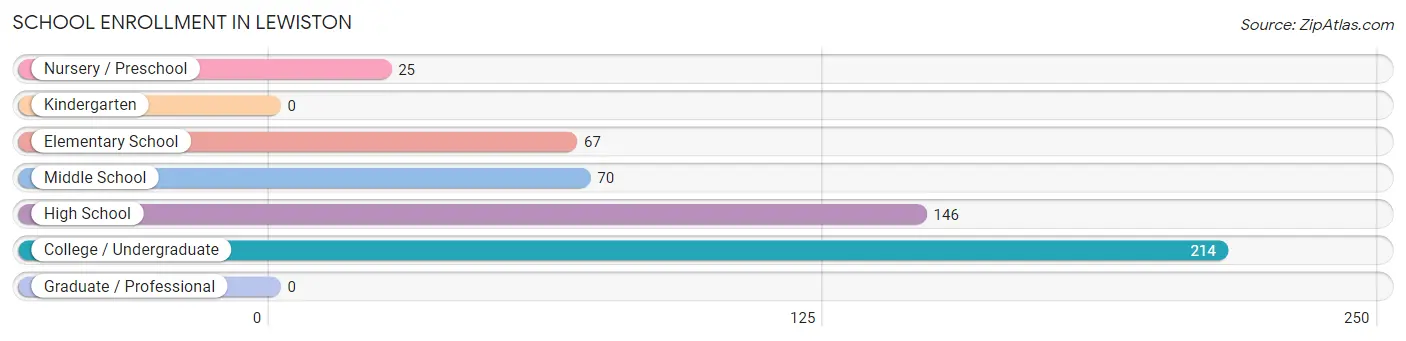
| School Level | # Students | % Students |
| Nursery / Preschool | 25 | 4.8% |
| Kindergarten | 0 | 0.0% |
| Elementary School | 67 | 12.8% |
| Middle School | 70 | 13.4% |
| High School | 146 | 28.0% |
| College / Undergraduate | 214 | 41.0% |
| Graduate / Professional | 0 | 0.0% |
| Total | 522 | 100.0% |
School Enrollment by Age by Funding Source in Lewiston
Out of a total of 522 students who are enrolled in schools in Lewiston, 159 (30.5%) attend a private institution, while the remaining 363 (69.5%) are enrolled in public schools. The age group of 3 to 4 year olds has the highest likelihood of being enrolled in private schools, with 25 (100.0% in the age bracket) enrolled. Conversely, the age group of 10 to 14 year olds has the lowest likelihood of being enrolled in a private school, with 89 (100.0% in the age bracket) attending a public institution.
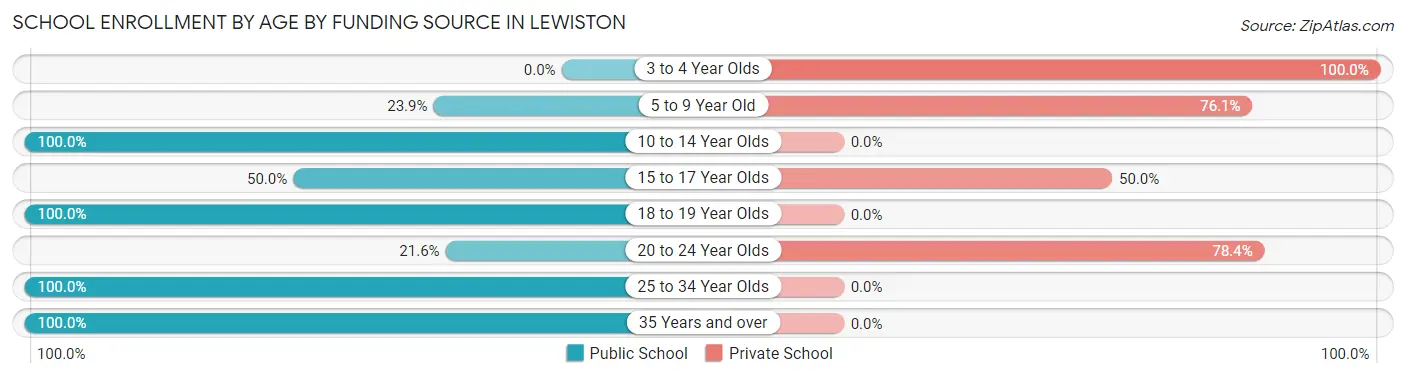
| Age Bracket | Public School | Private School |
| 3 to 4 Year Olds | 0 (0.0%) | 25 (100.0%) |
| 5 to 9 Year Old | 16 (23.9%) | 51 (76.1%) |
| 10 to 14 Year Olds | 89 (100.0%) | 0 (0.0%) |
| 15 to 17 Year Olds | 54 (50.0%) | 54 (50.0%) |
| 18 to 19 Year Olds | 134 (100.0%) | 0 (0.0%) |
| 20 to 24 Year Olds | 8 (21.6%) | 29 (78.4%) |
| 25 to 34 Year Olds | 54 (100.0%) | 0 (0.0%) |
| 35 Years and over | 8 (100.0%) | 0 (0.0%) |
| Total | 363 (69.5%) | 159 (30.5%) |
Educational Attainment by Field of Study in Lewiston
Business (218 | 24.0%), social sciences (106 | 11.7%), education (91 | 10.0%), communications (87 | 9.6%), and visual & performing arts (57 | 6.3%) are the most common fields of study among 910 individuals in Lewiston who have obtained a bachelor's degree or higher.
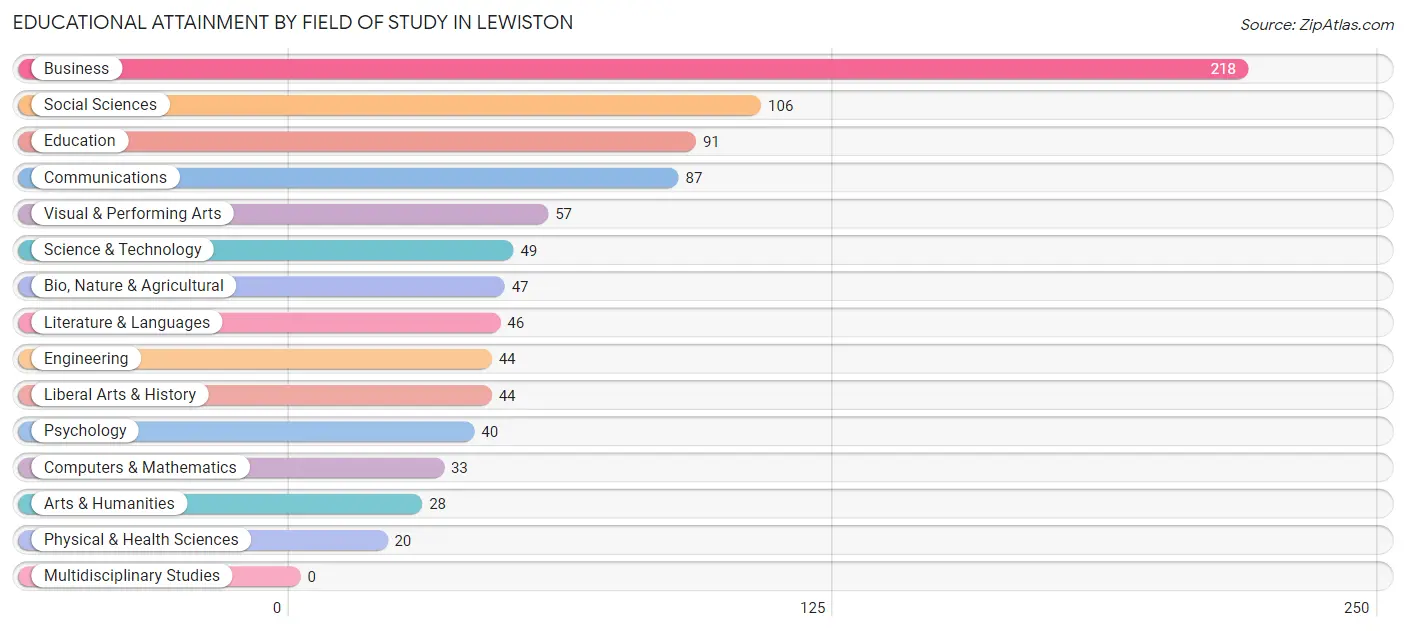
| Field of Study | # Graduates | % Graduates |
| Computers & Mathematics | 33 | 3.6% |
| Bio, Nature & Agricultural | 47 | 5.2% |
| Physical & Health Sciences | 20 | 2.2% |
| Psychology | 40 | 4.4% |
| Social Sciences | 106 | 11.7% |
| Engineering | 44 | 4.8% |
| Multidisciplinary Studies | 0 | 0.0% |
| Science & Technology | 49 | 5.4% |
| Business | 218 | 24.0% |
| Education | 91 | 10.0% |
| Literature & Languages | 46 | 5.1% |
| Liberal Arts & History | 44 | 4.8% |
| Visual & Performing Arts | 57 | 6.3% |
| Communications | 87 | 9.6% |
| Arts & Humanities | 28 | 3.1% |
| Total | 910 | 100.0% |
Transportation & Commute in Lewiston
Vehicle Availability by Sex in Lewiston
The most prevalent vehicle ownership categories in Lewiston are males with 2 vehicles (256, accounting for 37.3%) and females with 2 vehicles (215, making up 41.5%).
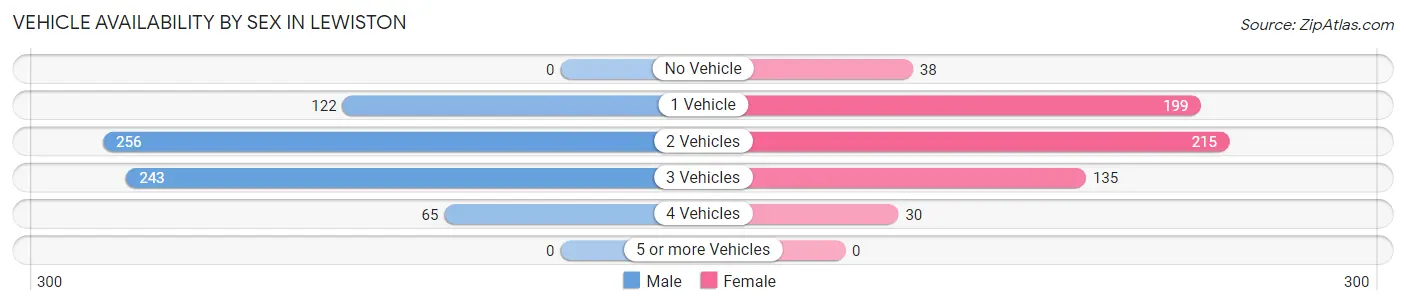
| Vehicles Available | Male | Female |
| No Vehicle | 0 (0.0%) | 38 (6.2%) |
| 1 Vehicle | 122 (17.8%) | 199 (32.3%) |
| 2 Vehicles | 256 (37.3%) | 215 (34.8%) |
| 3 Vehicles | 243 (35.4%) | 135 (21.9%) |
| 4 Vehicles | 65 (9.5%) | 30 (4.9%) |
| 5 or more Vehicles | 0 (0.0%) | 0 (0.0%) |
| Total | 686 (100.0%) | 617 (100.0%) |
Commute Time in Lewiston
The most frequently occuring commute durations in Lewiston are 30 to 34 minutes (170 commuters, 14.2%), 20 to 24 minutes (165 commuters, 13.8%), and 10 to 14 minutes (163 commuters, 13.6%).
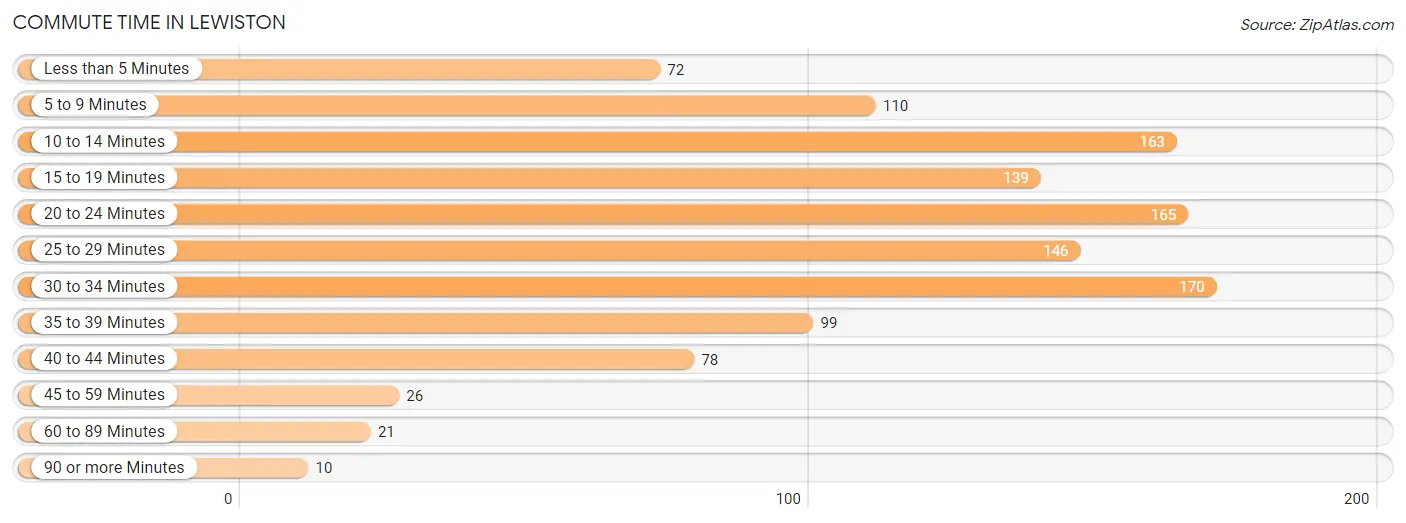
| Commute Time | # Commuters | % Commuters |
| Less than 5 Minutes | 72 | 6.0% |
| 5 to 9 Minutes | 110 | 9.2% |
| 10 to 14 Minutes | 163 | 13.6% |
| 15 to 19 Minutes | 139 | 11.6% |
| 20 to 24 Minutes | 165 | 13.8% |
| 25 to 29 Minutes | 146 | 12.2% |
| 30 to 34 Minutes | 170 | 14.2% |
| 35 to 39 Minutes | 99 | 8.3% |
| 40 to 44 Minutes | 78 | 6.5% |
| 45 to 59 Minutes | 26 | 2.2% |
| 60 to 89 Minutes | 21 | 1.8% |
| 90 or more Minutes | 10 | 0.8% |
Commute Time by Sex in Lewiston
The most common commute times in Lewiston are 30 to 34 minutes (149 commuters, 22.6%) for males and 10 to 14 minutes (70 commuters, 12.9%) for females.
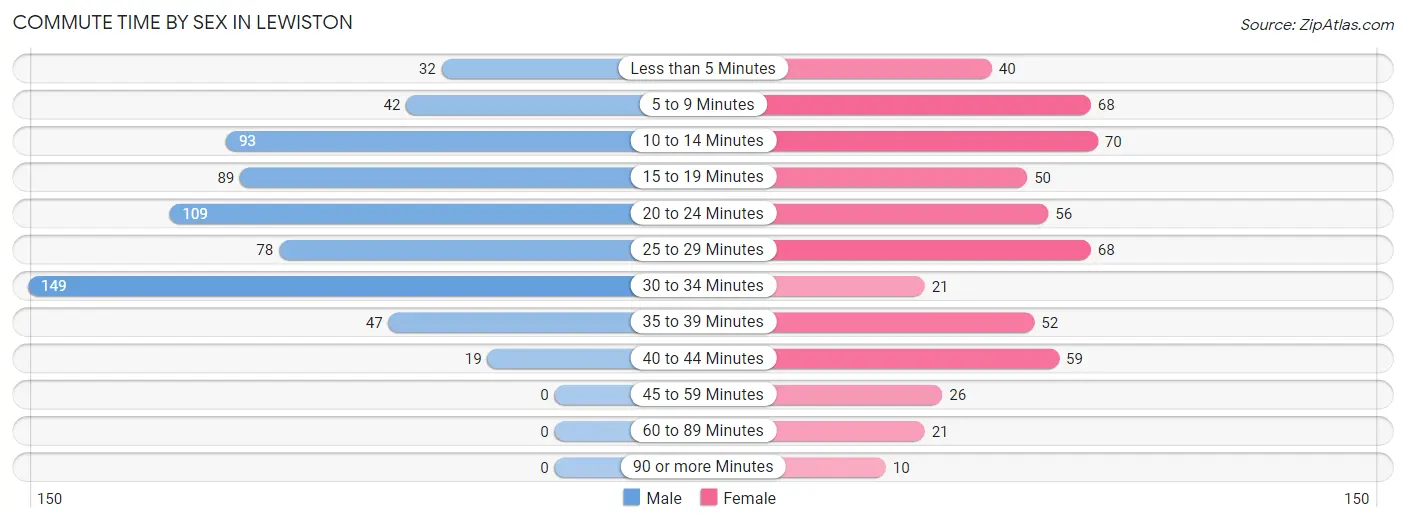
| Commute Time | Male | Female |
| Less than 5 Minutes | 32 (4.9%) | 40 (7.4%) |
| 5 to 9 Minutes | 42 (6.4%) | 68 (12.6%) |
| 10 to 14 Minutes | 93 (14.1%) | 70 (12.9%) |
| 15 to 19 Minutes | 89 (13.5%) | 50 (9.2%) |
| 20 to 24 Minutes | 109 (16.6%) | 56 (10.3%) |
| 25 to 29 Minutes | 78 (11.8%) | 68 (12.6%) |
| 30 to 34 Minutes | 149 (22.6%) | 21 (3.9%) |
| 35 to 39 Minutes | 47 (7.1%) | 52 (9.6%) |
| 40 to 44 Minutes | 19 (2.9%) | 59 (10.9%) |
| 45 to 59 Minutes | 0 (0.0%) | 26 (4.8%) |
| 60 to 89 Minutes | 0 (0.0%) | 21 (3.9%) |
| 90 or more Minutes | 0 (0.0%) | 10 (1.8%) |
Time of Departure to Work by Sex in Lewiston
The most frequent times of departure to work in Lewiston are 4:00 PM to 11:59 PM (208, 31.6%) for males and 7:30 AM to 7:59 AM (116, 21.4%) for females.
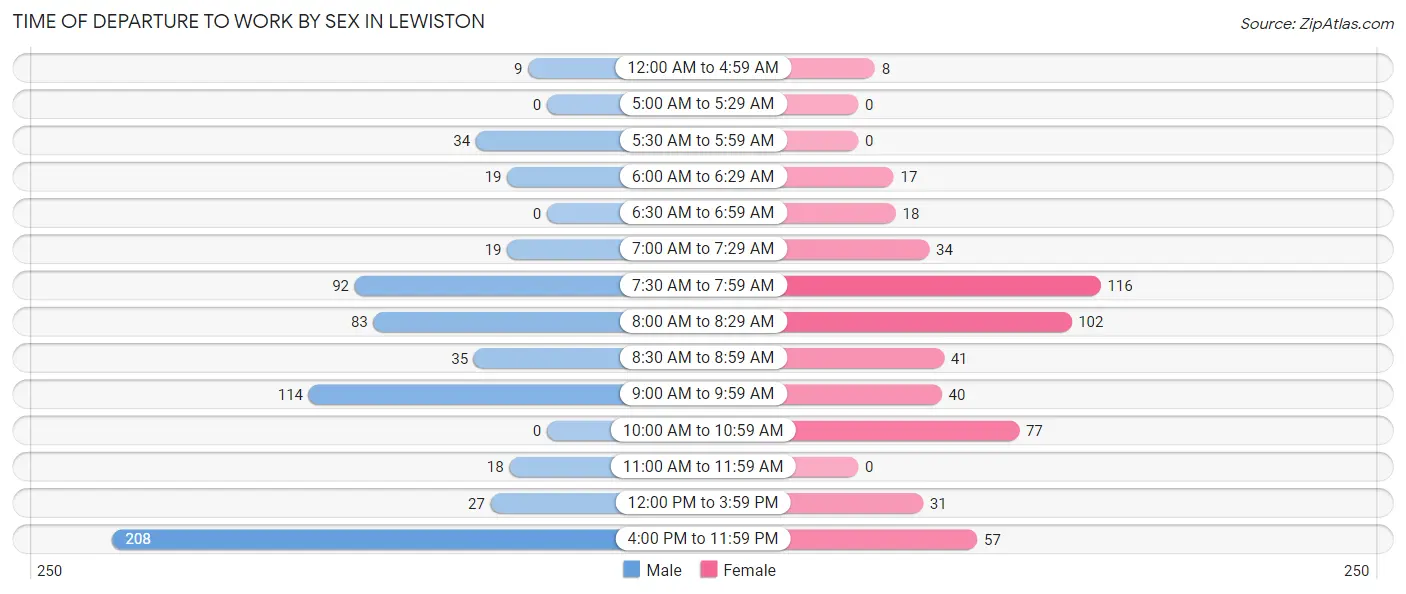
| Time of Departure | Male | Female |
| 12:00 AM to 4:59 AM | 9 (1.4%) | 8 (1.5%) |
| 5:00 AM to 5:29 AM | 0 (0.0%) | 0 (0.0%) |
| 5:30 AM to 5:59 AM | 34 (5.2%) | 0 (0.0%) |
| 6:00 AM to 6:29 AM | 19 (2.9%) | 17 (3.1%) |
| 6:30 AM to 6:59 AM | 0 (0.0%) | 18 (3.3%) |
| 7:00 AM to 7:29 AM | 19 (2.9%) | 34 (6.3%) |
| 7:30 AM to 7:59 AM | 92 (14.0%) | 116 (21.4%) |
| 8:00 AM to 8:29 AM | 83 (12.6%) | 102 (18.9%) |
| 8:30 AM to 8:59 AM | 35 (5.3%) | 41 (7.6%) |
| 9:00 AM to 9:59 AM | 114 (17.3%) | 40 (7.4%) |
| 10:00 AM to 10:59 AM | 0 (0.0%) | 77 (14.2%) |
| 11:00 AM to 11:59 AM | 18 (2.7%) | 0 (0.0%) |
| 12:00 PM to 3:59 PM | 27 (4.1%) | 31 (5.7%) |
| 4:00 PM to 11:59 PM | 208 (31.6%) | 57 (10.5%) |
| Total | 658 (100.0%) | 541 (100.0%) |
Housing Occupancy in Lewiston
Occupancy by Ownership in Lewiston
Of the total 1,307 dwellings in Lewiston, owner-occupied units account for 755 (57.8%), while renter-occupied units make up 552 (42.2%).
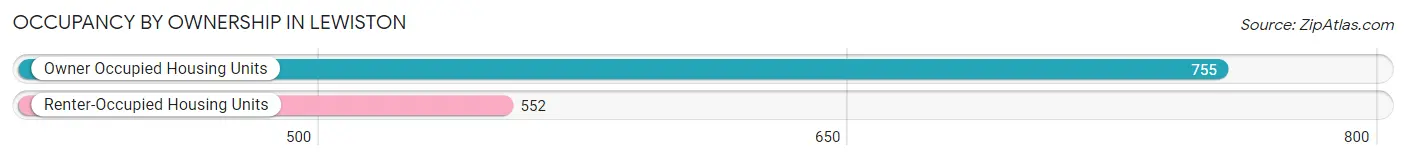
| Occupancy | # Housing Units | % Housing Units |
| Owner Occupied Housing Units | 755 | 57.8% |
| Renter-Occupied Housing Units | 552 | 42.2% |
| Total Occupied Housing Units | 1,307 | 100.0% |
Occupancy by Household Size in Lewiston
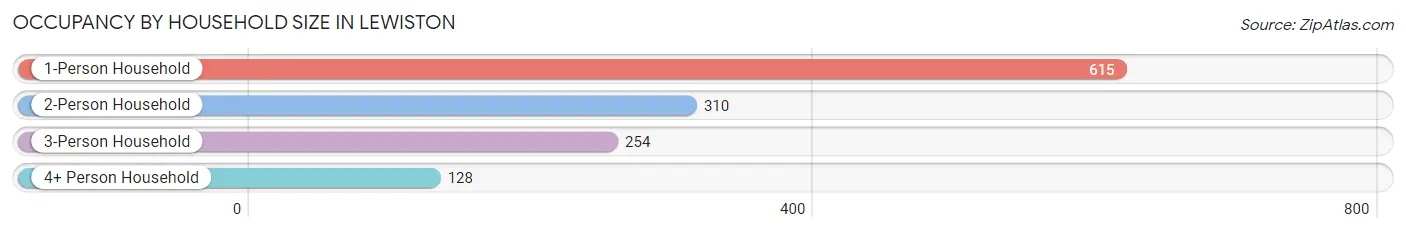
| Household Size | # Housing Units | % Housing Units |
| 1-Person Household | 615 | 47.0% |
| 2-Person Household | 310 | 23.7% |
| 3-Person Household | 254 | 19.4% |
| 4+ Person Household | 128 | 9.8% |
| Total Housing Units | 1,307 | 100.0% |
Occupancy by Ownership by Household Size in Lewiston
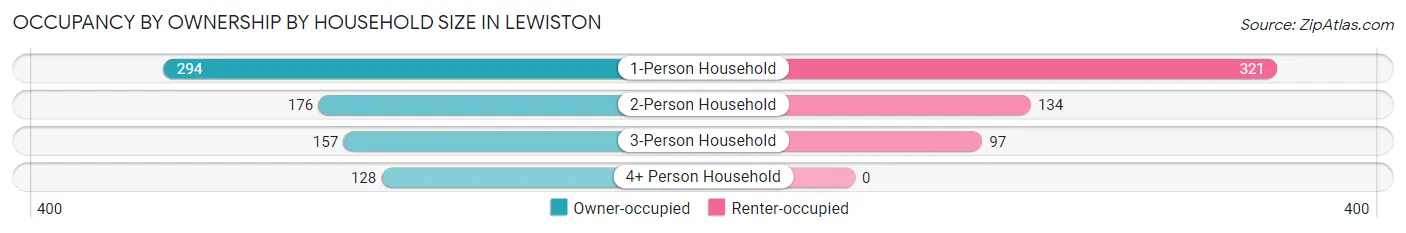
| Household Size | Owner-occupied | Renter-occupied |
| 1-Person Household | 294 (47.8%) | 321 (52.2%) |
| 2-Person Household | 176 (56.8%) | 134 (43.2%) |
| 3-Person Household | 157 (61.8%) | 97 (38.2%) |
| 4+ Person Household | 128 (100.0%) | 0 (0.0%) |
| Total Housing Units | 755 (57.8%) | 552 (42.2%) |
Occupancy by Educational Attainment in Lewiston
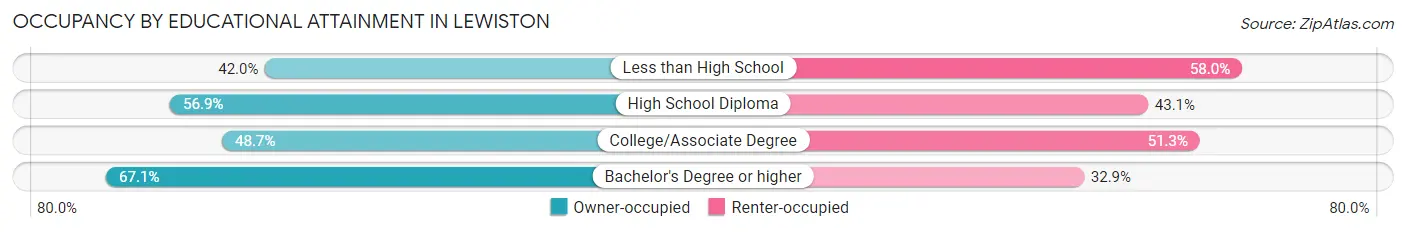
| Household Size | Owner-occupied | Renter-occupied |
| Less than High School | 34 (42.0%) | 47 (58.0%) |
| High School Diploma | 103 (56.9%) | 78 (43.1%) |
| College/Associate Degree | 219 (48.7%) | 231 (51.3%) |
| Bachelor's Degree or higher | 399 (67.1%) | 196 (32.9%) |
Occupancy by Age of Householder in Lewiston
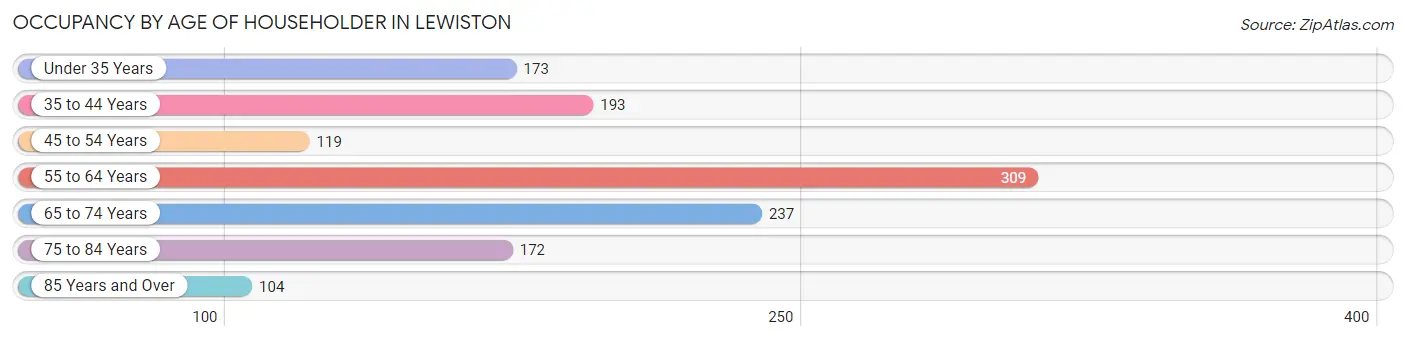
| Age Bracket | # Households | % Households |
| Under 35 Years | 173 | 13.2% |
| 35 to 44 Years | 193 | 14.8% |
| 45 to 54 Years | 119 | 9.1% |
| 55 to 64 Years | 309 | 23.6% |
| 65 to 74 Years | 237 | 18.1% |
| 75 to 84 Years | 172 | 13.2% |
| 85 Years and Over | 104 | 8.0% |
| Total | 1,307 | 100.0% |
Housing Finances in Lewiston
Median Income by Occupancy in Lewiston
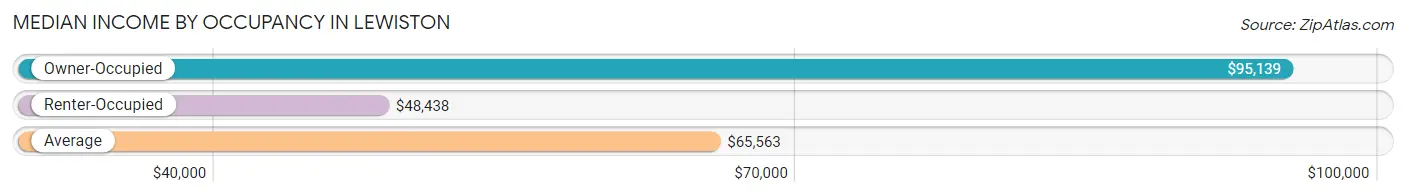
| Occupancy Type | # Households | Median Income |
| Owner-Occupied | 755 (57.8%) | $95,139 |
| Renter-Occupied | 552 (42.2%) | $48,438 |
| Average | 1,307 (100.0%) | $65,563 |
Occupancy by Householder Income Bracket in Lewiston
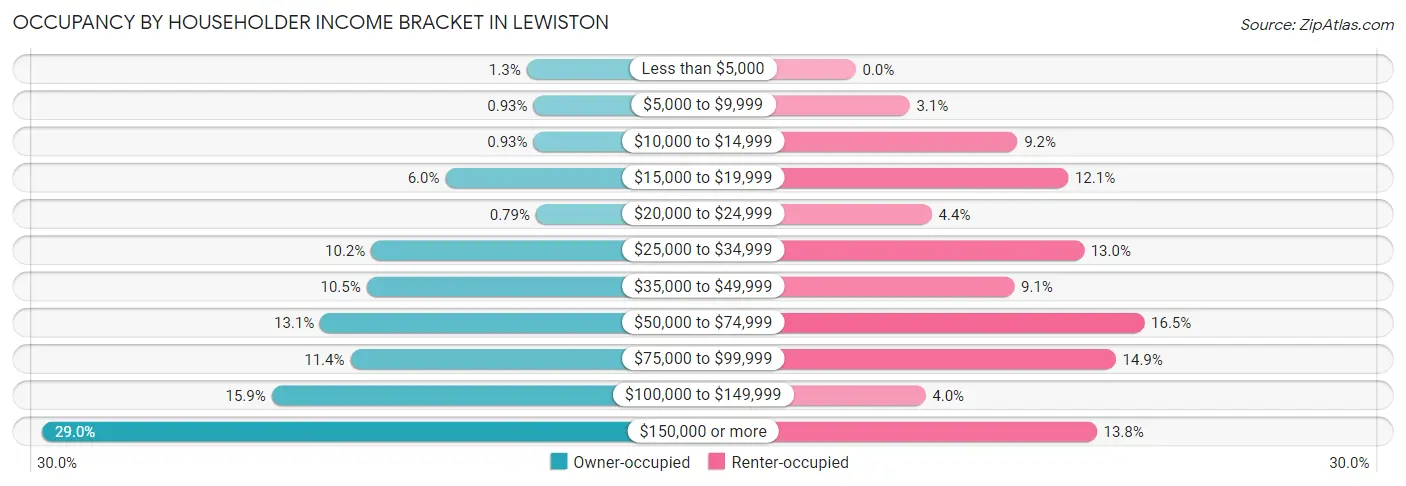
| Income Bracket | Owner-occupied | Renter-occupied |
| Less than $5,000 | 10 (1.3%) | 0 (0.0%) |
| $5,000 to $9,999 | 7 (0.9%) | 17 (3.1%) |
| $10,000 to $14,999 | 7 (0.9%) | 51 (9.2%) |
| $15,000 to $19,999 | 45 (6.0%) | 67 (12.1%) |
| $20,000 to $24,999 | 6 (0.8%) | 24 (4.3%) |
| $25,000 to $34,999 | 77 (10.2%) | 72 (13.0%) |
| $35,000 to $49,999 | 79 (10.5%) | 50 (9.1%) |
| $50,000 to $74,999 | 99 (13.1%) | 91 (16.5%) |
| $75,000 to $99,999 | 86 (11.4%) | 82 (14.9%) |
| $100,000 to $149,999 | 120 (15.9%) | 22 (4.0%) |
| $150,000 or more | 219 (29.0%) | 76 (13.8%) |
| Total | 755 (100.0%) | 552 (100.0%) |
Monthly Housing Cost Tiers in Lewiston
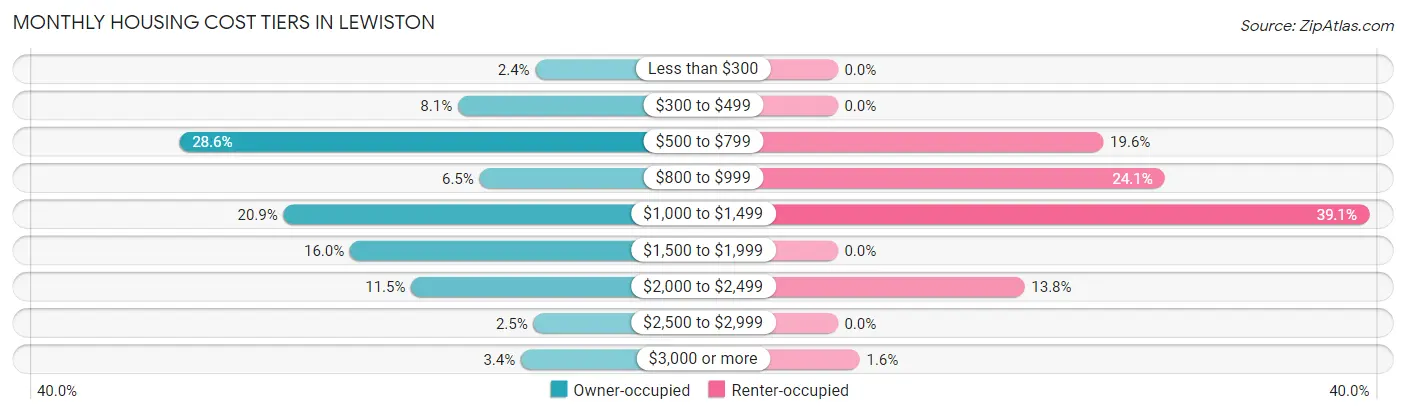
| Monthly Cost | Owner-occupied | Renter-occupied |
| Less than $300 | 18 (2.4%) | 0 (0.0%) |
| $300 to $499 | 61 (8.1%) | 0 (0.0%) |
| $500 to $799 | 216 (28.6%) | 108 (19.6%) |
| $800 to $999 | 49 (6.5%) | 133 (24.1%) |
| $1,000 to $1,499 | 158 (20.9%) | 216 (39.1%) |
| $1,500 to $1,999 | 121 (16.0%) | 0 (0.0%) |
| $2,000 to $2,499 | 87 (11.5%) | 76 (13.8%) |
| $2,500 to $2,999 | 19 (2.5%) | 0 (0.0%) |
| $3,000 or more | 26 (3.4%) | 9 (1.6%) |
| Total | 755 (100.0%) | 552 (100.0%) |
Physical Housing Characteristics in Lewiston
Housing Structures in Lewiston
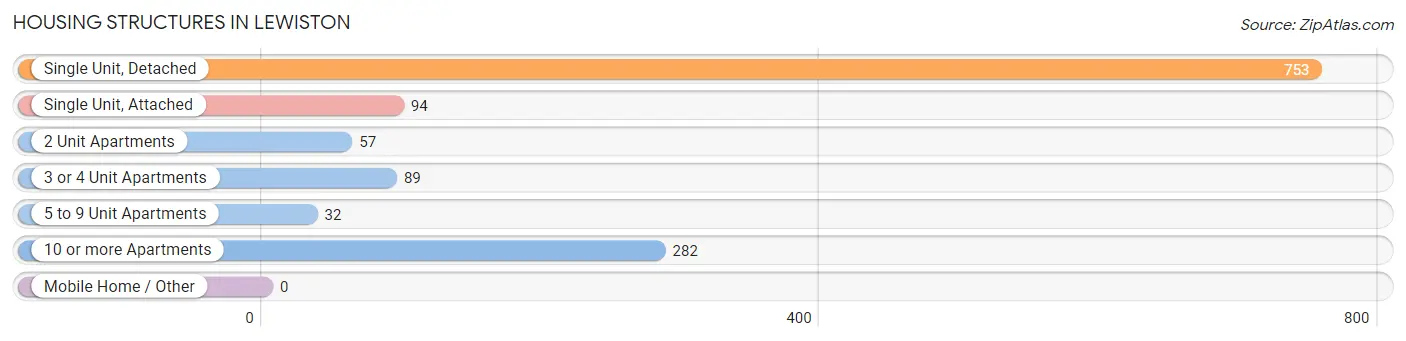
| Structure Type | # Housing Units | % Housing Units |
| Single Unit, Detached | 753 | 57.6% |
| Single Unit, Attached | 94 | 7.2% |
| 2 Unit Apartments | 57 | 4.4% |
| 3 or 4 Unit Apartments | 89 | 6.8% |
| 5 to 9 Unit Apartments | 32 | 2.5% |
| 10 or more Apartments | 282 | 21.6% |
| Mobile Home / Other | 0 | 0.0% |
| Total | 1,307 | 100.0% |
Housing Structures by Occupancy in Lewiston
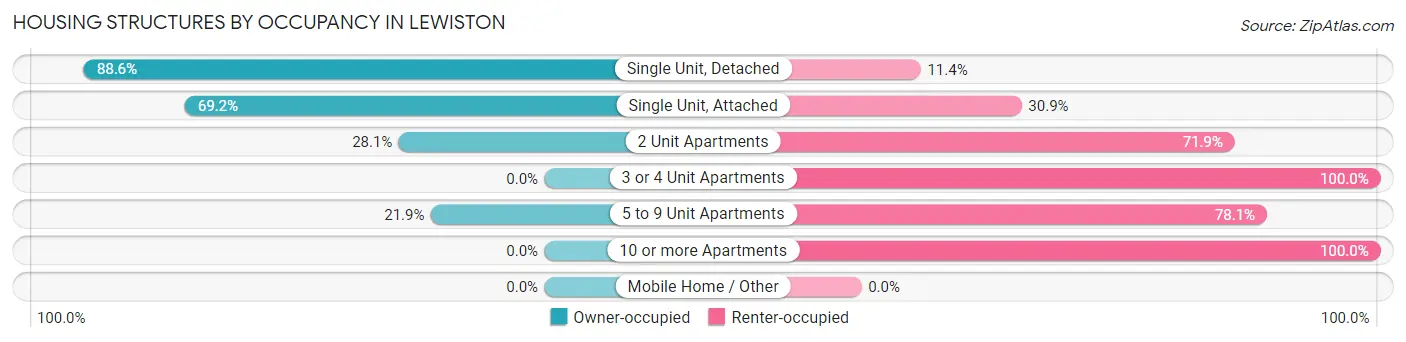
| Structure Type | Owner-occupied | Renter-occupied |
| Single Unit, Detached | 667 (88.6%) | 86 (11.4%) |
| Single Unit, Attached | 65 (69.2%) | 29 (30.8%) |
| 2 Unit Apartments | 16 (28.1%) | 41 (71.9%) |
| 3 or 4 Unit Apartments | 0 (0.0%) | 89 (100.0%) |
| 5 to 9 Unit Apartments | 7 (21.9%) | 25 (78.1%) |
| 10 or more Apartments | 0 (0.0%) | 282 (100.0%) |
| Mobile Home / Other | 0 (0.0%) | 0 (0.0%) |
| Total | 755 (57.8%) | 552 (42.2%) |
Housing Structures by Number of Rooms in Lewiston
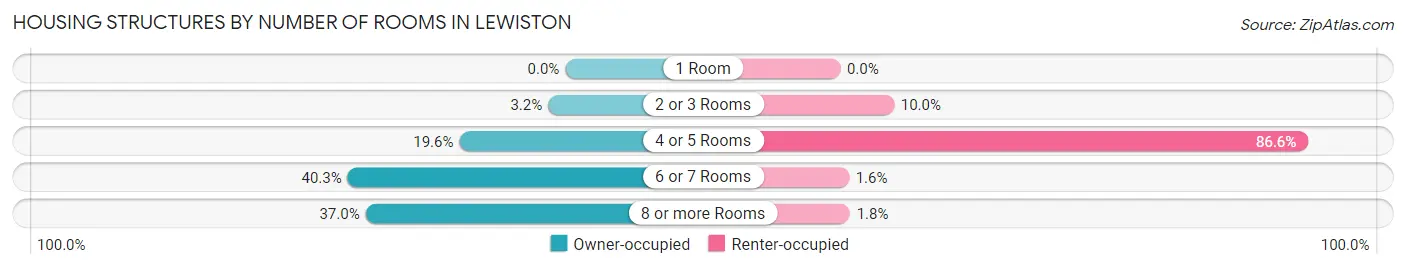
| Number of Rooms | Owner-occupied | Renter-occupied |
| 1 Room | 0 (0.0%) | 0 (0.0%) |
| 2 or 3 Rooms | 24 (3.2%) | 55 (10.0%) |
| 4 or 5 Rooms | 148 (19.6%) | 478 (86.6%) |
| 6 or 7 Rooms | 304 (40.3%) | 9 (1.6%) |
| 8 or more Rooms | 279 (36.9%) | 10 (1.8%) |
| Total | 755 (100.0%) | 552 (100.0%) |
Housing Structure by Heating Type in Lewiston
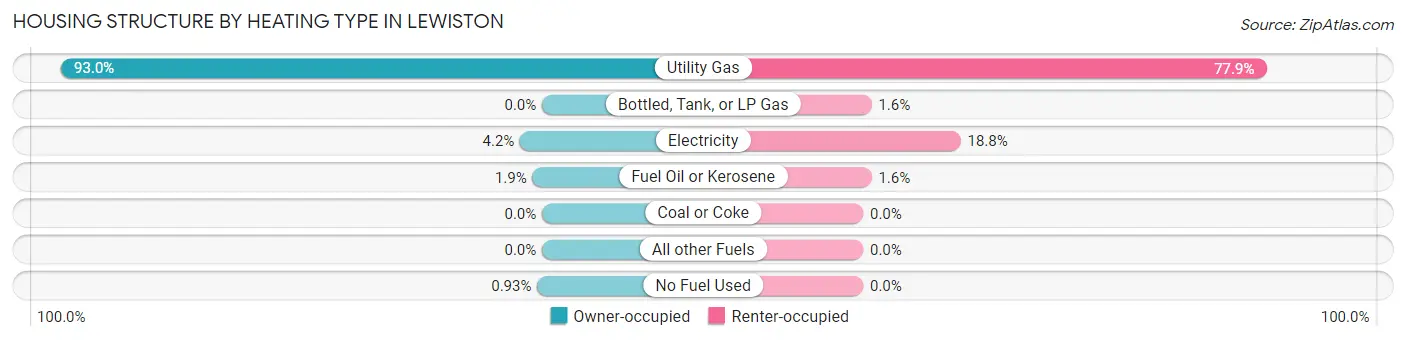
| Heating Type | Owner-occupied | Renter-occupied |
| Utility Gas | 702 (93.0%) | 430 (77.9%) |
| Bottled, Tank, or LP Gas | 0 (0.0%) | 9 (1.6%) |
| Electricity | 32 (4.2%) | 104 (18.8%) |
| Fuel Oil or Kerosene | 14 (1.8%) | 9 (1.6%) |
| Coal or Coke | 0 (0.0%) | 0 (0.0%) |
| All other Fuels | 0 (0.0%) | 0 (0.0%) |
| No Fuel Used | 7 (0.9%) | 0 (0.0%) |
| Total | 755 (100.0%) | 552 (100.0%) |
Household Vehicle Usage in Lewiston
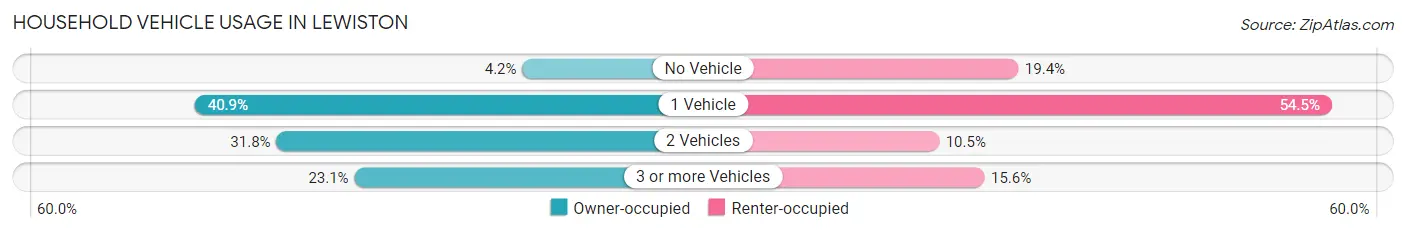
| Vehicles per Household | Owner-occupied | Renter-occupied |
| No Vehicle | 32 (4.2%) | 107 (19.4%) |
| 1 Vehicle | 309 (40.9%) | 301 (54.5%) |
| 2 Vehicles | 240 (31.8%) | 58 (10.5%) |
| 3 or more Vehicles | 174 (23.1%) | 86 (15.6%) |
| Total | 755 (100.0%) | 552 (100.0%) |
Real Estate & Mortgages in Lewiston
Real Estate and Mortgage Overview in Lewiston
| Characteristic | Without Mortgage | With Mortgage |
| Housing Units | 354 | 401 |
| Median Property Value | $195,500 | $199,100 |
| Median Household Income | $68,125 | $133 |
| Monthly Housing Costs | $696 | $16 |
| Real Estate Taxes | $3,836 | $0 |
Property Value by Mortgage Status in Lewiston
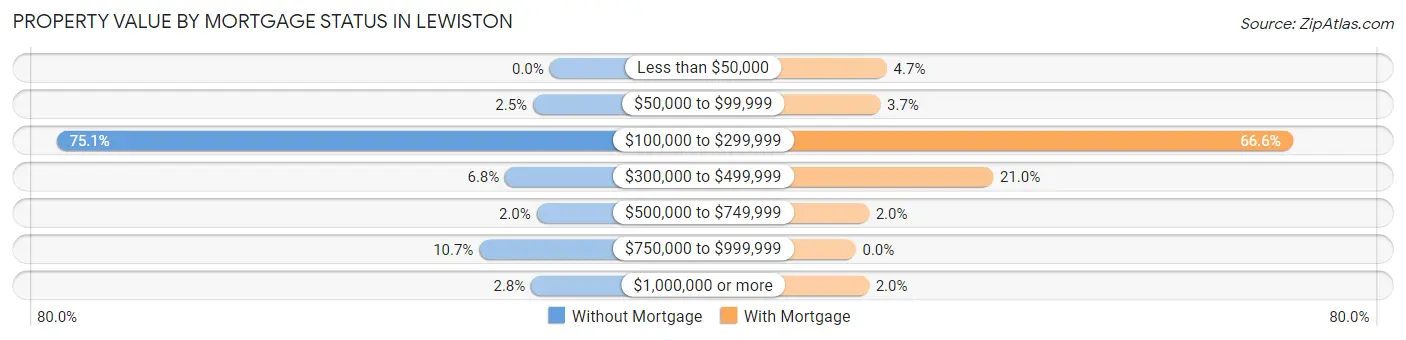
| Property Value | Without Mortgage | With Mortgage |
| Less than $50,000 | 0 (0.0%) | 19 (4.7%) |
| $50,000 to $99,999 | 9 (2.5%) | 15 (3.7%) |
| $100,000 to $299,999 | 266 (75.1%) | 267 (66.6%) |
| $300,000 to $499,999 | 24 (6.8%) | 84 (20.9%) |
| $500,000 to $749,999 | 7 (2.0%) | 8 (2.0%) |
| $750,000 to $999,999 | 38 (10.7%) | 0 (0.0%) |
| $1,000,000 or more | 10 (2.8%) | 8 (2.0%) |
| Total | 354 (100.0%) | 401 (100.0%) |
Household Income by Mortgage Status in Lewiston
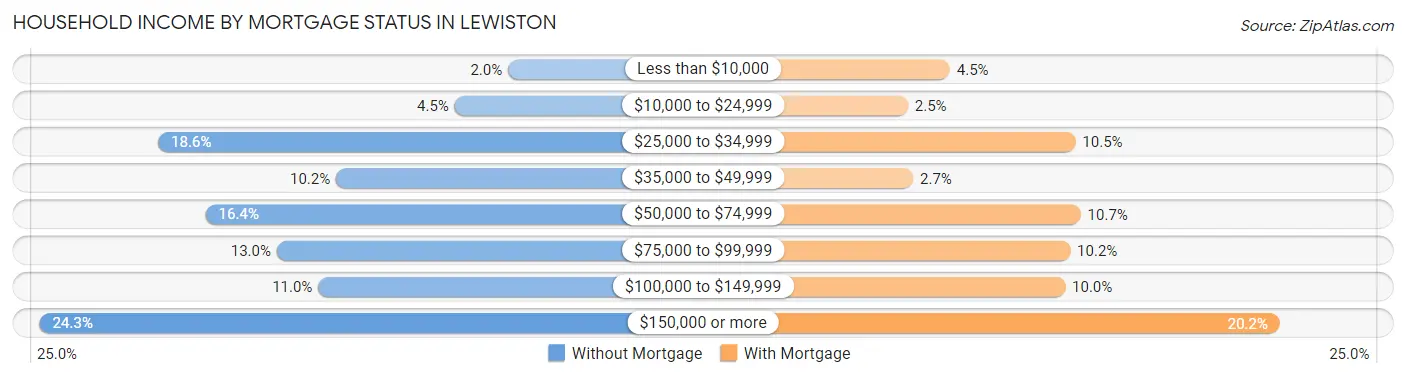
| Household Income | Without Mortgage | With Mortgage |
| Less than $10,000 | 7 (2.0%) | 18 (4.5%) |
| $10,000 to $24,999 | 16 (4.5%) | 10 (2.5%) |
| $25,000 to $34,999 | 66 (18.6%) | 42 (10.5%) |
| $35,000 to $49,999 | 36 (10.2%) | 11 (2.7%) |
| $50,000 to $74,999 | 58 (16.4%) | 43 (10.7%) |
| $75,000 to $99,999 | 46 (13.0%) | 41 (10.2%) |
| $100,000 to $149,999 | 39 (11.0%) | 40 (10.0%) |
| $150,000 or more | 86 (24.3%) | 81 (20.2%) |
| Total | 354 (100.0%) | 401 (100.0%) |
Property Value to Household Income Ratio in Lewiston
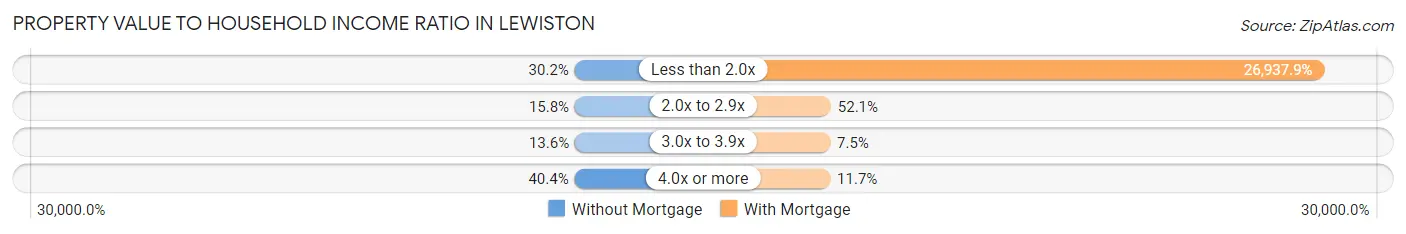
| Value-to-Income Ratio | Without Mortgage | With Mortgage |
| Less than 2.0x | 107 (30.2%) | 108,021 (26,937.9%) |
| 2.0x to 2.9x | 56 (15.8%) | 209 (52.1%) |
| 3.0x to 3.9x | 48 (13.6%) | 30 (7.5%) |
| 4.0x or more | 143 (40.4%) | 47 (11.7%) |
| Total | 354 (100.0%) | 401 (100.0%) |
Real Estate Taxes by Mortgage Status in Lewiston
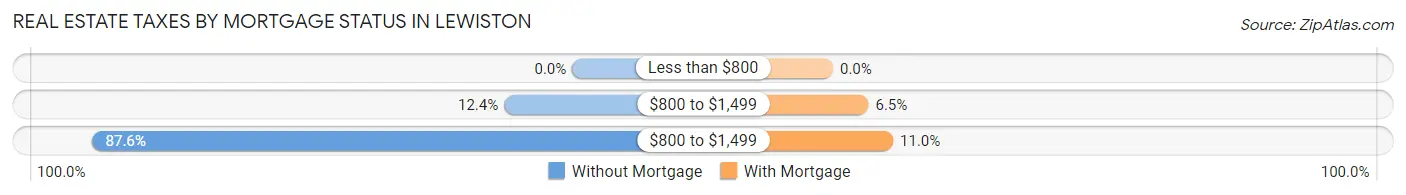
| Property Taxes | Without Mortgage | With Mortgage |
| Less than $800 | 0 (0.0%) | 0 (0.0%) |
| $800 to $1,499 | 44 (12.4%) | 26 (6.5%) |
| $800 to $1,499 | 310 (87.6%) | 44 (11.0%) |
| Total | 354 (100.0%) | 401 (100.0%) |
Health & Disability in Lewiston
Health Insurance Coverage by Age in Lewiston
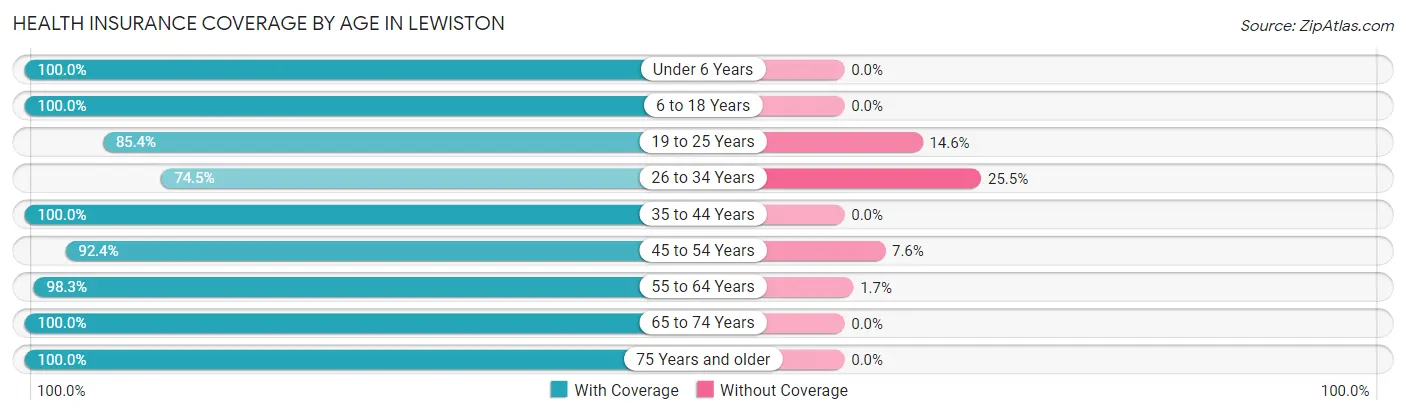
| Age Bracket | With Coverage | Without Coverage |
| Under 6 Years | 49 (100.0%) | 0 (0.0%) |
| 6 to 18 Years | 292 (100.0%) | 0 (0.0%) |
| 19 to 25 Years | 170 (85.4%) | 29 (14.6%) |
| 26 to 34 Years | 187 (74.5%) | 64 (25.5%) |
| 35 to 44 Years | 349 (100.0%) | 0 (0.0%) |
| 45 to 54 Years | 231 (92.4%) | 19 (7.6%) |
| 55 to 64 Years | 413 (98.3%) | 7 (1.7%) |
| 65 to 74 Years | 355 (100.0%) | 0 (0.0%) |
| 75 Years and older | 376 (100.0%) | 0 (0.0%) |
| Total | 2,422 (95.3%) | 119 (4.7%) |
Health Insurance Coverage by Citizenship Status in Lewiston
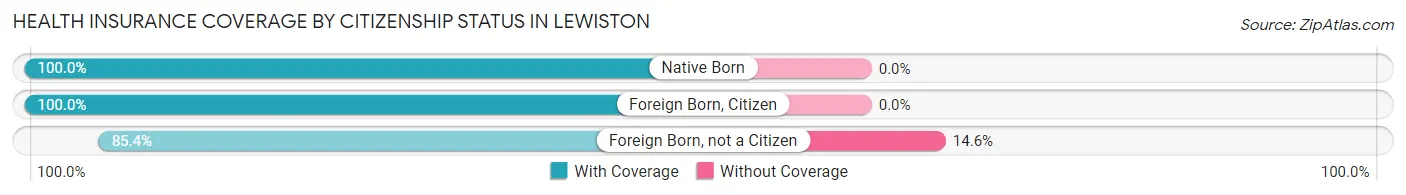
| Citizenship Status | With Coverage | Without Coverage |
| Native Born | 49 (100.0%) | 0 (0.0%) |
| Foreign Born, Citizen | 292 (100.0%) | 0 (0.0%) |
| Foreign Born, not a Citizen | 170 (85.4%) | 29 (14.6%) |
Health Insurance Coverage by Household Income in Lewiston
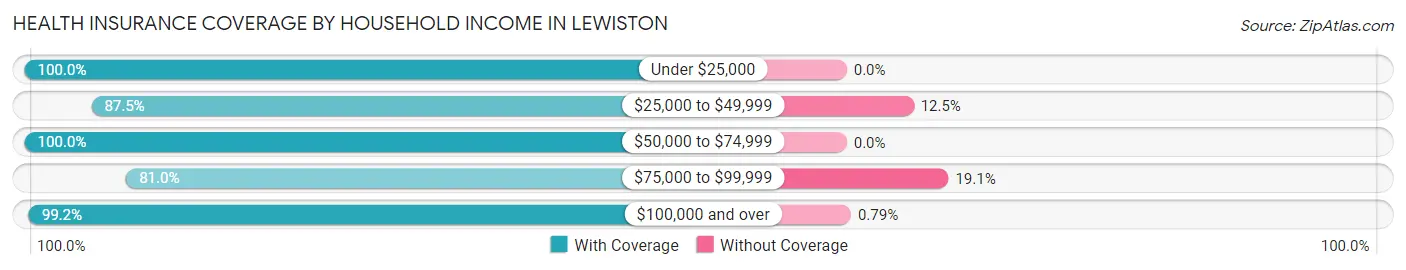
| Household Income | With Coverage | Without Coverage |
| Under $25,000 | 294 (100.0%) | 0 (0.0%) |
| $25,000 to $49,999 | 314 (87.5%) | 45 (12.5%) |
| $50,000 to $74,999 | 269 (100.0%) | 0 (0.0%) |
| $75,000 to $99,999 | 272 (80.9%) | 64 (19.1%) |
| $100,000 and over | 1,256 (99.2%) | 10 (0.8%) |
Public vs Private Health Insurance Coverage by Age in Lewiston
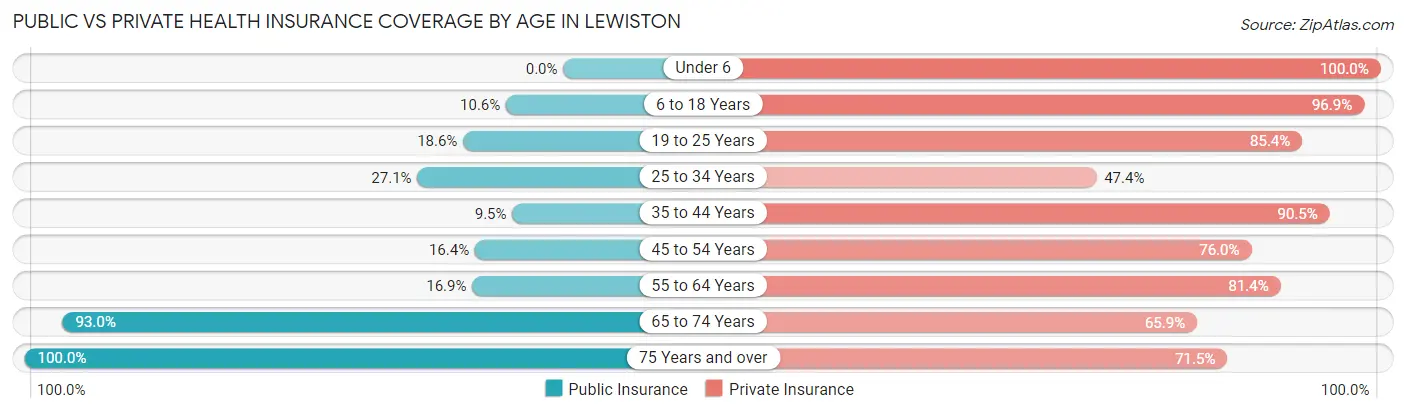
| Age Bracket | Public Insurance | Private Insurance |
| Under 6 | 0 (0.0%) | 49 (100.0%) |
| 6 to 18 Years | 31 (10.6%) | 283 (96.9%) |
| 19 to 25 Years | 37 (18.6%) | 170 (85.4%) |
| 25 to 34 Years | 68 (27.1%) | 119 (47.4%) |
| 35 to 44 Years | 33 (9.5%) | 316 (90.5%) |
| 45 to 54 Years | 41 (16.4%) | 190 (76.0%) |
| 55 to 64 Years | 71 (16.9%) | 342 (81.4%) |
| 65 to 74 Years | 330 (93.0%) | 234 (65.9%) |
| 75 Years and over | 376 (100.0%) | 269 (71.5%) |
| Total | 987 (38.8%) | 1,972 (77.6%) |
Disability Status by Sex by Age in Lewiston
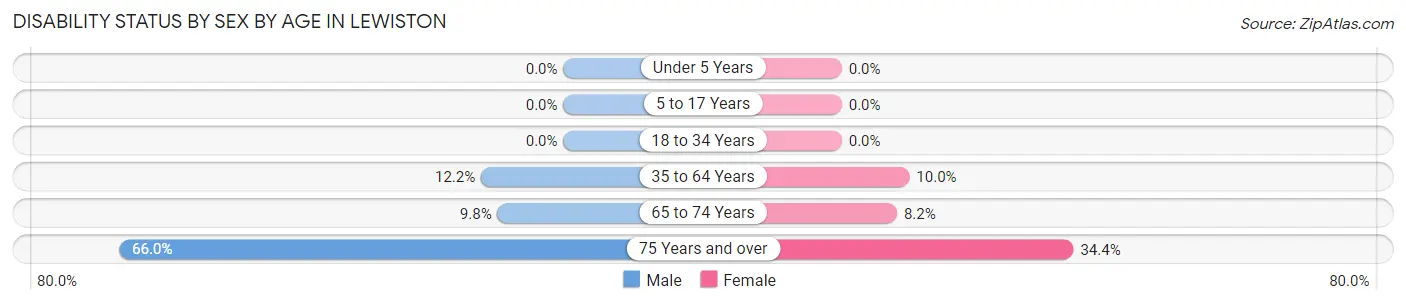
| Age Bracket | Male | Female |
| Under 5 Years | 0 (0.0%) | 0 (0.0%) |
| 5 to 17 Years | 0 (0.0%) | 0 (0.0%) |
| 18 to 34 Years | 0 (0.0%) | 0 (0.0%) |
| 35 to 64 Years | 60 (12.2%) | 53 (10.0%) |
| 65 to 74 Years | 18 (9.8%) | 14 (8.2%) |
| 75 Years and over | 62 (66.0%) | 97 (34.4%) |
Disability Class by Sex by Age in Lewiston
Disability Class: Hearing Difficulty
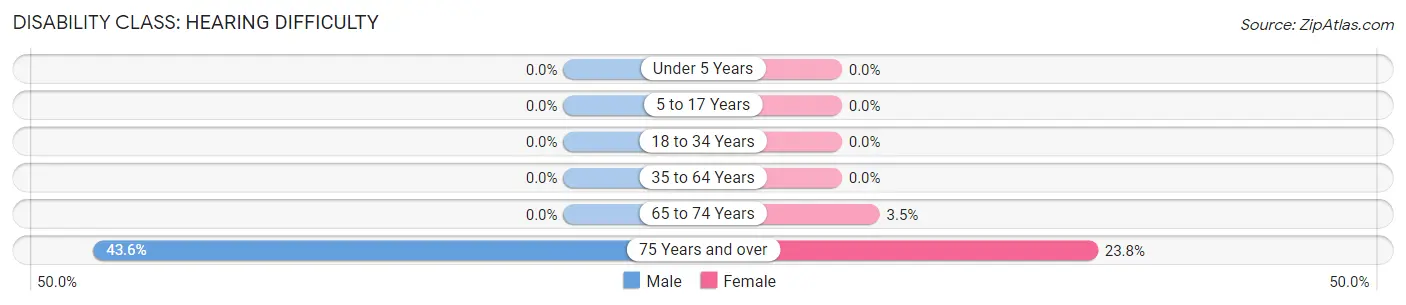
| Age Bracket | Male | Female |
| Under 5 Years | 0 (0.0%) | 0 (0.0%) |
| 5 to 17 Years | 0 (0.0%) | 0 (0.0%) |
| 18 to 34 Years | 0 (0.0%) | 0 (0.0%) |
| 35 to 64 Years | 0 (0.0%) | 0 (0.0%) |
| 65 to 74 Years | 0 (0.0%) | 6 (3.5%) |
| 75 Years and over | 41 (43.6%) | 67 (23.8%) |
Disability Class: Vision Difficulty
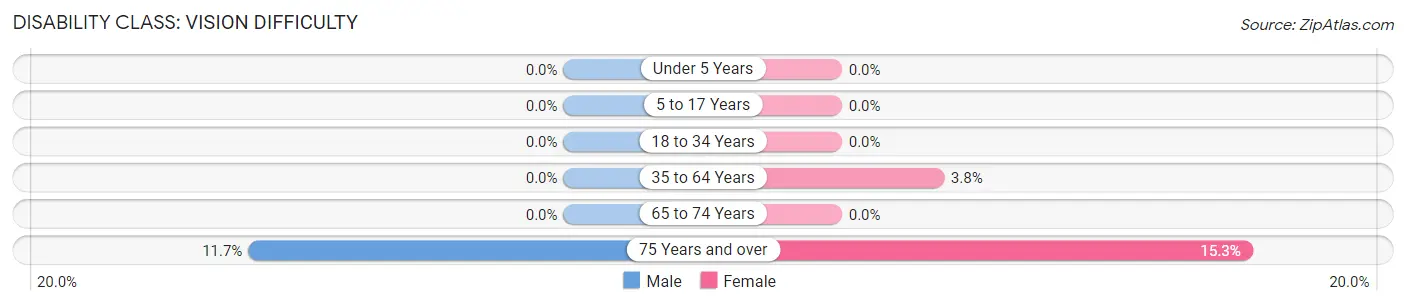
| Age Bracket | Male | Female |
| Under 5 Years | 0 (0.0%) | 0 (0.0%) |
| 5 to 17 Years | 0 (0.0%) | 0 (0.0%) |
| 18 to 34 Years | 0 (0.0%) | 0 (0.0%) |
| 35 to 64 Years | 0 (0.0%) | 20 (3.8%) |
| 65 to 74 Years | 0 (0.0%) | 0 (0.0%) |
| 75 Years and over | 11 (11.7%) | 43 (15.2%) |
Disability Class: Cognitive Difficulty
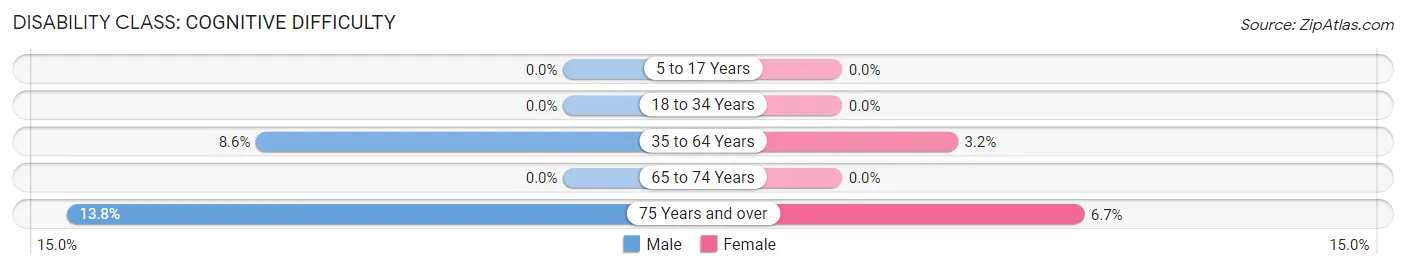
| Age Bracket | Male | Female |
| 5 to 17 Years | 0 (0.0%) | 0 (0.0%) |
| 18 to 34 Years | 0 (0.0%) | 0 (0.0%) |
| 35 to 64 Years | 42 (8.6%) | 17 (3.2%) |
| 65 to 74 Years | 0 (0.0%) | 0 (0.0%) |
| 75 Years and over | 13 (13.8%) | 19 (6.7%) |
Disability Class: Ambulatory Difficulty
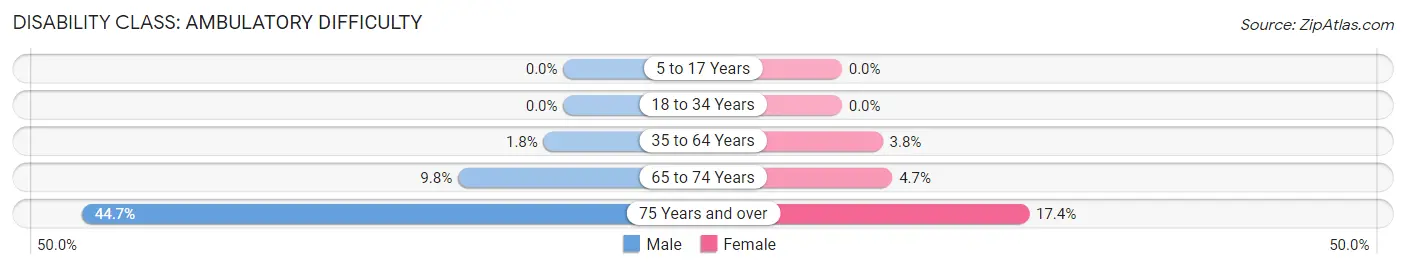
| Age Bracket | Male | Female |
| 5 to 17 Years | 0 (0.0%) | 0 (0.0%) |
| 18 to 34 Years | 0 (0.0%) | 0 (0.0%) |
| 35 to 64 Years | 9 (1.8%) | 20 (3.8%) |
| 65 to 74 Years | 18 (9.8%) | 8 (4.7%) |
| 75 Years and over | 42 (44.7%) | 49 (17.4%) |
Disability Class: Self-Care Difficulty
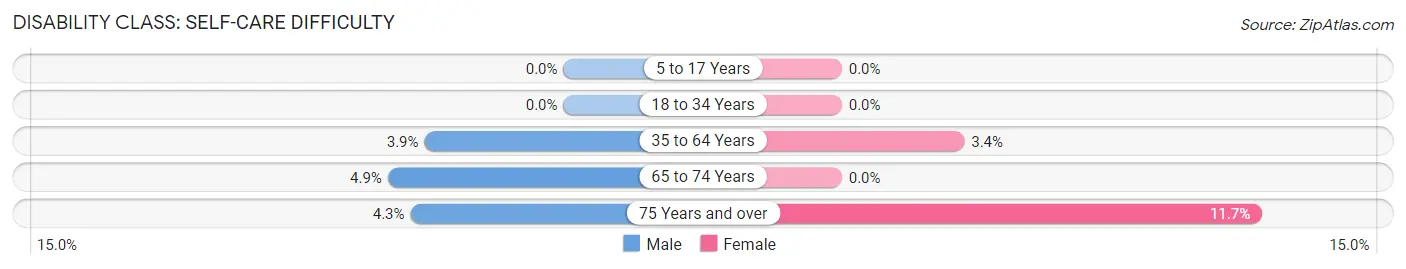
| Age Bracket | Male | Female |
| 5 to 17 Years | 0 (0.0%) | 0 (0.0%) |
| 18 to 34 Years | 0 (0.0%) | 0 (0.0%) |
| 35 to 64 Years | 19 (3.9%) | 18 (3.4%) |
| 65 to 74 Years | 9 (4.9%) | 0 (0.0%) |
| 75 Years and over | 4 (4.3%) | 33 (11.7%) |
Technology Access in Lewiston
Computing Device Access in Lewiston
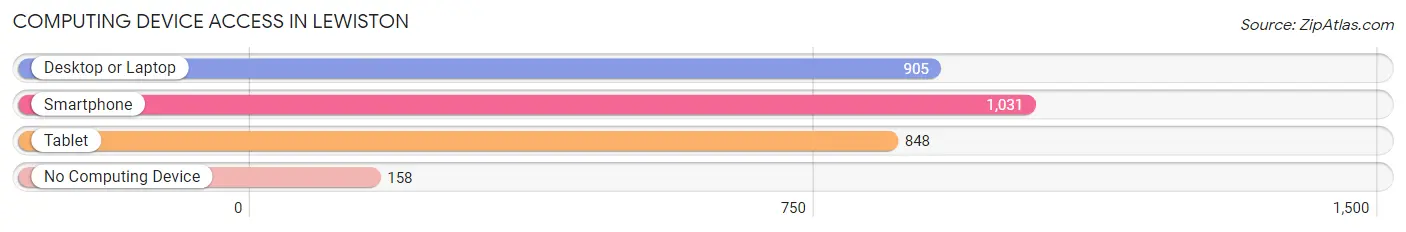
| Device Type | # Households | % Households |
| Desktop or Laptop | 905 | 69.2% |
| Smartphone | 1,031 | 78.9% |
| Tablet | 848 | 64.9% |
| No Computing Device | 158 | 12.1% |
| Total | 1,307 | 100.0% |
Internet Access in Lewiston
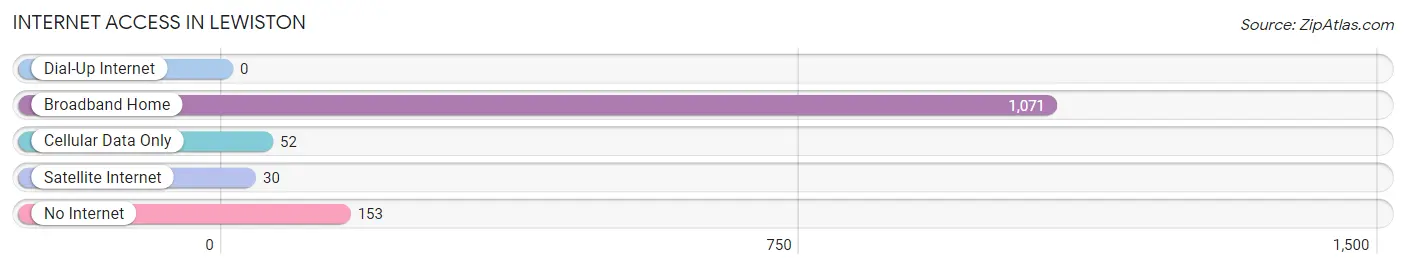
| Internet Type | # Households | % Households |
| Dial-Up Internet | 0 | 0.0% |
| Broadband Home | 1,071 | 81.9% |
| Cellular Data Only | 52 | 4.0% |
| Satellite Internet | 30 | 2.3% |
| No Internet | 153 | 11.7% |
| Total | 1,307 | 100.0% |
Lewiston Summary
Lewiston, New York is a village located in Niagara County, New York, United States. The population was 2,701 at the 2010 census. It is part of the Buffalo–Niagara Falls Metropolitan Statistical Area. The Village of Lewiston, NY is located in the Town of Lewiston and is the most populous village in the town.
Geography
Lewiston is located at the intersection of the Niagara River and the Erie Canal. It is situated on the west bank of the Niagara River, just south of the City of Niagara Falls. The village is bordered by the Town of Porter to the north, the Town of Niagara to the east, and the Town of Cambria to the south.
The village is located at the intersection of two major highways, New York State Route 104 and New York State Route 18F. The village is also served by the Niagara Falls International Airport, located just south of the village.
History
The area that is now Lewiston was originally inhabited by the Neutral Nation of Native Americans. The first European settlers arrived in the area in the late 1700s. The village was founded in 1818 and was originally known as "Lewistonville". The village was named after Morgan Lewis, the Governor of New York at the time.
In 1820, the village was incorporated as the Village of Lewiston. The village grew rapidly in the 19th century due to its location at the intersection of the Niagara River and the Erie Canal. The village was a major port for the transportation of goods between the Great Lakes and the Atlantic Ocean.
The village was also a major center for the Underground Railroad, with many slaves escaping to freedom in Canada via the Niagara River.
Economy
The economy of Lewiston is largely based on tourism. The village is home to several attractions, including the Niagara Power Vista, the Niagara Gorge Discovery Center, and the Niagara Aquarium. The village is also home to several wineries, including the Niagara Landing Wine Cellars and the Schulze Vineyards & Winery.
The village is also home to several restaurants, including the Brickyard Pub & BBQ, the Brickyard Brewing Company, and the Brickyard Bistro.
Demographics
As of the 2010 census, the population of Lewiston was 2,701. The racial makeup of the village was 94.3% White, 2.2% African American, 0.7% Native American, 0.7% Asian, 0.2% Pacific Islander, 0.7% from other races, and 1.2% from two or more races. Hispanic or Latino of any race were 2.7% of the population.
The median income for a household in the village was $45,938, and the median income for a family was $51,938. The per capita income for the village was $22,938. About 8.3% of families and 10.2% of the population were below the poverty line, including 14.2% of those under age 18 and 5.2% of those age 65 or over.
Conclusion
Lewiston, New York is a village located in Niagara County, New York, United States. The village is situated on the west bank of the Niagara River, just south of the City of Niagara Falls. The village is bordered by the Town of Porter to the north, the Town of Niagara to the east, and the Town of Cambria to the south. The village is home to several attractions, including the Niagara Power Vista, the Niagara Gorge Discovery Center, and the Niagara Aquarium. The economy of Lewiston is largely based on tourism. As of the 2010 census, the population of Lewiston was 2,701. The median income for a household in the village was $45,938, and the median income for a family was $51,938.
Common Questions
What is Per Capita Income in Lewiston?
Per Capita income in Lewiston is $50,391.
What is the Median Family Income in Lewiston?
Median Family Income in Lewiston is $140,000.
What is the Median Household income in Lewiston?
Median Household Income in Lewiston is $65,563.
What is Income or Wage Gap in Lewiston?
Income or Wage Gap in Lewiston is 38.2%.
Women in Lewiston earn 61.8 cents for every dollar earned by a man.
What is Inequality or Gini Index in Lewiston?
Inequality or Gini Index in Lewiston is 0.49.
What is the Total Population of Lewiston?
Total Population of Lewiston is 2,541.
What is the Total Male Population of Lewiston?
Total Male Population of Lewiston is 1,181.
What is the Total Female Population of Lewiston?
Total Female Population of Lewiston is 1,360.
What is the Ratio of Males per 100 Females in Lewiston?
There are 86.84 Males per 100 Females in Lewiston.
What is the Ratio of Females per 100 Males in Lewiston?
There are 115.16 Females per 100 Males in Lewiston.
What is the Median Population Age in Lewiston?
Median Population Age in Lewiston is 50.6 Years.
What is the Average Family Size in Lewiston
Average Family Size in Lewiston is 2.9 People.
What is the Average Household Size in Lewiston
Average Household Size in Lewiston is 1.9 People.
How Large is the Labor Force in Lewiston?
There are 1,388 People in the Labor Forcein in Lewiston.
What is the Percentage of People in the Labor Force in Lewiston?
60.1% of People are in the Labor Force in Lewiston.
What is the Unemployment Rate in Lewiston?
Unemployment Rate in Lewiston is 4.1%.