Country Knolls, NY Map & Demographics
Country Knolls Map
Country Knolls Overview
$55,223
PER CAPITA INCOME
$148,777
AVG FAMILY INCOME
$127,639
AVG HOUSEHOLD INCOME
49.9%
WAGE / INCOME GAP [ % ]
50.1¢/ $1
WAGE / INCOME GAP [ $ ]
0.38
INEQUALITY / GINI INDEX
5,811
TOTAL POPULATION
2,981
MALE POPULATION
2,830
FEMALE POPULATION
105.34
MALES / 100 FEMALES
94.93
FEMALES / 100 MALES
45.0
MEDIAN AGE
3.3
AVG FAMILY SIZE
2.7
AVG HOUSEHOLD SIZE
3,114
LABOR FORCE [ PEOPLE ]
65.2%
PERCENT IN LABOR FORCE
1.2%
UNEMPLOYMENT RATE
Income in Country Knolls
Income Overview in Country Knolls
Per Capita Income in Country Knolls is $55,223, while median incomes of families and households are $148,777 and $127,639 respectively.
| Characteristic | Number | Measure |
| Per Capita Income | 5,811 | $55,223 |
| Median Family Income | 1,567 | $148,777 |
| Mean Family Income | 1,567 | $170,315 |
| Median Household Income | 2,128 | $127,639 |
| Mean Household Income | 2,128 | $147,758 |
| Income Deficit | 1,567 | $0 |
| Wage / Income Gap (%) | 5,811 | 49.87% |
| Wage / Income Gap ($) | 5,811 | 50.13¢ per $1 |
| Gini / Inequality Index | 5,811 | 0.38 |
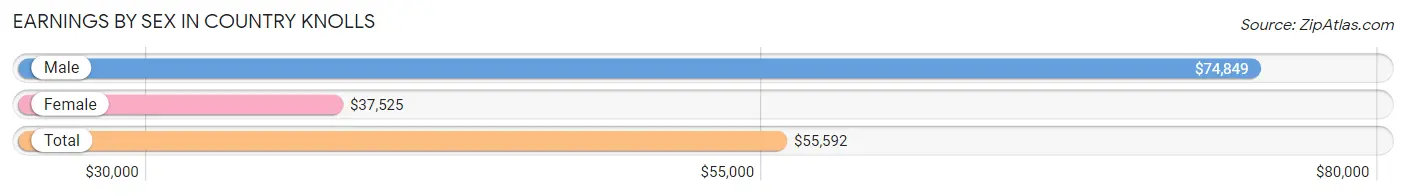
Earnings by Sex in Country Knolls
Average Earnings in Country Knolls are $55,592, $74,849 for men and $37,525 for women, a difference of 49.9%.
| Sex | Number | Average Earnings |
| Male | 1,611 (49.9%) | $74,849 |
| Female | 1,619 (50.1%) | $37,525 |
| Total | 3,230 (100.0%) | $55,592 |
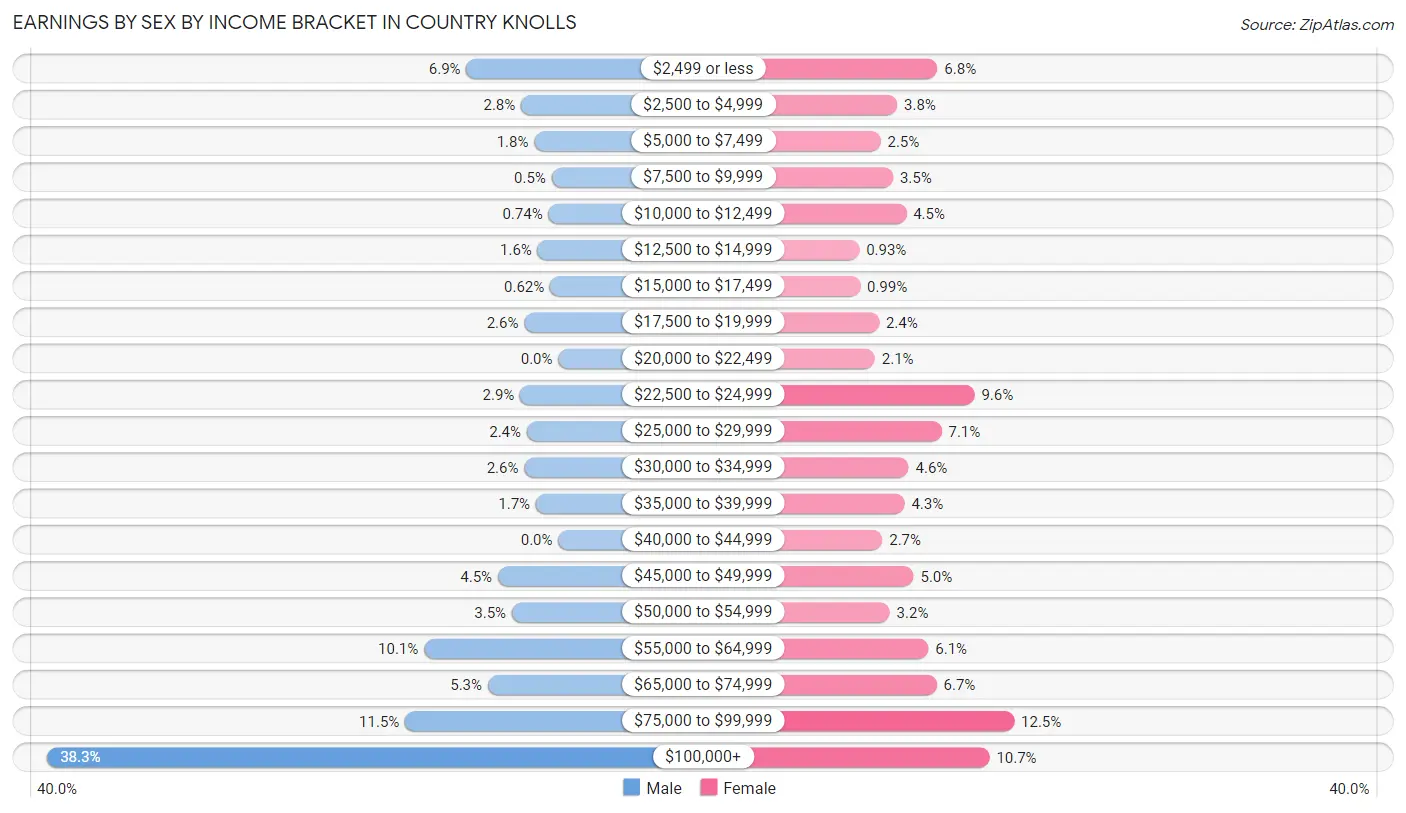
Earnings by Sex by Income Bracket in Country Knolls
The most common earnings brackets in Country Knolls are $100,000+ for men (617 | 38.3%) and $75,000 to $99,999 for women (203 | 12.5%).
| Income | Male | Female |
| $2,499 or less | 111 (6.9%) | 110 (6.8%) |
| $2,500 to $4,999 | 45 (2.8%) | 61 (3.8%) |
| $5,000 to $7,499 | 29 (1.8%) | 41 (2.5%) |
| $7,500 to $9,999 | 8 (0.5%) | 56 (3.5%) |
| $10,000 to $12,499 | 12 (0.7%) | 72 (4.4%) |
| $12,500 to $14,999 | 25 (1.5%) | 15 (0.9%) |
| $15,000 to $17,499 | 10 (0.6%) | 16 (1.0%) |
| $17,500 to $19,999 | 41 (2.5%) | 39 (2.4%) |
| $20,000 to $22,499 | 0 (0.0%) | 34 (2.1%) |
| $22,500 to $24,999 | 46 (2.9%) | 155 (9.6%) |
| $25,000 to $29,999 | 38 (2.4%) | 115 (7.1%) |
| $30,000 to $34,999 | 41 (2.5%) | 75 (4.6%) |
| $35,000 to $39,999 | 27 (1.7%) | 70 (4.3%) |
| $40,000 to $44,999 | 0 (0.0%) | 43 (2.7%) |
| $45,000 to $49,999 | 73 (4.5%) | 81 (5.0%) |
| $50,000 to $54,999 | 56 (3.5%) | 52 (3.2%) |
| $55,000 to $64,999 | 162 (10.1%) | 99 (6.1%) |
| $65,000 to $74,999 | 85 (5.3%) | 109 (6.7%) |
| $75,000 to $99,999 | 185 (11.5%) | 203 (12.5%) |
| $100,000+ | 617 (38.3%) | 173 (10.7%) |
| Total | 1,611 (100.0%) | 1,619 (100.0%) |
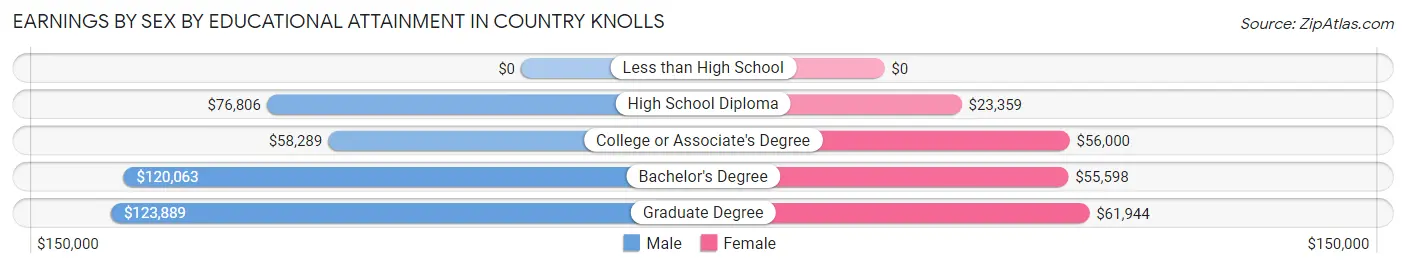
Earnings by Sex by Educational Attainment in Country Knolls
Average earnings in Country Knolls are $86,641 for men and $47,096 for women, a difference of 45.6%. Men with an educational attainment of graduate degree enjoy the highest average annual earnings of $123,889, while those with college or associate's degree education earn the least with $58,289. Women with an educational attainment of graduate degree earn the most with the average annual earnings of $61,944, while those with high school diploma education have the smallest earnings of $23,359.
| Educational Attainment | Male Income | Female Income |
| Less than High School | - | - |
| High School Diploma | $76,806 | $23,359 |
| College or Associate's Degree | $58,289 | $56,000 |
| Bachelor's Degree | $120,063 | $55,598 |
| Graduate Degree | $123,889 | $61,944 |
| Total | $86,641 | $47,096 |
Family Income in Country Knolls
Family Income Brackets in Country Knolls
According to the Country Knolls family income data, there are 480 families falling into the $200,000+ income range, which is the most common income bracket and makes up 30.6% of all families.
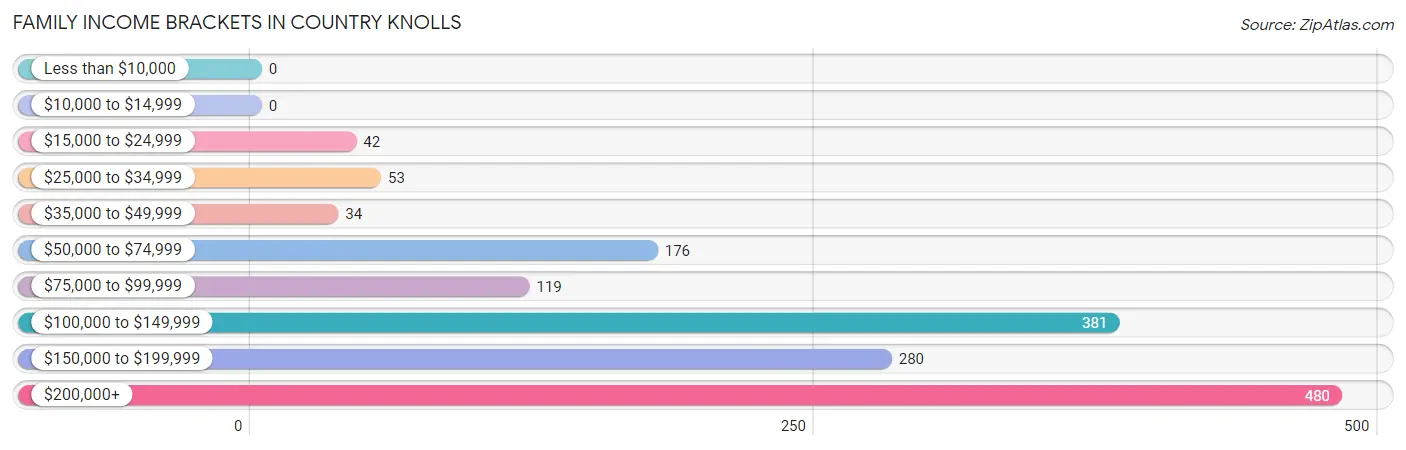
| Income Bracket | # Families | % Families |
| Less than $10,000 | 0 | 0.0% |
| $10,000 to $14,999 | 0 | 0.0% |
| $15,000 to $24,999 | 42 | 2.7% |
| $25,000 to $34,999 | 53 | 3.4% |
| $35,000 to $49,999 | 34 | 2.2% |
| $50,000 to $74,999 | 176 | 11.2% |
| $75,000 to $99,999 | 119 | 7.6% |
| $100,000 to $149,999 | 381 | 24.3% |
| $150,000 to $199,999 | 280 | 17.9% |
| $200,000+ | 480 | 30.6% |
Family Income by Famaliy Size in Country Knolls
6-person families (28 | 1.8%) account for the highest median family income in Country Knolls with $237,941 per family, while 2-person families (613 | 39.1%) have the highest median income of $66,678 per family member.
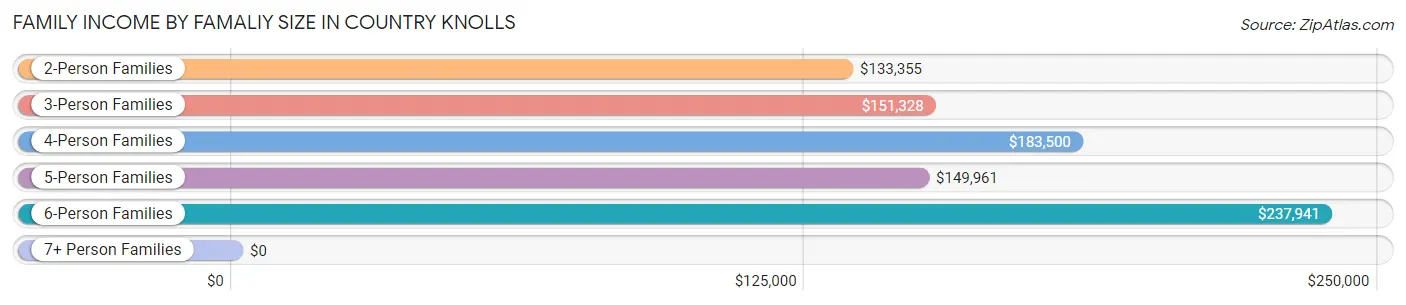
| Income Bracket | # Families | Median Income |
| 2-Person Families | 613 (39.1%) | $133,355 |
| 3-Person Families | 384 (24.5%) | $151,328 |
| 4-Person Families | 358 (22.9%) | $183,500 |
| 5-Person Families | 173 (11.0%) | $149,961 |
| 6-Person Families | 28 (1.8%) | $237,941 |
| 7+ Person Families | 11 (0.7%) | $0 |
| Total | 1,567 (100.0%) | $148,777 |
Family Income by Number of Earners in Country Knolls
The median family income in Country Knolls is $148,777, with families comprising 3+ earners (332) having the highest median family income of $183,000, while families with no earners (156) have the lowest median family income of $111,429, accounting for 21.2% and 10.0% of families, respectively.
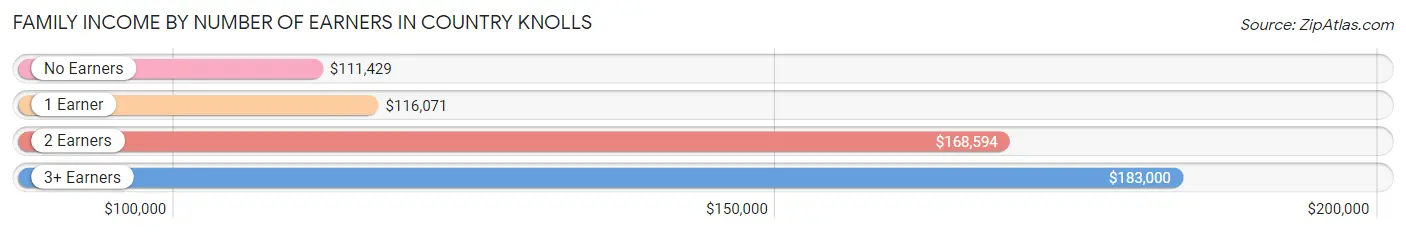
| Number of Earners | # Families | Median Income |
| No Earners | 156 (10.0%) | $111,429 |
| 1 Earner | 506 (32.3%) | $116,071 |
| 2 Earners | 573 (36.6%) | $168,594 |
| 3+ Earners | 332 (21.2%) | $183,000 |
| Total | 1,567 (100.0%) | $148,777 |
Household Income in Country Knolls
Household Income Brackets in Country Knolls
With 515 households falling in the category, the $200,000+ income range is the most frequent in Country Knolls, accounting for 24.2% of all households. In contrast, only 11 households (0.5%) fall into the $10,000 to $14,999 income bracket, making it the least populous group.
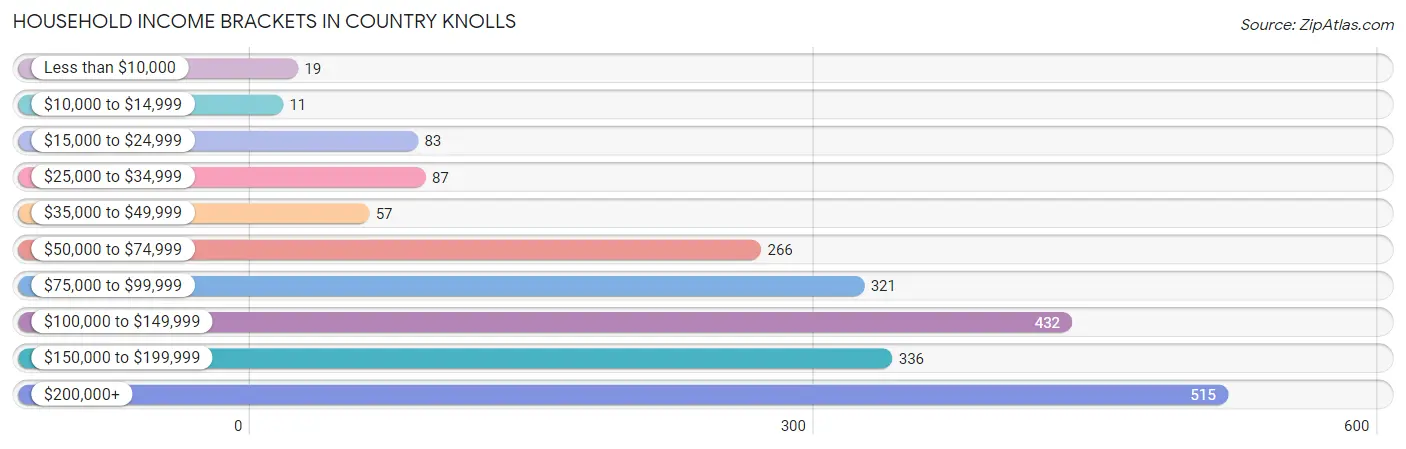
| Income Bracket | # Households | % Households |
| Less than $10,000 | 19 | 0.9% |
| $10,000 to $14,999 | 11 | 0.5% |
| $15,000 to $24,999 | 83 | 3.9% |
| $25,000 to $34,999 | 87 | 4.1% |
| $35,000 to $49,999 | 57 | 2.7% |
| $50,000 to $74,999 | 266 | 12.5% |
| $75,000 to $99,999 | 321 | 15.1% |
| $100,000 to $149,999 | 432 | 20.3% |
| $150,000 to $199,999 | 336 | 15.8% |
| $200,000+ | 515 | 24.2% |
Household Income by Householder Age in Country Knolls
The median household income in Country Knolls is $127,639, with the highest median household income of $151,406 found in the 25 to 44 years age bracket for the primary householder. A total of 387 households (18.2%) fall into this category.
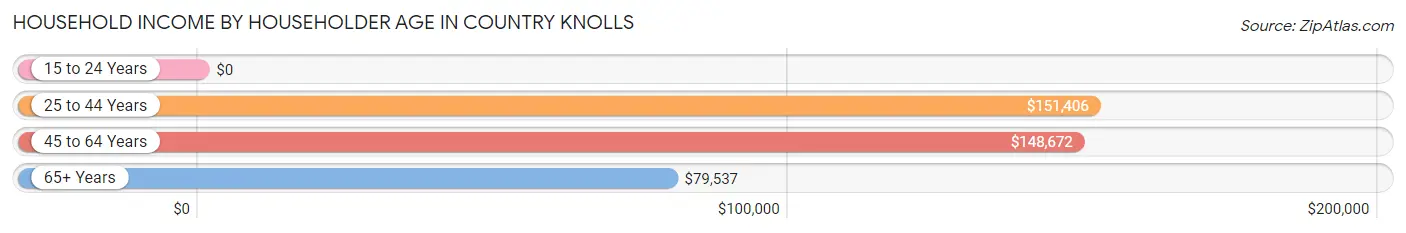
| Income Bracket | # Households | Median Income |
| 15 to 24 Years | 0 (0.0%) | $0 |
| 25 to 44 Years | 387 (18.2%) | $151,406 |
| 45 to 64 Years | 1,030 (48.4%) | $148,672 |
| 65+ Years | 711 (33.4%) | $79,537 |
| Total | 2,128 (100.0%) | $127,639 |
Poverty in Country Knolls
Income Below Poverty by Sex and Age in Country Knolls
With 1.3% poverty level for males and 1.0% for females among the residents of Country Knolls, 35 to 44 year old males and 75 year old and over females are the most vulnerable to poverty, with 10 males (4.1%) and 17 females (7.2%) in their respective age groups living below the poverty level.
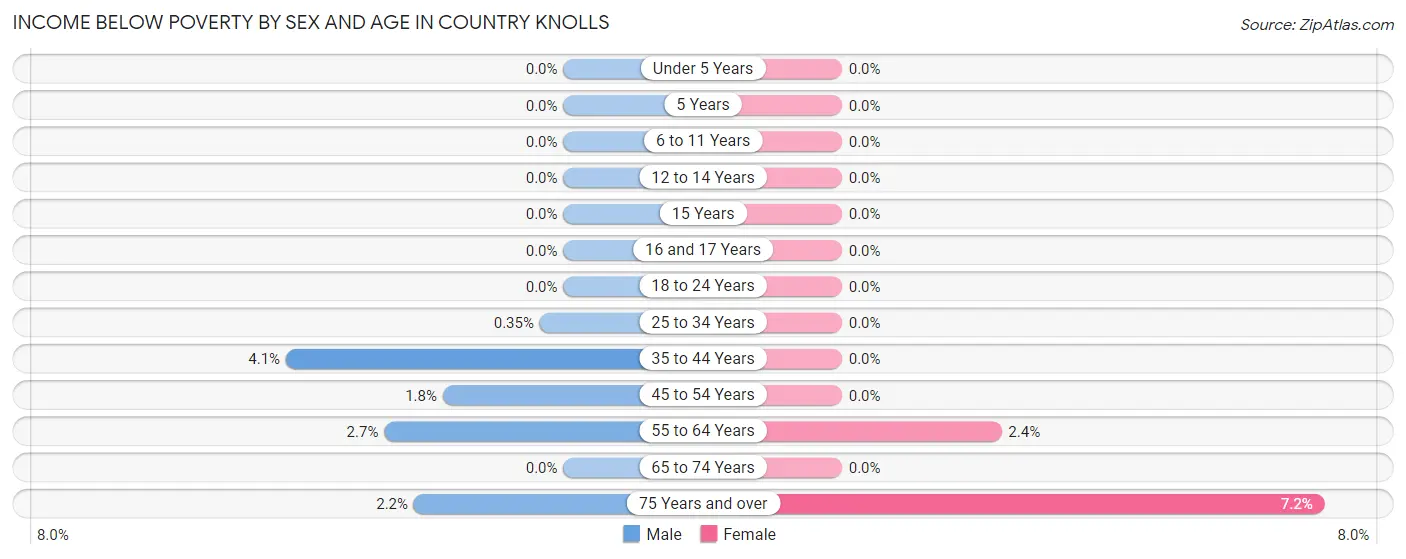
| Age Bracket | Male | Female |
| Under 5 Years | 0 (0.0%) | 0 (0.0%) |
| 5 Years | 0 (0.0%) | 0 (0.0%) |
| 6 to 11 Years | 0 (0.0%) | 0 (0.0%) |
| 12 to 14 Years | 0 (0.0%) | 0 (0.0%) |
| 15 Years | 0 (0.0%) | 0 (0.0%) |
| 16 and 17 Years | 0 (0.0%) | 0 (0.0%) |
| 18 to 24 Years | 0 (0.0%) | 0 (0.0%) |
| 25 to 34 Years | 1 (0.4%) | 0 (0.0%) |
| 35 to 44 Years | 10 (4.1%) | 0 (0.0%) |
| 45 to 54 Years | 8 (1.8%) | 0 (0.0%) |
| 55 to 64 Years | 13 (2.7%) | 11 (2.4%) |
| 65 to 74 Years | 0 (0.0%) | 0 (0.0%) |
| 75 Years and over | 7 (2.2%) | 17 (7.2%) |
| Total | 39 (1.3%) | 28 (1.0%) |
Income Above Poverty by Sex and Age in Country Knolls
According to the poverty statistics in Country Knolls, males aged under 5 years and females aged under 5 years are the age groups that are most secure financially, with 100.0% of males and 100.0% of females in these age groups living above the poverty line.
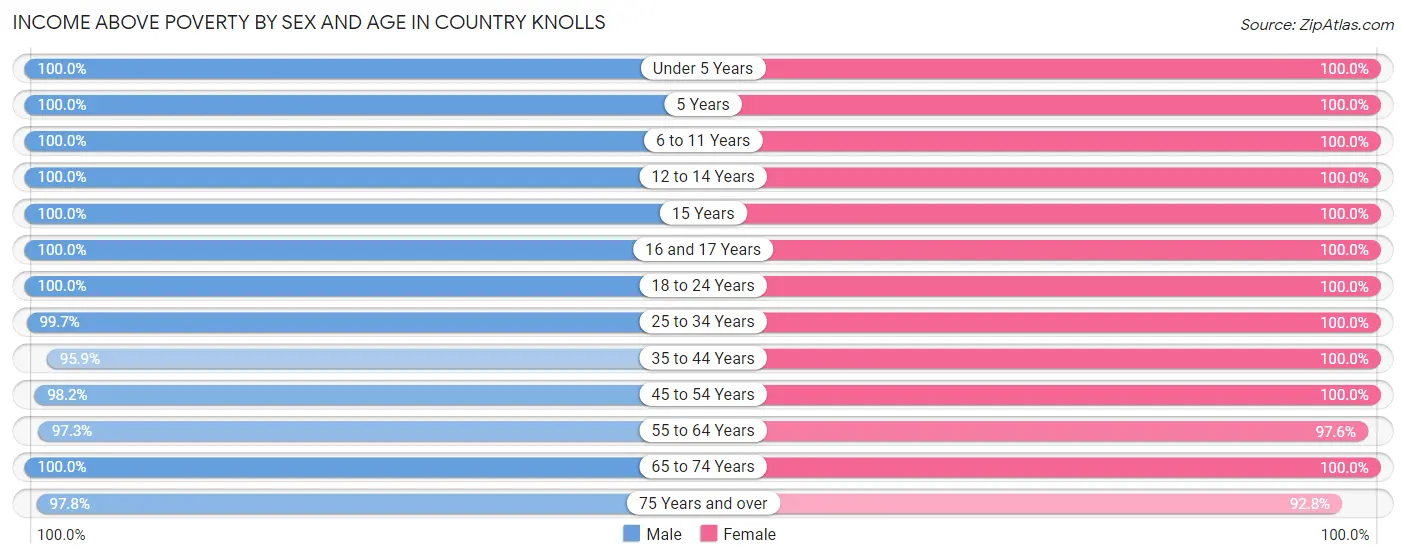
| Age Bracket | Male | Female |
| Under 5 Years | 94 (100.0%) | 85 (100.0%) |
| 5 Years | 7 (100.0%) | 25 (100.0%) |
| 6 to 11 Years | 243 (100.0%) | 230 (100.0%) |
| 12 to 14 Years | 116 (100.0%) | 151 (100.0%) |
| 15 Years | 64 (100.0%) | 20 (100.0%) |
| 16 and 17 Years | 206 (100.0%) | 178 (100.0%) |
| 18 to 24 Years | 249 (100.0%) | 172 (100.0%) |
| 25 to 34 Years | 286 (99.7%) | 194 (100.0%) |
| 35 to 44 Years | 233 (95.9%) | 339 (100.0%) |
| 45 to 54 Years | 440 (98.2%) | 536 (100.0%) |
| 55 to 64 Years | 475 (97.3%) | 453 (97.6%) |
| 65 to 74 Years | 220 (100.0%) | 199 (100.0%) |
| 75 Years and over | 309 (97.8%) | 220 (92.8%) |
| Total | 2,942 (98.7%) | 2,802 (99.0%) |
Income Below Poverty Among Married-Couple Families in Country Knolls
The poverty statistics for married-couple families in Country Knolls show that 0.5% or 7 of the total 1,290 families live below the poverty line. Families with no children have the highest poverty rate of 1.1%, comprising of 7 families. On the other hand, families with 1 or 2 children have the lowest poverty rate of 0.0%, which includes 0 families.
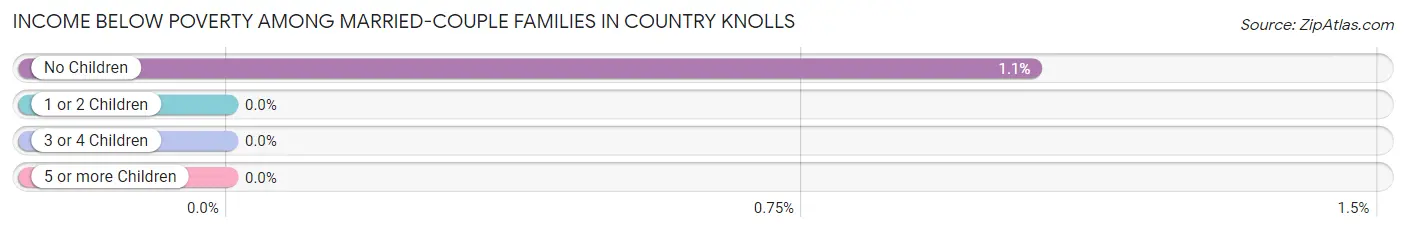
| Children | Above Poverty | Below Poverty |
| No Children | 657 (99.0%) | 7 (1.1%) |
| 1 or 2 Children | 515 (100.0%) | 0 (0.0%) |
| 3 or 4 Children | 111 (100.0%) | 0 (0.0%) |
| 5 or more Children | 0 (0.0%) | 0 (0.0%) |
| Total | 1,283 (99.5%) | 7 (0.5%) |
Income Below Poverty Among Single-Parent Households in Country Knolls
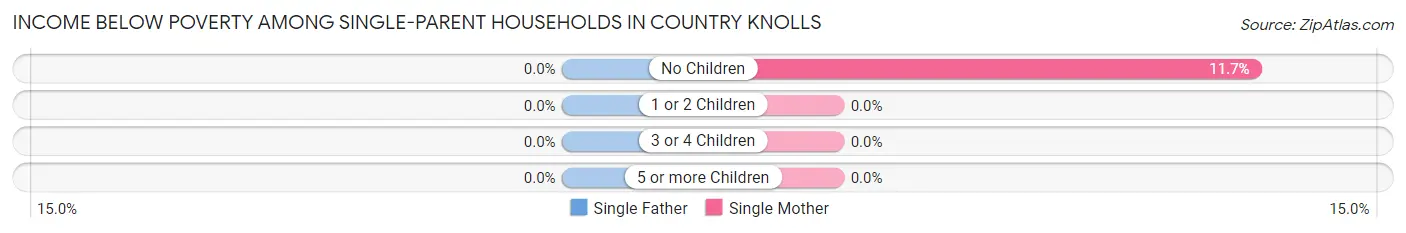
| Children | Single Father | Single Mother |
| No Children | 0 (0.0%) | 7 (11.7%) |
| 1 or 2 Children | 0 (0.0%) | 0 (0.0%) |
| 3 or 4 Children | 0 (0.0%) | 0 (0.0%) |
| 5 or more Children | 0 (0.0%) | 0 (0.0%) |
| Total | 0 (0.0%) | 7 (3.1%) |
Income Below Poverty Among Married-Couple vs Single-Parent Households in Country Knolls
The poverty data for Country Knolls shows that 7 of the married-couple family households (0.5%) and 7 of the single-parent households (2.5%) are living below the poverty level. Within the married-couple family households, those with no children have the highest poverty rate, with 7 households (1.1%) falling below the poverty line. Among the single-parent households, those with no children have the highest poverty rate, with 7 household (7.6%) living below poverty.
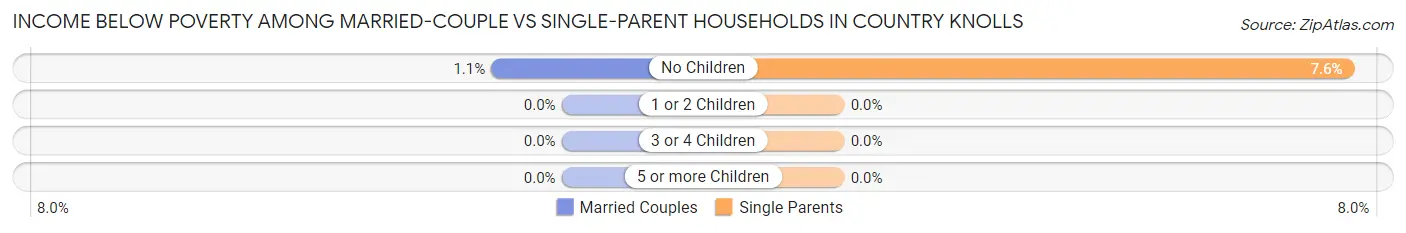
| Children | Married-Couple Families | Single-Parent Households |
| No Children | 7 (1.1%) | 7 (7.6%) |
| 1 or 2 Children | 0 (0.0%) | 0 (0.0%) |
| 3 or 4 Children | 0 (0.0%) | 0 (0.0%) |
| 5 or more Children | 0 (0.0%) | 0 (0.0%) |
| Total | 7 (0.5%) | 7 (2.5%) |
Race in Country Knolls
The most populous races in Country Knolls are White / Caucasian (5,193 | 89.4%), Black / African American (182 | 3.1%), and Asian (176 | 3.0%).
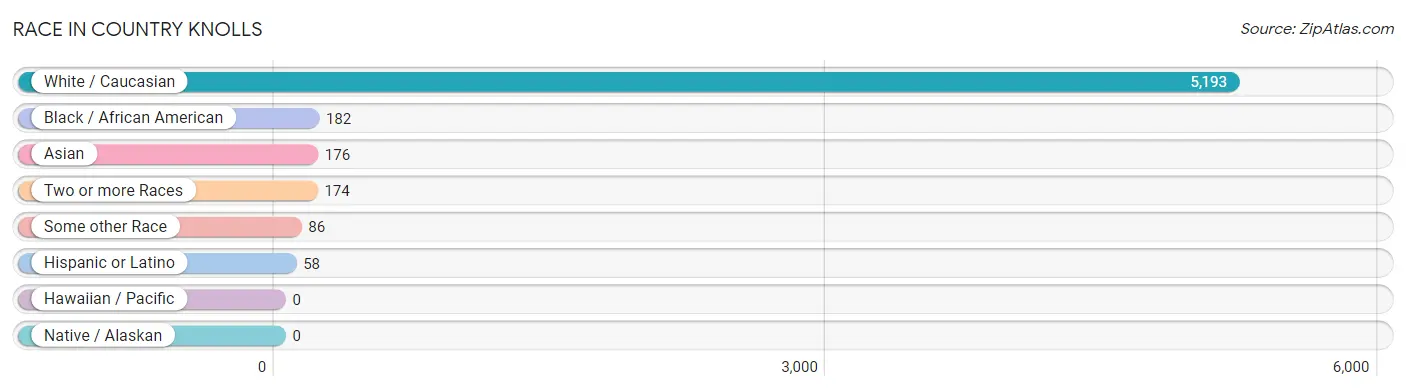
| Race | # Population | % Population |
| Asian | 176 | 3.0% |
| Black / African American | 182 | 3.1% |
| Hawaiian / Pacific | 0 | 0.0% |
| Hispanic or Latino | 58 | 1.0% |
| Native / Alaskan | 0 | 0.0% |
| White / Caucasian | 5,193 | 89.4% |
| Two or more Races | 174 | 3.0% |
| Some other Race | 86 | 1.5% |
| Total | 5,811 | 100.0% |
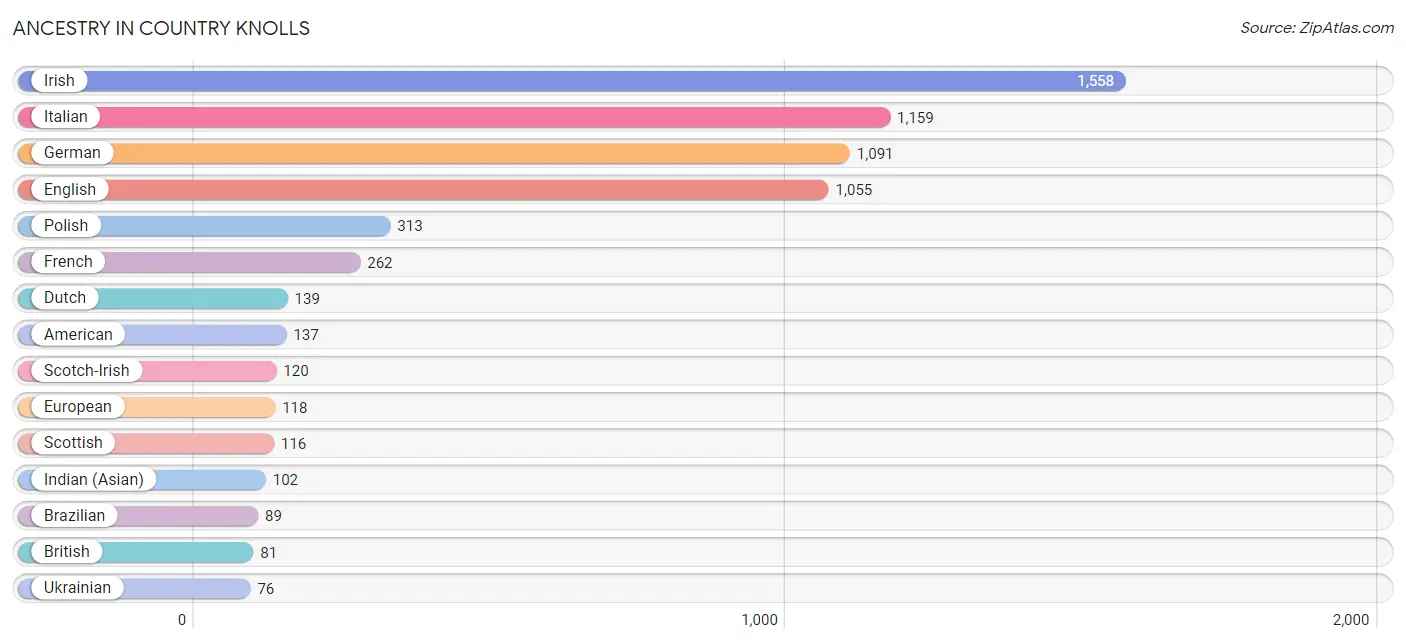
Ancestry in Country Knolls
The most populous ancestries reported in Country Knolls are Irish (1,558 | 26.8%), Italian (1,159 | 19.9%), German (1,091 | 18.8%), English (1,055 | 18.2%), and Polish (313 | 5.4%), together accounting for 89.1% of all Country Knolls residents.
| Ancestry | # Population | % Population |
| Afghan | 60 | 1.0% |
| African | 15 | 0.3% |
| American | 137 | 2.4% |
| Arab | 15 | 0.3% |
| Armenian | 20 | 0.3% |
| Austrian | 6 | 0.1% |
| Brazilian | 89 | 1.5% |
| British | 81 | 1.4% |
| Burmese | 22 | 0.4% |
| Canadian | 10 | 0.2% |
| Croatian | 9 | 0.2% |
| Cuban | 20 | 0.3% |
| Czech | 64 | 1.1% |
| Czechoslovakian | 7 | 0.1% |
| Danish | 51 | 0.9% |
| Dutch | 139 | 2.4% |
| Eastern European | 49 | 0.8% |
| English | 1,055 | 18.2% |
| European | 118 | 2.0% |
| Filipino | 32 | 0.5% |
| French | 262 | 4.5% |
| French Canadian | 38 | 0.6% |
| German | 1,091 | 18.8% |
| Greek | 37 | 0.6% |
| Guyanese | 3 | 0.1% |
| Hungarian | 16 | 0.3% |
| Indian (Asian) | 102 | 1.8% |
| Irish | 1,558 | 26.8% |
| Italian | 1,159 | 19.9% |
| Kenyan | 11 | 0.2% |
| Korean | 35 | 0.6% |
| Latvian | 12 | 0.2% |
| Lebanese | 7 | 0.1% |
| Lithuanian | 48 | 0.8% |
| Macedonian | 8 | 0.1% |
| Mexican | 33 | 0.6% |
| Norwegian | 15 | 0.3% |
| Polish | 313 | 5.4% |
| Portuguese | 7 | 0.1% |
| Puerto Rican | 5 | 0.1% |
| Romanian | 12 | 0.2% |
| Russian | 44 | 0.8% |
| Scandinavian | 12 | 0.2% |
| Scotch-Irish | 120 | 2.1% |
| Scottish | 116 | 2.0% |
| Slavic | 15 | 0.3% |
| Subsaharan African | 26 | 0.4% |
| Swedish | 35 | 0.6% |
| Syrian | 8 | 0.1% |
| Thai | 38 | 0.6% |
| Ukrainian | 76 | 1.3% |
| Welsh | 16 | 0.3% | View All 52 Rows |
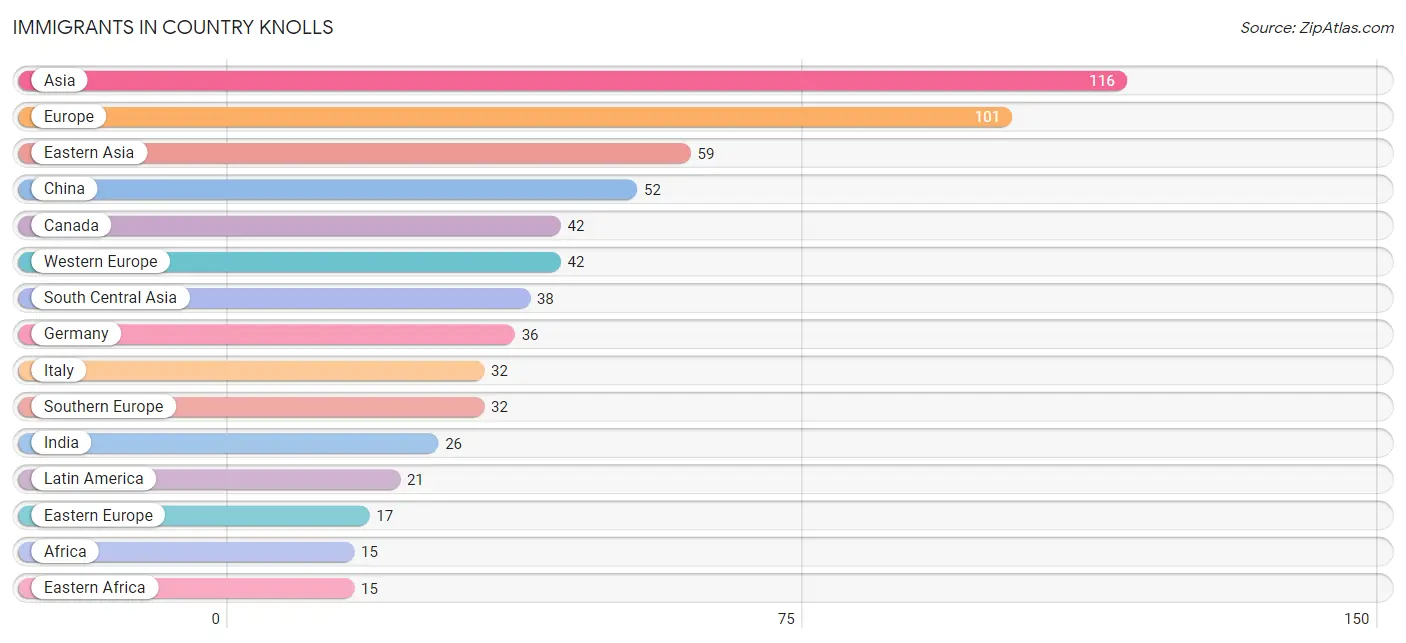
Immigrants in Country Knolls
The most numerous immigrant groups reported in Country Knolls came from Asia (116 | 2.0%), Europe (101 | 1.7%), Eastern Asia (59 | 1.0%), China (52 | 0.9%), and Canada (42 | 0.7%), together accounting for 6.4% of all Country Knolls residents.
| Immigration Origin | # Population | % Population |
| Afghanistan | 12 | 0.2% |
| Africa | 15 | 0.3% |
| Asia | 116 | 2.0% |
| Canada | 42 | 0.7% |
| Caribbean | 11 | 0.2% |
| China | 52 | 0.9% |
| Eastern Africa | 15 | 0.3% |
| Eastern Asia | 59 | 1.0% |
| Eastern Europe | 17 | 0.3% |
| Europe | 101 | 1.7% |
| France | 6 | 0.1% |
| Germany | 36 | 0.6% |
| Guyana | 2 | 0.0% |
| Hong Kong | 6 | 0.1% |
| India | 26 | 0.4% |
| Iraq | 7 | 0.1% |
| Italy | 32 | 0.5% |
| Kenya | 15 | 0.3% |
| Korea | 7 | 0.1% |
| Latin America | 21 | 0.4% |
| Moldova | 11 | 0.2% |
| Northern Europe | 10 | 0.2% |
| Philippines | 12 | 0.2% |
| Scotland | 10 | 0.2% |
| South America | 10 | 0.2% |
| South Central Asia | 38 | 0.6% |
| South Eastern Asia | 12 | 0.2% |
| Southern Europe | 32 | 0.5% |
| Taiwan | 9 | 0.2% |
| Venezuela | 8 | 0.1% |
| Western Asia | 7 | 0.1% |
| Western Europe | 42 | 0.7% | View All 32 Rows |
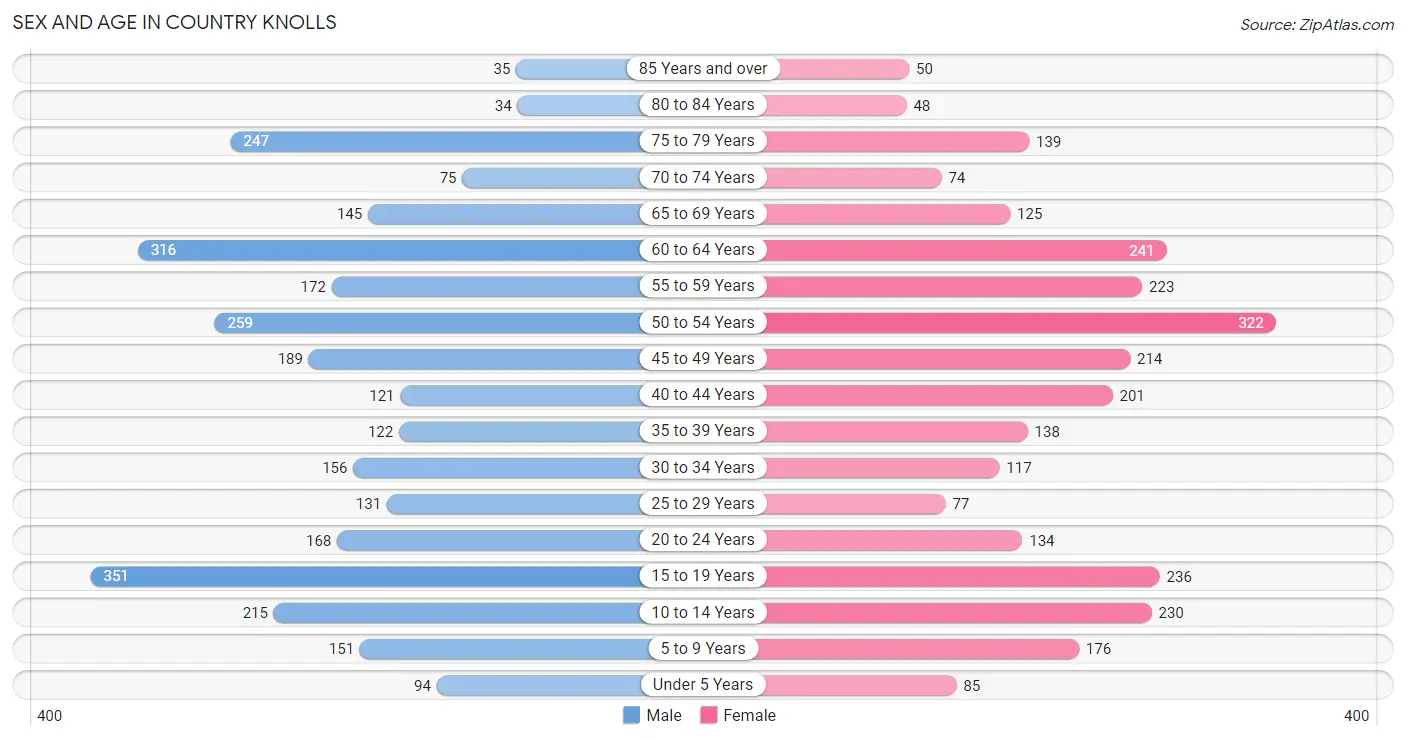
Sex and Age in Country Knolls
Sex and Age in Country Knolls
The most populous age groups in Country Knolls are 15 to 19 Years (351 | 11.8%) for men and 50 to 54 Years (322 | 11.4%) for women.
| Age Bracket | Male | Female |
| Under 5 Years | 94 (3.2%) | 85 (3.0%) |
| 5 to 9 Years | 151 (5.1%) | 176 (6.2%) |
| 10 to 14 Years | 215 (7.2%) | 230 (8.1%) |
| 15 to 19 Years | 351 (11.8%) | 236 (8.3%) |
| 20 to 24 Years | 168 (5.6%) | 134 (4.7%) |
| 25 to 29 Years | 131 (4.4%) | 77 (2.7%) |
| 30 to 34 Years | 156 (5.2%) | 117 (4.1%) |
| 35 to 39 Years | 122 (4.1%) | 138 (4.9%) |
| 40 to 44 Years | 121 (4.1%) | 201 (7.1%) |
| 45 to 49 Years | 189 (6.3%) | 214 (7.6%) |
| 50 to 54 Years | 259 (8.7%) | 322 (11.4%) |
| 55 to 59 Years | 172 (5.8%) | 223 (7.9%) |
| 60 to 64 Years | 316 (10.6%) | 241 (8.5%) |
| 65 to 69 Years | 145 (4.9%) | 125 (4.4%) |
| 70 to 74 Years | 75 (2.5%) | 74 (2.6%) |
| 75 to 79 Years | 247 (8.3%) | 139 (4.9%) |
| 80 to 84 Years | 34 (1.1%) | 48 (1.7%) |
| 85 Years and over | 35 (1.2%) | 50 (1.8%) |
| Total | 2,981 (100.0%) | 2,830 (100.0%) |
Families and Households in Country Knolls
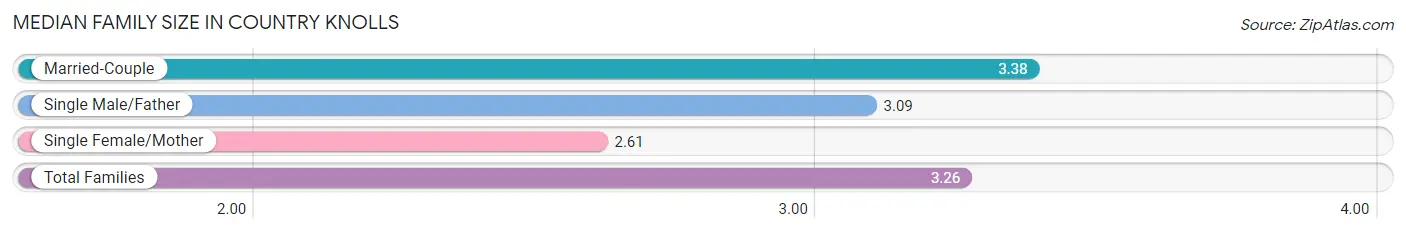
Median Family Size in Country Knolls
The median family size in Country Knolls is 3.26 persons per family, with married-couple families (1,290 | 82.3%) accounting for the largest median family size of 3.38 persons per family. On the other hand, single female/mother families (224 | 14.3%) represent the smallest median family size with 2.61 persons per family.
| Family Type | # Families | Family Size |
| Married-Couple | 1,290 (82.3%) | 3.38 |
| Single Male/Father | 53 (3.4%) | 3.09 |
| Single Female/Mother | 224 (14.3%) | 2.61 |
| Total Families | 1,567 (100.0%) | 3.26 |
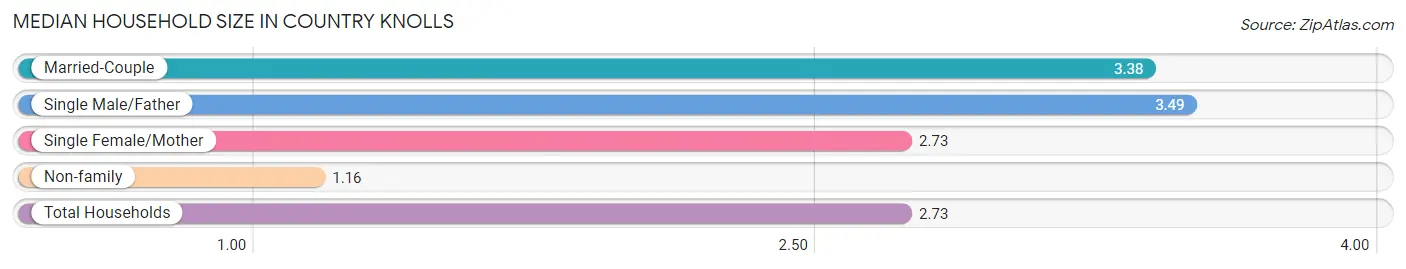
Median Household Size in Country Knolls
The median household size in Country Knolls is 2.73 persons per household, with single male/father households (53 | 2.5%) accounting for the largest median household size of 3.49 persons per household. non-family households (561 | 26.4%) represent the smallest median household size with 1.16 persons per household.
| Household Type | # Households | Household Size |
| Married-Couple | 1,290 (60.6%) | 3.38 |
| Single Male/Father | 53 (2.5%) | 3.49 |
| Single Female/Mother | 224 (10.5%) | 2.73 |
| Non-family | 561 (26.4%) | 1.16 |
| Total Households | 2,128 (100.0%) | 2.73 |
Household Size by Marriage Status in Country Knolls
Out of a total of 2,128 households in Country Knolls, 1,567 (73.6%) are family households, while 561 (26.4%) are nonfamily households. The most numerous type of family households are 2-person households, comprising 588, and the most common type of nonfamily households are 1-person households, comprising 476.
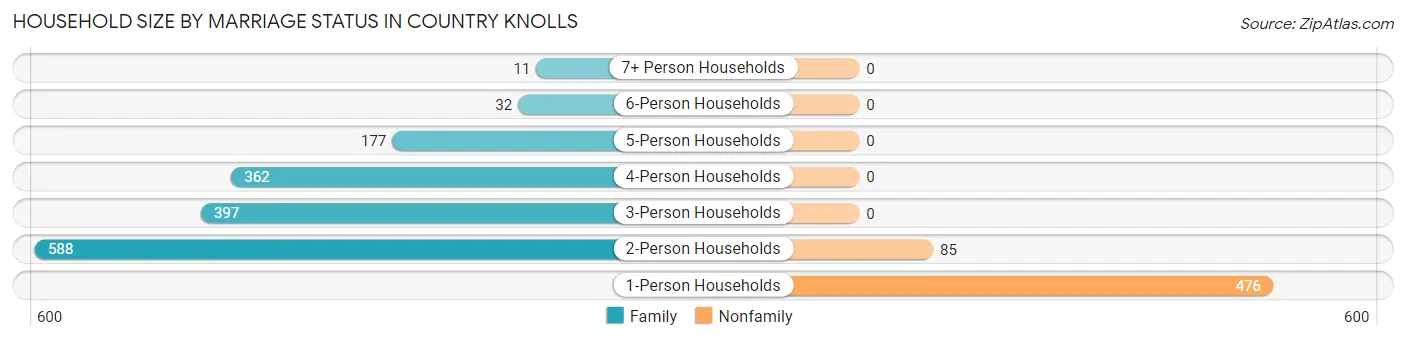
| Household Size | Family Households | Nonfamily Households |
| 1-Person Households | - | 476 (22.4%) |
| 2-Person Households | 588 (27.6%) | 85 (4.0%) |
| 3-Person Households | 397 (18.7%) | 0 (0.0%) |
| 4-Person Households | 362 (17.0%) | 0 (0.0%) |
| 5-Person Households | 177 (8.3%) | 0 (0.0%) |
| 6-Person Households | 32 (1.5%) | 0 (0.0%) |
| 7+ Person Households | 11 (0.5%) | 0 (0.0%) |
| Total | 1,567 (73.6%) | 561 (26.4%) |
Female Fertility in Country Knolls
Fertility by Age in Country Knolls
Average fertility rate in Country Knolls is 13.0 births per 1,000 women. Women in the age bracket of 20 to 34 years have the highest fertility rate with 49.0 births per 1,000 women. Women in the age bracket of 20 to 34 years acount for 100.0% of all women with births.
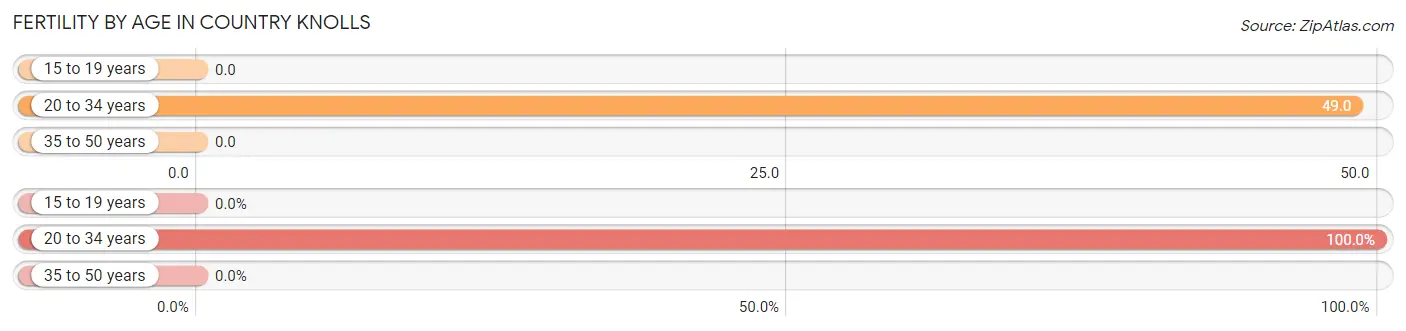
| Age Bracket | Women with Births | Births / 1,000 Women |
| 15 to 19 years | 0 (0.0%) | 0.0 |
| 20 to 34 years | 16 (100.0%) | 49.0 |
| 35 to 50 years | 0 (0.0%) | 0.0 |
| Total | 16 (100.0%) | 13.0 |
Fertility by Age by Marriage Status in Country Knolls
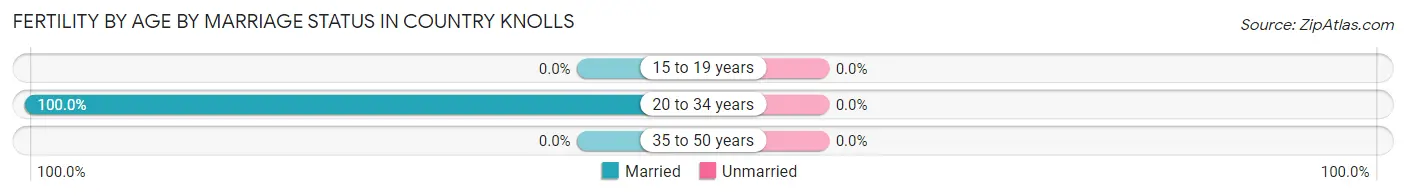
| Age Bracket | Married | Unmarried |
| 15 to 19 years | 0 (0.0%) | 0 (0.0%) |
| 20 to 34 years | 16 (100.0%) | 0 (0.0%) |
| 35 to 50 years | 0 (0.0%) | 0 (0.0%) |
| Total | 16 (100.0%) | 0 (0.0%) |
Fertility by Education in Country Knolls
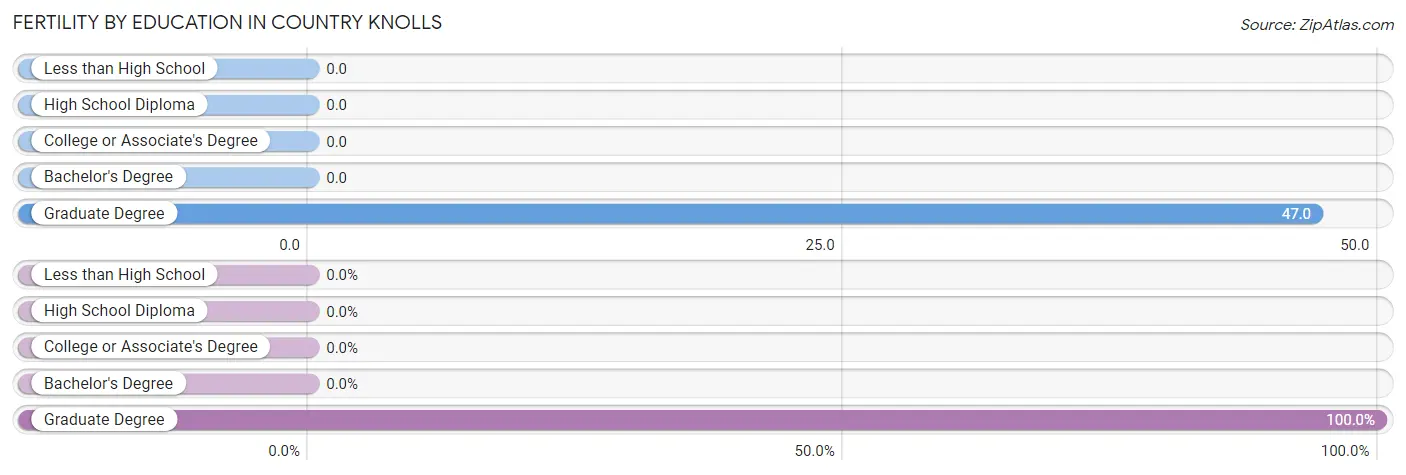
| Educational Attainment | Women with Births | Births / 1,000 Women |
| Less than High School | 0 (0.0%) | 0.0 |
| High School Diploma | 0 (0.0%) | 0.0 |
| College or Associate's Degree | 0 (0.0%) | 0.0 |
| Bachelor's Degree | 0 (0.0%) | 0.0 |
| Graduate Degree | 16 (100.0%) | 47.0 |
| Total | 16 (100.0%) | 13.0 |
Fertility by Education by Marriage Status in Country Knolls
| Educational Attainment | Married | Unmarried |
| Less than High School | 0 (0.0%) | 0 (0.0%) |
| High School Diploma | 0 (0.0%) | 0 (0.0%) |
| College or Associate's Degree | 0 (0.0%) | 0 (0.0%) |
| Bachelor's Degree | 0 (0.0%) | 0 (0.0%) |
| Graduate Degree | 16 (100.0%) | 0 (0.0%) |
| Total | 16 (100.0%) | 0 (0.0%) |
Employment Characteristics in Country Knolls
Employment by Class of Employer in Country Knolls
Among the 3,076 employed individuals in Country Knolls, private company employees (1,968 | 64.0%), local government employees (324 | 10.5%), and not-for-profit organizations (295 | 9.6%) make up the most common classes of employment.
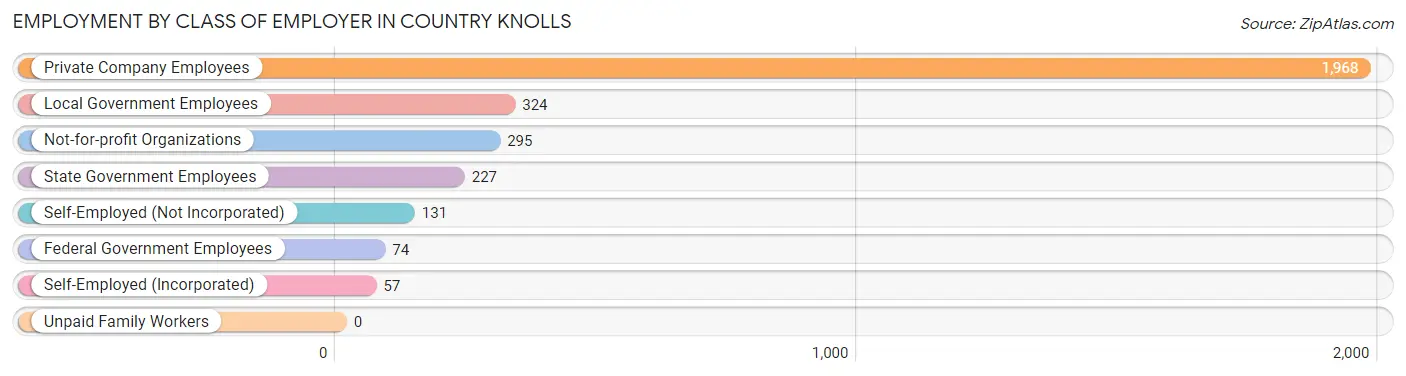
| Employer Class | # Employees | % Employees |
| Private Company Employees | 1,968 | 64.0% |
| Self-Employed (Incorporated) | 57 | 1.8% |
| Self-Employed (Not Incorporated) | 131 | 4.3% |
| Not-for-profit Organizations | 295 | 9.6% |
| Local Government Employees | 324 | 10.5% |
| State Government Employees | 227 | 7.4% |
| Federal Government Employees | 74 | 2.4% |
| Unpaid Family Workers | 0 | 0.0% |
| Total | 3,076 | 100.0% |
Employment Status by Age in Country Knolls
According to the labor force statistics for Country Knolls, out of the total population over 16 years of age (4,776), 65.2% or 3,114 individuals are in the labor force, with 1.2% or 37 of them unemployed. The age group with the highest labor force participation rate is 30 to 34 years, with 96.0% or 262 individuals in the labor force. Within the labor force, the 25 to 29 years age range has the highest percentage of unemployed individuals, with 11.2% or 22 of them being unemployed.
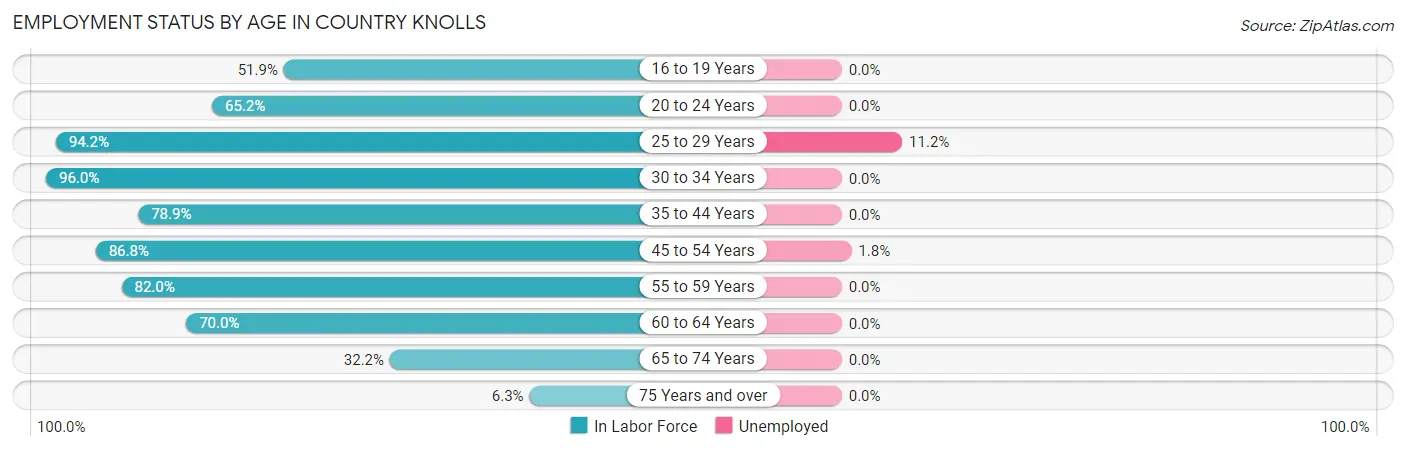
| Age Bracket | In Labor Force | Unemployed |
| 16 to 19 Years | 261 (51.9%) | 0 (0.0%) |
| 20 to 24 Years | 197 (65.2%) | 0 (0.0%) |
| 25 to 29 Years | 196 (94.2%) | 22 (11.2%) |
| 30 to 34 Years | 262 (96.0%) | 0 (0.0%) |
| 35 to 44 Years | 459 (78.9%) | 0 (0.0%) |
| 45 to 54 Years | 854 (86.8%) | 15 (1.8%) |
| 55 to 59 Years | 324 (82.0%) | 0 (0.0%) |
| 60 to 64 Years | 390 (70.0%) | 0 (0.0%) |
| 65 to 74 Years | 135 (32.2%) | 0 (0.0%) |
| 75 Years and over | 35 (6.3%) | 0 (0.0%) |
| Total | 3,114 (65.2%) | 37 (1.2%) |
Employment Status by Educational Attainment in Country Knolls
According to labor force statistics for Country Knolls, 82.9% of individuals (2,486) out of the total population between 25 and 64 years of age (2,999) are in the labor force, with 1.5% or 37 of them being unemployed. The group with the highest labor force participation rate are those with the educational attainment of bachelor's degree or higher, with 85.6% or 1,560 individuals in the labor force. Within the labor force, individuals with college / associate degree education have the highest percentage of unemployment, with 1.7% or 10 of them being unemployed.
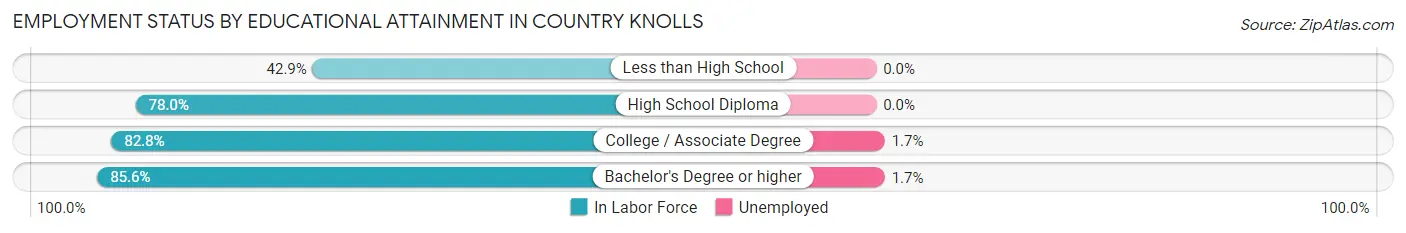
| Educational Attainment | In Labor Force | Unemployed |
| Less than High School | 33 (42.9%) | 0 (0.0%) |
| High School Diploma | 308 (78.0%) | 0 (0.0%) |
| College / Associate Degree | 584 (82.8%) | 12 (1.7%) |
| Bachelor's Degree or higher | 1,560 (85.6%) | 31 (1.7%) |
| Total | 2,486 (82.9%) | 45 (1.5%) |
Employment Occupations by Sex in Country Knolls
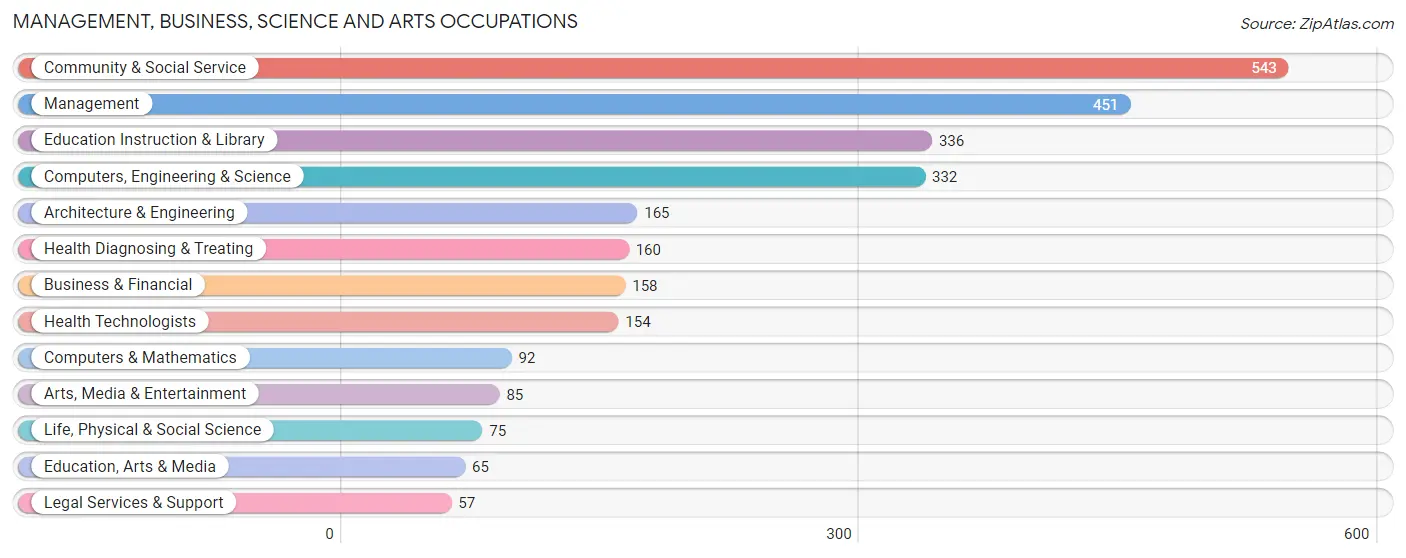
Management, Business, Science and Arts Occupations
The most common Management, Business, Science and Arts occupations in Country Knolls are Community & Social Service (543 | 17.6%), Management (451 | 14.7%), Education Instruction & Library (336 | 10.9%), Computers, Engineering & Science (332 | 10.8%), and Architecture & Engineering (165 | 5.4%).
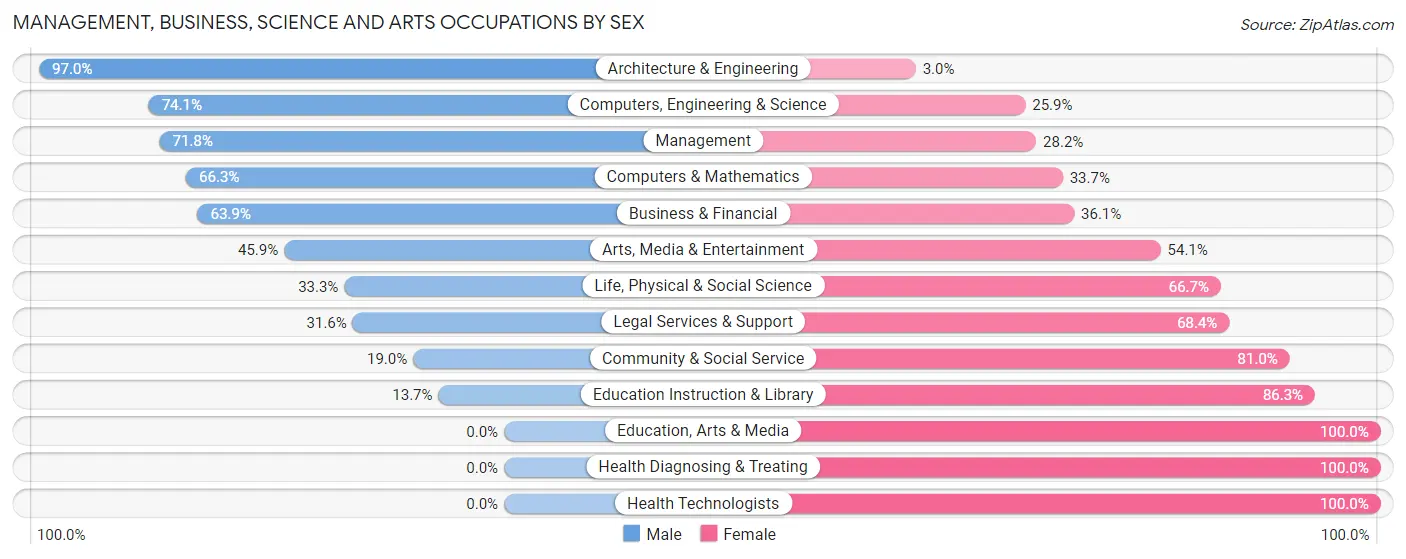
Management, Business, Science and Arts Occupations by Sex
Within the Management, Business, Science and Arts occupations in Country Knolls, the most male-oriented occupations are Architecture & Engineering (97.0%), Computers, Engineering & Science (74.1%), and Management (71.8%), while the most female-oriented occupations are Education, Arts & Media (100.0%), Health Diagnosing & Treating (100.0%), and Health Technologists (100.0%).
| Occupation | Male | Female |
| Management | 324 (71.8%) | 127 (28.2%) |
| Business & Financial | 101 (63.9%) | 57 (36.1%) |
| Computers, Engineering & Science | 246 (74.1%) | 86 (25.9%) |
| Computers & Mathematics | 61 (66.3%) | 31 (33.7%) |
| Architecture & Engineering | 160 (97.0%) | 5 (3.0%) |
| Life, Physical & Social Science | 25 (33.3%) | 50 (66.7%) |
| Community & Social Service | 103 (19.0%) | 440 (81.0%) |
| Education, Arts & Media | 0 (0.0%) | 65 (100.0%) |
| Legal Services & Support | 18 (31.6%) | 39 (68.4%) |
| Education Instruction & Library | 46 (13.7%) | 290 (86.3%) |
| Arts, Media & Entertainment | 39 (45.9%) | 46 (54.1%) |
| Health Diagnosing & Treating | 0 (0.0%) | 160 (100.0%) |
| Health Technologists | 0 (0.0%) | 154 (100.0%) |
| Total (Category) | 774 (47.1%) | 870 (52.9%) |
| Total (Overall) | 1,495 (48.6%) | 1,581 (51.4%) |
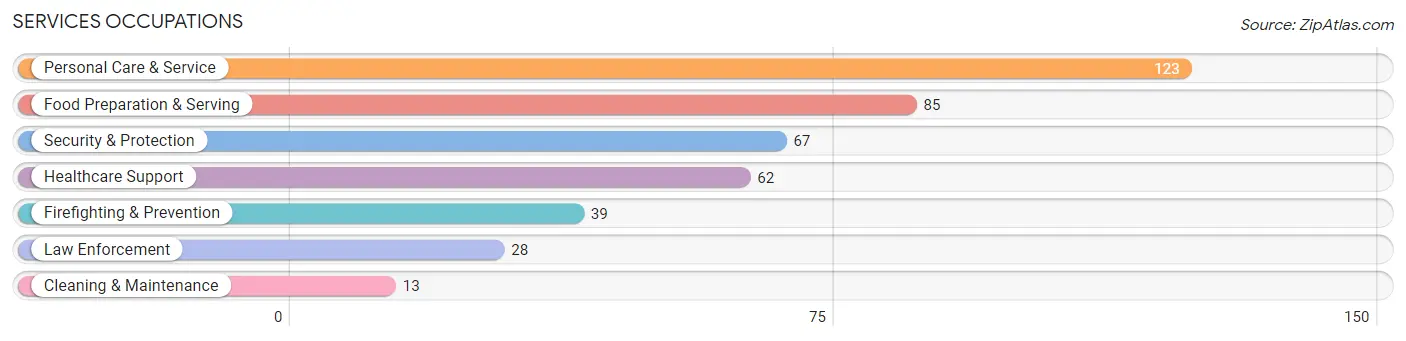
Services Occupations
The most common Services occupations in Country Knolls are Personal Care & Service (123 | 4.0%), Food Preparation & Serving (85 | 2.8%), Security & Protection (67 | 2.2%), Healthcare Support (62 | 2.0%), and Firefighting & Prevention (39 | 1.3%).
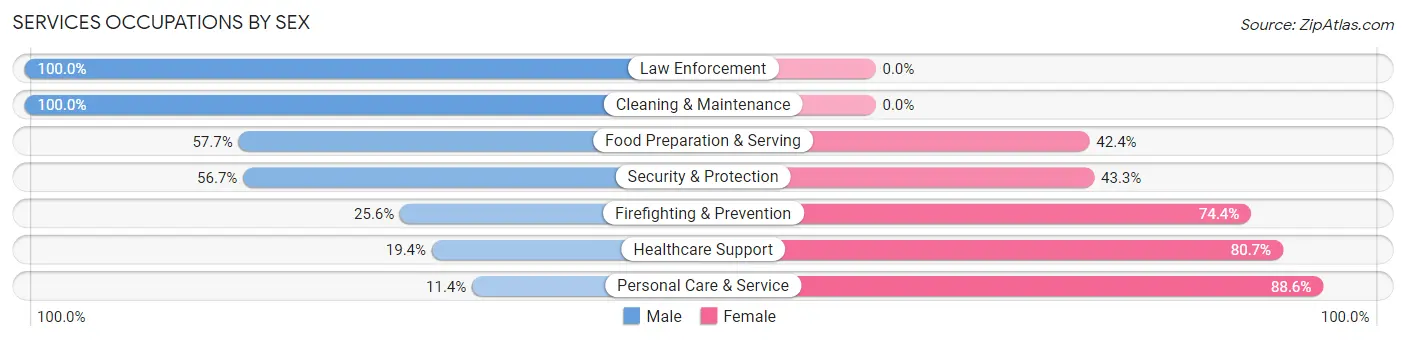
Services Occupations by Sex
Within the Services occupations in Country Knolls, the most male-oriented occupations are Law Enforcement (100.0%), Cleaning & Maintenance (100.0%), and Food Preparation & Serving (57.7%), while the most female-oriented occupations are Personal Care & Service (88.6%), Healthcare Support (80.6%), and Firefighting & Prevention (74.4%).
| Occupation | Male | Female |
| Healthcare Support | 12 (19.4%) | 50 (80.6%) |
| Security & Protection | 38 (56.7%) | 29 (43.3%) |
| Firefighting & Prevention | 10 (25.6%) | 29 (74.4%) |
| Law Enforcement | 28 (100.0%) | 0 (0.0%) |
| Food Preparation & Serving | 49 (57.7%) | 36 (42.3%) |
| Cleaning & Maintenance | 13 (100.0%) | 0 (0.0%) |
| Personal Care & Service | 14 (11.4%) | 109 (88.6%) |
| Total (Category) | 126 (36.0%) | 224 (64.0%) |
| Total (Overall) | 1,495 (48.6%) | 1,581 (51.4%) |
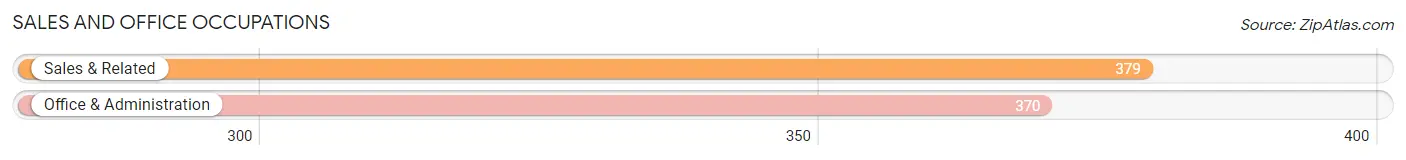
Sales and Office Occupations
The most common Sales and Office occupations in Country Knolls are Sales & Related (379 | 12.3%), and Office & Administration (370 | 12.0%).
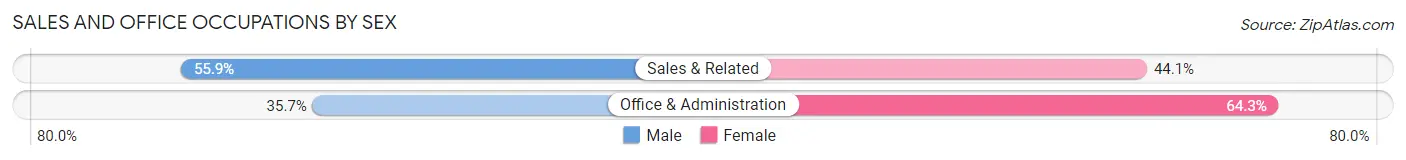
Sales and Office Occupations by Sex
| Occupation | Male | Female |
| Sales & Related | 212 (55.9%) | 167 (44.1%) |
| Office & Administration | 132 (35.7%) | 238 (64.3%) |
| Total (Category) | 344 (45.9%) | 405 (54.1%) |
| Total (Overall) | 1,495 (48.6%) | 1,581 (51.4%) |
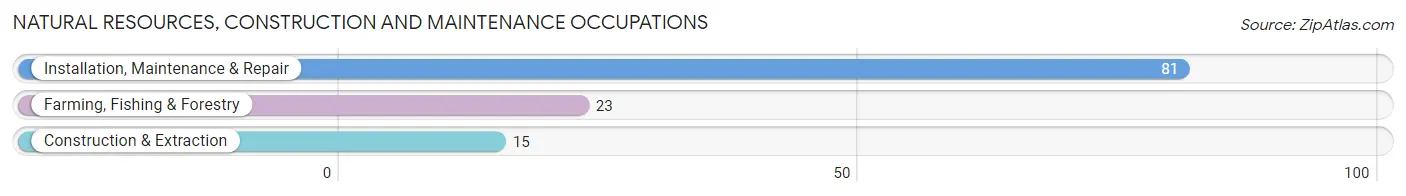
Natural Resources, Construction and Maintenance Occupations
The most common Natural Resources, Construction and Maintenance occupations in Country Knolls are Installation, Maintenance & Repair (81 | 2.6%), Farming, Fishing & Forestry (23 | 0.7%), and Construction & Extraction (15 | 0.5%).
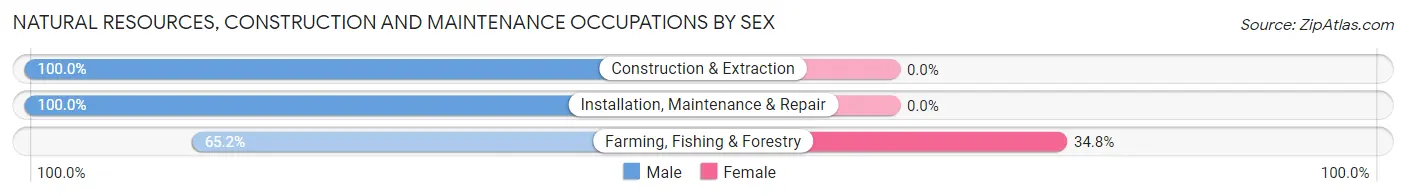
Natural Resources, Construction and Maintenance Occupations by Sex
| Occupation | Male | Female |
| Farming, Fishing & Forestry | 15 (65.2%) | 8 (34.8%) |
| Construction & Extraction | 15 (100.0%) | 0 (0.0%) |
| Installation, Maintenance & Repair | 81 (100.0%) | 0 (0.0%) |
| Total (Category) | 111 (93.3%) | 8 (6.7%) |
| Total (Overall) | 1,495 (48.6%) | 1,581 (51.4%) |
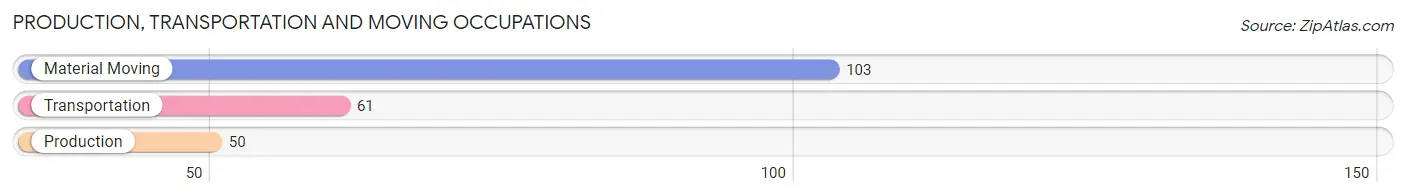
Production, Transportation and Moving Occupations
The most common Production, Transportation and Moving occupations in Country Knolls are Material Moving (103 | 3.4%), Transportation (61 | 2.0%), and Production (50 | 1.6%).
Production, Transportation and Moving Occupations by Sex
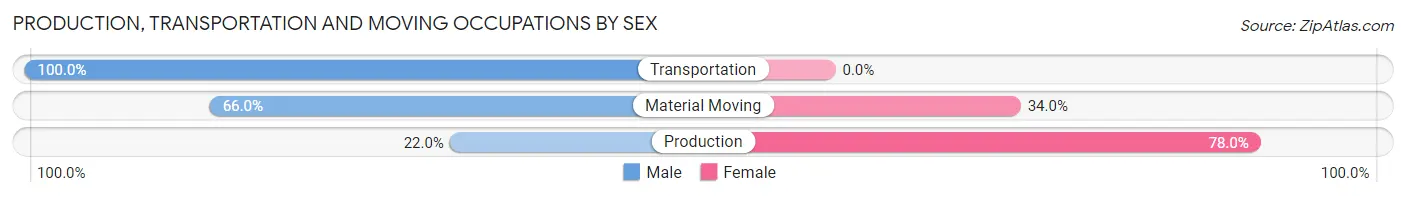
| Occupation | Male | Female |
| Production | 11 (22.0%) | 39 (78.0%) |
| Transportation | 61 (100.0%) | 0 (0.0%) |
| Material Moving | 68 (66.0%) | 35 (34.0%) |
| Total (Category) | 140 (65.4%) | 74 (34.6%) |
| Total (Overall) | 1,495 (48.6%) | 1,581 (51.4%) |
Employment Industries by Sex in Country Knolls
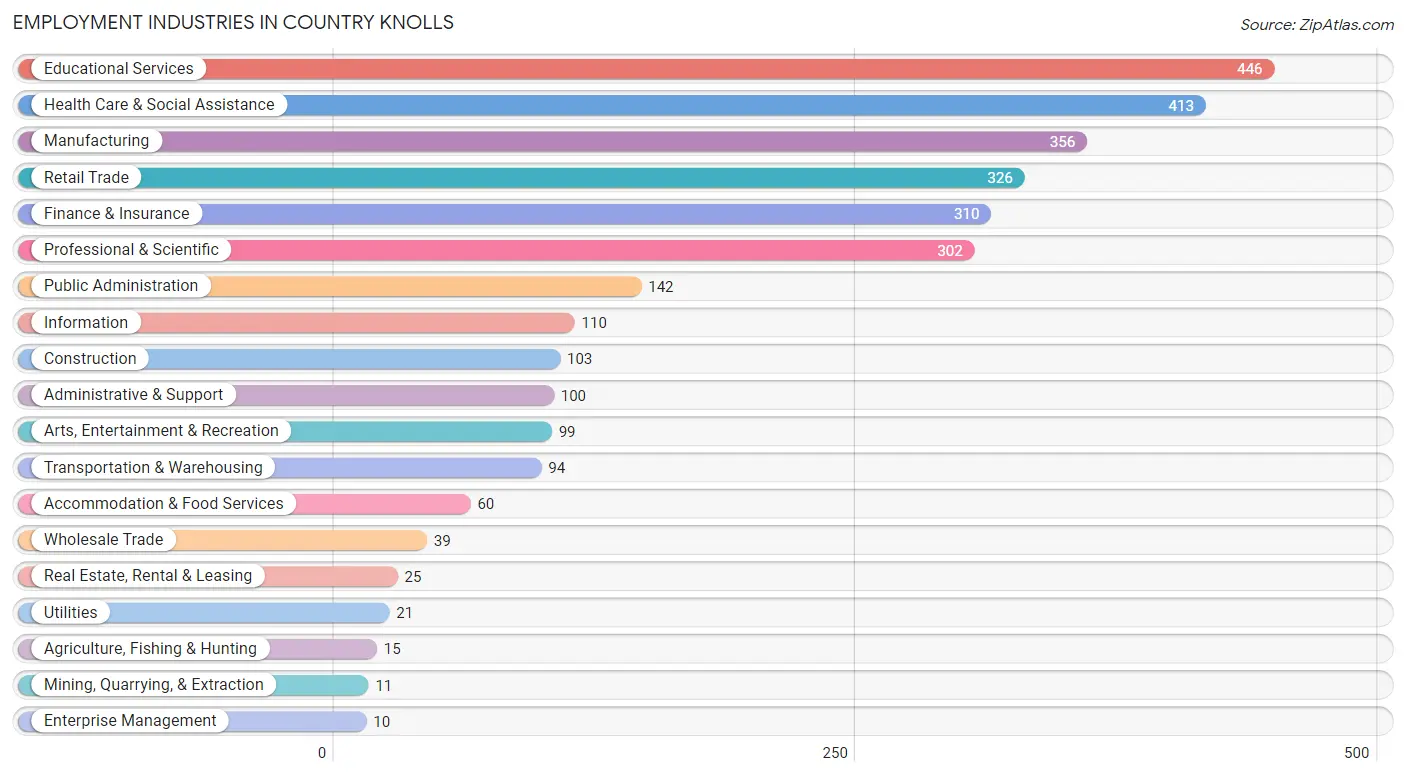
Employment Industries in Country Knolls
The major employment industries in Country Knolls include Educational Services (446 | 14.5%), Health Care & Social Assistance (413 | 13.4%), Manufacturing (356 | 11.6%), Retail Trade (326 | 10.6%), and Finance & Insurance (310 | 10.1%).
Employment Industries by Sex in Country Knolls
The Country Knolls industries that see more men than women are Agriculture, Fishing & Hunting (100.0%), Mining, Quarrying, & Extraction (100.0%), and Transportation & Warehousing (100.0%), whereas the industries that tend to have a higher number of women are Enterprise Management (100.0%), Health Care & Social Assistance (79.7%), and Arts, Entertainment & Recreation (75.8%).
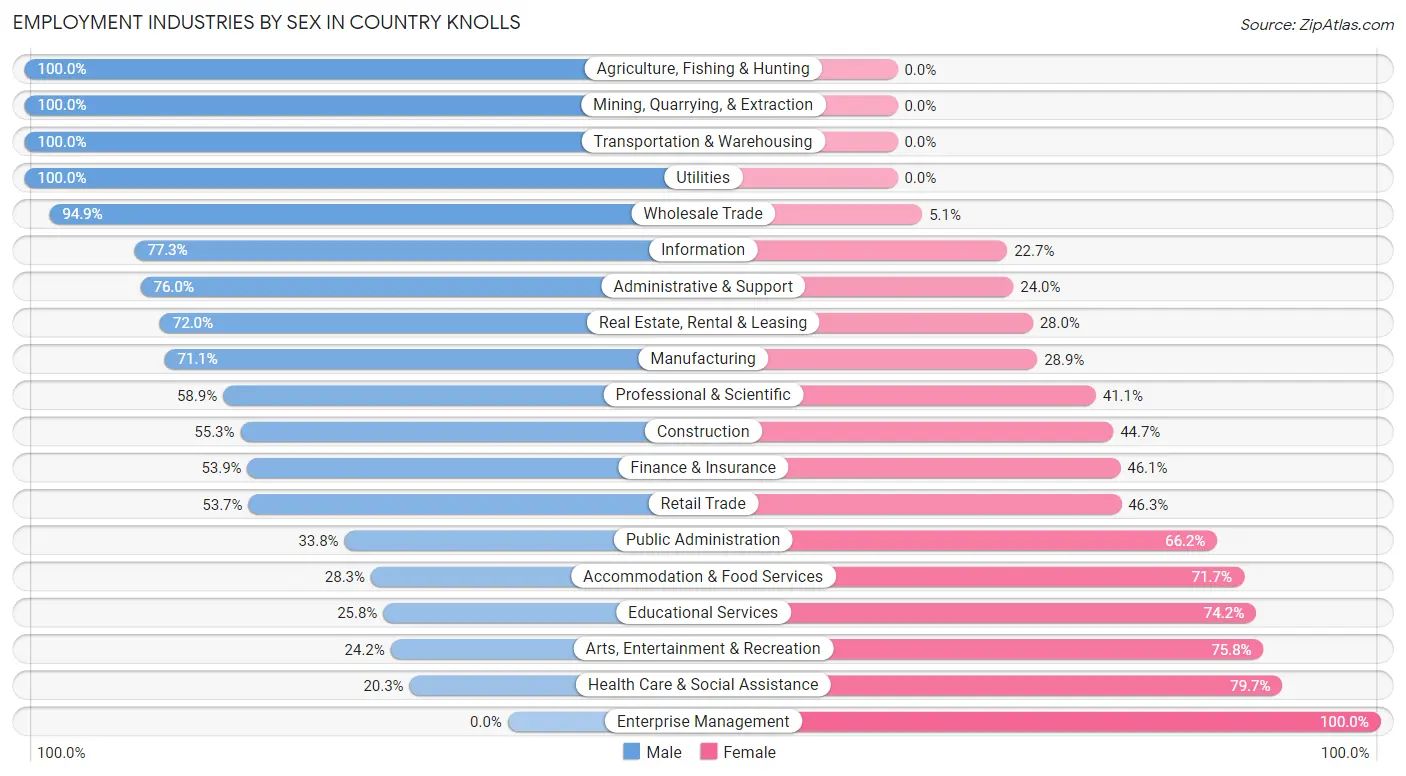
| Industry | Male | Female |
| Agriculture, Fishing & Hunting | 15 (100.0%) | 0 (0.0%) |
| Mining, Quarrying, & Extraction | 11 (100.0%) | 0 (0.0%) |
| Construction | 57 (55.3%) | 46 (44.7%) |
| Manufacturing | 253 (71.1%) | 103 (28.9%) |
| Wholesale Trade | 37 (94.9%) | 2 (5.1%) |
| Retail Trade | 175 (53.7%) | 151 (46.3%) |
| Transportation & Warehousing | 94 (100.0%) | 0 (0.0%) |
| Utilities | 21 (100.0%) | 0 (0.0%) |
| Information | 85 (77.3%) | 25 (22.7%) |
| Finance & Insurance | 167 (53.9%) | 143 (46.1%) |
| Real Estate, Rental & Leasing | 18 (72.0%) | 7 (28.0%) |
| Professional & Scientific | 178 (58.9%) | 124 (41.1%) |
| Enterprise Management | 0 (0.0%) | 10 (100.0%) |
| Administrative & Support | 76 (76.0%) | 24 (24.0%) |
| Educational Services | 115 (25.8%) | 331 (74.2%) |
| Health Care & Social Assistance | 84 (20.3%) | 329 (79.7%) |
| Arts, Entertainment & Recreation | 24 (24.2%) | 75 (75.8%) |
| Accommodation & Food Services | 17 (28.3%) | 43 (71.7%) |
| Public Administration | 48 (33.8%) | 94 (66.2%) |
| Total | 1,495 (48.6%) | 1,581 (51.4%) |
Education in Country Knolls
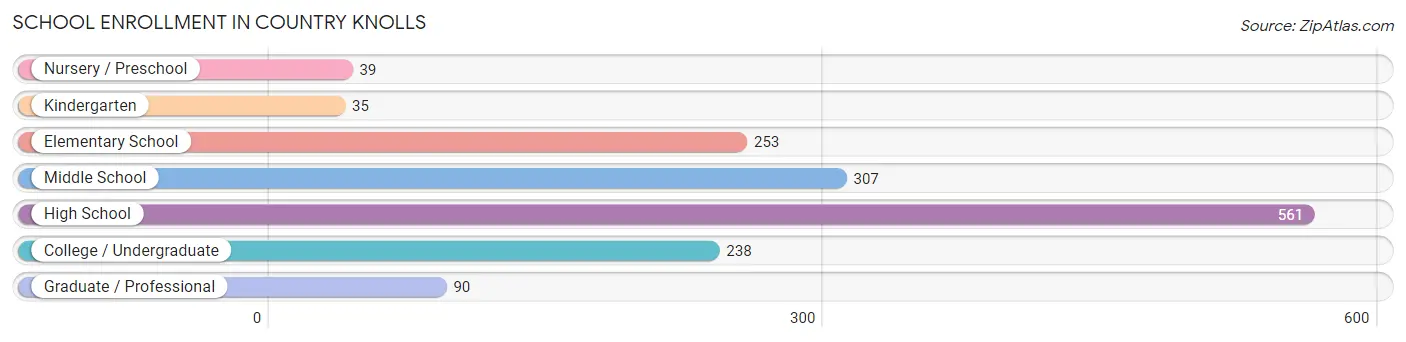
School Enrollment in Country Knolls
The most common levels of schooling among the 1,523 students in Country Knolls are high school (561 | 36.8%), middle school (307 | 20.2%), and elementary school (253 | 16.6%).
| School Level | # Students | % Students |
| Nursery / Preschool | 39 | 2.6% |
| Kindergarten | 35 | 2.3% |
| Elementary School | 253 | 16.6% |
| Middle School | 307 | 20.2% |
| High School | 561 | 36.8% |
| College / Undergraduate | 238 | 15.6% |
| Graduate / Professional | 90 | 5.9% |
| Total | 1,523 | 100.0% |
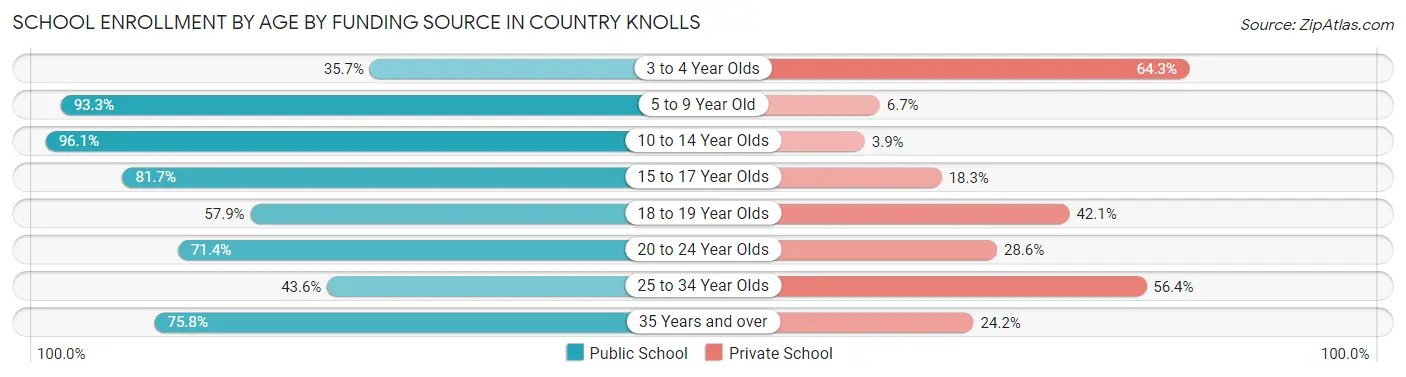
School Enrollment by Age by Funding Source in Country Knolls
Out of a total of 1,523 students who are enrolled in schools in Country Knolls, 265 (17.4%) attend a private institution, while the remaining 1,258 (82.6%) are enrolled in public schools. The age group of 3 to 4 year olds has the highest likelihood of being enrolled in private schools, with 18 (64.3% in the age bracket) enrolled. Conversely, the age group of 10 to 14 year olds has the lowest likelihood of being enrolled in a private school, with 390 (96.1% in the age bracket) attending a public institution.
| Age Bracket | Public School | Private School |
| 3 to 4 Year Olds | 10 (35.7%) | 18 (64.3%) |
| 5 to 9 Year Old | 249 (93.3%) | 18 (6.7%) |
| 10 to 14 Year Olds | 390 (96.1%) | 16 (3.9%) |
| 15 to 17 Year Olds | 376 (81.7%) | 84 (18.3%) |
| 18 to 19 Year Olds | 62 (57.9%) | 45 (42.1%) |
| 20 to 24 Year Olds | 75 (71.4%) | 30 (28.6%) |
| 25 to 34 Year Olds | 24 (43.6%) | 31 (56.4%) |
| 35 Years and over | 72 (75.8%) | 23 (24.2%) |
| Total | 1,258 (82.6%) | 265 (17.4%) |
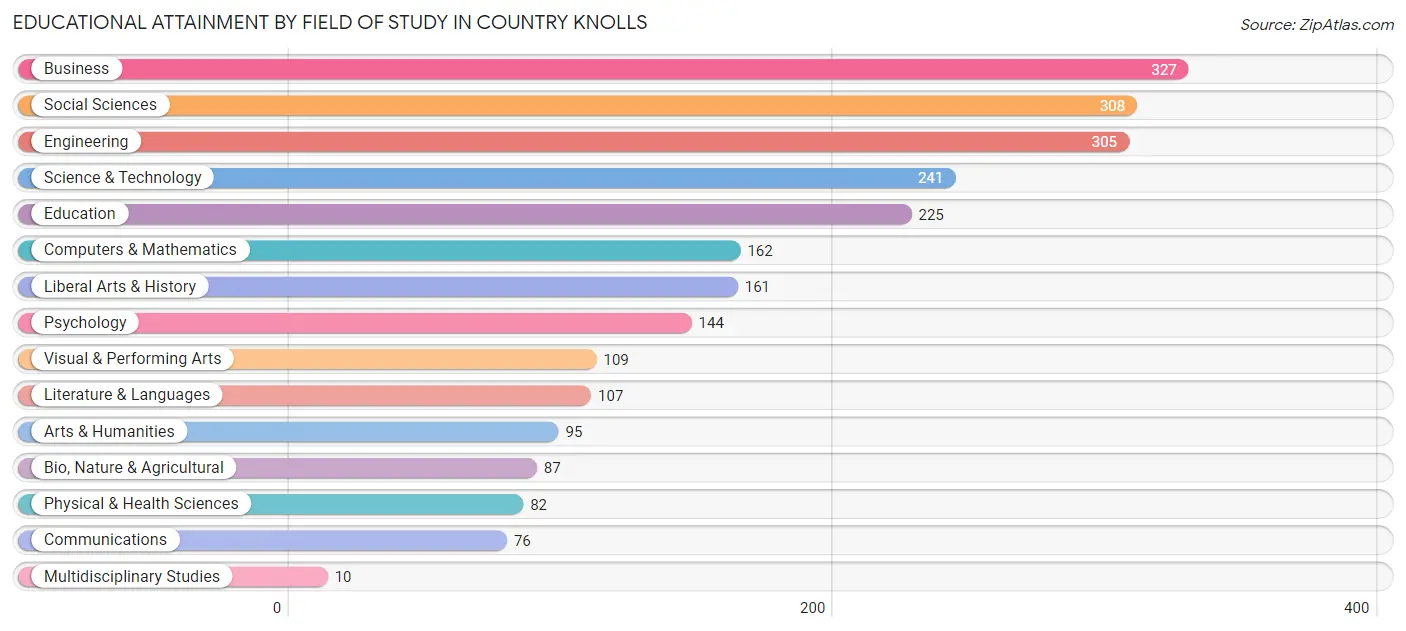
Educational Attainment by Field of Study in Country Knolls
Business (327 | 13.4%), social sciences (308 | 12.6%), engineering (305 | 12.5%), science & technology (241 | 9.9%), and education (225 | 9.2%) are the most common fields of study among 2,439 individuals in Country Knolls who have obtained a bachelor's degree or higher.
| Field of Study | # Graduates | % Graduates |
| Computers & Mathematics | 162 | 6.6% |
| Bio, Nature & Agricultural | 87 | 3.6% |
| Physical & Health Sciences | 82 | 3.4% |
| Psychology | 144 | 5.9% |
| Social Sciences | 308 | 12.6% |
| Engineering | 305 | 12.5% |
| Multidisciplinary Studies | 10 | 0.4% |
| Science & Technology | 241 | 9.9% |
| Business | 327 | 13.4% |
| Education | 225 | 9.2% |
| Literature & Languages | 107 | 4.4% |
| Liberal Arts & History | 161 | 6.6% |
| Visual & Performing Arts | 109 | 4.5% |
| Communications | 76 | 3.1% |
| Arts & Humanities | 95 | 3.9% |
| Total | 2,439 | 100.0% |
Transportation & Commute in Country Knolls
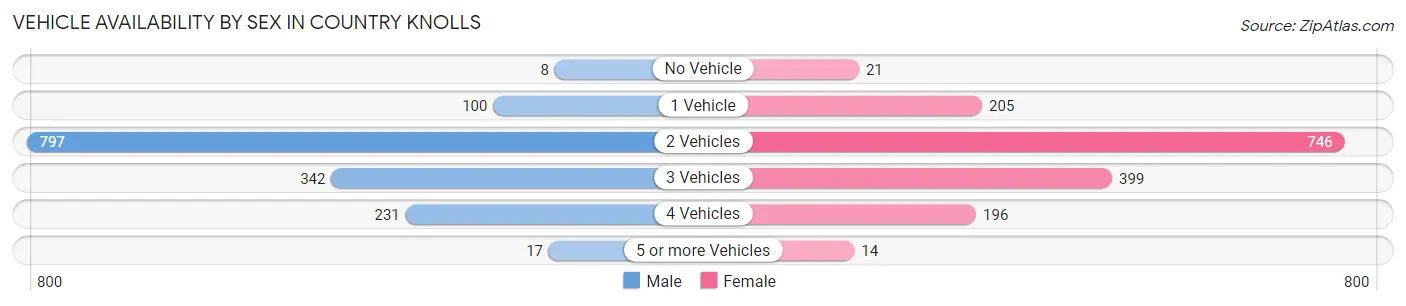
Vehicle Availability by Sex in Country Knolls
The most prevalent vehicle ownership categories in Country Knolls are males with 2 vehicles (797, accounting for 53.3%) and females with 2 vehicles (746, making up 50.4%).
| Vehicles Available | Male | Female |
| No Vehicle | 8 (0.5%) | 21 (1.3%) |
| 1 Vehicle | 100 (6.7%) | 205 (13.0%) |
| 2 Vehicles | 797 (53.3%) | 746 (47.2%) |
| 3 Vehicles | 342 (22.9%) | 399 (25.2%) |
| 4 Vehicles | 231 (15.4%) | 196 (12.4%) |
| 5 or more Vehicles | 17 (1.1%) | 14 (0.9%) |
| Total | 1,495 (100.0%) | 1,581 (100.0%) |
Commute Time in Country Knolls
The most frequently occuring commute durations in Country Knolls are 30 to 34 minutes (611 commuters, 23.3%), 10 to 14 minutes (533 commuters, 20.3%), and 20 to 24 minutes (368 commuters, 14.0%).
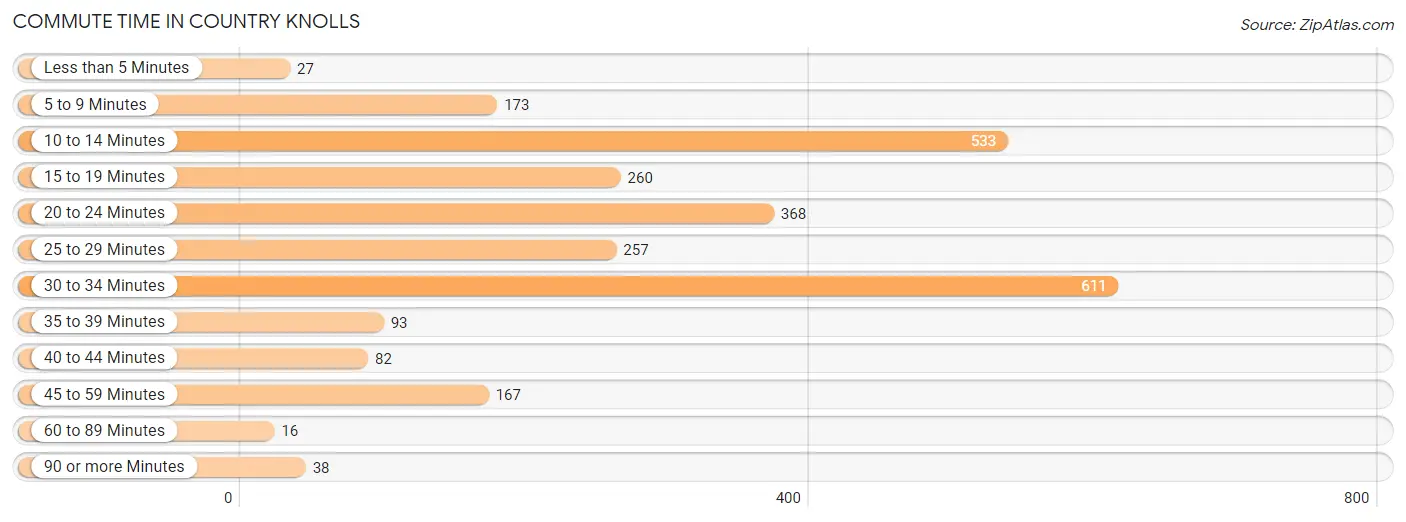
| Commute Time | # Commuters | % Commuters |
| Less than 5 Minutes | 27 | 1.0% |
| 5 to 9 Minutes | 173 | 6.6% |
| 10 to 14 Minutes | 533 | 20.3% |
| 15 to 19 Minutes | 260 | 9.9% |
| 20 to 24 Minutes | 368 | 14.0% |
| 25 to 29 Minutes | 257 | 9.8% |
| 30 to 34 Minutes | 611 | 23.3% |
| 35 to 39 Minutes | 93 | 3.5% |
| 40 to 44 Minutes | 82 | 3.1% |
| 45 to 59 Minutes | 167 | 6.4% |
| 60 to 89 Minutes | 16 | 0.6% |
| 90 or more Minutes | 38 | 1.5% |
Commute Time by Sex in Country Knolls
The most common commute times in Country Knolls are 30 to 34 minutes (347 commuters, 27.5%) for males and 10 to 14 minutes (417 commuters, 30.6%) for females.
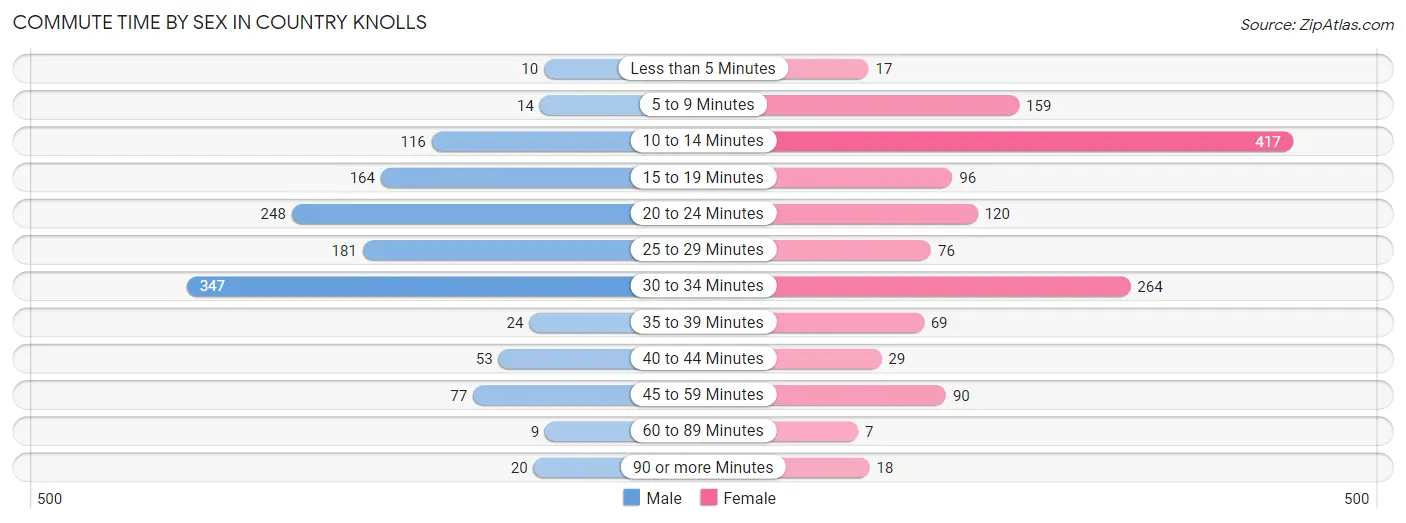
| Commute Time | Male | Female |
| Less than 5 Minutes | 10 (0.8%) | 17 (1.3%) |
| 5 to 9 Minutes | 14 (1.1%) | 159 (11.7%) |
| 10 to 14 Minutes | 116 (9.2%) | 417 (30.6%) |
| 15 to 19 Minutes | 164 (13.0%) | 96 (7.0%) |
| 20 to 24 Minutes | 248 (19.6%) | 120 (8.8%) |
| 25 to 29 Minutes | 181 (14.3%) | 76 (5.6%) |
| 30 to 34 Minutes | 347 (27.5%) | 264 (19.4%) |
| 35 to 39 Minutes | 24 (1.9%) | 69 (5.1%) |
| 40 to 44 Minutes | 53 (4.2%) | 29 (2.1%) |
| 45 to 59 Minutes | 77 (6.1%) | 90 (6.6%) |
| 60 to 89 Minutes | 9 (0.7%) | 7 (0.5%) |
| 90 or more Minutes | 20 (1.6%) | 18 (1.3%) |
Time of Departure to Work by Sex in Country Knolls
The most frequent times of departure to work in Country Knolls are 8:00 AM to 8:29 AM (251, 19.9%) for males and 6:30 AM to 6:59 AM (231, 17.0%) for females.
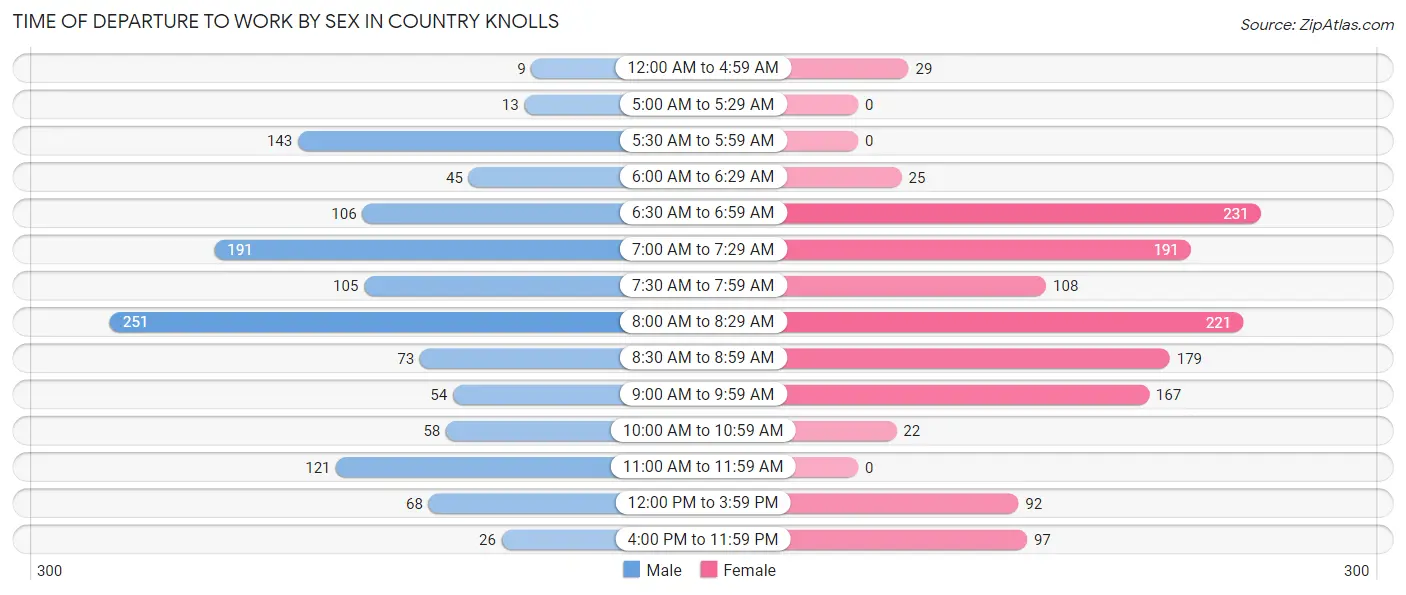
| Time of Departure | Male | Female |
| 12:00 AM to 4:59 AM | 9 (0.7%) | 29 (2.1%) |
| 5:00 AM to 5:29 AM | 13 (1.0%) | 0 (0.0%) |
| 5:30 AM to 5:59 AM | 143 (11.3%) | 0 (0.0%) |
| 6:00 AM to 6:29 AM | 45 (3.6%) | 25 (1.8%) |
| 6:30 AM to 6:59 AM | 106 (8.4%) | 231 (17.0%) |
| 7:00 AM to 7:29 AM | 191 (15.1%) | 191 (14.0%) |
| 7:30 AM to 7:59 AM | 105 (8.3%) | 108 (7.9%) |
| 8:00 AM to 8:29 AM | 251 (19.9%) | 221 (16.2%) |
| 8:30 AM to 8:59 AM | 73 (5.8%) | 179 (13.1%) |
| 9:00 AM to 9:59 AM | 54 (4.3%) | 167 (12.3%) |
| 10:00 AM to 10:59 AM | 58 (4.6%) | 22 (1.6%) |
| 11:00 AM to 11:59 AM | 121 (9.6%) | 0 (0.0%) |
| 12:00 PM to 3:59 PM | 68 (5.4%) | 92 (6.8%) |
| 4:00 PM to 11:59 PM | 26 (2.1%) | 97 (7.1%) |
| Total | 1,263 (100.0%) | 1,362 (100.0%) |
Housing Occupancy in Country Knolls
Occupancy by Ownership in Country Knolls
Of the total 2,128 dwellings in Country Knolls, owner-occupied units account for 2,047 (96.2%), while renter-occupied units make up 81 (3.8%).
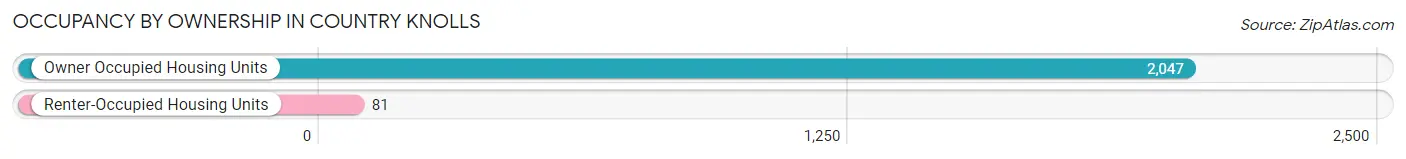
| Occupancy | # Housing Units | % Housing Units |
| Owner Occupied Housing Units | 2,047 | 96.2% |
| Renter-Occupied Housing Units | 81 | 3.8% |
| Total Occupied Housing Units | 2,128 | 100.0% |
Occupancy by Household Size in Country Knolls
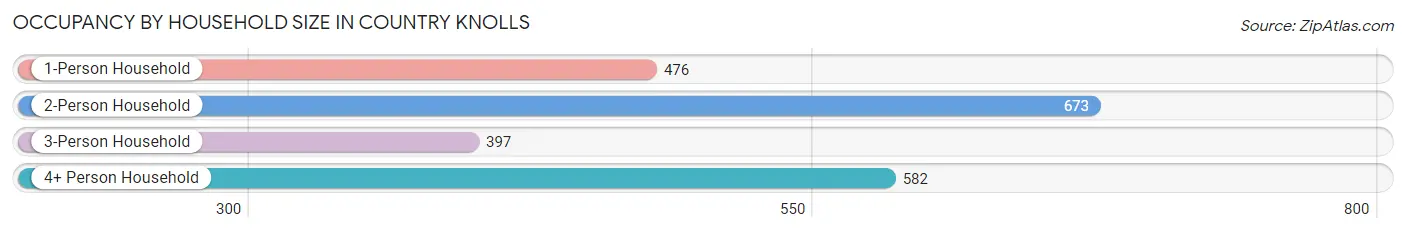
| Household Size | # Housing Units | % Housing Units |
| 1-Person Household | 476 | 22.4% |
| 2-Person Household | 673 | 31.6% |
| 3-Person Household | 397 | 18.7% |
| 4+ Person Household | 582 | 27.4% |
| Total Housing Units | 2,128 | 100.0% |
Occupancy by Ownership by Household Size in Country Knolls
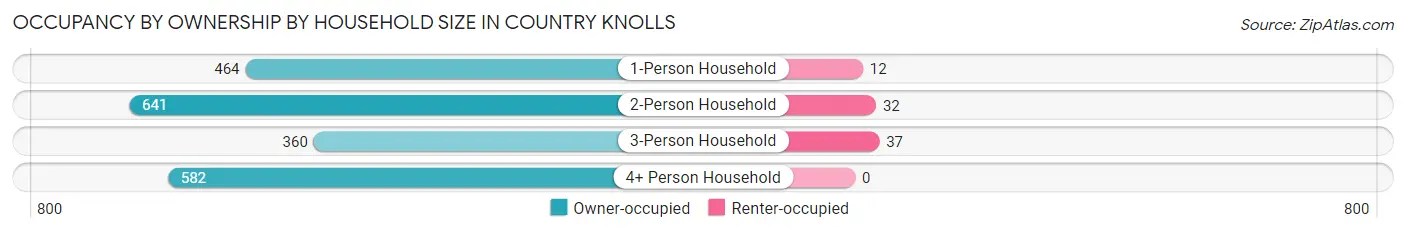
| Household Size | Owner-occupied | Renter-occupied |
| 1-Person Household | 464 (97.5%) | 12 (2.5%) |
| 2-Person Household | 641 (95.3%) | 32 (4.8%) |
| 3-Person Household | 360 (90.7%) | 37 (9.3%) |
| 4+ Person Household | 582 (100.0%) | 0 (0.0%) |
| Total Housing Units | 2,047 (96.2%) | 81 (3.8%) |
Occupancy by Educational Attainment in Country Knolls
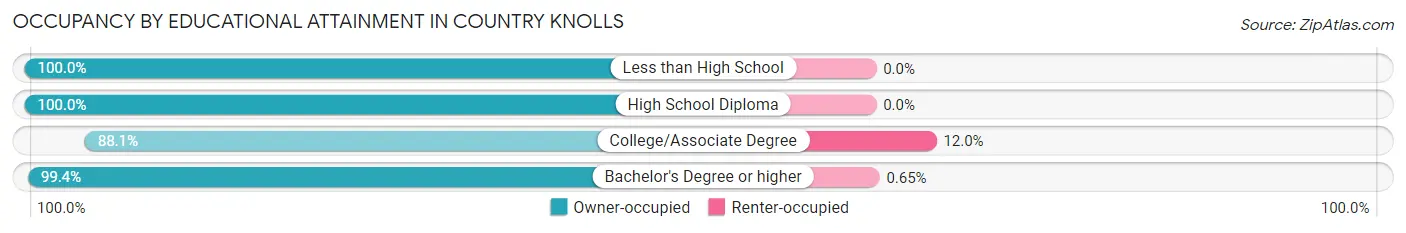
| Household Size | Owner-occupied | Renter-occupied |
| Less than High School | 30 (100.0%) | 0 (0.0%) |
| High School Diploma | 248 (100.0%) | 0 (0.0%) |
| College/Associate Degree | 538 (88.0%) | 73 (11.9%) |
| Bachelor's Degree or higher | 1,231 (99.4%) | 8 (0.6%) |
Occupancy by Age of Householder in Country Knolls
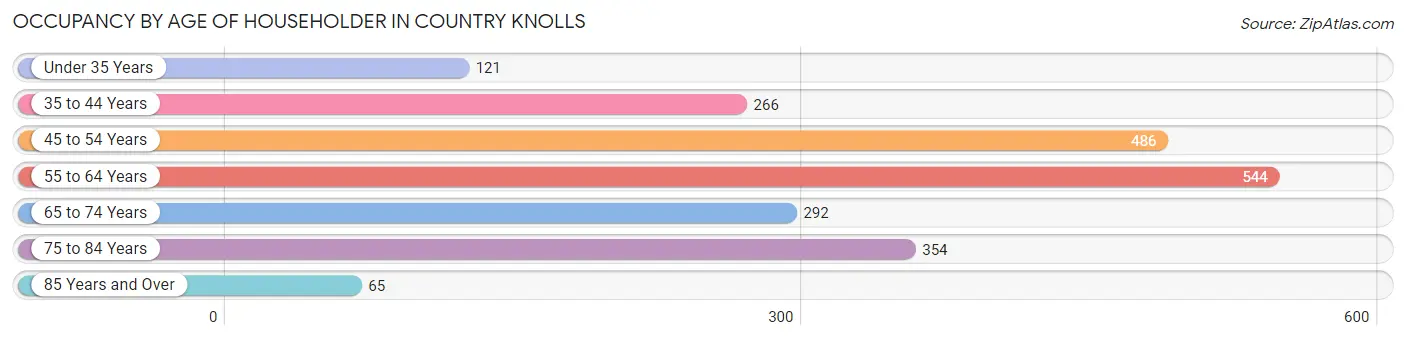
| Age Bracket | # Households | % Households |
| Under 35 Years | 121 | 5.7% |
| 35 to 44 Years | 266 | 12.5% |
| 45 to 54 Years | 486 | 22.8% |
| 55 to 64 Years | 544 | 25.6% |
| 65 to 74 Years | 292 | 13.7% |
| 75 to 84 Years | 354 | 16.6% |
| 85 Years and Over | 65 | 3.0% |
| Total | 2,128 | 100.0% |
Housing Finances in Country Knolls
Median Income by Occupancy in Country Knolls
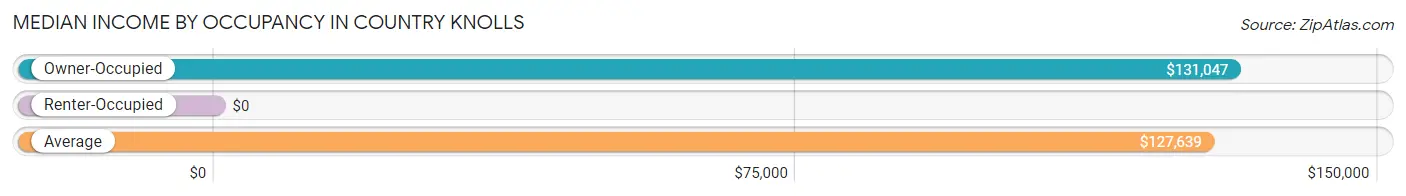
| Occupancy Type | # Households | Median Income |
| Owner-Occupied | 2,047 (96.2%) | $131,047 |
| Renter-Occupied | 81 (3.8%) | $0 |
| Average | 2,128 (100.0%) | $127,639 |
Occupancy by Householder Income Bracket in Country Knolls
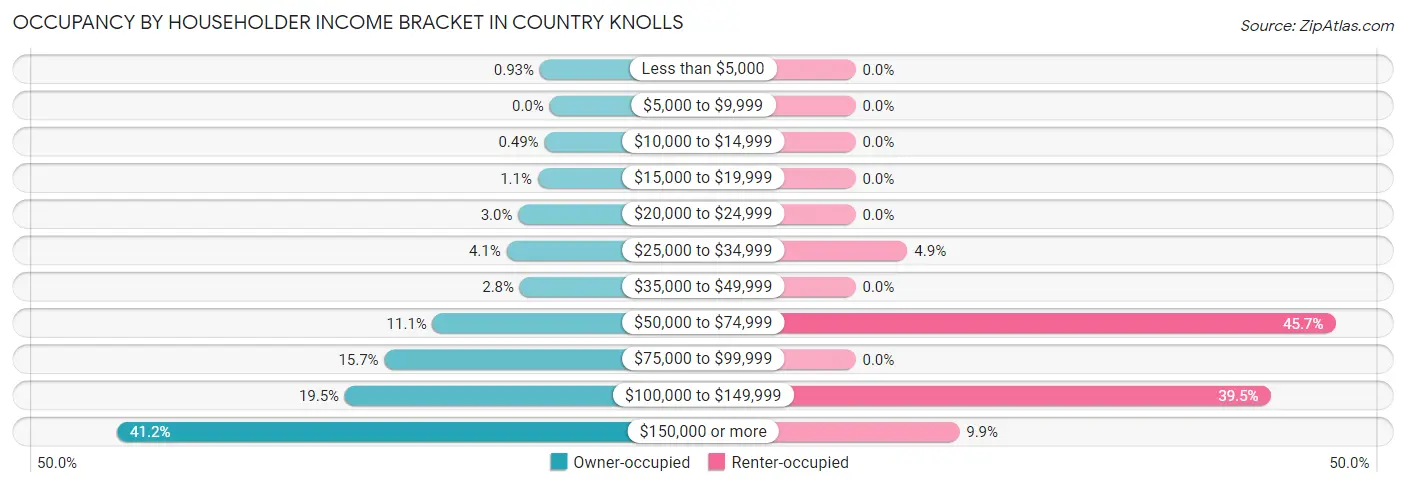
| Income Bracket | Owner-occupied | Renter-occupied |
| Less than $5,000 | 19 (0.9%) | 0 (0.0%) |
| $5,000 to $9,999 | 0 (0.0%) | 0 (0.0%) |
| $10,000 to $14,999 | 10 (0.5%) | 0 (0.0%) |
| $15,000 to $19,999 | 23 (1.1%) | 0 (0.0%) |
| $20,000 to $24,999 | 61 (3.0%) | 0 (0.0%) |
| $25,000 to $34,999 | 84 (4.1%) | 4 (4.9%) |
| $35,000 to $49,999 | 58 (2.8%) | 0 (0.0%) |
| $50,000 to $74,999 | 228 (11.1%) | 37 (45.7%) |
| $75,000 to $99,999 | 322 (15.7%) | 0 (0.0%) |
| $100,000 to $149,999 | 399 (19.5%) | 32 (39.5%) |
| $150,000 or more | 843 (41.2%) | 8 (9.9%) |
| Total | 2,047 (100.0%) | 81 (100.0%) |
Monthly Housing Cost Tiers in Country Knolls
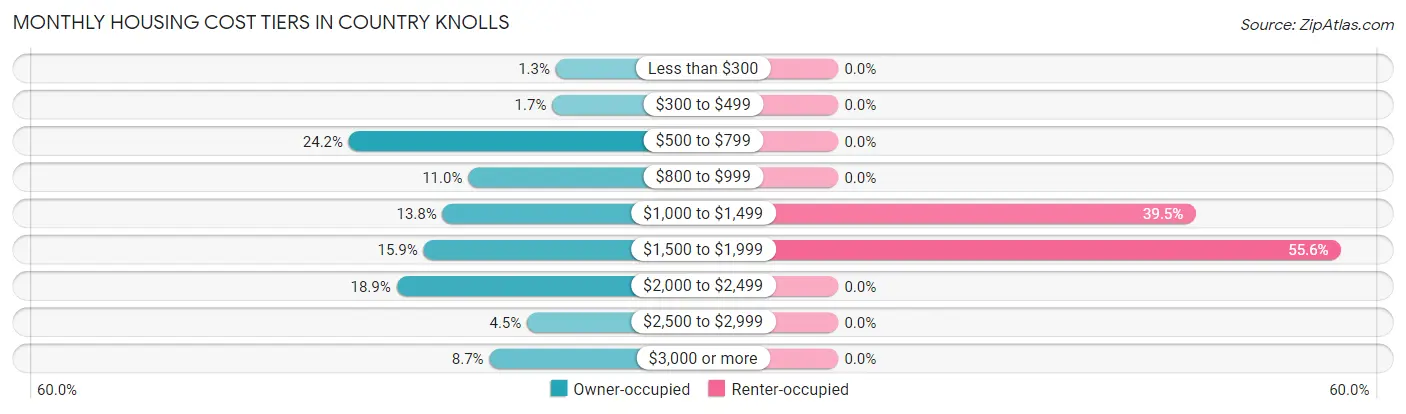
| Monthly Cost | Owner-occupied | Renter-occupied |
| Less than $300 | 27 (1.3%) | 0 (0.0%) |
| $300 to $499 | 35 (1.7%) | 0 (0.0%) |
| $500 to $799 | 495 (24.2%) | 0 (0.0%) |
| $800 to $999 | 225 (11.0%) | 0 (0.0%) |
| $1,000 to $1,499 | 283 (13.8%) | 32 (39.5%) |
| $1,500 to $1,999 | 326 (15.9%) | 45 (55.6%) |
| $2,000 to $2,499 | 387 (18.9%) | 0 (0.0%) |
| $2,500 to $2,999 | 92 (4.5%) | 0 (0.0%) |
| $3,000 or more | 177 (8.6%) | 0 (0.0%) |
| Total | 2,047 (100.0%) | 81 (100.0%) |
Physical Housing Characteristics in Country Knolls
Housing Structures in Country Knolls
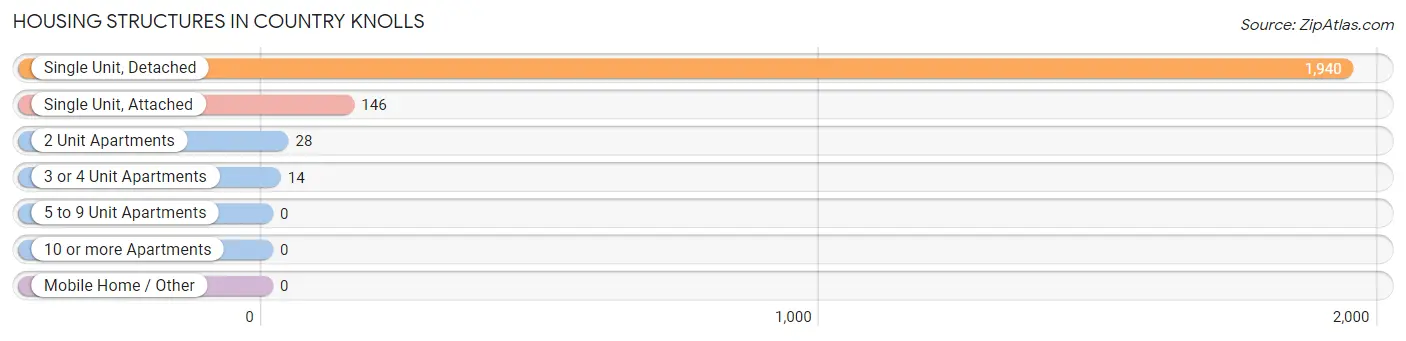
| Structure Type | # Housing Units | % Housing Units |
| Single Unit, Detached | 1,940 | 91.2% |
| Single Unit, Attached | 146 | 6.9% |
| 2 Unit Apartments | 28 | 1.3% |
| 3 or 4 Unit Apartments | 14 | 0.7% |
| 5 to 9 Unit Apartments | 0 | 0.0% |
| 10 or more Apartments | 0 | 0.0% |
| Mobile Home / Other | 0 | 0.0% |
| Total | 2,128 | 100.0% |
Housing Structures by Occupancy in Country Knolls
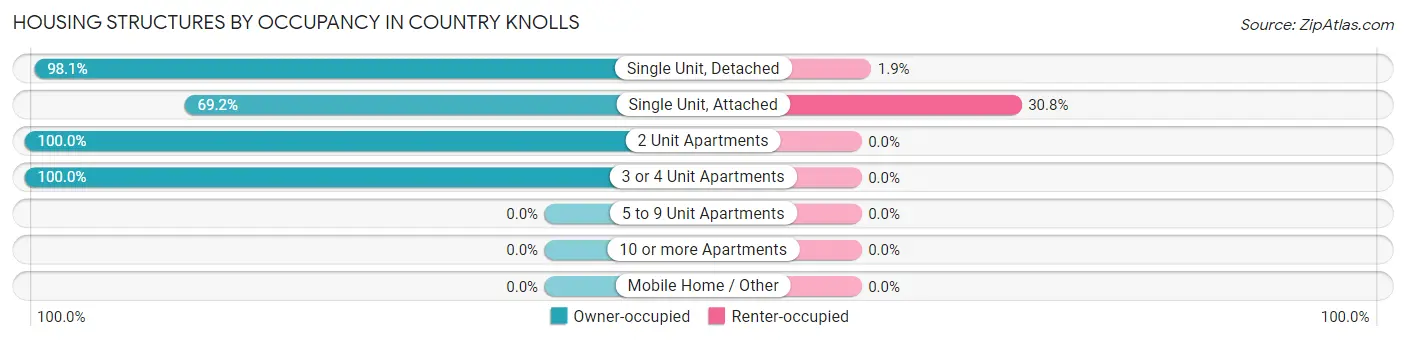
| Structure Type | Owner-occupied | Renter-occupied |
| Single Unit, Detached | 1,904 (98.1%) | 36 (1.9%) |
| Single Unit, Attached | 101 (69.2%) | 45 (30.8%) |
| 2 Unit Apartments | 28 (100.0%) | 0 (0.0%) |
| 3 or 4 Unit Apartments | 14 (100.0%) | 0 (0.0%) |
| 5 to 9 Unit Apartments | 0 (0.0%) | 0 (0.0%) |
| 10 or more Apartments | 0 (0.0%) | 0 (0.0%) |
| Mobile Home / Other | 0 (0.0%) | 0 (0.0%) |
| Total | 2,047 (96.2%) | 81 (3.8%) |
Housing Structures by Number of Rooms in Country Knolls
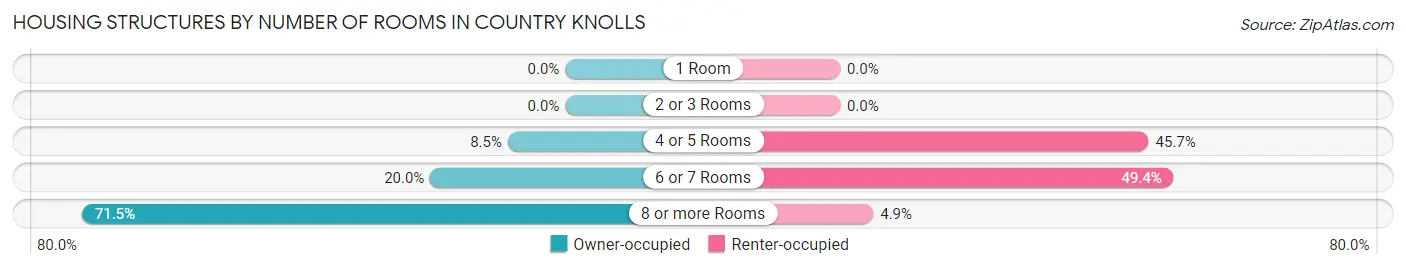
| Number of Rooms | Owner-occupied | Renter-occupied |
| 1 Room | 0 (0.0%) | 0 (0.0%) |
| 2 or 3 Rooms | 0 (0.0%) | 0 (0.0%) |
| 4 or 5 Rooms | 174 (8.5%) | 37 (45.7%) |
| 6 or 7 Rooms | 409 (20.0%) | 40 (49.4%) |
| 8 or more Rooms | 1,464 (71.5%) | 4 (4.9%) |
| Total | 2,047 (100.0%) | 81 (100.0%) |
Housing Structure by Heating Type in Country Knolls
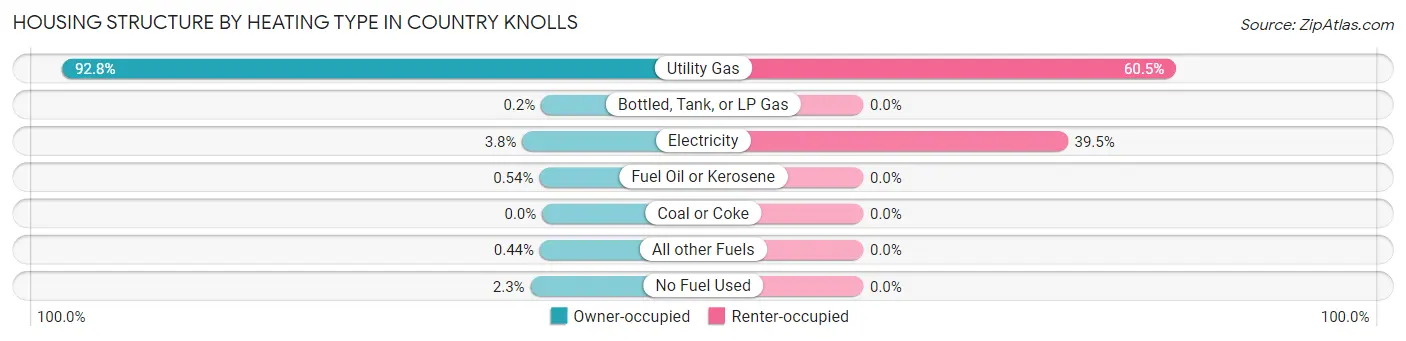
| Heating Type | Owner-occupied | Renter-occupied |
| Utility Gas | 1,899 (92.8%) | 49 (60.5%) |
| Bottled, Tank, or LP Gas | 4 (0.2%) | 0 (0.0%) |
| Electricity | 78 (3.8%) | 32 (39.5%) |
| Fuel Oil or Kerosene | 11 (0.5%) | 0 (0.0%) |
| Coal or Coke | 0 (0.0%) | 0 (0.0%) |
| All other Fuels | 9 (0.4%) | 0 (0.0%) |
| No Fuel Used | 46 (2.2%) | 0 (0.0%) |
| Total | 2,047 (100.0%) | 81 (100.0%) |
Household Vehicle Usage in Country Knolls
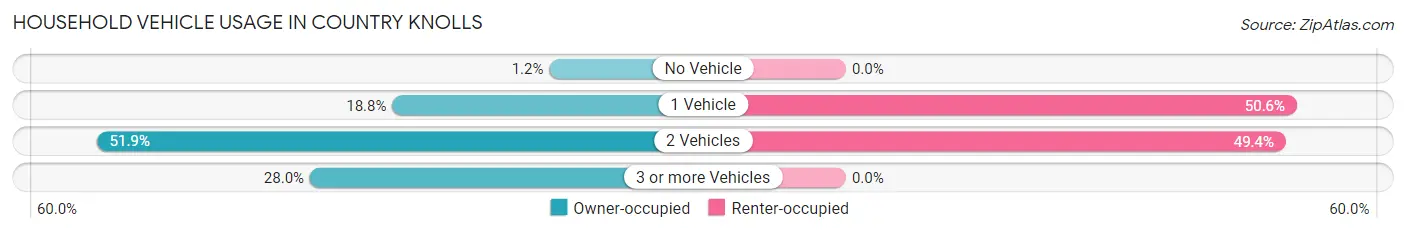
| Vehicles per Household | Owner-occupied | Renter-occupied |
| No Vehicle | 25 (1.2%) | 0 (0.0%) |
| 1 Vehicle | 385 (18.8%) | 41 (50.6%) |
| 2 Vehicles | 1,063 (51.9%) | 40 (49.4%) |
| 3 or more Vehicles | 574 (28.0%) | 0 (0.0%) |
| Total | 2,047 (100.0%) | 81 (100.0%) |
Real Estate & Mortgages in Country Knolls
Real Estate and Mortgage Overview in Country Knolls
| Characteristic | Without Mortgage | With Mortgage |
| Housing Units | 842 | 1,205 |
| Median Property Value | $336,000 | $357,300 |
| Median Household Income | $86,500 | $619 |
| Monthly Housing Costs | $742 | $167 |
| Real Estate Taxes | $5,197 | $8 |
Property Value by Mortgage Status in Country Knolls
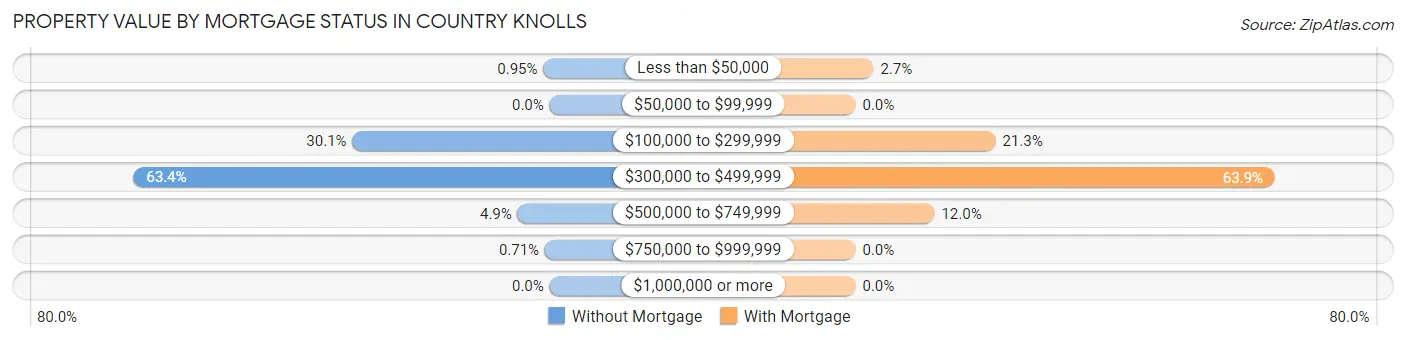
| Property Value | Without Mortgage | With Mortgage |
| Less than $50,000 | 8 (0.9%) | 33 (2.7%) |
| $50,000 to $99,999 | 0 (0.0%) | 0 (0.0%) |
| $100,000 to $299,999 | 253 (30.0%) | 257 (21.3%) |
| $300,000 to $499,999 | 534 (63.4%) | 770 (63.9%) |
| $500,000 to $749,999 | 41 (4.9%) | 145 (12.0%) |
| $750,000 to $999,999 | 6 (0.7%) | 0 (0.0%) |
| $1,000,000 or more | 0 (0.0%) | 0 (0.0%) |
| Total | 842 (100.0%) | 1,205 (100.0%) |
Household Income by Mortgage Status in Country Knolls
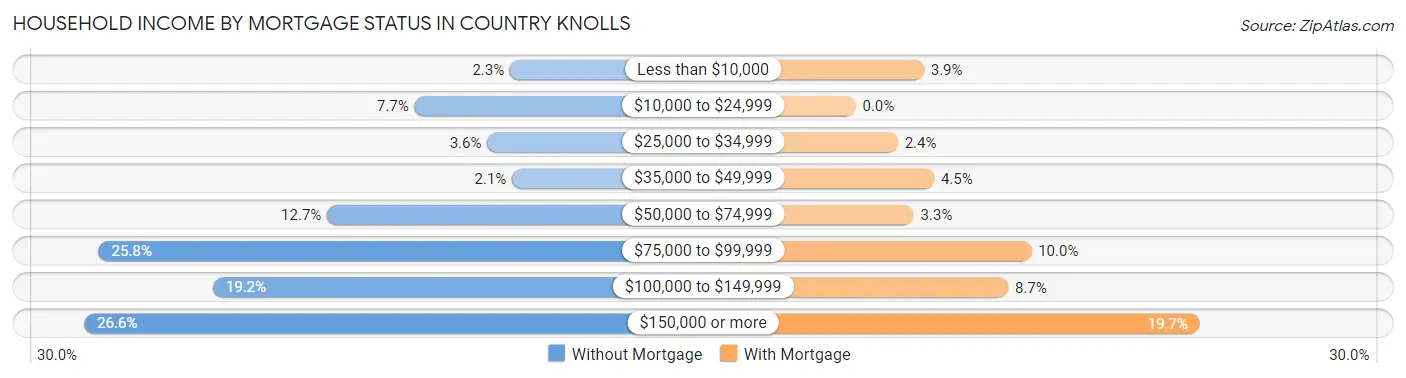
| Household Income | Without Mortgage | With Mortgage |
| Less than $10,000 | 19 (2.3%) | 47 (3.9%) |
| $10,000 to $24,999 | 65 (7.7%) | 0 (0.0%) |
| $25,000 to $34,999 | 30 (3.6%) | 29 (2.4%) |
| $35,000 to $49,999 | 18 (2.1%) | 54 (4.5%) |
| $50,000 to $74,999 | 107 (12.7%) | 40 (3.3%) |
| $75,000 to $99,999 | 217 (25.8%) | 121 (10.0%) |
| $100,000 to $149,999 | 162 (19.2%) | 105 (8.7%) |
| $150,000 or more | 224 (26.6%) | 237 (19.7%) |
| Total | 842 (100.0%) | 1,205 (100.0%) |
Property Value to Household Income Ratio in Country Knolls
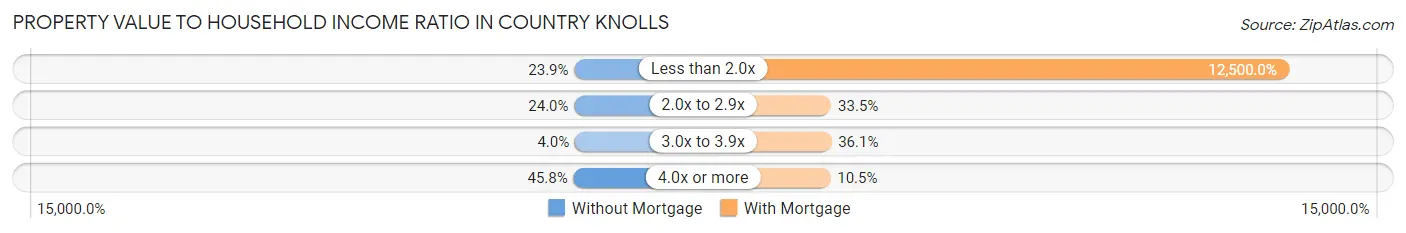
| Value-to-Income Ratio | Without Mortgage | With Mortgage |
| Less than 2.0x | 201 (23.9%) | 150,625 (12,500.0%) |
| 2.0x to 2.9x | 202 (24.0%) | 404 (33.5%) |
| 3.0x to 3.9x | 34 (4.0%) | 435 (36.1%) |
| 4.0x or more | 386 (45.8%) | 127 (10.5%) |
| Total | 842 (100.0%) | 1,205 (100.0%) |
Real Estate Taxes by Mortgage Status in Country Knolls
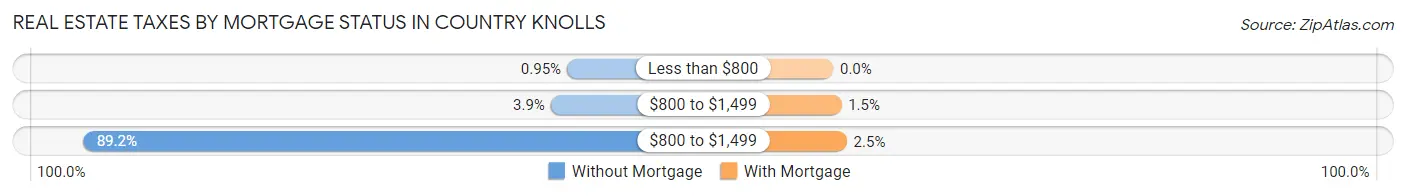
| Property Taxes | Without Mortgage | With Mortgage |
| Less than $800 | 8 (0.9%) | 0 (0.0%) |
| $800 to $1,499 | 33 (3.9%) | 18 (1.5%) |
| $800 to $1,499 | 751 (89.2%) | 30 (2.5%) |
| Total | 842 (100.0%) | 1,205 (100.0%) |
Health & Disability in Country Knolls
Health Insurance Coverage by Age in Country Knolls
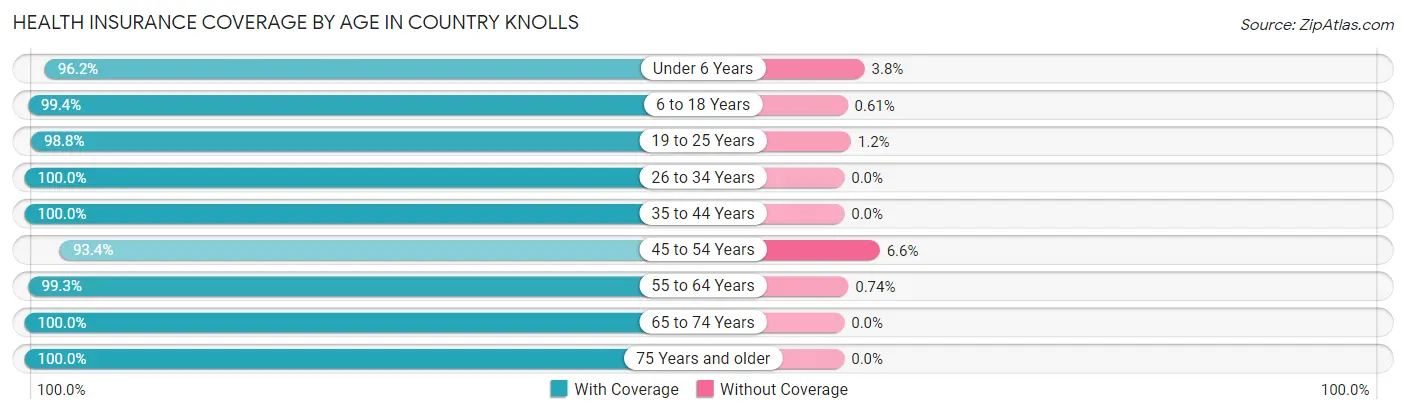
| Age Bracket | With Coverage | Without Coverage |
| Under 6 Years | 203 (96.2%) | 8 (3.8%) |
| 6 to 18 Years | 1,307 (99.4%) | 8 (0.6%) |
| 19 to 25 Years | 324 (98.8%) | 4 (1.2%) |
| 26 to 34 Years | 467 (100.0%) | 0 (0.0%) |
| 35 to 44 Years | 582 (100.0%) | 0 (0.0%) |
| 45 to 54 Years | 919 (93.4%) | 65 (6.6%) |
| 55 to 64 Years | 945 (99.3%) | 7 (0.7%) |
| 65 to 74 Years | 419 (100.0%) | 0 (0.0%) |
| 75 Years and older | 553 (100.0%) | 0 (0.0%) |
| Total | 5,719 (98.4%) | 92 (1.6%) |
Health Insurance Coverage by Citizenship Status in Country Knolls
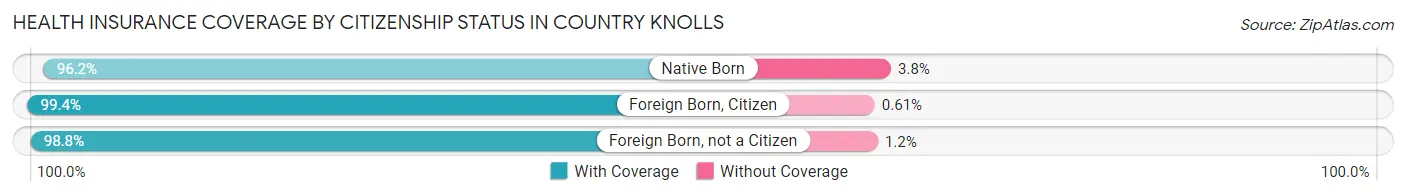
| Citizenship Status | With Coverage | Without Coverage |
| Native Born | 203 (96.2%) | 8 (3.8%) |
| Foreign Born, Citizen | 1,307 (99.4%) | 8 (0.6%) |
| Foreign Born, not a Citizen | 324 (98.8%) | 4 (1.2%) |
Health Insurance Coverage by Household Income in Country Knolls
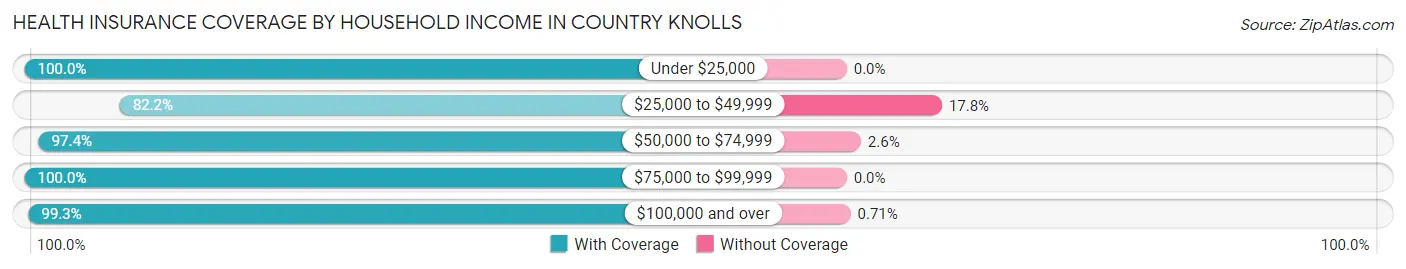
| Household Income | With Coverage | Without Coverage |
| Under $25,000 | 185 (100.0%) | 0 (0.0%) |
| $25,000 to $49,999 | 212 (82.2%) | 46 (17.8%) |
| $50,000 to $74,999 | 590 (97.4%) | 16 (2.6%) |
| $75,000 to $99,999 | 504 (100.0%) | 0 (0.0%) |
| $100,000 and over | 4,223 (99.3%) | 30 (0.7%) |
Public vs Private Health Insurance Coverage by Age in Country Knolls
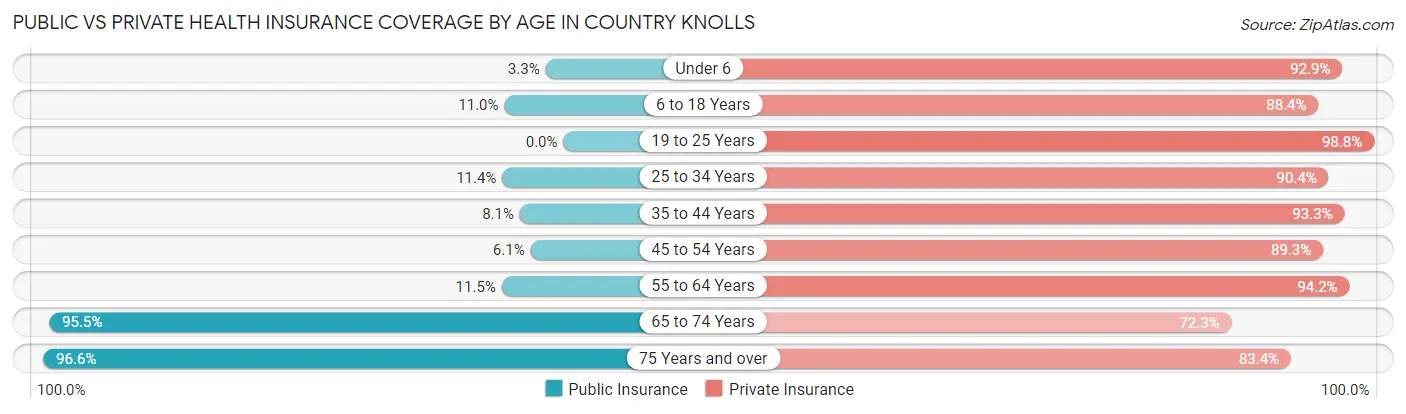
| Age Bracket | Public Insurance | Private Insurance |
| Under 6 | 7 (3.3%) | 196 (92.9%) |
| 6 to 18 Years | 144 (11.0%) | 1,163 (88.4%) |
| 19 to 25 Years | 0 (0.0%) | 324 (98.8%) |
| 25 to 34 Years | 53 (11.4%) | 422 (90.4%) |
| 35 to 44 Years | 47 (8.1%) | 543 (93.3%) |
| 45 to 54 Years | 60 (6.1%) | 879 (89.3%) |
| 55 to 64 Years | 109 (11.5%) | 897 (94.2%) |
| 65 to 74 Years | 400 (95.5%) | 303 (72.3%) |
| 75 Years and over | 534 (96.6%) | 461 (83.4%) |
| Total | 1,354 (23.3%) | 5,188 (89.3%) |
Disability Status by Sex by Age in Country Knolls
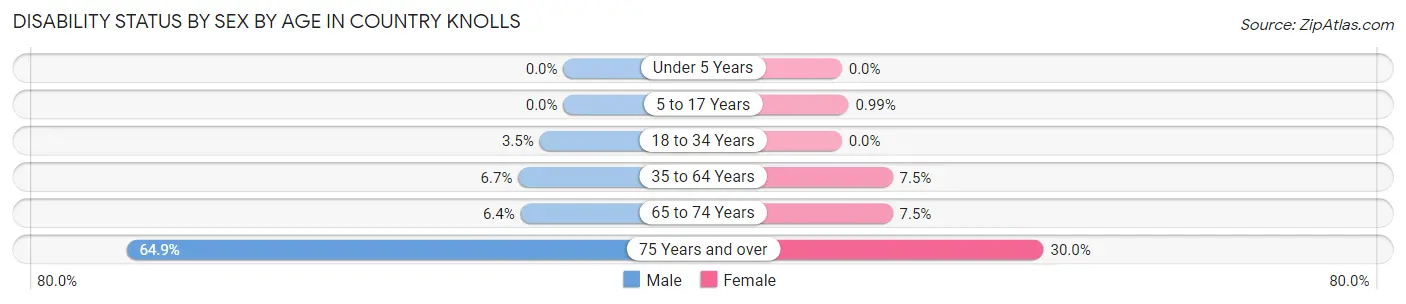
| Age Bracket | Male | Female |
| Under 5 Years | 0 (0.0%) | 0 (0.0%) |
| 5 to 17 Years | 0 (0.0%) | 6 (1.0%) |
| 18 to 34 Years | 19 (3.5%) | 0 (0.0%) |
| 35 to 64 Years | 79 (6.7%) | 101 (7.5%) |
| 65 to 74 Years | 14 (6.4%) | 15 (7.5%) |
| 75 Years and over | 205 (64.9%) | 71 (30.0%) |
Disability Class by Sex by Age in Country Knolls
Disability Class: Hearing Difficulty
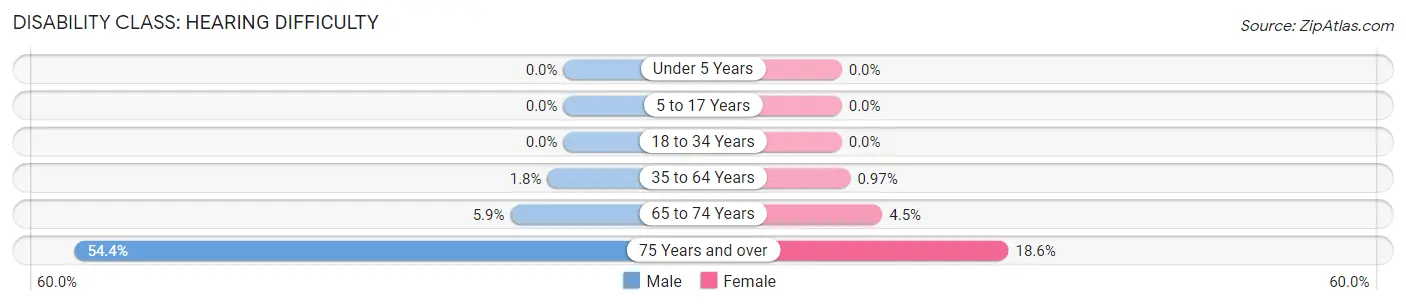
| Age Bracket | Male | Female |
| Under 5 Years | 0 (0.0%) | 0 (0.0%) |
| 5 to 17 Years | 0 (0.0%) | 0 (0.0%) |
| 18 to 34 Years | 0 (0.0%) | 0 (0.0%) |
| 35 to 64 Years | 21 (1.8%) | 13 (1.0%) |
| 65 to 74 Years | 13 (5.9%) | 9 (4.5%) |
| 75 Years and over | 172 (54.4%) | 44 (18.6%) |
Disability Class: Vision Difficulty
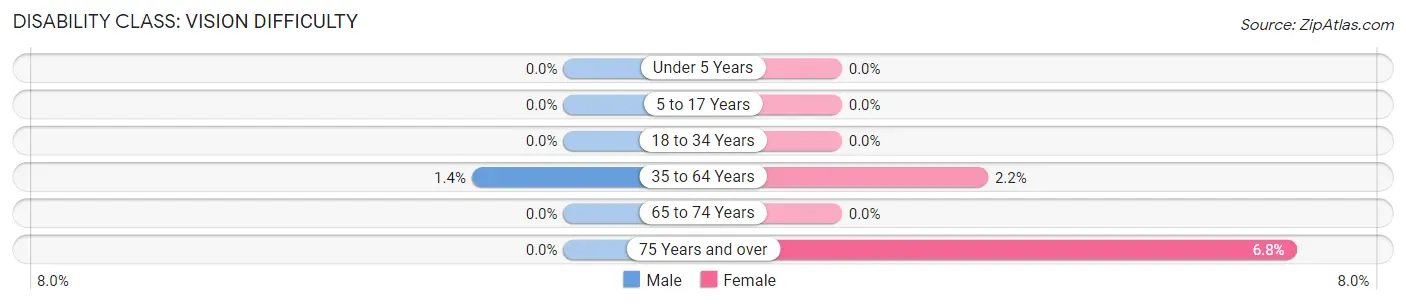
| Age Bracket | Male | Female |
| Under 5 Years | 0 (0.0%) | 0 (0.0%) |
| 5 to 17 Years | 0 (0.0%) | 0 (0.0%) |
| 18 to 34 Years | 0 (0.0%) | 0 (0.0%) |
| 35 to 64 Years | 16 (1.4%) | 29 (2.2%) |
| 65 to 74 Years | 0 (0.0%) | 0 (0.0%) |
| 75 Years and over | 0 (0.0%) | 16 (6.8%) |
Disability Class: Cognitive Difficulty
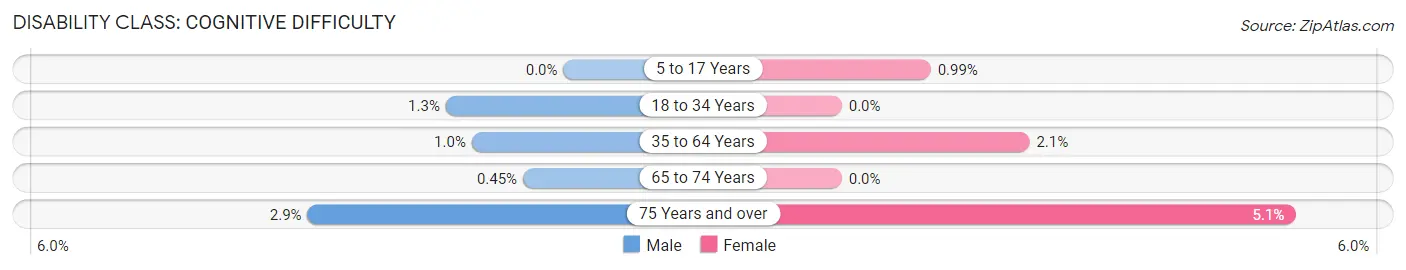
| Age Bracket | Male | Female |
| 5 to 17 Years | 0 (0.0%) | 6 (1.0%) |
| 18 to 34 Years | 7 (1.3%) | 0 (0.0%) |
| 35 to 64 Years | 12 (1.0%) | 28 (2.1%) |
| 65 to 74 Years | 1 (0.4%) | 0 (0.0%) |
| 75 Years and over | 9 (2.9%) | 12 (5.1%) |
Disability Class: Ambulatory Difficulty
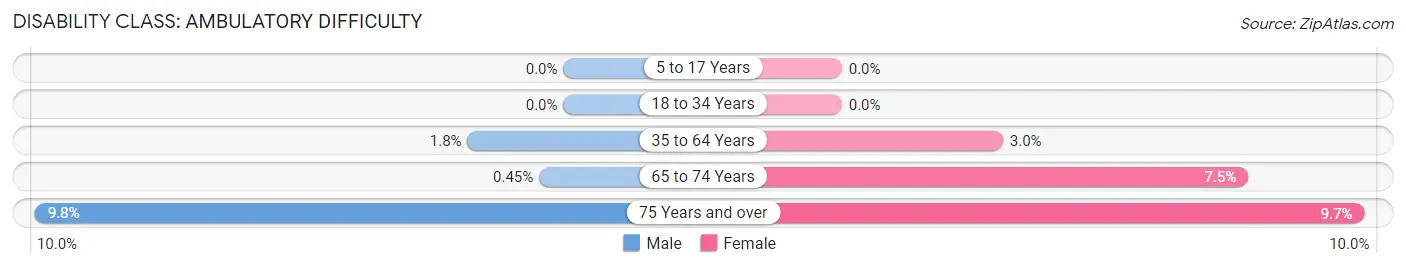
| Age Bracket | Male | Female |
| 5 to 17 Years | 0 (0.0%) | 0 (0.0%) |
| 18 to 34 Years | 0 (0.0%) | 0 (0.0%) |
| 35 to 64 Years | 21 (1.8%) | 40 (3.0%) |
| 65 to 74 Years | 1 (0.4%) | 15 (7.5%) |
| 75 Years and over | 31 (9.8%) | 23 (9.7%) |
Disability Class: Self-Care Difficulty
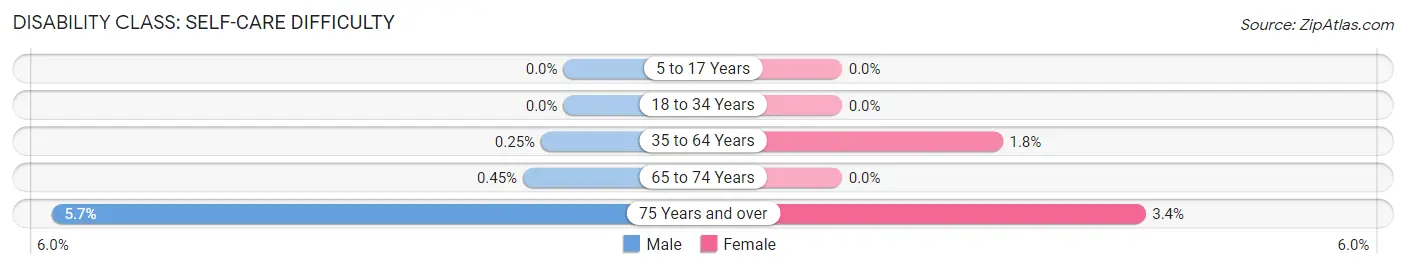
| Age Bracket | Male | Female |
| 5 to 17 Years | 0 (0.0%) | 0 (0.0%) |
| 18 to 34 Years | 0 (0.0%) | 0 (0.0%) |
| 35 to 64 Years | 3 (0.3%) | 24 (1.8%) |
| 65 to 74 Years | 1 (0.4%) | 0 (0.0%) |
| 75 Years and over | 18 (5.7%) | 8 (3.4%) |
Technology Access in Country Knolls
Computing Device Access in Country Knolls
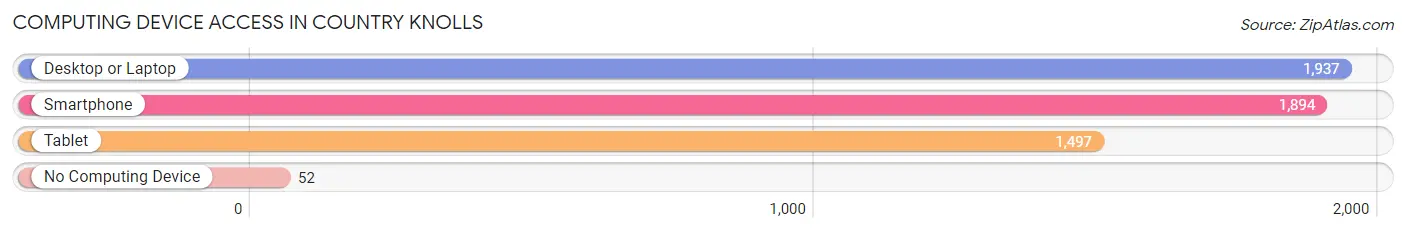
| Device Type | # Households | % Households |
| Desktop or Laptop | 1,937 | 91.0% |
| Smartphone | 1,894 | 89.0% |
| Tablet | 1,497 | 70.4% |
| No Computing Device | 52 | 2.4% |
| Total | 2,128 | 100.0% |
Internet Access in Country Knolls
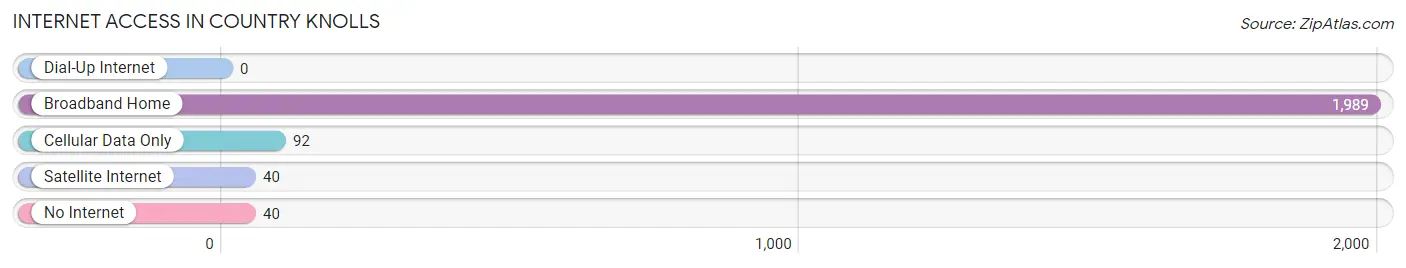
| Internet Type | # Households | % Households |
| Dial-Up Internet | 0 | 0.0% |
| Broadband Home | 1,989 | 93.5% |
| Cellular Data Only | 92 | 4.3% |
| Satellite Internet | 40 | 1.9% |
| No Internet | 40 | 1.9% |
| Total | 2,128 | 100.0% |
Country Knolls Summary
Country Knolls is a hamlet located in the town of Halfmoon in Saratoga County, New York. It is situated on the eastern side of the town, just south of the city of Clifton Park. The hamlet is bordered by the Mohawk River to the east, the town of Halfmoon to the north, and the town of Clifton Park to the south.
Geography
Country Knolls is located in the eastern part of the town of Halfmoon, in Saratoga County, New York. It is situated on the eastern side of the town, just south of the city of Clifton Park. The hamlet is bordered by the Mohawk River to the east, the town of Halfmoon to the north, and the town of Clifton Park to the south. The hamlet is located in the Mohawk Valley region of New York State, and is part of the Albany-Schenectady-Troy Metropolitan Statistical Area.
The hamlet is situated on a plateau, with elevations ranging from 500 to 600 feet above sea level. The terrain is generally flat, with some rolling hills. The soil is mostly loam, with some areas of clay. The climate is humid continental, with cold winters and hot, humid summers.
History
Country Knolls was first settled in the late 1700s by Dutch and German immigrants. The hamlet was originally known as “Country Hill”, and was part of the town of Halfmoon. In the early 1800s, the hamlet was renamed “Country Knolls”.
The hamlet grew slowly over the years, and by the mid-1800s, it had become a popular summer resort destination. The hamlet was home to several hotels, including the Country Knolls Hotel, which was built in 1845. The hotel was a popular destination for wealthy New Yorkers, who would come to the hamlet to escape the summer heat of the city.
In the late 1800s, the hamlet began to develop into a residential community. The hamlet was home to several farms, and the population began to grow. By the early 1900s, the hamlet had become a popular residential area for commuters to the nearby cities of Albany and Schenectady.
Economy
The economy of Country Knolls is largely based on the service industry. The hamlet is home to several restaurants, retail stores, and other businesses. The hamlet is also home to several professional offices, including doctors, lawyers, and accountants.
The hamlet is also home to several light industrial businesses, including a printing company and a plastics manufacturer. The hamlet is also home to several small manufacturing businesses, including a furniture manufacturer and a metal fabrication shop.
Demographics
As of the 2010 census, the population of Country Knolls was 4,845. The population is largely white (94.3%), with small percentages of African American (2.2%), Asian (1.3%), and Hispanic (1.2%) residents. The median household income is $76,944, and the median home value is $269,400.
The hamlet is served by the Shenendehowa Central School District. The hamlet is home to several churches, including the Country Knolls Presbyterian Church, the Country Knolls Baptist Church, and the Country Knolls United Methodist Church.
Conclusion
Country Knolls is a hamlet located in the town of Halfmoon in Saratoga County, New York. It is situated on the eastern side of the town, just south of the city of Clifton Park. The hamlet is bordered by the Mohawk River to the east, the town of Halfmoon to the north, and the town of Clifton Park to the south. The hamlet is located in the Mohawk Valley region of New York State, and is part of the Albany-Schenectady-Troy Metropolitan Statistical Area. The hamlet was first settled in the late 1700s by Dutch and German immigrants, and has since grown into a popular residential area for commuters to the nearby cities of Albany and Schenectady. The economy of Country Knolls is largely based on the service industry, and the population is largely white. The hamlet is served by the Shenendehowa Central School District, and is home to several churches.
Common Questions
What is Per Capita Income in Country Knolls?
Per Capita income in Country Knolls is $55,223.
What is the Median Family Income in Country Knolls?
Median Family Income in Country Knolls is $148,777.
What is the Median Household income in Country Knolls?
Median Household Income in Country Knolls is $127,639.
What is Income or Wage Gap in Country Knolls?
Income or Wage Gap in Country Knolls is 49.9%.
Women in Country Knolls earn 50.1 cents for every dollar earned by a man.
What is Inequality or Gini Index in Country Knolls?
Inequality or Gini Index in Country Knolls is 0.38.
What is the Total Population of Country Knolls?
Total Population of Country Knolls is 5,811.
What is the Total Male Population of Country Knolls?
Total Male Population of Country Knolls is 2,981.
What is the Total Female Population of Country Knolls?
Total Female Population of Country Knolls is 2,830.
What is the Ratio of Males per 100 Females in Country Knolls?
There are 105.34 Males per 100 Females in Country Knolls.
What is the Ratio of Females per 100 Males in Country Knolls?
There are 94.93 Females per 100 Males in Country Knolls.
What is the Median Population Age in Country Knolls?
Median Population Age in Country Knolls is 45.0 Years.
What is the Average Family Size in Country Knolls
Average Family Size in Country Knolls is 3.3 People.
What is the Average Household Size in Country Knolls
Average Household Size in Country Knolls is 2.7 People.
How Large is the Labor Force in Country Knolls?
There are 3,114 People in the Labor Forcein in Country Knolls.
What is the Percentage of People in the Labor Force in Country Knolls?
65.2% of People are in the Labor Force in Country Knolls.
What is the Unemployment Rate in Country Knolls?
Unemployment Rate in Country Knolls is 1.2%.