Old Forge, NY Map & Demographics
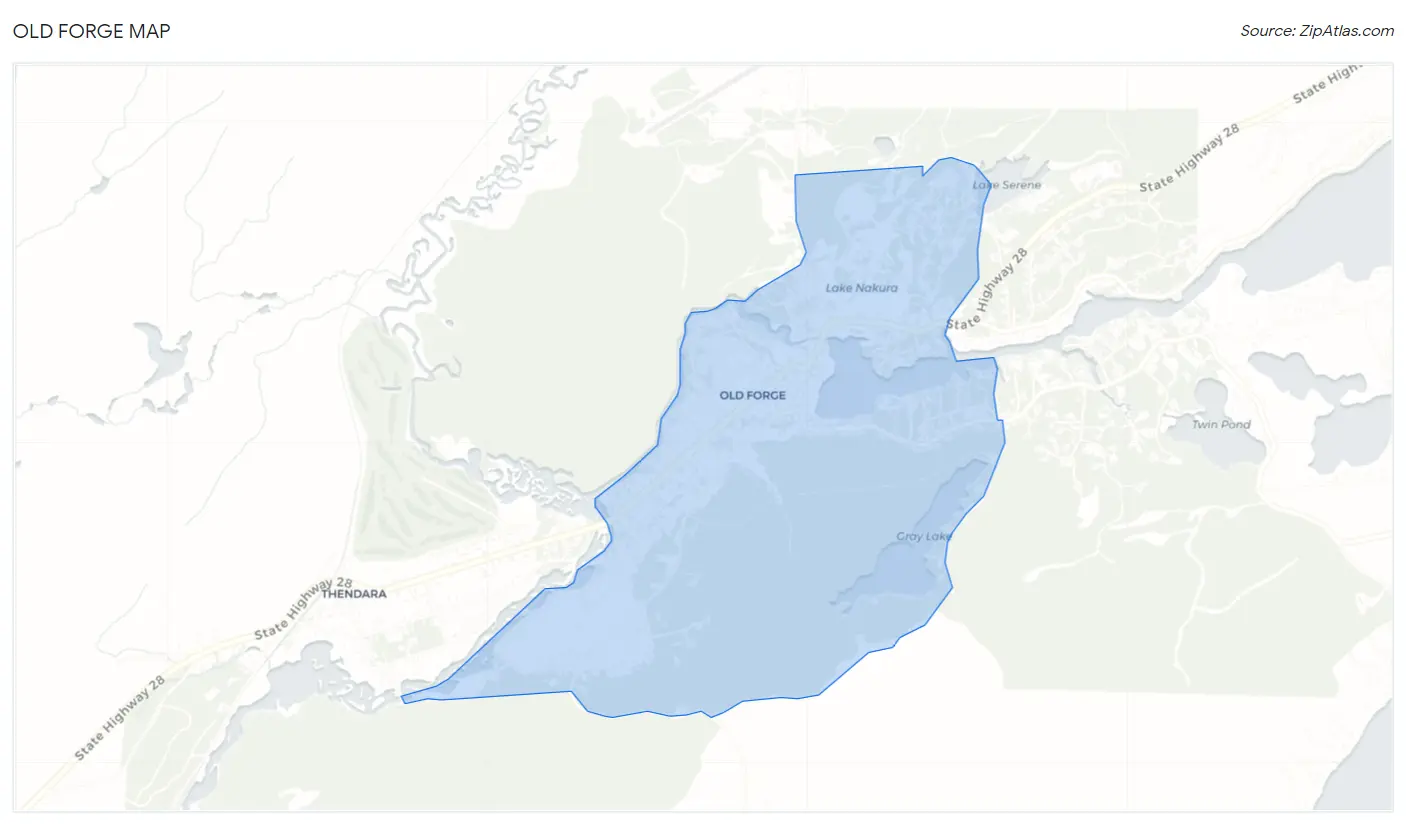
Old Forge Map
Old Forge Overview
$57,808
PER CAPITA INCOME
$133,974
AVG FAMILY INCOME
$132,645
AVG HOUSEHOLD INCOME
0.28
INEQUALITY / GINI INDEX
573
TOTAL POPULATION
312
MALE POPULATION
261
FEMALE POPULATION
119.54
MALES / 100 FEMALES
83.65
FEMALES / 100 MALES
56.7
MEDIAN AGE
2.0
AVG FAMILY SIZE
1.8
AVG HOUSEHOLD SIZE
410
LABOR FORCE [ PEOPLE ]
71.6%
PERCENT IN LABOR FORCE
8.8%
UNEMPLOYMENT RATE
Old Forge Zip Codes
Old Forge Area Codes
Income in Old Forge
Income Overview in Old Forge
Per Capita Income in Old Forge is $57,808, while median incomes of families and households are $133,974 and $132,645 respectively.
| Characteristic | Number | Measure |
| Per Capita Income | 573 | $57,808 |
| Median Family Income | 186 | $133,974 |
| Mean Family Income | 186 | $143,961 |
| Median Household Income | 287 | $132,645 |
| Mean Household Income | 287 | $109,180 |
| Income Deficit | 186 | $0 |
| Wage / Income Gap (%) | 573 | 0.00% |
| Wage / Income Gap ($) | 573 | 100.00¢ per $1 |
| Gini / Inequality Index | 573 | 0.28 |
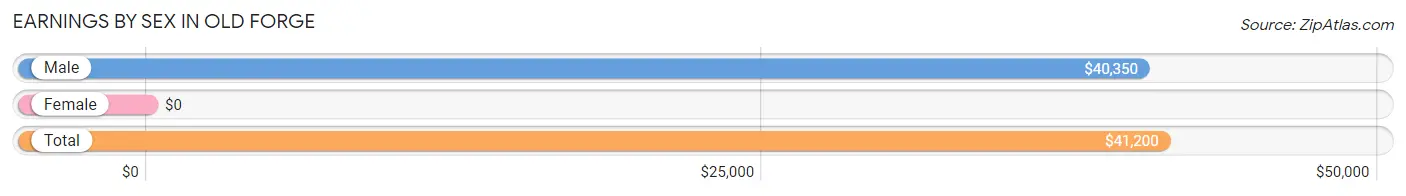
Earnings by Sex in Old Forge
| Sex | Number | Average Earnings |
| Male | 237 (57.8%) | $40,350 |
| Female | 173 (42.2%) | $0 |
| Total | 410 (100.0%) | $41,200 |
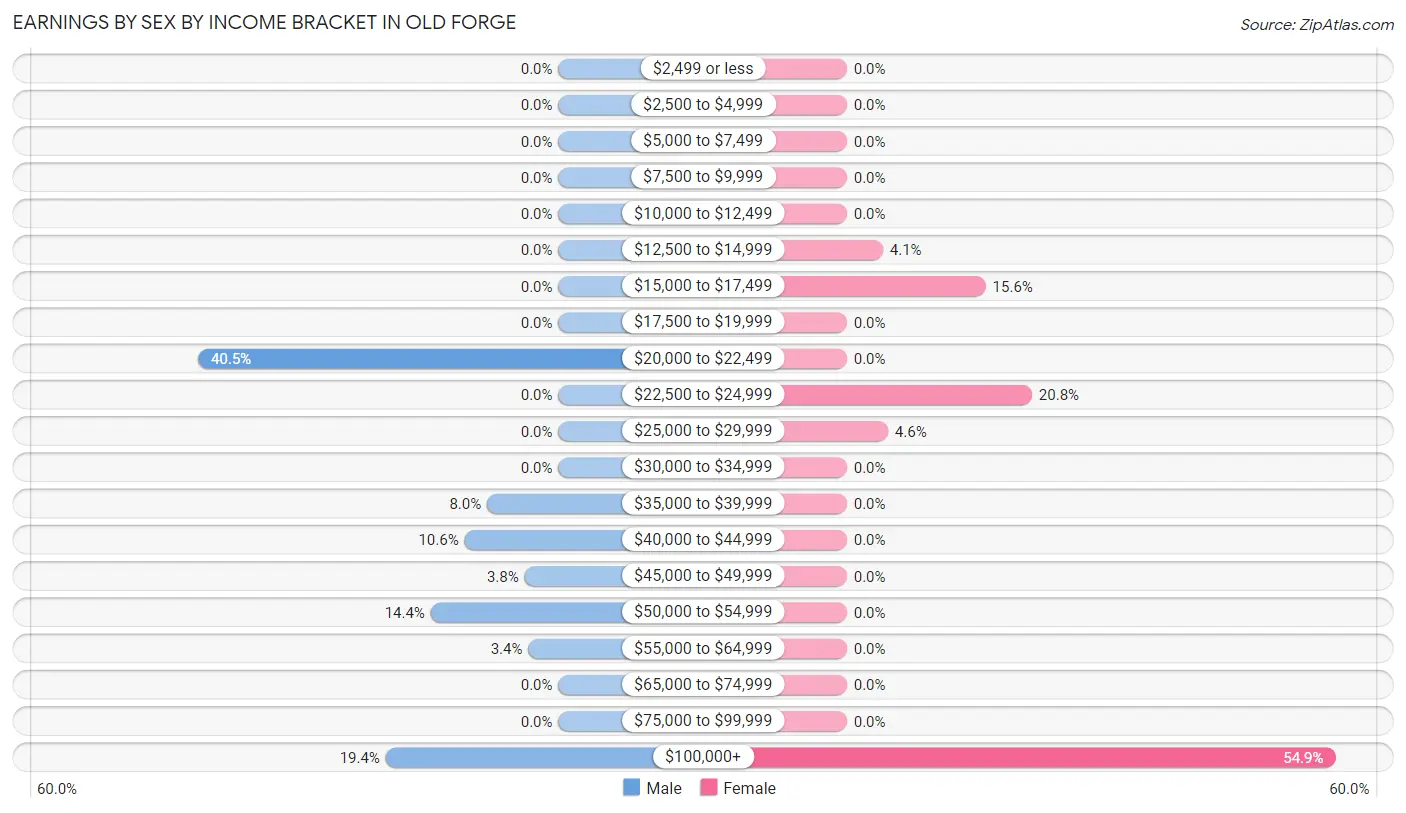
Earnings by Sex by Income Bracket in Old Forge
The most common earnings brackets in Old Forge are $20,000 to $22,499 for men (96 | 40.5%) and $100,000+ for women (95 | 54.9%).
| Income | Male | Female |
| $2,499 or less | 0 (0.0%) | 0 (0.0%) |
| $2,500 to $4,999 | 0 (0.0%) | 0 (0.0%) |
| $5,000 to $7,499 | 0 (0.0%) | 0 (0.0%) |
| $7,500 to $9,999 | 0 (0.0%) | 0 (0.0%) |
| $10,000 to $12,499 | 0 (0.0%) | 0 (0.0%) |
| $12,500 to $14,999 | 0 (0.0%) | 7 (4.1%) |
| $15,000 to $17,499 | 0 (0.0%) | 27 (15.6%) |
| $17,500 to $19,999 | 0 (0.0%) | 0 (0.0%) |
| $20,000 to $22,499 | 96 (40.5%) | 0 (0.0%) |
| $22,500 to $24,999 | 0 (0.0%) | 36 (20.8%) |
| $25,000 to $29,999 | 0 (0.0%) | 8 (4.6%) |
| $30,000 to $34,999 | 0 (0.0%) | 0 (0.0%) |
| $35,000 to $39,999 | 19 (8.0%) | 0 (0.0%) |
| $40,000 to $44,999 | 25 (10.5%) | 0 (0.0%) |
| $45,000 to $49,999 | 9 (3.8%) | 0 (0.0%) |
| $50,000 to $54,999 | 34 (14.3%) | 0 (0.0%) |
| $55,000 to $64,999 | 8 (3.4%) | 0 (0.0%) |
| $65,000 to $74,999 | 0 (0.0%) | 0 (0.0%) |
| $75,000 to $99,999 | 0 (0.0%) | 0 (0.0%) |
| $100,000+ | 46 (19.4%) | 95 (54.9%) |
| Total | 237 (100.0%) | 173 (100.0%) |
Earnings by Sex by Educational Attainment in Old Forge
| Educational Attainment | Male Income | Female Income |
| Less than High School | - | - |
| High School Diploma | - | - |
| College or Associate's Degree | - | - |
| Bachelor's Degree | - | - |
| Graduate Degree | - | - |
| Total | $36,316 | $0 |
Family Income in Old Forge
Family Income Brackets in Old Forge
According to the Old Forge family income data, there are 130 families falling into the $100,000 to $149,999 income range, which is the most common income bracket and makes up 69.9% of all families.
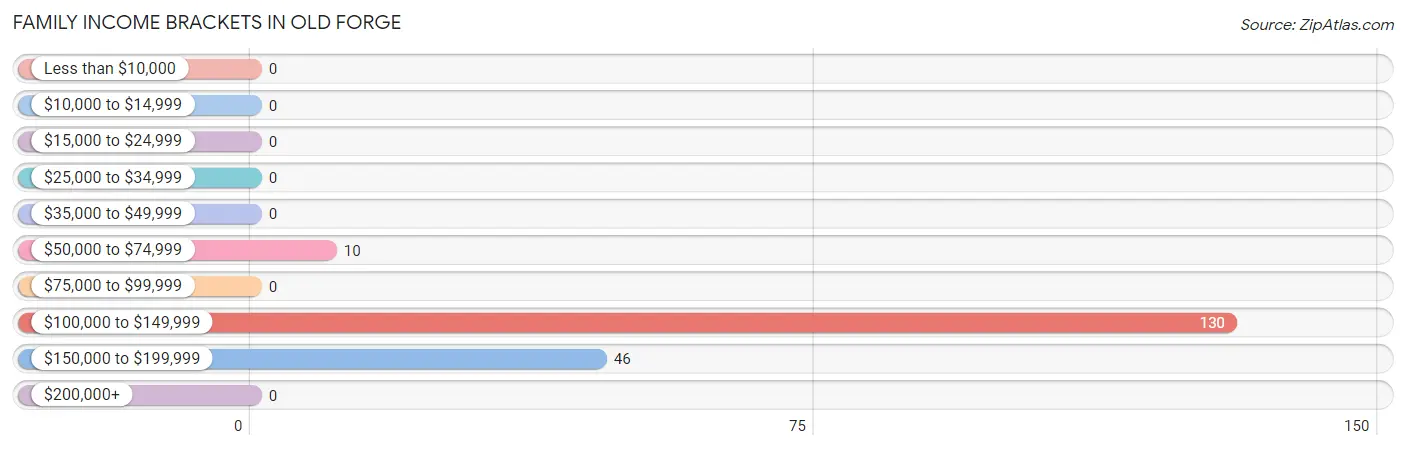
| Income Bracket | # Families | % Families |
| Less than $10,000 | 0 | 0.0% |
| $10,000 to $14,999 | 0 | 0.0% |
| $15,000 to $24,999 | 0 | 0.0% |
| $25,000 to $34,999 | 0 | 0.0% |
| $35,000 to $49,999 | 0 | 0.0% |
| $50,000 to $74,999 | 10 | 5.4% |
| $75,000 to $99,999 | 0 | 0.0% |
| $100,000 to $149,999 | 130 | 69.9% |
| $150,000 to $199,999 | 46 | 24.7% |
| $200,000+ | 0 | 0.0% |
Family Income by Famaliy Size in Old Forge
2-person families (177 | 95.2%) account for the highest median family income in Old Forge with $134,092 per family, while 2-person families (177 | 95.2%) have the highest median income of $67,046 per family member.
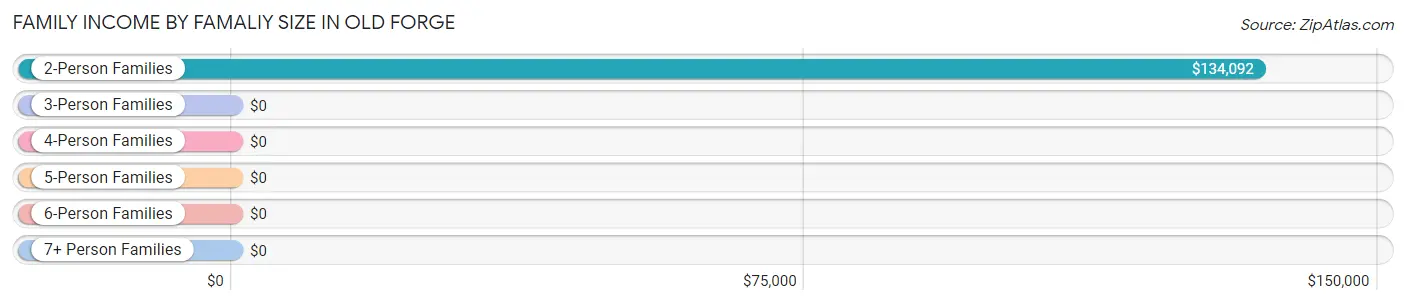
| Income Bracket | # Families | Median Income |
| 2-Person Families | 177 (95.2%) | $134,092 |
| 3-Person Families | 9 (4.8%) | $0 |
| 4-Person Families | 0 (0.0%) | $0 |
| 5-Person Families | 0 (0.0%) | $0 |
| 6-Person Families | 0 (0.0%) | $0 |
| 7+ Person Families | 0 (0.0%) | $0 |
| Total | 186 (100.0%) | $133,974 |
Family Income by Number of Earners in Old Forge
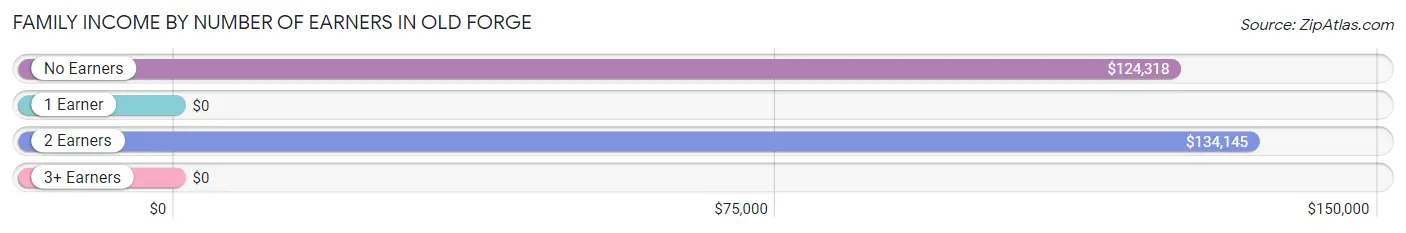
| Number of Earners | # Families | Median Income |
| No Earners | 22 (11.8%) | $124,318 |
| 1 Earner | 7 (3.8%) | $0 |
| 2 Earners | 157 (84.4%) | $134,145 |
| 3+ Earners | 0 (0.0%) | $0 |
| Total | 186 (100.0%) | $133,974 |
Household Income in Old Forge
Household Income Brackets in Old Forge
With 130 households falling in the category, the $100,000 to $149,999 income range is the most frequent in Old Forge, accounting for 45.3% of all households.
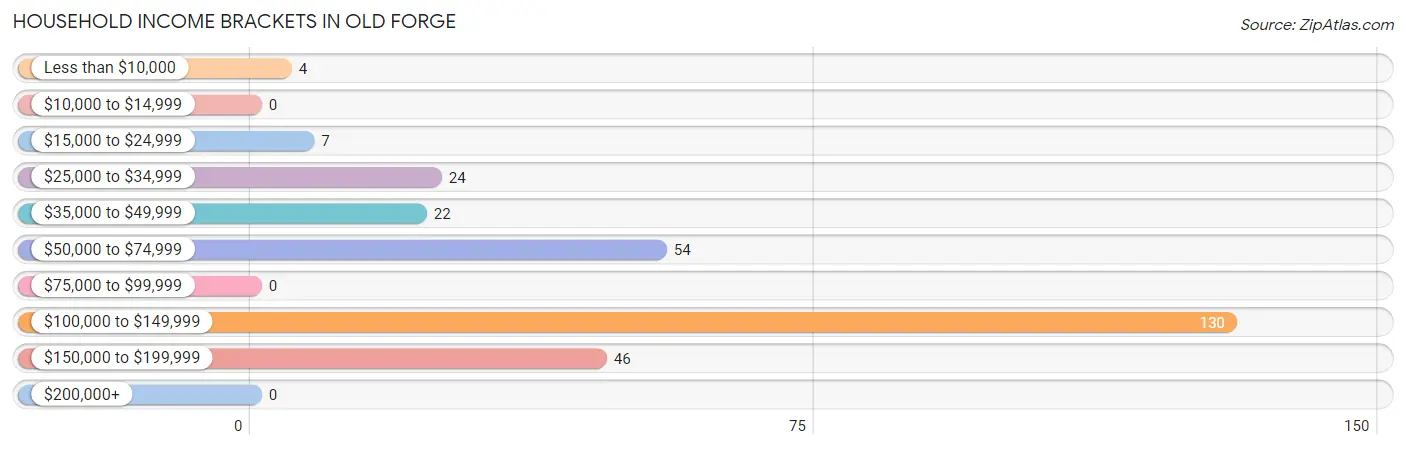
| Income Bracket | # Households | % Households |
| Less than $10,000 | 4 | 1.4% |
| $10,000 to $14,999 | 0 | 0.0% |
| $15,000 to $24,999 | 7 | 2.4% |
| $25,000 to $34,999 | 24 | 8.4% |
| $35,000 to $49,999 | 22 | 7.7% |
| $50,000 to $74,999 | 54 | 18.8% |
| $75,000 to $99,999 | 0 | 0.0% |
| $100,000 to $149,999 | 130 | 45.3% |
| $150,000 to $199,999 | 46 | 16.0% |
| $200,000+ | 0 | 0.0% |
Household Income by Householder Age in Old Forge
The median household income in Old Forge is $132,645, with the highest median household income of $42,386 found in the 65+ years age bracket for the primary householder. A total of 112 households (39.0%) fall into this category.
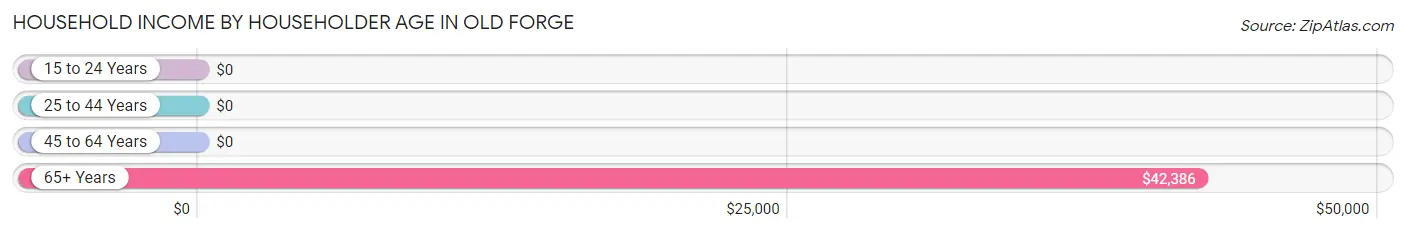
| Income Bracket | # Households | Median Income |
| 15 to 24 Years | 0 (0.0%) | $0 |
| 25 to 44 Years | 71 (24.7%) | $0 |
| 45 to 64 Years | 104 (36.2%) | $0 |
| 65+ Years | 112 (39.0%) | $42,386 |
| Total | 287 (100.0%) | $132,645 |
Poverty in Old Forge
Income Below Poverty by Sex and Age in Old Forge
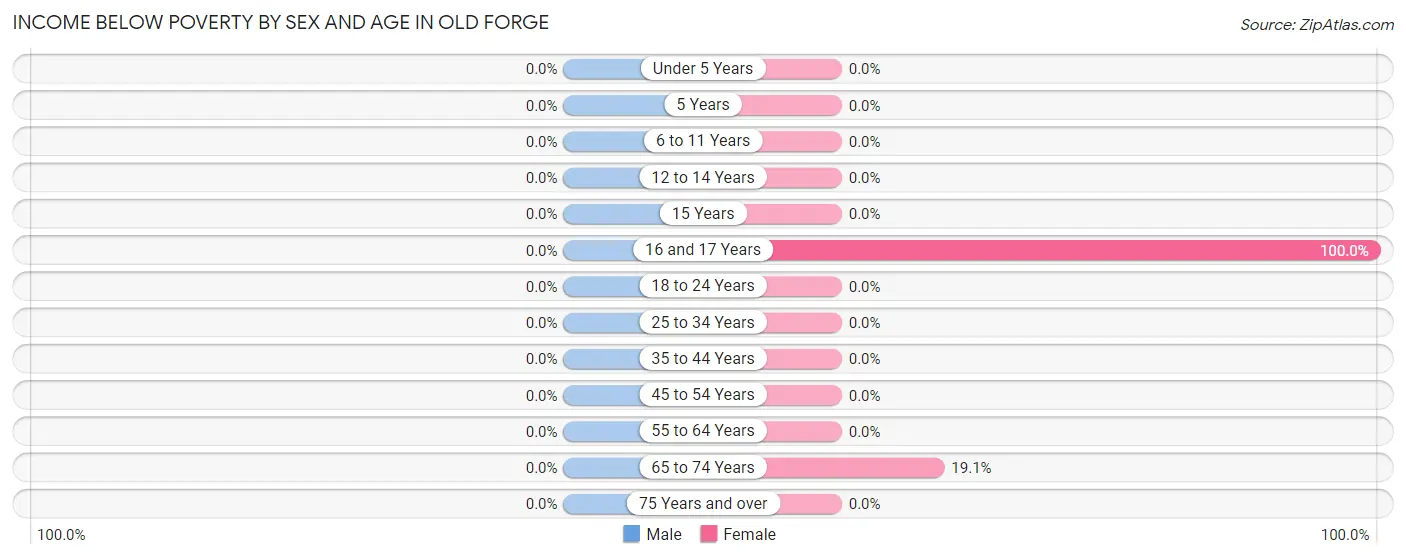
| Age Bracket | Male | Female |
| Under 5 Years | 0 (0.0%) | 0 (0.0%) |
| 5 Years | 0 (0.0%) | 0 (0.0%) |
| 6 to 11 Years | 0 (0.0%) | 0 (0.0%) |
| 12 to 14 Years | 0 (0.0%) | 0 (0.0%) |
| 15 Years | 0 (0.0%) | 0 (0.0%) |
| 16 and 17 Years | 0 (0.0%) | 24 (100.0%) |
| 18 to 24 Years | 0 (0.0%) | 0 (0.0%) |
| 25 to 34 Years | 0 (0.0%) | 0 (0.0%) |
| 35 to 44 Years | 0 (0.0%) | 0 (0.0%) |
| 45 to 54 Years | 0 (0.0%) | 0 (0.0%) |
| 55 to 64 Years | 0 (0.0%) | 0 (0.0%) |
| 65 to 74 Years | 0 (0.0%) | 4 (19.1%) |
| 75 Years and over | 0 (0.0%) | 0 (0.0%) |
| Total | 0 (0.0%) | 28 (10.7%) |
Income Above Poverty by Sex and Age in Old Forge
According to the poverty statistics in Old Forge, males aged 18 to 24 years and females aged 25 to 34 years are the age groups that are most secure financially, with 100.0% of males and 100.0% of females in these age groups living above the poverty line.
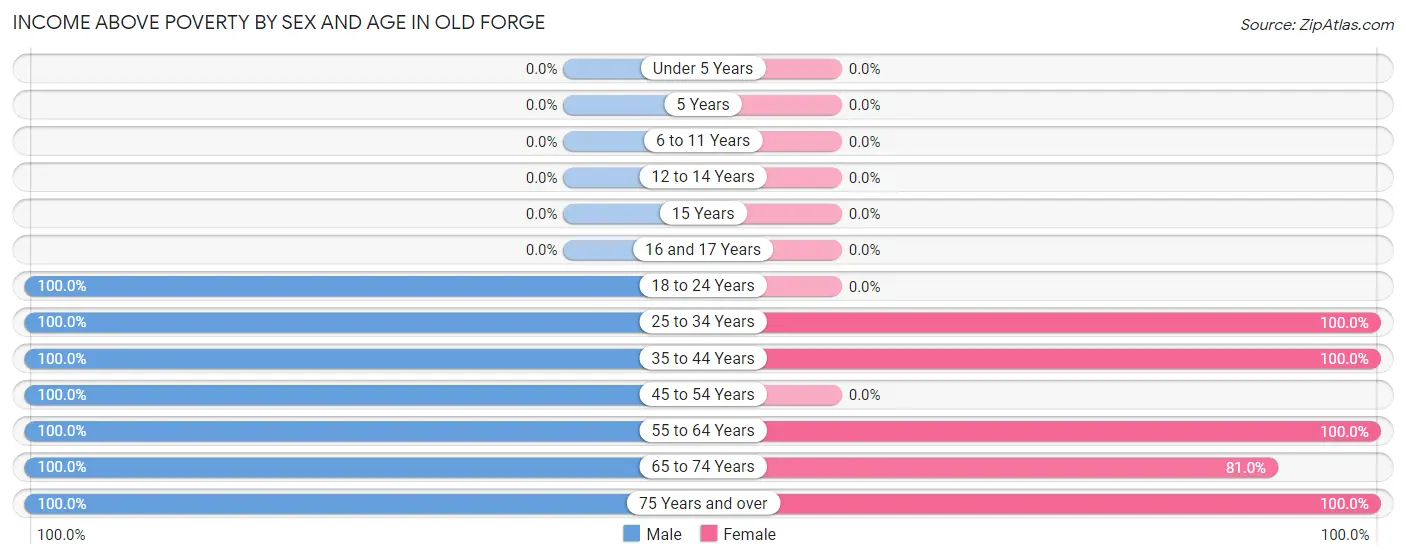
| Age Bracket | Male | Female |
| Under 5 Years | 0 (0.0%) | 0 (0.0%) |
| 5 Years | 0 (0.0%) | 0 (0.0%) |
| 6 to 11 Years | 0 (0.0%) | 0 (0.0%) |
| 12 to 14 Years | 0 (0.0%) | 0 (0.0%) |
| 15 Years | 0 (0.0%) | 0 (0.0%) |
| 16 and 17 Years | 0 (0.0%) | 0 (0.0%) |
| 18 to 24 Years | 25 (100.0%) | 0 (0.0%) |
| 25 to 34 Years | 25 (100.0%) | 27 (100.0%) |
| 35 to 44 Years | 58 (100.0%) | 36 (100.0%) |
| 45 to 54 Years | 19 (100.0%) | 0 (0.0%) |
| 55 to 64 Years | 105 (100.0%) | 103 (100.0%) |
| 65 to 74 Years | 20 (100.0%) | 17 (80.9%) |
| 75 Years and over | 60 (100.0%) | 50 (100.0%) |
| Total | 312 (100.0%) | 233 (89.3%) |
Income Below Poverty Among Married-Couple Families in Old Forge
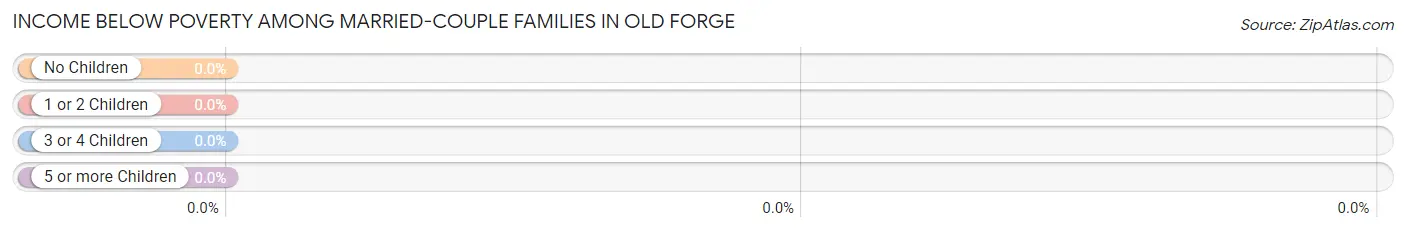
| Children | Above Poverty | Below Poverty |
| No Children | 186 (100.0%) | 0 (0.0%) |
| 1 or 2 Children | 0 (0.0%) | 0 (0.0%) |
| 3 or 4 Children | 0 (0.0%) | 0 (0.0%) |
| 5 or more Children | 0 (0.0%) | 0 (0.0%) |
| Total | 186 (100.0%) | 0 (0.0%) |
Income Below Poverty Among Single-Parent Households in Old Forge
| Children | Single Father | Single Mother |
| No Children | 0 (0.0%) | 0 (0.0%) |
| 1 or 2 Children | 0 (0.0%) | 0 (0.0%) |
| 3 or 4 Children | 0 (0.0%) | 0 (0.0%) |
| 5 or more Children | 0 (0.0%) | 0 (0.0%) |
| Total | 0 (0.0%) | 0 (0.0%) |
Income Below Poverty Among Married-Couple vs Single-Parent Households in Old Forge
| Children | Married-Couple Families | Single-Parent Households |
| No Children | 0 (0.0%) | 0 (0.0%) |
| 1 or 2 Children | 0 (0.0%) | 0 (0.0%) |
| 3 or 4 Children | 0 (0.0%) | 0 (0.0%) |
| 5 or more Children | 0 (0.0%) | 0 (0.0%) |
| Total | 0 (0.0%) | 0 (0.0%) |
Race in Old Forge
The most populous races in Old Forge are White / Caucasian (549 | 95.8%), and Black / African American (24 | 4.2%).
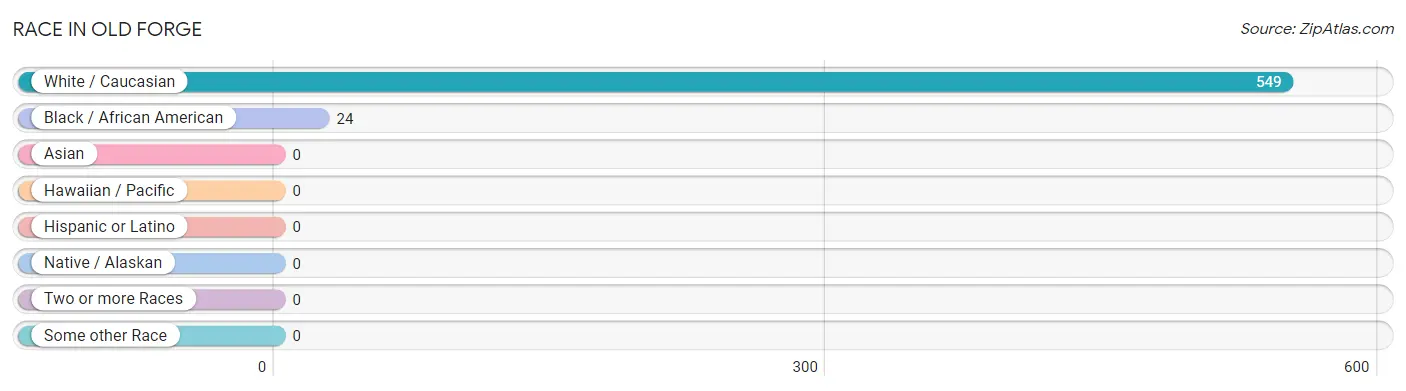
| Race | # Population | % Population |
| Asian | 0 | 0.0% |
| Black / African American | 24 | 4.2% |
| Hawaiian / Pacific | 0 | 0.0% |
| Hispanic or Latino | 0 | 0.0% |
| Native / Alaskan | 0 | 0.0% |
| White / Caucasian | 549 | 95.8% |
| Two or more Races | 0 | 0.0% |
| Some other Race | 0 | 0.0% |
| Total | 573 | 100.0% |
Ancestry in Old Forge
The most populous ancestries reported in Old Forge are Irish (238 | 41.5%), German (194 | 33.9%), French Canadian (96 | 16.8%), French (28 | 4.9%), and Swedish (27 | 4.7%), together accounting for 101.7% of all Old Forge residents.
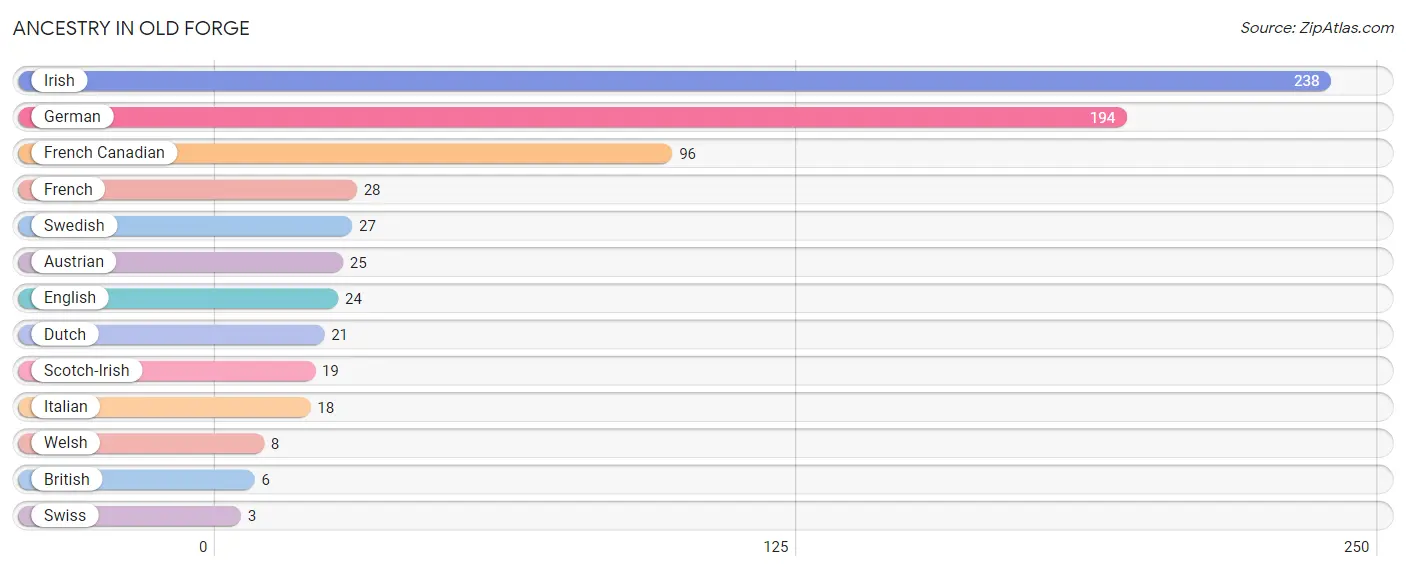
| Ancestry | # Population | % Population |
| Austrian | 25 | 4.4% |
| British | 6 | 1.1% |
| Dutch | 21 | 3.7% |
| English | 24 | 4.2% |
| French | 28 | 4.9% |
| French Canadian | 96 | 16.8% |
| German | 194 | 33.9% |
| Irish | 238 | 41.5% |
| Italian | 18 | 3.1% |
| Scotch-Irish | 19 | 3.3% |
| Swedish | 27 | 4.7% |
| Swiss | 3 | 0.5% |
| Welsh | 8 | 1.4% | View All 13 Rows |
Immigrants in Old Forge

| Immigration Origin | # Population | % Population | View All 0 Rows |
Sex and Age in Old Forge
Sex and Age in Old Forge
The most populous age groups in Old Forge are 55 to 59 Years (96 | 30.8%) for men and 55 to 59 Years (103 | 39.5%) for women.
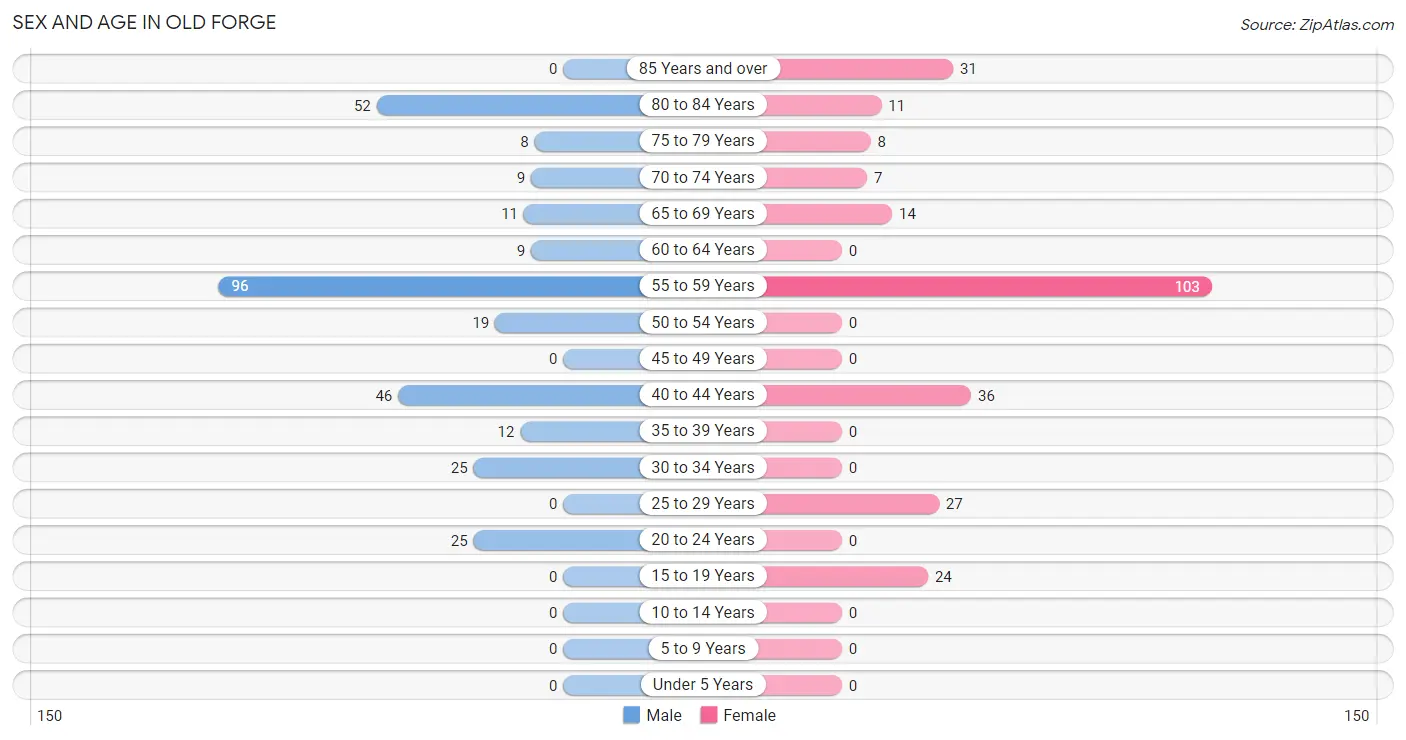
| Age Bracket | Male | Female |
| Under 5 Years | 0 (0.0%) | 0 (0.0%) |
| 5 to 9 Years | 0 (0.0%) | 0 (0.0%) |
| 10 to 14 Years | 0 (0.0%) | 0 (0.0%) |
| 15 to 19 Years | 0 (0.0%) | 24 (9.2%) |
| 20 to 24 Years | 25 (8.0%) | 0 (0.0%) |
| 25 to 29 Years | 0 (0.0%) | 27 (10.3%) |
| 30 to 34 Years | 25 (8.0%) | 0 (0.0%) |
| 35 to 39 Years | 12 (3.8%) | 0 (0.0%) |
| 40 to 44 Years | 46 (14.7%) | 36 (13.8%) |
| 45 to 49 Years | 0 (0.0%) | 0 (0.0%) |
| 50 to 54 Years | 19 (6.1%) | 0 (0.0%) |
| 55 to 59 Years | 96 (30.8%) | 103 (39.5%) |
| 60 to 64 Years | 9 (2.9%) | 0 (0.0%) |
| 65 to 69 Years | 11 (3.5%) | 14 (5.4%) |
| 70 to 74 Years | 9 (2.9%) | 7 (2.7%) |
| 75 to 79 Years | 8 (2.6%) | 8 (3.1%) |
| 80 to 84 Years | 52 (16.7%) | 11 (4.2%) |
| 85 Years and over | 0 (0.0%) | 31 (11.9%) |
| Total | 312 (100.0%) | 261 (100.0%) |
Families and Households in Old Forge
Median Family Size in Old Forge
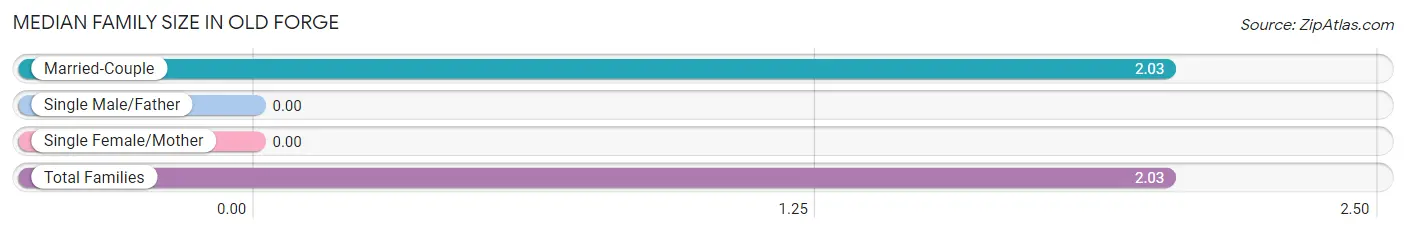
| Family Type | # Families | Family Size |
| Married-Couple | 186 (100.0%) | 2.03 |
| Single Male/Father | 0 (0.0%) | - |
| Single Female/Mother | 0 (0.0%) | - |
| Total Families | 186 (100.0%) | 2.03 |
Median Household Size in Old Forge
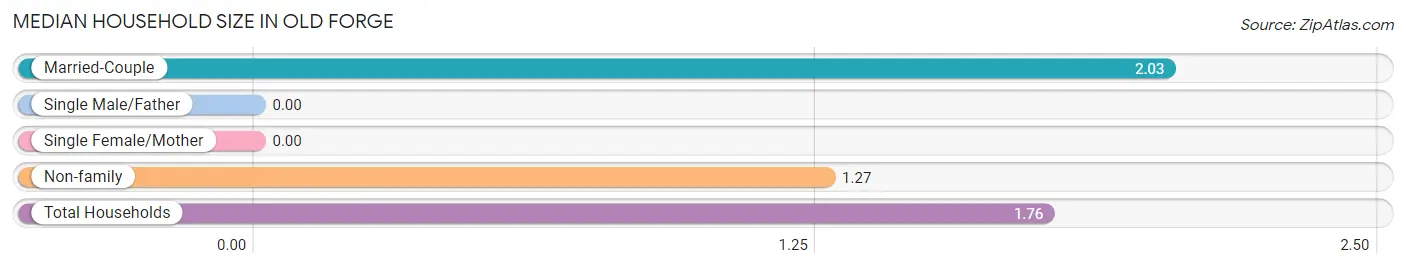
| Household Type | # Households | Household Size |
| Married-Couple | 186 (64.8%) | 2.03 |
| Single Male/Father | 0 (0.0%) | - |
| Single Female/Mother | 0 (0.0%) | - |
| Non-family | 101 (35.2%) | 1.27 |
| Total Households | 287 (100.0%) | 1.76 |
Household Size by Marriage Status in Old Forge
Out of a total of 287 households in Old Forge, 186 (64.8%) are family households, while 101 (35.2%) are nonfamily households. The most numerous type of family households are 2-person households, comprising 177, and the most common type of nonfamily households are 1-person households, comprising 76.
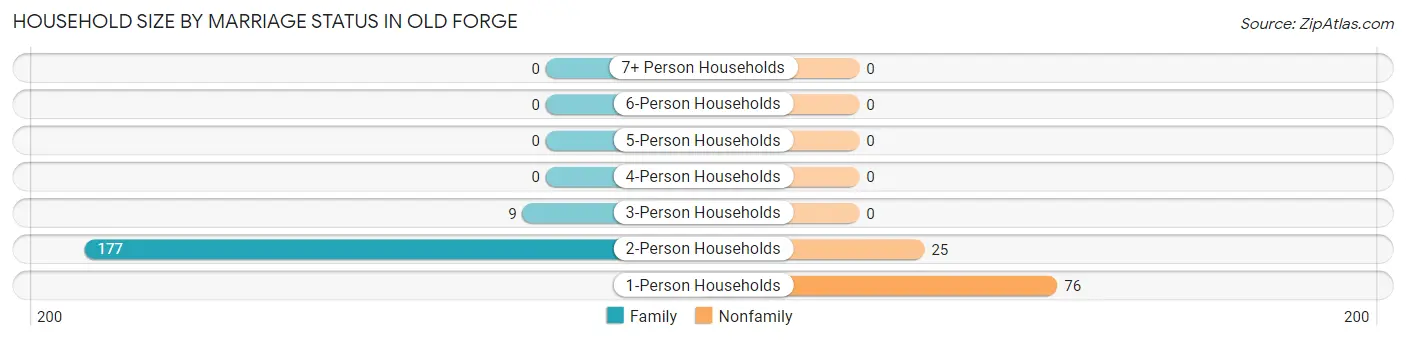
| Household Size | Family Households | Nonfamily Households |
| 1-Person Households | - | 76 (26.5%) |
| 2-Person Households | 177 (61.7%) | 25 (8.7%) |
| 3-Person Households | 9 (3.1%) | 0 (0.0%) |
| 4-Person Households | 0 (0.0%) | 0 (0.0%) |
| 5-Person Households | 0 (0.0%) | 0 (0.0%) |
| 6-Person Households | 0 (0.0%) | 0 (0.0%) |
| 7+ Person Households | 0 (0.0%) | 0 (0.0%) |
| Total | 186 (64.8%) | 101 (35.2%) |
Female Fertility in Old Forge
Fertility by Age in Old Forge
| Age Bracket | Women with Births | Births / 1,000 Women |
| 15 to 19 years | 0 (0.0%) | 0.0 |
| 20 to 34 years | 0 (0.0%) | 0.0 |
| 35 to 50 years | 0 (0.0%) | 0.0 |
| Total | 0 (0.0%) | 0.0 |
Fertility by Age by Marriage Status in Old Forge
| Age Bracket | Married | Unmarried |
| 15 to 19 years | 0 (0.0%) | 0 (0.0%) |
| 20 to 34 years | 0 (0.0%) | 0 (0.0%) |
| 35 to 50 years | 0 (0.0%) | 0 (0.0%) |
| Total | 0 (0.0%) | 0 (0.0%) |
Fertility by Education in Old Forge
| Educational Attainment | Women with Births | Births / 1,000 Women |
| Less than High School | 0 (0.0%) | 0.0 |
| High School Diploma | 0 (0.0%) | 0.0 |
| College or Associate's Degree | 0 (0.0%) | 0.0 |
| Bachelor's Degree | 0 (0.0%) | 0.0 |
| Graduate Degree | 0 (0.0%) | 0.0 |
| Total | 0 (0.0%) | 0.0 |
Fertility by Education by Marriage Status in Old Forge
| Educational Attainment | Married | Unmarried |
| Less than High School | 0 (0.0%) | 0 (0.0%) |
| High School Diploma | 0 (0.0%) | 0 (0.0%) |
| College or Associate's Degree | 0 (0.0%) | 0 (0.0%) |
| Bachelor's Degree | 0 (0.0%) | 0 (0.0%) |
| Graduate Degree | 0 (0.0%) | 0 (0.0%) |
| Total | 0 (0.0%) | 0 (0.0%) |
Employment Characteristics in Old Forge
Employment by Class of Employer in Old Forge
Among the 366 employed individuals in Old Forge, private company employees (322 | 88.0%), self-employed (incorporated) (25 | 6.8%), and not-for-profit organizations (19 | 5.2%) make up the most common classes of employment.
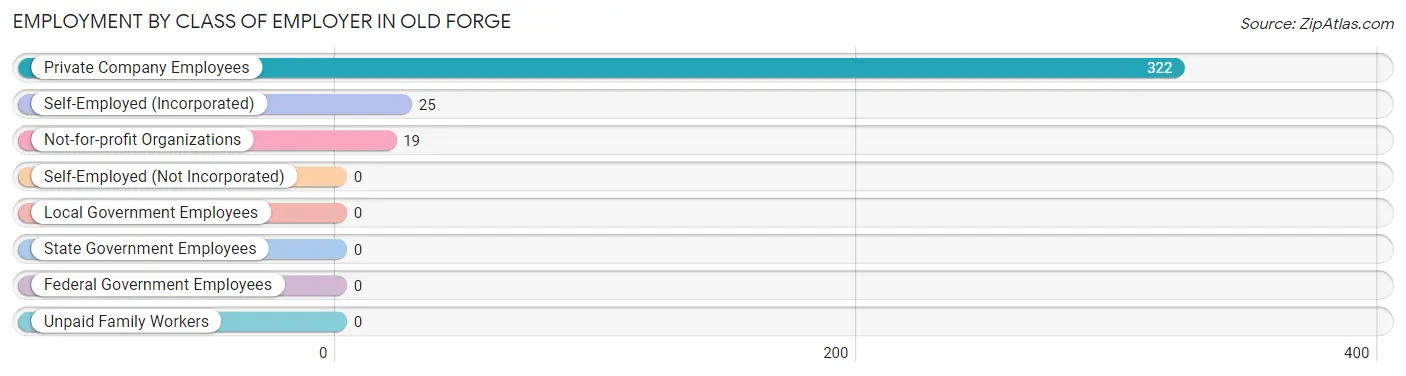
| Employer Class | # Employees | % Employees |
| Private Company Employees | 322 | 88.0% |
| Self-Employed (Incorporated) | 25 | 6.8% |
| Self-Employed (Not Incorporated) | 0 | 0.0% |
| Not-for-profit Organizations | 19 | 5.2% |
| Local Government Employees | 0 | 0.0% |
| State Government Employees | 0 | 0.0% |
| Federal Government Employees | 0 | 0.0% |
| Unpaid Family Workers | 0 | 0.0% |
| Total | 366 | 100.0% |
Employment Status by Age in Old Forge
According to the labor force statistics for Old Forge, out of the total population over 16 years of age (573), 71.6% or 410 individuals are in the labor force, with 8.8% or 36 of them unemployed. The age group with the highest labor force participation rate is 20 to 24 years, with 100.0% or 25 individuals in the labor force. Within the labor force, the 35 to 44 years age range has the highest percentage of unemployed individuals, with 43.9% or 36 of them being unemployed.
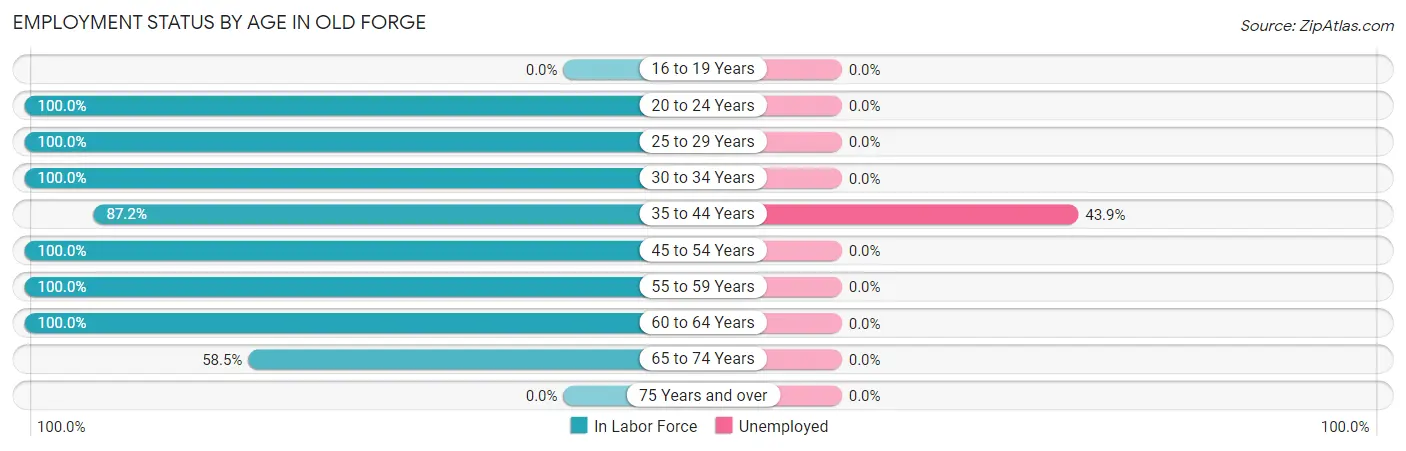
| Age Bracket | In Labor Force | Unemployed |
| 16 to 19 Years | 0 (0.0%) | 0 (0.0%) |
| 20 to 24 Years | 25 (100.0%) | 0 (0.0%) |
| 25 to 29 Years | 27 (100.0%) | 0 (0.0%) |
| 30 to 34 Years | 25 (100.0%) | 0 (0.0%) |
| 35 to 44 Years | 82 (87.2%) | 36 (43.9%) |
| 45 to 54 Years | 19 (100.0%) | 0 (0.0%) |
| 55 to 59 Years | 199 (100.0%) | 0 (0.0%) |
| 60 to 64 Years | 9 (100.0%) | 0 (0.0%) |
| 65 to 74 Years | 24 (58.5%) | 0 (0.0%) |
| 75 Years and over | 0 (0.0%) | 0 (0.0%) |
| Total | 410 (71.6%) | 36 (8.8%) |
Employment Status by Educational Attainment in Old Forge
According to labor force statistics for Old Forge, 96.8% of individuals (361) out of the total population between 25 and 64 years of age (373) are in the labor force, with 10.0% or 36 of them being unemployed. The group with the highest labor force participation rate are those with the educational attainment of less than high school, with 100.0% or 104 individuals in the labor force. Within the labor force, individuals with bachelor's degree or higher education have the highest percentage of unemployment, with 23.5% or 36 of them being unemployed.
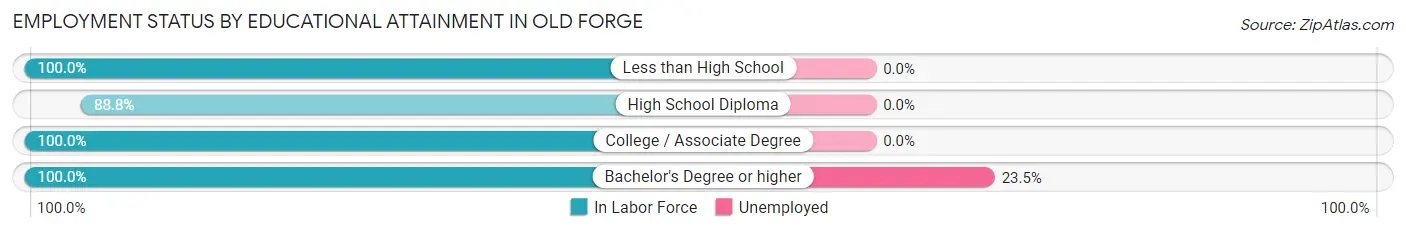
| Educational Attainment | In Labor Force | Unemployed |
| Less than High School | 104 (100.0%) | 0 (0.0%) |
| High School Diploma | 95 (88.8%) | 0 (0.0%) |
| College / Associate Degree | 9 (100.0%) | 0 (0.0%) |
| Bachelor's Degree or higher | 153 (100.0%) | 36 (23.5%) |
| Total | 361 (96.8%) | 37 (10.0%) |
Employment Occupations by Sex in Old Forge
Management, Business, Science and Arts Occupations
The most common Management, Business, Science and Arts occupations in Old Forge are Computers, Engineering & Science (46 | 12.3%), Architecture & Engineering (46 | 12.3%), Community & Social Service (28 | 7.5%), Education, Arts & Media (19 | 5.1%), and Legal Services & Support (9 | 2.4%).
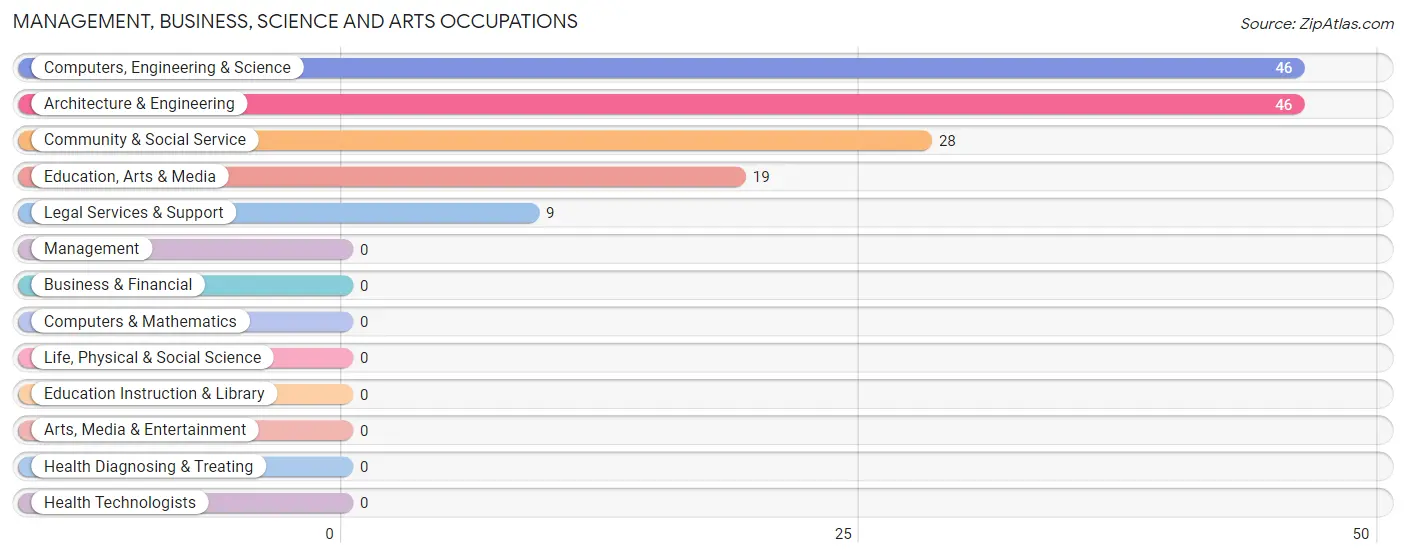
Management, Business, Science and Arts Occupations by Sex
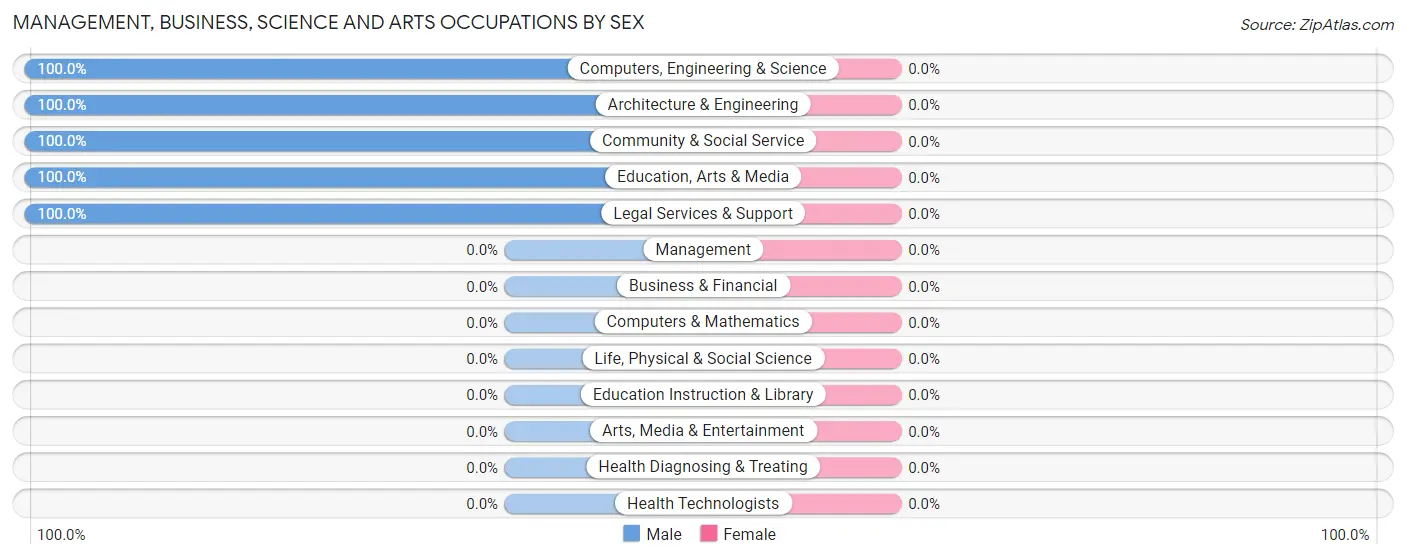
| Occupation | Male | Female |
| Management | 0 (0.0%) | 0 (0.0%) |
| Business & Financial | 0 (0.0%) | 0 (0.0%) |
| Computers, Engineering & Science | 46 (100.0%) | 0 (0.0%) |
| Computers & Mathematics | 0 (0.0%) | 0 (0.0%) |
| Architecture & Engineering | 46 (100.0%) | 0 (0.0%) |
| Life, Physical & Social Science | 0 (0.0%) | 0 (0.0%) |
| Community & Social Service | 28 (100.0%) | 0 (0.0%) |
| Education, Arts & Media | 19 (100.0%) | 0 (0.0%) |
| Legal Services & Support | 9 (100.0%) | 0 (0.0%) |
| Education Instruction & Library | 0 (0.0%) | 0 (0.0%) |
| Arts, Media & Entertainment | 0 (0.0%) | 0 (0.0%) |
| Health Diagnosing & Treating | 0 (0.0%) | 0 (0.0%) |
| Health Technologists | 0 (0.0%) | 0 (0.0%) |
| Total (Category) | 74 (100.0%) | 0 (0.0%) |
| Total (Overall) | 237 (63.4%) | 137 (36.6%) |
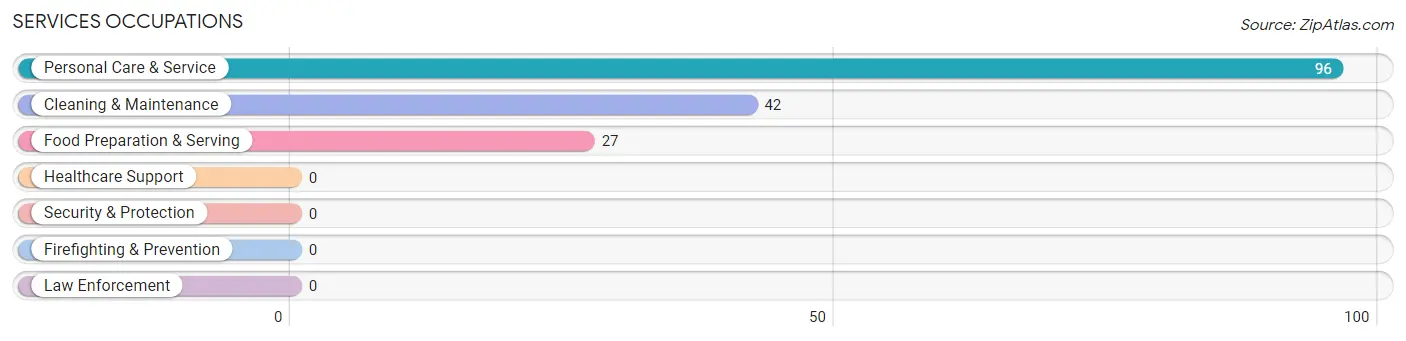
Services Occupations
The most common Services occupations in Old Forge are Personal Care & Service (96 | 25.7%), Cleaning & Maintenance (42 | 11.2%), and Food Preparation & Serving (27 | 7.2%).
Services Occupations by Sex
Within the Services occupations in Old Forge, the most male-oriented occupations are Personal Care & Service (100.0%), and Cleaning & Maintenance (80.9%), while the most female-oriented occupations are Food Preparation & Serving (100.0%), and Cleaning & Maintenance (19.1%).
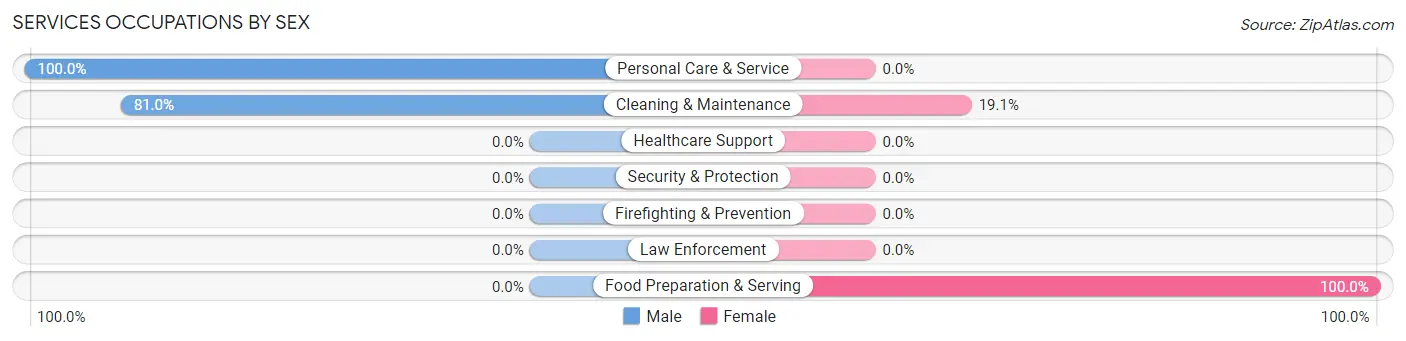
| Occupation | Male | Female |
| Healthcare Support | 0 (0.0%) | 0 (0.0%) |
| Security & Protection | 0 (0.0%) | 0 (0.0%) |
| Firefighting & Prevention | 0 (0.0%) | 0 (0.0%) |
| Law Enforcement | 0 (0.0%) | 0 (0.0%) |
| Food Preparation & Serving | 0 (0.0%) | 27 (100.0%) |
| Cleaning & Maintenance | 34 (80.9%) | 8 (19.1%) |
| Personal Care & Service | 96 (100.0%) | 0 (0.0%) |
| Total (Category) | 130 (78.8%) | 35 (21.2%) |
| Total (Overall) | 237 (63.4%) | 137 (36.6%) |
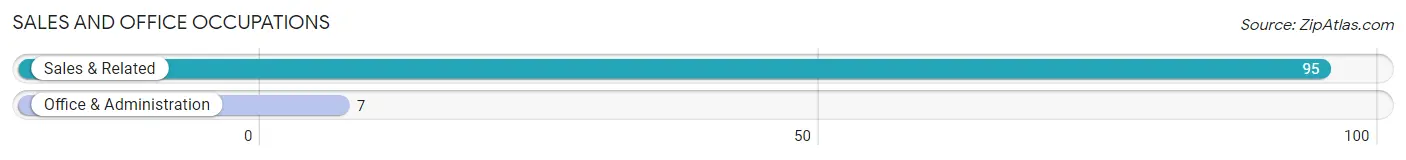
Sales and Office Occupations
The most common Sales and Office occupations in Old Forge are Sales & Related (95 | 25.4%), and Office & Administration (7 | 1.9%).
Sales and Office Occupations by Sex
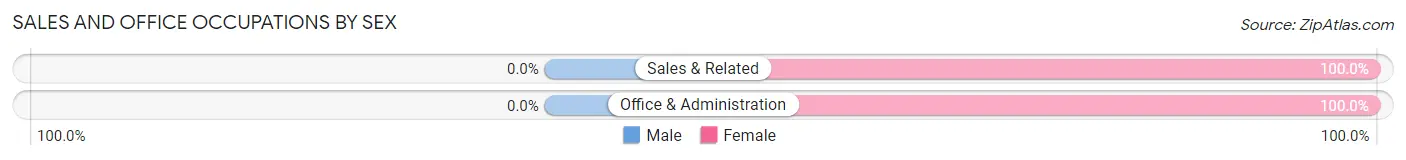
| Occupation | Male | Female |
| Sales & Related | 0 (0.0%) | 95 (100.0%) |
| Office & Administration | 0 (0.0%) | 7 (100.0%) |
| Total (Category) | 0 (0.0%) | 102 (100.0%) |
| Total (Overall) | 237 (63.4%) | 137 (36.6%) |
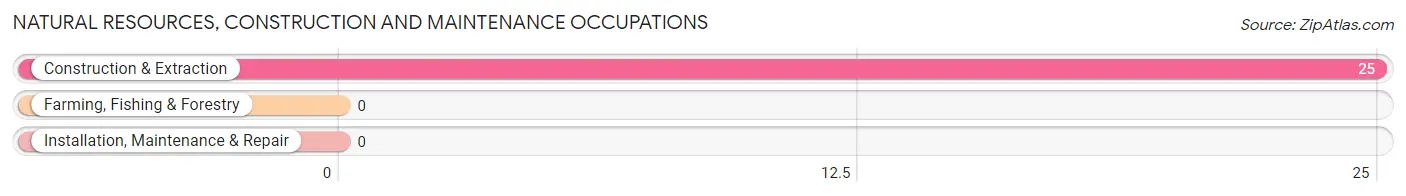
Natural Resources, Construction and Maintenance Occupations
The most common Natural Resources, Construction and Maintenance occupations in Old Forge are , and Construction & Extraction (25 | 6.7%).
Natural Resources, Construction and Maintenance Occupations by Sex
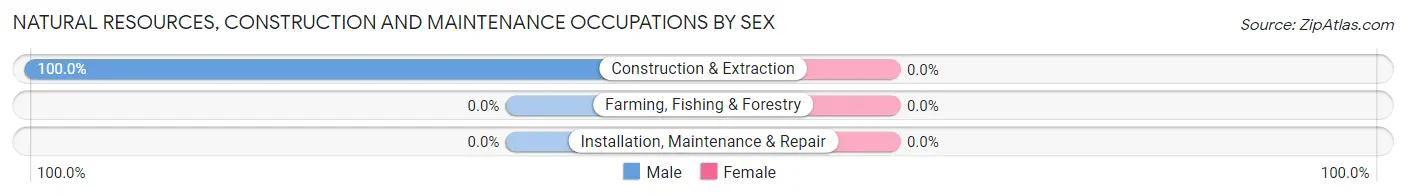
| Occupation | Male | Female |
| Farming, Fishing & Forestry | 0 (0.0%) | 0 (0.0%) |
| Construction & Extraction | 25 (100.0%) | 0 (0.0%) |
| Installation, Maintenance & Repair | 0 (0.0%) | 0 (0.0%) |
| Total (Category) | 25 (100.0%) | 0 (0.0%) |
| Total (Overall) | 237 (63.4%) | 137 (36.6%) |
Production, Transportation and Moving Occupations
The most common Production, Transportation and Moving occupations in Old Forge are , and Transportation (8 | 2.1%).
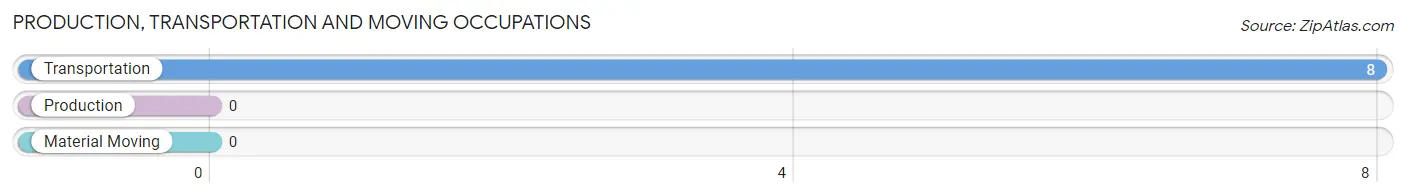
Production, Transportation and Moving Occupations by Sex
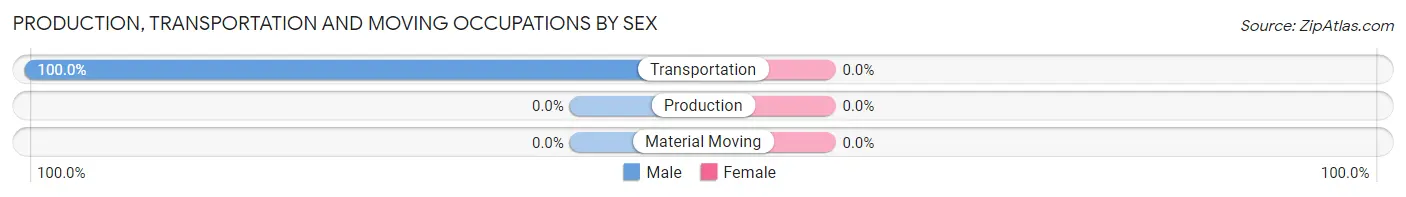
| Occupation | Male | Female |
| Production | 0 (0.0%) | 0 (0.0%) |
| Transportation | 8 (100.0%) | 0 (0.0%) |
| Material Moving | 0 (0.0%) | 0 (0.0%) |
| Total (Category) | 8 (100.0%) | 0 (0.0%) |
| Total (Overall) | 237 (63.4%) | 137 (36.6%) |
Employment Industries by Sex in Old Forge
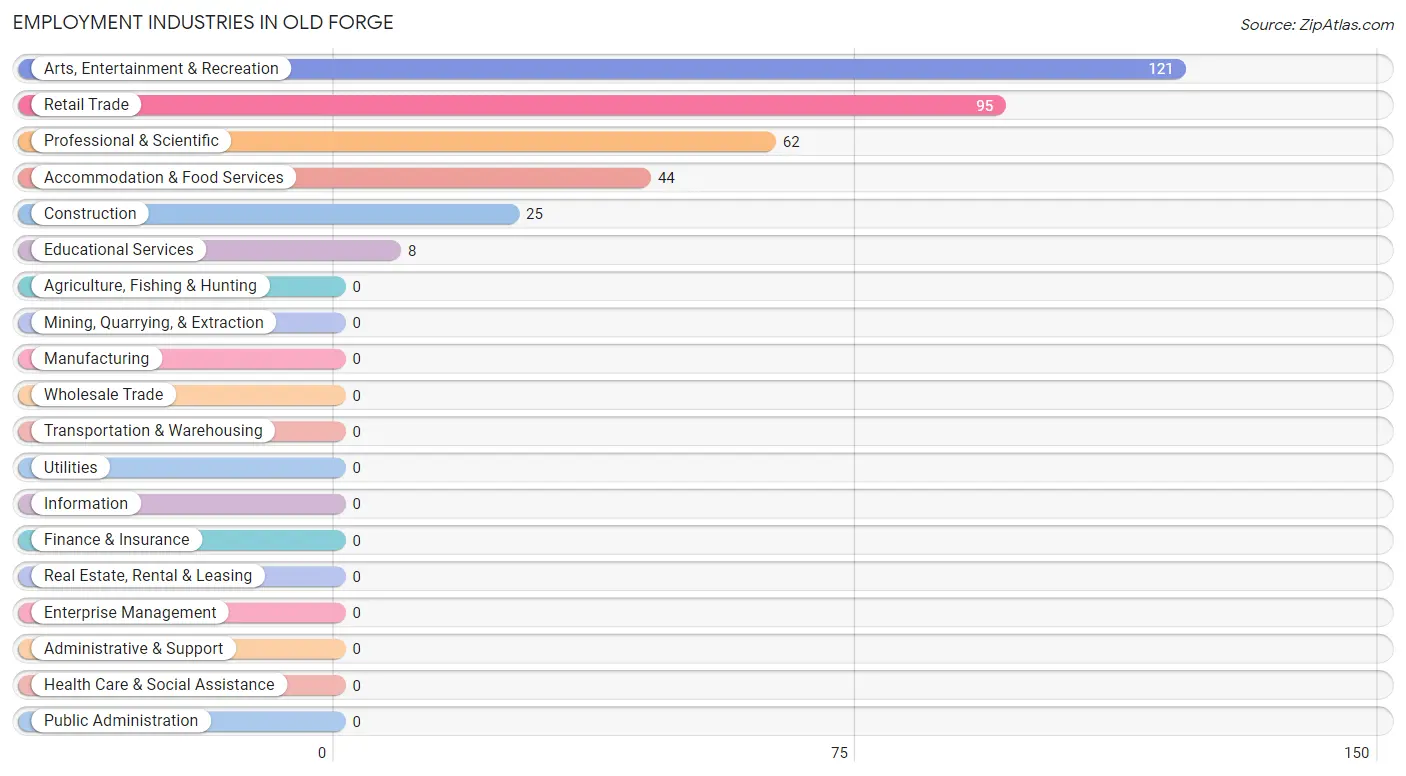
Employment Industries in Old Forge
The major employment industries in Old Forge include Arts, Entertainment & Recreation (121 | 32.4%), Retail Trade (95 | 25.4%), Professional & Scientific (62 | 16.6%), Accommodation & Food Services (44 | 11.8%), and Construction (25 | 6.7%).
Employment Industries by Sex in Old Forge
The Old Forge industries that see more men than women are Construction (100.0%), Educational Services (100.0%), and Arts, Entertainment & Recreation (100.0%), whereas the industries that tend to have a higher number of women are Retail Trade (100.0%), Accommodation & Food Services (79.5%), and Professional & Scientific (11.3%).
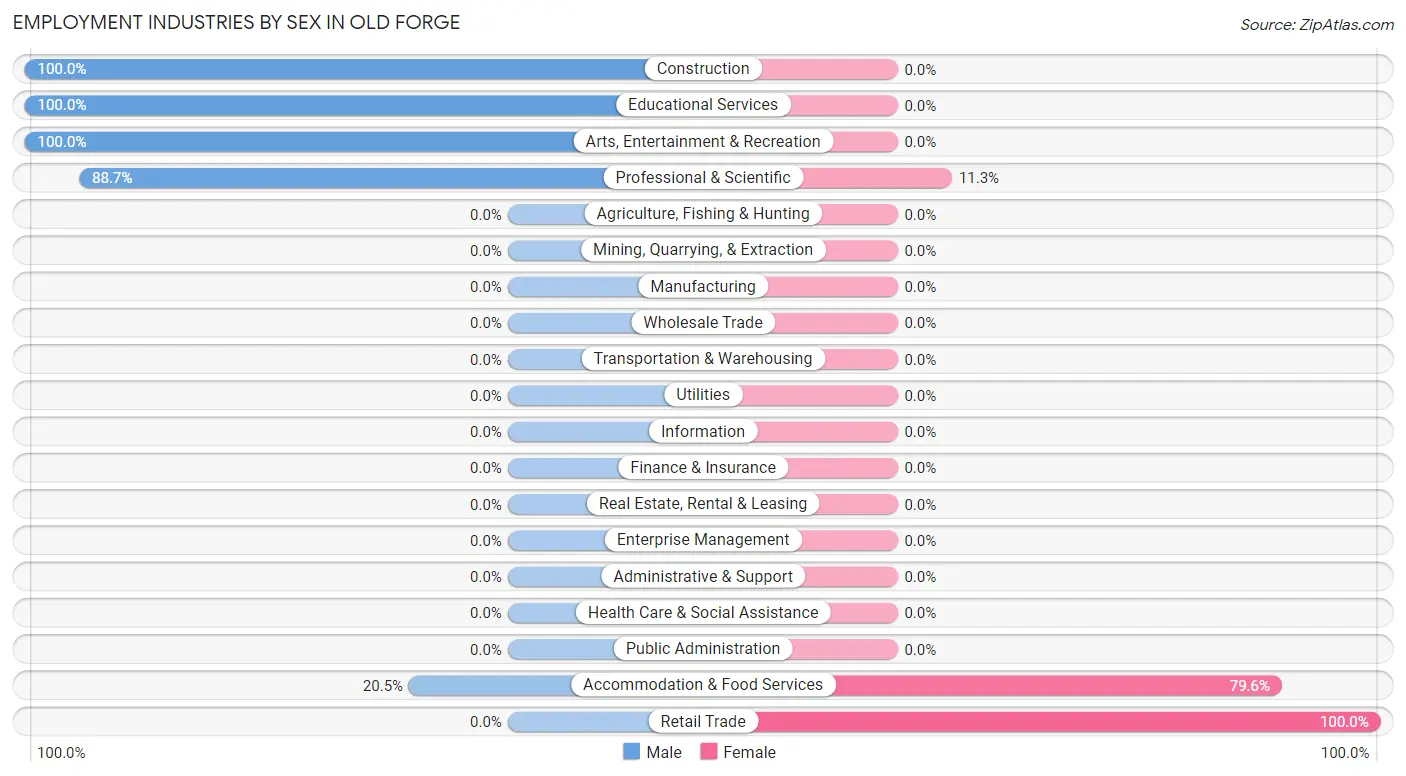
| Industry | Male | Female |
| Agriculture, Fishing & Hunting | 0 (0.0%) | 0 (0.0%) |
| Mining, Quarrying, & Extraction | 0 (0.0%) | 0 (0.0%) |
| Construction | 25 (100.0%) | 0 (0.0%) |
| Manufacturing | 0 (0.0%) | 0 (0.0%) |
| Wholesale Trade | 0 (0.0%) | 0 (0.0%) |
| Retail Trade | 0 (0.0%) | 95 (100.0%) |
| Transportation & Warehousing | 0 (0.0%) | 0 (0.0%) |
| Utilities | 0 (0.0%) | 0 (0.0%) |
| Information | 0 (0.0%) | 0 (0.0%) |
| Finance & Insurance | 0 (0.0%) | 0 (0.0%) |
| Real Estate, Rental & Leasing | 0 (0.0%) | 0 (0.0%) |
| Professional & Scientific | 55 (88.7%) | 7 (11.3%) |
| Enterprise Management | 0 (0.0%) | 0 (0.0%) |
| Administrative & Support | 0 (0.0%) | 0 (0.0%) |
| Educational Services | 8 (100.0%) | 0 (0.0%) |
| Health Care & Social Assistance | 0 (0.0%) | 0 (0.0%) |
| Arts, Entertainment & Recreation | 121 (100.0%) | 0 (0.0%) |
| Accommodation & Food Services | 9 (20.4%) | 35 (79.5%) |
| Public Administration | 0 (0.0%) | 0 (0.0%) |
| Total | 237 (63.4%) | 137 (36.6%) |
Education in Old Forge
School Enrollment in Old Forge
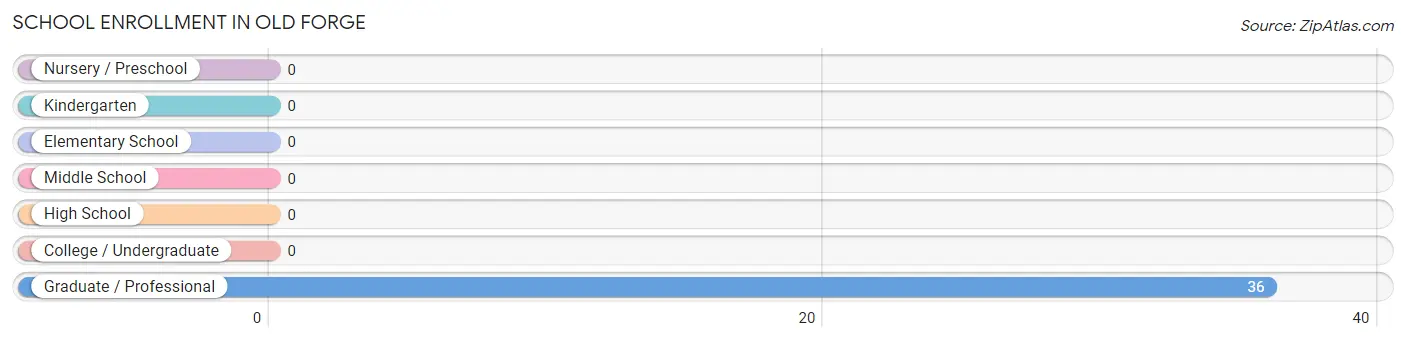
| School Level | # Students | % Students |
| Nursery / Preschool | 0 | 0.0% |
| Kindergarten | 0 | 0.0% |
| Elementary School | 0 | 0.0% |
| Middle School | 0 | 0.0% |
| High School | 0 | 0.0% |
| College / Undergraduate | 0 | 0.0% |
| Graduate / Professional | 36 | 100.0% |
| Total | 36 | 100.0% |
School Enrollment by Age by Funding Source in Old Forge
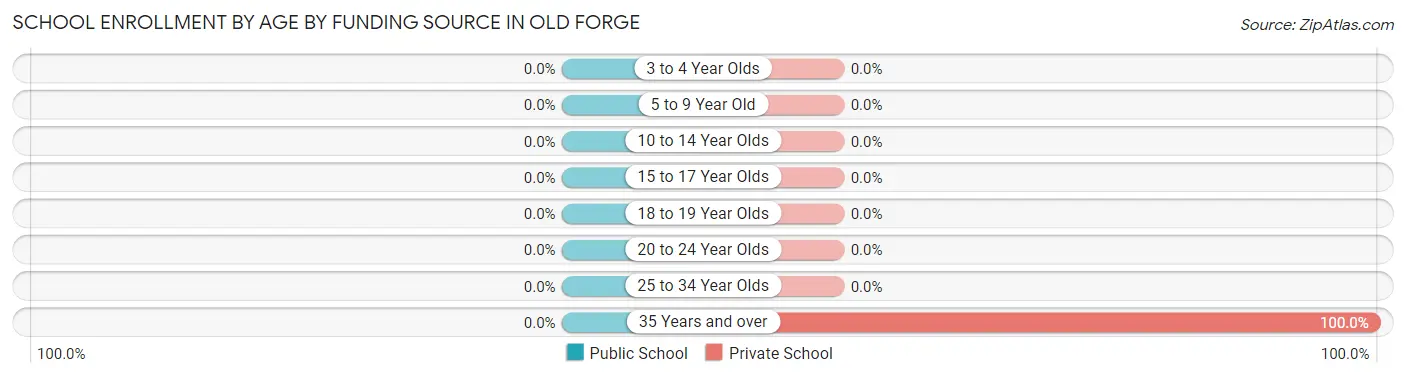
| Age Bracket | Public School | Private School |
| 3 to 4 Year Olds | 0 (0.0%) | 0 (0.0%) |
| 5 to 9 Year Old | 0 (0.0%) | 0 (0.0%) |
| 10 to 14 Year Olds | 0 (0.0%) | 0 (0.0%) |
| 15 to 17 Year Olds | 0 (0.0%) | 0 (0.0%) |
| 18 to 19 Year Olds | 0 (0.0%) | 0 (0.0%) |
| 20 to 24 Year Olds | 0 (0.0%) | 0 (0.0%) |
| 25 to 34 Year Olds | 0 (0.0%) | 0 (0.0%) |
| 35 Years and over | 0 (0.0%) | 36 (100.0%) |
| Total | 0 (0.0%) | 36 (100.0%) |
Educational Attainment by Field of Study in Old Forge
Education (82 | 38.1%), science & technology (46 | 21.4%), business (28 | 13.0%), bio, nature & agricultural (27 | 12.6%), and engineering (25 | 11.6%) are the most common fields of study among 215 individuals in Old Forge who have obtained a bachelor's degree or higher.
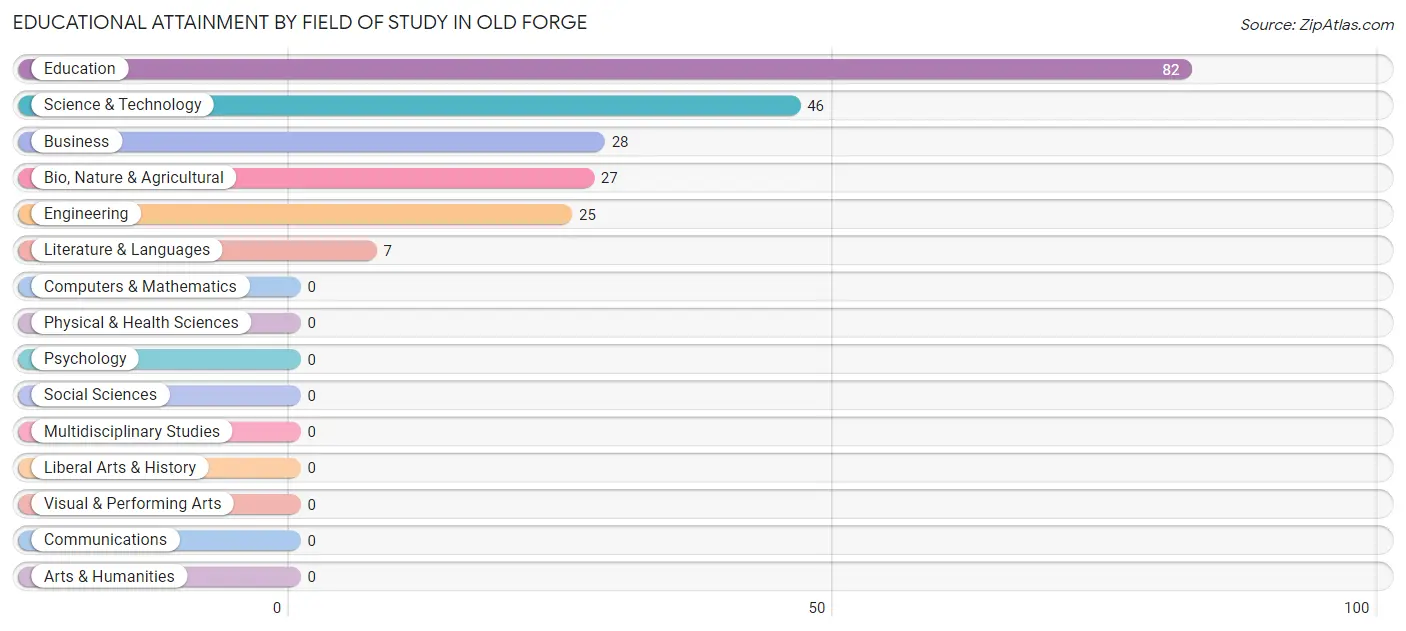
| Field of Study | # Graduates | % Graduates |
| Computers & Mathematics | 0 | 0.0% |
| Bio, Nature & Agricultural | 27 | 12.6% |
| Physical & Health Sciences | 0 | 0.0% |
| Psychology | 0 | 0.0% |
| Social Sciences | 0 | 0.0% |
| Engineering | 25 | 11.6% |
| Multidisciplinary Studies | 0 | 0.0% |
| Science & Technology | 46 | 21.4% |
| Business | 28 | 13.0% |
| Education | 82 | 38.1% |
| Literature & Languages | 7 | 3.3% |
| Liberal Arts & History | 0 | 0.0% |
| Visual & Performing Arts | 0 | 0.0% |
| Communications | 0 | 0.0% |
| Arts & Humanities | 0 | 0.0% |
| Total | 215 | 100.0% |
Transportation & Commute in Old Forge
Vehicle Availability by Sex in Old Forge
The most prevalent vehicle ownership categories in Old Forge are males with 2 vehicles (151, accounting for 81.6%) and females with 2 vehicles (102, making up 110.2%).
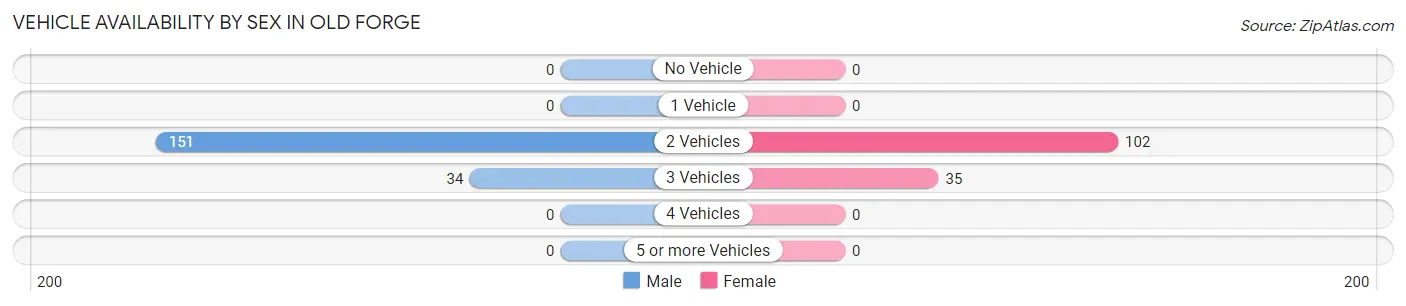
| Vehicles Available | Male | Female |
| No Vehicle | 0 (0.0%) | 0 (0.0%) |
| 1 Vehicle | 0 (0.0%) | 0 (0.0%) |
| 2 Vehicles | 151 (81.6%) | 102 (74.5%) |
| 3 Vehicles | 34 (18.4%) | 35 (25.6%) |
| 4 Vehicles | 0 (0.0%) | 0 (0.0%) |
| 5 or more Vehicles | 0 (0.0%) | 0 (0.0%) |
| Total | 185 (100.0%) | 137 (100.0%) |
Commute Time in Old Forge
The most frequently occuring commute durations in Old Forge are less than 5 minutes (218 commuters, 67.7%), 10 to 14 minutes (71 commuters, 22.1%), and 5 to 9 minutes (17 commuters, 5.3%).
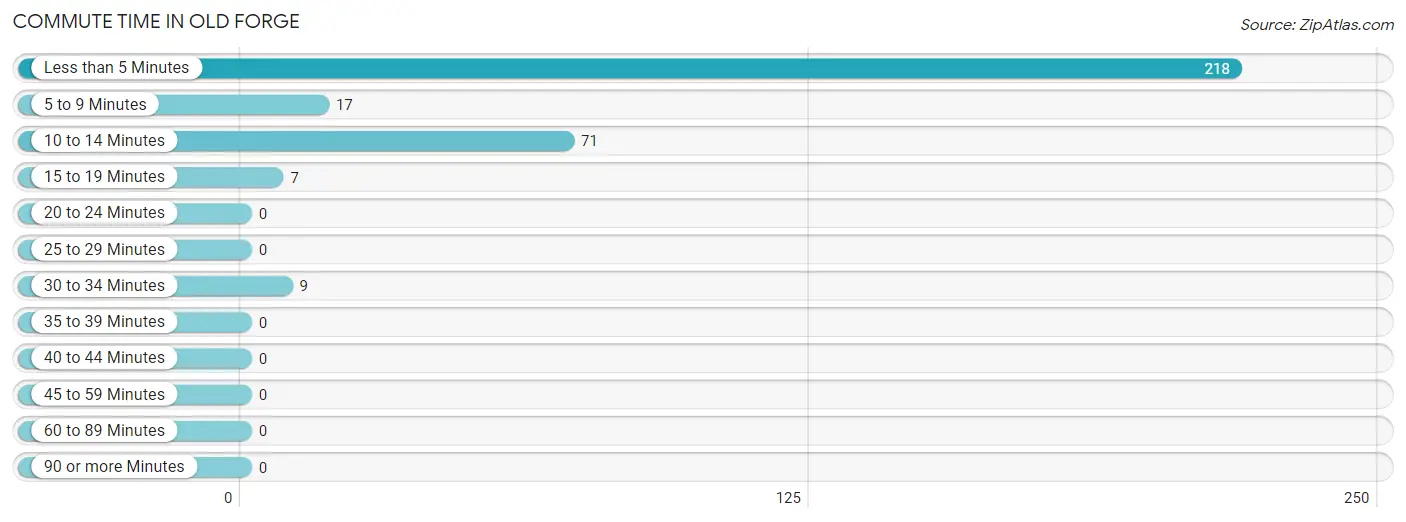
| Commute Time | # Commuters | % Commuters |
| Less than 5 Minutes | 218 | 67.7% |
| 5 to 9 Minutes | 17 | 5.3% |
| 10 to 14 Minutes | 71 | 22.1% |
| 15 to 19 Minutes | 7 | 2.2% |
| 20 to 24 Minutes | 0 | 0.0% |
| 25 to 29 Minutes | 0 | 0.0% |
| 30 to 34 Minutes | 9 | 2.8% |
| 35 to 39 Minutes | 0 | 0.0% |
| 40 to 44 Minutes | 0 | 0.0% |
| 45 to 59 Minutes | 0 | 0.0% |
| 60 to 89 Minutes | 0 | 0.0% |
| 90 or more Minutes | 0 | 0.0% |
Commute Time by Sex in Old Forge
The most common commute times in Old Forge are less than 5 minutes (96 commuters, 51.9%) for males and less than 5 minutes (122 commuters, 89.0%) for females.
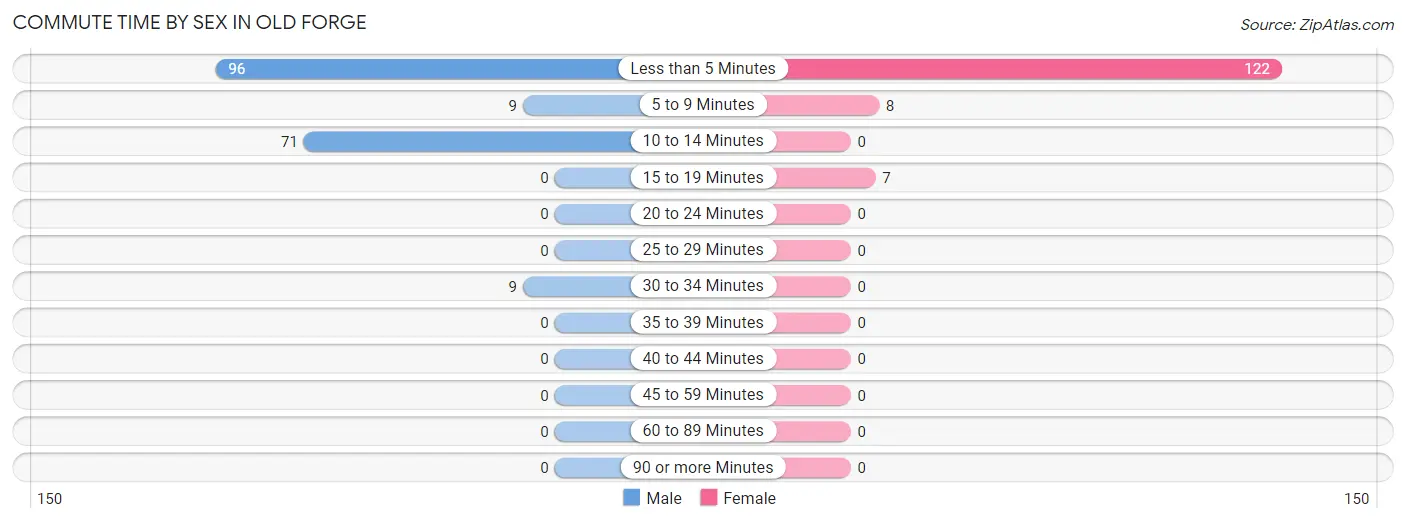
| Commute Time | Male | Female |
| Less than 5 Minutes | 96 (51.9%) | 122 (89.0%) |
| 5 to 9 Minutes | 9 (4.9%) | 8 (5.8%) |
| 10 to 14 Minutes | 71 (38.4%) | 0 (0.0%) |
| 15 to 19 Minutes | 0 (0.0%) | 7 (5.1%) |
| 20 to 24 Minutes | 0 (0.0%) | 0 (0.0%) |
| 25 to 29 Minutes | 0 (0.0%) | 0 (0.0%) |
| 30 to 34 Minutes | 9 (4.9%) | 0 (0.0%) |
| 35 to 39 Minutes | 0 (0.0%) | 0 (0.0%) |
| 40 to 44 Minutes | 0 (0.0%) | 0 (0.0%) |
| 45 to 59 Minutes | 0 (0.0%) | 0 (0.0%) |
| 60 to 89 Minutes | 0 (0.0%) | 0 (0.0%) |
| 90 or more Minutes | 0 (0.0%) | 0 (0.0%) |
Time of Departure to Work by Sex in Old Forge
The most frequent times of departure to work in Old Forge are 7:00 AM to 7:29 AM (114, 61.6%) for males and 6:30 AM to 6:59 AM (95, 69.3%) for females.
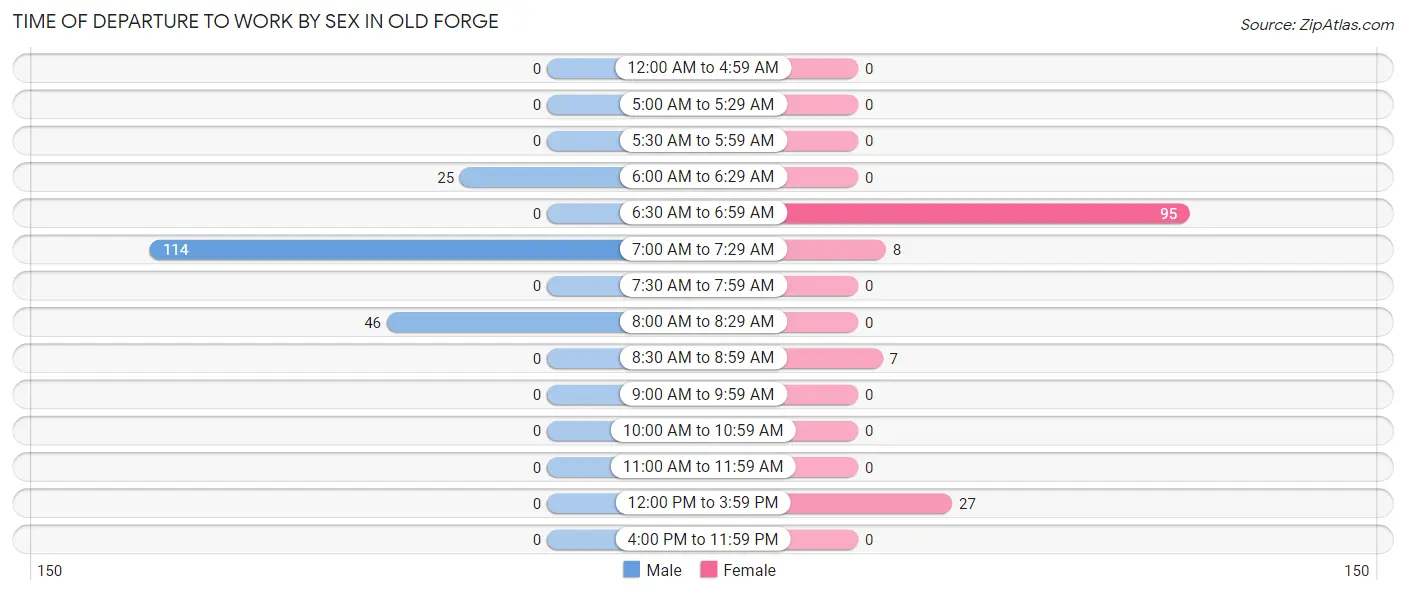
| Time of Departure | Male | Female |
| 12:00 AM to 4:59 AM | 0 (0.0%) | 0 (0.0%) |
| 5:00 AM to 5:29 AM | 0 (0.0%) | 0 (0.0%) |
| 5:30 AM to 5:59 AM | 0 (0.0%) | 0 (0.0%) |
| 6:00 AM to 6:29 AM | 25 (13.5%) | 0 (0.0%) |
| 6:30 AM to 6:59 AM | 0 (0.0%) | 95 (69.3%) |
| 7:00 AM to 7:29 AM | 114 (61.6%) | 8 (5.8%) |
| 7:30 AM to 7:59 AM | 0 (0.0%) | 0 (0.0%) |
| 8:00 AM to 8:29 AM | 46 (24.9%) | 0 (0.0%) |
| 8:30 AM to 8:59 AM | 0 (0.0%) | 7 (5.1%) |
| 9:00 AM to 9:59 AM | 0 (0.0%) | 0 (0.0%) |
| 10:00 AM to 10:59 AM | 0 (0.0%) | 0 (0.0%) |
| 11:00 AM to 11:59 AM | 0 (0.0%) | 0 (0.0%) |
| 12:00 PM to 3:59 PM | 0 (0.0%) | 27 (19.7%) |
| 4:00 PM to 11:59 PM | 0 (0.0%) | 0 (0.0%) |
| Total | 185 (100.0%) | 137 (100.0%) |
Housing Occupancy in Old Forge
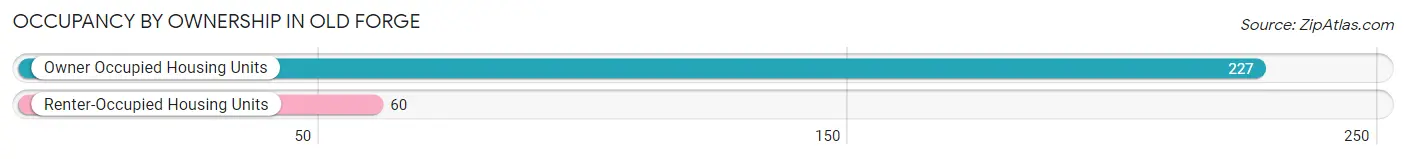
Occupancy by Ownership in Old Forge
Of the total 287 dwellings in Old Forge, owner-occupied units account for 227 (79.1%), while renter-occupied units make up 60 (20.9%).
| Occupancy | # Housing Units | % Housing Units |
| Owner Occupied Housing Units | 227 | 79.1% |
| Renter-Occupied Housing Units | 60 | 20.9% |
| Total Occupied Housing Units | 287 | 100.0% |
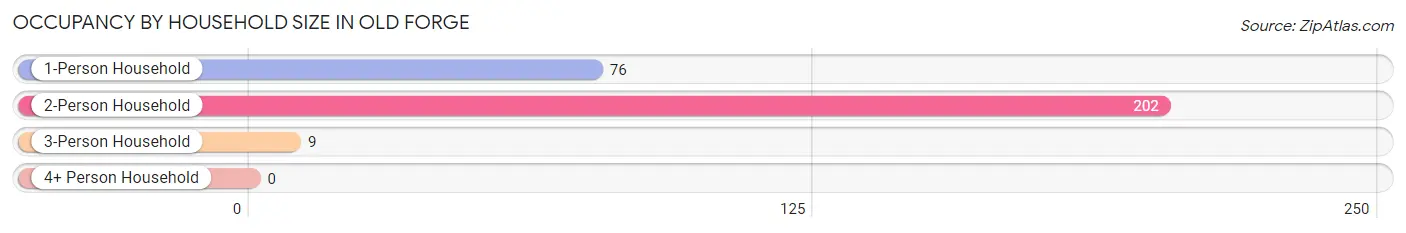
Occupancy by Household Size in Old Forge
| Household Size | # Housing Units | % Housing Units |
| 1-Person Household | 76 | 26.5% |
| 2-Person Household | 202 | 70.4% |
| 3-Person Household | 9 | 3.1% |
| 4+ Person Household | 0 | 0.0% |
| Total Housing Units | 287 | 100.0% |
Occupancy by Ownership by Household Size in Old Forge
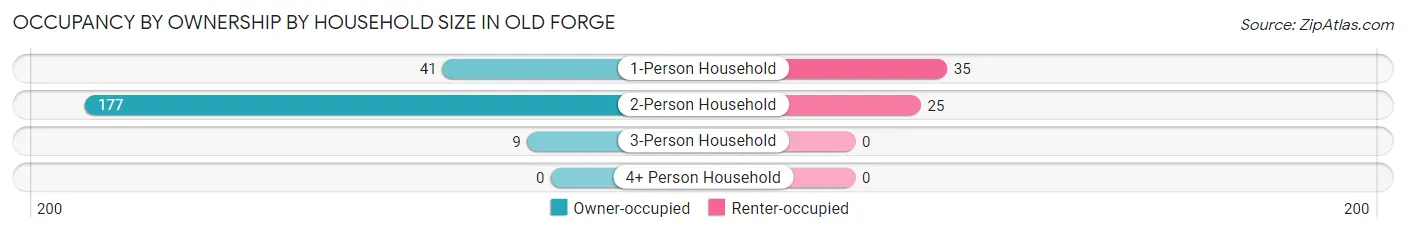
| Household Size | Owner-occupied | Renter-occupied |
| 1-Person Household | 41 (53.9%) | 35 (46.1%) |
| 2-Person Household | 177 (87.6%) | 25 (12.4%) |
| 3-Person Household | 9 (100.0%) | 0 (0.0%) |
| 4+ Person Household | 0 (0.0%) | 0 (0.0%) |
| Total Housing Units | 227 (79.1%) | 60 (20.9%) |
Occupancy by Educational Attainment in Old Forge
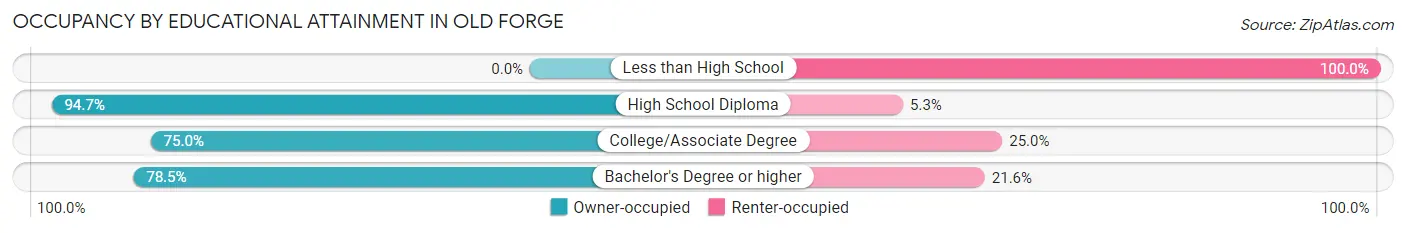
| Household Size | Owner-occupied | Renter-occupied |
| Less than High School | 0 (0.0%) | 24 (100.0%) |
| High School Diploma | 124 (94.7%) | 7 (5.3%) |
| College/Associate Degree | 12 (75.0%) | 4 (25.0%) |
| Bachelor's Degree or higher | 91 (78.4%) | 25 (21.5%) |
Occupancy by Age of Householder in Old Forge
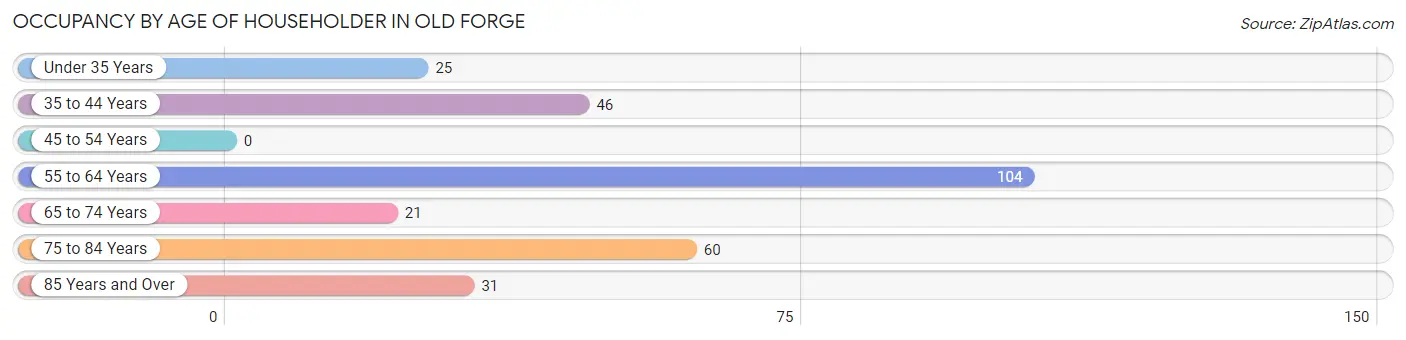
| Age Bracket | # Households | % Households |
| Under 35 Years | 25 | 8.7% |
| 35 to 44 Years | 46 | 16.0% |
| 45 to 54 Years | 0 | 0.0% |
| 55 to 64 Years | 104 | 36.2% |
| 65 to 74 Years | 21 | 7.3% |
| 75 to 84 Years | 60 | 20.9% |
| 85 Years and Over | 31 | 10.8% |
| Total | 287 | 100.0% |
Housing Finances in Old Forge
Median Income by Occupancy in Old Forge
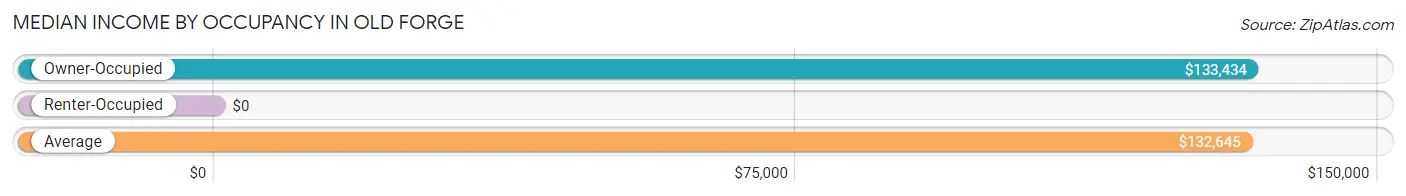
| Occupancy Type | # Households | Median Income |
| Owner-Occupied | 227 (79.1%) | $133,434 |
| Renter-Occupied | 60 (20.9%) | $0 |
| Average | 287 (100.0%) | $132,645 |
Occupancy by Householder Income Bracket in Old Forge
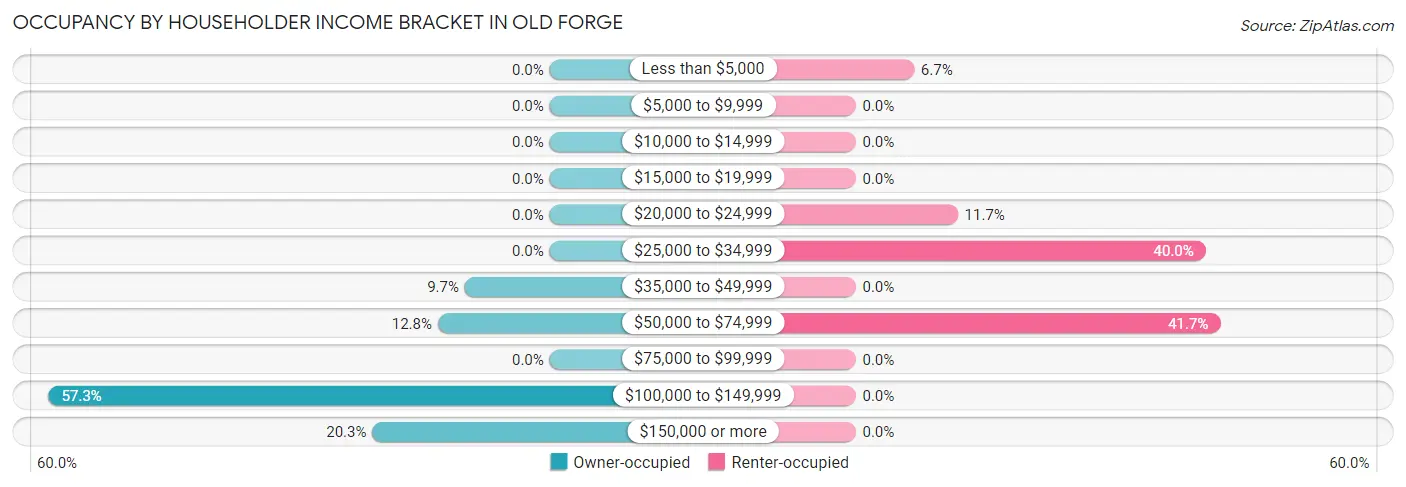
| Income Bracket | Owner-occupied | Renter-occupied |
| Less than $5,000 | 0 (0.0%) | 4 (6.7%) |
| $5,000 to $9,999 | 0 (0.0%) | 0 (0.0%) |
| $10,000 to $14,999 | 0 (0.0%) | 0 (0.0%) |
| $15,000 to $19,999 | 0 (0.0%) | 0 (0.0%) |
| $20,000 to $24,999 | 0 (0.0%) | 7 (11.7%) |
| $25,000 to $34,999 | 0 (0.0%) | 24 (40.0%) |
| $35,000 to $49,999 | 22 (9.7%) | 0 (0.0%) |
| $50,000 to $74,999 | 29 (12.8%) | 25 (41.7%) |
| $75,000 to $99,999 | 0 (0.0%) | 0 (0.0%) |
| $100,000 to $149,999 | 130 (57.3%) | 0 (0.0%) |
| $150,000 or more | 46 (20.3%) | 0 (0.0%) |
| Total | 227 (100.0%) | 60 (100.0%) |
Monthly Housing Cost Tiers in Old Forge
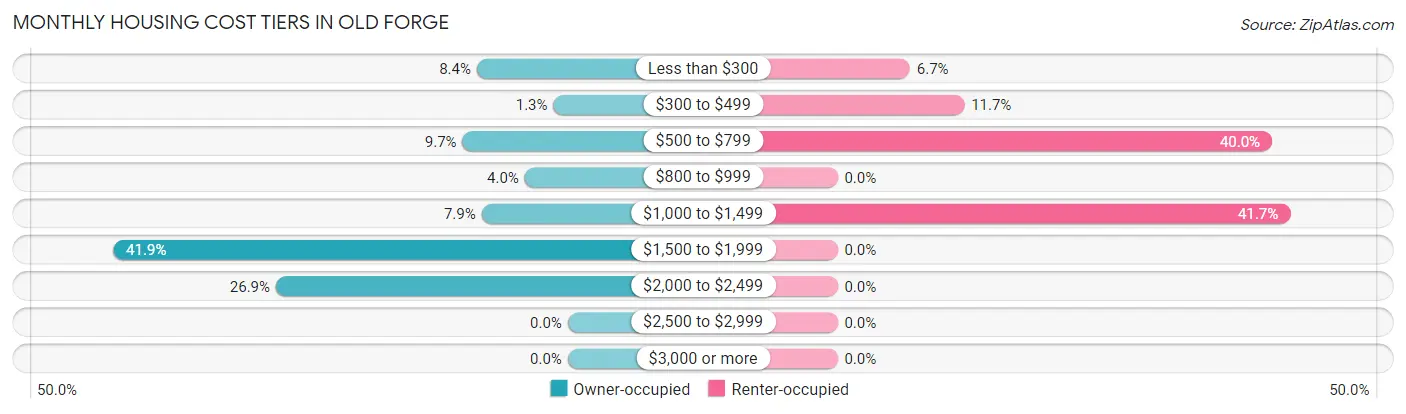
| Monthly Cost | Owner-occupied | Renter-occupied |
| Less than $300 | 19 (8.4%) | 4 (6.7%) |
| $300 to $499 | 3 (1.3%) | 7 (11.7%) |
| $500 to $799 | 22 (9.7%) | 24 (40.0%) |
| $800 to $999 | 9 (4.0%) | 0 (0.0%) |
| $1,000 to $1,499 | 18 (7.9%) | 25 (41.7%) |
| $1,500 to $1,999 | 95 (41.8%) | 0 (0.0%) |
| $2,000 to $2,499 | 61 (26.9%) | 0 (0.0%) |
| $2,500 to $2,999 | 0 (0.0%) | 0 (0.0%) |
| $3,000 or more | 0 (0.0%) | 0 (0.0%) |
| Total | 227 (100.0%) | 60 (100.0%) |
Physical Housing Characteristics in Old Forge
Housing Structures in Old Forge
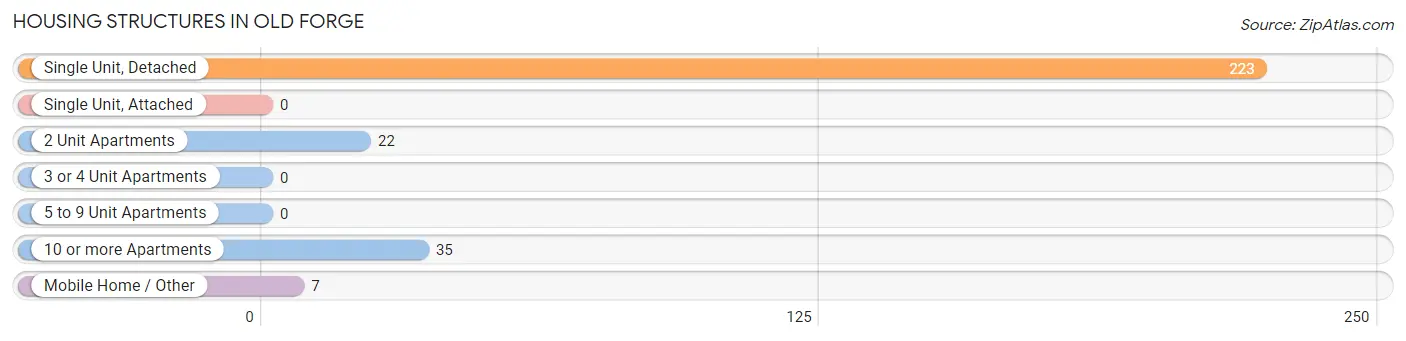
| Structure Type | # Housing Units | % Housing Units |
| Single Unit, Detached | 223 | 77.7% |
| Single Unit, Attached | 0 | 0.0% |
| 2 Unit Apartments | 22 | 7.7% |
| 3 or 4 Unit Apartments | 0 | 0.0% |
| 5 to 9 Unit Apartments | 0 | 0.0% |
| 10 or more Apartments | 35 | 12.2% |
| Mobile Home / Other | 7 | 2.4% |
| Total | 287 | 100.0% |
Housing Structures by Occupancy in Old Forge
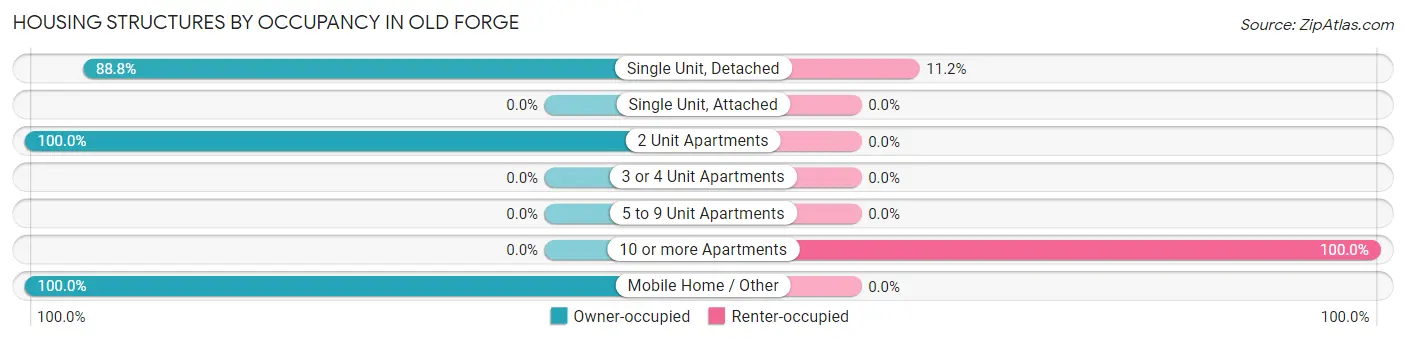
| Structure Type | Owner-occupied | Renter-occupied |
| Single Unit, Detached | 198 (88.8%) | 25 (11.2%) |
| Single Unit, Attached | 0 (0.0%) | 0 (0.0%) |
| 2 Unit Apartments | 22 (100.0%) | 0 (0.0%) |
| 3 or 4 Unit Apartments | 0 (0.0%) | 0 (0.0%) |
| 5 to 9 Unit Apartments | 0 (0.0%) | 0 (0.0%) |
| 10 or more Apartments | 0 (0.0%) | 35 (100.0%) |
| Mobile Home / Other | 7 (100.0%) | 0 (0.0%) |
| Total | 227 (79.1%) | 60 (20.9%) |
Housing Structures by Number of Rooms in Old Forge
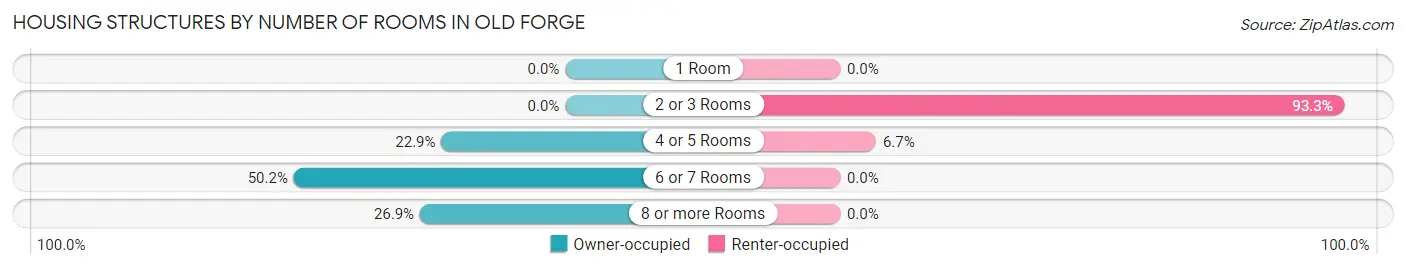
| Number of Rooms | Owner-occupied | Renter-occupied |
| 1 Room | 0 (0.0%) | 0 (0.0%) |
| 2 or 3 Rooms | 0 (0.0%) | 56 (93.3%) |
| 4 or 5 Rooms | 52 (22.9%) | 4 (6.7%) |
| 6 or 7 Rooms | 114 (50.2%) | 0 (0.0%) |
| 8 or more Rooms | 61 (26.9%) | 0 (0.0%) |
| Total | 227 (100.0%) | 60 (100.0%) |
Housing Structure by Heating Type in Old Forge
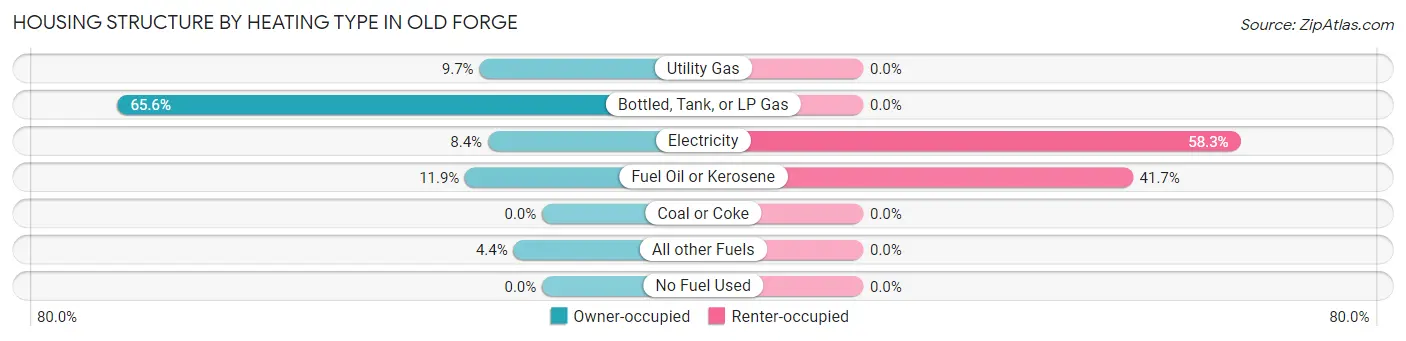
| Heating Type | Owner-occupied | Renter-occupied |
| Utility Gas | 22 (9.7%) | 0 (0.0%) |
| Bottled, Tank, or LP Gas | 149 (65.6%) | 0 (0.0%) |
| Electricity | 19 (8.4%) | 35 (58.3%) |
| Fuel Oil or Kerosene | 27 (11.9%) | 25 (41.7%) |
| Coal or Coke | 0 (0.0%) | 0 (0.0%) |
| All other Fuels | 10 (4.4%) | 0 (0.0%) |
| No Fuel Used | 0 (0.0%) | 0 (0.0%) |
| Total | 227 (100.0%) | 60 (100.0%) |
Household Vehicle Usage in Old Forge
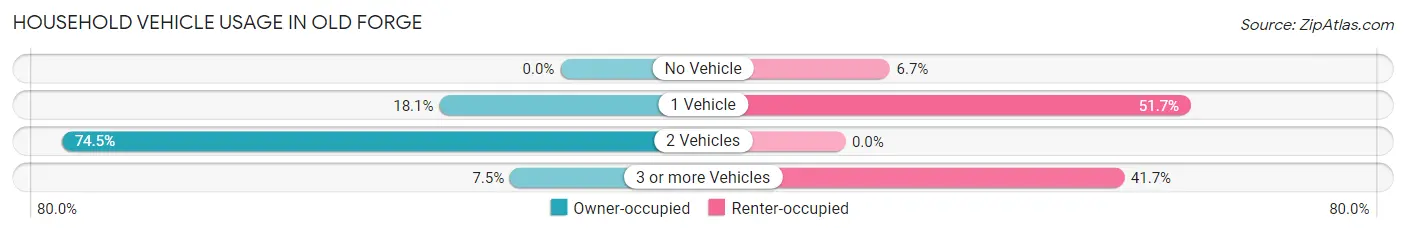
| Vehicles per Household | Owner-occupied | Renter-occupied |
| No Vehicle | 0 (0.0%) | 4 (6.7%) |
| 1 Vehicle | 41 (18.1%) | 31 (51.7%) |
| 2 Vehicles | 169 (74.5%) | 0 (0.0%) |
| 3 or more Vehicles | 17 (7.5%) | 25 (41.7%) |
| Total | 227 (100.0%) | 60 (100.0%) |
Real Estate & Mortgages in Old Forge
Real Estate and Mortgage Overview in Old Forge
| Characteristic | Without Mortgage | With Mortgage |
| Housing Units | 150 | 77 |
| Median Property Value | $329,200 | $348,900 |
| Median Household Income | $133,026 | $46 |
| Monthly Housing Costs | $1,501 | $0 |
| Real Estate Taxes | $5,731 | $0 |
Property Value by Mortgage Status in Old Forge
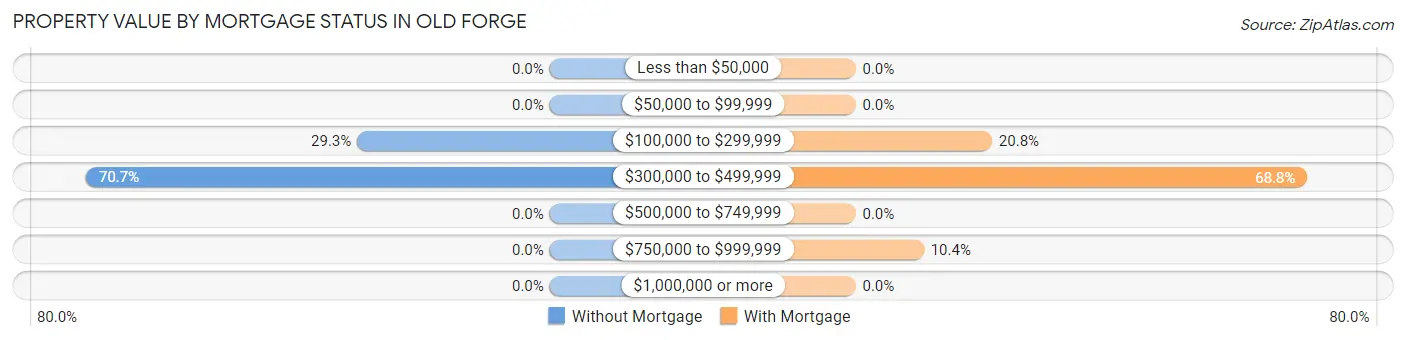
| Property Value | Without Mortgage | With Mortgage |
| Less than $50,000 | 0 (0.0%) | 0 (0.0%) |
| $50,000 to $99,999 | 0 (0.0%) | 0 (0.0%) |
| $100,000 to $299,999 | 44 (29.3%) | 16 (20.8%) |
| $300,000 to $499,999 | 106 (70.7%) | 53 (68.8%) |
| $500,000 to $749,999 | 0 (0.0%) | 0 (0.0%) |
| $750,000 to $999,999 | 0 (0.0%) | 8 (10.4%) |
| $1,000,000 or more | 0 (0.0%) | 0 (0.0%) |
| Total | 150 (100.0%) | 77 (100.0%) |
Household Income by Mortgage Status in Old Forge
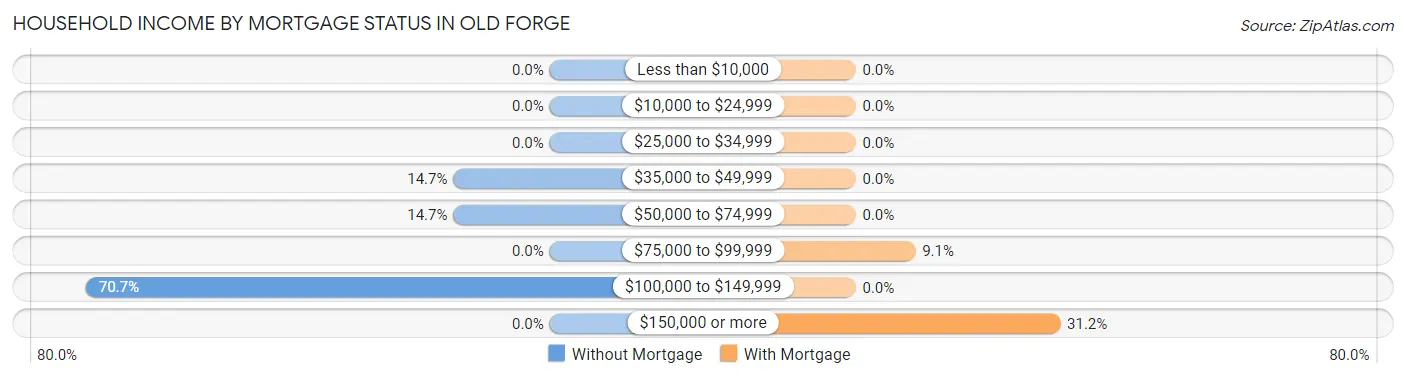
| Household Income | Without Mortgage | With Mortgage |
| Less than $10,000 | 0 (0.0%) | 0 (0.0%) |
| $10,000 to $24,999 | 0 (0.0%) | 0 (0.0%) |
| $25,000 to $34,999 | 0 (0.0%) | 0 (0.0%) |
| $35,000 to $49,999 | 22 (14.7%) | 0 (0.0%) |
| $50,000 to $74,999 | 22 (14.7%) | 0 (0.0%) |
| $75,000 to $99,999 | 0 (0.0%) | 7 (9.1%) |
| $100,000 to $149,999 | 106 (70.7%) | 0 (0.0%) |
| $150,000 or more | 0 (0.0%) | 24 (31.2%) |
| Total | 150 (100.0%) | 77 (100.0%) |
Property Value to Household Income Ratio in Old Forge
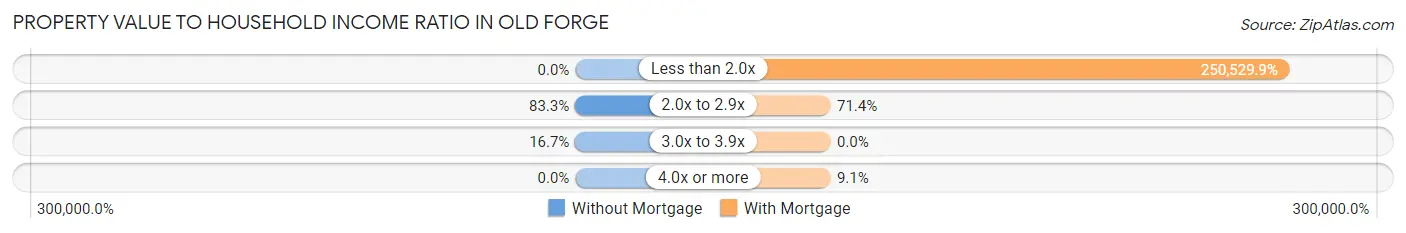
| Value-to-Income Ratio | Without Mortgage | With Mortgage |
| Less than 2.0x | 0 (0.0%) | 192,908 (250,529.9%) |
| 2.0x to 2.9x | 125 (83.3%) | 55 (71.4%) |
| 3.0x to 3.9x | 25 (16.7%) | 0 (0.0%) |
| 4.0x or more | 0 (0.0%) | 7 (9.1%) |
| Total | 150 (100.0%) | 77 (100.0%) |
Real Estate Taxes by Mortgage Status in Old Forge
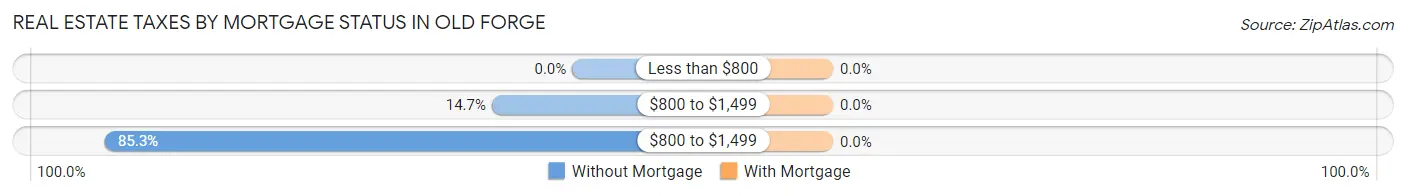
| Property Taxes | Without Mortgage | With Mortgage |
| Less than $800 | 0 (0.0%) | 0 (0.0%) |
| $800 to $1,499 | 22 (14.7%) | 0 (0.0%) |
| $800 to $1,499 | 128 (85.3%) | 0 (0.0%) |
| Total | 150 (100.0%) | 77 (100.0%) |
Health & Disability in Old Forge
Health Insurance Coverage by Age in Old Forge
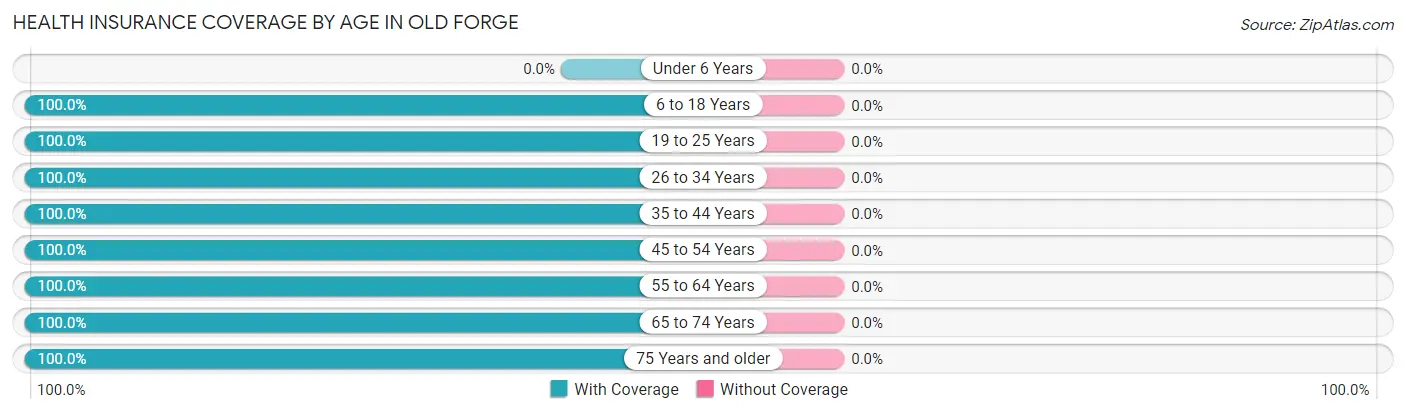
| Age Bracket | With Coverage | Without Coverage |
| Under 6 Years | 0 (0.0%) | 0 (0.0%) |
| 6 to 18 Years | 24 (100.0%) | 0 (0.0%) |
| 19 to 25 Years | 25 (100.0%) | 0 (0.0%) |
| 26 to 34 Years | 52 (100.0%) | 0 (0.0%) |
| 35 to 44 Years | 94 (100.0%) | 0 (0.0%) |
| 45 to 54 Years | 19 (100.0%) | 0 (0.0%) |
| 55 to 64 Years | 208 (100.0%) | 0 (0.0%) |
| 65 to 74 Years | 41 (100.0%) | 0 (0.0%) |
| 75 Years and older | 110 (100.0%) | 0 (0.0%) |
| Total | 573 (100.0%) | 0 (0.0%) |
Health Insurance Coverage by Citizenship Status in Old Forge
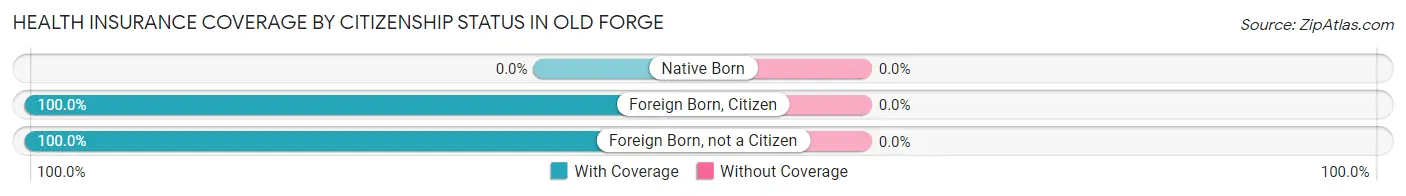
| Citizenship Status | With Coverage | Without Coverage |
| Native Born | 0 (0.0%) | 0 (0.0%) |
| Foreign Born, Citizen | 24 (100.0%) | 0 (0.0%) |
| Foreign Born, not a Citizen | 25 (100.0%) | 0 (0.0%) |
Health Insurance Coverage by Household Income in Old Forge
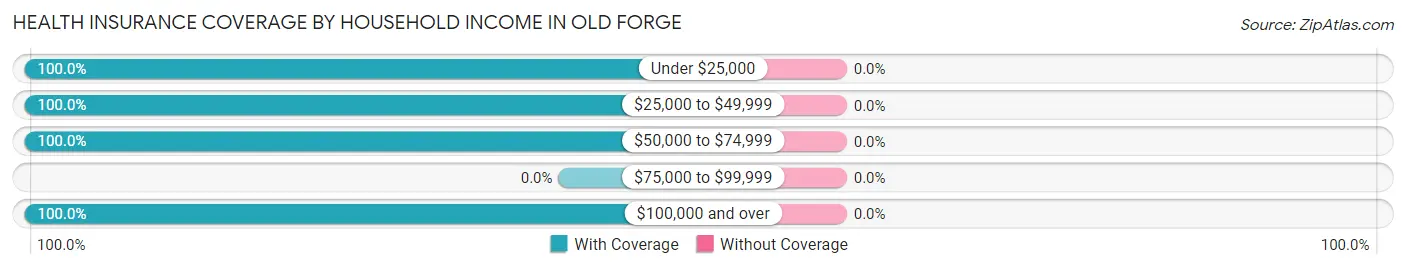
| Household Income | With Coverage | Without Coverage |
| Under $25,000 | 11 (100.0%) | 0 (0.0%) |
| $25,000 to $49,999 | 46 (100.0%) | 0 (0.0%) |
| $50,000 to $74,999 | 92 (100.0%) | 0 (0.0%) |
| $75,000 to $99,999 | 0 (0.0%) | 0 (0.0%) |
| $100,000 and over | 356 (100.0%) | 0 (0.0%) |
Public vs Private Health Insurance Coverage by Age in Old Forge
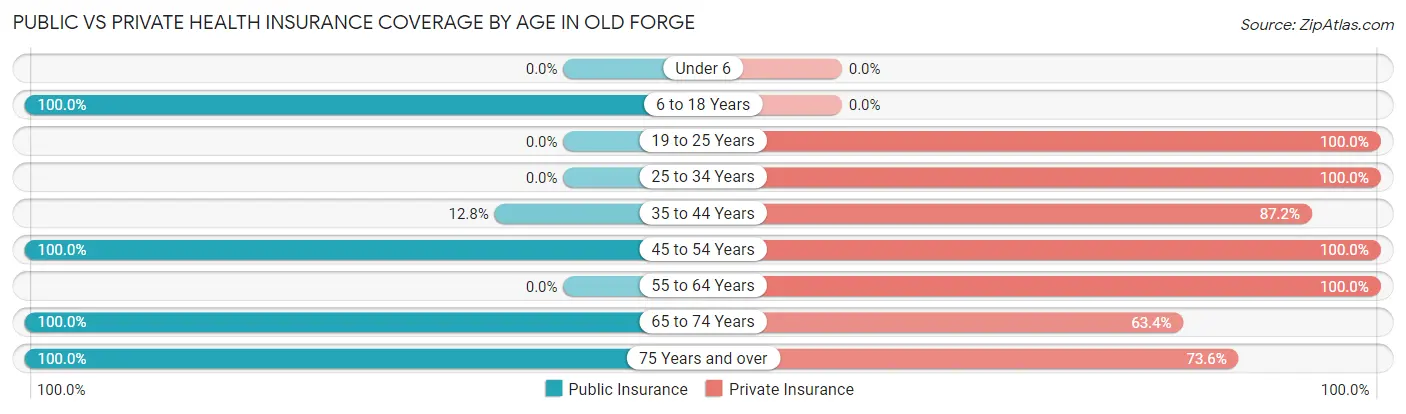
| Age Bracket | Public Insurance | Private Insurance |
| Under 6 | 0 (0.0%) | 0 (0.0%) |
| 6 to 18 Years | 24 (100.0%) | 0 (0.0%) |
| 19 to 25 Years | 0 (0.0%) | 25 (100.0%) |
| 25 to 34 Years | 0 (0.0%) | 52 (100.0%) |
| 35 to 44 Years | 12 (12.8%) | 82 (87.2%) |
| 45 to 54 Years | 19 (100.0%) | 19 (100.0%) |
| 55 to 64 Years | 0 (0.0%) | 208 (100.0%) |
| 65 to 74 Years | 41 (100.0%) | 26 (63.4%) |
| 75 Years and over | 110 (100.0%) | 81 (73.6%) |
| Total | 206 (35.9%) | 493 (86.0%) |
Disability Status by Sex by Age in Old Forge
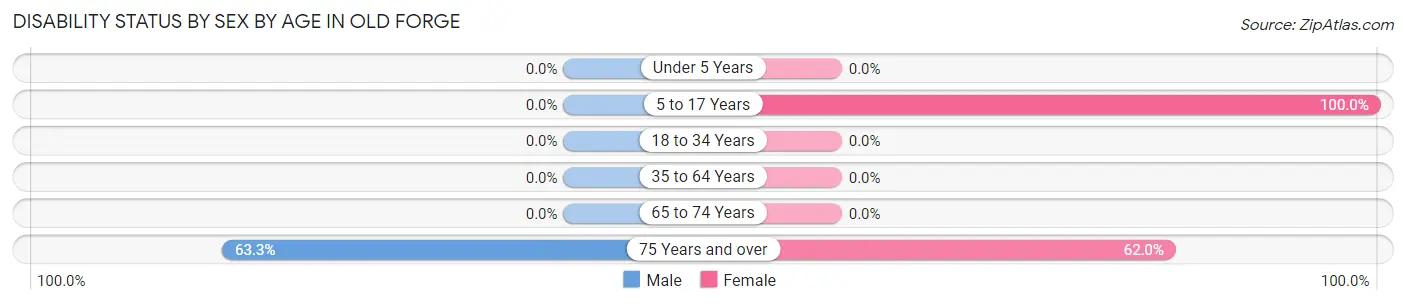
| Age Bracket | Male | Female |
| Under 5 Years | 0 (0.0%) | 0 (0.0%) |
| 5 to 17 Years | 0 (0.0%) | 24 (100.0%) |
| 18 to 34 Years | 0 (0.0%) | 0 (0.0%) |
| 35 to 64 Years | 0 (0.0%) | 0 (0.0%) |
| 65 to 74 Years | 0 (0.0%) | 0 (0.0%) |
| 75 Years and over | 38 (63.3%) | 31 (62.0%) |
Disability Class by Sex by Age in Old Forge
Disability Class: Hearing Difficulty
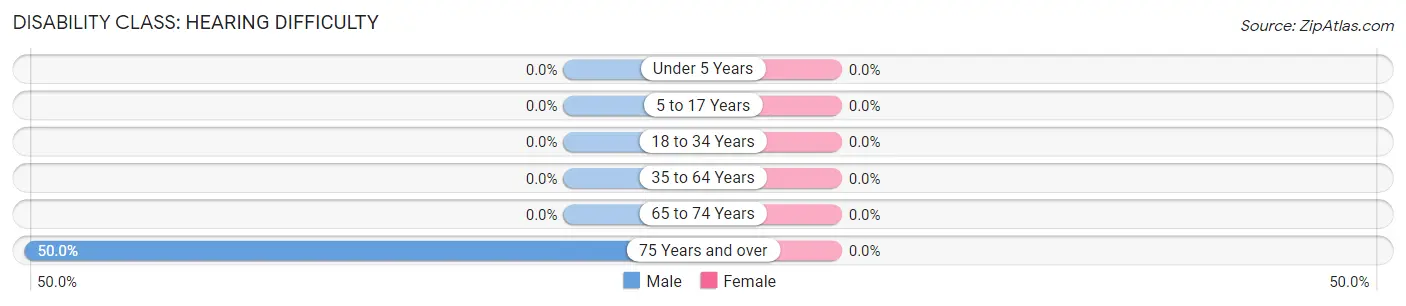
| Age Bracket | Male | Female |
| Under 5 Years | 0 (0.0%) | 0 (0.0%) |
| 5 to 17 Years | 0 (0.0%) | 0 (0.0%) |
| 18 to 34 Years | 0 (0.0%) | 0 (0.0%) |
| 35 to 64 Years | 0 (0.0%) | 0 (0.0%) |
| 65 to 74 Years | 0 (0.0%) | 0 (0.0%) |
| 75 Years and over | 30 (50.0%) | 0 (0.0%) |
Disability Class: Vision Difficulty
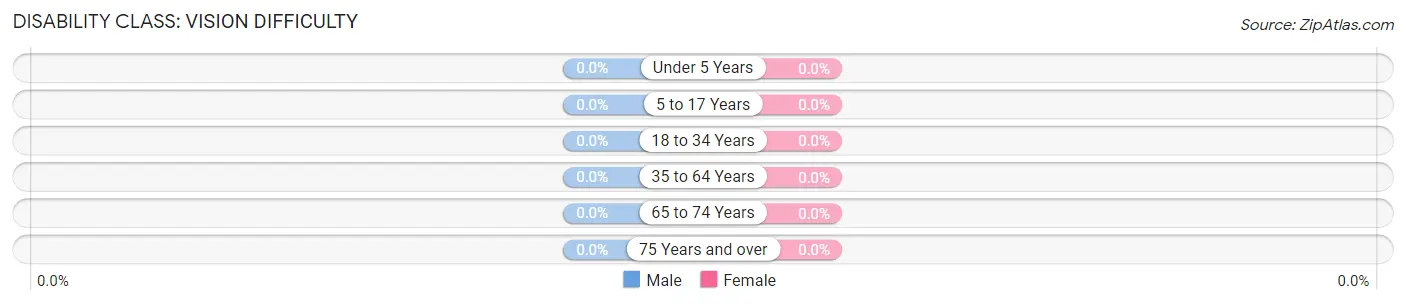
| Age Bracket | Male | Female |
| Under 5 Years | 0 (0.0%) | 0 (0.0%) |
| 5 to 17 Years | 0 (0.0%) | 0 (0.0%) |
| 18 to 34 Years | 0 (0.0%) | 0 (0.0%) |
| 35 to 64 Years | 0 (0.0%) | 0 (0.0%) |
| 65 to 74 Years | 0 (0.0%) | 0 (0.0%) |
| 75 Years and over | 0 (0.0%) | 0 (0.0%) |
Disability Class: Cognitive Difficulty
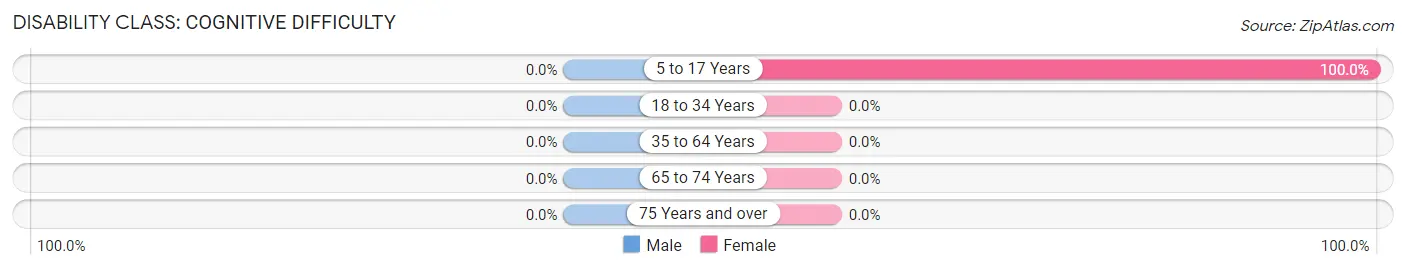
| Age Bracket | Male | Female |
| 5 to 17 Years | 0 (0.0%) | 24 (100.0%) |
| 18 to 34 Years | 0 (0.0%) | 0 (0.0%) |
| 35 to 64 Years | 0 (0.0%) | 0 (0.0%) |
| 65 to 74 Years | 0 (0.0%) | 0 (0.0%) |
| 75 Years and over | 0 (0.0%) | 0 (0.0%) |
Disability Class: Ambulatory Difficulty
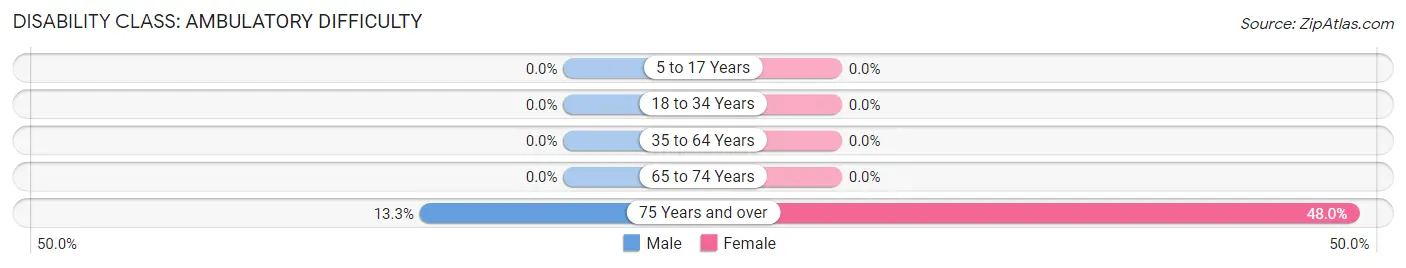
| Age Bracket | Male | Female |
| 5 to 17 Years | 0 (0.0%) | 0 (0.0%) |
| 18 to 34 Years | 0 (0.0%) | 0 (0.0%) |
| 35 to 64 Years | 0 (0.0%) | 0 (0.0%) |
| 65 to 74 Years | 0 (0.0%) | 0 (0.0%) |
| 75 Years and over | 8 (13.3%) | 24 (48.0%) |
Disability Class: Self-Care Difficulty
| Age Bracket | Male | Female |
| 5 to 17 Years | 0 (0.0%) | 0 (0.0%) |
| 18 to 34 Years | 0 (0.0%) | 0 (0.0%) |
| 35 to 64 Years | 0 (0.0%) | 0 (0.0%) |
| 65 to 74 Years | 0 (0.0%) | 0 (0.0%) |
| 75 Years and over | 0 (0.0%) | 0 (0.0%) |
Technology Access in Old Forge
Computing Device Access in Old Forge
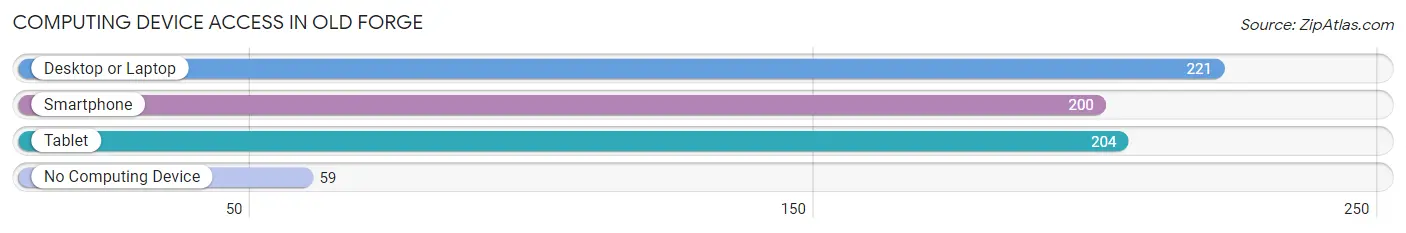
| Device Type | # Households | % Households |
| Desktop or Laptop | 221 | 77.0% |
| Smartphone | 200 | 69.7% |
| Tablet | 204 | 71.1% |
| No Computing Device | 59 | 20.6% |
| Total | 287 | 100.0% |
Internet Access in Old Forge
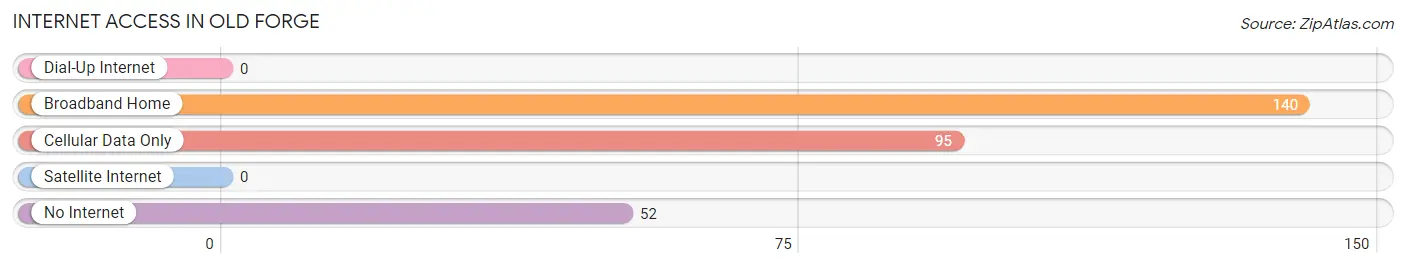
| Internet Type | # Households | % Households |
| Dial-Up Internet | 0 | 0.0% |
| Broadband Home | 140 | 48.8% |
| Cellular Data Only | 95 | 33.1% |
| Satellite Internet | 0 | 0.0% |
| No Internet | 52 | 18.1% |
| Total | 287 | 100.0% |
Old Forge Summary
Forged in the Adirondack Mountains of upstate New York, the village of Old Forge is a small, rural community with a rich history and a vibrant economy. Located in Herkimer County, Old Forge is situated on the banks of the Moose River and is surrounded by the Adirondack Park, a 6 million acre preserve of public and private land. With a population of just over 1,000 people, Old Forge is a small, tight-knit community that is proud of its history and its natural beauty.
History
The history of Old Forge dates back to the early 1800s when the area was first settled by the Mohawk and Oneida tribes. The first permanent settlers arrived in the area in 1819 and the village was officially incorporated in 1845. The village was named after an old forge that was located on the banks of the Moose River. The forge was used to make tools and weapons for the local settlers.
In the late 1800s, Old Forge became a popular tourist destination for those looking to escape the hustle and bustle of city life. The village was home to several hotels and resorts, as well as a variety of outdoor activities such as fishing, hunting, and boating. The village also became a popular destination for artists and writers, who were drawn to the area’s natural beauty.
In the early 1900s, Old Forge began to experience a decline in tourism due to the rise of the automobile. The village was also impacted by the Great Depression, which caused many of the local businesses to close. However, the village was able to rebound in the 1950s and 1960s with the help of the Adirondack Park, which was established in 1892. The park brought new visitors to the area and helped to revive the local economy.
Geography
Old Forge is located in the Adirondack Mountains of upstate New York. The village is situated on the banks of the Moose River and is surrounded by the Adirondack Park. The village is located approximately 30 miles north of Utica and 60 miles west of Albany.
The village is located at an elevation of 1,400 feet and has a total area of 1.2 square miles. The village is located in a temperate climate zone and experiences four distinct seasons. The average temperature in the summer is around 70 degrees Fahrenheit and the average temperature in the winter is around 20 degrees Fahrenheit.
Economy
The economy of Old Forge is largely based on tourism. The village is home to several hotels and resorts, as well as a variety of outdoor activities such as fishing, hunting, and boating. The village is also home to several restaurants, shops, and galleries.
In addition to tourism, Old Forge is also home to several manufacturing companies. The village is home to a paper mill, a furniture factory, and a metal fabrication plant. The village is also home to several small businesses, such as auto repair shops, hardware stores, and grocery stores.
Demographics
As of the 2010 census, the population of Old Forge was 1,072. The village is predominantly white, with 94.3% of the population identifying as white. The village is also home to a small Hispanic population, with 4.2% of the population identifying as Hispanic or Latino.
The median household income in Old Forge is $41,250, which is slightly lower than the national average of $50,221. The median home value in the village is $117,400, which is slightly lower than the national average of $184,700. The village has a poverty rate of 11.2%, which is slightly higher than the national average of 10.5%.
Common Questions
What is Per Capita Income in Old Forge?
Per Capita income in Old Forge is $57,808.
What is the Median Family Income in Old Forge?
Median Family Income in Old Forge is $133,974.
What is the Median Household income in Old Forge?
Median Household Income in Old Forge is $132,645.
What is Inequality or Gini Index in Old Forge?
Inequality or Gini Index in Old Forge is 0.28.
What is the Total Population of Old Forge?
Total Population of Old Forge is 573.
What is the Total Male Population of Old Forge?
Total Male Population of Old Forge is 312.
What is the Total Female Population of Old Forge?
Total Female Population of Old Forge is 261.
What is the Ratio of Males per 100 Females in Old Forge?
There are 119.54 Males per 100 Females in Old Forge.
What is the Ratio of Females per 100 Males in Old Forge?
There are 83.65 Females per 100 Males in Old Forge.
What is the Median Population Age in Old Forge?
Median Population Age in Old Forge is 56.7 Years.
What is the Average Family Size in Old Forge
Average Family Size in Old Forge is 2.0 People.
What is the Average Household Size in Old Forge
Average Household Size in Old Forge is 1.8 People.
How Large is the Labor Force in Old Forge?
There are 410 People in the Labor Forcein in Old Forge.
What is the Percentage of People in the Labor Force in Old Forge?
71.6% of People are in the Labor Force in Old Forge.
What is the Unemployment Rate in Old Forge?
Unemployment Rate in Old Forge is 8.8%.