Zip Codes with the Highest Percentage of Population Employed in Architecture & Engineering in Brooklyn, NY
RELATED REPORTS & OPTIONS
Architecture & Engineering
Brooklyn
Compare Zip Codes
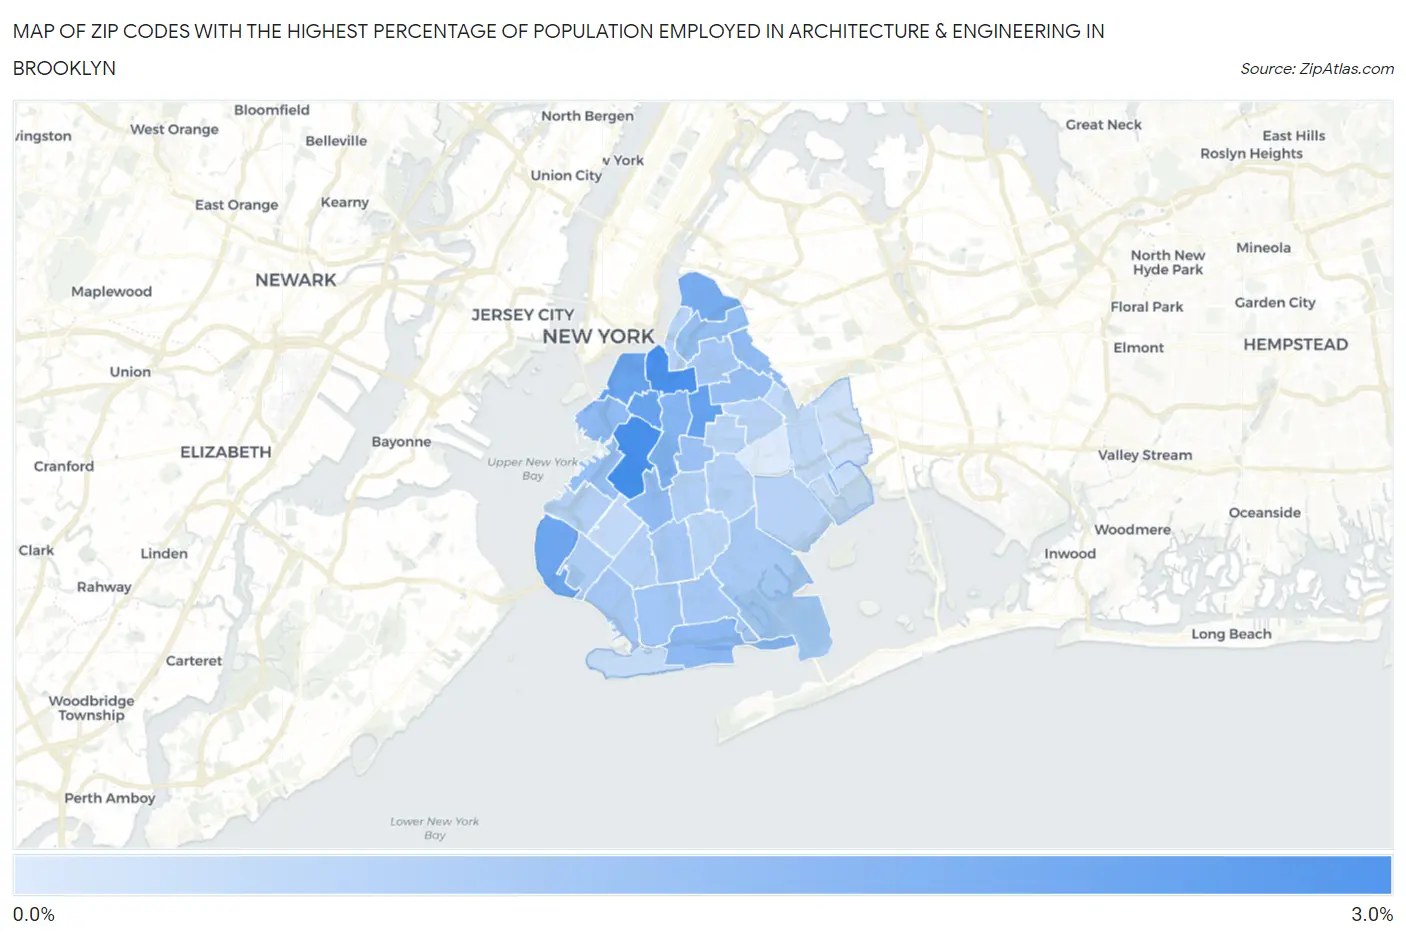
Map of Zip Codes with the Highest Percentage of Population Employed in Architecture & Engineering in Brooklyn
0.15%
2.8%
Zip Codes with the Highest Percentage of Population Employed in Architecture & Engineering in Brooklyn, NY
| Zip Code | % Employed | vs State | vs National | |
| 1. | 11215 | 2.8% | 1.6%(+1.21)#321 | 2.1%(+0.672)#5,703 |
| 2. | 11205 | 2.7% | 1.6%(+1.14)#347 | 2.1%(+0.598)#5,979 |
| 3. | 11216 | 2.3% | 1.6%(+0.658)#449 | 2.1%(+0.119)#8,108 |
| 4. | 11217 | 2.2% | 1.6%(+0.590)#462 | 2.1%(+0.051)#8,476 |
| 5. | 11201 | 2.2% | 1.6%(+0.582)#466 | 2.1%(+0.043)#8,508 |
| 6. | 11209 | 2.1% | 1.6%(+0.515)#482 | 2.1%(-0.024)#8,892 |
| 7. | 11222 | 1.9% | 1.6%(+0.332)#544 | 2.1%(-0.207)#9,965 |
| 8. | 11238 | 1.7% | 1.6%(+0.111)#632 | 2.1%(-0.428)#11,354 |
| 9. | 11231 | 1.5% | 1.6%(-0.073)#703 | 2.1%(-0.612)#12,601 |
| 10. | 11235 | 1.5% | 1.6%(-0.086)#707 | 2.1%(-0.625)#12,695 |
| 11. | 11218 | 1.5% | 1.6%(-0.106)#717 | 2.1%(-0.645)#12,848 |
| 12. | 11237 | 1.5% | 1.6%(-0.122)#724 | 2.1%(-0.661)#12,968 |
| 13. | 11211 | 1.4% | 1.6%(-0.186)#759 | 2.1%(-0.725)#13,401 |
| 14. | 11232 | 1.4% | 1.6%(-0.221)#775 | 2.1%(-0.760)#13,662 |
| 15. | 11221 | 1.4% | 1.6%(-0.239)#781 | 2.1%(-0.777)#13,789 |
| 16. | 11225 | 1.3% | 1.6%(-0.268)#801 | 2.1%(-0.807)#14,008 |
| 17. | 11223 | 1.2% | 1.6%(-0.431)#889 | 2.1%(-0.970)#15,246 |
| 18. | 11214 | 1.1% | 1.6%(-0.467)#905 | 2.1%(-1.01)#15,536 |
| 19. | 11230 | 1.1% | 1.6%(-0.469)#907 | 2.1%(-1.01)#15,545 |
| 20. | 11206 | 1.1% | 1.6%(-0.486)#917 | 2.1%(-1.02)#15,653 |
| 21. | 11229 | 1.1% | 1.6%(-0.495)#925 | 2.1%(-1.03)#15,726 |
| 22. | 11234 | 1.1% | 1.6%(-0.509)#937 | 2.1%(-1.05)#15,841 |
| 23. | 11228 | 0.97% | 1.6%(-0.645)#1,007 | 2.1%(-1.18)#16,879 |
| 24. | 11226 | 0.93% | 1.6%(-0.682)#1,024 | 2.1%(-1.22)#17,146 |
| 25. | 11220 | 0.88% | 1.6%(-0.728)#1,040 | 2.1%(-1.27)#17,507 |
| 26. | 11204 | 0.87% | 1.6%(-0.741)#1,044 | 2.1%(-1.28)#17,597 |
| 27. | 11203 | 0.86% | 1.6%(-0.753)#1,046 | 2.1%(-1.29)#17,697 |
| 28. | 11249 | 0.86% | 1.6%(-0.755)#1,047 | 2.1%(-1.29)#17,712 |
| 29. | 11233 | 0.82% | 1.6%(-0.791)#1,069 | 2.1%(-1.33)#17,996 |
| 30. | 11236 | 0.81% | 1.6%(-0.803)#1,072 | 2.1%(-1.34)#18,070 |
| 31. | 11213 | 0.78% | 1.6%(-0.829)#1,082 | 2.1%(-1.37)#18,271 |
| 32. | 11210 | 0.78% | 1.6%(-0.834)#1,085 | 2.1%(-1.37)#18,313 |
| 33. | 11207 | 0.66% | 1.6%(-0.948)#1,130 | 2.1%(-1.49)#19,157 |
| 34. | 11219 | 0.66% | 1.6%(-0.949)#1,132 | 2.1%(-1.49)#19,162 |
| 35. | 11224 | 0.57% | 1.6%(-1.04)#1,170 | 2.1%(-1.58)#19,873 |
| 36. | 11239 | 0.50% | 1.6%(-1.11)#1,196 | 2.1%(-1.65)#20,289 |
| 37. | 11208 | 0.44% | 1.6%(-1.17)#1,218 | 2.1%(-1.71)#20,652 |
| 38. | 11212 | 0.15% | 1.6%(-1.46)#1,304 | 2.1%(-1.99)#22,240 |
1
Common Questions
What are the Top 10 Zip Codes with the Highest Percentage of Population Employed in Architecture & Engineering in Brooklyn, NY?
Top 10 Zip Codes with the Highest Percentage of Population Employed in Architecture & Engineering in Brooklyn, NY are:
What zip code has the Highest Percentage of Population Employed in Architecture & Engineering in Brooklyn, NY?
11215 has the Highest Percentage of Population Employed in Architecture & Engineering in Brooklyn, NY with 2.8%.
What is the Percentage of Population Employed in Architecture & Engineering in New York?
Percentage of Population Employed in Architecture & Engineering in New York is 1.6%.
What is the Percentage of Population Employed in Architecture & Engineering in the United States?
Percentage of Population Employed in Architecture & Engineering in the United States is 2.1%.