East Marion, NY Map & Demographics
East Marion Map
East Marion Overview
$74,521
PER CAPITA INCOME
$135,972
AVG FAMILY INCOME
$100,682
AVG HOUSEHOLD INCOME
24.2%
WAGE / INCOME GAP [ % ]
75.8¢/ $1
WAGE / INCOME GAP [ $ ]
0.49
INEQUALITY / GINI INDEX
1,564
TOTAL POPULATION
687
MALE POPULATION
877
FEMALE POPULATION
78.34
MALES / 100 FEMALES
127.66
FEMALES / 100 MALES
61.3
MEDIAN AGE
2.6
AVG FAMILY SIZE
2.2
AVG HOUSEHOLD SIZE
709
LABOR FORCE [ PEOPLE ]
48.7%
PERCENT IN LABOR FORCE
0.8%
UNEMPLOYMENT RATE
East Marion Zip Codes
East Marion Area Codes
Income in East Marion
Income Overview in East Marion
Per Capita Income in East Marion is $74,521, while median incomes of families and households are $135,972 and $100,682 respectively.
| Characteristic | Number | Measure |
| Per Capita Income | 1,564 | $74,521 |
| Median Family Income | 476 | $135,972 |
| Mean Family Income | 476 | $197,027 |
| Median Household Income | 722 | $100,682 |
| Mean Household Income | 722 | $161,125 |
| Income Deficit | 476 | $0 |
| Wage / Income Gap (%) | 1,564 | 24.19% |
| Wage / Income Gap ($) | 1,564 | 75.81¢ per $1 |
| Gini / Inequality Index | 1,564 | 0.49 |
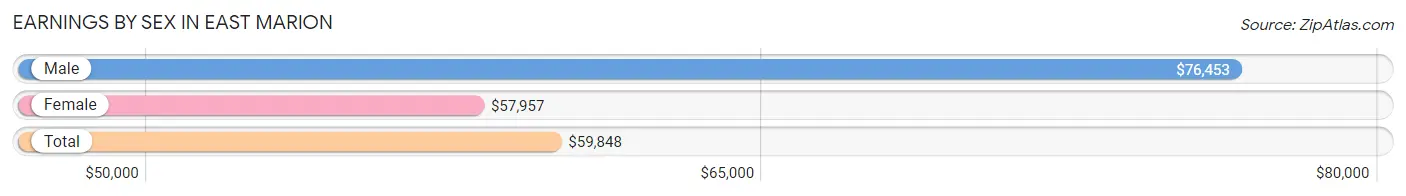
Earnings by Sex in East Marion
Average Earnings in East Marion are $59,848, $76,453 for men and $57,957 for women, a difference of 24.2%.
| Sex | Number | Average Earnings |
| Male | 390 (49.8%) | $76,453 |
| Female | 393 (50.2%) | $57,957 |
| Total | 783 (100.0%) | $59,848 |
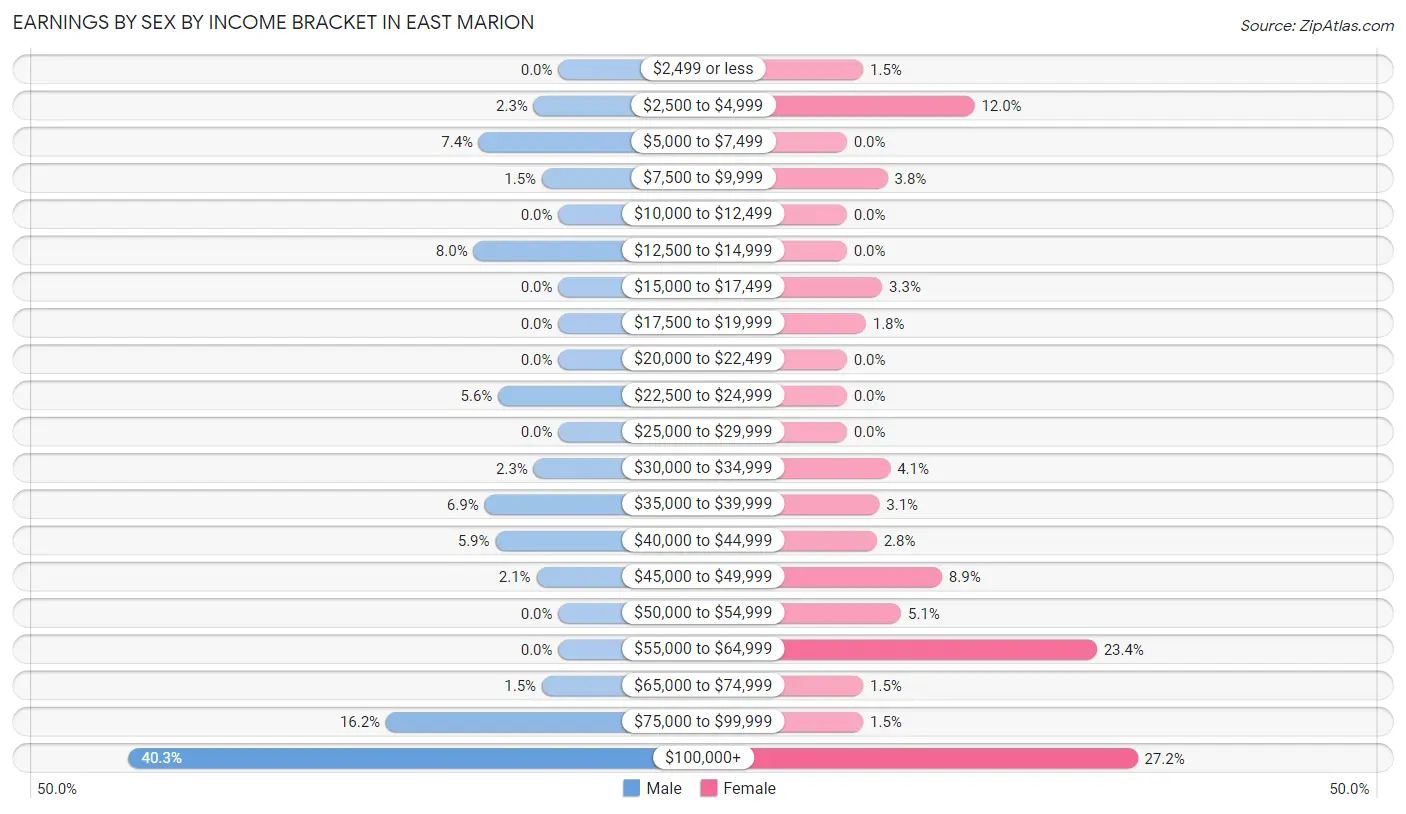
Earnings by Sex by Income Bracket in East Marion
The most common earnings brackets in East Marion are $100,000+ for men (157 | 40.3%) and $100,000+ for women (107 | 27.2%).
| Income | Male | Female |
| $2,499 or less | 0 (0.0%) | 6 (1.5%) |
| $2,500 to $4,999 | 9 (2.3%) | 47 (12.0%) |
| $5,000 to $7,499 | 29 (7.4%) | 0 (0.0%) |
| $7,500 to $9,999 | 6 (1.5%) | 15 (3.8%) |
| $10,000 to $12,499 | 0 (0.0%) | 0 (0.0%) |
| $12,500 to $14,999 | 31 (8.0%) | 0 (0.0%) |
| $15,000 to $17,499 | 0 (0.0%) | 13 (3.3%) |
| $17,500 to $19,999 | 0 (0.0%) | 7 (1.8%) |
| $20,000 to $22,499 | 0 (0.0%) | 0 (0.0%) |
| $22,500 to $24,999 | 22 (5.6%) | 0 (0.0%) |
| $25,000 to $29,999 | 0 (0.0%) | 0 (0.0%) |
| $30,000 to $34,999 | 9 (2.3%) | 16 (4.1%) |
| $35,000 to $39,999 | 27 (6.9%) | 12 (3.0%) |
| $40,000 to $44,999 | 23 (5.9%) | 11 (2.8%) |
| $45,000 to $49,999 | 8 (2.1%) | 35 (8.9%) |
| $50,000 to $54,999 | 0 (0.0%) | 20 (5.1%) |
| $55,000 to $64,999 | 0 (0.0%) | 92 (23.4%) |
| $65,000 to $74,999 | 6 (1.5%) | 6 (1.5%) |
| $75,000 to $99,999 | 63 (16.2%) | 6 (1.5%) |
| $100,000+ | 157 (40.3%) | 107 (27.2%) |
| Total | 390 (100.0%) | 393 (100.0%) |
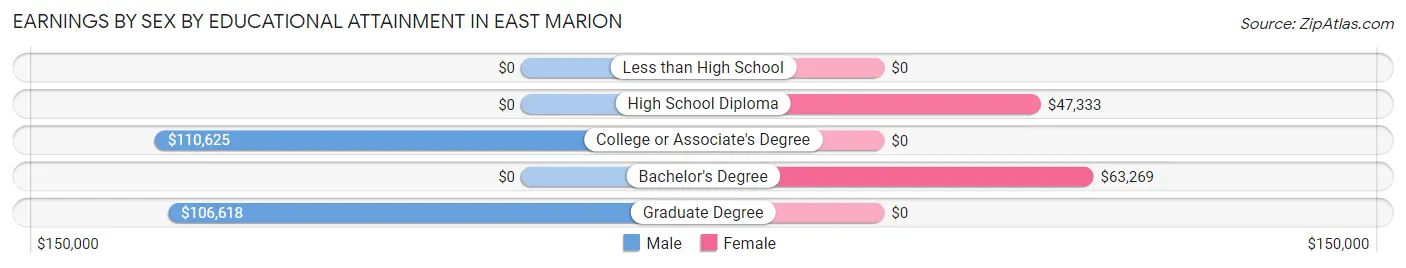
Earnings by Sex by Educational Attainment in East Marion
Average earnings in East Marion are $84,107 for men and $59,848 for women, a difference of 28.8%. Men with an educational attainment of college or associate's degree enjoy the highest average annual earnings of $110,625, while those with graduate degree education earn the least with $106,618. Women with an educational attainment of bachelor's degree earn the most with the average annual earnings of $63,269, while those with high school diploma education have the smallest earnings of $47,333.
| Educational Attainment | Male Income | Female Income |
| Less than High School | - | - |
| High School Diploma | - | - |
| College or Associate's Degree | $110,625 | $0 |
| Bachelor's Degree | - | - |
| Graduate Degree | $106,618 | $0 |
| Total | $84,107 | $59,848 |
Family Income in East Marion
Family Income Brackets in East Marion
According to the East Marion family income data, there are 140 families falling into the $200,000+ income range, which is the most common income bracket and makes up 29.4% of all families.
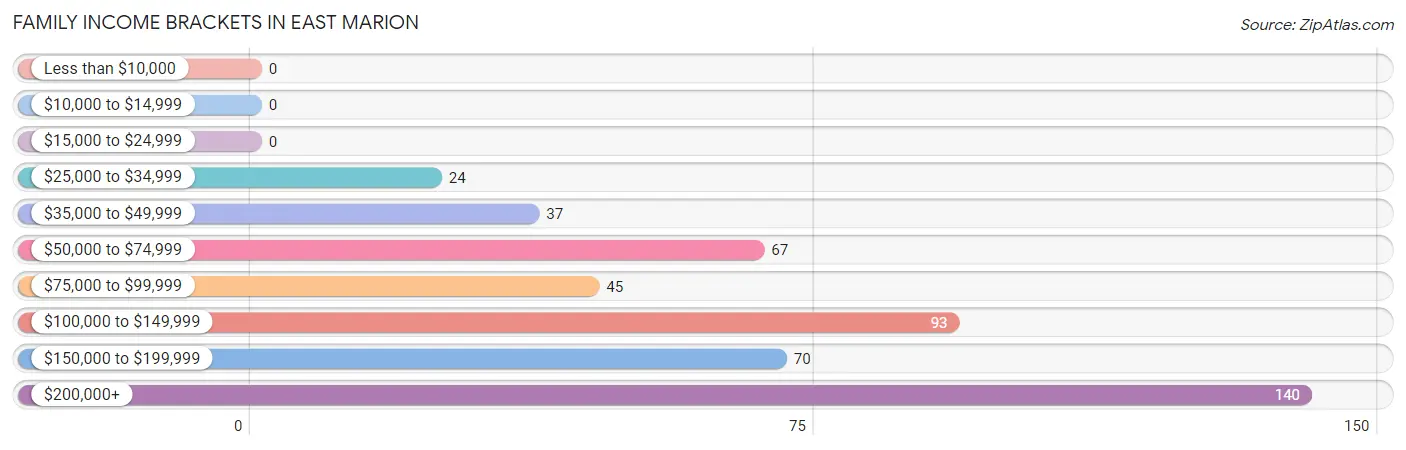
| Income Bracket | # Families | % Families |
| Less than $10,000 | 0 | 0.0% |
| $10,000 to $14,999 | 0 | 0.0% |
| $15,000 to $24,999 | 0 | 0.0% |
| $25,000 to $34,999 | 24 | 5.0% |
| $35,000 to $49,999 | 37 | 7.8% |
| $50,000 to $74,999 | 67 | 14.1% |
| $75,000 to $99,999 | 45 | 9.5% |
| $100,000 to $149,999 | 93 | 19.5% |
| $150,000 to $199,999 | 70 | 14.7% |
| $200,000+ | 140 | 29.4% |
Family Income by Famaliy Size in East Marion
4-person families (81 | 17.0%) account for the highest median family income in East Marion with $189,313 per family, while 2-person families (291 | 61.1%) have the highest median income of $55,104 per family member.
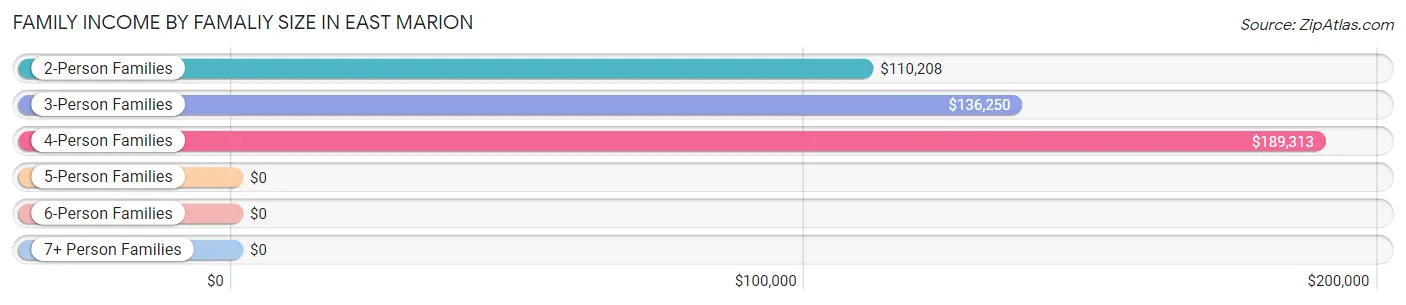
| Income Bracket | # Families | Median Income |
| 2-Person Families | 291 (61.1%) | $110,208 |
| 3-Person Families | 98 (20.6%) | $136,250 |
| 4-Person Families | 81 (17.0%) | $189,313 |
| 5-Person Families | 0 (0.0%) | $0 |
| 6-Person Families | 6 (1.3%) | $0 |
| 7+ Person Families | 0 (0.0%) | $0 |
| Total | 476 (100.0%) | $135,972 |
Family Income by Number of Earners in East Marion
The median family income in East Marion is $135,972, with families comprising 3+ earners (41) having the highest median family income of $250,001, while families with no earners (157) have the lowest median family income of $68,358, accounting for 8.6% and 33.0% of families, respectively.
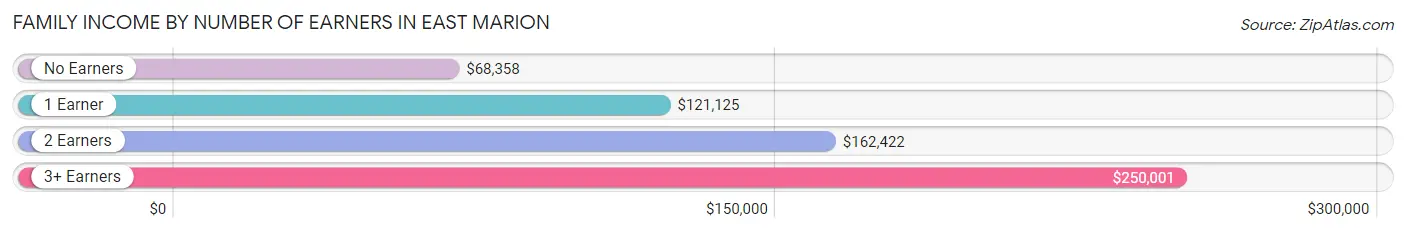
| Number of Earners | # Families | Median Income |
| No Earners | 157 (33.0%) | $68,358 |
| 1 Earner | 63 (13.2%) | $121,125 |
| 2 Earners | 215 (45.2%) | $162,422 |
| 3+ Earners | 41 (8.6%) | $250,001 |
| Total | 476 (100.0%) | $135,972 |
Household Income in East Marion
Household Income Brackets in East Marion
With 161 households falling in the category, the $200,000+ income range is the most frequent in East Marion, accounting for 22.3% of all households. In contrast, only 6 households (0.8%) fall into the $10,000 to $14,999 income bracket, making it the least populous group.
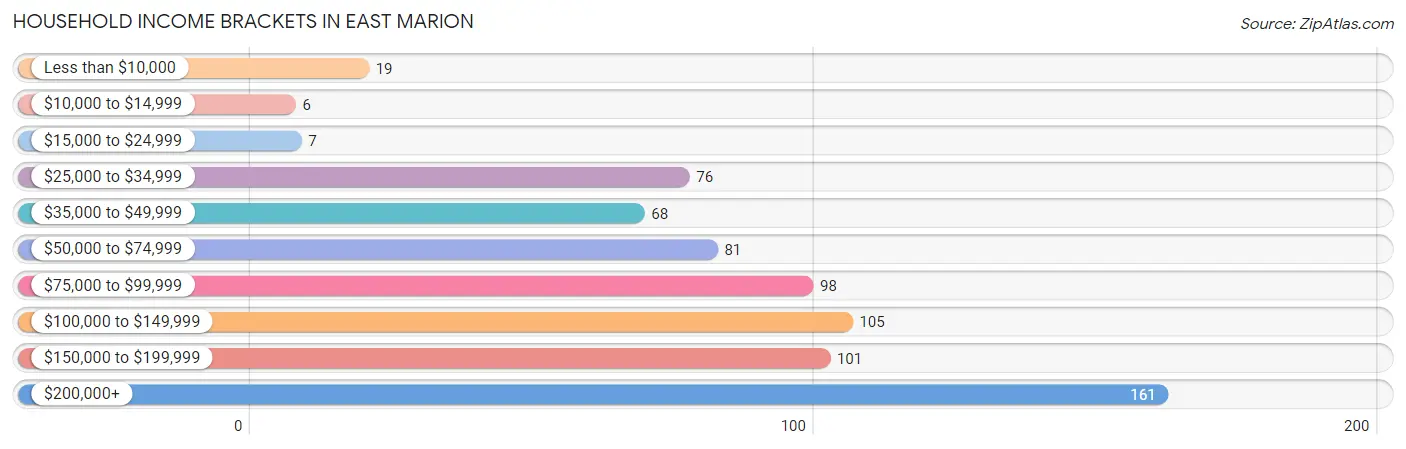
| Income Bracket | # Households | % Households |
| Less than $10,000 | 19 | 2.6% |
| $10,000 to $14,999 | 6 | 0.8% |
| $15,000 to $24,999 | 7 | 1.0% |
| $25,000 to $34,999 | 76 | 10.5% |
| $35,000 to $49,999 | 68 | 9.4% |
| $50,000 to $74,999 | 81 | 11.2% |
| $75,000 to $99,999 | 98 | 13.6% |
| $100,000 to $149,999 | 105 | 14.5% |
| $150,000 to $199,999 | 101 | 14.0% |
| $200,000+ | 161 | 22.3% |
Household Income by Householder Age in East Marion
The median household income in East Marion is $100,682, with the highest median household income of $174,531 found in the 45 to 64 years age bracket for the primary householder. A total of 239 households (33.1%) fall into this category.
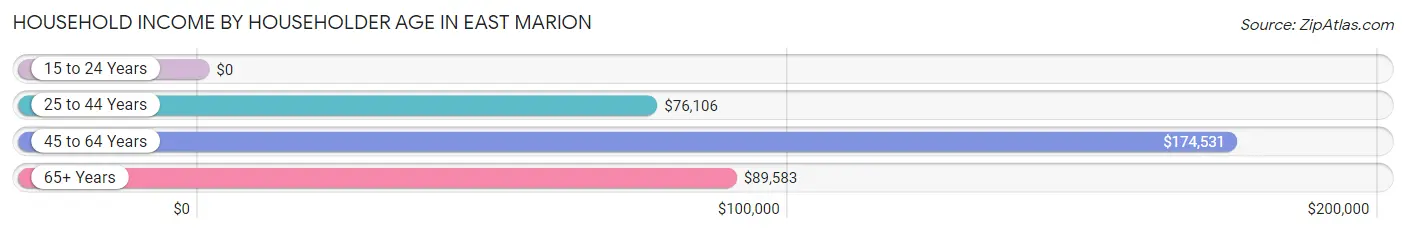
| Income Bracket | # Households | Median Income |
| 15 to 24 Years | 0 (0.0%) | $0 |
| 25 to 44 Years | 41 (5.7%) | $76,106 |
| 45 to 64 Years | 239 (33.1%) | $174,531 |
| 65+ Years | 442 (61.2%) | $89,583 |
| Total | 722 (100.0%) | $100,682 |
Poverty in East Marion
Income Below Poverty by Sex and Age in East Marion
With 1.8% poverty level for males and 1.5% for females among the residents of East Marion, 65 to 74 year old males and 75 year old and over females are the most vulnerable to poverty, with 12 males (6.7%) and 13 females (6.5%) in their respective age groups living below the poverty level.
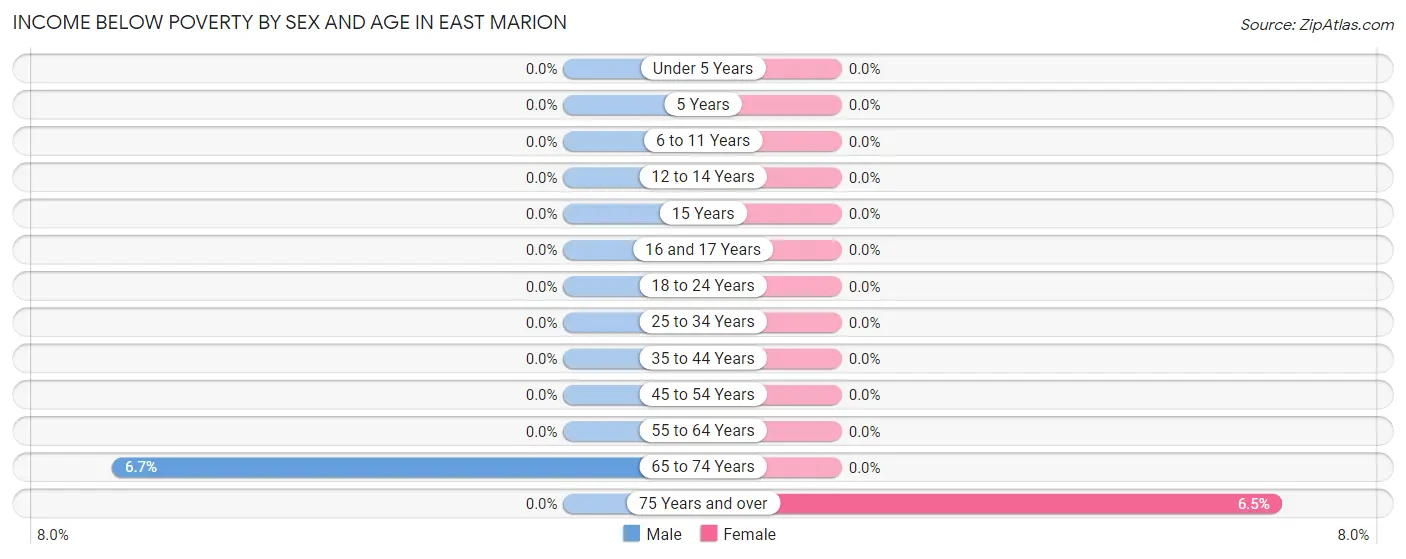
| Age Bracket | Male | Female |
| Under 5 Years | 0 (0.0%) | 0 (0.0%) |
| 5 Years | 0 (0.0%) | 0 (0.0%) |
| 6 to 11 Years | 0 (0.0%) | 0 (0.0%) |
| 12 to 14 Years | 0 (0.0%) | 0 (0.0%) |
| 15 Years | 0 (0.0%) | 0 (0.0%) |
| 16 and 17 Years | 0 (0.0%) | 0 (0.0%) |
| 18 to 24 Years | 0 (0.0%) | 0 (0.0%) |
| 25 to 34 Years | 0 (0.0%) | 0 (0.0%) |
| 35 to 44 Years | 0 (0.0%) | 0 (0.0%) |
| 45 to 54 Years | 0 (0.0%) | 0 (0.0%) |
| 55 to 64 Years | 0 (0.0%) | 0 (0.0%) |
| 65 to 74 Years | 12 (6.7%) | 0 (0.0%) |
| 75 Years and over | 0 (0.0%) | 13 (6.5%) |
| Total | 12 (1.8%) | 13 (1.5%) |
Income Above Poverty by Sex and Age in East Marion
According to the poverty statistics in East Marion, males aged under 5 years and females aged under 5 years are the age groups that are most secure financially, with 100.0% of males and 100.0% of females in these age groups living above the poverty line.
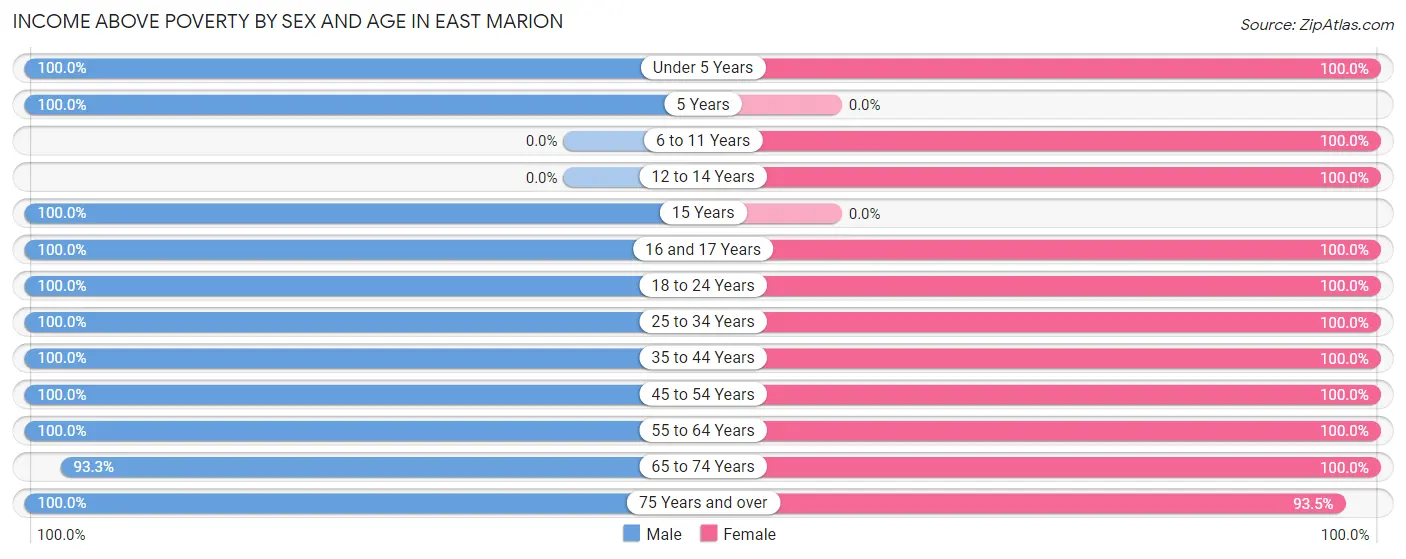
| Age Bracket | Male | Female |
| Under 5 Years | 7 (100.0%) | 30 (100.0%) |
| 5 Years | 6 (100.0%) | 0 (0.0%) |
| 6 to 11 Years | 0 (0.0%) | 19 (100.0%) |
| 12 to 14 Years | 0 (0.0%) | 40 (100.0%) |
| 15 Years | 7 (100.0%) | 0 (0.0%) |
| 16 and 17 Years | 13 (100.0%) | 30 (100.0%) |
| 18 to 24 Years | 54 (100.0%) | 55 (100.0%) |
| 25 to 34 Years | 56 (100.0%) | 48 (100.0%) |
| 35 to 44 Years | 33 (100.0%) | 32 (100.0%) |
| 45 to 54 Years | 93 (100.0%) | 113 (100.0%) |
| 55 to 64 Years | 91 (100.0%) | 123 (100.0%) |
| 65 to 74 Years | 167 (93.3%) | 188 (100.0%) |
| 75 Years and over | 148 (100.0%) | 186 (93.5%) |
| Total | 675 (98.3%) | 864 (98.5%) |
Income Below Poverty Among Married-Couple Families in East Marion
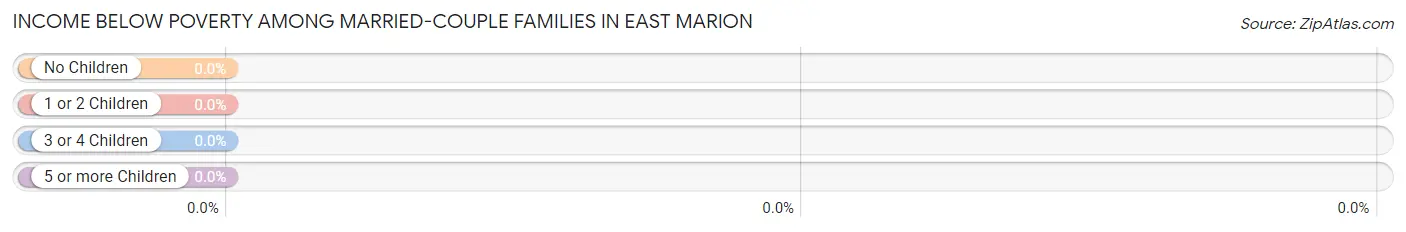
| Children | Above Poverty | Below Poverty |
| No Children | 377 (100.0%) | 0 (0.0%) |
| 1 or 2 Children | 83 (100.0%) | 0 (0.0%) |
| 3 or 4 Children | 0 (0.0%) | 0 (0.0%) |
| 5 or more Children | 0 (0.0%) | 0 (0.0%) |
| Total | 460 (100.0%) | 0 (0.0%) |
Income Below Poverty Among Single-Parent Households in East Marion
| Children | Single Father | Single Mother |
| No Children | 0 (0.0%) | 0 (0.0%) |
| 1 or 2 Children | 0 (0.0%) | 0 (0.0%) |
| 3 or 4 Children | 0 (0.0%) | 0 (0.0%) |
| 5 or more Children | 0 (0.0%) | 0 (0.0%) |
| Total | 0 (0.0%) | 0 (0.0%) |
Income Below Poverty Among Married-Couple vs Single-Parent Households in East Marion
| Children | Married-Couple Families | Single-Parent Households |
| No Children | 0 (0.0%) | 0 (0.0%) |
| 1 or 2 Children | 0 (0.0%) | 0 (0.0%) |
| 3 or 4 Children | 0 (0.0%) | 0 (0.0%) |
| 5 or more Children | 0 (0.0%) | 0 (0.0%) |
| Total | 0 (0.0%) | 0 (0.0%) |
Race in East Marion
The most populous races in East Marion are White / Caucasian (1,518 | 97.1%), Two or more Races (37 | 2.4%), and Hispanic or Latino (31 | 2.0%).
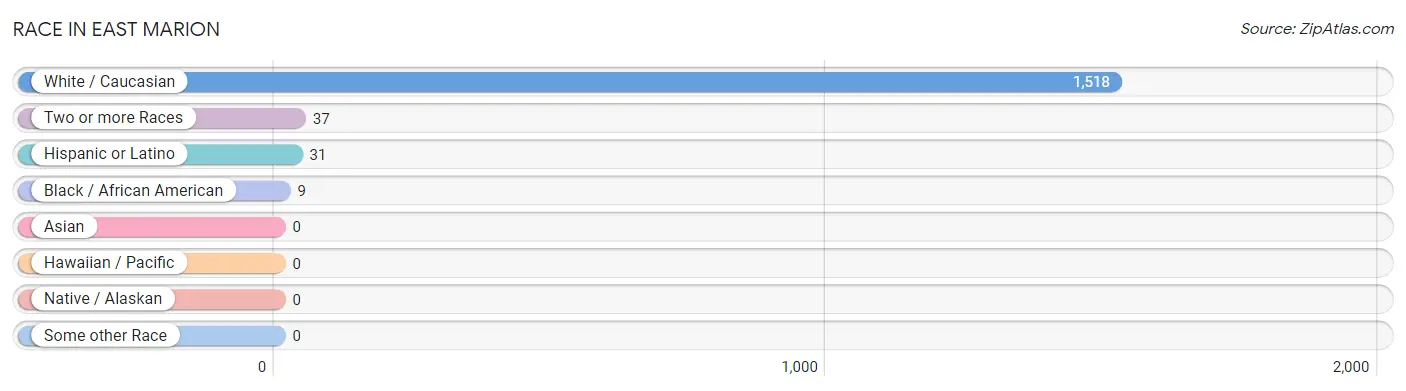
| Race | # Population | % Population |
| Asian | 0 | 0.0% |
| Black / African American | 9 | 0.6% |
| Hawaiian / Pacific | 0 | 0.0% |
| Hispanic or Latino | 31 | 2.0% |
| Native / Alaskan | 0 | 0.0% |
| White / Caucasian | 1,518 | 97.1% |
| Two or more Races | 37 | 2.4% |
| Some other Race | 0 | 0.0% |
| Total | 1,564 | 100.0% |
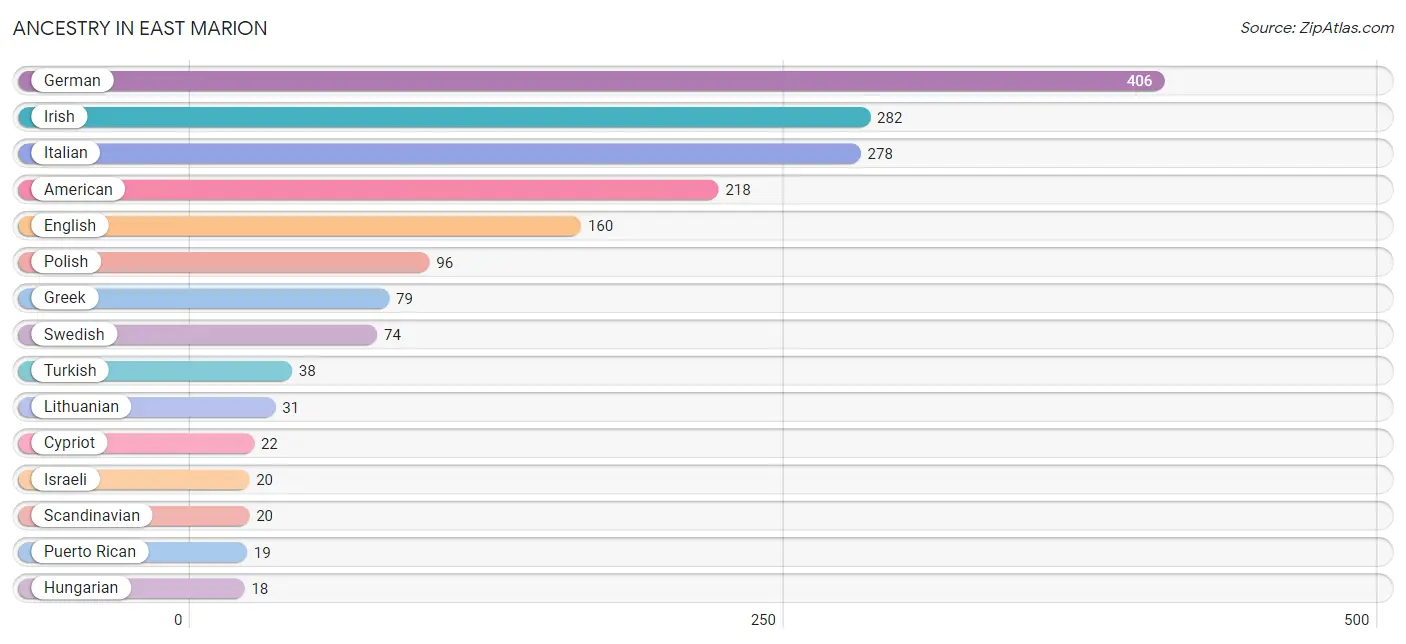
Ancestry in East Marion
The most populous ancestries reported in East Marion are German (406 | 26.0%), Irish (282 | 18.0%), Italian (278 | 17.8%), American (218 | 13.9%), and English (160 | 10.2%), together accounting for 85.9% of all East Marion residents.
| Ancestry | # Population | % Population |
| American | 218 | 13.9% |
| Armenian | 7 | 0.4% |
| British | 11 | 0.7% |
| Cypriot | 22 | 1.4% |
| Danish | 6 | 0.4% |
| Dutch | 7 | 0.4% |
| Eastern European | 13 | 0.8% |
| English | 160 | 10.2% |
| European | 6 | 0.4% |
| French Canadian | 7 | 0.4% |
| German | 406 | 26.0% |
| Greek | 79 | 5.1% |
| Hungarian | 18 | 1.1% |
| Icelander | 3 | 0.2% |
| Indian (Asian) | 6 | 0.4% |
| Irish | 282 | 18.0% |
| Israeli | 20 | 1.3% |
| Italian | 278 | 17.8% |
| Lithuanian | 31 | 2.0% |
| Norwegian | 6 | 0.4% |
| Polish | 96 | 6.1% |
| Portuguese | 14 | 0.9% |
| Puerto Rican | 19 | 1.2% |
| Russian | 18 | 1.1% |
| Scandinavian | 20 | 1.3% |
| Scotch-Irish | 6 | 0.4% |
| Spanish | 12 | 0.8% |
| Swedish | 74 | 4.7% |
| Swiss | 3 | 0.2% |
| Turkish | 38 | 2.4% |
| Welsh | 7 | 0.4% |
| Yugoslavian | 7 | 0.4% | View All 32 Rows |
Immigrants in East Marion
The most numerous immigrant groups reported in East Marion came from Europe (92 | 5.9%), Asia (65 | 4.2%), Southern Europe (64 | 4.1%), Western Asia (59 | 3.8%), and Greece (53 | 3.4%), together accounting for 21.3% of all East Marion residents.
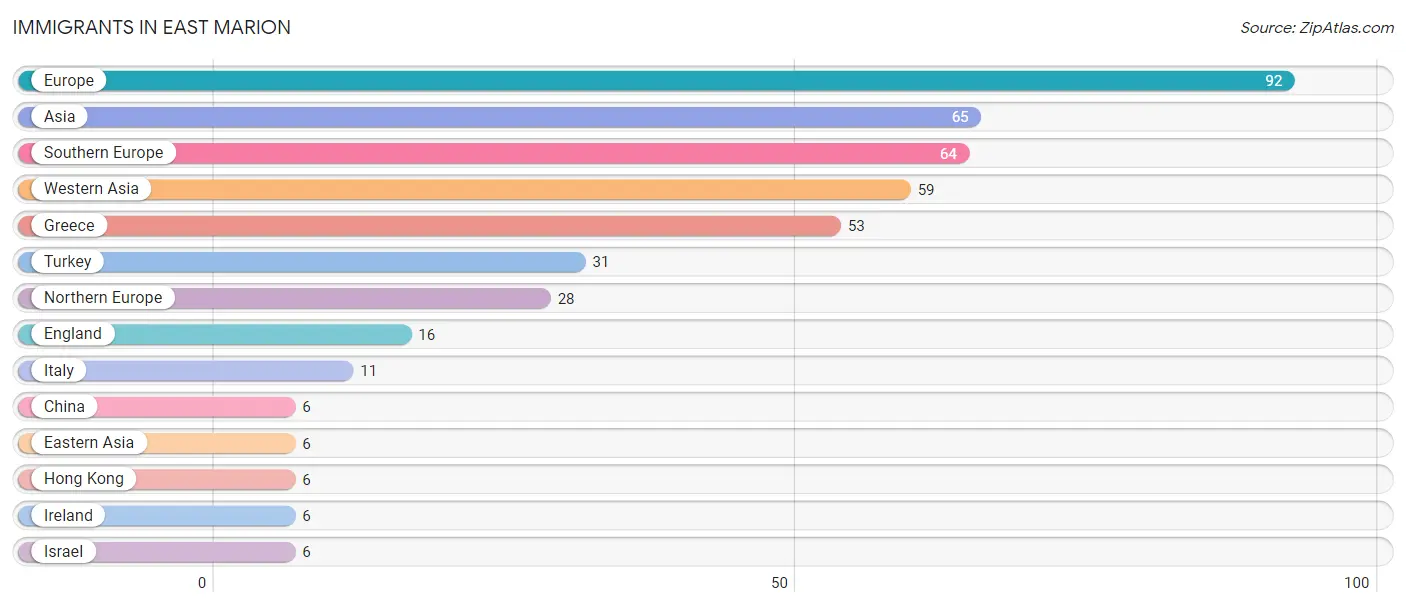
| Immigration Origin | # Population | % Population |
| Asia | 65 | 4.2% |
| China | 6 | 0.4% |
| Eastern Asia | 6 | 0.4% |
| England | 16 | 1.0% |
| Europe | 92 | 5.9% |
| Greece | 53 | 3.4% |
| Hong Kong | 6 | 0.4% |
| Ireland | 6 | 0.4% |
| Israel | 6 | 0.4% |
| Italy | 11 | 0.7% |
| Northern Europe | 28 | 1.8% |
| Southern Europe | 64 | 4.1% |
| Turkey | 31 | 2.0% |
| Western Asia | 59 | 3.8% | View All 14 Rows |
Sex and Age in East Marion
Sex and Age in East Marion
The most populous age groups in East Marion are 70 to 74 Years (108 | 15.7%) for men and 65 to 69 Years (118 | 13.5%) for women.
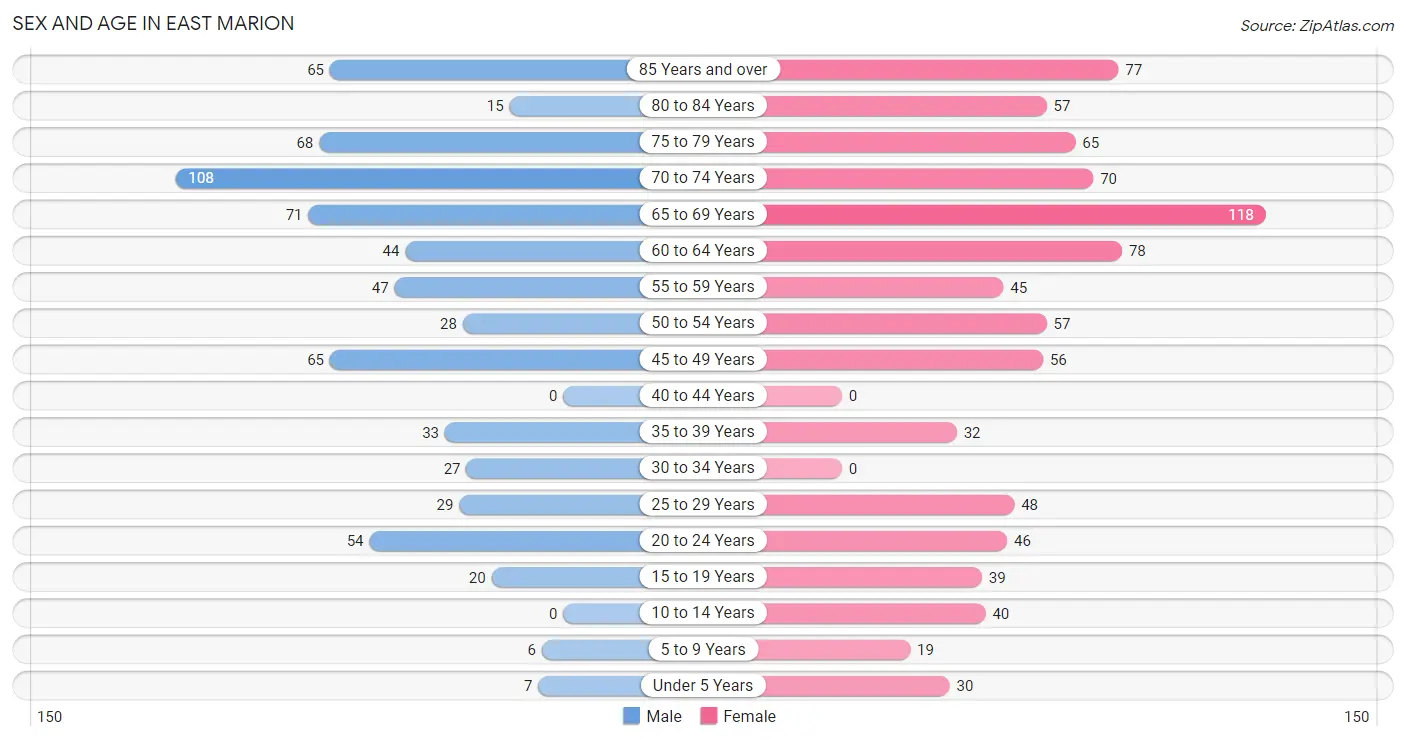
| Age Bracket | Male | Female |
| Under 5 Years | 7 (1.0%) | 30 (3.4%) |
| 5 to 9 Years | 6 (0.9%) | 19 (2.2%) |
| 10 to 14 Years | 0 (0.0%) | 40 (4.6%) |
| 15 to 19 Years | 20 (2.9%) | 39 (4.4%) |
| 20 to 24 Years | 54 (7.9%) | 46 (5.2%) |
| 25 to 29 Years | 29 (4.2%) | 48 (5.5%) |
| 30 to 34 Years | 27 (3.9%) | 0 (0.0%) |
| 35 to 39 Years | 33 (4.8%) | 32 (3.6%) |
| 40 to 44 Years | 0 (0.0%) | 0 (0.0%) |
| 45 to 49 Years | 65 (9.5%) | 56 (6.4%) |
| 50 to 54 Years | 28 (4.1%) | 57 (6.5%) |
| 55 to 59 Years | 47 (6.8%) | 45 (5.1%) |
| 60 to 64 Years | 44 (6.4%) | 78 (8.9%) |
| 65 to 69 Years | 71 (10.3%) | 118 (13.5%) |
| 70 to 74 Years | 108 (15.7%) | 70 (8.0%) |
| 75 to 79 Years | 68 (9.9%) | 65 (7.4%) |
| 80 to 84 Years | 15 (2.2%) | 57 (6.5%) |
| 85 Years and over | 65 (9.5%) | 77 (8.8%) |
| Total | 687 (100.0%) | 877 (100.0%) |
Families and Households in East Marion
Median Family Size in East Marion
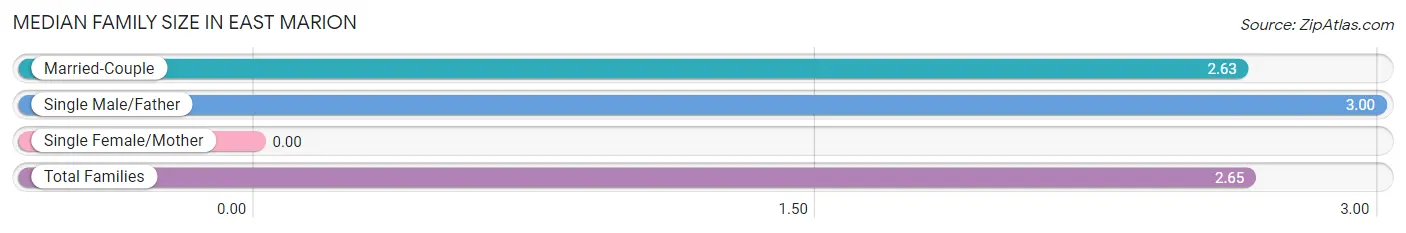
| Family Type | # Families | Family Size |
| Married-Couple | 460 (96.6%) | 2.63 |
| Single Male/Father | 16 (3.4%) | 3.00 |
| Single Female/Mother | 0 (0.0%) | - |
| Total Families | 476 (100.0%) | 2.65 |
Median Household Size in East Marion
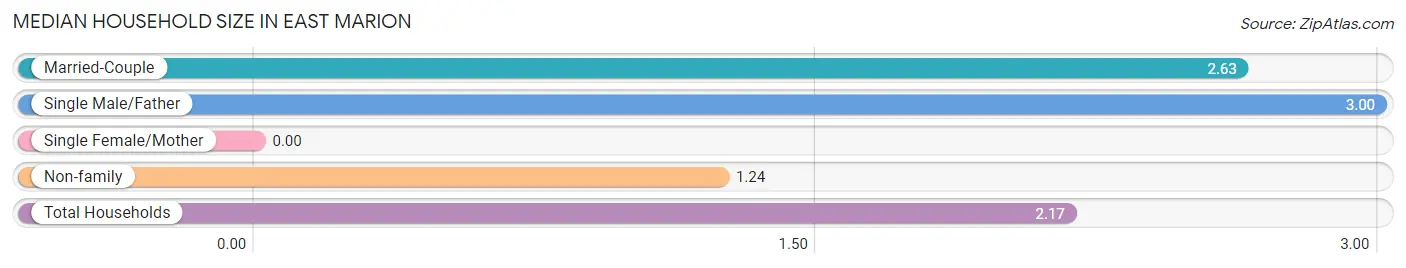
| Household Type | # Households | Household Size |
| Married-Couple | 460 (63.7%) | 2.63 |
| Single Male/Father | 16 (2.2%) | 3.00 |
| Single Female/Mother | 0 (0.0%) | - |
| Non-family | 246 (34.1%) | 1.24 |
| Total Households | 722 (100.0%) | 2.17 |
Household Size by Marriage Status in East Marion
Out of a total of 722 households in East Marion, 476 (65.9%) are family households, while 246 (34.1%) are nonfamily households. The most numerous type of family households are 2-person households, comprising 291, and the most common type of nonfamily households are 1-person households, comprising 196.
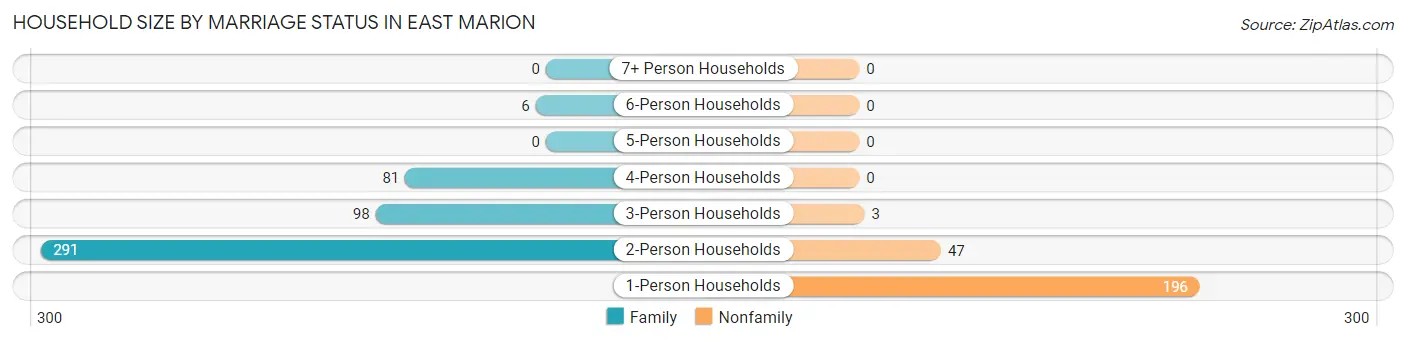
| Household Size | Family Households | Nonfamily Households |
| 1-Person Households | - | 196 (27.2%) |
| 2-Person Households | 291 (40.3%) | 47 (6.5%) |
| 3-Person Households | 98 (13.6%) | 3 (0.4%) |
| 4-Person Households | 81 (11.2%) | 0 (0.0%) |
| 5-Person Households | 0 (0.0%) | 0 (0.0%) |
| 6-Person Households | 6 (0.8%) | 0 (0.0%) |
| 7+ Person Households | 0 (0.0%) | 0 (0.0%) |
| Total | 476 (65.9%) | 246 (34.1%) |
Female Fertility in East Marion
Fertility by Age in East Marion
| Age Bracket | Women with Births | Births / 1,000 Women |
| 15 to 19 years | 0 (0.0%) | 0.0 |
| 20 to 34 years | 0 (0.0%) | 0.0 |
| 35 to 50 years | 0 (0.0%) | 0.0 |
| Total | 0 (0.0%) | 0.0 |
Fertility by Age by Marriage Status in East Marion
| Age Bracket | Married | Unmarried |
| 15 to 19 years | 0 (0.0%) | 0 (0.0%) |
| 20 to 34 years | 0 (0.0%) | 0 (0.0%) |
| 35 to 50 years | 0 (0.0%) | 0 (0.0%) |
| Total | 0 (0.0%) | 0 (0.0%) |
Fertility by Education in East Marion
| Educational Attainment | Women with Births | Births / 1,000 Women |
| Less than High School | 0 (0.0%) | 0.0 |
| High School Diploma | 0 (0.0%) | 0.0 |
| College or Associate's Degree | 0 (0.0%) | 0.0 |
| Bachelor's Degree | 0 (0.0%) | 0.0 |
| Graduate Degree | 0 (0.0%) | 0.0 |
| Total | 0 (0.0%) | 0.0 |
Fertility by Education by Marriage Status in East Marion
| Educational Attainment | Married | Unmarried |
| Less than High School | 0 (0.0%) | 0 (0.0%) |
| High School Diploma | 0 (0.0%) | 0 (0.0%) |
| College or Associate's Degree | 0 (0.0%) | 0 (0.0%) |
| Bachelor's Degree | 0 (0.0%) | 0 (0.0%) |
| Graduate Degree | 0 (0.0%) | 0 (0.0%) |
| Total | 0 (0.0%) | 0 (0.0%) |
Employment Characteristics in East Marion
Employment by Class of Employer in East Marion
Among the 691 employed individuals in East Marion, private company employees (258 | 37.3%), local government employees (143 | 20.7%), and self-employed (not incorporated) (101 | 14.6%) make up the most common classes of employment.
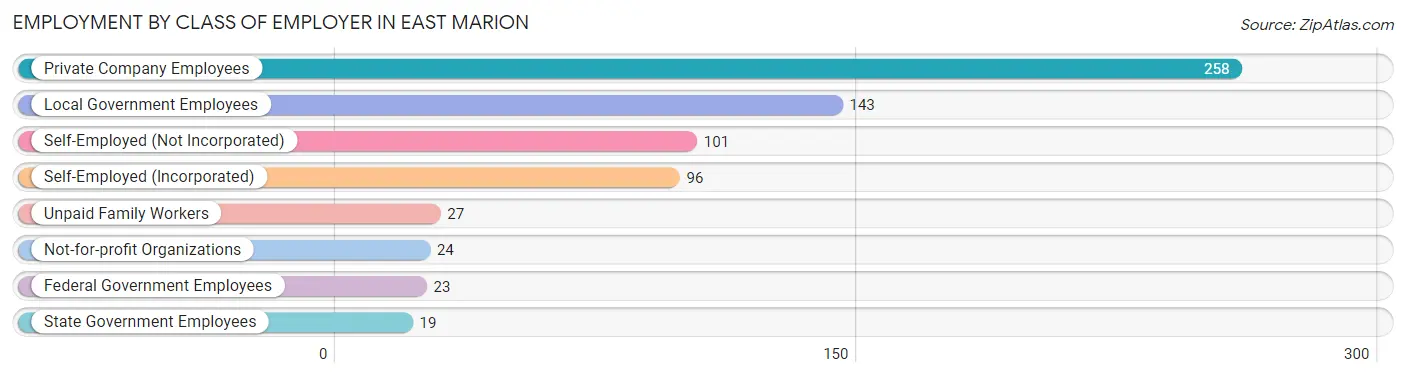
| Employer Class | # Employees | % Employees |
| Private Company Employees | 258 | 37.3% |
| Self-Employed (Incorporated) | 96 | 13.9% |
| Self-Employed (Not Incorporated) | 101 | 14.6% |
| Not-for-profit Organizations | 24 | 3.5% |
| Local Government Employees | 143 | 20.7% |
| State Government Employees | 19 | 2.8% |
| Federal Government Employees | 23 | 3.3% |
| Unpaid Family Workers | 27 | 3.9% |
| Total | 691 | 100.0% |
Employment Status by Age in East Marion
According to the labor force statistics for East Marion, out of the total population over 16 years of age (1,455), 48.7% or 709 individuals are in the labor force, with 0.8% or 6 of them unemployed. The age group with the highest labor force participation rate is 30 to 34 years, with 100.0% or 27 individuals in the labor force. Within the labor force, the 75 years and over age range has the highest percentage of unemployed individuals, with 18.8% or 6 of them being unemployed.
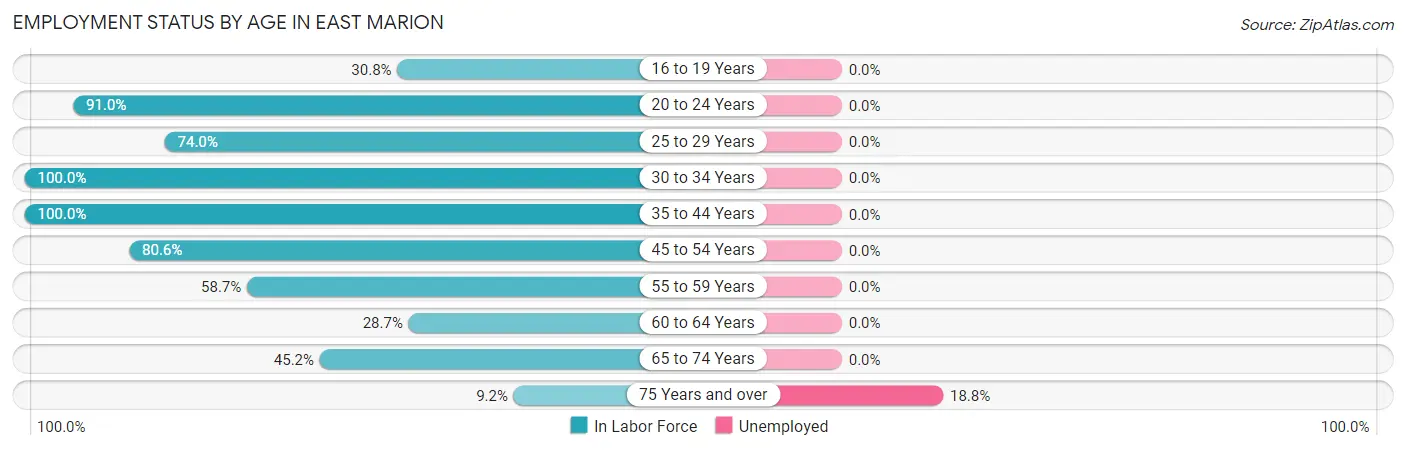
| Age Bracket | In Labor Force | Unemployed |
| 16 to 19 Years | 16 (30.8%) | 0 (0.0%) |
| 20 to 24 Years | 91 (91.0%) | 0 (0.0%) |
| 25 to 29 Years | 57 (74.0%) | 0 (0.0%) |
| 30 to 34 Years | 27 (100.0%) | 0 (0.0%) |
| 35 to 44 Years | 65 (100.0%) | 0 (0.0%) |
| 45 to 54 Years | 166 (80.6%) | 0 (0.0%) |
| 55 to 59 Years | 54 (58.7%) | 0 (0.0%) |
| 60 to 64 Years | 35 (28.7%) | 0 (0.0%) |
| 65 to 74 Years | 166 (45.2%) | 0 (0.0%) |
| 75 Years and over | 32 (9.2%) | 6 (18.8%) |
| Total | 709 (48.7%) | 6 (0.8%) |
Employment Status by Educational Attainment in East Marion
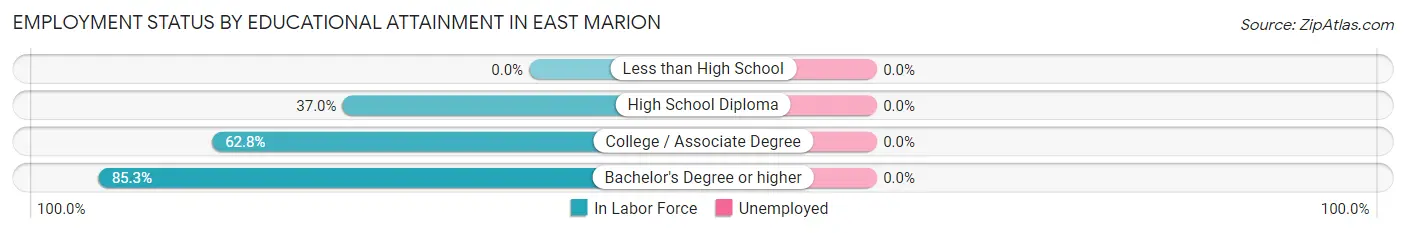
| Educational Attainment | In Labor Force | Unemployed |
| Less than High School | 0 (0.0%) | 0 (0.0%) |
| High School Diploma | 37 (37.0%) | 0 (0.0%) |
| College / Associate Degree | 140 (62.8%) | 0 (0.0%) |
| Bachelor's Degree or higher | 227 (85.3%) | 0 (0.0%) |
| Total | 404 (68.6%) | 0 (0.0%) |
Employment Occupations by Sex in East Marion
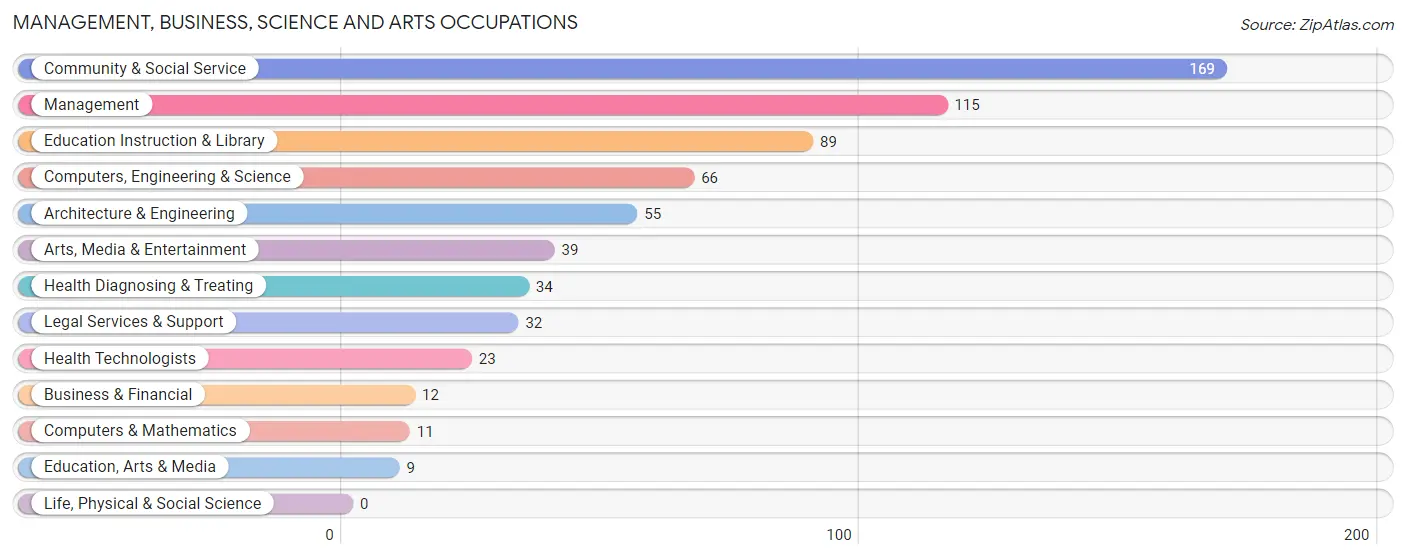
Management, Business, Science and Arts Occupations
The most common Management, Business, Science and Arts occupations in East Marion are Community & Social Service (169 | 24.0%), Management (115 | 16.4%), Education Instruction & Library (89 | 12.7%), Computers, Engineering & Science (66 | 9.4%), and Architecture & Engineering (55 | 7.8%).
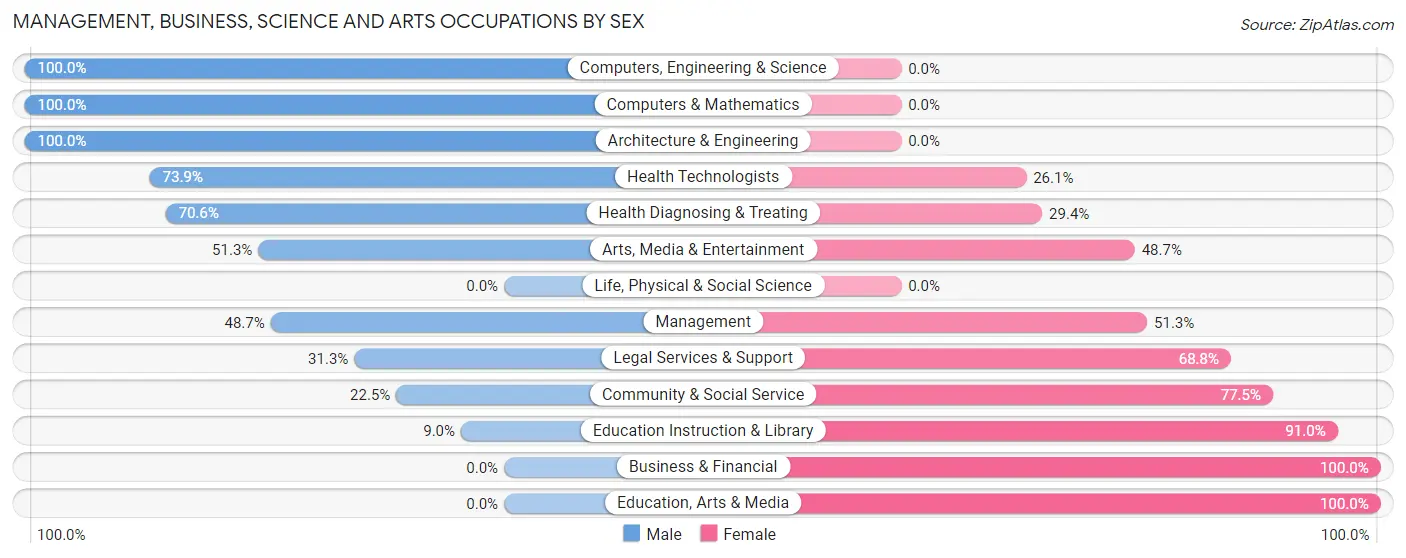
Management, Business, Science and Arts Occupations by Sex
Within the Management, Business, Science and Arts occupations in East Marion, the most male-oriented occupations are Computers, Engineering & Science (100.0%), Computers & Mathematics (100.0%), and Architecture & Engineering (100.0%), while the most female-oriented occupations are Business & Financial (100.0%), Education, Arts & Media (100.0%), and Education Instruction & Library (91.0%).
| Occupation | Male | Female |
| Management | 56 (48.7%) | 59 (51.3%) |
| Business & Financial | 0 (0.0%) | 12 (100.0%) |
| Computers, Engineering & Science | 66 (100.0%) | 0 (0.0%) |
| Computers & Mathematics | 11 (100.0%) | 0 (0.0%) |
| Architecture & Engineering | 55 (100.0%) | 0 (0.0%) |
| Life, Physical & Social Science | 0 (0.0%) | 0 (0.0%) |
| Community & Social Service | 38 (22.5%) | 131 (77.5%) |
| Education, Arts & Media | 0 (0.0%) | 9 (100.0%) |
| Legal Services & Support | 10 (31.2%) | 22 (68.8%) |
| Education Instruction & Library | 8 (9.0%) | 81 (91.0%) |
| Arts, Media & Entertainment | 20 (51.3%) | 19 (48.7%) |
| Health Diagnosing & Treating | 24 (70.6%) | 10 (29.4%) |
| Health Technologists | 17 (73.9%) | 6 (26.1%) |
| Total (Category) | 184 (46.5%) | 212 (53.5%) |
| Total (Overall) | 340 (48.4%) | 363 (51.6%) |
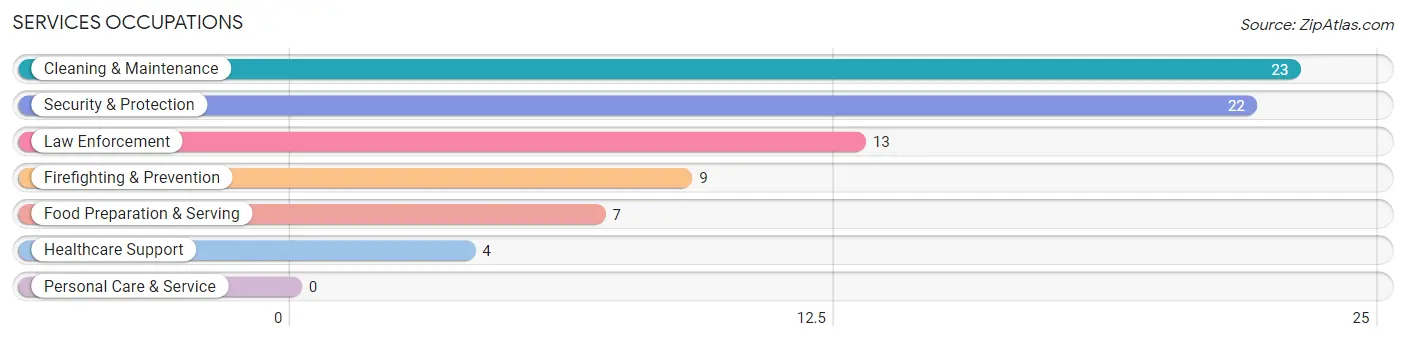
Services Occupations
The most common Services occupations in East Marion are Cleaning & Maintenance (23 | 3.3%), Security & Protection (22 | 3.1%), Law Enforcement (13 | 1.8%), Firefighting & Prevention (9 | 1.3%), and Food Preparation & Serving (7 | 1.0%).
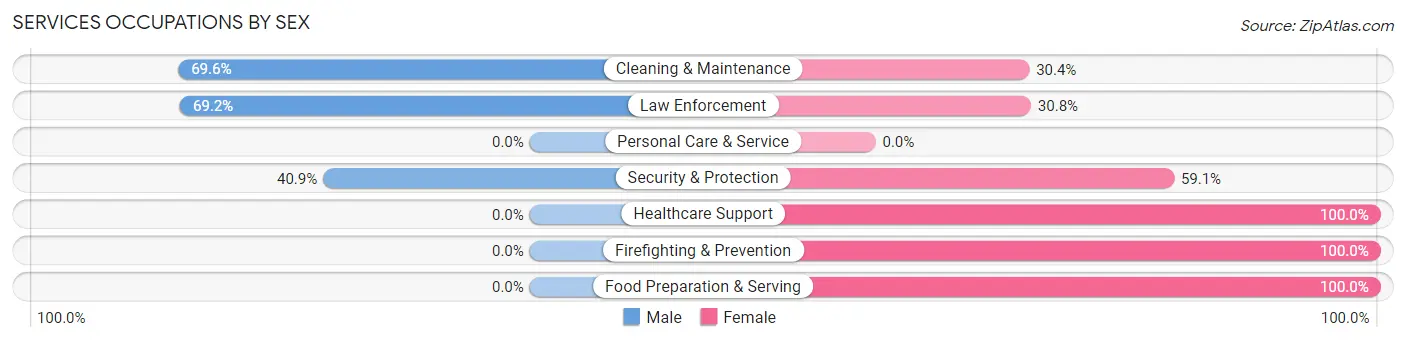
Services Occupations by Sex
Within the Services occupations in East Marion, the most male-oriented occupations are Cleaning & Maintenance (69.6%), Law Enforcement (69.2%), and Security & Protection (40.9%), while the most female-oriented occupations are Healthcare Support (100.0%), Firefighting & Prevention (100.0%), and Food Preparation & Serving (100.0%).
| Occupation | Male | Female |
| Healthcare Support | 0 (0.0%) | 4 (100.0%) |
| Security & Protection | 9 (40.9%) | 13 (59.1%) |
| Firefighting & Prevention | 0 (0.0%) | 9 (100.0%) |
| Law Enforcement | 9 (69.2%) | 4 (30.8%) |
| Food Preparation & Serving | 0 (0.0%) | 7 (100.0%) |
| Cleaning & Maintenance | 16 (69.6%) | 7 (30.4%) |
| Personal Care & Service | 0 (0.0%) | 0 (0.0%) |
| Total (Category) | 25 (44.6%) | 31 (55.4%) |
| Total (Overall) | 340 (48.4%) | 363 (51.6%) |
Sales and Office Occupations
The most common Sales and Office occupations in East Marion are Office & Administration (117 | 16.6%), and Sales & Related (54 | 7.7%).
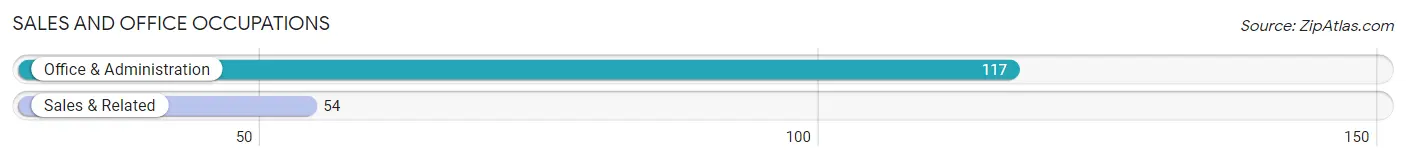
Sales and Office Occupations by Sex
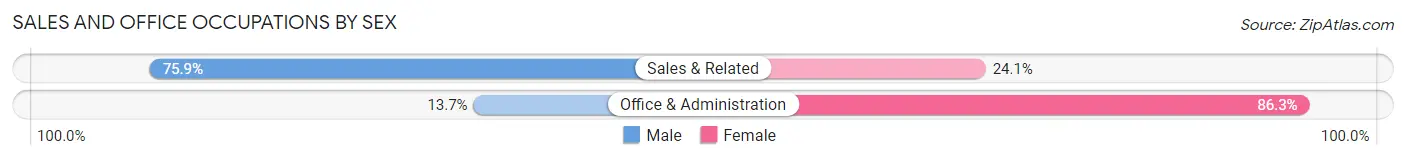
| Occupation | Male | Female |
| Sales & Related | 41 (75.9%) | 13 (24.1%) |
| Office & Administration | 16 (13.7%) | 101 (86.3%) |
| Total (Category) | 57 (33.3%) | 114 (66.7%) |
| Total (Overall) | 340 (48.4%) | 363 (51.6%) |
Natural Resources, Construction and Maintenance Occupations
The most common Natural Resources, Construction and Maintenance occupations in East Marion are Farming, Fishing & Forestry (33 | 4.7%), and Construction & Extraction (26 | 3.7%).
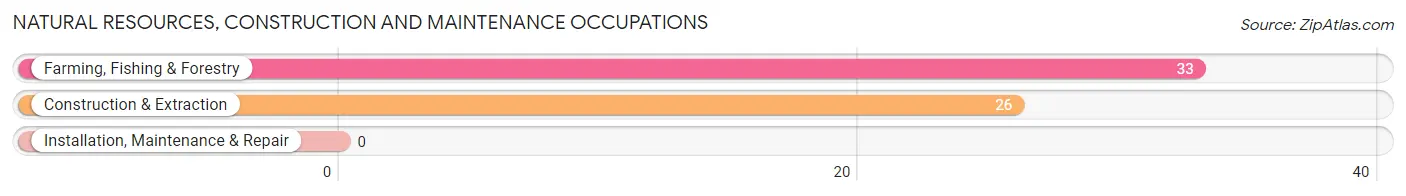
Natural Resources, Construction and Maintenance Occupations by Sex
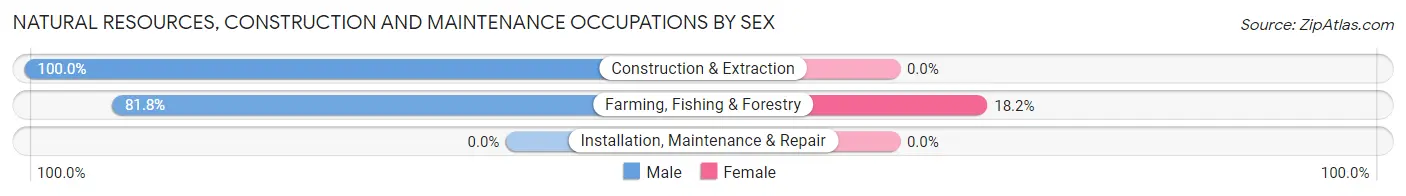
| Occupation | Male | Female |
| Farming, Fishing & Forestry | 27 (81.8%) | 6 (18.2%) |
| Construction & Extraction | 26 (100.0%) | 0 (0.0%) |
| Installation, Maintenance & Repair | 0 (0.0%) | 0 (0.0%) |
| Total (Category) | 53 (89.8%) | 6 (10.2%) |
| Total (Overall) | 340 (48.4%) | 363 (51.6%) |
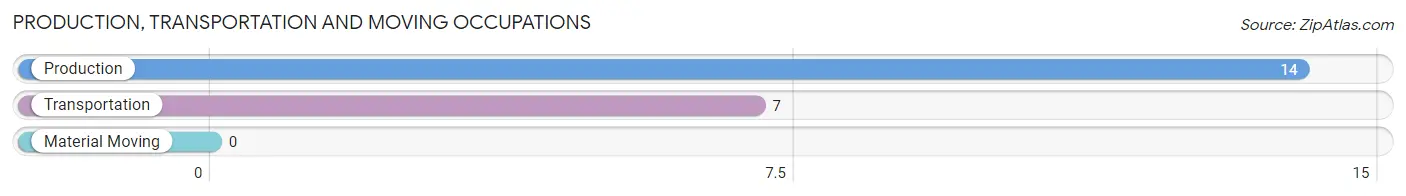
Production, Transportation and Moving Occupations
The most common Production, Transportation and Moving occupations in East Marion are Production (14 | 2.0%), and Transportation (7 | 1.0%).
Production, Transportation and Moving Occupations by Sex
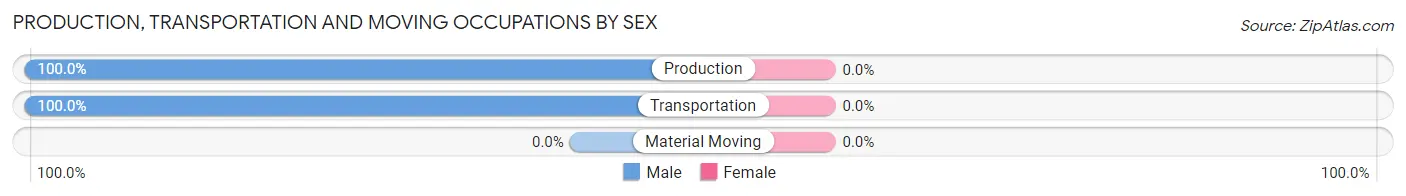
| Occupation | Male | Female |
| Production | 14 (100.0%) | 0 (0.0%) |
| Transportation | 7 (100.0%) | 0 (0.0%) |
| Material Moving | 0 (0.0%) | 0 (0.0%) |
| Total (Category) | 21 (100.0%) | 0 (0.0%) |
| Total (Overall) | 340 (48.4%) | 363 (51.6%) |
Employment Industries by Sex in East Marion
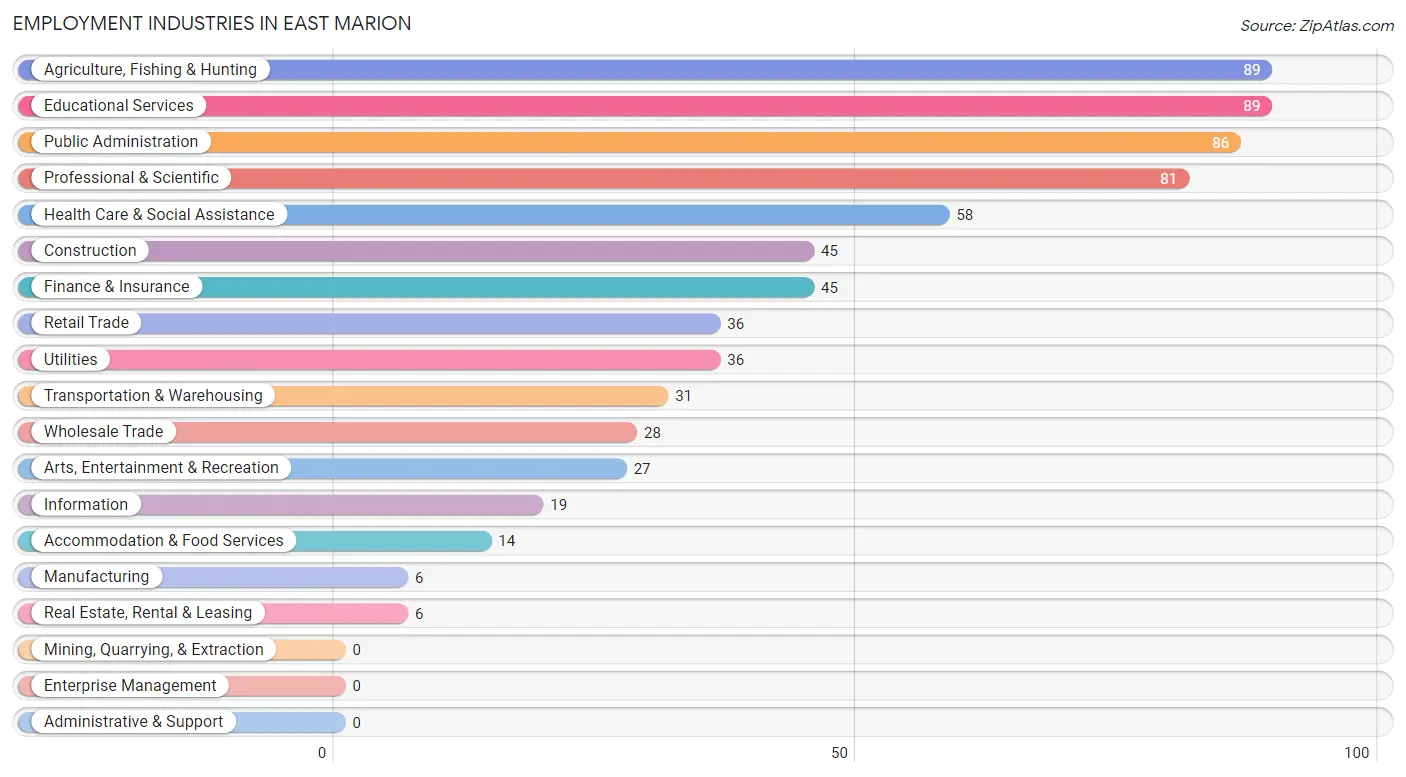
Employment Industries in East Marion
The major employment industries in East Marion include Agriculture, Fishing & Hunting (89 | 12.7%), Educational Services (89 | 12.7%), Public Administration (86 | 12.2%), Professional & Scientific (81 | 11.5%), and Health Care & Social Assistance (58 | 8.3%).
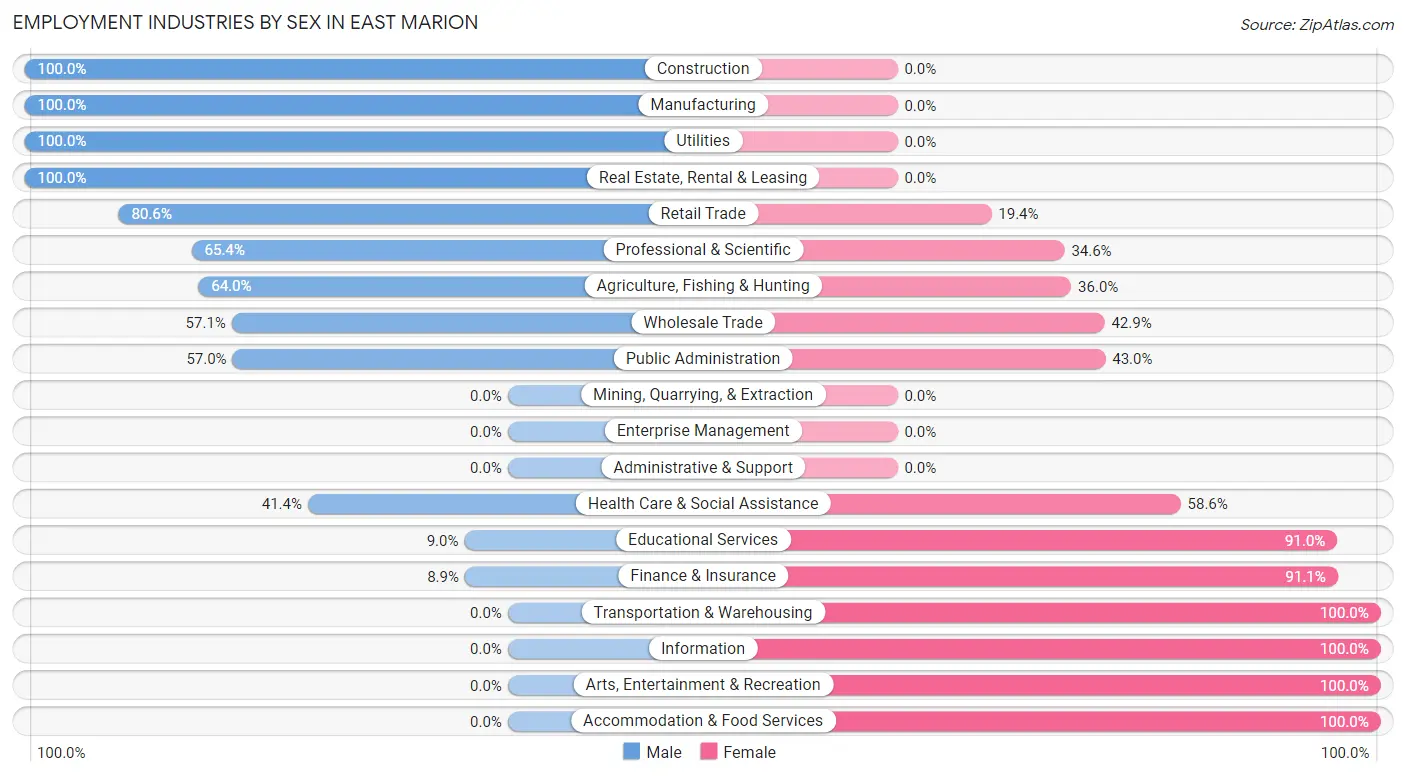
Employment Industries by Sex in East Marion
The East Marion industries that see more men than women are Construction (100.0%), Manufacturing (100.0%), and Utilities (100.0%), whereas the industries that tend to have a higher number of women are Transportation & Warehousing (100.0%), Information (100.0%), and Arts, Entertainment & Recreation (100.0%).
| Industry | Male | Female |
| Agriculture, Fishing & Hunting | 57 (64.0%) | 32 (36.0%) |
| Mining, Quarrying, & Extraction | 0 (0.0%) | 0 (0.0%) |
| Construction | 45 (100.0%) | 0 (0.0%) |
| Manufacturing | 6 (100.0%) | 0 (0.0%) |
| Wholesale Trade | 16 (57.1%) | 12 (42.9%) |
| Retail Trade | 29 (80.6%) | 7 (19.4%) |
| Transportation & Warehousing | 0 (0.0%) | 31 (100.0%) |
| Utilities | 36 (100.0%) | 0 (0.0%) |
| Information | 0 (0.0%) | 19 (100.0%) |
| Finance & Insurance | 4 (8.9%) | 41 (91.1%) |
| Real Estate, Rental & Leasing | 6 (100.0%) | 0 (0.0%) |
| Professional & Scientific | 53 (65.4%) | 28 (34.6%) |
| Enterprise Management | 0 (0.0%) | 0 (0.0%) |
| Administrative & Support | 0 (0.0%) | 0 (0.0%) |
| Educational Services | 8 (9.0%) | 81 (91.0%) |
| Health Care & Social Assistance | 24 (41.4%) | 34 (58.6%) |
| Arts, Entertainment & Recreation | 0 (0.0%) | 27 (100.0%) |
| Accommodation & Food Services | 0 (0.0%) | 14 (100.0%) |
| Public Administration | 49 (57.0%) | 37 (43.0%) |
| Total | 340 (48.4%) | 363 (51.6%) |
Education in East Marion
School Enrollment in East Marion
The most common levels of schooling among the 189 students in East Marion are high school (71 | 37.6%), college / undergraduate (56 | 29.6%), and elementary school (19 | 10.1%).
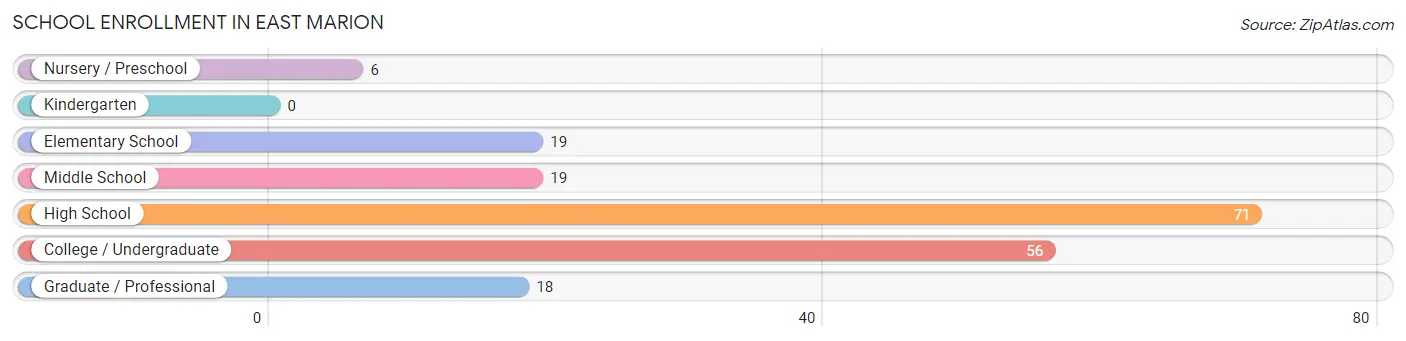
| School Level | # Students | % Students |
| Nursery / Preschool | 6 | 3.2% |
| Kindergarten | 0 | 0.0% |
| Elementary School | 19 | 10.1% |
| Middle School | 19 | 10.1% |
| High School | 71 | 37.6% |
| College / Undergraduate | 56 | 29.6% |
| Graduate / Professional | 18 | 9.5% |
| Total | 189 | 100.0% |
School Enrollment by Age by Funding Source in East Marion
Out of a total of 189 students who are enrolled in schools in East Marion, 51 (27.0%) attend a private institution, while the remaining 138 (73.0%) are enrolled in public schools. The age group of 18 to 19 year olds has the highest likelihood of being enrolled in private schools, with 9 (100.0% in the age bracket) enrolled. Conversely, the age group of 10 to 14 year olds has the lowest likelihood of being enrolled in a private school, with 40 (100.0% in the age bracket) attending a public institution.
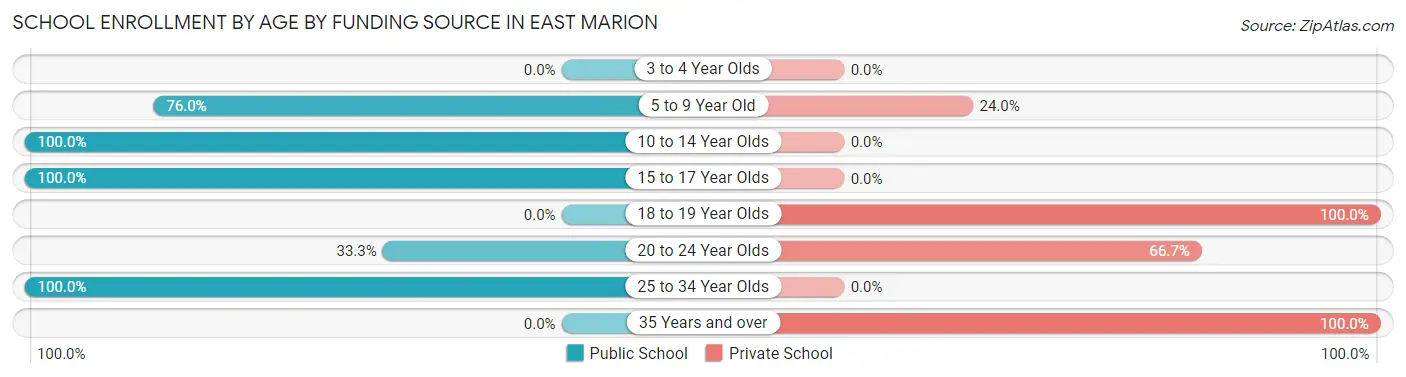
| Age Bracket | Public School | Private School |
| 3 to 4 Year Olds | 0 (0.0%) | 0 (0.0%) |
| 5 to 9 Year Old | 19 (76.0%) | 6 (24.0%) |
| 10 to 14 Year Olds | 40 (100.0%) | 0 (0.0%) |
| 15 to 17 Year Olds | 50 (100.0%) | 0 (0.0%) |
| 18 to 19 Year Olds | 0 (0.0%) | 9 (100.0%) |
| 20 to 24 Year Olds | 9 (33.3%) | 18 (66.7%) |
| 25 to 34 Year Olds | 20 (100.0%) | 0 (0.0%) |
| 35 Years and over | 0 (0.0%) | 18 (100.0%) |
| Total | 138 (73.0%) | 51 (27.0%) |
Educational Attainment by Field of Study in East Marion
Education (154 | 27.0%), business (98 | 17.2%), social sciences (65 | 11.4%), psychology (54 | 9.5%), and visual & performing arts (43 | 7.5%) are the most common fields of study among 571 individuals in East Marion who have obtained a bachelor's degree or higher.
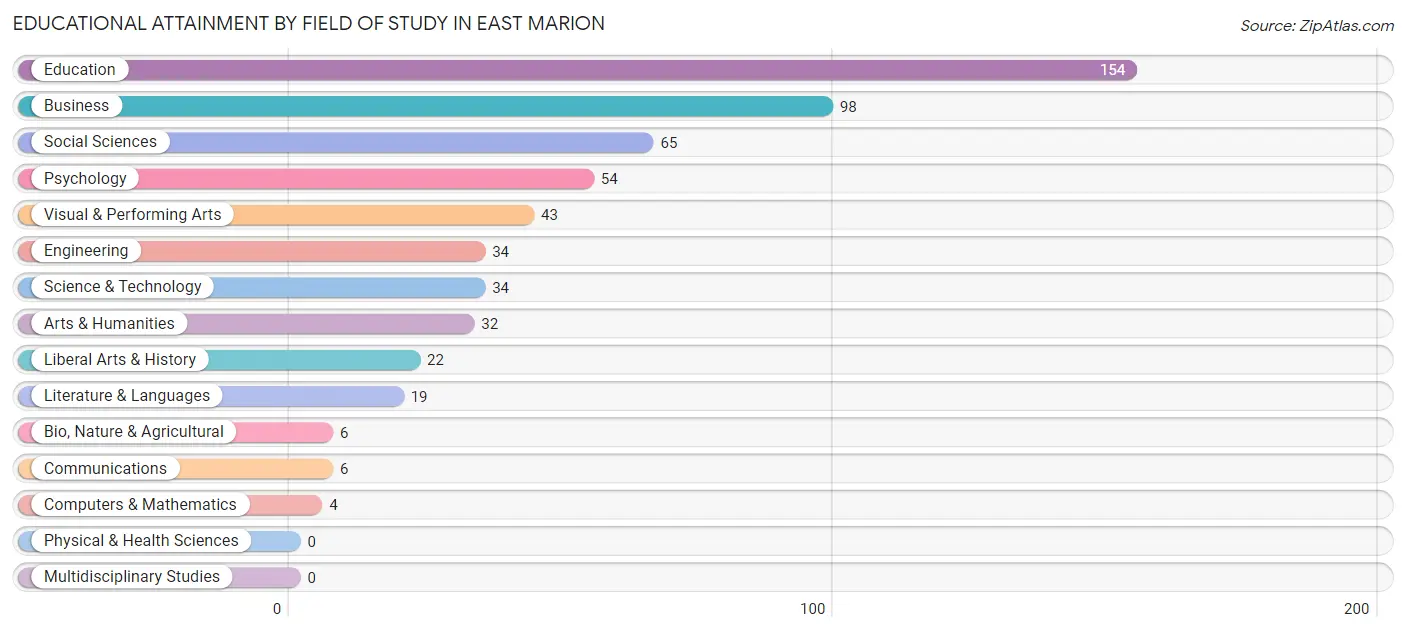
| Field of Study | # Graduates | % Graduates |
| Computers & Mathematics | 4 | 0.7% |
| Bio, Nature & Agricultural | 6 | 1.1% |
| Physical & Health Sciences | 0 | 0.0% |
| Psychology | 54 | 9.5% |
| Social Sciences | 65 | 11.4% |
| Engineering | 34 | 5.9% |
| Multidisciplinary Studies | 0 | 0.0% |
| Science & Technology | 34 | 5.9% |
| Business | 98 | 17.2% |
| Education | 154 | 27.0% |
| Literature & Languages | 19 | 3.3% |
| Liberal Arts & History | 22 | 3.8% |
| Visual & Performing Arts | 43 | 7.5% |
| Communications | 6 | 1.1% |
| Arts & Humanities | 32 | 5.6% |
| Total | 571 | 100.0% |
Transportation & Commute in East Marion
Vehicle Availability by Sex in East Marion
The most prevalent vehicle ownership categories in East Marion are males with 2 vehicles (137, accounting for 41.0%) and females with 2 vehicles (190, making up 38.4%).
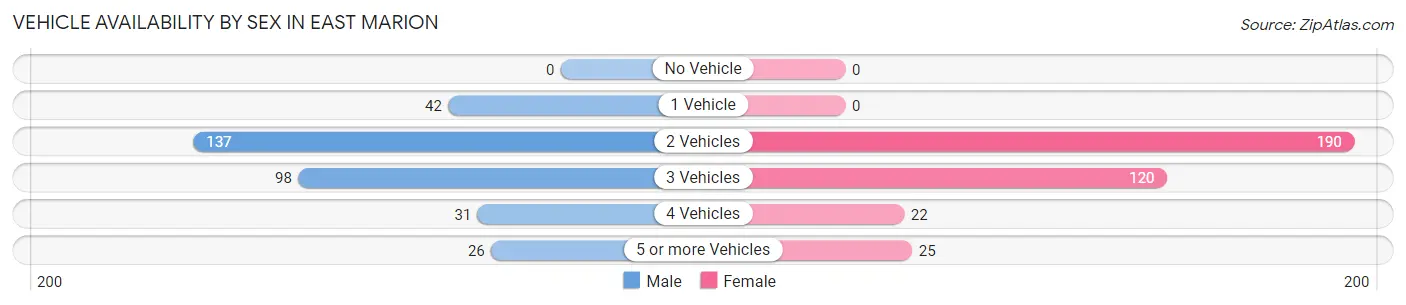
| Vehicles Available | Male | Female |
| No Vehicle | 0 (0.0%) | 0 (0.0%) |
| 1 Vehicle | 42 (12.6%) | 0 (0.0%) |
| 2 Vehicles | 137 (41.0%) | 190 (53.2%) |
| 3 Vehicles | 98 (29.3%) | 120 (33.6%) |
| 4 Vehicles | 31 (9.3%) | 22 (6.2%) |
| 5 or more Vehicles | 26 (7.8%) | 25 (7.0%) |
| Total | 334 (100.0%) | 357 (100.0%) |
Commute Time in East Marion
The most frequently occuring commute durations in East Marion are 5 to 9 minutes (157 commuters, 30.6%), 60 to 89 minutes (115 commuters, 22.4%), and 40 to 44 minutes (58 commuters, 11.3%).
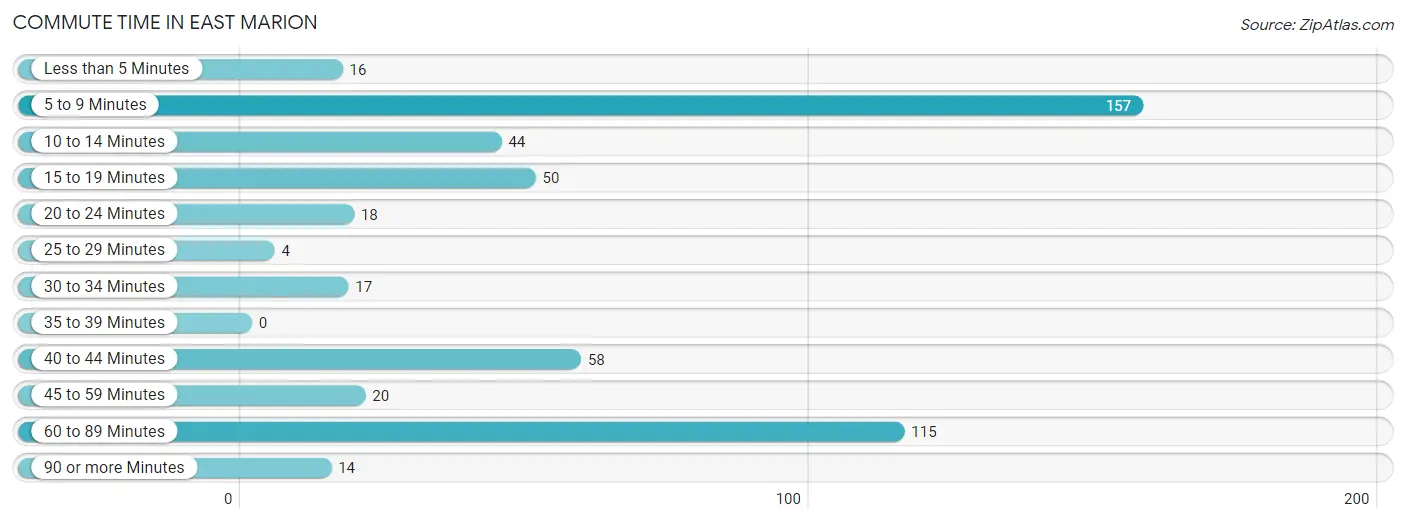
| Commute Time | # Commuters | % Commuters |
| Less than 5 Minutes | 16 | 3.1% |
| 5 to 9 Minutes | 157 | 30.6% |
| 10 to 14 Minutes | 44 | 8.6% |
| 15 to 19 Minutes | 50 | 9.8% |
| 20 to 24 Minutes | 18 | 3.5% |
| 25 to 29 Minutes | 4 | 0.8% |
| 30 to 34 Minutes | 17 | 3.3% |
| 35 to 39 Minutes | 0 | 0.0% |
| 40 to 44 Minutes | 58 | 11.3% |
| 45 to 59 Minutes | 20 | 3.9% |
| 60 to 89 Minutes | 115 | 22.4% |
| 90 or more Minutes | 14 | 2.7% |
Commute Time by Sex in East Marion
The most common commute times in East Marion are 5 to 9 minutes (76 commuters, 26.8%) for males and 5 to 9 minutes (81 commuters, 35.4%) for females.
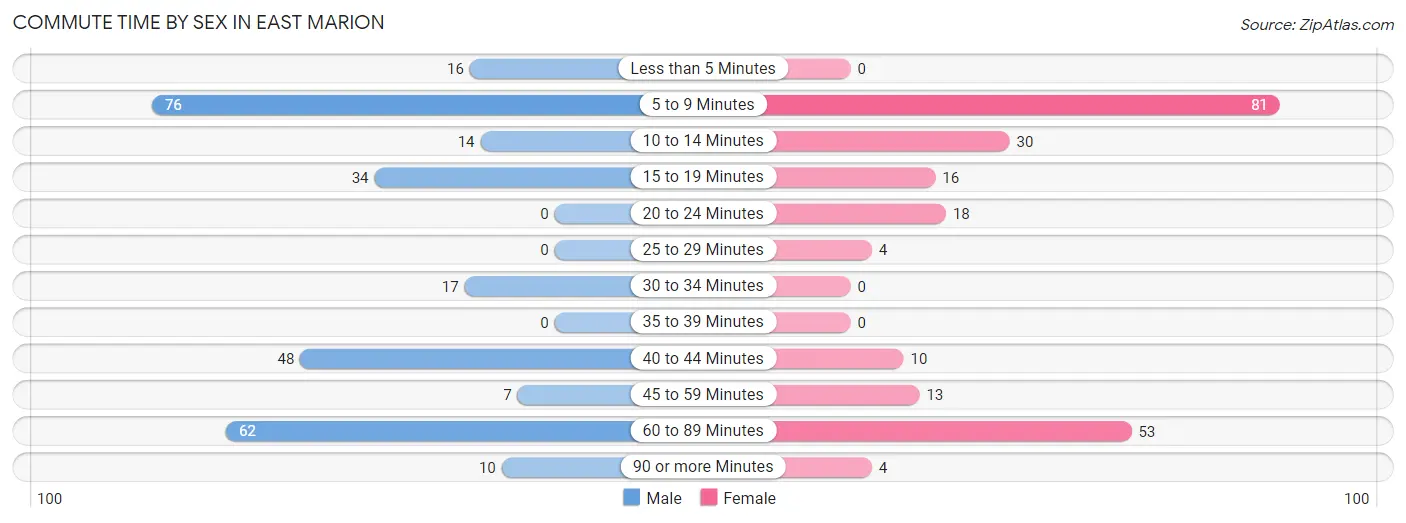
| Commute Time | Male | Female |
| Less than 5 Minutes | 16 (5.6%) | 0 (0.0%) |
| 5 to 9 Minutes | 76 (26.8%) | 81 (35.4%) |
| 10 to 14 Minutes | 14 (4.9%) | 30 (13.1%) |
| 15 to 19 Minutes | 34 (12.0%) | 16 (7.0%) |
| 20 to 24 Minutes | 0 (0.0%) | 18 (7.9%) |
| 25 to 29 Minutes | 0 (0.0%) | 4 (1.8%) |
| 30 to 34 Minutes | 17 (6.0%) | 0 (0.0%) |
| 35 to 39 Minutes | 0 (0.0%) | 0 (0.0%) |
| 40 to 44 Minutes | 48 (16.9%) | 10 (4.4%) |
| 45 to 59 Minutes | 7 (2.5%) | 13 (5.7%) |
| 60 to 89 Minutes | 62 (21.8%) | 53 (23.1%) |
| 90 or more Minutes | 10 (3.5%) | 4 (1.8%) |
Time of Departure to Work by Sex in East Marion
The most frequent times of departure to work in East Marion are 8:00 AM to 8:29 AM (65, 22.9%) for males and 8:00 AM to 8:29 AM (48, 21.0%) for females.
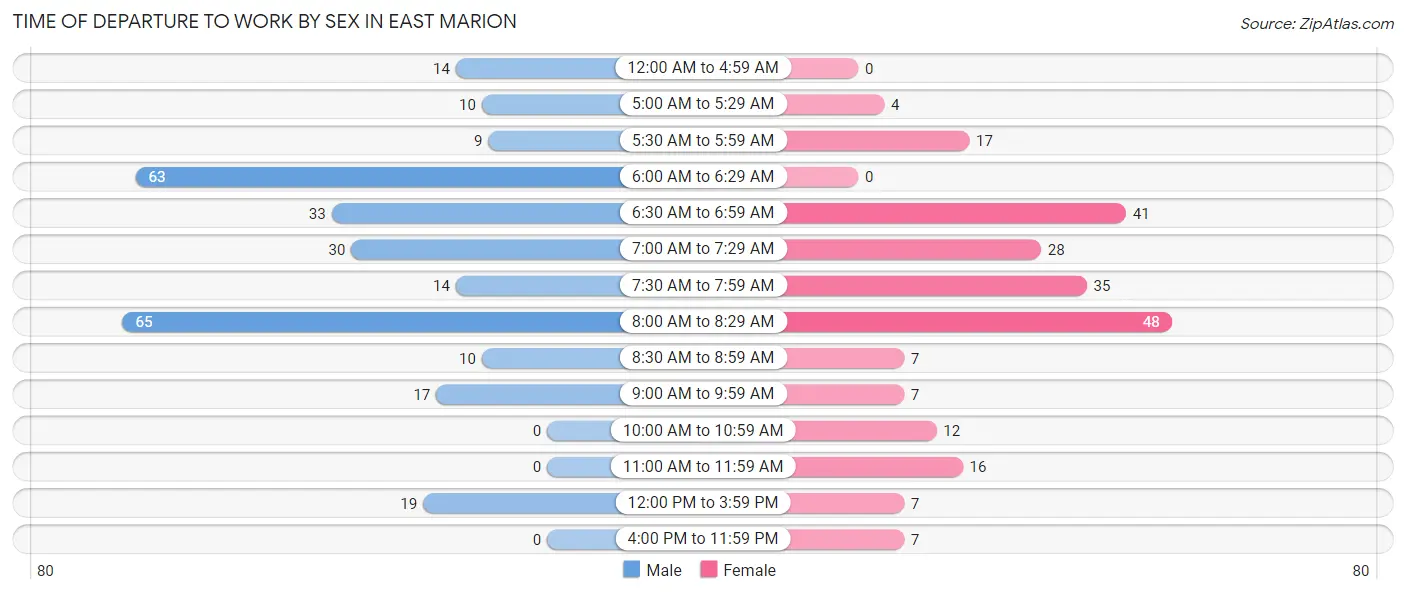
| Time of Departure | Male | Female |
| 12:00 AM to 4:59 AM | 14 (4.9%) | 0 (0.0%) |
| 5:00 AM to 5:29 AM | 10 (3.5%) | 4 (1.8%) |
| 5:30 AM to 5:59 AM | 9 (3.2%) | 17 (7.4%) |
| 6:00 AM to 6:29 AM | 63 (22.2%) | 0 (0.0%) |
| 6:30 AM to 6:59 AM | 33 (11.6%) | 41 (17.9%) |
| 7:00 AM to 7:29 AM | 30 (10.6%) | 28 (12.2%) |
| 7:30 AM to 7:59 AM | 14 (4.9%) | 35 (15.3%) |
| 8:00 AM to 8:29 AM | 65 (22.9%) | 48 (21.0%) |
| 8:30 AM to 8:59 AM | 10 (3.5%) | 7 (3.1%) |
| 9:00 AM to 9:59 AM | 17 (6.0%) | 7 (3.1%) |
| 10:00 AM to 10:59 AM | 0 (0.0%) | 12 (5.2%) |
| 11:00 AM to 11:59 AM | 0 (0.0%) | 16 (7.0%) |
| 12:00 PM to 3:59 PM | 19 (6.7%) | 7 (3.1%) |
| 4:00 PM to 11:59 PM | 0 (0.0%) | 7 (3.1%) |
| Total | 284 (100.0%) | 229 (100.0%) |
Housing Occupancy in East Marion
Occupancy by Ownership in East Marion
Of the total 722 dwellings in East Marion, owner-occupied units account for 649 (89.9%), while renter-occupied units make up 73 (10.1%).
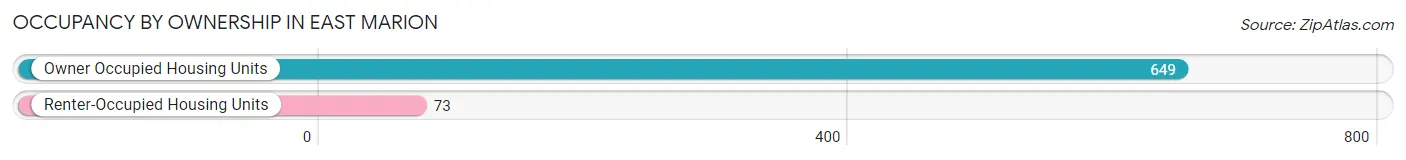
| Occupancy | # Housing Units | % Housing Units |
| Owner Occupied Housing Units | 649 | 89.9% |
| Renter-Occupied Housing Units | 73 | 10.1% |
| Total Occupied Housing Units | 722 | 100.0% |
Occupancy by Household Size in East Marion
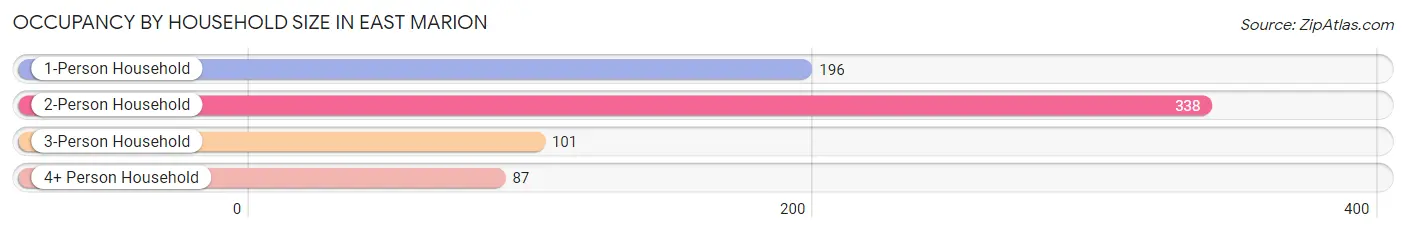
| Household Size | # Housing Units | % Housing Units |
| 1-Person Household | 196 | 27.2% |
| 2-Person Household | 338 | 46.8% |
| 3-Person Household | 101 | 14.0% |
| 4+ Person Household | 87 | 12.0% |
| Total Housing Units | 722 | 100.0% |
Occupancy by Ownership by Household Size in East Marion
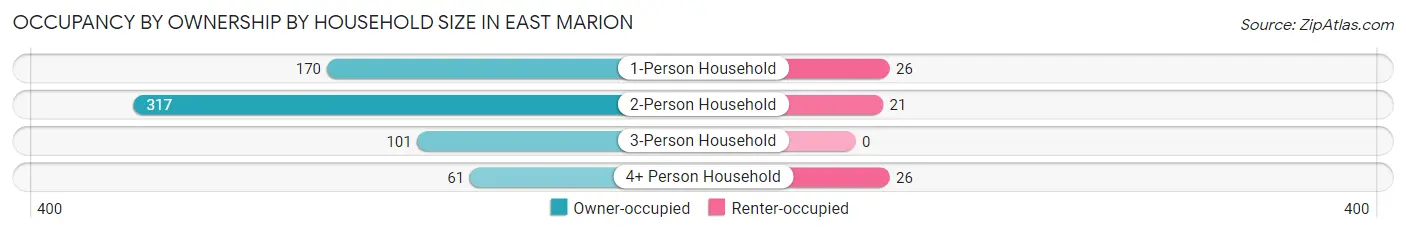
| Household Size | Owner-occupied | Renter-occupied |
| 1-Person Household | 170 (86.7%) | 26 (13.3%) |
| 2-Person Household | 317 (93.8%) | 21 (6.2%) |
| 3-Person Household | 101 (100.0%) | 0 (0.0%) |
| 4+ Person Household | 61 (70.1%) | 26 (29.9%) |
| Total Housing Units | 649 (89.9%) | 73 (10.1%) |
Occupancy by Educational Attainment in East Marion
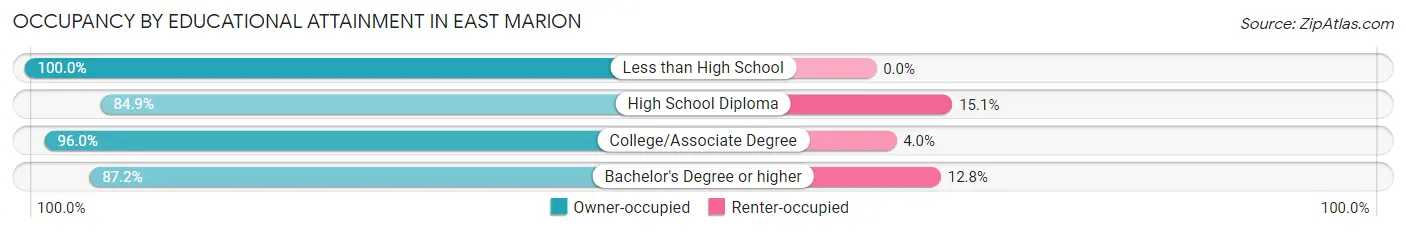
| Household Size | Owner-occupied | Renter-occupied |
| Less than High School | 19 (100.0%) | 0 (0.0%) |
| High School Diploma | 107 (84.9%) | 19 (15.1%) |
| College/Associate Degree | 217 (96.0%) | 9 (4.0%) |
| Bachelor's Degree or higher | 306 (87.2%) | 45 (12.8%) |
Occupancy by Age of Householder in East Marion
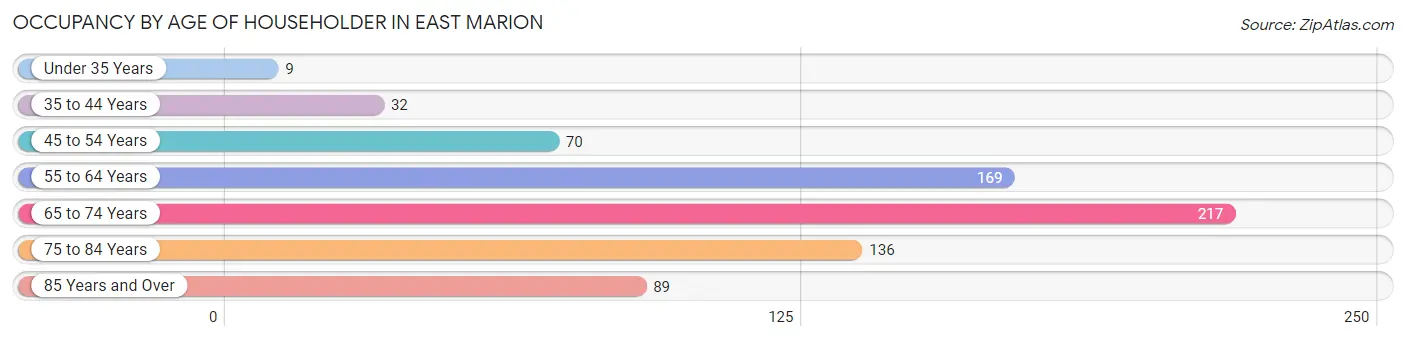
| Age Bracket | # Households | % Households |
| Under 35 Years | 9 | 1.3% |
| 35 to 44 Years | 32 | 4.4% |
| 45 to 54 Years | 70 | 9.7% |
| 55 to 64 Years | 169 | 23.4% |
| 65 to 74 Years | 217 | 30.1% |
| 75 to 84 Years | 136 | 18.8% |
| 85 Years and Over | 89 | 12.3% |
| Total | 722 | 100.0% |
Housing Finances in East Marion
Median Income by Occupancy in East Marion
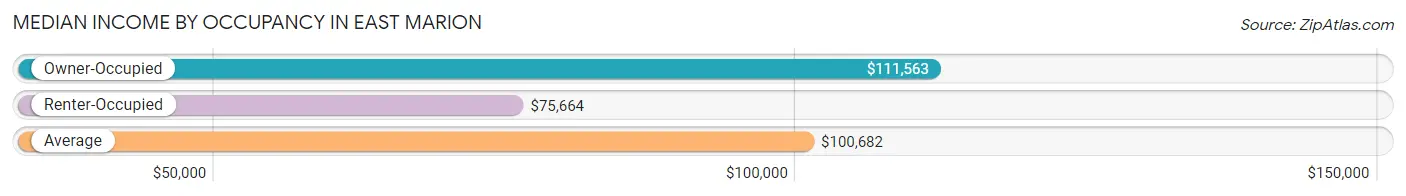
| Occupancy Type | # Households | Median Income |
| Owner-Occupied | 649 (89.9%) | $111,563 |
| Renter-Occupied | 73 (10.1%) | $75,664 |
| Average | 722 (100.0%) | $100,682 |
Occupancy by Householder Income Bracket in East Marion
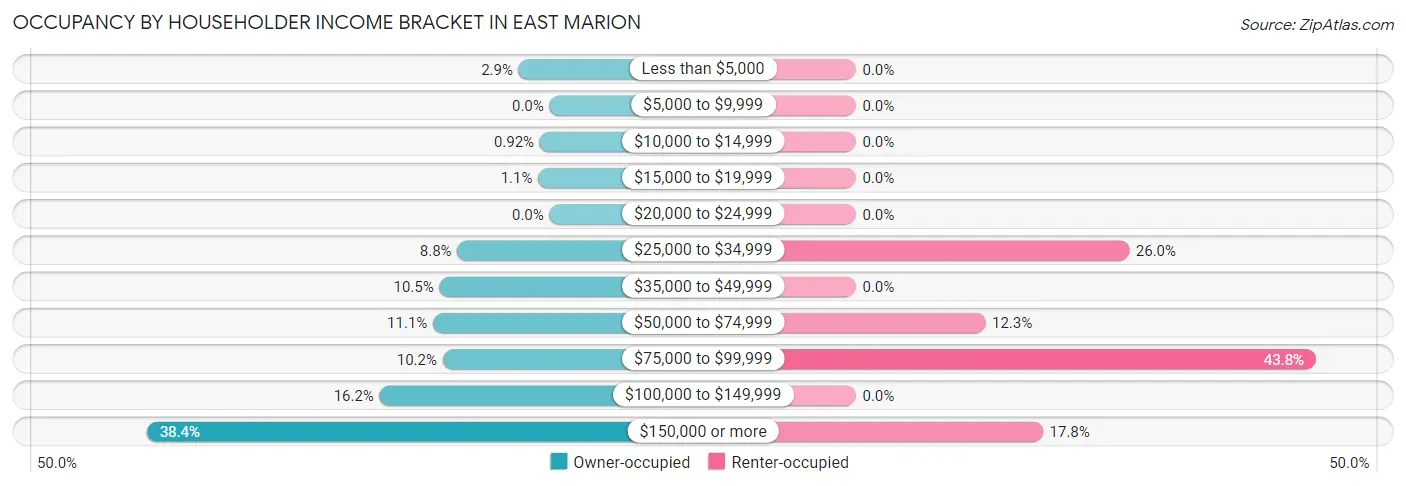
| Income Bracket | Owner-occupied | Renter-occupied |
| Less than $5,000 | 19 (2.9%) | 0 (0.0%) |
| $5,000 to $9,999 | 0 (0.0%) | 0 (0.0%) |
| $10,000 to $14,999 | 6 (0.9%) | 0 (0.0%) |
| $15,000 to $19,999 | 7 (1.1%) | 0 (0.0%) |
| $20,000 to $24,999 | 0 (0.0%) | 0 (0.0%) |
| $25,000 to $34,999 | 57 (8.8%) | 19 (26.0%) |
| $35,000 to $49,999 | 68 (10.5%) | 0 (0.0%) |
| $50,000 to $74,999 | 72 (11.1%) | 9 (12.3%) |
| $75,000 to $99,999 | 66 (10.2%) | 32 (43.8%) |
| $100,000 to $149,999 | 105 (16.2%) | 0 (0.0%) |
| $150,000 or more | 249 (38.4%) | 13 (17.8%) |
| Total | 649 (100.0%) | 73 (100.0%) |
Monthly Housing Cost Tiers in East Marion
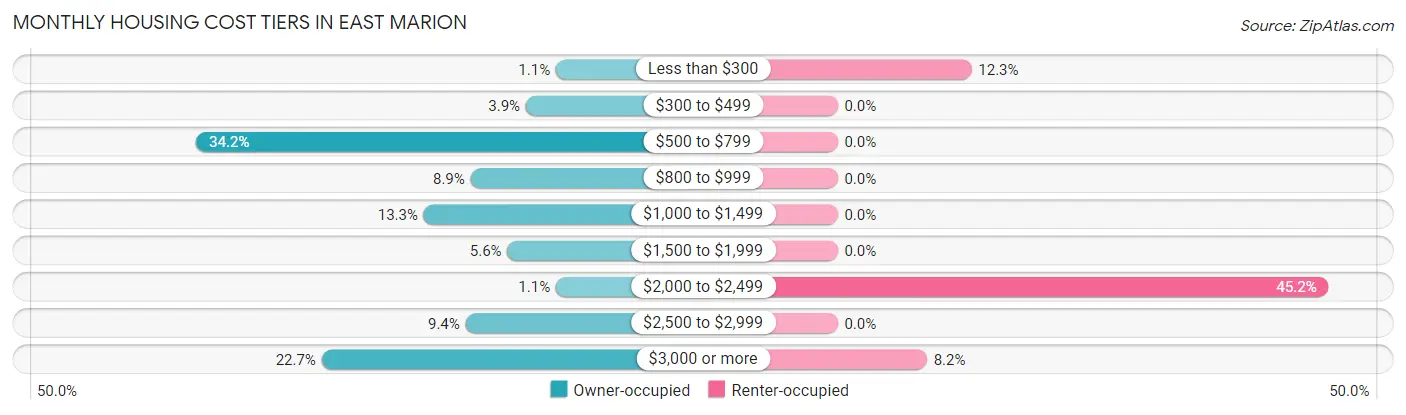
| Monthly Cost | Owner-occupied | Renter-occupied |
| Less than $300 | 7 (1.1%) | 9 (12.3%) |
| $300 to $499 | 25 (3.8%) | 0 (0.0%) |
| $500 to $799 | 222 (34.2%) | 0 (0.0%) |
| $800 to $999 | 58 (8.9%) | 0 (0.0%) |
| $1,000 to $1,499 | 86 (13.3%) | 0 (0.0%) |
| $1,500 to $1,999 | 36 (5.6%) | 0 (0.0%) |
| $2,000 to $2,499 | 7 (1.1%) | 33 (45.2%) |
| $2,500 to $2,999 | 61 (9.4%) | 0 (0.0%) |
| $3,000 or more | 147 (22.7%) | 6 (8.2%) |
| Total | 649 (100.0%) | 73 (100.0%) |
Physical Housing Characteristics in East Marion
Housing Structures in East Marion
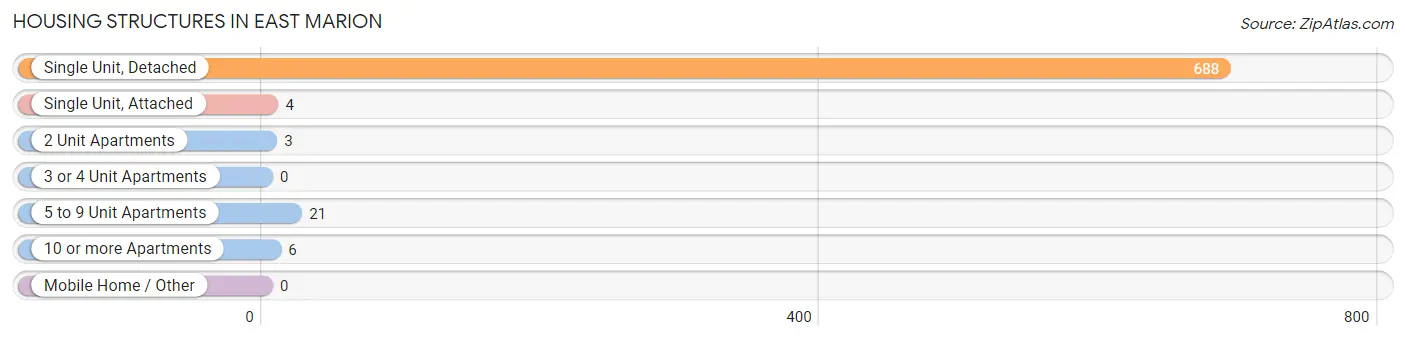
| Structure Type | # Housing Units | % Housing Units |
| Single Unit, Detached | 688 | 95.3% |
| Single Unit, Attached | 4 | 0.5% |
| 2 Unit Apartments | 3 | 0.4% |
| 3 or 4 Unit Apartments | 0 | 0.0% |
| 5 to 9 Unit Apartments | 21 | 2.9% |
| 10 or more Apartments | 6 | 0.8% |
| Mobile Home / Other | 0 | 0.0% |
| Total | 722 | 100.0% |
Housing Structures by Occupancy in East Marion
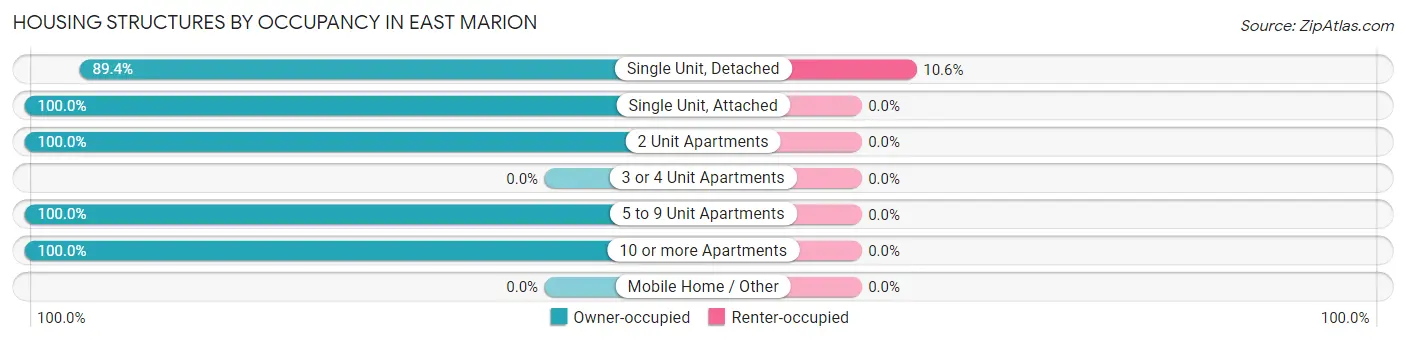
| Structure Type | Owner-occupied | Renter-occupied |
| Single Unit, Detached | 615 (89.4%) | 73 (10.6%) |
| Single Unit, Attached | 4 (100.0%) | 0 (0.0%) |
| 2 Unit Apartments | 3 (100.0%) | 0 (0.0%) |
| 3 or 4 Unit Apartments | 0 (0.0%) | 0 (0.0%) |
| 5 to 9 Unit Apartments | 21 (100.0%) | 0 (0.0%) |
| 10 or more Apartments | 6 (100.0%) | 0 (0.0%) |
| Mobile Home / Other | 0 (0.0%) | 0 (0.0%) |
| Total | 649 (89.9%) | 73 (10.1%) |
Housing Structures by Number of Rooms in East Marion
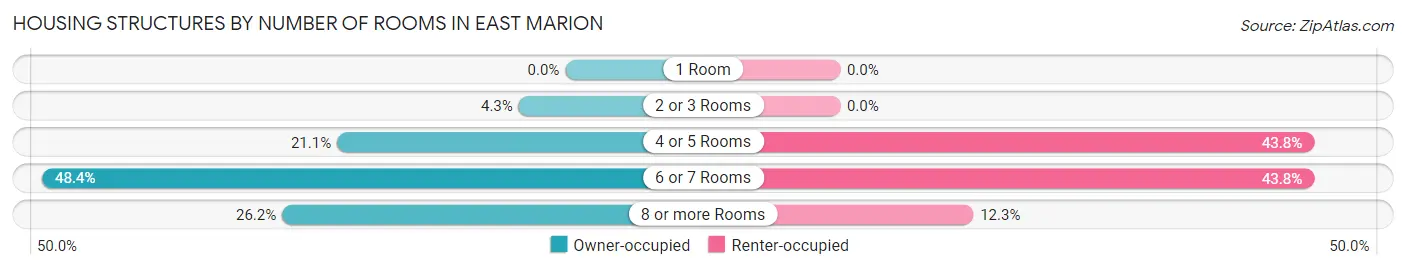
| Number of Rooms | Owner-occupied | Renter-occupied |
| 1 Room | 0 (0.0%) | 0 (0.0%) |
| 2 or 3 Rooms | 28 (4.3%) | 0 (0.0%) |
| 4 or 5 Rooms | 137 (21.1%) | 32 (43.8%) |
| 6 or 7 Rooms | 314 (48.4%) | 32 (43.8%) |
| 8 or more Rooms | 170 (26.2%) | 9 (12.3%) |
| Total | 649 (100.0%) | 73 (100.0%) |
Housing Structure by Heating Type in East Marion
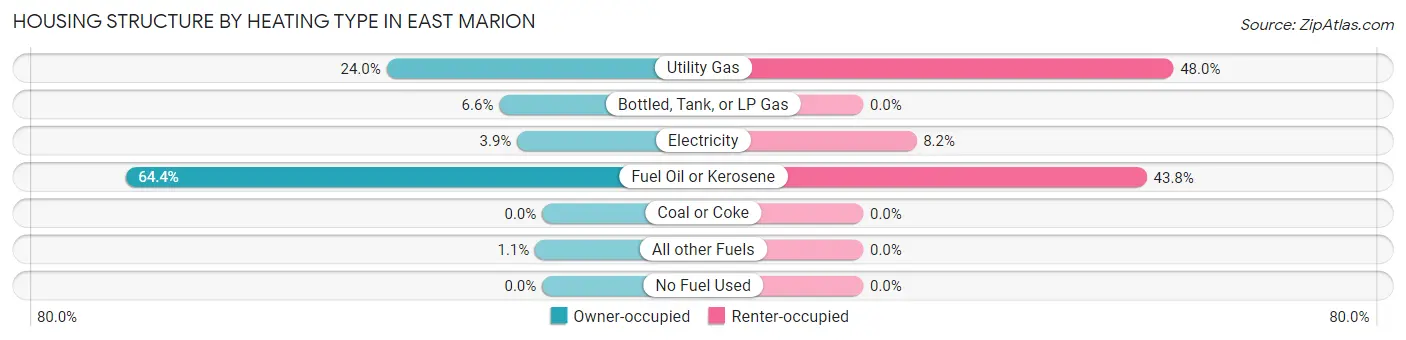
| Heating Type | Owner-occupied | Renter-occupied |
| Utility Gas | 156 (24.0%) | 35 (47.9%) |
| Bottled, Tank, or LP Gas | 43 (6.6%) | 0 (0.0%) |
| Electricity | 25 (3.8%) | 6 (8.2%) |
| Fuel Oil or Kerosene | 418 (64.4%) | 32 (43.8%) |
| Coal or Coke | 0 (0.0%) | 0 (0.0%) |
| All other Fuels | 7 (1.1%) | 0 (0.0%) |
| No Fuel Used | 0 (0.0%) | 0 (0.0%) |
| Total | 649 (100.0%) | 73 (100.0%) |
Household Vehicle Usage in East Marion
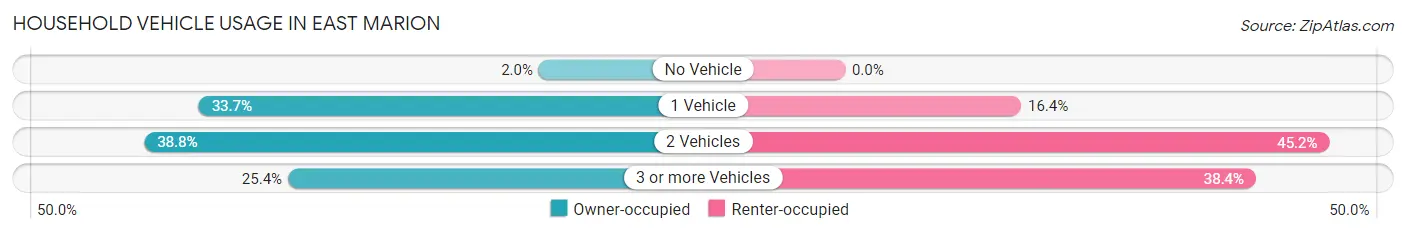
| Vehicles per Household | Owner-occupied | Renter-occupied |
| No Vehicle | 13 (2.0%) | 0 (0.0%) |
| 1 Vehicle | 219 (33.7%) | 12 (16.4%) |
| 2 Vehicles | 252 (38.8%) | 33 (45.2%) |
| 3 or more Vehicles | 165 (25.4%) | 28 (38.4%) |
| Total | 649 (100.0%) | 73 (100.0%) |
Real Estate & Mortgages in East Marion
Real Estate and Mortgage Overview in East Marion
| Characteristic | Without Mortgage | With Mortgage |
| Housing Units | 425 | 224 |
| Median Property Value | $727,400 | $889,200 |
| Median Household Income | $87,708 | $174 |
| Monthly Housing Costs | $764 | $147 |
| Real Estate Taxes | $4,413 | $0 |
Property Value by Mortgage Status in East Marion
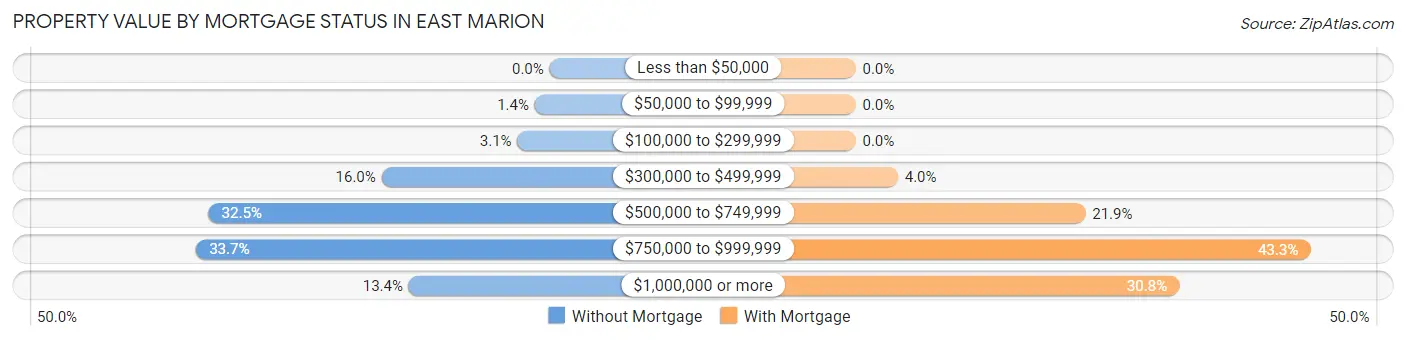
| Property Value | Without Mortgage | With Mortgage |
| Less than $50,000 | 0 (0.0%) | 0 (0.0%) |
| $50,000 to $99,999 | 6 (1.4%) | 0 (0.0%) |
| $100,000 to $299,999 | 13 (3.1%) | 0 (0.0%) |
| $300,000 to $499,999 | 68 (16.0%) | 9 (4.0%) |
| $500,000 to $749,999 | 138 (32.5%) | 49 (21.9%) |
| $750,000 to $999,999 | 143 (33.7%) | 97 (43.3%) |
| $1,000,000 or more | 57 (13.4%) | 69 (30.8%) |
| Total | 425 (100.0%) | 224 (100.0%) |
Household Income by Mortgage Status in East Marion
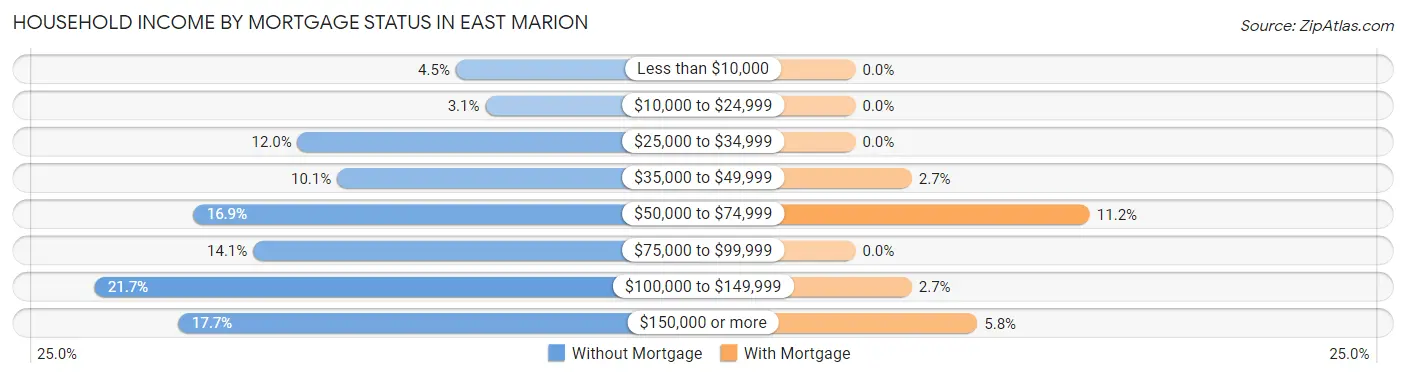
| Household Income | Without Mortgage | With Mortgage |
| Less than $10,000 | 19 (4.5%) | 0 (0.0%) |
| $10,000 to $24,999 | 13 (3.1%) | 0 (0.0%) |
| $25,000 to $34,999 | 51 (12.0%) | 0 (0.0%) |
| $35,000 to $49,999 | 43 (10.1%) | 6 (2.7%) |
| $50,000 to $74,999 | 72 (16.9%) | 25 (11.2%) |
| $75,000 to $99,999 | 60 (14.1%) | 0 (0.0%) |
| $100,000 to $149,999 | 92 (21.6%) | 6 (2.7%) |
| $150,000 or more | 75 (17.6%) | 13 (5.8%) |
| Total | 425 (100.0%) | 224 (100.0%) |
Property Value to Household Income Ratio in East Marion
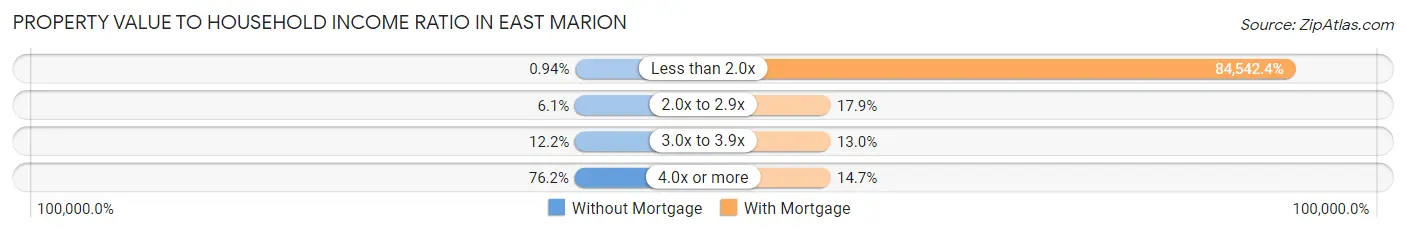
| Value-to-Income Ratio | Without Mortgage | With Mortgage |
| Less than 2.0x | 4 (0.9%) | 189,375 (84,542.4%) |
| 2.0x to 2.9x | 26 (6.1%) | 40 (17.9%) |
| 3.0x to 3.9x | 52 (12.2%) | 29 (13.0%) |
| 4.0x or more | 324 (76.2%) | 33 (14.7%) |
| Total | 425 (100.0%) | 224 (100.0%) |
Real Estate Taxes by Mortgage Status in East Marion
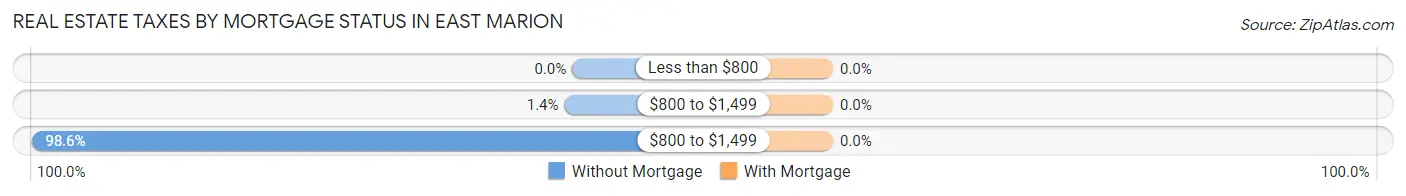
| Property Taxes | Without Mortgage | With Mortgage |
| Less than $800 | 0 (0.0%) | 0 (0.0%) |
| $800 to $1,499 | 6 (1.4%) | 0 (0.0%) |
| $800 to $1,499 | 419 (98.6%) | 0 (0.0%) |
| Total | 425 (100.0%) | 224 (100.0%) |
Health & Disability in East Marion
Health Insurance Coverage by Age in East Marion
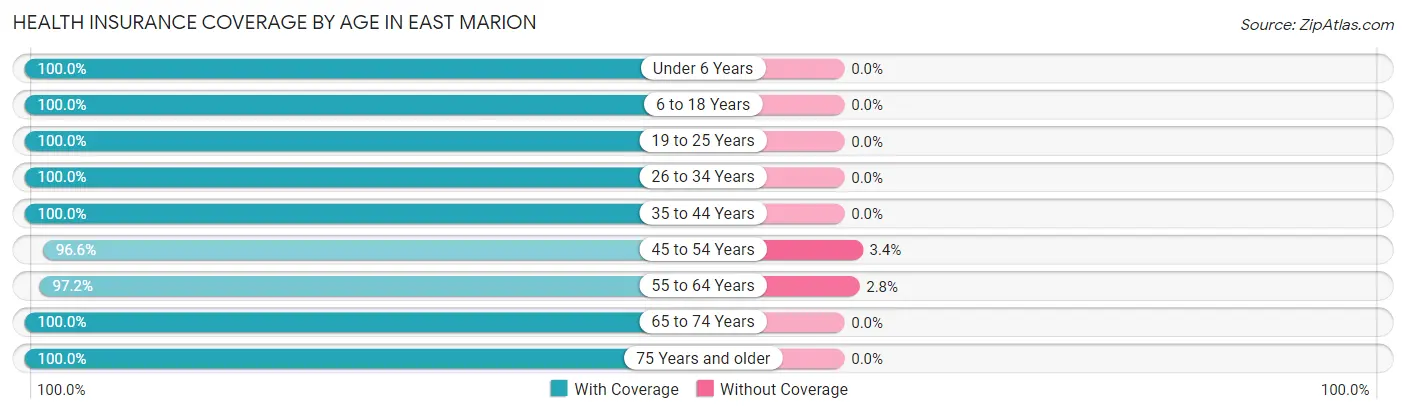
| Age Bracket | With Coverage | Without Coverage |
| Under 6 Years | 43 (100.0%) | 0 (0.0%) |
| 6 to 18 Years | 118 (100.0%) | 0 (0.0%) |
| 19 to 25 Years | 120 (100.0%) | 0 (0.0%) |
| 26 to 34 Years | 84 (100.0%) | 0 (0.0%) |
| 35 to 44 Years | 65 (100.0%) | 0 (0.0%) |
| 45 to 54 Years | 199 (96.6%) | 7 (3.4%) |
| 55 to 64 Years | 208 (97.2%) | 6 (2.8%) |
| 65 to 74 Years | 367 (100.0%) | 0 (0.0%) |
| 75 Years and older | 347 (100.0%) | 0 (0.0%) |
| Total | 1,551 (99.2%) | 13 (0.8%) |
Health Insurance Coverage by Citizenship Status in East Marion
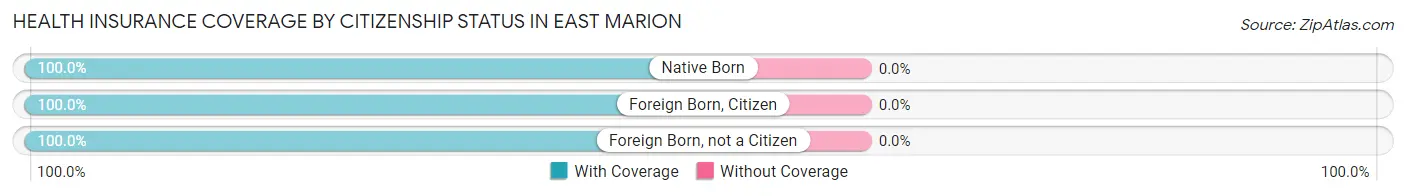
| Citizenship Status | With Coverage | Without Coverage |
| Native Born | 43 (100.0%) | 0 (0.0%) |
| Foreign Born, Citizen | 118 (100.0%) | 0 (0.0%) |
| Foreign Born, not a Citizen | 120 (100.0%) | 0 (0.0%) |
Health Insurance Coverage by Household Income in East Marion
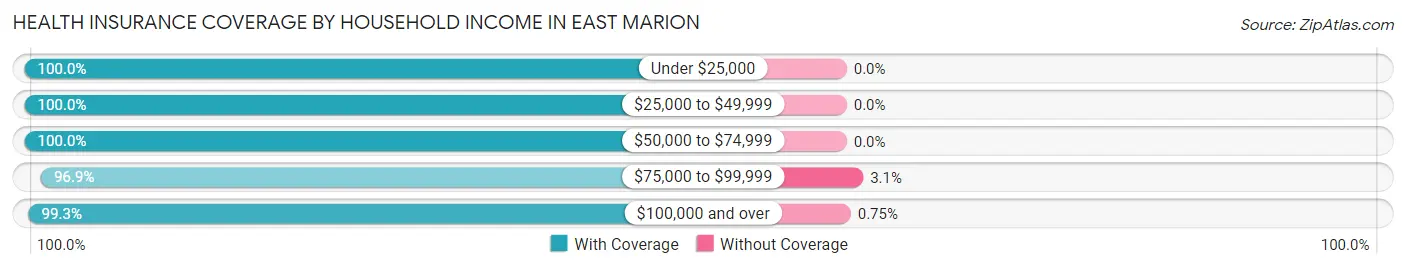
| Household Income | With Coverage | Without Coverage |
| Under $25,000 | 32 (100.0%) | 0 (0.0%) |
| $25,000 to $49,999 | 247 (100.0%) | 0 (0.0%) |
| $50,000 to $74,999 | 151 (100.0%) | 0 (0.0%) |
| $75,000 to $99,999 | 189 (96.9%) | 6 (3.1%) |
| $100,000 and over | 932 (99.3%) | 7 (0.7%) |
Public vs Private Health Insurance Coverage by Age in East Marion
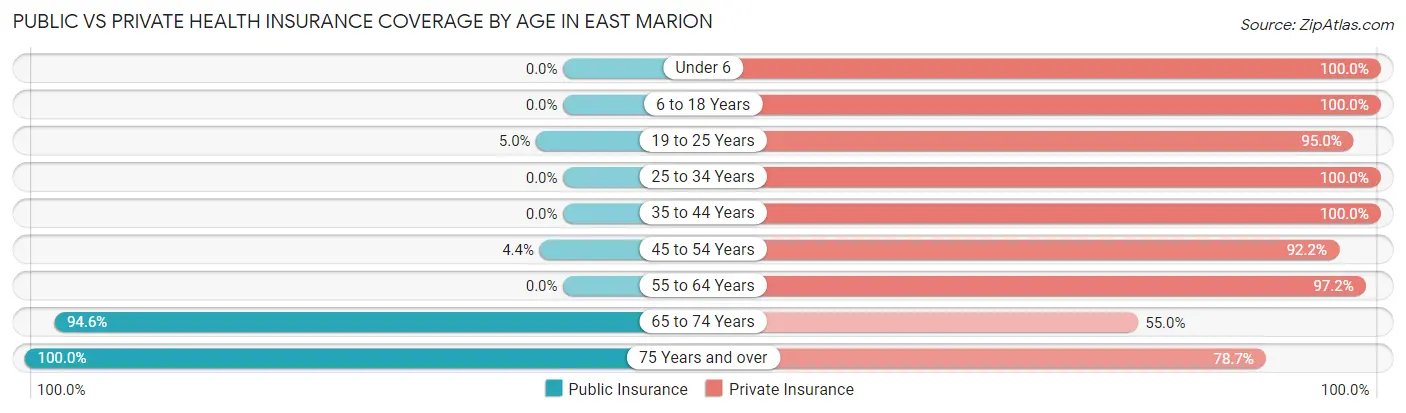
| Age Bracket | Public Insurance | Private Insurance |
| Under 6 | 0 (0.0%) | 43 (100.0%) |
| 6 to 18 Years | 0 (0.0%) | 118 (100.0%) |
| 19 to 25 Years | 6 (5.0%) | 114 (95.0%) |
| 25 to 34 Years | 0 (0.0%) | 84 (100.0%) |
| 35 to 44 Years | 0 (0.0%) | 65 (100.0%) |
| 45 to 54 Years | 9 (4.4%) | 190 (92.2%) |
| 55 to 64 Years | 0 (0.0%) | 208 (97.2%) |
| 65 to 74 Years | 347 (94.6%) | 202 (55.0%) |
| 75 Years and over | 347 (100.0%) | 273 (78.7%) |
| Total | 709 (45.3%) | 1,297 (82.9%) |
Disability Status by Sex by Age in East Marion
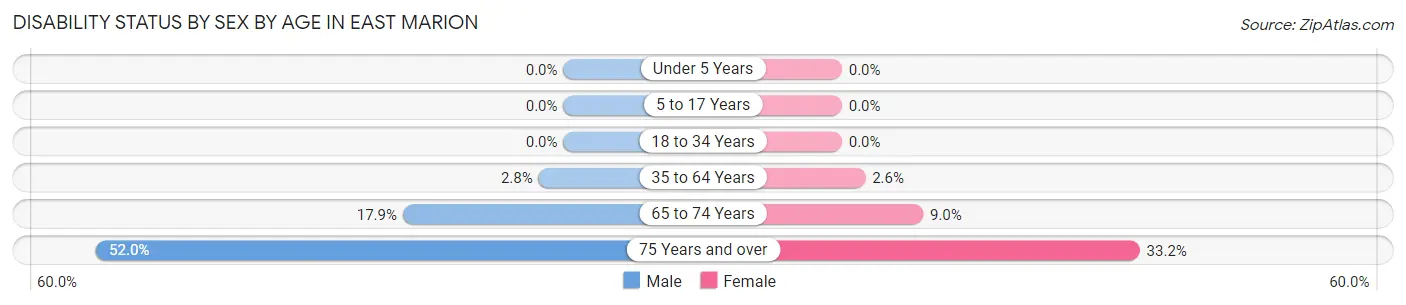
| Age Bracket | Male | Female |
| Under 5 Years | 0 (0.0%) | 0 (0.0%) |
| 5 to 17 Years | 0 (0.0%) | 0 (0.0%) |
| 18 to 34 Years | 0 (0.0%) | 0 (0.0%) |
| 35 to 64 Years | 6 (2.8%) | 7 (2.6%) |
| 65 to 74 Years | 32 (17.9%) | 17 (9.0%) |
| 75 Years and over | 77 (52.0%) | 66 (33.2%) |
Disability Class by Sex by Age in East Marion
Disability Class: Hearing Difficulty
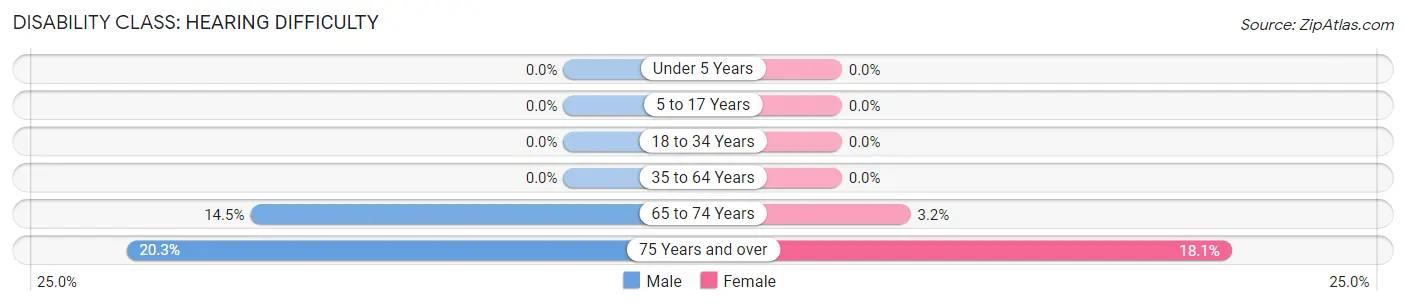
| Age Bracket | Male | Female |
| Under 5 Years | 0 (0.0%) | 0 (0.0%) |
| 5 to 17 Years | 0 (0.0%) | 0 (0.0%) |
| 18 to 34 Years | 0 (0.0%) | 0 (0.0%) |
| 35 to 64 Years | 0 (0.0%) | 0 (0.0%) |
| 65 to 74 Years | 26 (14.5%) | 6 (3.2%) |
| 75 Years and over | 30 (20.3%) | 36 (18.1%) |
Disability Class: Vision Difficulty
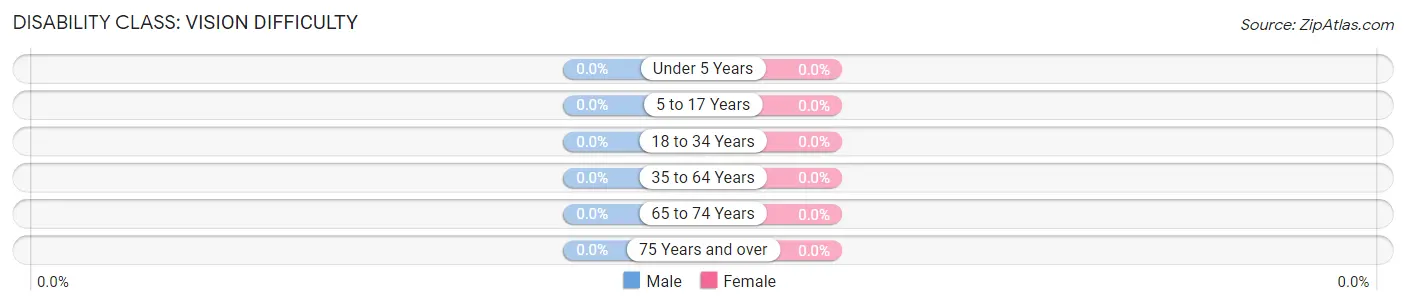
| Age Bracket | Male | Female |
| Under 5 Years | 0 (0.0%) | 0 (0.0%) |
| 5 to 17 Years | 0 (0.0%) | 0 (0.0%) |
| 18 to 34 Years | 0 (0.0%) | 0 (0.0%) |
| 35 to 64 Years | 0 (0.0%) | 0 (0.0%) |
| 65 to 74 Years | 0 (0.0%) | 0 (0.0%) |
| 75 Years and over | 0 (0.0%) | 0 (0.0%) |
Disability Class: Cognitive Difficulty
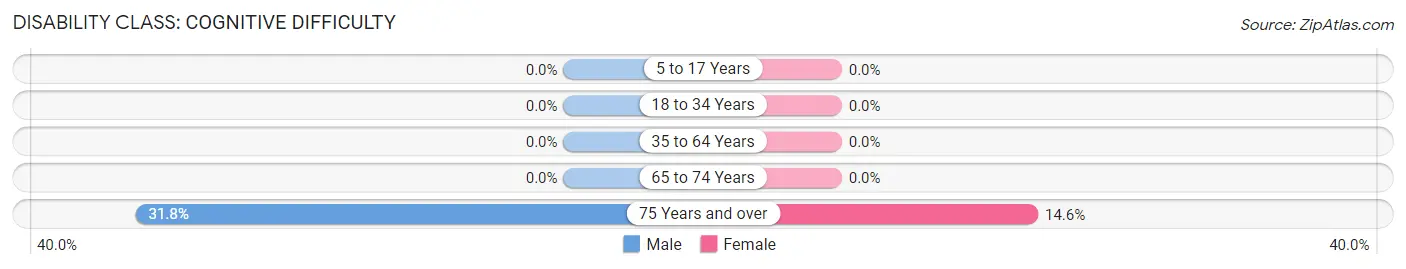
| Age Bracket | Male | Female |
| 5 to 17 Years | 0 (0.0%) | 0 (0.0%) |
| 18 to 34 Years | 0 (0.0%) | 0 (0.0%) |
| 35 to 64 Years | 0 (0.0%) | 0 (0.0%) |
| 65 to 74 Years | 0 (0.0%) | 0 (0.0%) |
| 75 Years and over | 47 (31.8%) | 29 (14.6%) |
Disability Class: Ambulatory Difficulty
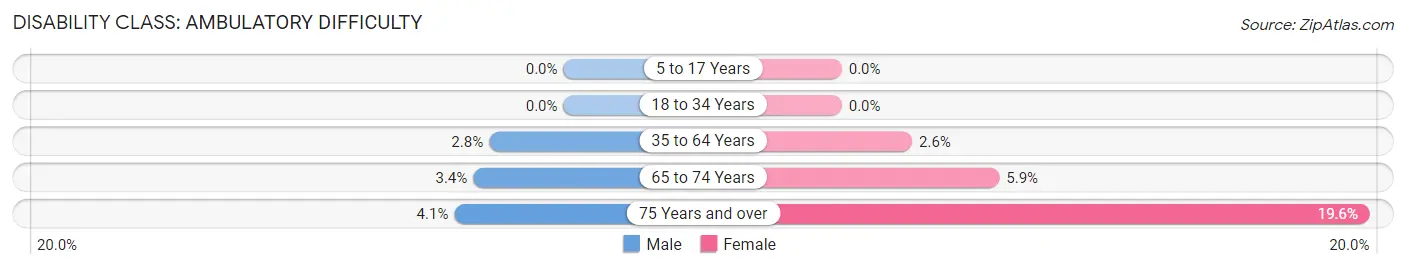
| Age Bracket | Male | Female |
| 5 to 17 Years | 0 (0.0%) | 0 (0.0%) |
| 18 to 34 Years | 0 (0.0%) | 0 (0.0%) |
| 35 to 64 Years | 6 (2.8%) | 7 (2.6%) |
| 65 to 74 Years | 6 (3.4%) | 11 (5.9%) |
| 75 Years and over | 6 (4.1%) | 39 (19.6%) |
Disability Class: Self-Care Difficulty
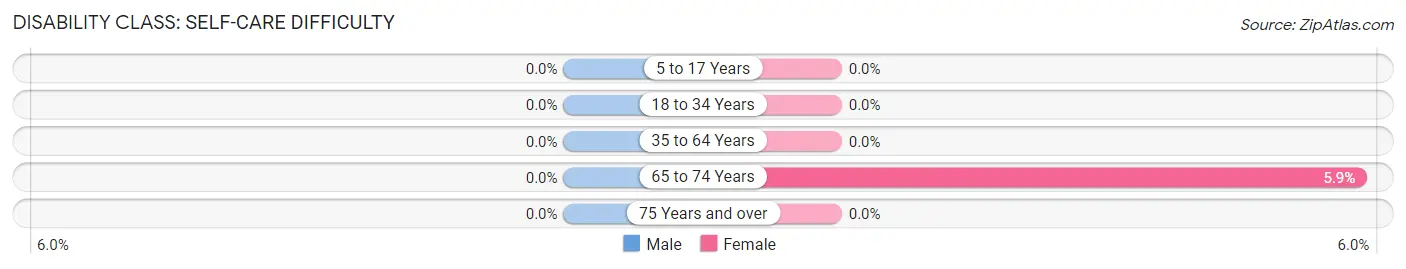
| Age Bracket | Male | Female |
| 5 to 17 Years | 0 (0.0%) | 0 (0.0%) |
| 18 to 34 Years | 0 (0.0%) | 0 (0.0%) |
| 35 to 64 Years | 0 (0.0%) | 0 (0.0%) |
| 65 to 74 Years | 0 (0.0%) | 11 (5.9%) |
| 75 Years and over | 0 (0.0%) | 0 (0.0%) |
Technology Access in East Marion
Computing Device Access in East Marion
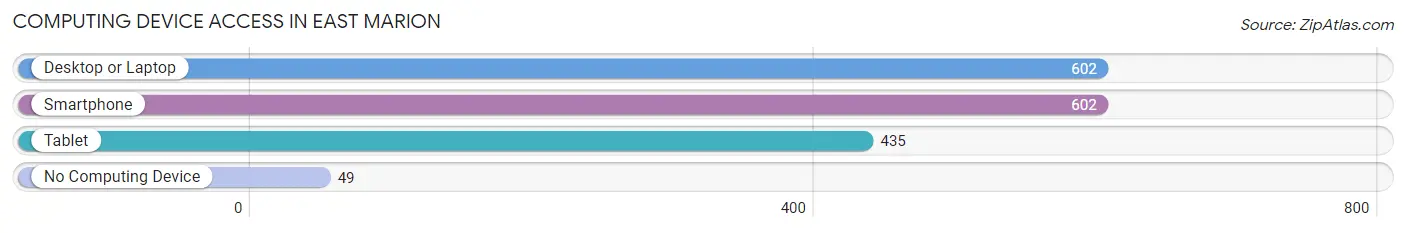
| Device Type | # Households | % Households |
| Desktop or Laptop | 602 | 83.4% |
| Smartphone | 602 | 83.4% |
| Tablet | 435 | 60.3% |
| No Computing Device | 49 | 6.8% |
| Total | 722 | 100.0% |
Internet Access in East Marion
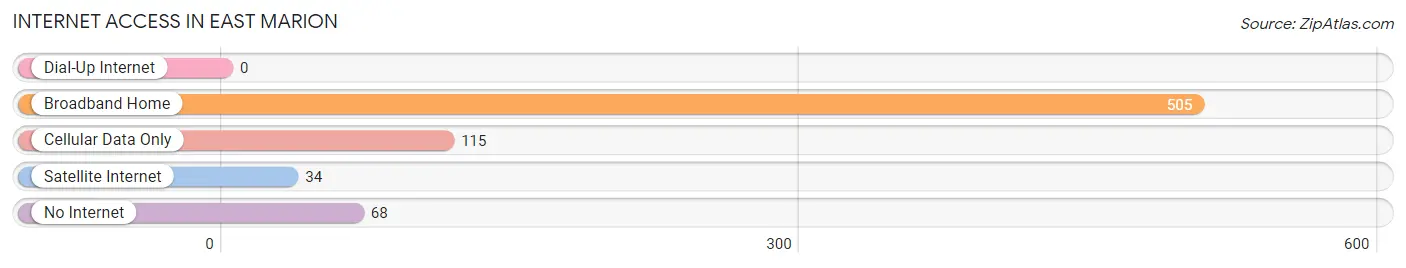
| Internet Type | # Households | % Households |
| Dial-Up Internet | 0 | 0.0% |
| Broadband Home | 505 | 69.9% |
| Cellular Data Only | 115 | 15.9% |
| Satellite Internet | 34 | 4.7% |
| No Internet | 68 | 9.4% |
| Total | 722 | 100.0% |
East Marion Summary
History
East Marion is a hamlet located in the Town of Southold in Suffolk County, New York. It is located on the North Fork of Long Island, approximately 90 miles east of New York City. The hamlet was originally inhabited by the Shinnecock Indians, who were the first to settle in the area. The first European settlers arrived in the area in the late 1600s, and the hamlet was officially established in 1730.
The hamlet was originally known as “Orient”, and was renamed “East Marion” in 1845 in honor of Revolutionary War hero General Francis Marion. The hamlet was a popular summer destination for wealthy New Yorkers in the late 19th and early 20th centuries. The area was known for its beautiful beaches, and many of the original summer homes still stand today.
The hamlet was also home to a thriving fishing industry, which was centered around Orient Harbor. The harbor was a major port for the oyster industry, and was also home to a number of commercial fishing vessels. The harbor was also a popular destination for recreational boaters, and was home to a number of marinas.
The hamlet was also home to a number of farms, which produced a variety of crops, including potatoes, corn, and hay. The area was also home to a number of wineries, which produced a variety of wines.
Geography
East Marion is located on the North Fork of Long Island, approximately 90 miles east of New York City. The hamlet is bordered by the hamlets of Orient to the west, Greenport to the south, and Cutchogue to the east. The hamlet is located on the Peconic Bay, and is home to a number of beaches, including Orient Beach State Park. The hamlet is also home to Orient Harbor, which is a popular destination for recreational boaters.
The hamlet is located in a rural area, and is home to a number of farms, wineries, and other agricultural businesses. The area is also home to a number of historic sites, including the Orient Historic District, which is listed on the National Register of Historic Places.
Economy
The economy of East Marion is largely based on tourism and agriculture. The hamlet is home to a number of wineries, which produce a variety of wines. The area is also home to a number of farms, which produce a variety of crops, including potatoes, corn, and hay. The hamlet is also home to a number of marinas, which are popular destinations for recreational boaters.
The hamlet is also home to a number of businesses, including restaurants, shops, and other retail establishments. The hamlet is also home to a number of bed and breakfasts, which cater to tourists visiting the area.
Demographics
As of the 2010 census, the population of East Marion was 1,845. The population is largely white (94.3%), with a small percentage of African Americans (2.2%) and Hispanics (2.2%). The median household income is $68,750, and the median home value is $541,000. The hamlet is largely rural, with a population density of just over 100 people per square mile.
Common Questions
What is Per Capita Income in East Marion?
Per Capita income in East Marion is $74,521.
What is the Median Family Income in East Marion?
Median Family Income in East Marion is $135,972.
What is the Median Household income in East Marion?
Median Household Income in East Marion is $100,682.
What is Income or Wage Gap in East Marion?
Income or Wage Gap in East Marion is 24.2%.
Women in East Marion earn 75.8 cents for every dollar earned by a man.
What is Inequality or Gini Index in East Marion?
Inequality or Gini Index in East Marion is 0.49.
What is the Total Population of East Marion?
Total Population of East Marion is 1,564.
What is the Total Male Population of East Marion?
Total Male Population of East Marion is 687.
What is the Total Female Population of East Marion?
Total Female Population of East Marion is 877.
What is the Ratio of Males per 100 Females in East Marion?
There are 78.34 Males per 100 Females in East Marion.
What is the Ratio of Females per 100 Males in East Marion?
There are 127.66 Females per 100 Males in East Marion.
What is the Median Population Age in East Marion?
Median Population Age in East Marion is 61.3 Years.
What is the Average Family Size in East Marion
Average Family Size in East Marion is 2.6 People.
What is the Average Household Size in East Marion
Average Household Size in East Marion is 2.2 People.
How Large is the Labor Force in East Marion?
There are 709 People in the Labor Forcein in East Marion.
What is the Percentage of People in the Labor Force in East Marion?
48.7% of People are in the Labor Force in East Marion.
What is the Unemployment Rate in East Marion?
Unemployment Rate in East Marion is 0.8%.