Weedsport, NY Map & Demographics
Weedsport Map
Weedsport Overview
$35,853
PER CAPITA INCOME
$93,672
AVG FAMILY INCOME
$67,426
AVG HOUSEHOLD INCOME
34.1%
WAGE / INCOME GAP [ % ]
65.9¢/ $1
WAGE / INCOME GAP [ $ ]
0.38
INEQUALITY / GINI INDEX
1,858
TOTAL POPULATION
1,003
MALE POPULATION
855
FEMALE POPULATION
117.31
MALES / 100 FEMALES
85.24
FEMALES / 100 MALES
47.5
MEDIAN AGE
2.6
AVG FAMILY SIZE
2.1
AVG HOUSEHOLD SIZE
858
LABOR FORCE [ PEOPLE ]
53.7%
PERCENT IN LABOR FORCE
0.8%
UNEMPLOYMENT RATE
Weedsport Zip Codes
Weedsport Area Codes
Income in Weedsport
Income Overview in Weedsport
Per Capita Income in Weedsport is $35,853, while median incomes of families and households are $93,672 and $67,426 respectively.
| Characteristic | Number | Measure |
| Per Capita Income | 1,858 | $35,853 |
| Median Family Income | 506 | $93,672 |
| Mean Family Income | 506 | $101,503 |
| Median Household Income | 850 | $67,426 |
| Mean Household Income | 850 | $77,386 |
| Income Deficit | 506 | $0 |
| Wage / Income Gap (%) | 1,858 | 34.06% |
| Wage / Income Gap ($) | 1,858 | 65.94¢ per $1 |
| Gini / Inequality Index | 1,858 | 0.38 |
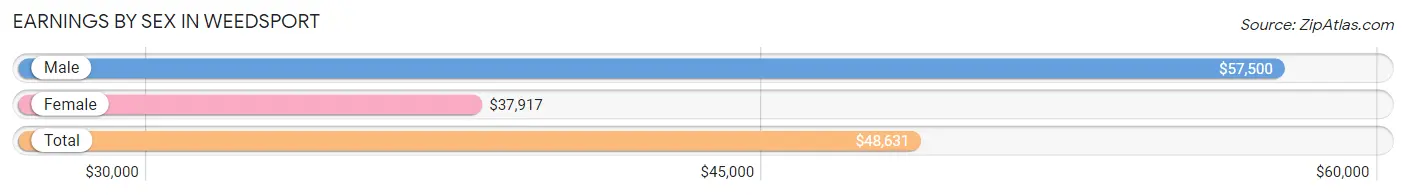
Earnings by Sex in Weedsport
Average Earnings in Weedsport are $48,631, $57,500 for men and $37,917 for women, a difference of 34.1%.
| Sex | Number | Average Earnings |
| Male | 462 (50.0%) | $57,500 |
| Female | 461 (49.9%) | $37,917 |
| Total | 923 (100.0%) | $48,631 |
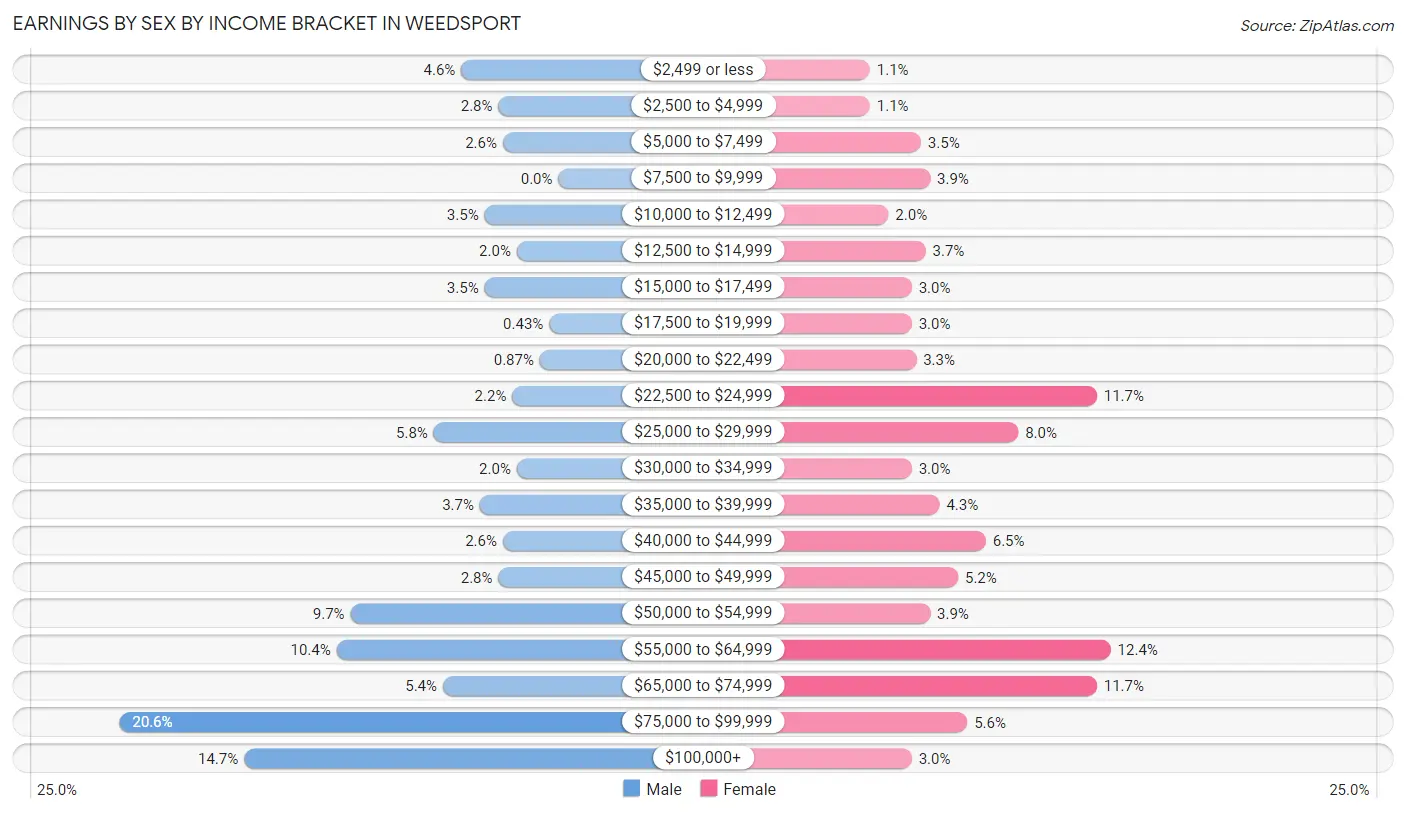
Earnings by Sex by Income Bracket in Weedsport
The most common earnings brackets in Weedsport are $75,000 to $99,999 for men (95 | 20.6%) and $55,000 to $64,999 for women (57 | 12.4%).
| Income | Male | Female |
| $2,499 or less | 21 (4.5%) | 5 (1.1%) |
| $2,500 to $4,999 | 13 (2.8%) | 5 (1.1%) |
| $5,000 to $7,499 | 12 (2.6%) | 16 (3.5%) |
| $7,500 to $9,999 | 0 (0.0%) | 18 (3.9%) |
| $10,000 to $12,499 | 16 (3.5%) | 9 (1.9%) |
| $12,500 to $14,999 | 9 (1.9%) | 17 (3.7%) |
| $15,000 to $17,499 | 16 (3.5%) | 14 (3.0%) |
| $17,500 to $19,999 | 2 (0.4%) | 14 (3.0%) |
| $20,000 to $22,499 | 4 (0.9%) | 15 (3.3%) |
| $22,500 to $24,999 | 10 (2.2%) | 54 (11.7%) |
| $25,000 to $29,999 | 27 (5.8%) | 37 (8.0%) |
| $30,000 to $34,999 | 9 (1.9%) | 14 (3.0%) |
| $35,000 to $39,999 | 17 (3.7%) | 20 (4.3%) |
| $40,000 to $44,999 | 12 (2.6%) | 30 (6.5%) |
| $45,000 to $49,999 | 13 (2.8%) | 24 (5.2%) |
| $50,000 to $54,999 | 45 (9.7%) | 18 (3.9%) |
| $55,000 to $64,999 | 48 (10.4%) | 57 (12.4%) |
| $65,000 to $74,999 | 25 (5.4%) | 54 (11.7%) |
| $75,000 to $99,999 | 95 (20.6%) | 26 (5.6%) |
| $100,000+ | 68 (14.7%) | 14 (3.0%) |
| Total | 462 (100.0%) | 461 (100.0%) |
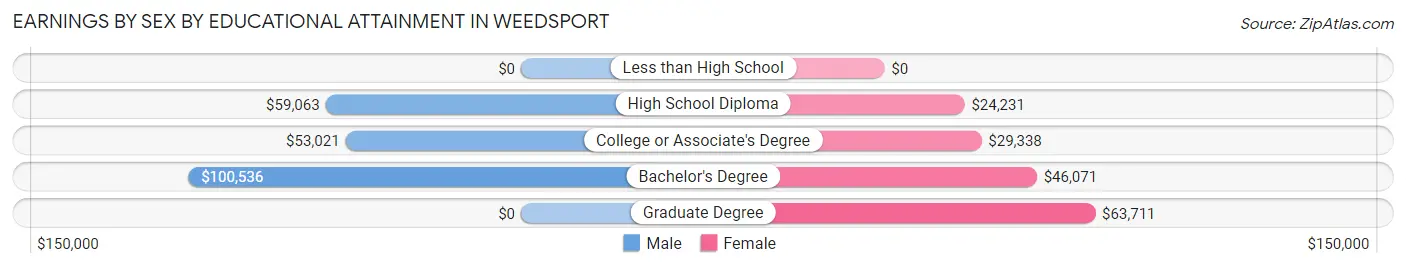
Earnings by Sex by Educational Attainment in Weedsport
Average earnings in Weedsport are $61,336 for men and $40,815 for women, a difference of 33.5%. Men with an educational attainment of bachelor's degree enjoy the highest average annual earnings of $100,536, while those with college or associate's degree education earn the least with $53,021. Women with an educational attainment of graduate degree earn the most with the average annual earnings of $63,711, while those with high school diploma education have the smallest earnings of $24,231.
| Educational Attainment | Male Income | Female Income |
| Less than High School | - | - |
| High School Diploma | $59,063 | $24,231 |
| College or Associate's Degree | $53,021 | $29,338 |
| Bachelor's Degree | $100,536 | $46,071 |
| Graduate Degree | - | - |
| Total | $61,336 | $40,815 |
Family Income in Weedsport
Family Income Brackets in Weedsport
According to the Weedsport family income data, there are 114 families falling into the $100,000 to $149,999 income range, which is the most common income bracket and makes up 22.5% of all families. Conversely, the $10,000 to $14,999 income bracket is the least frequent group with only 3 families (0.6%) belonging to this category.
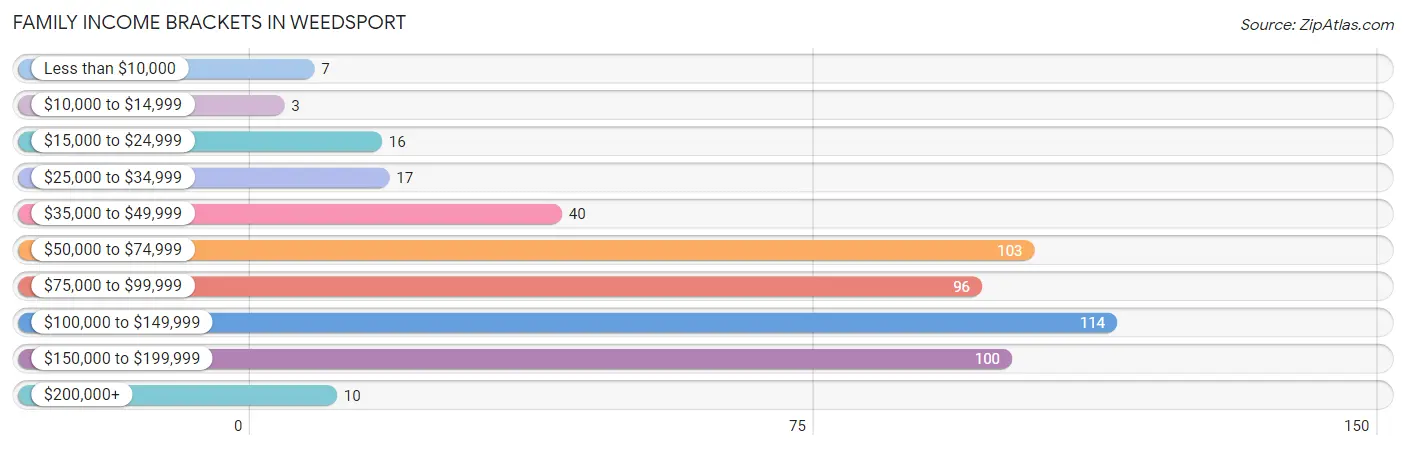
| Income Bracket | # Families | % Families |
| Less than $10,000 | 7 | 1.4% |
| $10,000 to $14,999 | 3 | 0.6% |
| $15,000 to $24,999 | 16 | 3.2% |
| $25,000 to $34,999 | 17 | 3.4% |
| $35,000 to $49,999 | 40 | 7.9% |
| $50,000 to $74,999 | 103 | 20.4% |
| $75,000 to $99,999 | 96 | 19.0% |
| $100,000 to $149,999 | 114 | 22.5% |
| $150,000 to $199,999 | 100 | 19.8% |
| $200,000+ | 10 | 2.0% |
Family Income by Famaliy Size in Weedsport
4-person families (71 | 14.0%) account for the highest median family income in Weedsport with $99,531 per family, while 2-person families (318 | 62.8%) have the highest median income of $46,848 per family member.
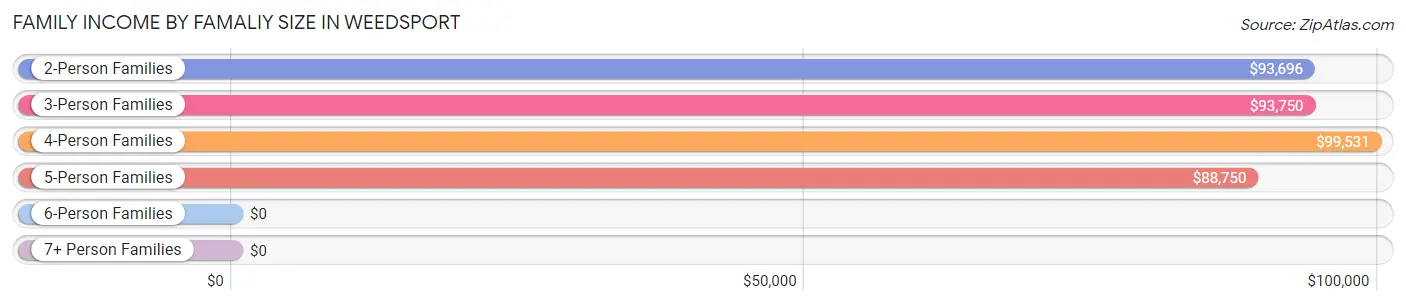
| Income Bracket | # Families | Median Income |
| 2-Person Families | 318 (62.8%) | $93,696 |
| 3-Person Families | 81 (16.0%) | $93,750 |
| 4-Person Families | 71 (14.0%) | $99,531 |
| 5-Person Families | 36 (7.1%) | $88,750 |
| 6-Person Families | 0 (0.0%) | $0 |
| 7+ Person Families | 0 (0.0%) | $0 |
| Total | 506 (100.0%) | $93,672 |
Family Income by Number of Earners in Weedsport
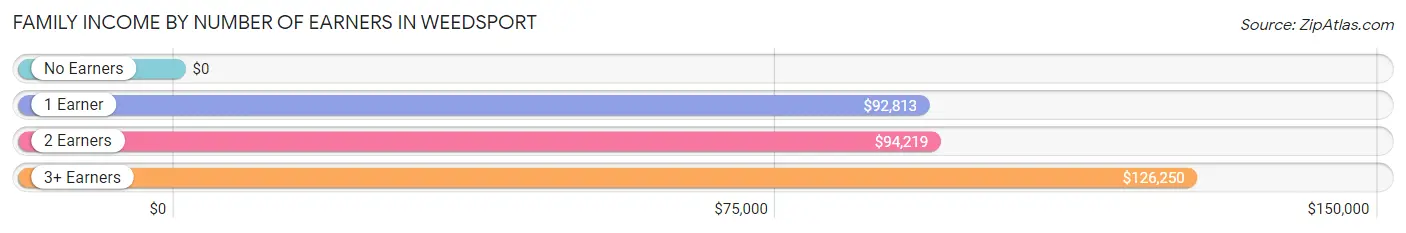
| Number of Earners | # Families | Median Income |
| No Earners | 47 (9.3%) | $0 |
| 1 Earner | 175 (34.6%) | $92,813 |
| 2 Earners | 260 (51.4%) | $94,219 |
| 3+ Earners | 24 (4.7%) | $126,250 |
| Total | 506 (100.0%) | $93,672 |
Household Income in Weedsport
Household Income Brackets in Weedsport
With 147 households falling in the category, the $50,000 to $74,999 income range is the most frequent in Weedsport, accounting for 17.3% of all households. In contrast, only 10 households (1.2%) fall into the $200,000+ income bracket, making it the least populous group.
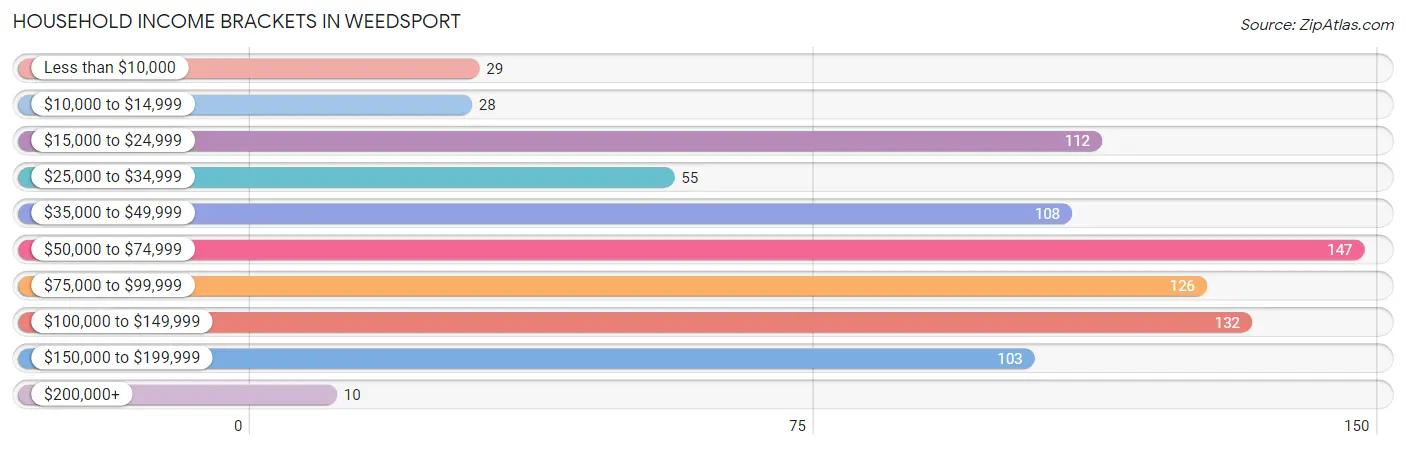
| Income Bracket | # Households | % Households |
| Less than $10,000 | 29 | 3.4% |
| $10,000 to $14,999 | 28 | 3.3% |
| $15,000 to $24,999 | 112 | 13.2% |
| $25,000 to $34,999 | 55 | 6.5% |
| $35,000 to $49,999 | 108 | 12.7% |
| $50,000 to $74,999 | 147 | 17.3% |
| $75,000 to $99,999 | 126 | 14.8% |
| $100,000 to $149,999 | 132 | 15.5% |
| $150,000 to $199,999 | 103 | 12.1% |
| $200,000+ | 10 | 1.2% |
Household Income by Householder Age in Weedsport
The median household income in Weedsport is $67,426, with the highest median household income of $77,250 found in the 25 to 44 years age bracket for the primary householder. A total of 225 households (26.5%) fall into this category. Meanwhile, the 15 to 24 years age bracket for the primary householder has the lowest median household income of $0, with 15 households (1.8%) in this group.
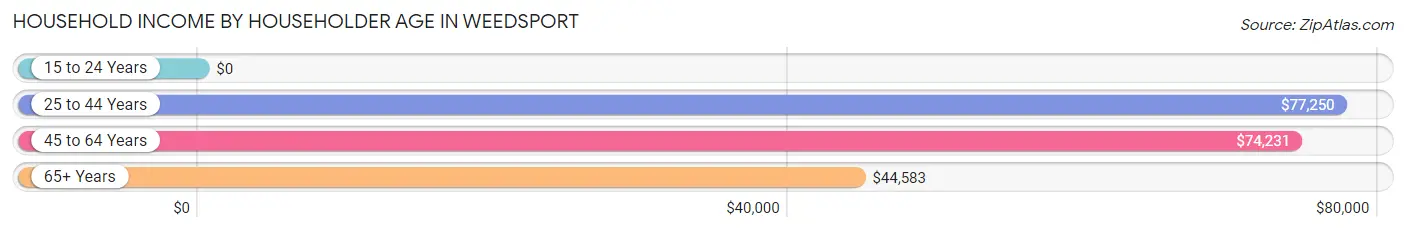
| Income Bracket | # Households | Median Income |
| 15 to 24 Years | 15 (1.8%) | $0 |
| 25 to 44 Years | 225 (26.5%) | $77,250 |
| 45 to 64 Years | 386 (45.4%) | $74,231 |
| 65+ Years | 224 (26.4%) | $44,583 |
| Total | 850 (100.0%) | $67,426 |
Poverty in Weedsport
Income Below Poverty by Sex and Age in Weedsport
With 24.4% poverty level for males and 7.6% for females among the residents of Weedsport, 35 to 44 year old males and 55 to 64 year old females are the most vulnerable to poverty, with 83 males (53.5%) and 33 females (21.1%) in their respective age groups living below the poverty level.
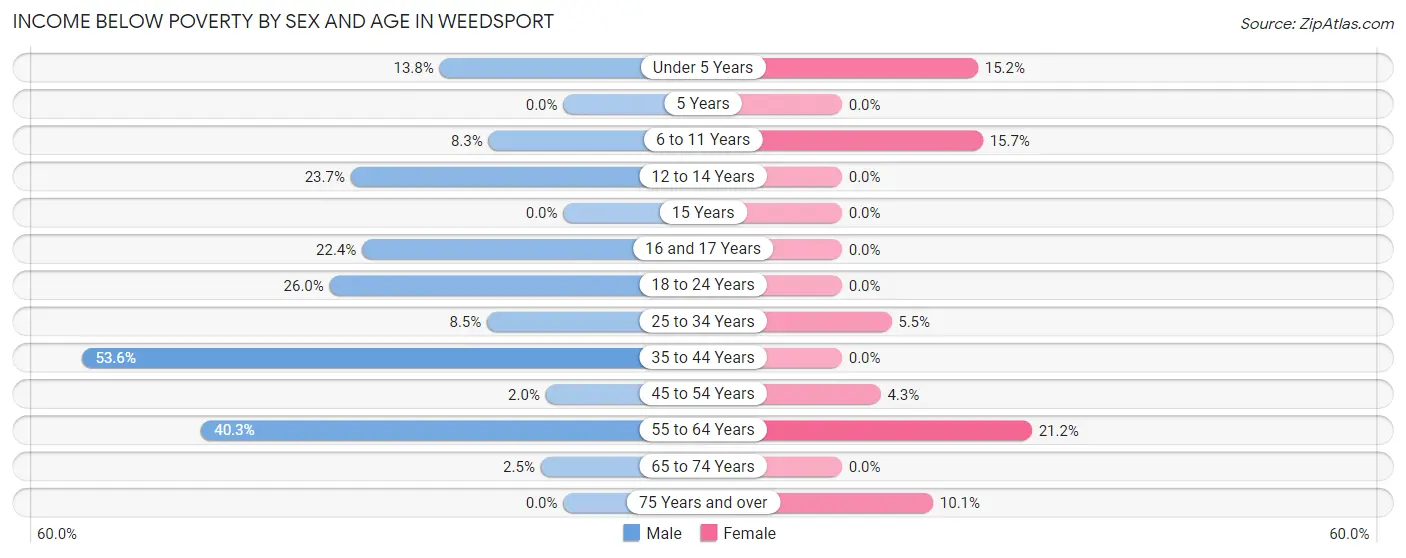
| Age Bracket | Male | Female |
| Under 5 Years | 4 (13.8%) | 5 (15.1%) |
| 5 Years | 0 (0.0%) | 0 (0.0%) |
| 6 to 11 Years | 3 (8.3%) | 8 (15.7%) |
| 12 to 14 Years | 9 (23.7%) | 0 (0.0%) |
| 15 Years | 0 (0.0%) | 0 (0.0%) |
| 16 and 17 Years | 13 (22.4%) | 0 (0.0%) |
| 18 to 24 Years | 19 (26.0%) | 0 (0.0%) |
| 25 to 34 Years | 9 (8.5%) | 7 (5.5%) |
| 35 to 44 Years | 83 (53.5%) | 0 (0.0%) |
| 45 to 54 Years | 2 (2.0%) | 5 (4.3%) |
| 55 to 64 Years | 100 (40.3%) | 33 (21.1%) |
| 65 to 74 Years | 3 (2.5%) | 0 (0.0%) |
| 75 Years and over | 0 (0.0%) | 7 (10.1%) |
| Total | 245 (24.4%) | 65 (7.6%) |
Income Above Poverty by Sex and Age in Weedsport
According to the poverty statistics in Weedsport, males aged 5 years and females aged 12 to 14 years are the age groups that are most secure financially, with 100.0% of males and 100.0% of females in these age groups living above the poverty line.
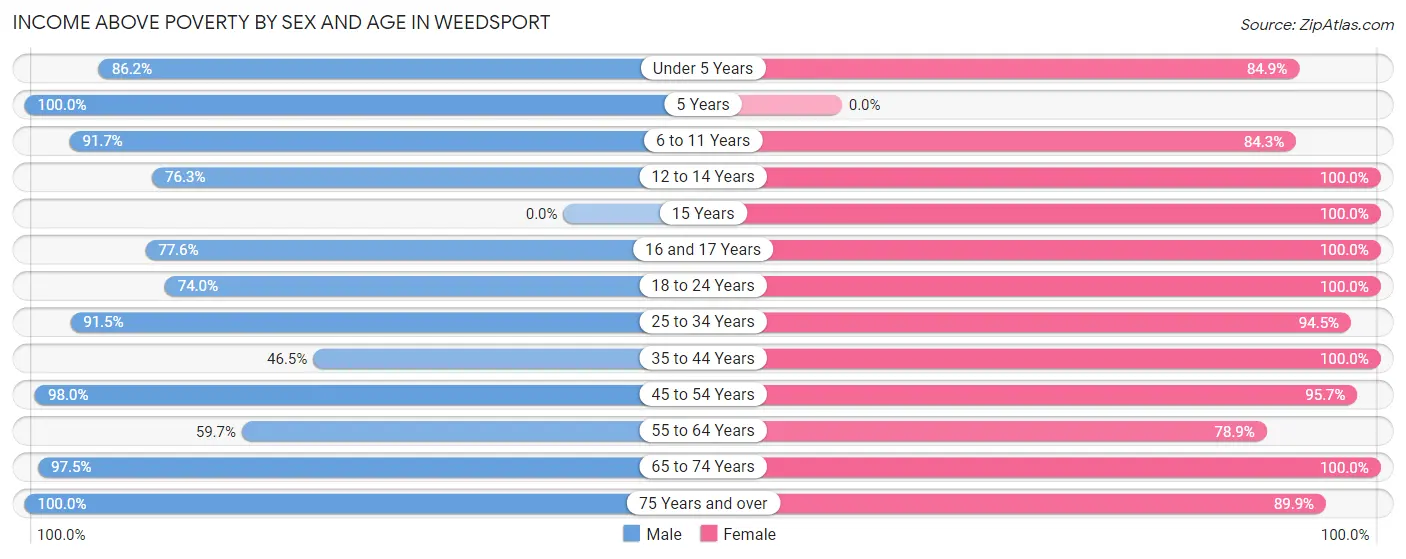
| Age Bracket | Male | Female |
| Under 5 Years | 25 (86.2%) | 28 (84.9%) |
| 5 Years | 11 (100.0%) | 0 (0.0%) |
| 6 to 11 Years | 33 (91.7%) | 43 (84.3%) |
| 12 to 14 Years | 29 (76.3%) | 59 (100.0%) |
| 15 Years | 0 (0.0%) | 3 (100.0%) |
| 16 and 17 Years | 45 (77.6%) | 13 (100.0%) |
| 18 to 24 Years | 54 (74.0%) | 27 (100.0%) |
| 25 to 34 Years | 97 (91.5%) | 120 (94.5%) |
| 35 to 44 Years | 72 (46.5%) | 90 (100.0%) |
| 45 to 54 Years | 100 (98.0%) | 111 (95.7%) |
| 55 to 64 Years | 148 (59.7%) | 123 (78.8%) |
| 65 to 74 Years | 116 (97.5%) | 111 (100.0%) |
| 75 Years and over | 28 (100.0%) | 62 (89.9%) |
| Total | 758 (75.6%) | 790 (92.4%) |
Income Below Poverty Among Married-Couple Families in Weedsport
The poverty statistics for married-couple families in Weedsport show that 3.6% or 13 of the total 357 families live below the poverty line. Families with no children have the highest poverty rate of 4.3%, comprising of 10 families. On the other hand, families with 3 or 4 children have the lowest poverty rate of 0.0%, which includes 0 families.
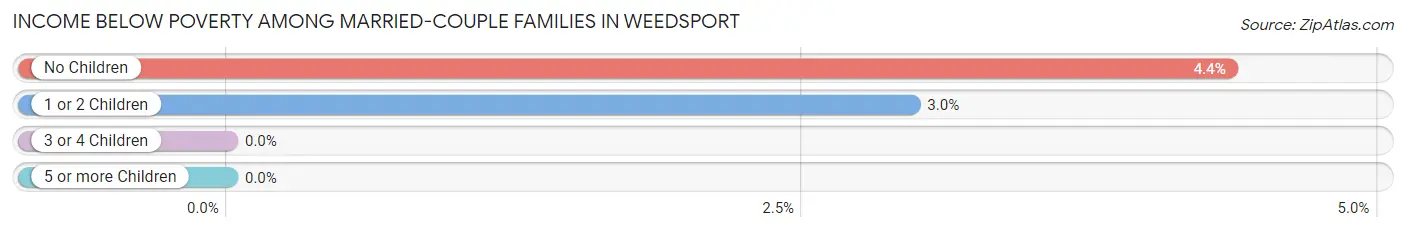
| Children | Above Poverty | Below Poverty |
| No Children | 220 (95.7%) | 10 (4.3%) |
| 1 or 2 Children | 98 (97.0%) | 3 (3.0%) |
| 3 or 4 Children | 26 (100.0%) | 0 (0.0%) |
| 5 or more Children | 0 (0.0%) | 0 (0.0%) |
| Total | 344 (96.4%) | 13 (3.6%) |
Income Below Poverty Among Single-Parent Households in Weedsport
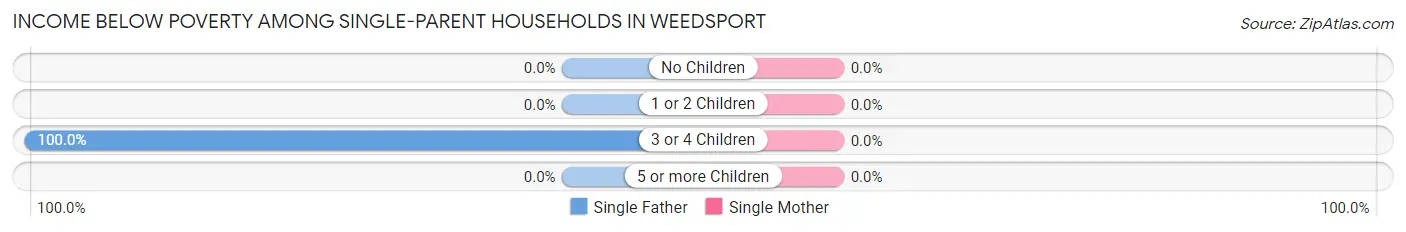
| Children | Single Father | Single Mother |
| No Children | 0 (0.0%) | 0 (0.0%) |
| 1 or 2 Children | 0 (0.0%) | 0 (0.0%) |
| 3 or 4 Children | 9 (100.0%) | 0 (0.0%) |
| 5 or more Children | 0 (0.0%) | 0 (0.0%) |
| Total | 9 (21.4%) | 0 (0.0%) |
Income Below Poverty Among Married-Couple vs Single-Parent Households in Weedsport
The poverty data for Weedsport shows that 13 of the married-couple family households (3.6%) and 9 of the single-parent households (6.0%) are living below the poverty level. Within the married-couple family households, those with no children have the highest poverty rate, with 10 households (4.3%) falling below the poverty line. Among the single-parent households, those with 3 or 4 children have the highest poverty rate, with 9 household (52.9%) living below poverty.
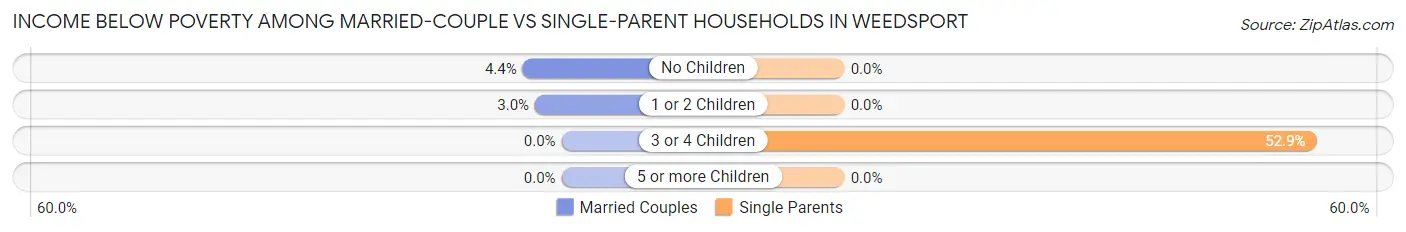
| Children | Married-Couple Families | Single-Parent Households |
| No Children | 10 (4.3%) | 0 (0.0%) |
| 1 or 2 Children | 3 (3.0%) | 0 (0.0%) |
| 3 or 4 Children | 0 (0.0%) | 9 (52.9%) |
| 5 or more Children | 0 (0.0%) | 0 (0.0%) |
| Total | 13 (3.6%) | 9 (6.0%) |
Race in Weedsport
The most populous races in Weedsport are White / Caucasian (1,804 | 97.1%), Hispanic or Latino (35 | 1.9%), and Two or more Races (32 | 1.7%).
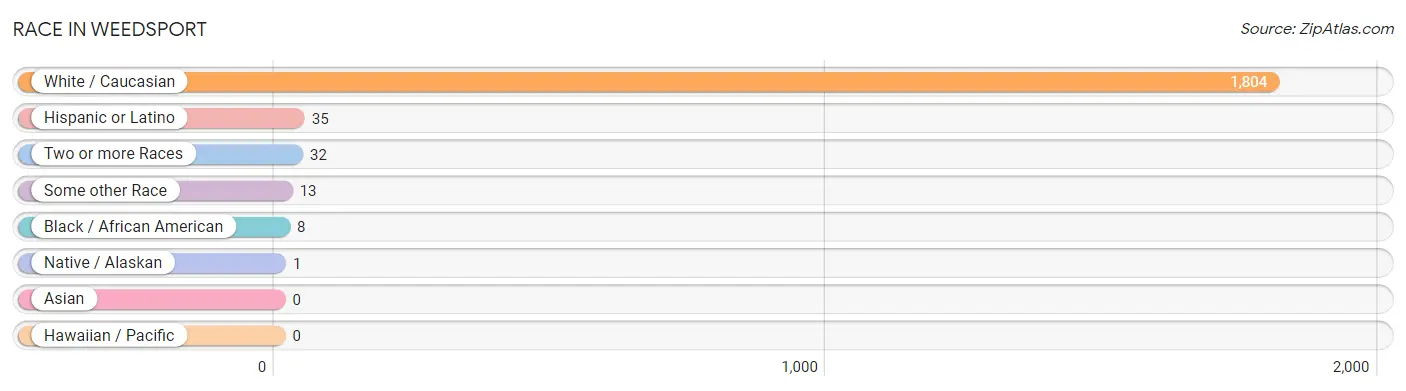
| Race | # Population | % Population |
| Asian | 0 | 0.0% |
| Black / African American | 8 | 0.4% |
| Hawaiian / Pacific | 0 | 0.0% |
| Hispanic or Latino | 35 | 1.9% |
| Native / Alaskan | 1 | 0.1% |
| White / Caucasian | 1,804 | 97.1% |
| Two or more Races | 32 | 1.7% |
| Some other Race | 13 | 0.7% |
| Total | 1,858 | 100.0% |
Ancestry in Weedsport
The most populous ancestries reported in Weedsport are English (503 | 27.1%), Irish (414 | 22.3%), German (358 | 19.3%), Italian (176 | 9.5%), and Polish (119 | 6.4%), together accounting for 84.5% of all Weedsport residents.
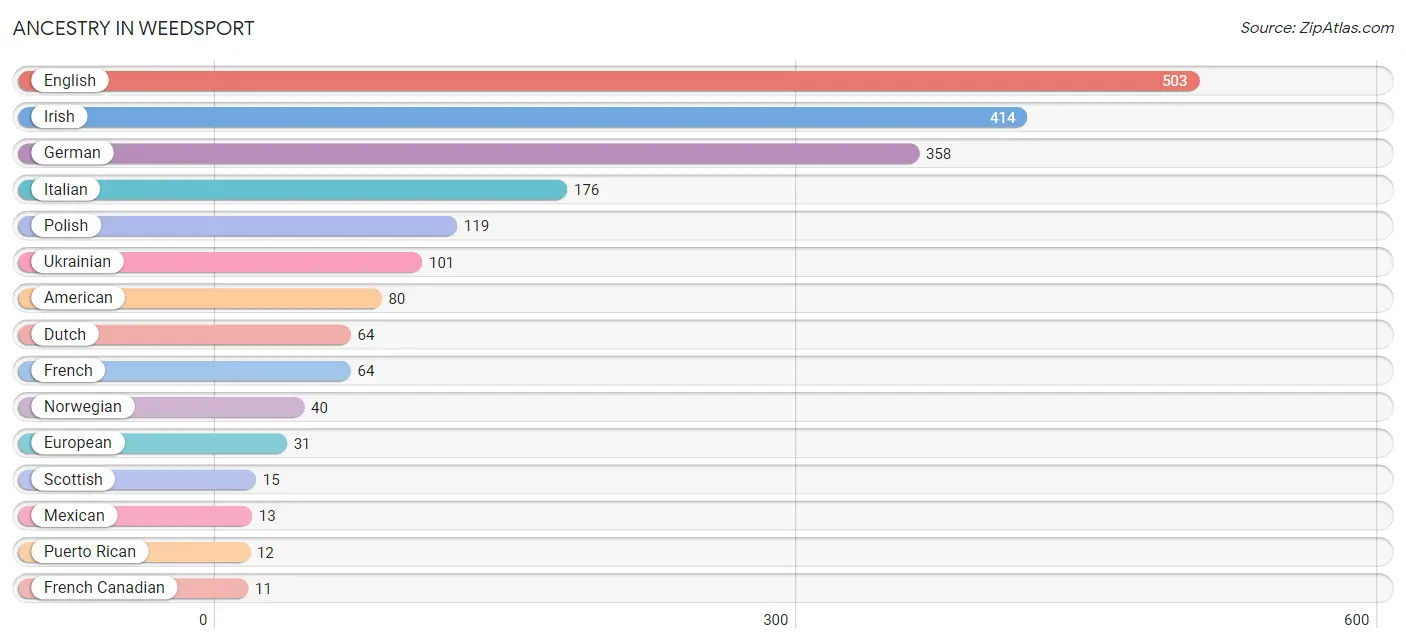
| Ancestry | # Population | % Population |
| American | 80 | 4.3% |
| Bhutanese | 1 | 0.1% |
| British | 3 | 0.2% |
| Canadian | 9 | 0.5% |
| Czech | 4 | 0.2% |
| Czechoslovakian | 3 | 0.2% |
| Dutch | 64 | 3.4% |
| English | 503 | 27.1% |
| European | 31 | 1.7% |
| French | 64 | 3.4% |
| French Canadian | 11 | 0.6% |
| German | 358 | 19.3% |
| Hungarian | 4 | 0.2% |
| Irish | 414 | 22.3% |
| Iroquois | 2 | 0.1% |
| Italian | 176 | 9.5% |
| Korean | 6 | 0.3% |
| Lithuanian | 3 | 0.2% |
| Mexican | 13 | 0.7% |
| Northern European | 11 | 0.6% |
| Norwegian | 40 | 2.1% |
| Polish | 119 | 6.4% |
| Puerto Rican | 12 | 0.6% |
| Scottish | 15 | 0.8% |
| Spanish | 9 | 0.5% |
| Swiss | 4 | 0.2% |
| Thai | 6 | 0.3% |
| Ukrainian | 101 | 5.4% |
| Welsh | 3 | 0.2% | View All 29 Rows |
Immigrants in Weedsport
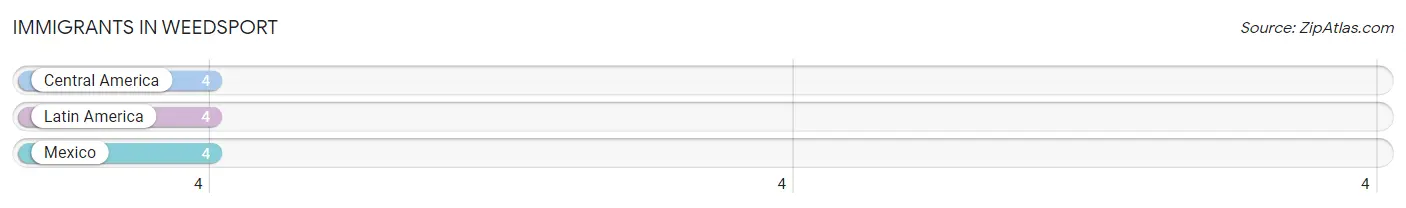
The most numerous immigrant groups reported in Weedsport came from Central America (4 | 0.2%), Latin America (4 | 0.2%), and Mexico (4 | 0.2%), together accounting for 0.7% of all Weedsport residents.
| Immigration Origin | # Population | % Population |
| Central America | 4 | 0.2% |
| Latin America | 4 | 0.2% |
| Mexico | 4 | 0.2% | View All 3 Rows |
Sex and Age in Weedsport
Sex and Age in Weedsport
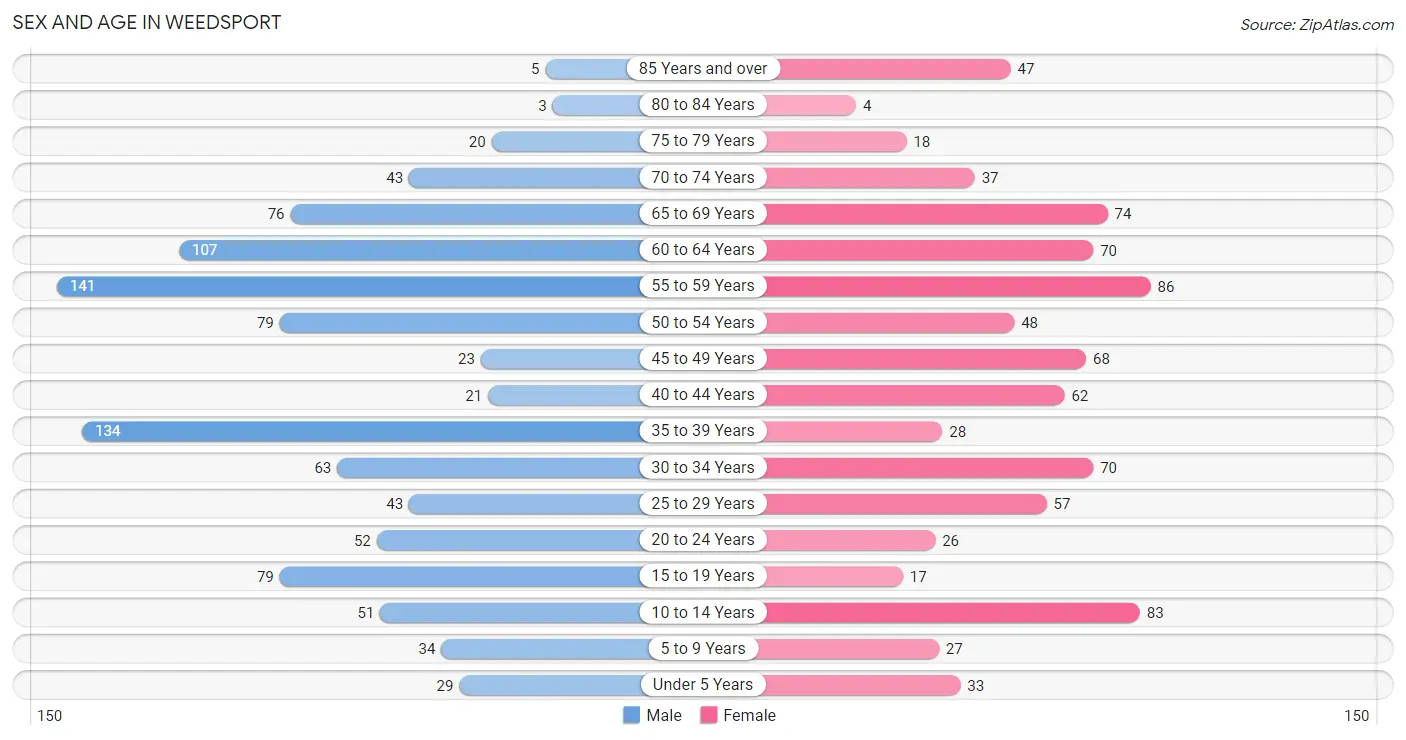
The most populous age groups in Weedsport are 55 to 59 Years (141 | 14.1%) for men and 55 to 59 Years (86 | 10.1%) for women.
| Age Bracket | Male | Female |
| Under 5 Years | 29 (2.9%) | 33 (3.9%) |
| 5 to 9 Years | 34 (3.4%) | 27 (3.2%) |
| 10 to 14 Years | 51 (5.1%) | 83 (9.7%) |
| 15 to 19 Years | 79 (7.9%) | 17 (2.0%) |
| 20 to 24 Years | 52 (5.2%) | 26 (3.0%) |
| 25 to 29 Years | 43 (4.3%) | 57 (6.7%) |
| 30 to 34 Years | 63 (6.3%) | 70 (8.2%) |
| 35 to 39 Years | 134 (13.4%) | 28 (3.3%) |
| 40 to 44 Years | 21 (2.1%) | 62 (7.2%) |
| 45 to 49 Years | 23 (2.3%) | 68 (8.0%) |
| 50 to 54 Years | 79 (7.9%) | 48 (5.6%) |
| 55 to 59 Years | 141 (14.1%) | 86 (10.1%) |
| 60 to 64 Years | 107 (10.7%) | 70 (8.2%) |
| 65 to 69 Years | 76 (7.6%) | 74 (8.6%) |
| 70 to 74 Years | 43 (4.3%) | 37 (4.3%) |
| 75 to 79 Years | 20 (2.0%) | 18 (2.1%) |
| 80 to 84 Years | 3 (0.3%) | 4 (0.5%) |
| 85 Years and over | 5 (0.5%) | 47 (5.5%) |
| Total | 1,003 (100.0%) | 855 (100.0%) |
Families and Households in Weedsport
Median Family Size in Weedsport
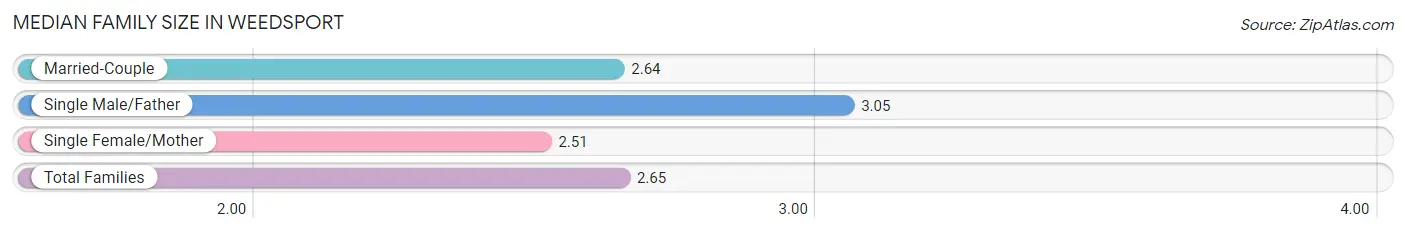
The median family size in Weedsport is 2.65 persons per family, with single male/father families (42 | 8.3%) accounting for the largest median family size of 3.05 persons per family. On the other hand, single female/mother families (107 | 21.1%) represent the smallest median family size with 2.51 persons per family.
| Family Type | # Families | Family Size |
| Married-Couple | 357 (70.6%) | 2.64 |
| Single Male/Father | 42 (8.3%) | 3.05 |
| Single Female/Mother | 107 (21.1%) | 2.51 |
| Total Families | 506 (100.0%) | 2.65 |
Median Household Size in Weedsport
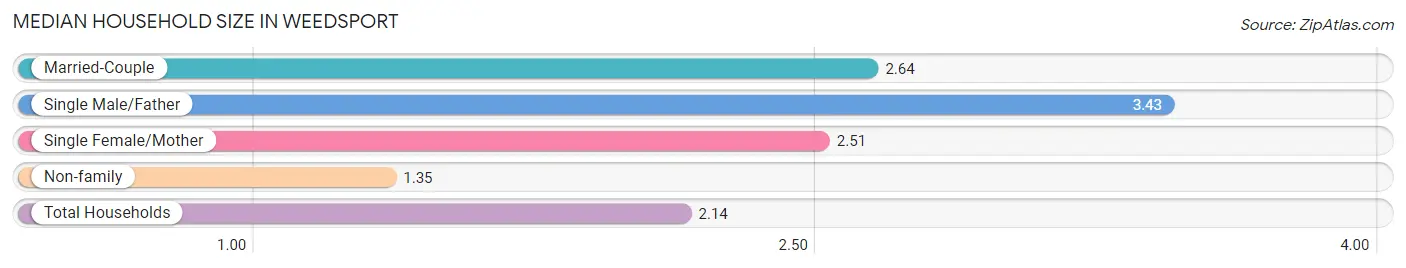
The median household size in Weedsport is 2.14 persons per household, with single male/father households (42 | 4.9%) accounting for the largest median household size of 3.43 persons per household. non-family households (344 | 40.5%) represent the smallest median household size with 1.35 persons per household.
| Household Type | # Households | Household Size |
| Married-Couple | 357 (42.0%) | 2.64 |
| Single Male/Father | 42 (4.9%) | 3.43 |
| Single Female/Mother | 107 (12.6%) | 2.51 |
| Non-family | 344 (40.5%) | 1.35 |
| Total Households | 850 (100.0%) | 2.14 |
Household Size by Marriage Status in Weedsport
Out of a total of 850 households in Weedsport, 506 (59.5%) are family households, while 344 (40.5%) are nonfamily households. The most numerous type of family households are 2-person households, comprising 307, and the most common type of nonfamily households are 1-person households, comprising 215.
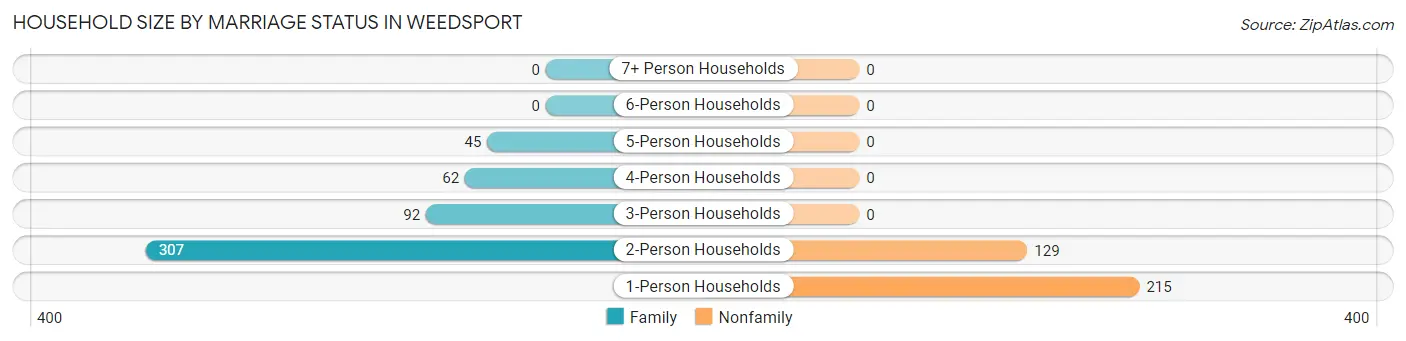
| Household Size | Family Households | Nonfamily Households |
| 1-Person Households | - | 215 (25.3%) |
| 2-Person Households | 307 (36.1%) | 129 (15.2%) |
| 3-Person Households | 92 (10.8%) | 0 (0.0%) |
| 4-Person Households | 62 (7.3%) | 0 (0.0%) |
| 5-Person Households | 45 (5.3%) | 0 (0.0%) |
| 6-Person Households | 0 (0.0%) | 0 (0.0%) |
| 7+ Person Households | 0 (0.0%) | 0 (0.0%) |
| Total | 506 (59.5%) | 344 (40.5%) |
Female Fertility in Weedsport
Fertility by Age in Weedsport
Average fertility rate in Weedsport is 66.0 births per 1,000 women. Women in the age bracket of 20 to 34 years have the highest fertility rate with 150.0 births per 1,000 women. Women in the age bracket of 20 to 34 years acount for 100.0% of all women with births.
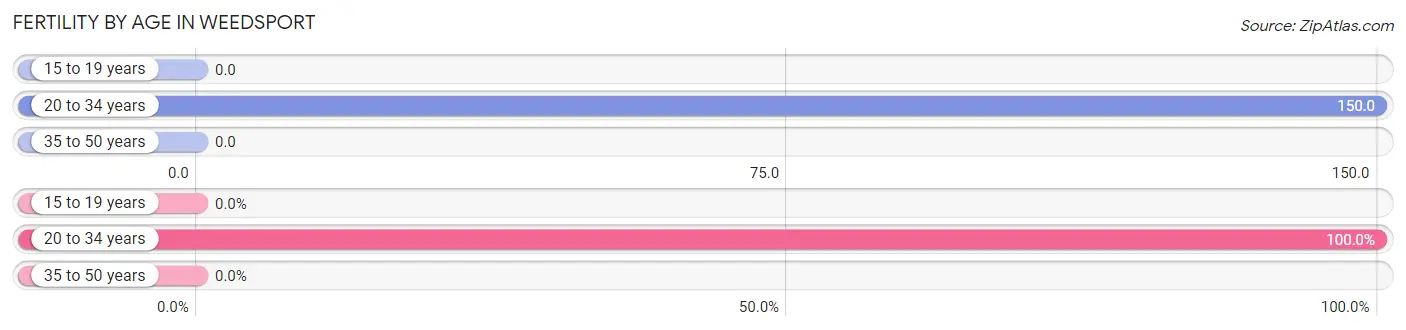
| Age Bracket | Women with Births | Births / 1,000 Women |
| 15 to 19 years | 0 (0.0%) | 0.0 |
| 20 to 34 years | 23 (100.0%) | 150.0 |
| 35 to 50 years | 0 (0.0%) | 0.0 |
| Total | 23 (100.0%) | 66.0 |
Fertility by Age by Marriage Status in Weedsport
87.0% of women with births (23) in Weedsport are married. The highest percentage of unmarried women with births falls into 20 to 34 years age bracket with 13.0% of them unmarried at the time of birth, while the lowest percentage of unmarried women with births belong to 20 to 34 years age bracket with 13.0% of them unmarried.
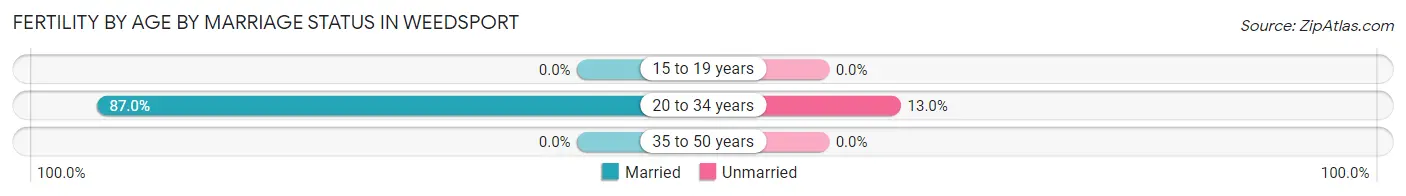
| Age Bracket | Married | Unmarried |
| 15 to 19 years | 0 (0.0%) | 0 (0.0%) |
| 20 to 34 years | 20 (87.0%) | 3 (13.0%) |
| 35 to 50 years | 0 (0.0%) | 0 (0.0%) |
| Total | 20 (87.0%) | 3 (13.0%) |
Fertility by Education in Weedsport
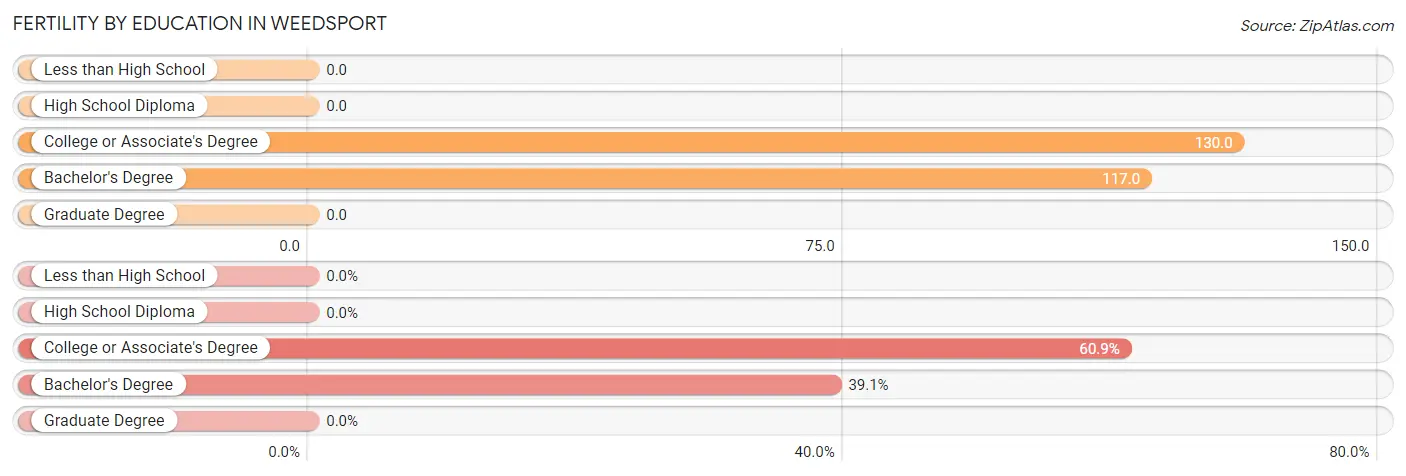
| Educational Attainment | Women with Births | Births / 1,000 Women |
| Less than High School | 0 (0.0%) | 0.0 |
| High School Diploma | 0 (0.0%) | 0.0 |
| College or Associate's Degree | 14 (60.9%) | 130.0 |
| Bachelor's Degree | 9 (39.1%) | 117.0 |
| Graduate Degree | 0 (0.0%) | 0.0 |
| Total | 23 (100.0%) | 66.0 |
Fertility by Education by Marriage Status in Weedsport
13.0% of women with births in Weedsport are unmarried. Women with the educational attainment of bachelor's degree are most likely to be married with 100.0% of them married at childbirth, while women with the educational attainment of college or associate's degree are least likely to be married with 21.4% of them unmarried at childbirth.
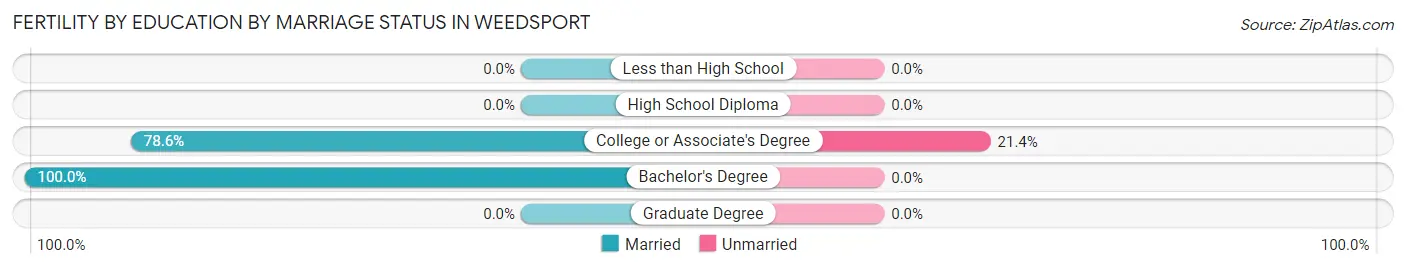
| Educational Attainment | Married | Unmarried |
| Less than High School | 0 (0.0%) | 0 (0.0%) |
| High School Diploma | 0 (0.0%) | 0 (0.0%) |
| College or Associate's Degree | 11 (78.6%) | 3 (21.4%) |
| Bachelor's Degree | 9 (100.0%) | 0 (0.0%) |
| Graduate Degree | 0 (0.0%) | 0 (0.0%) |
| Total | 20 (87.0%) | 3 (13.0%) |
Employment Characteristics in Weedsport
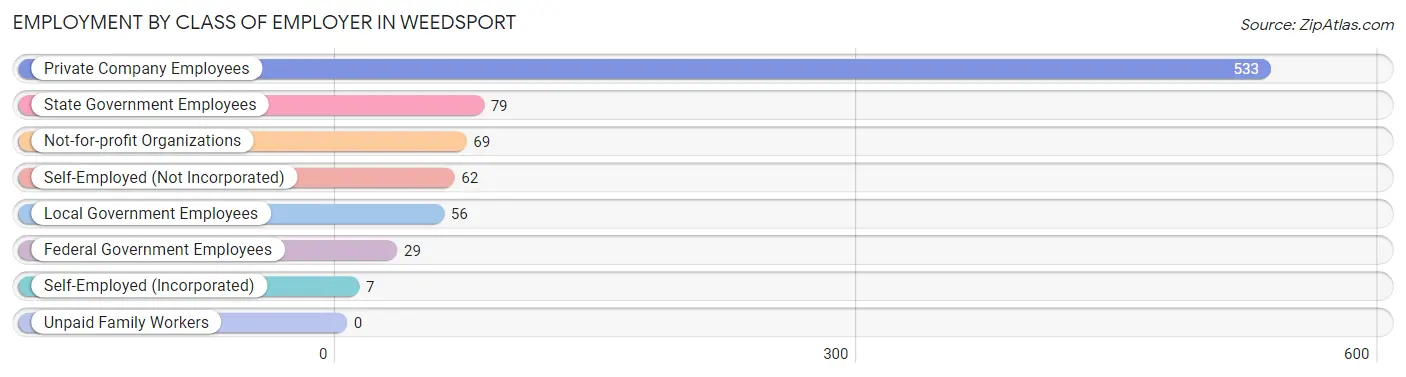
Employment by Class of Employer in Weedsport
Among the 835 employed individuals in Weedsport, private company employees (533 | 63.8%), state government employees (79 | 9.5%), and not-for-profit organizations (69 | 8.3%) make up the most common classes of employment.
| Employer Class | # Employees | % Employees |
| Private Company Employees | 533 | 63.8% |
| Self-Employed (Incorporated) | 7 | 0.8% |
| Self-Employed (Not Incorporated) | 62 | 7.4% |
| Not-for-profit Organizations | 69 | 8.3% |
| Local Government Employees | 56 | 6.7% |
| State Government Employees | 79 | 9.5% |
| Federal Government Employees | 29 | 3.5% |
| Unpaid Family Workers | 0 | 0.0% |
| Total | 835 | 100.0% |
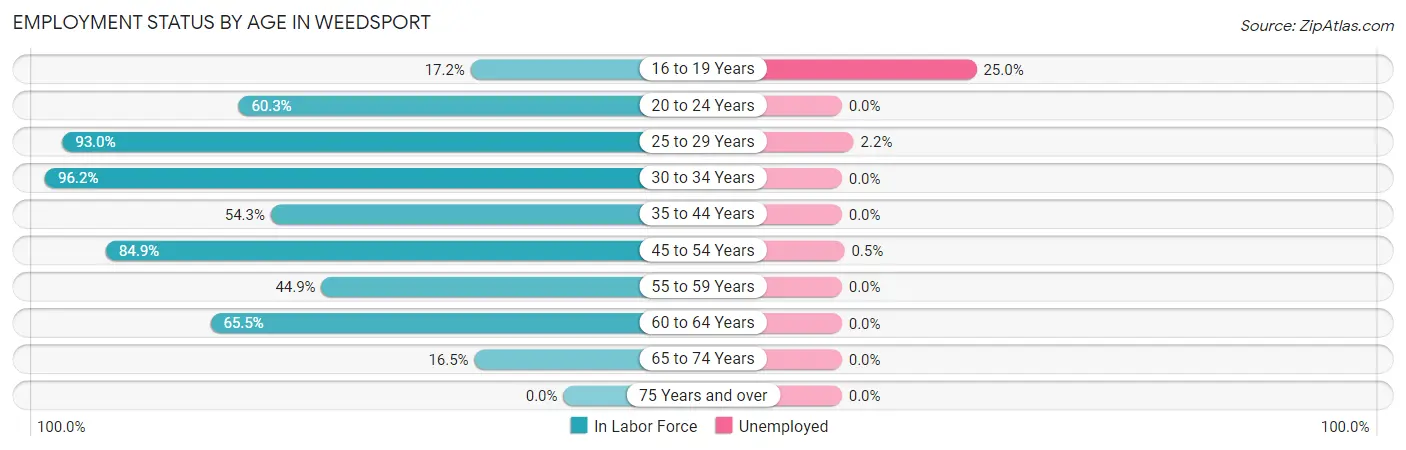
Employment Status by Age in Weedsport
According to the labor force statistics for Weedsport, out of the total population over 16 years of age (1,598), 53.7% or 858 individuals are in the labor force, with 0.8% or 7 of them unemployed. The age group with the highest labor force participation rate is 30 to 34 years, with 96.2% or 128 individuals in the labor force. Within the labor force, the 16 to 19 years age range has the highest percentage of unemployed individuals, with 25.0% or 4 of them being unemployed.
| Age Bracket | In Labor Force | Unemployed |
| 16 to 19 Years | 16 (17.2%) | 4 (25.0%) |
| 20 to 24 Years | 47 (60.3%) | 0 (0.0%) |
| 25 to 29 Years | 93 (93.0%) | 2 (2.2%) |
| 30 to 34 Years | 128 (96.2%) | 0 (0.0%) |
| 35 to 44 Years | 133 (54.3%) | 0 (0.0%) |
| 45 to 54 Years | 185 (84.9%) | 1 (0.5%) |
| 55 to 59 Years | 102 (44.9%) | 0 (0.0%) |
| 60 to 64 Years | 116 (65.5%) | 0 (0.0%) |
| 65 to 74 Years | 38 (16.5%) | 0 (0.0%) |
| 75 Years and over | 0 (0.0%) | 0 (0.0%) |
| Total | 858 (53.7%) | 7 (0.8%) |
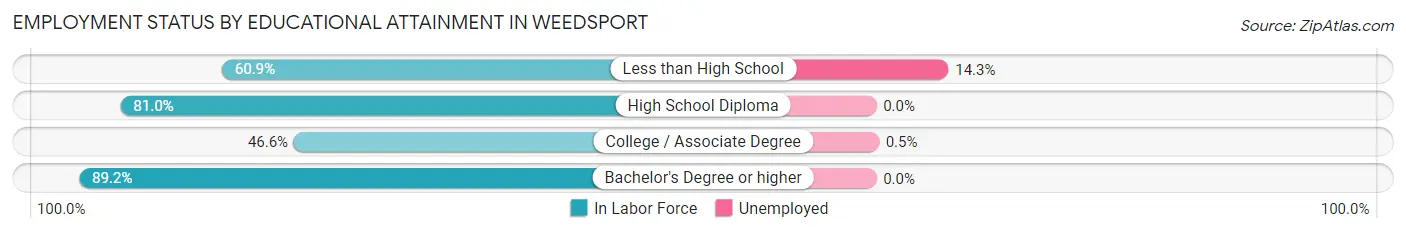
Employment Status by Educational Attainment in Weedsport
According to labor force statistics for Weedsport, 68.8% of individuals (757) out of the total population between 25 and 64 years of age (1,100) are in the labor force, with 0.4% or 3 of them being unemployed. The group with the highest labor force participation rate are those with the educational attainment of bachelor's degree or higher, with 89.2% or 282 individuals in the labor force. Within the labor force, individuals with less than high school education have the highest percentage of unemployment, with 14.3% or 2 of them being unemployed.
| Educational Attainment | In Labor Force | Unemployed |
| Less than High School | 14 (60.9%) | 3 (14.3%) |
| High School Diploma | 251 (81.0%) | 0 (0.0%) |
| College / Associate Degree | 210 (46.6%) | 2 (0.5%) |
| Bachelor's Degree or higher | 282 (89.2%) | 0 (0.0%) |
| Total | 757 (68.8%) | 4 (0.4%) |
Employment Occupations by Sex in Weedsport
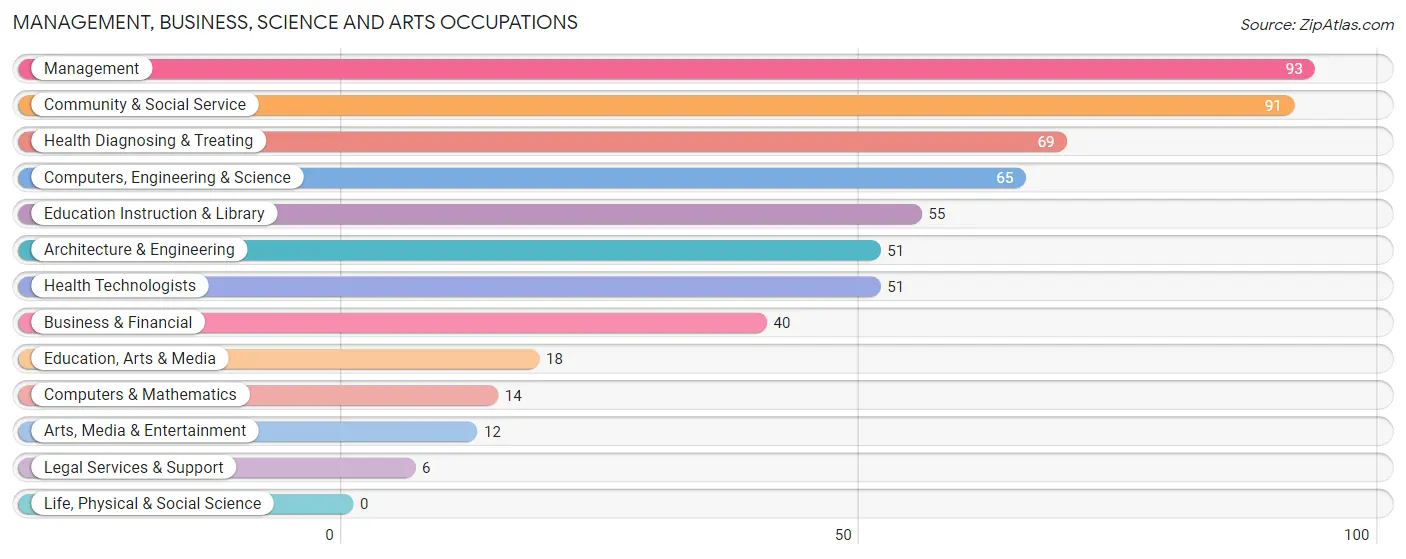
Management, Business, Science and Arts Occupations
The most common Management, Business, Science and Arts occupations in Weedsport are Management (93 | 10.9%), Community & Social Service (91 | 10.7%), Health Diagnosing & Treating (69 | 8.1%), Computers, Engineering & Science (65 | 7.6%), and Education Instruction & Library (55 | 6.5%).
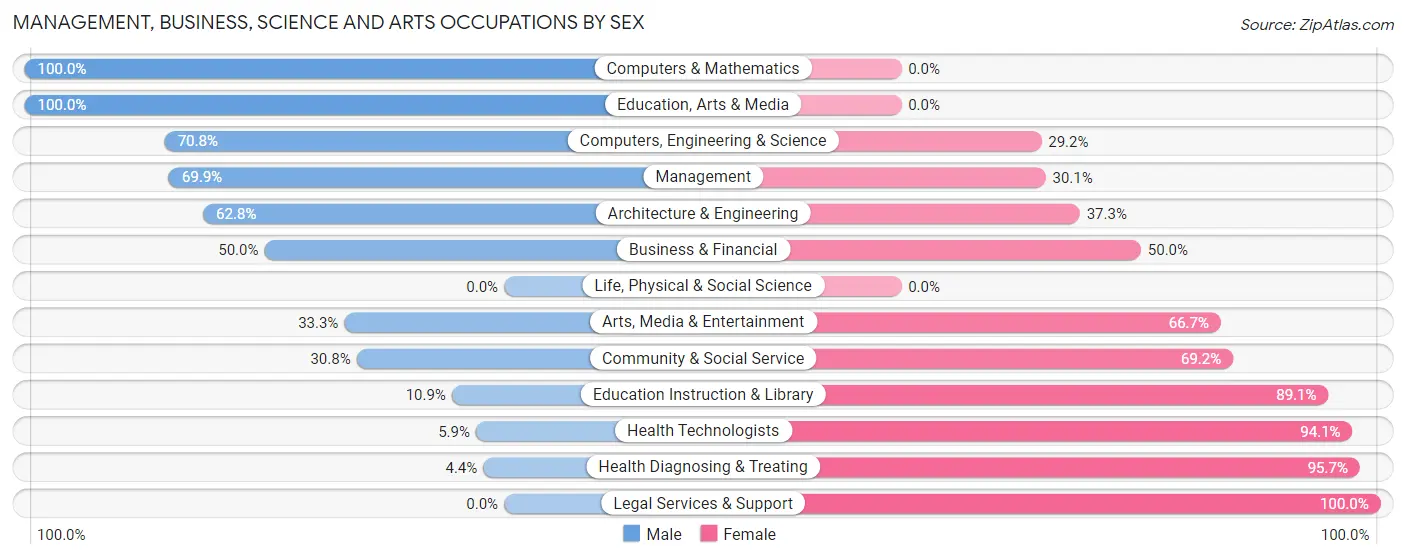
Management, Business, Science and Arts Occupations by Sex
Within the Management, Business, Science and Arts occupations in Weedsport, the most male-oriented occupations are Computers & Mathematics (100.0%), Education, Arts & Media (100.0%), and Computers, Engineering & Science (70.8%), while the most female-oriented occupations are Legal Services & Support (100.0%), Health Diagnosing & Treating (95.7%), and Health Technologists (94.1%).
| Occupation | Male | Female |
| Management | 65 (69.9%) | 28 (30.1%) |
| Business & Financial | 20 (50.0%) | 20 (50.0%) |
| Computers, Engineering & Science | 46 (70.8%) | 19 (29.2%) |
| Computers & Mathematics | 14 (100.0%) | 0 (0.0%) |
| Architecture & Engineering | 32 (62.7%) | 19 (37.2%) |
| Life, Physical & Social Science | 0 (0.0%) | 0 (0.0%) |
| Community & Social Service | 28 (30.8%) | 63 (69.2%) |
| Education, Arts & Media | 18 (100.0%) | 0 (0.0%) |
| Legal Services & Support | 0 (0.0%) | 6 (100.0%) |
| Education Instruction & Library | 6 (10.9%) | 49 (89.1%) |
| Arts, Media & Entertainment | 4 (33.3%) | 8 (66.7%) |
| Health Diagnosing & Treating | 3 (4.3%) | 66 (95.7%) |
| Health Technologists | 3 (5.9%) | 48 (94.1%) |
| Total (Category) | 162 (45.3%) | 196 (54.7%) |
| Total (Overall) | 424 (49.8%) | 427 (50.2%) |
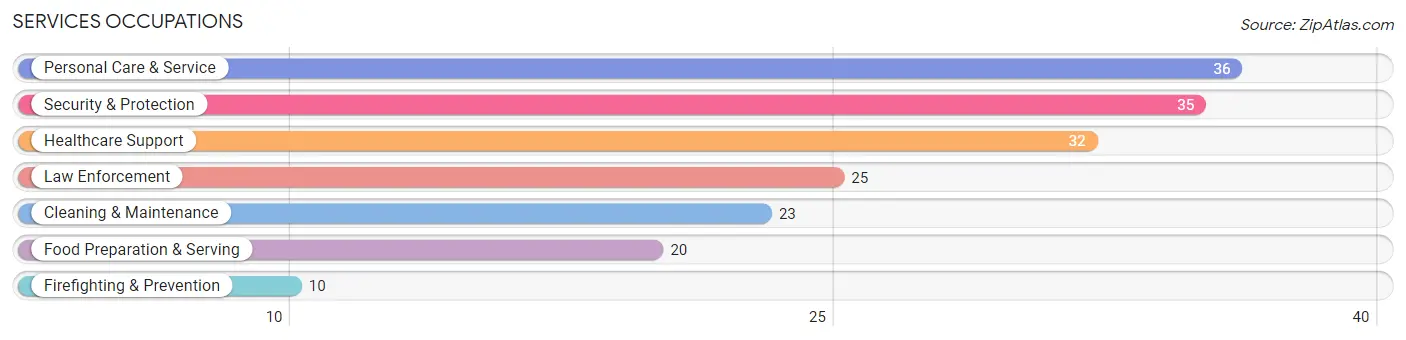
Services Occupations
The most common Services occupations in Weedsport are Personal Care & Service (36 | 4.2%), Security & Protection (35 | 4.1%), Healthcare Support (32 | 3.8%), Law Enforcement (25 | 2.9%), and Cleaning & Maintenance (23 | 2.7%).
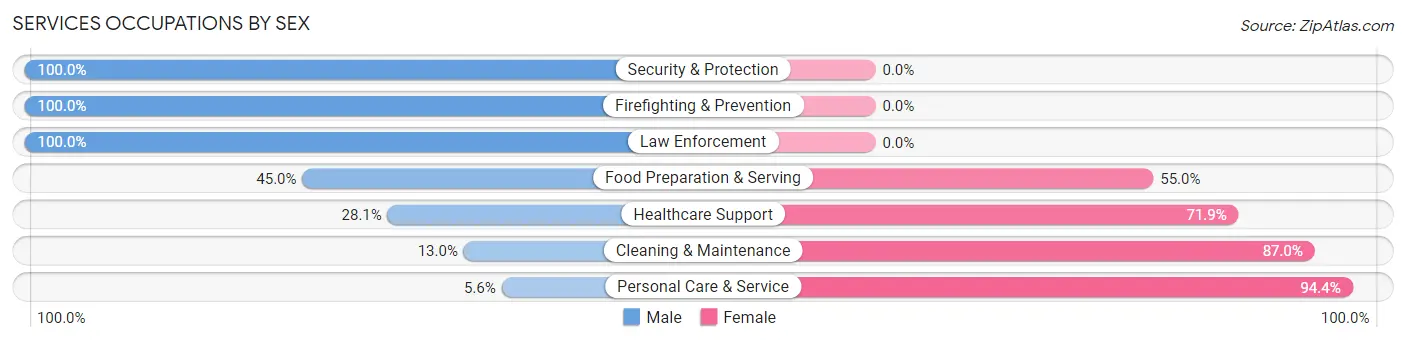
Services Occupations by Sex
Within the Services occupations in Weedsport, the most male-oriented occupations are Security & Protection (100.0%), Firefighting & Prevention (100.0%), and Law Enforcement (100.0%), while the most female-oriented occupations are Personal Care & Service (94.4%), Cleaning & Maintenance (87.0%), and Healthcare Support (71.9%).
| Occupation | Male | Female |
| Healthcare Support | 9 (28.1%) | 23 (71.9%) |
| Security & Protection | 35 (100.0%) | 0 (0.0%) |
| Firefighting & Prevention | 10 (100.0%) | 0 (0.0%) |
| Law Enforcement | 25 (100.0%) | 0 (0.0%) |
| Food Preparation & Serving | 9 (45.0%) | 11 (55.0%) |
| Cleaning & Maintenance | 3 (13.0%) | 20 (87.0%) |
| Personal Care & Service | 2 (5.6%) | 34 (94.4%) |
| Total (Category) | 58 (39.7%) | 88 (60.3%) |
| Total (Overall) | 424 (49.8%) | 427 (50.2%) |
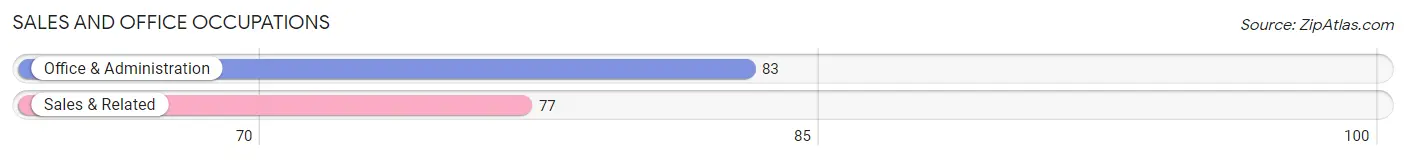
Sales and Office Occupations
The most common Sales and Office occupations in Weedsport are Office & Administration (83 | 9.8%), and Sales & Related (77 | 9.0%).
Sales and Office Occupations by Sex
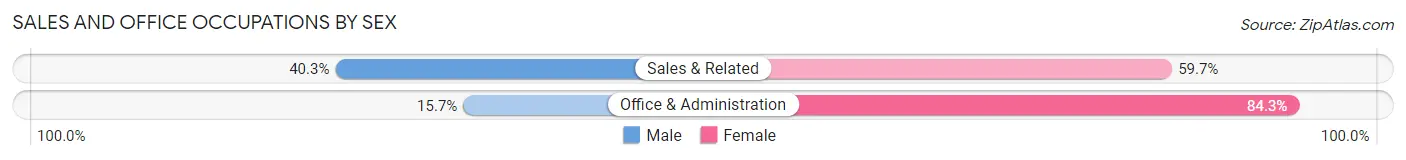
| Occupation | Male | Female |
| Sales & Related | 31 (40.3%) | 46 (59.7%) |
| Office & Administration | 13 (15.7%) | 70 (84.3%) |
| Total (Category) | 44 (27.5%) | 116 (72.5%) |
| Total (Overall) | 424 (49.8%) | 427 (50.2%) |
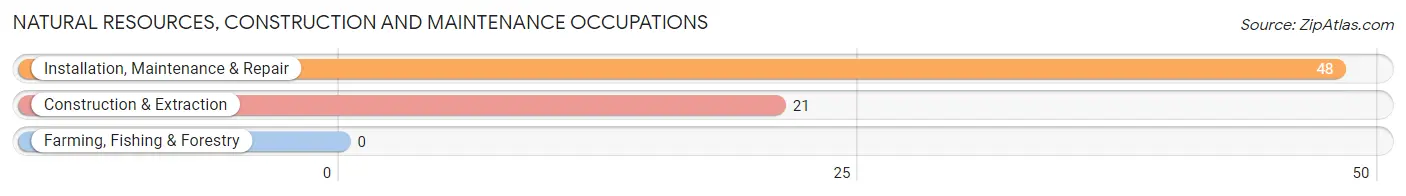
Natural Resources, Construction and Maintenance Occupations
The most common Natural Resources, Construction and Maintenance occupations in Weedsport are Installation, Maintenance & Repair (48 | 5.6%), and Construction & Extraction (21 | 2.5%).
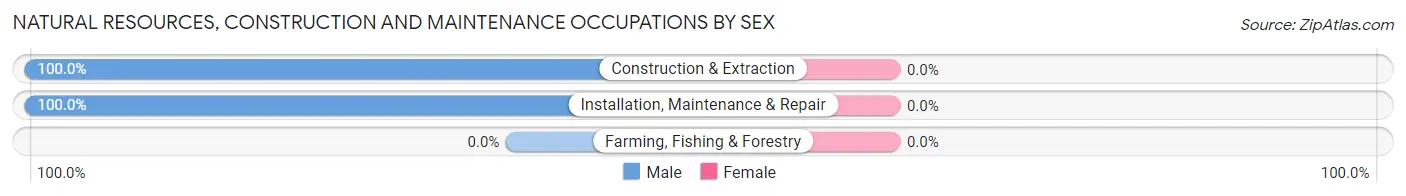
Natural Resources, Construction and Maintenance Occupations by Sex
| Occupation | Male | Female |
| Farming, Fishing & Forestry | 0 (0.0%) | 0 (0.0%) |
| Construction & Extraction | 21 (100.0%) | 0 (0.0%) |
| Installation, Maintenance & Repair | 48 (100.0%) | 0 (0.0%) |
| Total (Category) | 69 (100.0%) | 0 (0.0%) |
| Total (Overall) | 424 (49.8%) | 427 (50.2%) |
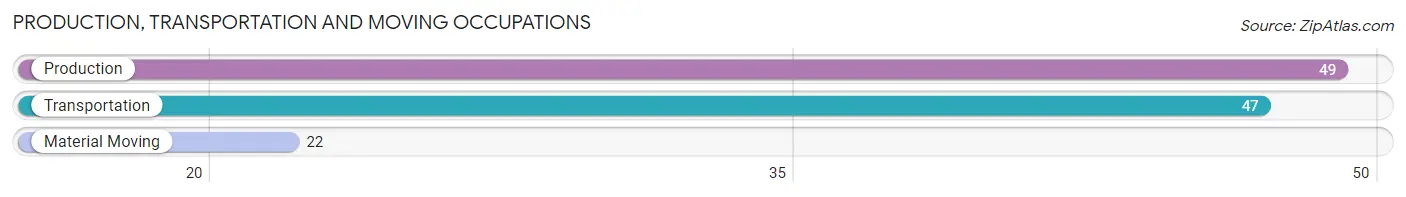
Production, Transportation and Moving Occupations
The most common Production, Transportation and Moving occupations in Weedsport are Production (49 | 5.8%), Transportation (47 | 5.5%), and Material Moving (22 | 2.6%).
Production, Transportation and Moving Occupations by Sex
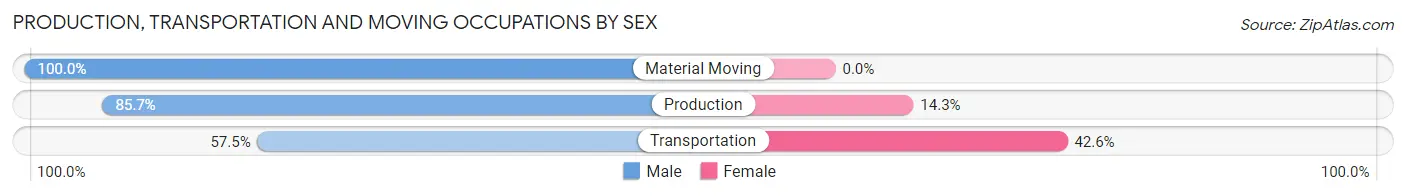
| Occupation | Male | Female |
| Production | 42 (85.7%) | 7 (14.3%) |
| Transportation | 27 (57.5%) | 20 (42.5%) |
| Material Moving | 22 (100.0%) | 0 (0.0%) |
| Total (Category) | 91 (77.1%) | 27 (22.9%) |
| Total (Overall) | 424 (49.8%) | 427 (50.2%) |
Employment Industries by Sex in Weedsport
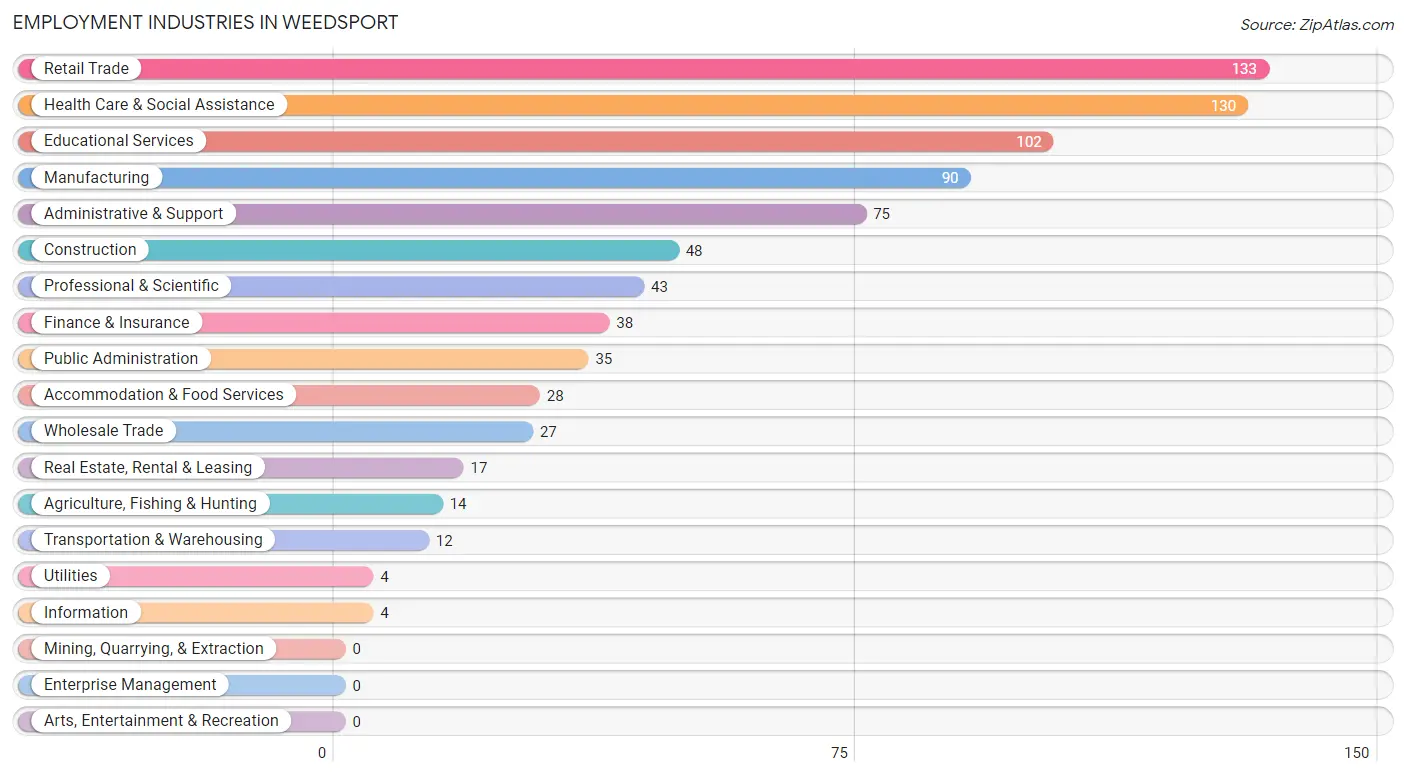
Employment Industries in Weedsport
The major employment industries in Weedsport include Retail Trade (133 | 15.6%), Health Care & Social Assistance (130 | 15.3%), Educational Services (102 | 12.0%), Manufacturing (90 | 10.6%), and Administrative & Support (75 | 8.8%).
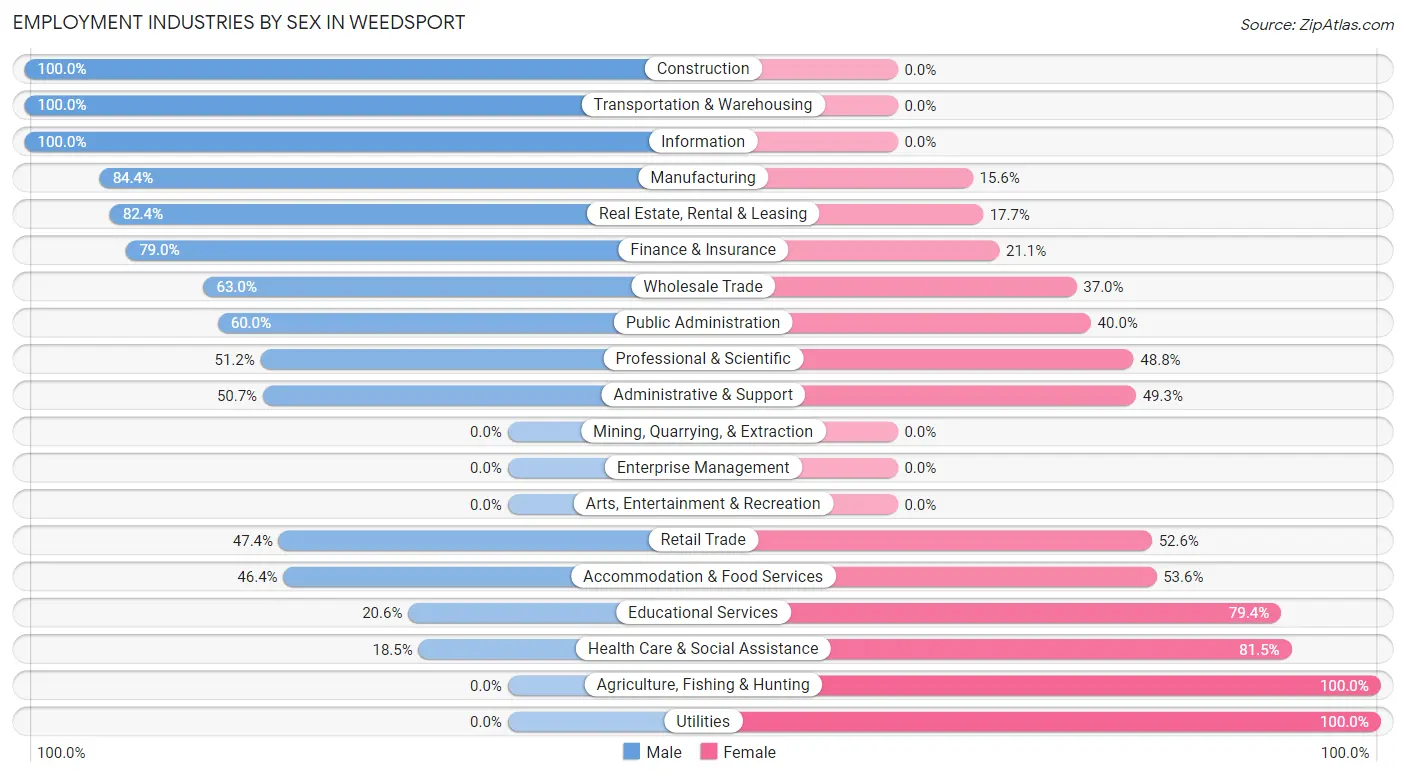
Employment Industries by Sex in Weedsport
The Weedsport industries that see more men than women are Construction (100.0%), Transportation & Warehousing (100.0%), and Information (100.0%), whereas the industries that tend to have a higher number of women are Agriculture, Fishing & Hunting (100.0%), Utilities (100.0%), and Health Care & Social Assistance (81.5%).
| Industry | Male | Female |
| Agriculture, Fishing & Hunting | 0 (0.0%) | 14 (100.0%) |
| Mining, Quarrying, & Extraction | 0 (0.0%) | 0 (0.0%) |
| Construction | 48 (100.0%) | 0 (0.0%) |
| Manufacturing | 76 (84.4%) | 14 (15.6%) |
| Wholesale Trade | 17 (63.0%) | 10 (37.0%) |
| Retail Trade | 63 (47.4%) | 70 (52.6%) |
| Transportation & Warehousing | 12 (100.0%) | 0 (0.0%) |
| Utilities | 0 (0.0%) | 4 (100.0%) |
| Information | 4 (100.0%) | 0 (0.0%) |
| Finance & Insurance | 30 (78.9%) | 8 (21.0%) |
| Real Estate, Rental & Leasing | 14 (82.4%) | 3 (17.6%) |
| Professional & Scientific | 22 (51.2%) | 21 (48.8%) |
| Enterprise Management | 0 (0.0%) | 0 (0.0%) |
| Administrative & Support | 38 (50.7%) | 37 (49.3%) |
| Educational Services | 21 (20.6%) | 81 (79.4%) |
| Health Care & Social Assistance | 24 (18.5%) | 106 (81.5%) |
| Arts, Entertainment & Recreation | 0 (0.0%) | 0 (0.0%) |
| Accommodation & Food Services | 13 (46.4%) | 15 (53.6%) |
| Public Administration | 21 (60.0%) | 14 (40.0%) |
| Total | 424 (49.8%) | 427 (50.2%) |
Education in Weedsport
School Enrollment in Weedsport
The most common levels of schooling among the 320 students in Weedsport are high school (131 | 40.9%), middle school (74 | 23.1%), and elementary school (51 | 15.9%).
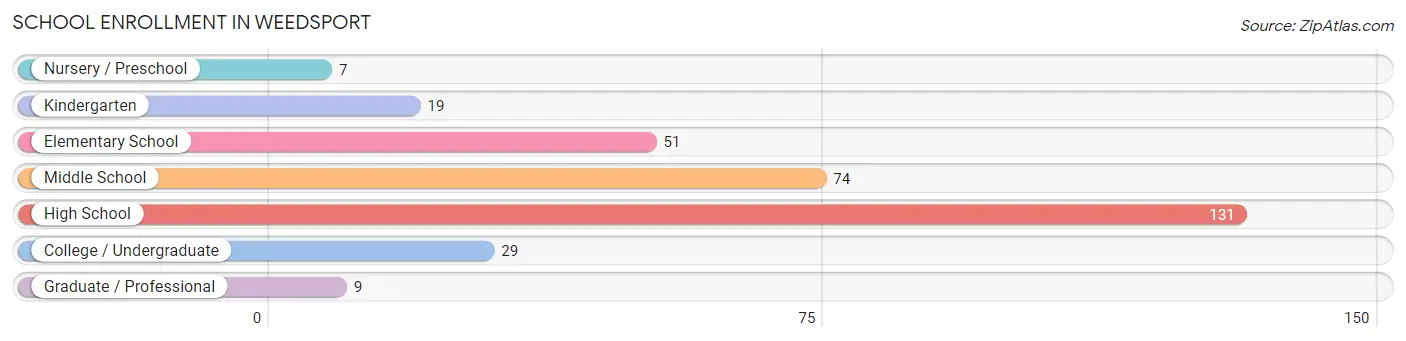
| School Level | # Students | % Students |
| Nursery / Preschool | 7 | 2.2% |
| Kindergarten | 19 | 5.9% |
| Elementary School | 51 | 15.9% |
| Middle School | 74 | 23.1% |
| High School | 131 | 40.9% |
| College / Undergraduate | 29 | 9.1% |
| Graduate / Professional | 9 | 2.8% |
| Total | 320 | 100.0% |
School Enrollment by Age by Funding Source in Weedsport
Out of a total of 320 students who are enrolled in schools in Weedsport, 12 (3.8%) attend a private institution, while the remaining 308 (96.2%) are enrolled in public schools. The age group of 20 to 24 year olds has the highest likelihood of being enrolled in private schools, with 6 (35.3% in the age bracket) enrolled. Conversely, the age group of 10 to 14 year olds has the lowest likelihood of being enrolled in a private school, with 126 (100.0% in the age bracket) attending a public institution.
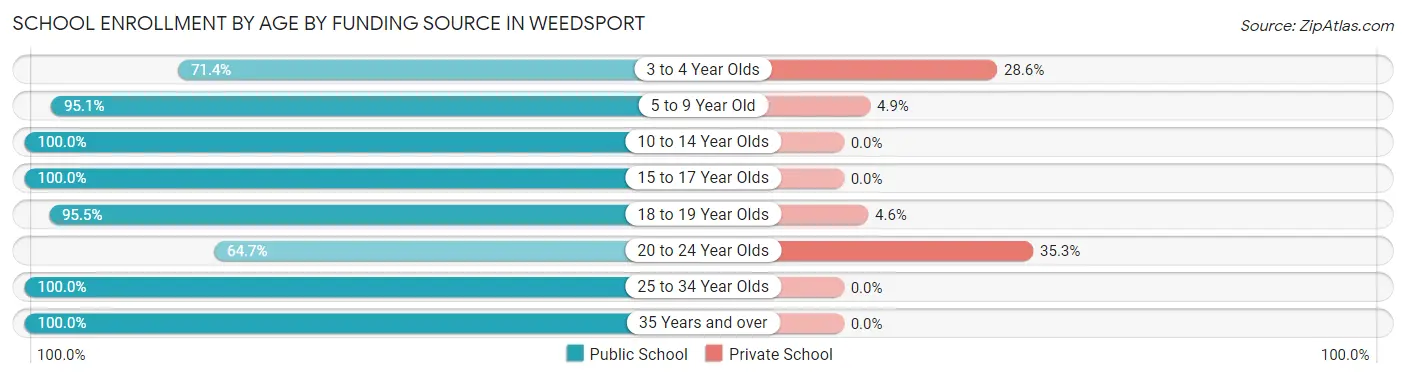
| Age Bracket | Public School | Private School |
| 3 to 4 Year Olds | 5 (71.4%) | 2 (28.6%) |
| 5 to 9 Year Old | 58 (95.1%) | 3 (4.9%) |
| 10 to 14 Year Olds | 126 (100.0%) | 0 (0.0%) |
| 15 to 17 Year Olds | 74 (100.0%) | 0 (0.0%) |
| 18 to 19 Year Olds | 21 (95.5%) | 1 (4.5%) |
| 20 to 24 Year Olds | 11 (64.7%) | 6 (35.3%) |
| 25 to 34 Year Olds | 8 (100.0%) | 0 (0.0%) |
| 35 Years and over | 5 (100.0%) | 0 (0.0%) |
| Total | 308 (96.3%) | 12 (3.8%) |
Educational Attainment by Field of Study in Weedsport
Education (92 | 22.2%), business (86 | 20.8%), science & technology (54 | 13.0%), engineering (49 | 11.8%), and psychology (42 | 10.1%) are the most common fields of study among 414 individuals in Weedsport who have obtained a bachelor's degree or higher.
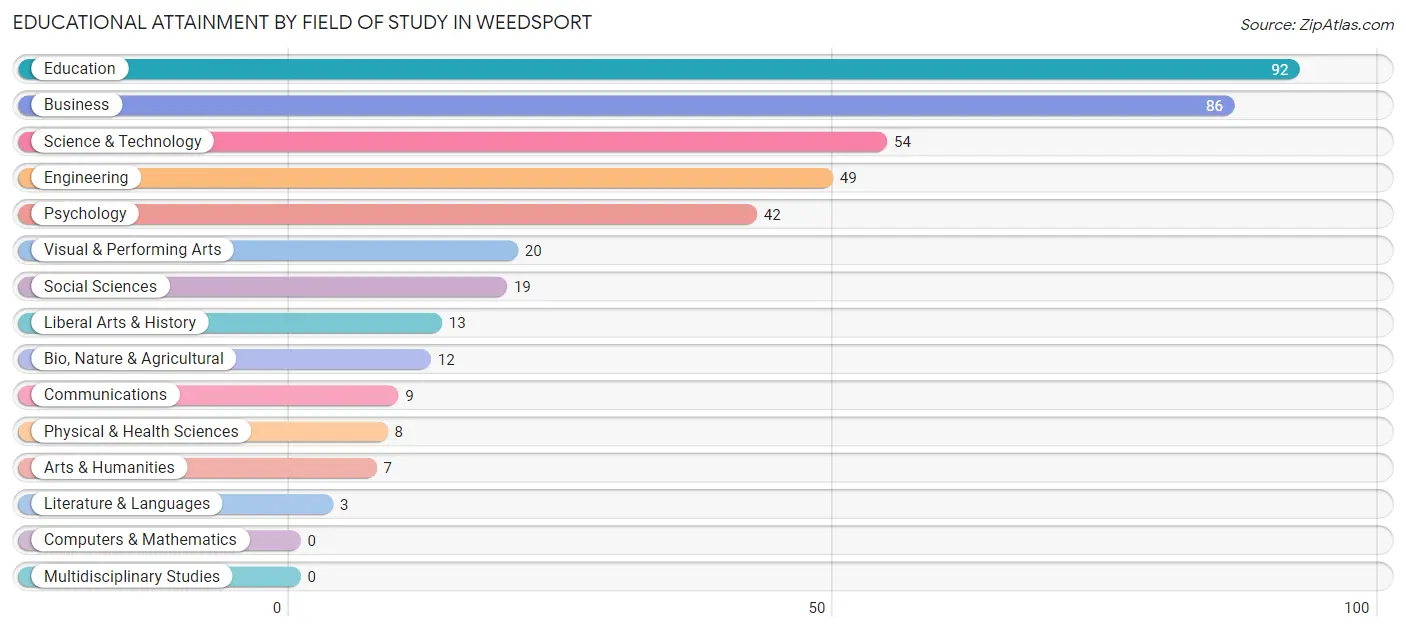
| Field of Study | # Graduates | % Graduates |
| Computers & Mathematics | 0 | 0.0% |
| Bio, Nature & Agricultural | 12 | 2.9% |
| Physical & Health Sciences | 8 | 1.9% |
| Psychology | 42 | 10.1% |
| Social Sciences | 19 | 4.6% |
| Engineering | 49 | 11.8% |
| Multidisciplinary Studies | 0 | 0.0% |
| Science & Technology | 54 | 13.0% |
| Business | 86 | 20.8% |
| Education | 92 | 22.2% |
| Literature & Languages | 3 | 0.7% |
| Liberal Arts & History | 13 | 3.1% |
| Visual & Performing Arts | 20 | 4.8% |
| Communications | 9 | 2.2% |
| Arts & Humanities | 7 | 1.7% |
| Total | 414 | 100.0% |
Transportation & Commute in Weedsport
Vehicle Availability by Sex in Weedsport
The most prevalent vehicle ownership categories in Weedsport are males with 2 vehicles (237, accounting for 57.1%) and females with 2 vehicles (260, making up 56.4%).
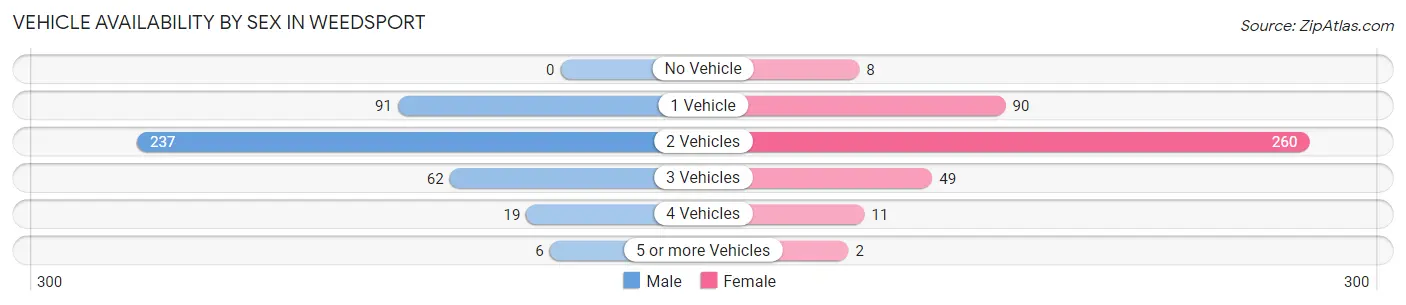
| Vehicles Available | Male | Female |
| No Vehicle | 0 (0.0%) | 8 (1.9%) |
| 1 Vehicle | 91 (21.9%) | 90 (21.4%) |
| 2 Vehicles | 237 (57.1%) | 260 (61.9%) |
| 3 Vehicles | 62 (14.9%) | 49 (11.7%) |
| 4 Vehicles | 19 (4.6%) | 11 (2.6%) |
| 5 or more Vehicles | 6 (1.5%) | 2 (0.5%) |
| Total | 415 (100.0%) | 420 (100.0%) |
Commute Time in Weedsport
The most frequently occuring commute durations in Weedsport are 15 to 19 minutes (163 commuters, 22.5%), 30 to 34 minutes (99 commuters, 13.7%), and 45 to 59 minutes (74 commuters, 10.2%).
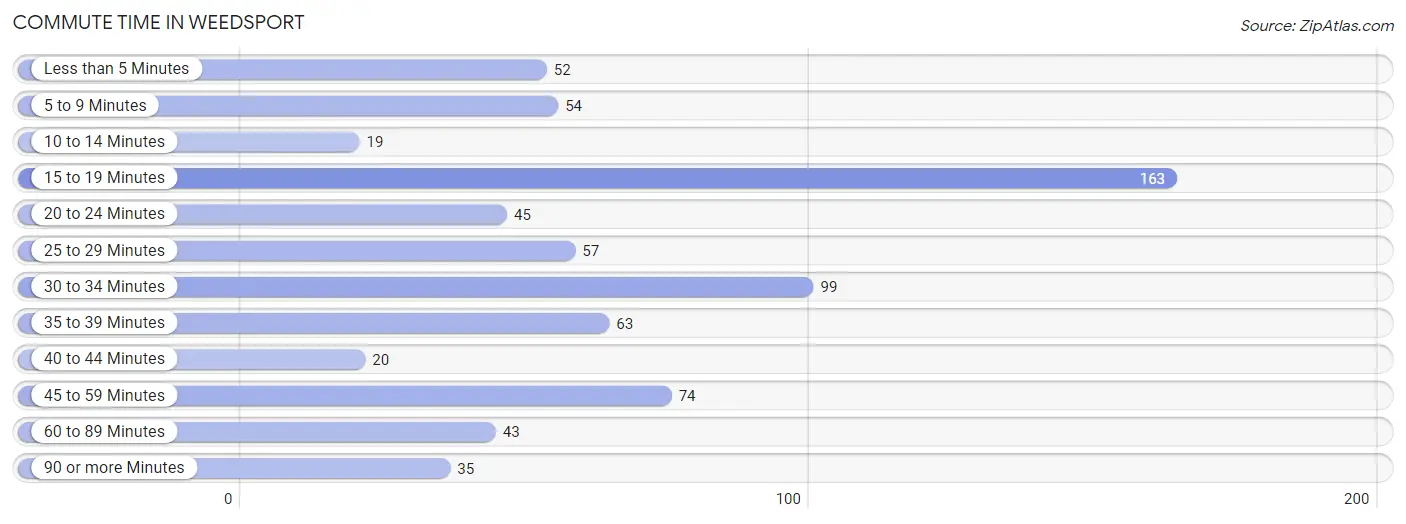
| Commute Time | # Commuters | % Commuters |
| Less than 5 Minutes | 52 | 7.2% |
| 5 to 9 Minutes | 54 | 7.5% |
| 10 to 14 Minutes | 19 | 2.6% |
| 15 to 19 Minutes | 163 | 22.5% |
| 20 to 24 Minutes | 45 | 6.2% |
| 25 to 29 Minutes | 57 | 7.9% |
| 30 to 34 Minutes | 99 | 13.7% |
| 35 to 39 Minutes | 63 | 8.7% |
| 40 to 44 Minutes | 20 | 2.8% |
| 45 to 59 Minutes | 74 | 10.2% |
| 60 to 89 Minutes | 43 | 5.9% |
| 90 or more Minutes | 35 | 4.8% |
Commute Time by Sex in Weedsport
The most common commute times in Weedsport are 15 to 19 minutes (68 commuters, 18.4%) for males and 15 to 19 minutes (95 commuters, 26.8%) for females.
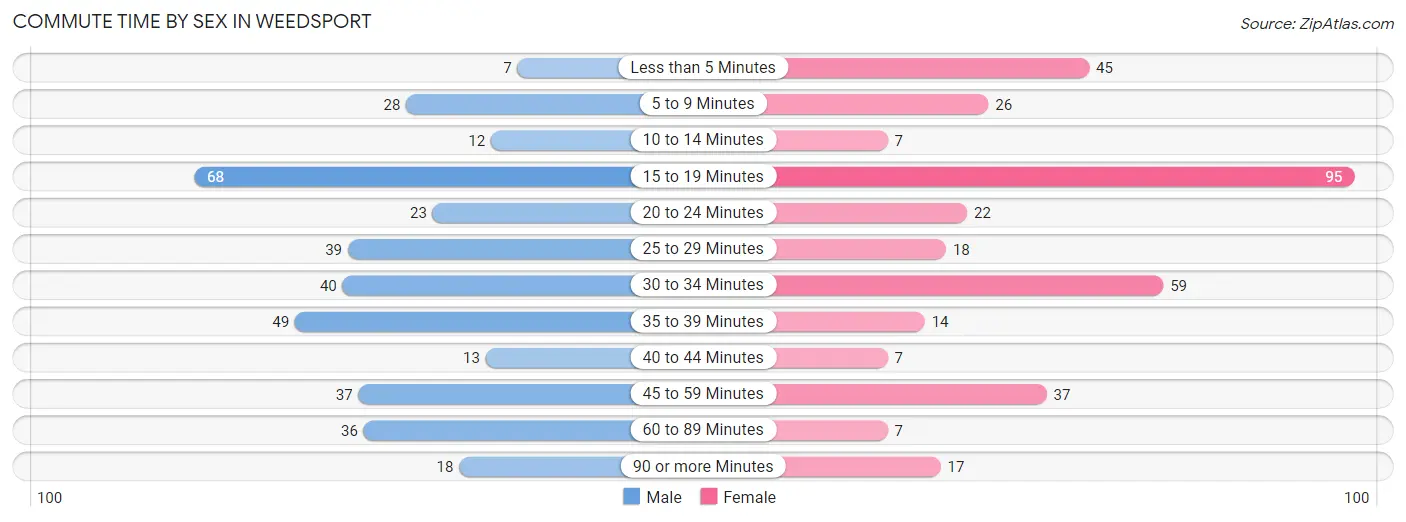
| Commute Time | Male | Female |
| Less than 5 Minutes | 7 (1.9%) | 45 (12.7%) |
| 5 to 9 Minutes | 28 (7.6%) | 26 (7.3%) |
| 10 to 14 Minutes | 12 (3.2%) | 7 (2.0%) |
| 15 to 19 Minutes | 68 (18.4%) | 95 (26.8%) |
| 20 to 24 Minutes | 23 (6.2%) | 22 (6.2%) |
| 25 to 29 Minutes | 39 (10.5%) | 18 (5.1%) |
| 30 to 34 Minutes | 40 (10.8%) | 59 (16.7%) |
| 35 to 39 Minutes | 49 (13.2%) | 14 (4.0%) |
| 40 to 44 Minutes | 13 (3.5%) | 7 (2.0%) |
| 45 to 59 Minutes | 37 (10.0%) | 37 (10.4%) |
| 60 to 89 Minutes | 36 (9.7%) | 7 (2.0%) |
| 90 or more Minutes | 18 (4.9%) | 17 (4.8%) |
Time of Departure to Work by Sex in Weedsport
The most frequent times of departure to work in Weedsport are 6:30 AM to 6:59 AM (56, 15.1%) for males and 7:30 AM to 7:59 AM (86, 24.3%) for females.
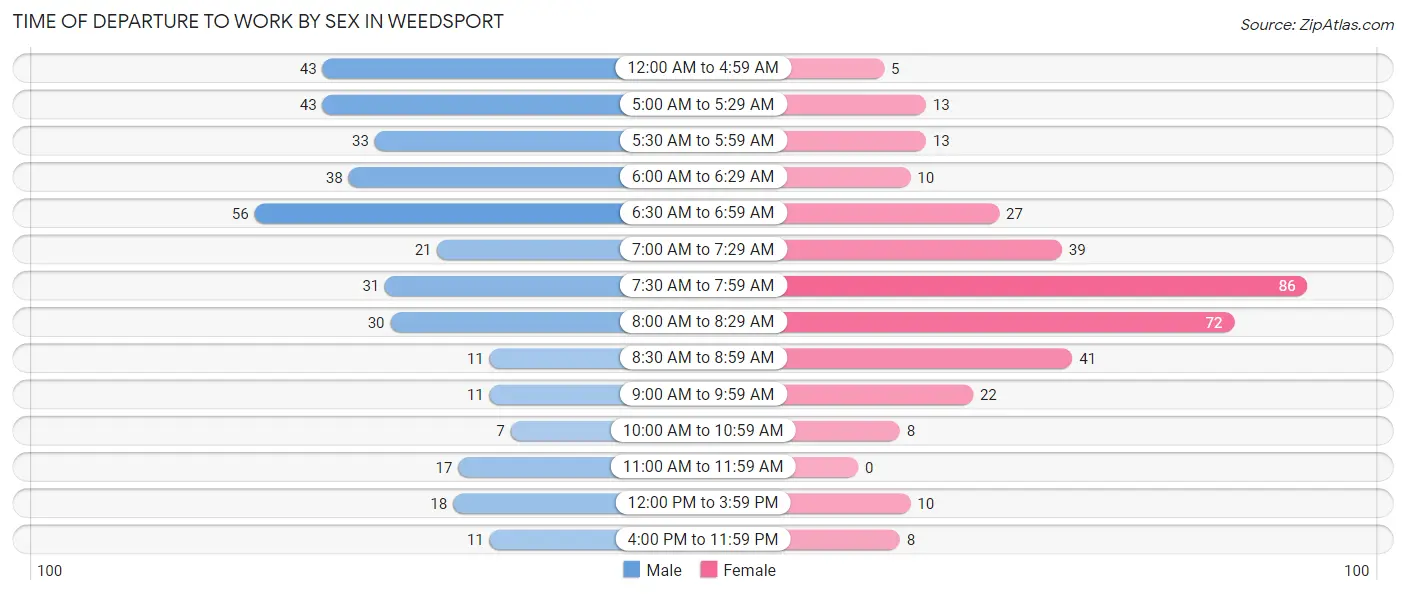
| Time of Departure | Male | Female |
| 12:00 AM to 4:59 AM | 43 (11.6%) | 5 (1.4%) |
| 5:00 AM to 5:29 AM | 43 (11.6%) | 13 (3.7%) |
| 5:30 AM to 5:59 AM | 33 (8.9%) | 13 (3.7%) |
| 6:00 AM to 6:29 AM | 38 (10.3%) | 10 (2.8%) |
| 6:30 AM to 6:59 AM | 56 (15.1%) | 27 (7.6%) |
| 7:00 AM to 7:29 AM | 21 (5.7%) | 39 (11.0%) |
| 7:30 AM to 7:59 AM | 31 (8.4%) | 86 (24.3%) |
| 8:00 AM to 8:29 AM | 30 (8.1%) | 72 (20.3%) |
| 8:30 AM to 8:59 AM | 11 (3.0%) | 41 (11.6%) |
| 9:00 AM to 9:59 AM | 11 (3.0%) | 22 (6.2%) |
| 10:00 AM to 10:59 AM | 7 (1.9%) | 8 (2.3%) |
| 11:00 AM to 11:59 AM | 17 (4.6%) | 0 (0.0%) |
| 12:00 PM to 3:59 PM | 18 (4.9%) | 10 (2.8%) |
| 4:00 PM to 11:59 PM | 11 (3.0%) | 8 (2.3%) |
| Total | 370 (100.0%) | 354 (100.0%) |
Housing Occupancy in Weedsport
Occupancy by Ownership in Weedsport
Of the total 850 dwellings in Weedsport, owner-occupied units account for 553 (65.1%), while renter-occupied units make up 297 (34.9%).
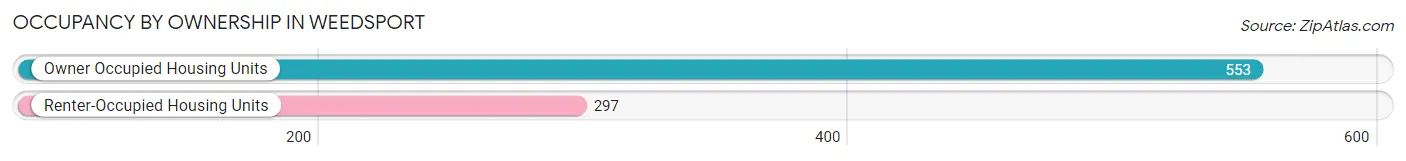
| Occupancy | # Housing Units | % Housing Units |
| Owner Occupied Housing Units | 553 | 65.1% |
| Renter-Occupied Housing Units | 297 | 34.9% |
| Total Occupied Housing Units | 850 | 100.0% |
Occupancy by Household Size in Weedsport
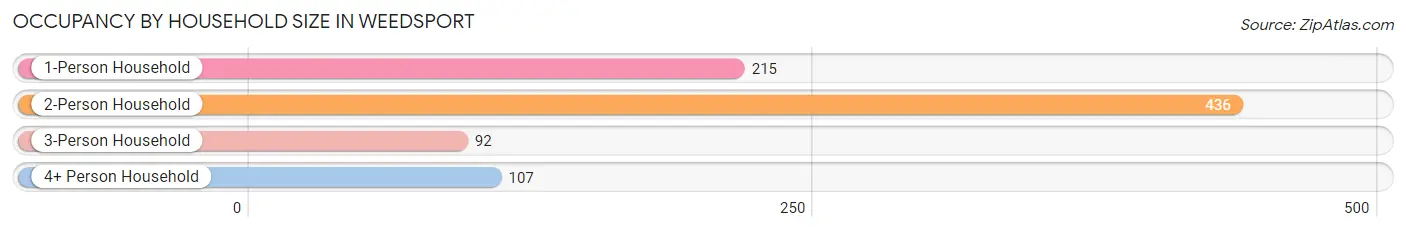
| Household Size | # Housing Units | % Housing Units |
| 1-Person Household | 215 | 25.3% |
| 2-Person Household | 436 | 51.3% |
| 3-Person Household | 92 | 10.8% |
| 4+ Person Household | 107 | 12.6% |
| Total Housing Units | 850 | 100.0% |
Occupancy by Ownership by Household Size in Weedsport
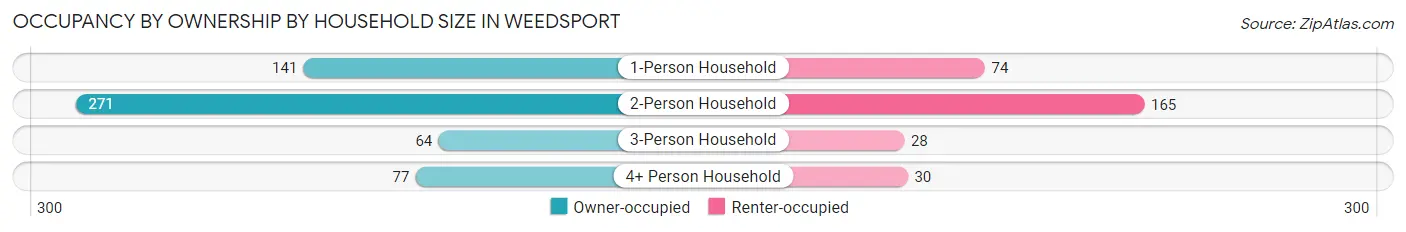
| Household Size | Owner-occupied | Renter-occupied |
| 1-Person Household | 141 (65.6%) | 74 (34.4%) |
| 2-Person Household | 271 (62.2%) | 165 (37.8%) |
| 3-Person Household | 64 (69.6%) | 28 (30.4%) |
| 4+ Person Household | 77 (72.0%) | 30 (28.0%) |
| Total Housing Units | 553 (65.1%) | 297 (34.9%) |
Occupancy by Educational Attainment in Weedsport
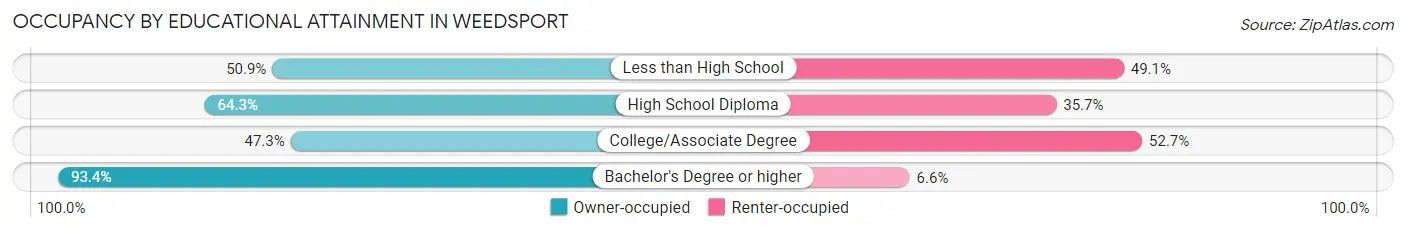
| Household Size | Owner-occupied | Renter-occupied |
| Less than High School | 28 (50.9%) | 27 (49.1%) |
| High School Diploma | 144 (64.3%) | 80 (35.7%) |
| College/Associate Degree | 156 (47.3%) | 174 (52.7%) |
| Bachelor's Degree or higher | 225 (93.4%) | 16 (6.6%) |
Occupancy by Age of Householder in Weedsport
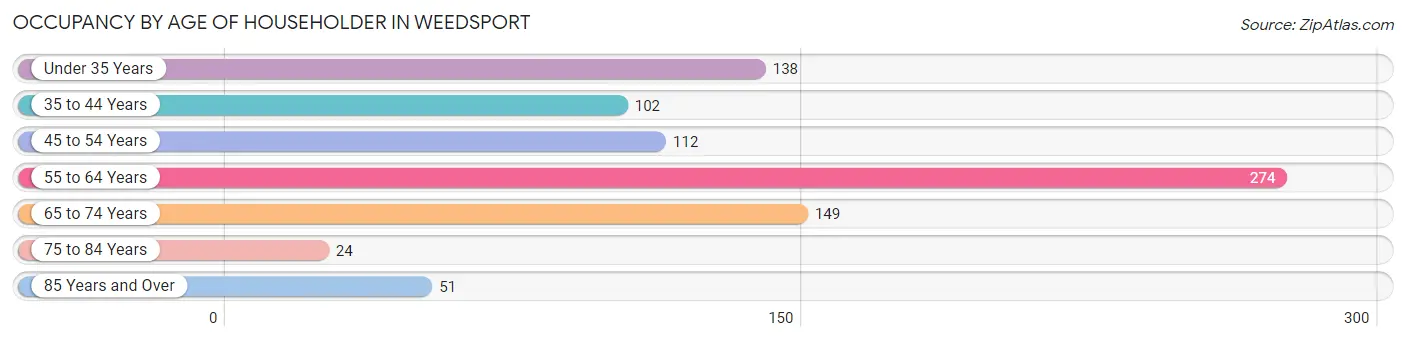
| Age Bracket | # Households | % Households |
| Under 35 Years | 138 | 16.2% |
| 35 to 44 Years | 102 | 12.0% |
| 45 to 54 Years | 112 | 13.2% |
| 55 to 64 Years | 274 | 32.2% |
| 65 to 74 Years | 149 | 17.5% |
| 75 to 84 Years | 24 | 2.8% |
| 85 Years and Over | 51 | 6.0% |
| Total | 850 | 100.0% |
Housing Finances in Weedsport
Median Income by Occupancy in Weedsport
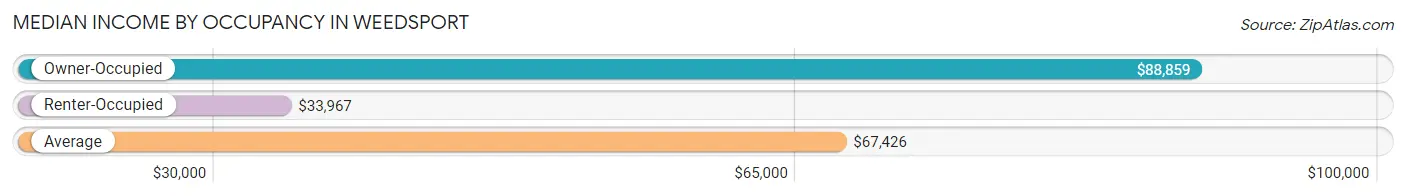
| Occupancy Type | # Households | Median Income |
| Owner-Occupied | 553 (65.1%) | $88,859 |
| Renter-Occupied | 297 (34.9%) | $33,967 |
| Average | 850 (100.0%) | $67,426 |
Occupancy by Householder Income Bracket in Weedsport
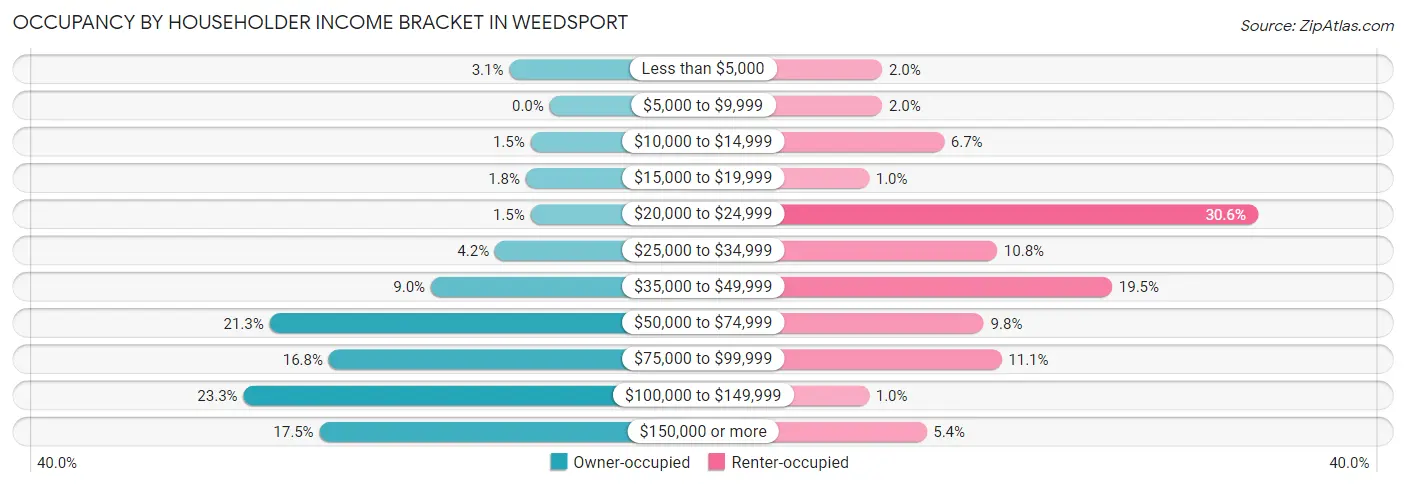
| Income Bracket | Owner-occupied | Renter-occupied |
| Less than $5,000 | 17 (3.1%) | 6 (2.0%) |
| $5,000 to $9,999 | 0 (0.0%) | 6 (2.0%) |
| $10,000 to $14,999 | 8 (1.5%) | 20 (6.7%) |
| $15,000 to $19,999 | 10 (1.8%) | 3 (1.0%) |
| $20,000 to $24,999 | 8 (1.5%) | 91 (30.6%) |
| $25,000 to $34,999 | 23 (4.2%) | 32 (10.8%) |
| $35,000 to $49,999 | 50 (9.0%) | 58 (19.5%) |
| $50,000 to $74,999 | 118 (21.3%) | 29 (9.8%) |
| $75,000 to $99,999 | 93 (16.8%) | 33 (11.1%) |
| $100,000 to $149,999 | 129 (23.3%) | 3 (1.0%) |
| $150,000 or more | 97 (17.5%) | 16 (5.4%) |
| Total | 553 (100.0%) | 297 (100.0%) |
Monthly Housing Cost Tiers in Weedsport
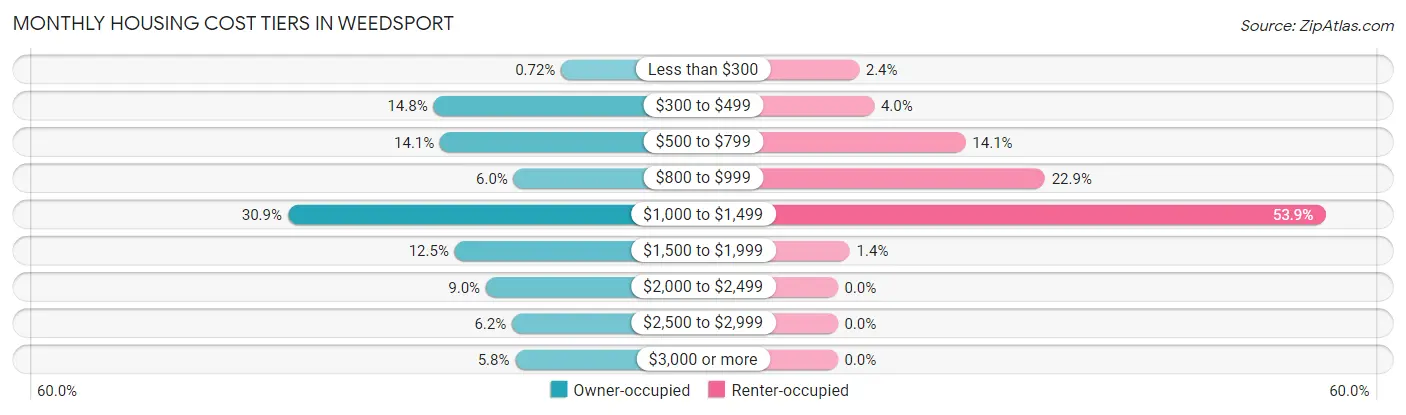
| Monthly Cost | Owner-occupied | Renter-occupied |
| Less than $300 | 4 (0.7%) | 7 (2.4%) |
| $300 to $499 | 82 (14.8%) | 12 (4.0%) |
| $500 to $799 | 78 (14.1%) | 42 (14.1%) |
| $800 to $999 | 33 (6.0%) | 68 (22.9%) |
| $1,000 to $1,499 | 171 (30.9%) | 160 (53.9%) |
| $1,500 to $1,999 | 69 (12.5%) | 4 (1.3%) |
| $2,000 to $2,499 | 50 (9.0%) | 0 (0.0%) |
| $2,500 to $2,999 | 34 (6.1%) | 0 (0.0%) |
| $3,000 or more | 32 (5.8%) | 0 (0.0%) |
| Total | 553 (100.0%) | 297 (100.0%) |
Physical Housing Characteristics in Weedsport
Housing Structures in Weedsport
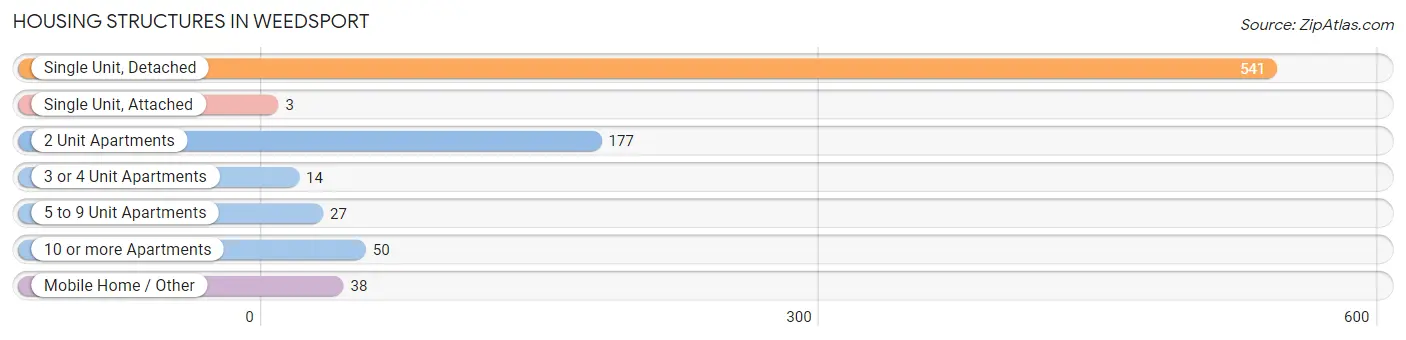
| Structure Type | # Housing Units | % Housing Units |
| Single Unit, Detached | 541 | 63.6% |
| Single Unit, Attached | 3 | 0.4% |
| 2 Unit Apartments | 177 | 20.8% |
| 3 or 4 Unit Apartments | 14 | 1.7% |
| 5 to 9 Unit Apartments | 27 | 3.2% |
| 10 or more Apartments | 50 | 5.9% |
| Mobile Home / Other | 38 | 4.5% |
| Total | 850 | 100.0% |
Housing Structures by Occupancy in Weedsport
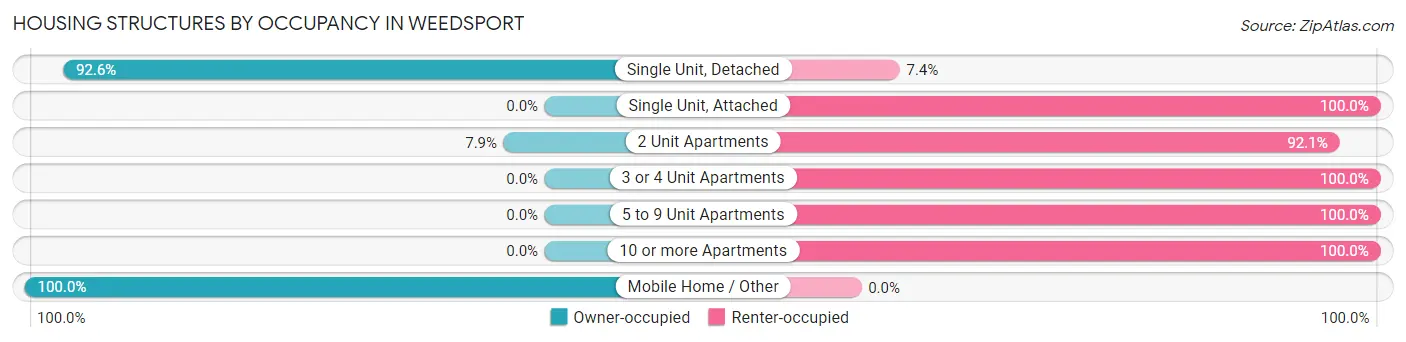
| Structure Type | Owner-occupied | Renter-occupied |
| Single Unit, Detached | 501 (92.6%) | 40 (7.4%) |
| Single Unit, Attached | 0 (0.0%) | 3 (100.0%) |
| 2 Unit Apartments | 14 (7.9%) | 163 (92.1%) |
| 3 or 4 Unit Apartments | 0 (0.0%) | 14 (100.0%) |
| 5 to 9 Unit Apartments | 0 (0.0%) | 27 (100.0%) |
| 10 or more Apartments | 0 (0.0%) | 50 (100.0%) |
| Mobile Home / Other | 38 (100.0%) | 0 (0.0%) |
| Total | 553 (65.1%) | 297 (34.9%) |
Housing Structures by Number of Rooms in Weedsport
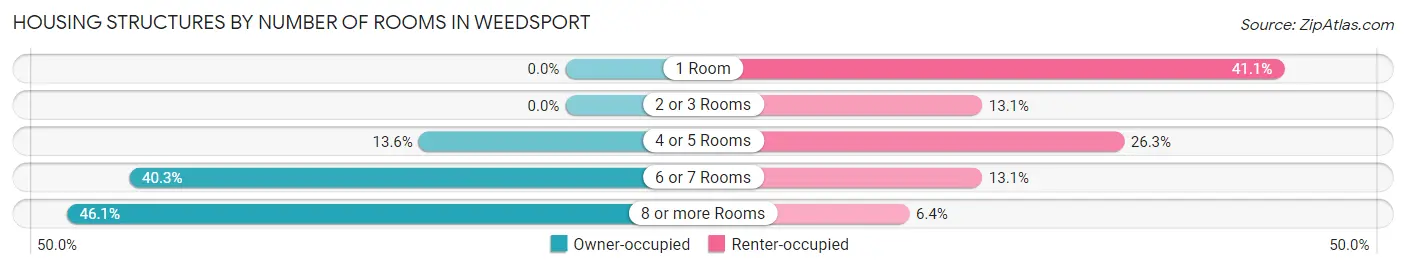
| Number of Rooms | Owner-occupied | Renter-occupied |
| 1 Room | 0 (0.0%) | 122 (41.1%) |
| 2 or 3 Rooms | 0 (0.0%) | 39 (13.1%) |
| 4 or 5 Rooms | 75 (13.6%) | 78 (26.3%) |
| 6 or 7 Rooms | 223 (40.3%) | 39 (13.1%) |
| 8 or more Rooms | 255 (46.1%) | 19 (6.4%) |
| Total | 553 (100.0%) | 297 (100.0%) |
Housing Structure by Heating Type in Weedsport
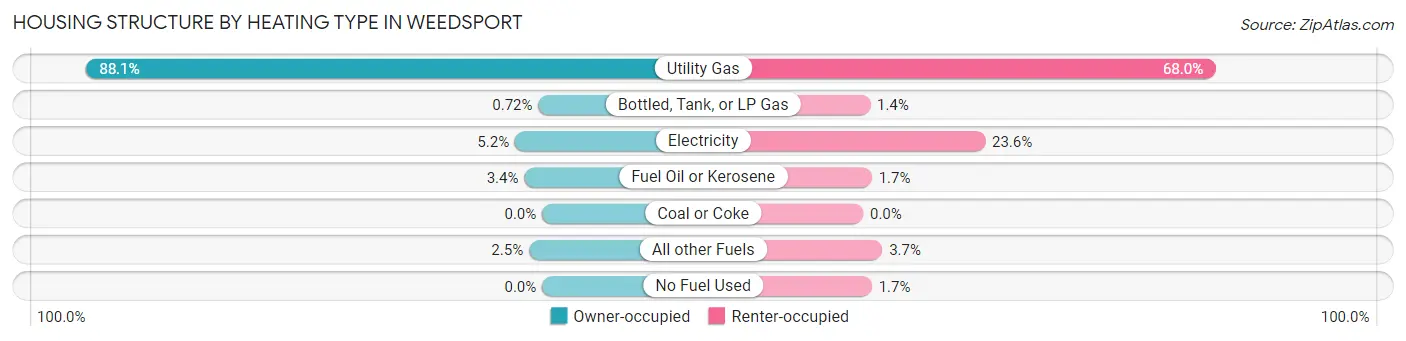
| Heating Type | Owner-occupied | Renter-occupied |
| Utility Gas | 487 (88.1%) | 202 (68.0%) |
| Bottled, Tank, or LP Gas | 4 (0.7%) | 4 (1.3%) |
| Electricity | 29 (5.2%) | 70 (23.6%) |
| Fuel Oil or Kerosene | 19 (3.4%) | 5 (1.7%) |
| Coal or Coke | 0 (0.0%) | 0 (0.0%) |
| All other Fuels | 14 (2.5%) | 11 (3.7%) |
| No Fuel Used | 0 (0.0%) | 5 (1.7%) |
| Total | 553 (100.0%) | 297 (100.0%) |
Household Vehicle Usage in Weedsport
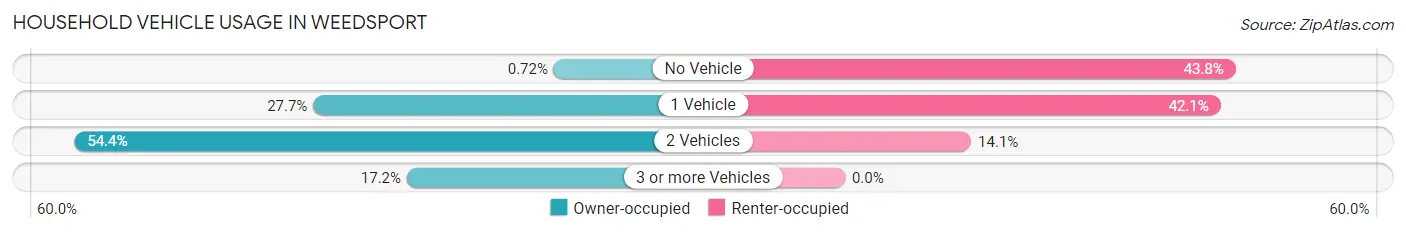
| Vehicles per Household | Owner-occupied | Renter-occupied |
| No Vehicle | 4 (0.7%) | 130 (43.8%) |
| 1 Vehicle | 153 (27.7%) | 125 (42.1%) |
| 2 Vehicles | 301 (54.4%) | 42 (14.1%) |
| 3 or more Vehicles | 95 (17.2%) | 0 (0.0%) |
| Total | 553 (100.0%) | 297 (100.0%) |
Real Estate & Mortgages in Weedsport
Real Estate and Mortgage Overview in Weedsport
| Characteristic | Without Mortgage | With Mortgage |
| Housing Units | 179 | 374 |
| Median Property Value | $117,600 | $163,700 |
| Median Household Income | $51,563 | $81 |
| Monthly Housing Costs | $540 | $32 |
| Real Estate Taxes | $2,763 | $38 |
Property Value by Mortgage Status in Weedsport
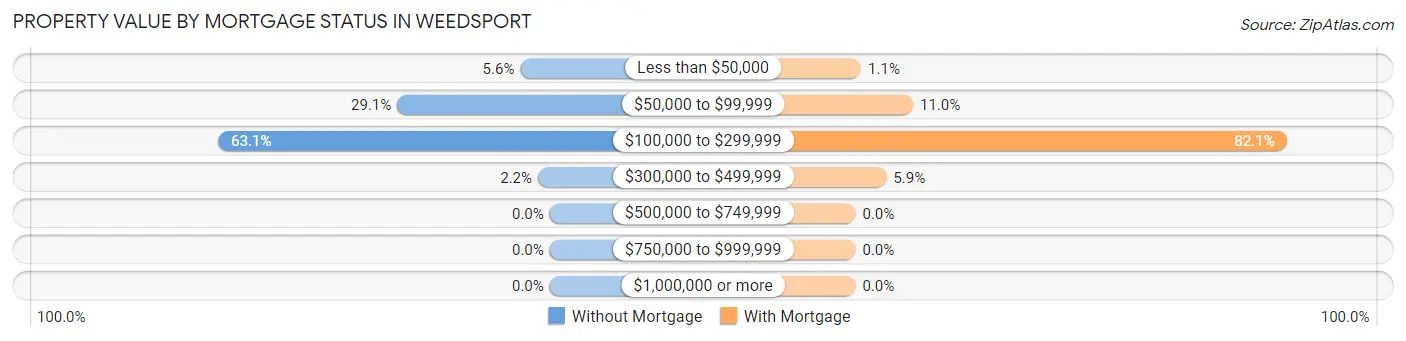
| Property Value | Without Mortgage | With Mortgage |
| Less than $50,000 | 10 (5.6%) | 4 (1.1%) |
| $50,000 to $99,999 | 52 (29.0%) | 41 (11.0%) |
| $100,000 to $299,999 | 113 (63.1%) | 307 (82.1%) |
| $300,000 to $499,999 | 4 (2.2%) | 22 (5.9%) |
| $500,000 to $749,999 | 0 (0.0%) | 0 (0.0%) |
| $750,000 to $999,999 | 0 (0.0%) | 0 (0.0%) |
| $1,000,000 or more | 0 (0.0%) | 0 (0.0%) |
| Total | 179 (100.0%) | 374 (100.0%) |
Household Income by Mortgage Status in Weedsport
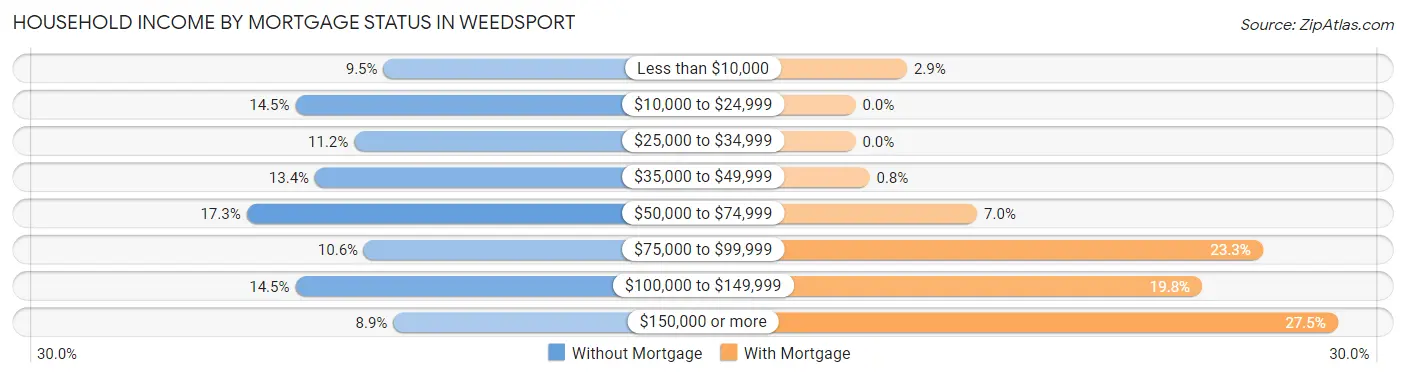
| Household Income | Without Mortgage | With Mortgage |
| Less than $10,000 | 17 (9.5%) | 11 (2.9%) |
| $10,000 to $24,999 | 26 (14.5%) | 0 (0.0%) |
| $25,000 to $34,999 | 20 (11.2%) | 0 (0.0%) |
| $35,000 to $49,999 | 24 (13.4%) | 3 (0.8%) |
| $50,000 to $74,999 | 31 (17.3%) | 26 (7.0%) |
| $75,000 to $99,999 | 19 (10.6%) | 87 (23.3%) |
| $100,000 to $149,999 | 26 (14.5%) | 74 (19.8%) |
| $150,000 or more | 16 (8.9%) | 103 (27.5%) |
| Total | 179 (100.0%) | 374 (100.0%) |
Property Value to Household Income Ratio in Weedsport
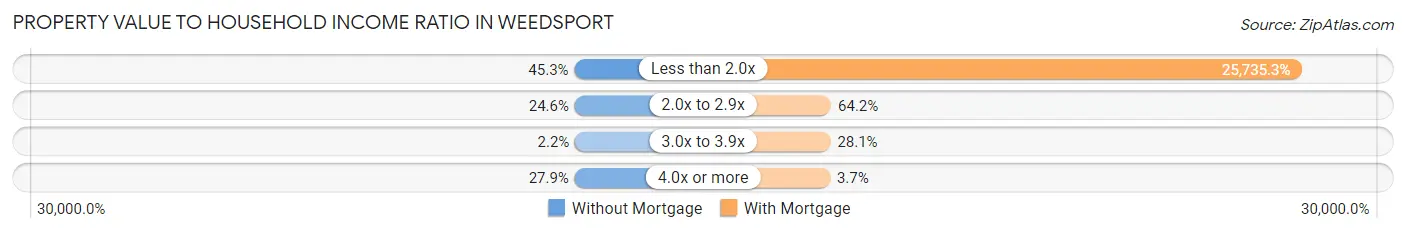
| Value-to-Income Ratio | Without Mortgage | With Mortgage |
| Less than 2.0x | 81 (45.3%) | 96,250 (25,735.3%) |
| 2.0x to 2.9x | 44 (24.6%) | 240 (64.2%) |
| 3.0x to 3.9x | 4 (2.2%) | 105 (28.1%) |
| 4.0x or more | 50 (27.9%) | 14 (3.7%) |
| Total | 179 (100.0%) | 374 (100.0%) |
Real Estate Taxes by Mortgage Status in Weedsport
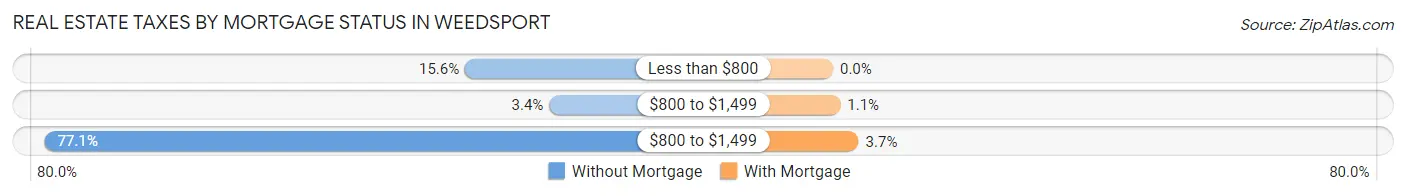
| Property Taxes | Without Mortgage | With Mortgage |
| Less than $800 | 28 (15.6%) | 0 (0.0%) |
| $800 to $1,499 | 6 (3.4%) | 4 (1.1%) |
| $800 to $1,499 | 138 (77.1%) | 14 (3.7%) |
| Total | 179 (100.0%) | 374 (100.0%) |
Health & Disability in Weedsport
Health Insurance Coverage by Age in Weedsport
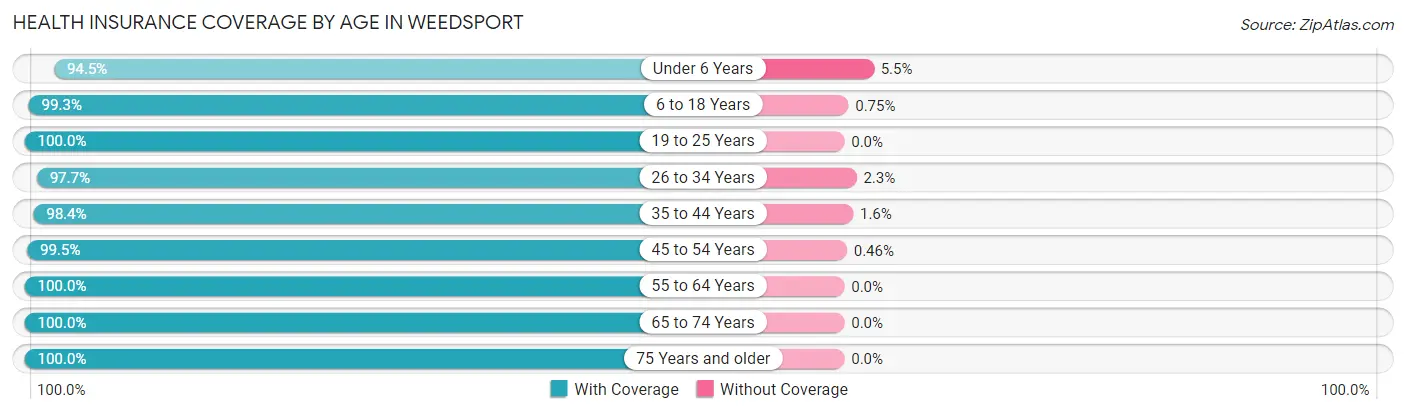
| Age Bracket | With Coverage | Without Coverage |
| Under 6 Years | 69 (94.5%) | 4 (5.5%) |
| 6 to 18 Years | 263 (99.3%) | 2 (0.7%) |
| 19 to 25 Years | 106 (100.0%) | 0 (0.0%) |
| 26 to 34 Years | 215 (97.7%) | 5 (2.3%) |
| 35 to 44 Years | 241 (98.4%) | 4 (1.6%) |
| 45 to 54 Years | 217 (99.5%) | 1 (0.5%) |
| 55 to 64 Years | 404 (100.0%) | 0 (0.0%) |
| 65 to 74 Years | 230 (100.0%) | 0 (0.0%) |
| 75 Years and older | 97 (100.0%) | 0 (0.0%) |
| Total | 1,842 (99.1%) | 16 (0.9%) |
Health Insurance Coverage by Citizenship Status in Weedsport
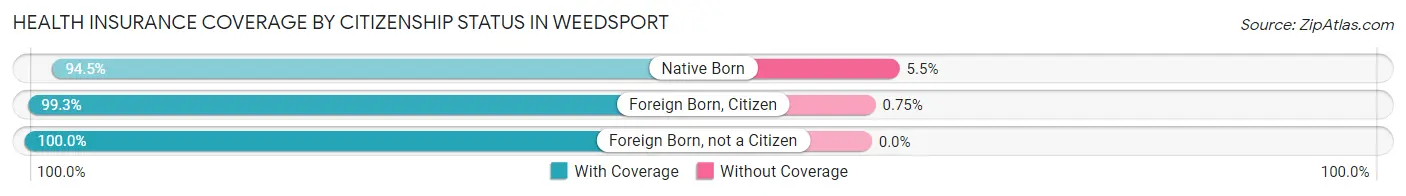
| Citizenship Status | With Coverage | Without Coverage |
| Native Born | 69 (94.5%) | 4 (5.5%) |
| Foreign Born, Citizen | 263 (99.3%) | 2 (0.7%) |
| Foreign Born, not a Citizen | 106 (100.0%) | 0 (0.0%) |
Health Insurance Coverage by Household Income in Weedsport
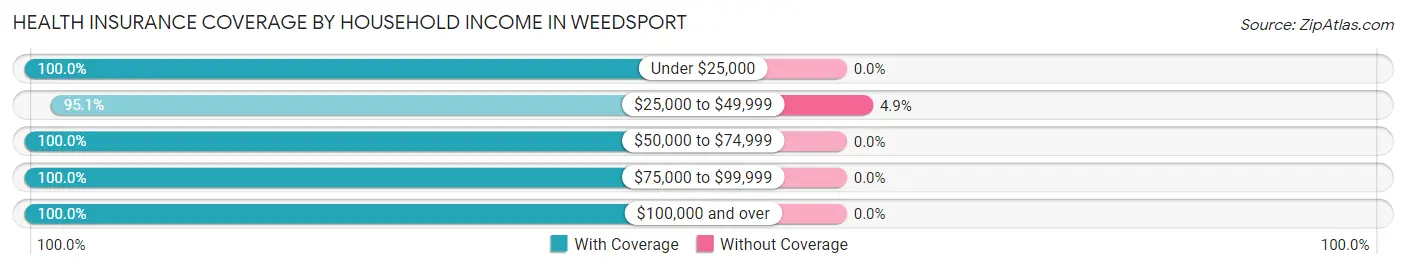
| Household Income | With Coverage | Without Coverage |
| Under $25,000 | 286 (100.0%) | 0 (0.0%) |
| $25,000 to $49,999 | 310 (95.1%) | 16 (4.9%) |
| $50,000 to $74,999 | 289 (100.0%) | 0 (0.0%) |
| $75,000 to $99,999 | 308 (100.0%) | 0 (0.0%) |
| $100,000 and over | 612 (100.0%) | 0 (0.0%) |
Public vs Private Health Insurance Coverage by Age in Weedsport
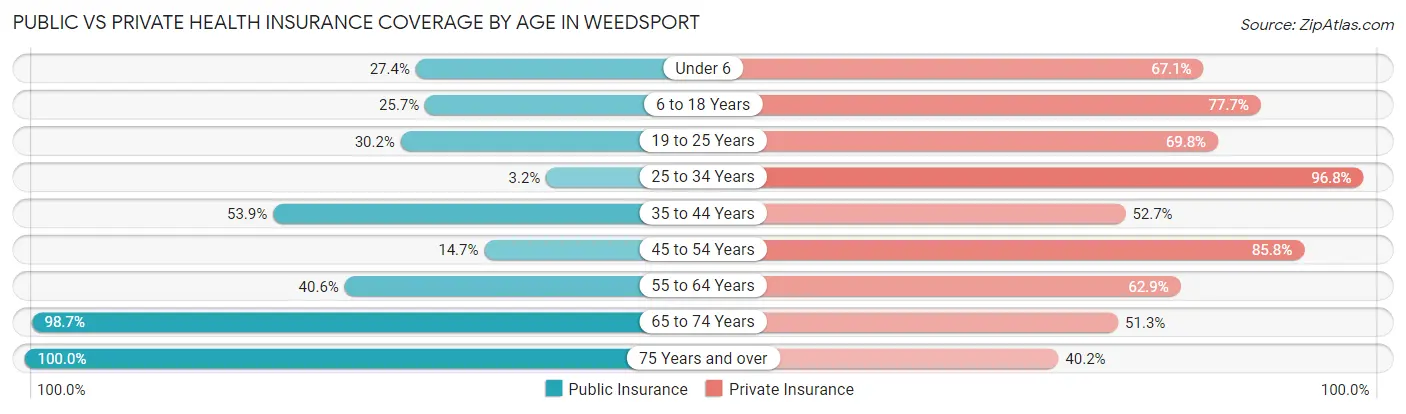
| Age Bracket | Public Insurance | Private Insurance |
| Under 6 | 20 (27.4%) | 49 (67.1%) |
| 6 to 18 Years | 68 (25.7%) | 206 (77.7%) |
| 19 to 25 Years | 32 (30.2%) | 74 (69.8%) |
| 25 to 34 Years | 7 (3.2%) | 213 (96.8%) |
| 35 to 44 Years | 132 (53.9%) | 129 (52.6%) |
| 45 to 54 Years | 32 (14.7%) | 187 (85.8%) |
| 55 to 64 Years | 164 (40.6%) | 254 (62.9%) |
| 65 to 74 Years | 227 (98.7%) | 118 (51.3%) |
| 75 Years and over | 97 (100.0%) | 39 (40.2%) |
| Total | 779 (41.9%) | 1,269 (68.3%) |
Disability Status by Sex by Age in Weedsport
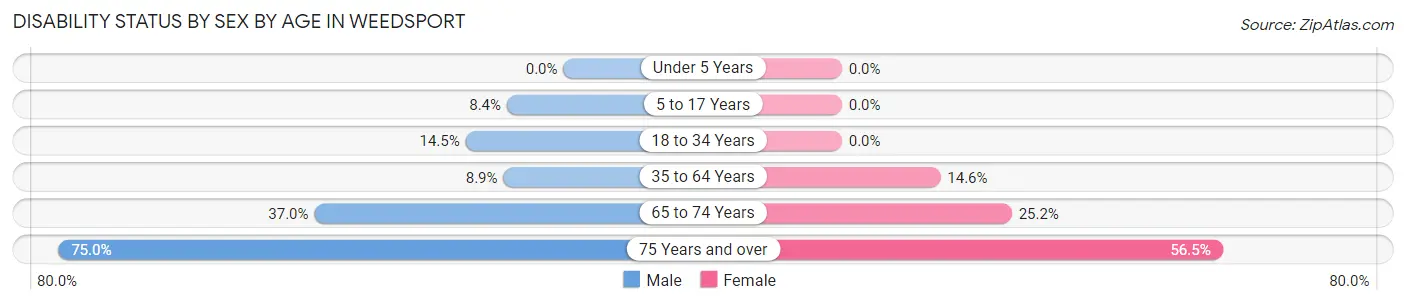
| Age Bracket | Male | Female |
| Under 5 Years | 0 (0.0%) | 0 (0.0%) |
| 5 to 17 Years | 12 (8.4%) | 0 (0.0%) |
| 18 to 34 Years | 26 (14.5%) | 0 (0.0%) |
| 35 to 64 Years | 45 (8.9%) | 53 (14.6%) |
| 65 to 74 Years | 44 (37.0%) | 28 (25.2%) |
| 75 Years and over | 21 (75.0%) | 39 (56.5%) |
Disability Class by Sex by Age in Weedsport
Disability Class: Hearing Difficulty
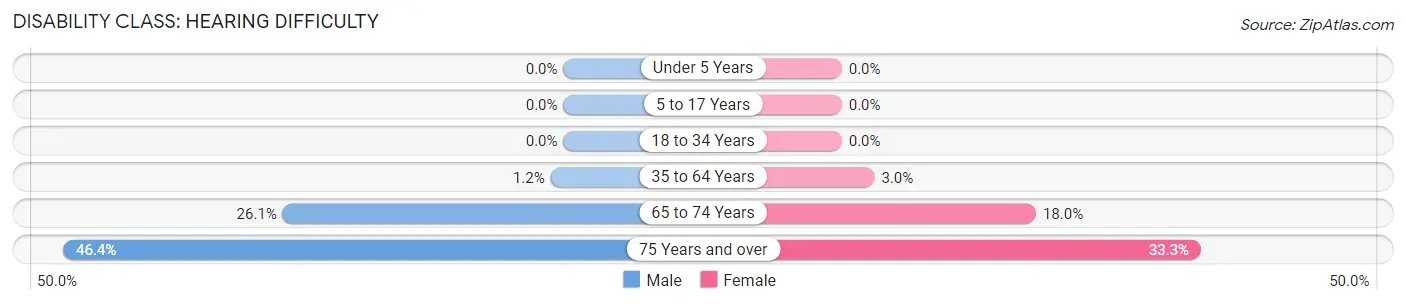
| Age Bracket | Male | Female |
| Under 5 Years | 0 (0.0%) | 0 (0.0%) |
| 5 to 17 Years | 0 (0.0%) | 0 (0.0%) |
| 18 to 34 Years | 0 (0.0%) | 0 (0.0%) |
| 35 to 64 Years | 6 (1.2%) | 11 (3.0%) |
| 65 to 74 Years | 31 (26.1%) | 20 (18.0%) |
| 75 Years and over | 13 (46.4%) | 23 (33.3%) |
Disability Class: Vision Difficulty
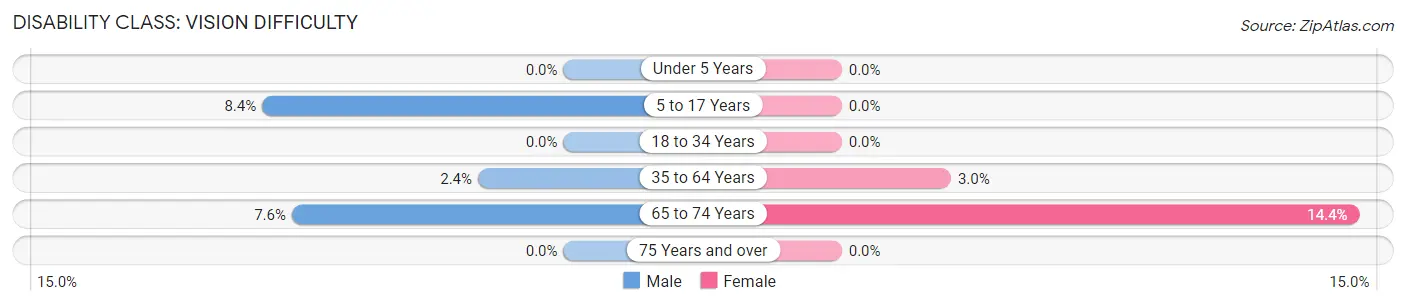
| Age Bracket | Male | Female |
| Under 5 Years | 0 (0.0%) | 0 (0.0%) |
| 5 to 17 Years | 12 (8.4%) | 0 (0.0%) |
| 18 to 34 Years | 0 (0.0%) | 0 (0.0%) |
| 35 to 64 Years | 12 (2.4%) | 11 (3.0%) |
| 65 to 74 Years | 9 (7.6%) | 16 (14.4%) |
| 75 Years and over | 0 (0.0%) | 0 (0.0%) |
Disability Class: Cognitive Difficulty
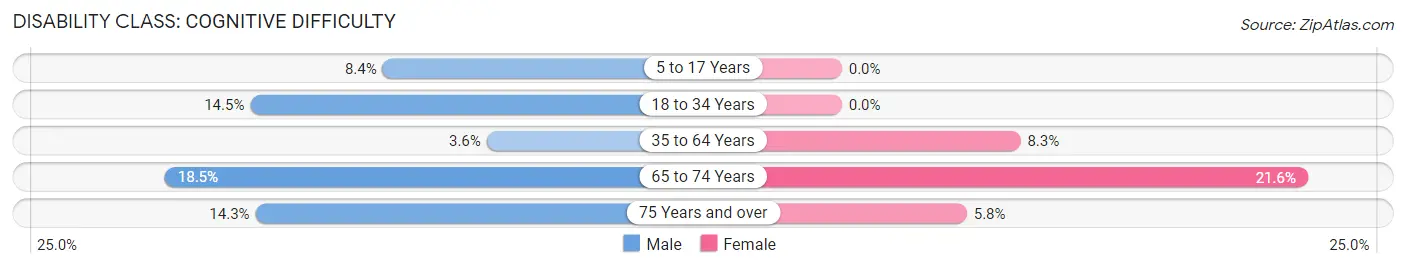
| Age Bracket | Male | Female |
| 5 to 17 Years | 12 (8.4%) | 0 (0.0%) |
| 18 to 34 Years | 26 (14.5%) | 0 (0.0%) |
| 35 to 64 Years | 18 (3.6%) | 30 (8.3%) |
| 65 to 74 Years | 22 (18.5%) | 24 (21.6%) |
| 75 Years and over | 4 (14.3%) | 4 (5.8%) |
Disability Class: Ambulatory Difficulty
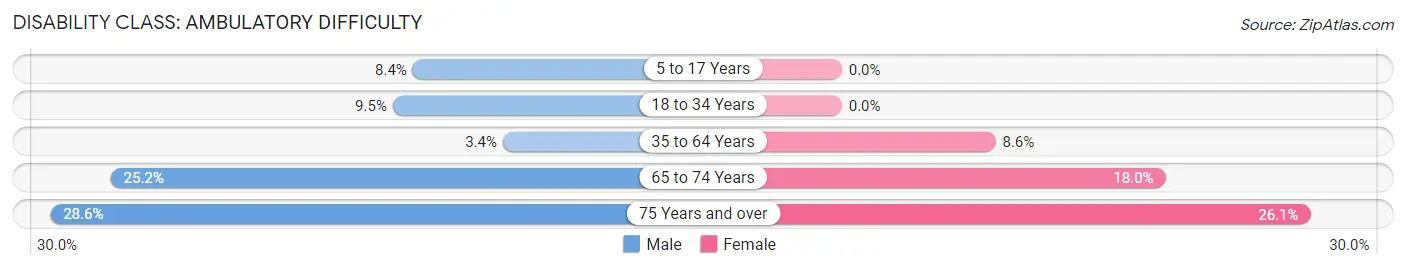
| Age Bracket | Male | Female |
| 5 to 17 Years | 12 (8.4%) | 0 (0.0%) |
| 18 to 34 Years | 17 (9.5%) | 0 (0.0%) |
| 35 to 64 Years | 17 (3.4%) | 31 (8.6%) |
| 65 to 74 Years | 30 (25.2%) | 20 (18.0%) |
| 75 Years and over | 8 (28.6%) | 18 (26.1%) |
Disability Class: Self-Care Difficulty
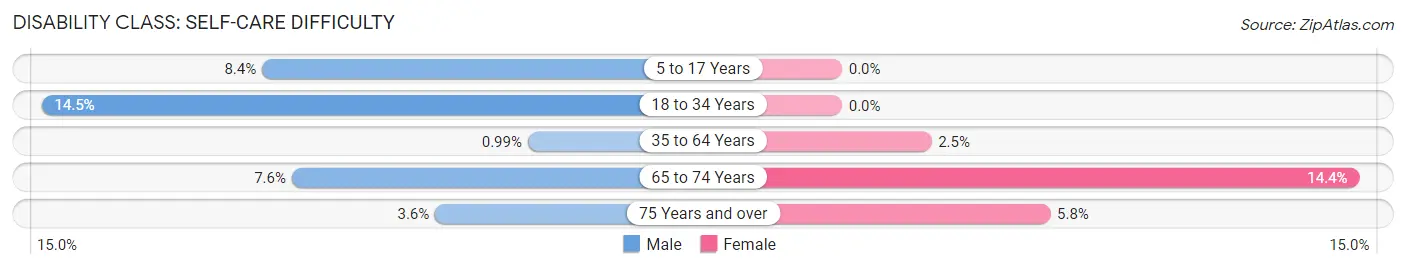
| Age Bracket | Male | Female |
| 5 to 17 Years | 12 (8.4%) | 0 (0.0%) |
| 18 to 34 Years | 26 (14.5%) | 0 (0.0%) |
| 35 to 64 Years | 5 (1.0%) | 9 (2.5%) |
| 65 to 74 Years | 9 (7.6%) | 16 (14.4%) |
| 75 Years and over | 1 (3.6%) | 4 (5.8%) |
Technology Access in Weedsport
Computing Device Access in Weedsport
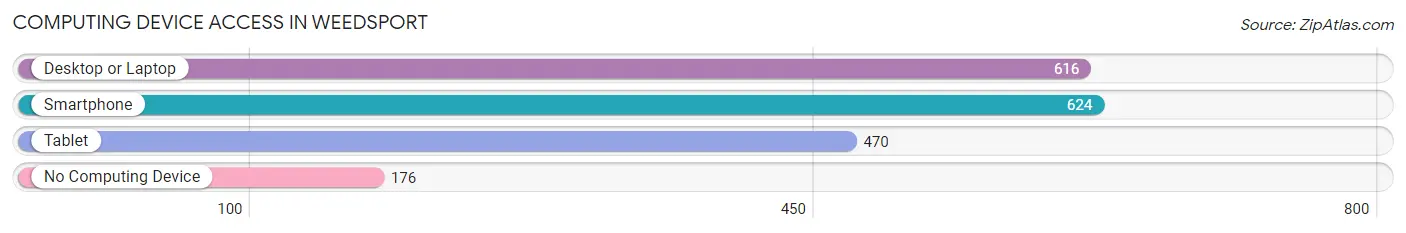
| Device Type | # Households | % Households |
| Desktop or Laptop | 616 | 72.5% |
| Smartphone | 624 | 73.4% |
| Tablet | 470 | 55.3% |
| No Computing Device | 176 | 20.7% |
| Total | 850 | 100.0% |
Internet Access in Weedsport
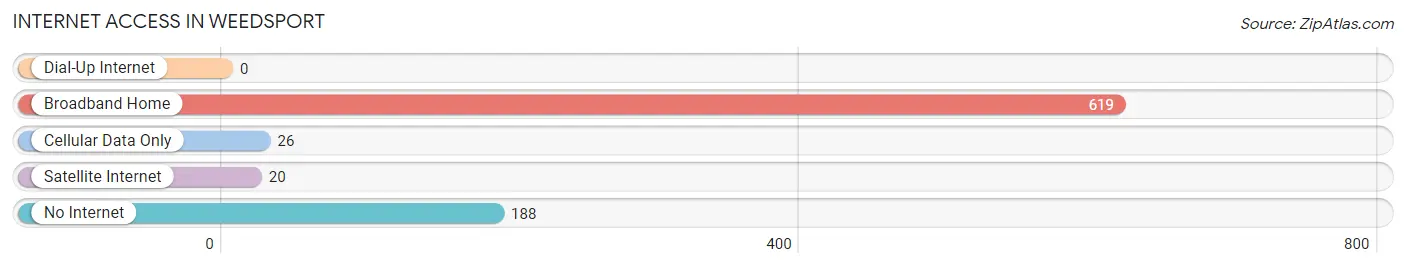
| Internet Type | # Households | % Households |
| Dial-Up Internet | 0 | 0.0% |
| Broadband Home | 619 | 72.8% |
| Cellular Data Only | 26 | 3.1% |
| Satellite Internet | 20 | 2.4% |
| No Internet | 188 | 22.1% |
| Total | 850 | 100.0% |
Weedsport Summary
Weedsport is a small village located in Cayuga County, New York, United States. It is situated on the north shore of Cayuga Lake, about halfway between Syracuse and Auburn. The population was 1,815 at the 2010 census.
History
Weedsport was first settled in 1794 by the Weed family, who were among the first settlers in the area. The village was originally known as "Weed's Basin" and was later renamed Weedsport. The village was incorporated in 1833.
Weedsport was an important stop on the Erie Canal, which opened in 1825. The canal brought increased trade and commerce to the area, and the village grew rapidly. By the mid-19th century, Weedsport was a thriving commercial center, with several mills, a tannery, and a variety of other businesses.
The village was also home to several important industries, including the Weedsport Foundry, which produced cast iron stoves and other products. The foundry was in operation from 1845 to 1875.
Geography
Weedsport is located at 43°7′25″N 76°37′17″W (43.123611, -76.621389). According to the United States Census Bureau, the village has a total area of 1.2 square miles (3.1 km2), all of it land.
Economy
Weedsport's economy is largely based on agriculture and tourism. The village is home to several farms, including a dairy farm, a vegetable farm, and a fruit farm. The village also has several wineries and breweries, as well as a number of restaurants and shops.
The village is also home to several manufacturing companies, including Weedsport Manufacturing, which produces industrial equipment, and Weedsport Plastics, which produces plastic products.
Demographics
As of the census of 2010, there were 1,815 people, 717 households, and 463 families residing in the village. The population density was 1,521.7 people per square mile (586.7/km2). There were 767 housing units at an average density of 637.5 per square mile (246.2/km2). The racial makeup of the village was 97.2% White, 0.7% African American, 0.2% Native American, 0.3% Asian, 0.2% from other races, and 1.4% from two or more races. Hispanic or Latino of any race were 1.2% of the population.
There were 717 households, out of which 32.2% had children under the age of 18 living with them, 46.2% were married couples living together, 13.2% had a female householder with no husband present, and 35.7% were non-families. 30.2% of all households were made up of individuals, and 13.2% had someone living alone who was 65 years of age or older. The average household size was 2.45 and the average family size was 3.04.
In the village, the population was spread out, with 25.2% under the age of 18, 8.2% from 18 to 24, 28.2% from 25 to 44, 22.7% from 45 to 64, and 15.7% who were 65 years of age or older. The median age was 37 years. For every 100 females, there were 91.2 males. For every 100 females age 18 and over, there were 87.2 males.
The median income for a household in the village was $37,500, and the median income for a family was $45,000. Males had a median income of $31,250 versus $25,000 for females. The per capita income for the village was $17,945. About 8.2% of families and 11.2% of the population were below the poverty line, including 15.2% of those under age 18 and 8.2% of those age 65 or over.
Common Questions
What is Per Capita Income in Weedsport?
Per Capita income in Weedsport is $35,853.
What is the Median Family Income in Weedsport?
Median Family Income in Weedsport is $93,672.
What is the Median Household income in Weedsport?
Median Household Income in Weedsport is $67,426.
What is Income or Wage Gap in Weedsport?
Income or Wage Gap in Weedsport is 34.1%.
Women in Weedsport earn 65.9 cents for every dollar earned by a man.
What is Inequality or Gini Index in Weedsport?
Inequality or Gini Index in Weedsport is 0.38.
What is the Total Population of Weedsport?
Total Population of Weedsport is 1,858.
What is the Total Male Population of Weedsport?
Total Male Population of Weedsport is 1,003.
What is the Total Female Population of Weedsport?
Total Female Population of Weedsport is 855.
What is the Ratio of Males per 100 Females in Weedsport?
There are 117.31 Males per 100 Females in Weedsport.
What is the Ratio of Females per 100 Males in Weedsport?
There are 85.24 Females per 100 Males in Weedsport.
What is the Median Population Age in Weedsport?
Median Population Age in Weedsport is 47.5 Years.
What is the Average Family Size in Weedsport
Average Family Size in Weedsport is 2.6 People.
What is the Average Household Size in Weedsport
Average Household Size in Weedsport is 2.1 People.
How Large is the Labor Force in Weedsport?
There are 858 People in the Labor Forcein in Weedsport.
What is the Percentage of People in the Labor Force in Weedsport?
53.7% of People are in the Labor Force in Weedsport.
What is the Unemployment Rate in Weedsport?
Unemployment Rate in Weedsport is 0.8%.