Saratoga Springs, NY Map & Demographics
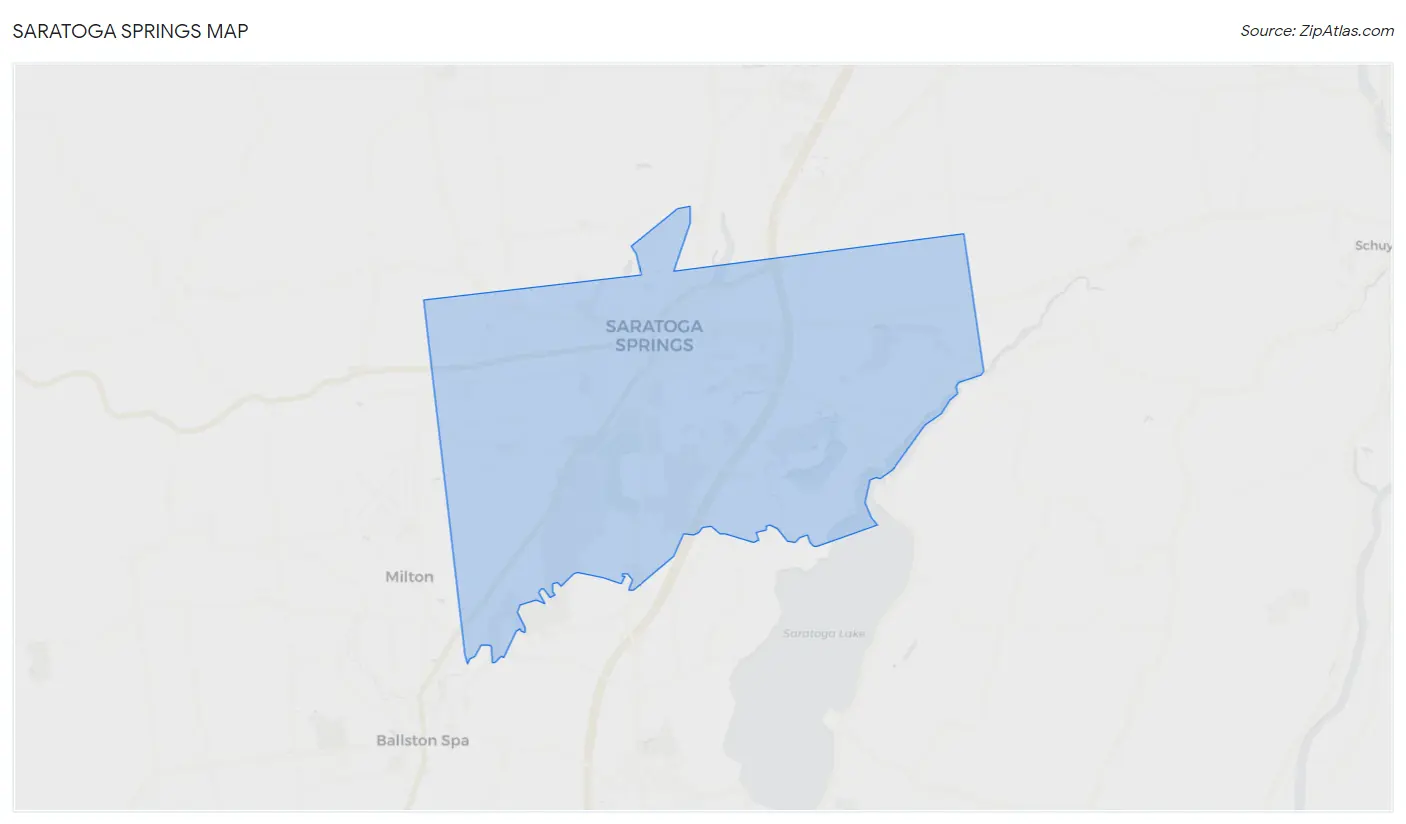
Saratoga Springs Map
Saratoga Springs Overview
$57,836
PER CAPITA INCOME
$132,965
AVG FAMILY INCOME
$97,241
AVG HOUSEHOLD INCOME
30.3%
WAGE / INCOME GAP [ % ]
69.7¢/ $1
WAGE / INCOME GAP [ $ ]
0.47
INEQUALITY / GINI INDEX
28,505
TOTAL POPULATION
13,346
MALE POPULATION
15,159
FEMALE POPULATION
88.04
MALES / 100 FEMALES
113.58
FEMALES / 100 MALES
41.8
MEDIAN AGE
2.6
AVG FAMILY SIZE
2.0
AVG HOUSEHOLD SIZE
15,888
LABOR FORCE [ PEOPLE ]
63.6%
PERCENT IN LABOR FORCE
2.7%
UNEMPLOYMENT RATE
Saratoga Springs Zip Codes
Saratoga Springs Area Codes
Income in Saratoga Springs
Income Overview in Saratoga Springs
Per Capita Income in Saratoga Springs is $57,836, while median incomes of families and households are $132,965 and $97,241 respectively.
| Characteristic | Number | Measure |
| Per Capita Income | 28,505 | $57,836 |
| Median Family Income | 6,850 | $132,965 |
| Mean Family Income | 6,850 | $162,891 |
| Median Household Income | 12,704 | $97,241 |
| Mean Household Income | 12,704 | $127,574 |
| Income Deficit | 6,850 | $0 |
| Wage / Income Gap (%) | 28,505 | 30.32% |
| Wage / Income Gap ($) | 28,505 | 69.68¢ per $1 |
| Gini / Inequality Index | 28,505 | 0.47 |
Earnings by Sex in Saratoga Springs
Average Earnings in Saratoga Springs are $49,332, $58,776 for men and $40,953 for women, a difference of 30.3%.
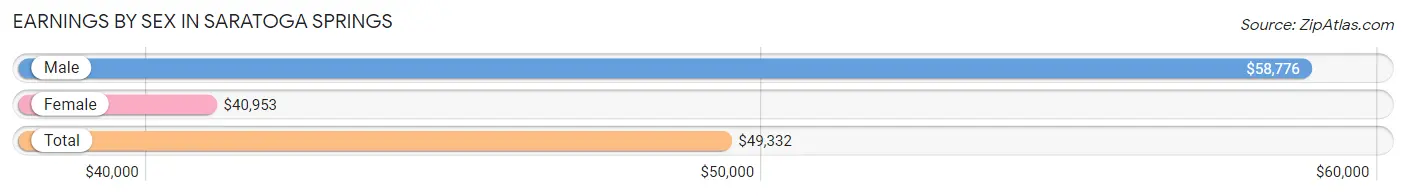
| Sex | Number | Average Earnings |
| Male | 8,513 (49.5%) | $58,776 |
| Female | 8,697 (50.5%) | $40,953 |
| Total | 17,210 (100.0%) | $49,332 |
Earnings by Sex by Income Bracket in Saratoga Springs
The most common earnings brackets in Saratoga Springs are $100,000+ for men (2,802 | 32.9%) and $100,000+ for women (1,529 | 17.6%).
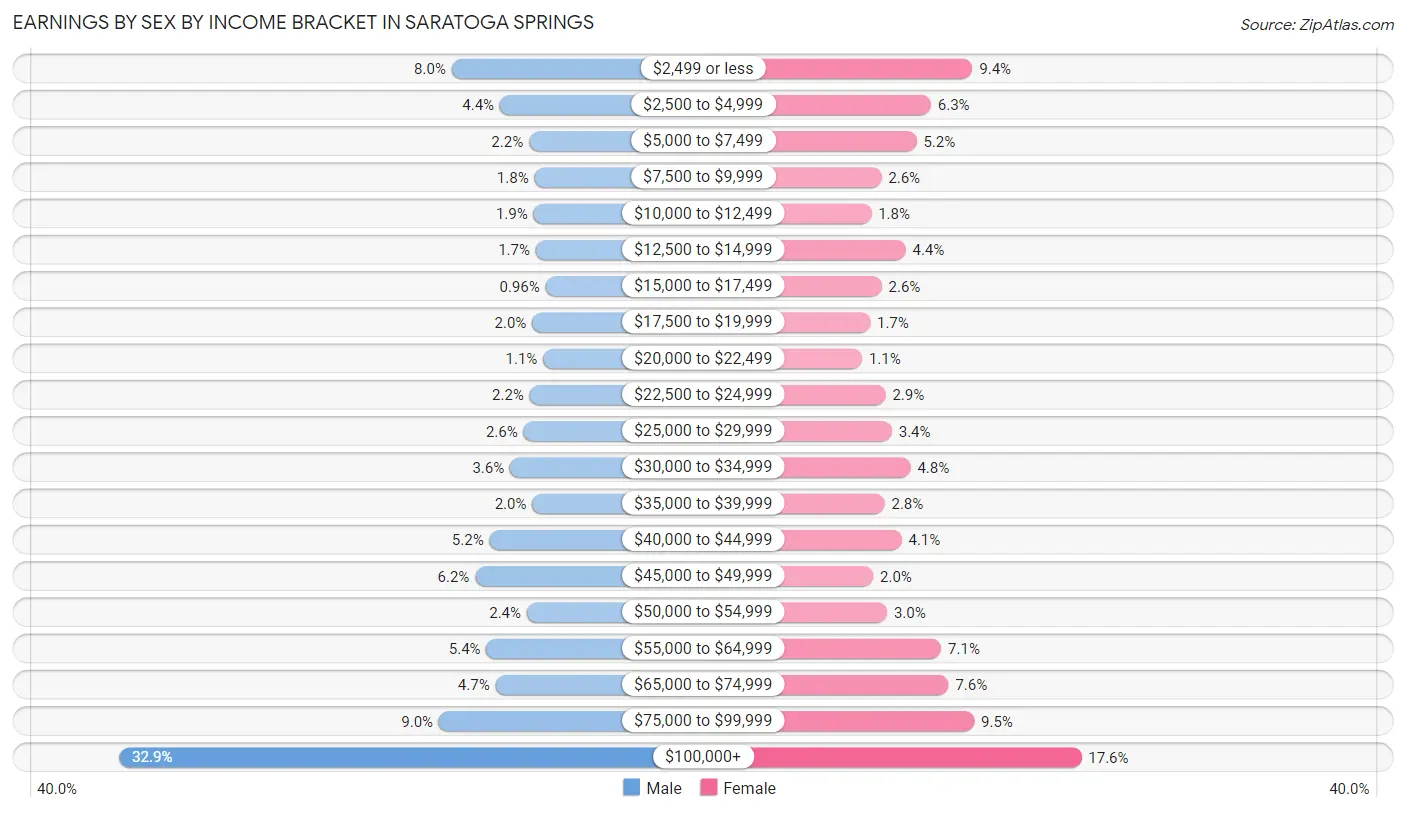
| Income | Male | Female |
| $2,499 or less | 680 (8.0%) | 818 (9.4%) |
| $2,500 to $4,999 | 373 (4.4%) | 548 (6.3%) |
| $5,000 to $7,499 | 187 (2.2%) | 454 (5.2%) |
| $7,500 to $9,999 | 152 (1.8%) | 225 (2.6%) |
| $10,000 to $12,499 | 158 (1.9%) | 159 (1.8%) |
| $12,500 to $14,999 | 144 (1.7%) | 383 (4.4%) |
| $15,000 to $17,499 | 82 (1.0%) | 227 (2.6%) |
| $17,500 to $19,999 | 167 (2.0%) | 151 (1.7%) |
| $20,000 to $22,499 | 97 (1.1%) | 99 (1.1%) |
| $22,500 to $24,999 | 183 (2.1%) | 252 (2.9%) |
| $25,000 to $29,999 | 222 (2.6%) | 293 (3.4%) |
| $30,000 to $34,999 | 308 (3.6%) | 415 (4.8%) |
| $35,000 to $39,999 | 166 (1.9%) | 246 (2.8%) |
| $40,000 to $44,999 | 439 (5.2%) | 357 (4.1%) |
| $45,000 to $49,999 | 530 (6.2%) | 171 (2.0%) |
| $50,000 to $54,999 | 201 (2.4%) | 262 (3.0%) |
| $55,000 to $64,999 | 459 (5.4%) | 615 (7.1%) |
| $65,000 to $74,999 | 401 (4.7%) | 663 (7.6%) |
| $75,000 to $99,999 | 762 (8.9%) | 830 (9.5%) |
| $100,000+ | 2,802 (32.9%) | 1,529 (17.6%) |
| Total | 8,513 (100.0%) | 8,697 (100.0%) |
Earnings by Sex by Educational Attainment in Saratoga Springs
Average earnings in Saratoga Springs are $76,162 for men and $57,572 for women, a difference of 24.4%. Men with an educational attainment of bachelor's degree enjoy the highest average annual earnings of $112,535, while those with less than high school education earn the least with $37,679. Women with an educational attainment of graduate degree earn the most with the average annual earnings of $80,000, while those with college or associate's degree education have the smallest earnings of $31,761.
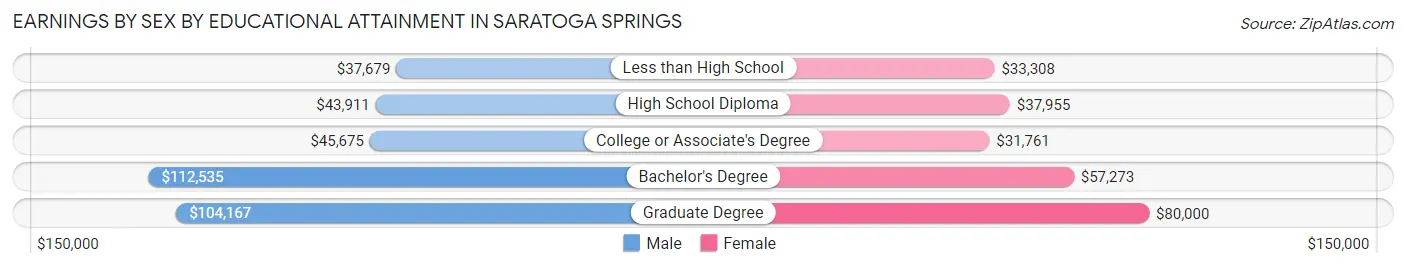
| Educational Attainment | Male Income | Female Income |
| Less than High School | $37,679 | $33,308 |
| High School Diploma | $43,911 | $37,955 |
| College or Associate's Degree | $45,675 | $31,761 |
| Bachelor's Degree | $112,535 | $57,273 |
| Graduate Degree | $104,167 | $80,000 |
| Total | $76,162 | $57,572 |
Family Income in Saratoga Springs
Family Income Brackets in Saratoga Springs
According to the Saratoga Springs family income data, there are 1,815 families falling into the $200,000+ income range, which is the most common income bracket and makes up 26.5% of all families. Conversely, the $10,000 to $14,999 income bracket is the least frequent group with only 48 families (0.7%) belonging to this category.
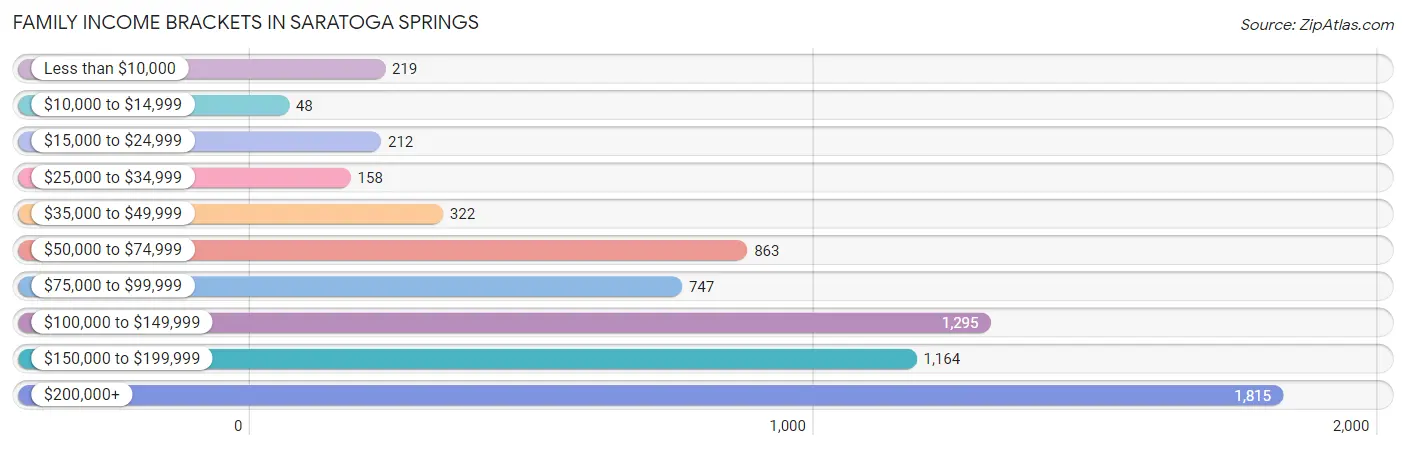
| Income Bracket | # Families | % Families |
| Less than $10,000 | 219 | 3.2% |
| $10,000 to $14,999 | 48 | 0.7% |
| $15,000 to $24,999 | 212 | 3.1% |
| $25,000 to $34,999 | 158 | 2.3% |
| $35,000 to $49,999 | 322 | 4.7% |
| $50,000 to $74,999 | 863 | 12.6% |
| $75,000 to $99,999 | 747 | 10.9% |
| $100,000 to $149,999 | 1,295 | 18.9% |
| $150,000 to $199,999 | 1,164 | 17.0% |
| $200,000+ | 1,815 | 26.5% |
Family Income by Famaliy Size in Saratoga Springs
6-person families (25 | 0.4%) account for the highest median family income in Saratoga Springs with $243,594 per family, while 2-person families (4,058 | 59.2%) have the highest median income of $55,525 per family member.
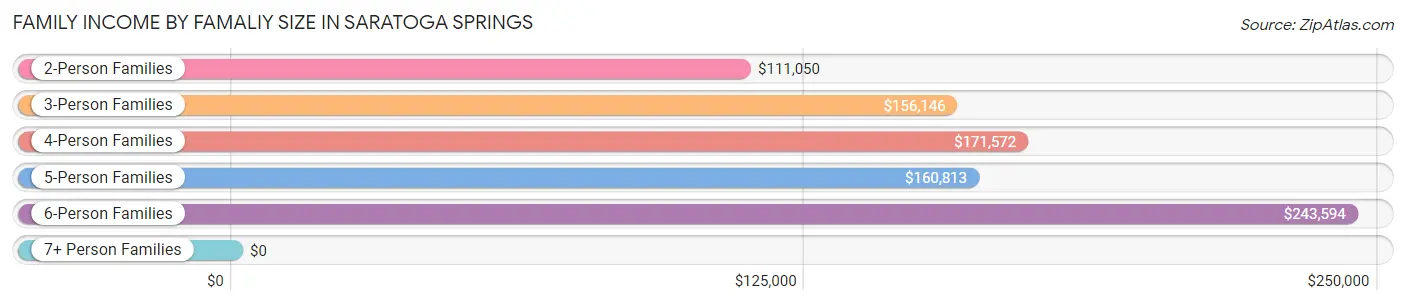
| Income Bracket | # Families | Median Income |
| 2-Person Families | 4,058 (59.2%) | $111,050 |
| 3-Person Families | 1,437 (21.0%) | $156,146 |
| 4-Person Families | 1,037 (15.1%) | $171,572 |
| 5-Person Families | 293 (4.3%) | $160,813 |
| 6-Person Families | 25 (0.4%) | $243,594 |
| 7+ Person Families | 0 (0.0%) | $0 |
| Total | 6,850 (100.0%) | $132,965 |
Family Income by Number of Earners in Saratoga Springs
The median family income in Saratoga Springs is $132,965, with families comprising 3+ earners (537) having the highest median family income of $178,564, while families with no earners (1,108) have the lowest median family income of $71,944, accounting for 7.8% and 16.2% of families, respectively.
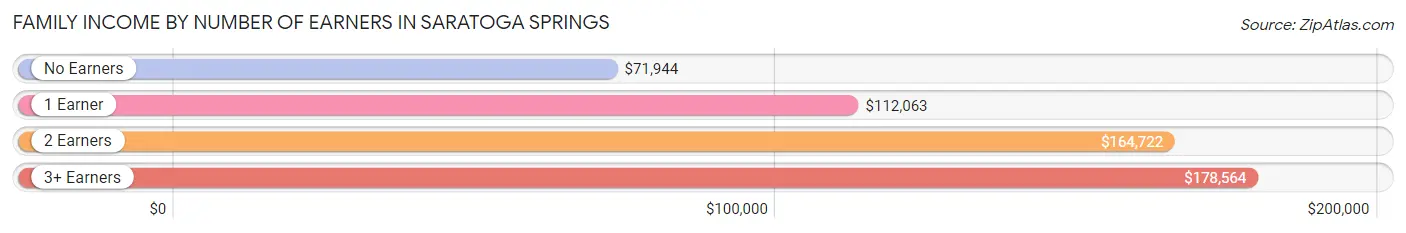
| Number of Earners | # Families | Median Income |
| No Earners | 1,108 (16.2%) | $71,944 |
| 1 Earner | 2,527 (36.9%) | $112,063 |
| 2 Earners | 2,678 (39.1%) | $164,722 |
| 3+ Earners | 537 (7.8%) | $178,564 |
| Total | 6,850 (100.0%) | $132,965 |
Household Income in Saratoga Springs
Household Income Brackets in Saratoga Springs
With 2,477 households falling in the category, the $100,000 to $149,999 income range is the most frequent in Saratoga Springs, accounting for 19.5% of all households. In contrast, only 305 households (2.4%) fall into the $10,000 to $14,999 income bracket, making it the least populous group.
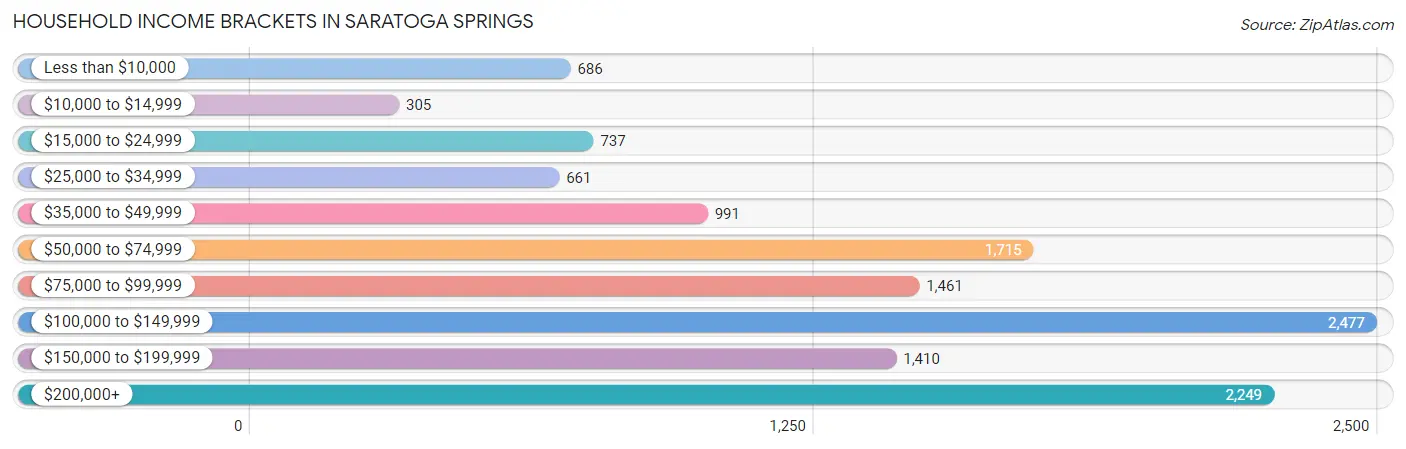
| Income Bracket | # Households | % Households |
| Less than $10,000 | 686 | 5.4% |
| $10,000 to $14,999 | 305 | 2.4% |
| $15,000 to $24,999 | 737 | 5.8% |
| $25,000 to $34,999 | 661 | 5.2% |
| $35,000 to $49,999 | 991 | 7.8% |
| $50,000 to $74,999 | 1,715 | 13.5% |
| $75,000 to $99,999 | 1,461 | 11.5% |
| $100,000 to $149,999 | 2,477 | 19.5% |
| $150,000 to $199,999 | 1,410 | 11.1% |
| $200,000+ | 2,249 | 17.7% |
Household Income by Householder Age in Saratoga Springs
The median household income in Saratoga Springs is $97,241, with the highest median household income of $115,064 found in the 25 to 44 years age bracket for the primary householder. A total of 4,204 households (33.1%) fall into this category. Meanwhile, the 15 to 24 years age bracket for the primary householder has the lowest median household income of $49,491, with 539 households (4.2%) in this group.
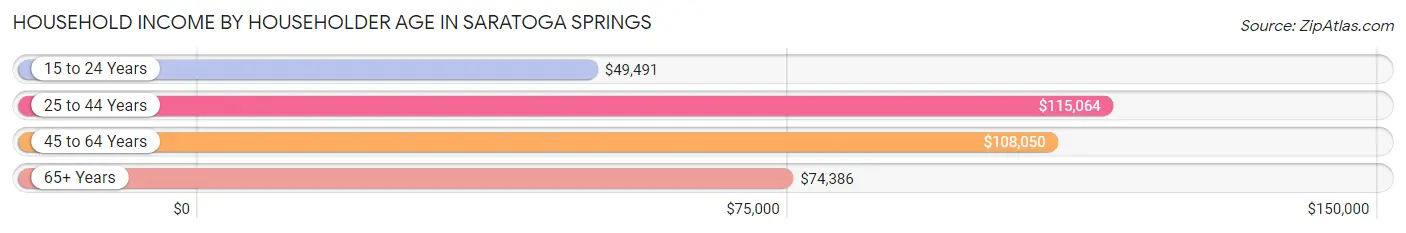
| Income Bracket | # Households | Median Income |
| 15 to 24 Years | 539 (4.2%) | $49,491 |
| 25 to 44 Years | 4,204 (33.1%) | $115,064 |
| 45 to 64 Years | 4,208 (33.1%) | $108,050 |
| 65+ Years | 3,753 (29.5%) | $74,386 |
| Total | 12,704 (100.0%) | $97,241 |
Poverty in Saratoga Springs
Income Below Poverty by Sex and Age in Saratoga Springs
With 8.8% poverty level for males and 11.2% for females among the residents of Saratoga Springs, 15 year old males and 5 year old females are the most vulnerable to poverty, with 48 males (34.0%) and 25 females (36.2%) in their respective age groups living below the poverty level.
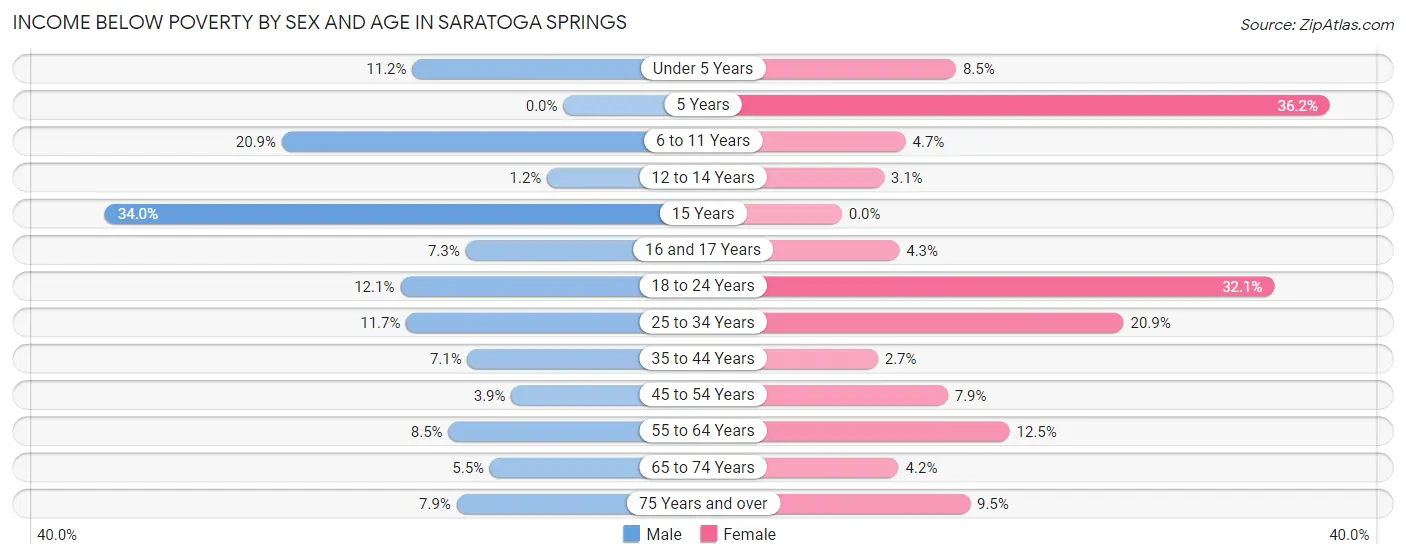
| Age Bracket | Male | Female |
| Under 5 Years | 52 (11.2%) | 47 (8.5%) |
| 5 Years | 0 (0.0%) | 25 (36.2%) |
| 6 to 11 Years | 130 (20.9%) | 33 (4.7%) |
| 12 to 14 Years | 5 (1.2%) | 8 (3.1%) |
| 15 Years | 48 (34.0%) | 0 (0.0%) |
| 16 and 17 Years | 17 (7.3%) | 9 (4.3%) |
| 18 to 24 Years | 109 (12.1%) | 364 (32.1%) |
| 25 to 34 Years | 217 (11.7%) | 378 (20.9%) |
| 35 to 44 Years | 121 (7.1%) | 48 (2.7%) |
| 45 to 54 Years | 53 (3.9%) | 144 (7.9%) |
| 55 to 64 Years | 157 (8.5%) | 276 (12.5%) |
| 65 to 74 Years | 84 (5.4%) | 66 (4.2%) |
| 75 Years and over | 77 (7.9%) | 146 (9.5%) |
| Total | 1,070 (8.8%) | 1,544 (11.2%) |
Income Above Poverty by Sex and Age in Saratoga Springs
According to the poverty statistics in Saratoga Springs, males aged 5 years and females aged 15 years are the age groups that are most secure financially, with 100.0% of males and 100.0% of females in these age groups living above the poverty line.
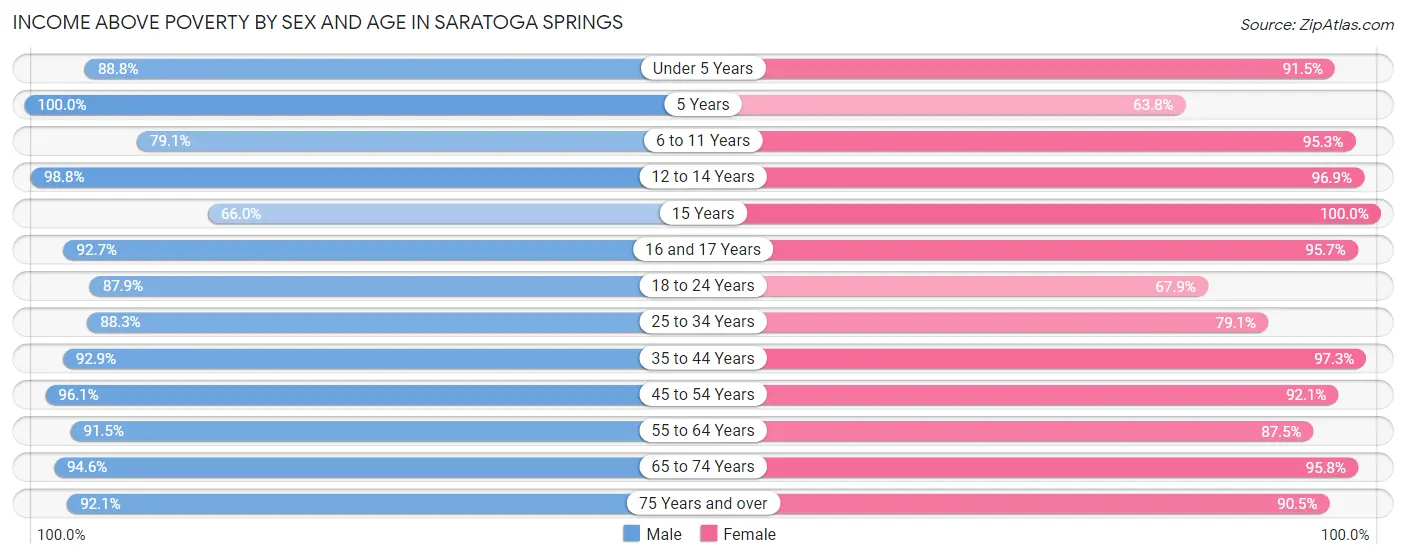
| Age Bracket | Male | Female |
| Under 5 Years | 412 (88.8%) | 507 (91.5%) |
| 5 Years | 148 (100.0%) | 44 (63.8%) |
| 6 to 11 Years | 492 (79.1%) | 663 (95.3%) |
| 12 to 14 Years | 412 (98.8%) | 248 (96.9%) |
| 15 Years | 93 (66.0%) | 111 (100.0%) |
| 16 and 17 Years | 217 (92.7%) | 202 (95.7%) |
| 18 to 24 Years | 791 (87.9%) | 770 (67.9%) |
| 25 to 34 Years | 1,644 (88.3%) | 1,429 (79.1%) |
| 35 to 44 Years | 1,581 (92.9%) | 1,752 (97.3%) |
| 45 to 54 Years | 1,319 (96.1%) | 1,686 (92.1%) |
| 55 to 64 Years | 1,683 (91.5%) | 1,939 (87.5%) |
| 65 to 74 Years | 1,456 (94.6%) | 1,499 (95.8%) |
| 75 Years and over | 895 (92.1%) | 1,387 (90.5%) |
| Total | 11,143 (91.2%) | 12,237 (88.8%) |
Income Below Poverty Among Married-Couple Families in Saratoga Springs
The poverty statistics for married-couple families in Saratoga Springs show that 3.4% or 186 of the total 5,409 families live below the poverty line. Families with 3 or 4 children have the highest poverty rate of 8.2%, comprising of 23 families. On the other hand, families with 1 or 2 children have the lowest poverty rate of 2.2%, which includes 34 families.
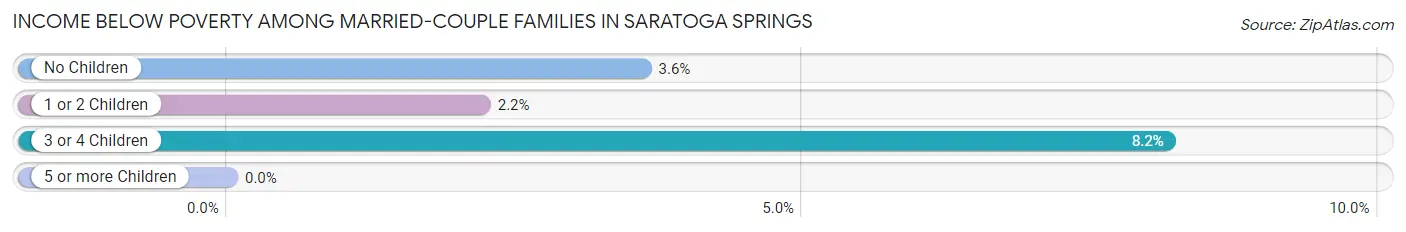
| Children | Above Poverty | Below Poverty |
| No Children | 3,451 (96.4%) | 129 (3.6%) |
| 1 or 2 Children | 1,513 (97.8%) | 34 (2.2%) |
| 3 or 4 Children | 259 (91.8%) | 23 (8.2%) |
| 5 or more Children | 0 (0.0%) | 0 (0.0%) |
| Total | 5,223 (96.6%) | 186 (3.4%) |
Income Below Poverty Among Single-Parent Households in Saratoga Springs
According to the poverty data in Saratoga Springs, 3.3% or 8 single-father households and 13.6% or 163 single-mother households are living below the poverty line. Among single-father households, those with 1 or 2 children have the highest poverty rate, with 8 households (12.5%) experiencing poverty. Likewise, among single-mother households, those with 1 or 2 children have the highest poverty rate, with 123 households (20.5%) falling below the poverty line.
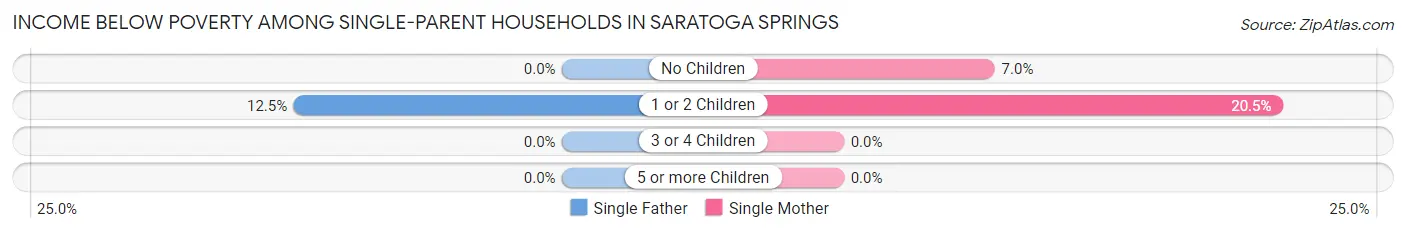
| Children | Single Father | Single Mother |
| No Children | 0 (0.0%) | 40 (7.0%) |
| 1 or 2 Children | 8 (12.5%) | 123 (20.5%) |
| 3 or 4 Children | 0 (0.0%) | 0 (0.0%) |
| 5 or more Children | 0 (0.0%) | 0 (0.0%) |
| Total | 8 (3.3%) | 163 (13.6%) |
Income Below Poverty Among Married-Couple vs Single-Parent Households in Saratoga Springs
The poverty data for Saratoga Springs shows that 186 of the married-couple family households (3.4%) and 171 of the single-parent households (11.9%) are living below the poverty level. Within the married-couple family households, those with 3 or 4 children have the highest poverty rate, with 23 households (8.2%) falling below the poverty line. Among the single-parent households, those with 1 or 2 children have the highest poverty rate, with 131 household (19.7%) living below poverty.
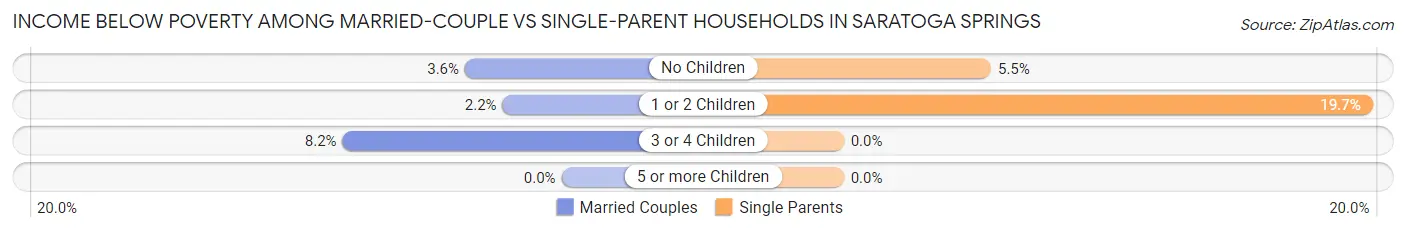
| Children | Married-Couple Families | Single-Parent Households |
| No Children | 129 (3.6%) | 40 (5.5%) |
| 1 or 2 Children | 34 (2.2%) | 131 (19.7%) |
| 3 or 4 Children | 23 (8.2%) | 0 (0.0%) |
| 5 or more Children | 0 (0.0%) | 0 (0.0%) |
| Total | 186 (3.4%) | 171 (11.9%) |
Race in Saratoga Springs
The most populous races in Saratoga Springs are White / Caucasian (24,928 | 87.5%), Two or more Races (1,279 | 4.5%), and Hispanic or Latino (1,226 | 4.3%).
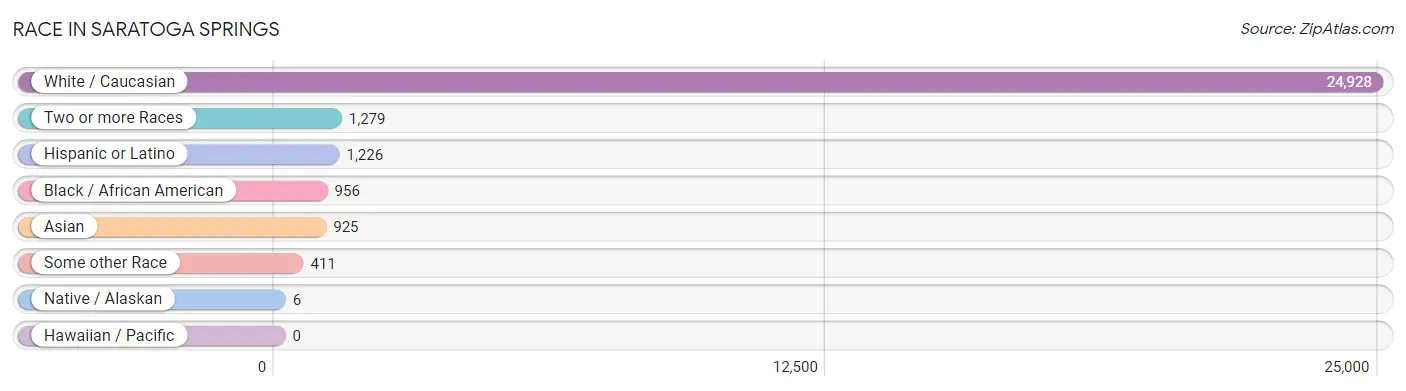
| Race | # Population | % Population |
| Asian | 925 | 3.3% |
| Black / African American | 956 | 3.4% |
| Hawaiian / Pacific | 0 | 0.0% |
| Hispanic or Latino | 1,226 | 4.3% |
| Native / Alaskan | 6 | 0.0% |
| White / Caucasian | 24,928 | 87.5% |
| Two or more Races | 1,279 | 4.5% |
| Some other Race | 411 | 1.4% |
| Total | 28,505 | 100.0% |
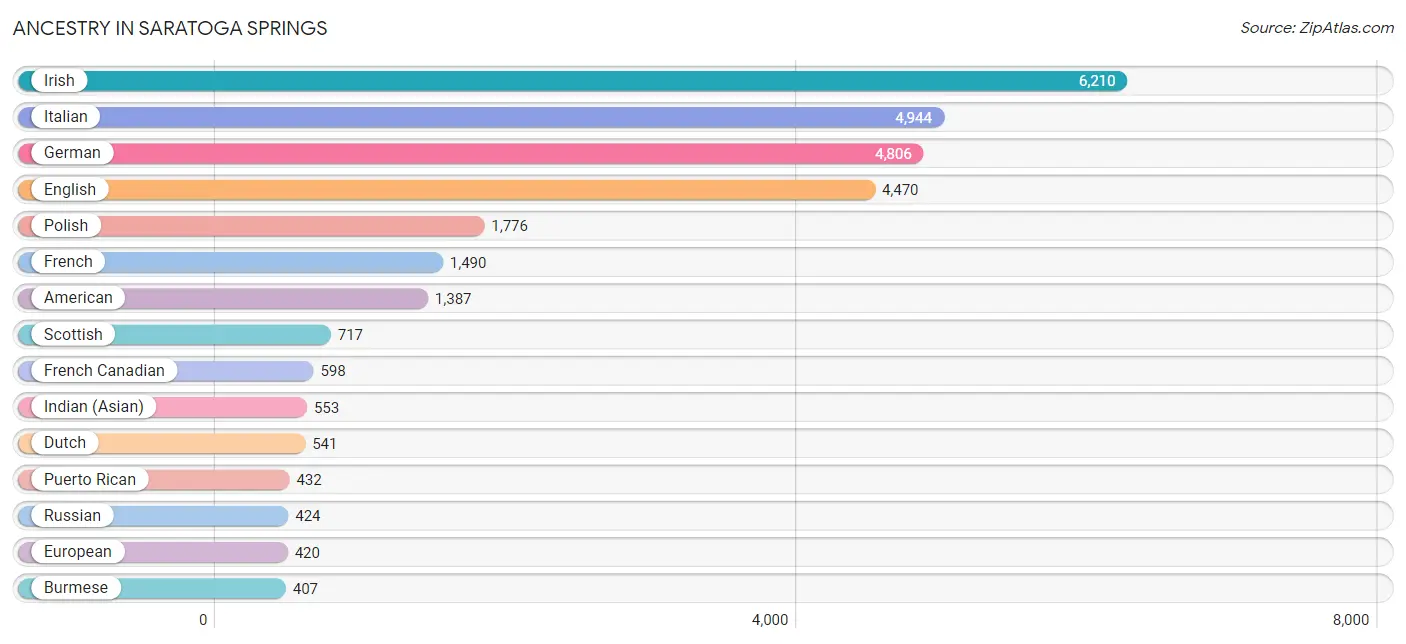
Ancestry in Saratoga Springs
The most populous ancestries reported in Saratoga Springs are Irish (6,210 | 21.8%), Italian (4,944 | 17.3%), German (4,806 | 16.9%), English (4,470 | 15.7%), and Polish (1,776 | 6.2%), together accounting for 77.9% of all Saratoga Springs residents.
| Ancestry | # Population | % Population |
| African | 16 | 0.1% |
| Albanian | 5 | 0.0% |
| American | 1,387 | 4.9% |
| Apache | 7 | 0.0% |
| Arab | 285 | 1.0% |
| Argentinean | 3 | 0.0% |
| Armenian | 162 | 0.6% |
| Austrian | 48 | 0.2% |
| Barbadian | 3 | 0.0% |
| Belgian | 49 | 0.2% |
| Bhutanese | 120 | 0.4% |
| Blackfeet | 31 | 0.1% |
| British | 147 | 0.5% |
| British West Indian | 111 | 0.4% |
| Burmese | 407 | 1.4% |
| Canadian | 48 | 0.2% |
| Cape Verdean | 35 | 0.1% |
| Celtic | 17 | 0.1% |
| Central American | 194 | 0.7% |
| Central American Indian | 16 | 0.1% |
| Cherokee | 57 | 0.2% |
| Colombian | 33 | 0.1% |
| Costa Rican | 108 | 0.4% |
| Croatian | 14 | 0.1% |
| Czech | 82 | 0.3% |
| Czechoslovakian | 110 | 0.4% |
| Danish | 109 | 0.4% |
| Dominican | 82 | 0.3% |
| Dutch | 541 | 1.9% |
| Eastern European | 166 | 0.6% |
| Ecuadorian | 68 | 0.2% |
| English | 4,470 | 15.7% |
| European | 420 | 1.5% |
| Finnish | 52 | 0.2% |
| French | 1,490 | 5.2% |
| French Canadian | 598 | 2.1% |
| German | 4,806 | 16.9% |
| Greek | 225 | 0.8% |
| Guatemalan | 22 | 0.1% |
| Guyanese | 70 | 0.3% |
| Haitian | 41 | 0.1% |
| Honduran | 5 | 0.0% |
| Hungarian | 165 | 0.6% |
| Indian (Asian) | 553 | 1.9% |
| Irish | 6,210 | 21.8% |
| Iroquois | 6 | 0.0% |
| Israeli | 36 | 0.1% |
| Italian | 4,944 | 17.3% |
| Jamaican | 33 | 0.1% |
| Japanese | 12 | 0.0% |
| Korean | 97 | 0.3% |
| Laotian | 57 | 0.2% |
| Latvian | 24 | 0.1% |
| Lithuanian | 51 | 0.2% |
| Mexican | 221 | 0.8% |
| Moroccan | 38 | 0.1% |
| Native Hawaiian | 41 | 0.1% |
| New Zealander | 4 | 0.0% |
| Nigerian | 8 | 0.0% |
| Northern European | 24 | 0.1% |
| Norwegian | 192 | 0.7% |
| Pakistani | 20 | 0.1% |
| Palestinian | 142 | 0.5% |
| Pennsylvania German | 30 | 0.1% |
| Peruvian | 14 | 0.1% |
| Polish | 1,776 | 6.2% |
| Portuguese | 73 | 0.3% |
| Puerto Rican | 432 | 1.5% |
| Romanian | 59 | 0.2% |
| Russian | 424 | 1.5% |
| Salvadoran | 59 | 0.2% |
| Scandinavian | 98 | 0.3% |
| Scotch-Irish | 234 | 0.8% |
| Scottish | 717 | 2.5% |
| Sierra Leonean | 11 | 0.0% |
| Slovak | 58 | 0.2% |
| South African | 10 | 0.0% |
| South American | 173 | 0.6% |
| Spaniard | 82 | 0.3% |
| Spanish | 8 | 0.0% |
| Subsaharan African | 80 | 0.3% |
| Swedish | 90 | 0.3% |
| Swiss | 39 | 0.1% |
| Syrian | 71 | 0.3% |
| Thai | 236 | 0.8% |
| Trinidadian and Tobagonian | 73 | 0.3% |
| Turkish | 5 | 0.0% |
| Ukrainian | 197 | 0.7% |
| Venezuelan | 55 | 0.2% |
| Welsh | 217 | 0.8% |
| West Indian | 25 | 0.1% |
| Yugoslavian | 61 | 0.2% | View All 92 Rows |
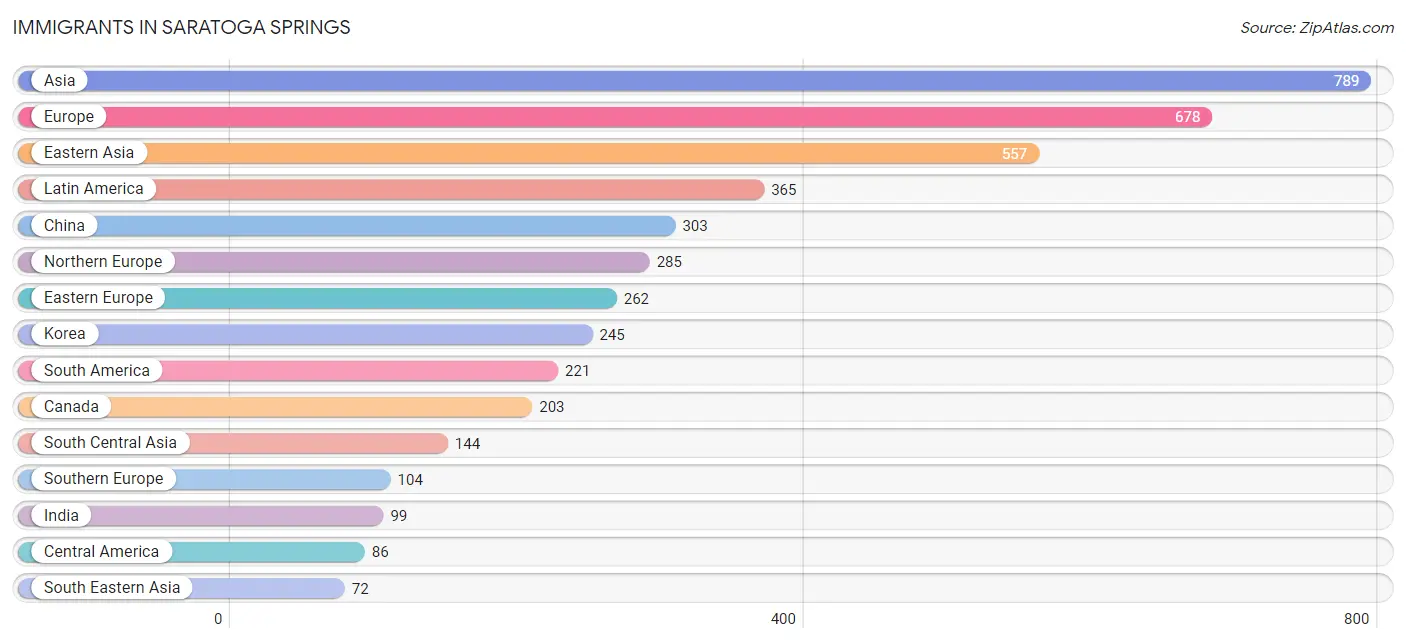
Immigrants in Saratoga Springs
The most numerous immigrant groups reported in Saratoga Springs came from Asia (789 | 2.8%), Europe (678 | 2.4%), Eastern Asia (557 | 1.9%), Latin America (365 | 1.3%), and China (303 | 1.1%), together accounting for 9.4% of all Saratoga Springs residents.
| Immigration Origin | # Population | % Population |
| Africa | 45 | 0.2% |
| Argentina | 13 | 0.1% |
| Asia | 789 | 2.8% |
| Australia | 13 | 0.1% |
| Bangladesh | 45 | 0.2% |
| Barbados | 3 | 0.0% |
| Bosnia and Herzegovina | 61 | 0.2% |
| Brazil | 18 | 0.1% |
| Cambodia | 12 | 0.0% |
| Canada | 203 | 0.7% |
| Caribbean | 58 | 0.2% |
| Central America | 86 | 0.3% |
| China | 303 | 1.1% |
| Colombia | 33 | 0.1% |
| Czechoslovakia | 30 | 0.1% |
| Dominican Republic | 34 | 0.1% |
| Eastern Africa | 8 | 0.0% |
| Eastern Asia | 557 | 1.9% |
| Eastern Europe | 262 | 0.9% |
| Ecuador | 42 | 0.2% |
| England | 33 | 0.1% |
| Europe | 678 | 2.4% |
| Germany | 27 | 0.1% |
| Guatemala | 17 | 0.1% |
| Guyana | 70 | 0.3% |
| Honduras | 16 | 0.1% |
| Hong Kong | 5 | 0.0% |
| Hungary | 4 | 0.0% |
| India | 99 | 0.4% |
| Indonesia | 25 | 0.1% |
| Ireland | 39 | 0.1% |
| Italy | 69 | 0.2% |
| Japan | 9 | 0.0% |
| Korea | 245 | 0.9% |
| Latin America | 365 | 1.3% |
| Lithuania | 15 | 0.1% |
| Mexico | 53 | 0.2% |
| Morocco | 10 | 0.0% |
| Nigeria | 16 | 0.1% |
| Northern Africa | 10 | 0.0% |
| Northern Europe | 285 | 1.0% |
| Oceania | 13 | 0.1% |
| Philippines | 15 | 0.1% |
| Poland | 58 | 0.2% |
| Portugal | 35 | 0.1% |
| Romania | 20 | 0.1% |
| Russia | 23 | 0.1% |
| Scotland | 32 | 0.1% |
| Sierra Leone | 11 | 0.0% |
| South America | 221 | 0.8% |
| South Central Asia | 144 | 0.5% |
| South Eastern Asia | 72 | 0.3% |
| Southern Europe | 104 | 0.4% |
| St. Vincent and the Grenadines | 21 | 0.1% |
| Taiwan | 72 | 0.3% |
| Thailand | 20 | 0.1% |
| Ukraine | 51 | 0.2% |
| Uruguay | 3 | 0.0% |
| Venezuela | 42 | 0.2% |
| Western Africa | 27 | 0.1% |
| Western Asia | 11 | 0.0% |
| Western Europe | 27 | 0.1% | View All 62 Rows |
Sex and Age in Saratoga Springs
Sex and Age in Saratoga Springs
The most populous age groups in Saratoga Springs are 15 to 19 Years (1,121 | 8.4%) for men and 20 to 24 Years (1,321 | 8.7%) for women.
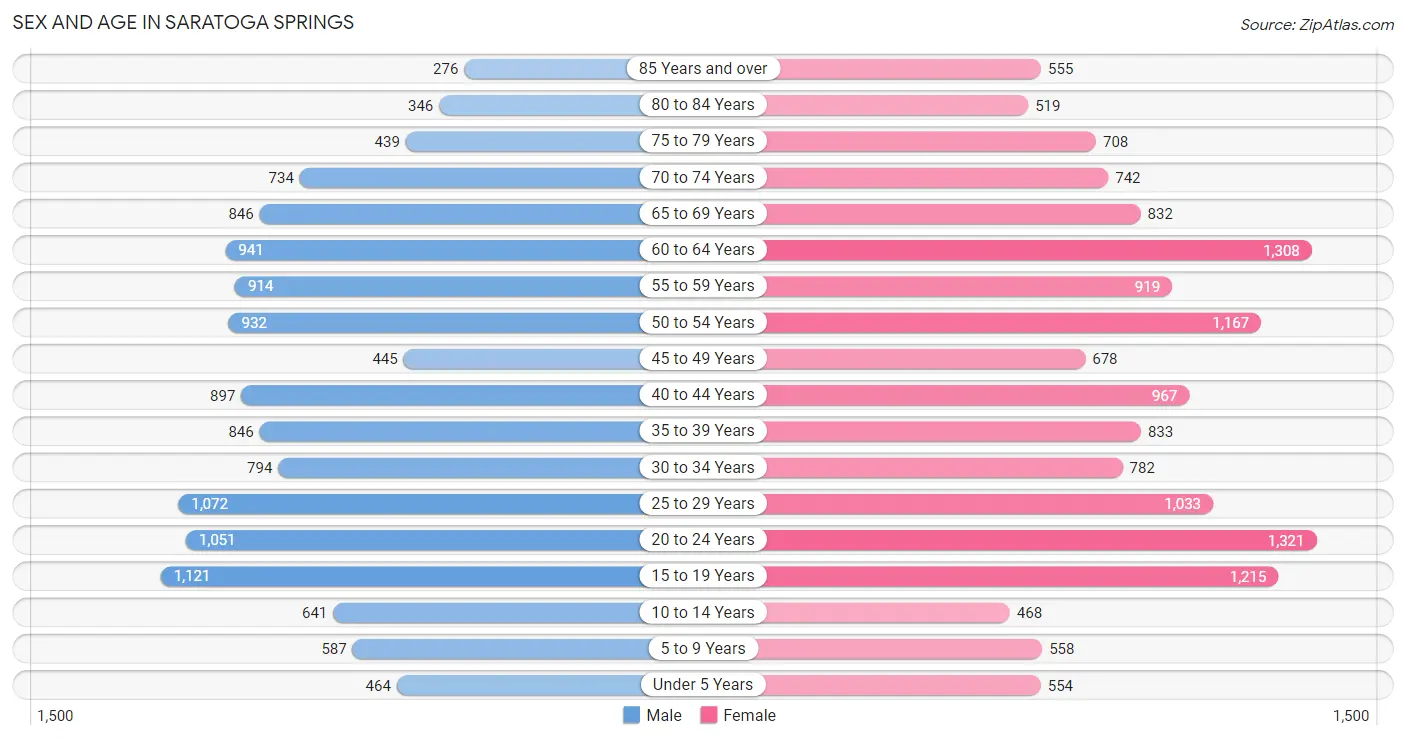
| Age Bracket | Male | Female |
| Under 5 Years | 464 (3.5%) | 554 (3.6%) |
| 5 to 9 Years | 587 (4.4%) | 558 (3.7%) |
| 10 to 14 Years | 641 (4.8%) | 468 (3.1%) |
| 15 to 19 Years | 1,121 (8.4%) | 1,215 (8.0%) |
| 20 to 24 Years | 1,051 (7.9%) | 1,321 (8.7%) |
| 25 to 29 Years | 1,072 (8.0%) | 1,033 (6.8%) |
| 30 to 34 Years | 794 (5.9%) | 782 (5.2%) |
| 35 to 39 Years | 846 (6.3%) | 833 (5.5%) |
| 40 to 44 Years | 897 (6.7%) | 967 (6.4%) |
| 45 to 49 Years | 445 (3.3%) | 678 (4.5%) |
| 50 to 54 Years | 932 (7.0%) | 1,167 (7.7%) |
| 55 to 59 Years | 914 (6.9%) | 919 (6.1%) |
| 60 to 64 Years | 941 (7.0%) | 1,308 (8.6%) |
| 65 to 69 Years | 846 (6.3%) | 832 (5.5%) |
| 70 to 74 Years | 734 (5.5%) | 742 (4.9%) |
| 75 to 79 Years | 439 (3.3%) | 708 (4.7%) |
| 80 to 84 Years | 346 (2.6%) | 519 (3.4%) |
| 85 Years and over | 276 (2.1%) | 555 (3.7%) |
| Total | 13,346 (100.0%) | 15,159 (100.0%) |
Families and Households in Saratoga Springs
Median Family Size in Saratoga Springs
The median family size in Saratoga Springs is 2.61 persons per family, with married-couple families (5,409 | 79.0%) accounting for the largest median family size of 2.7 persons per family. On the other hand, single female/mother families (1,198 | 17.5%) represent the smallest median family size with 2.23 persons per family.
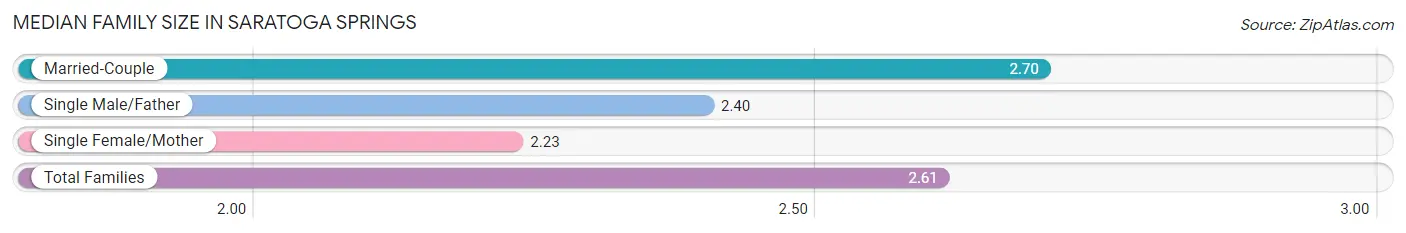
| Family Type | # Families | Family Size |
| Married-Couple | 5,409 (79.0%) | 2.70 |
| Single Male/Father | 243 (3.5%) | 2.40 |
| Single Female/Mother | 1,198 (17.5%) | 2.23 |
| Total Families | 6,850 (100.0%) | 2.61 |
Median Household Size in Saratoga Springs
The median household size in Saratoga Springs is 2.03 persons per household, with married-couple households (5,409 | 42.6%) accounting for the largest median household size of 2.72 persons per household. non-family households (5,854 | 46.1%) represent the smallest median household size with 1.27 persons per household.
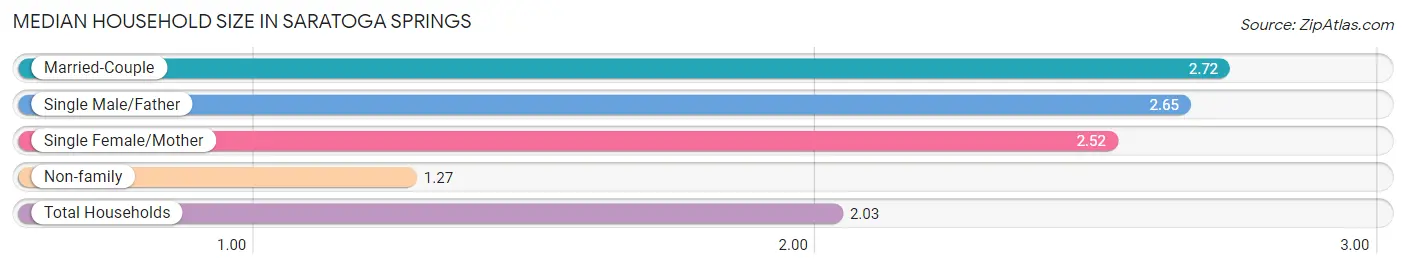
| Household Type | # Households | Household Size |
| Married-Couple | 5,409 (42.6%) | 2.72 |
| Single Male/Father | 243 (1.9%) | 2.65 |
| Single Female/Mother | 1,198 (9.4%) | 2.52 |
| Non-family | 5,854 (46.1%) | 1.27 |
| Total Households | 12,704 (100.0%) | 2.03 |
Household Size by Marriage Status in Saratoga Springs
Out of a total of 12,704 households in Saratoga Springs, 6,850 (53.9%) are family households, while 5,854 (46.1%) are nonfamily households. The most numerous type of family households are 2-person households, comprising 3,741, and the most common type of nonfamily households are 1-person households, comprising 4,261.
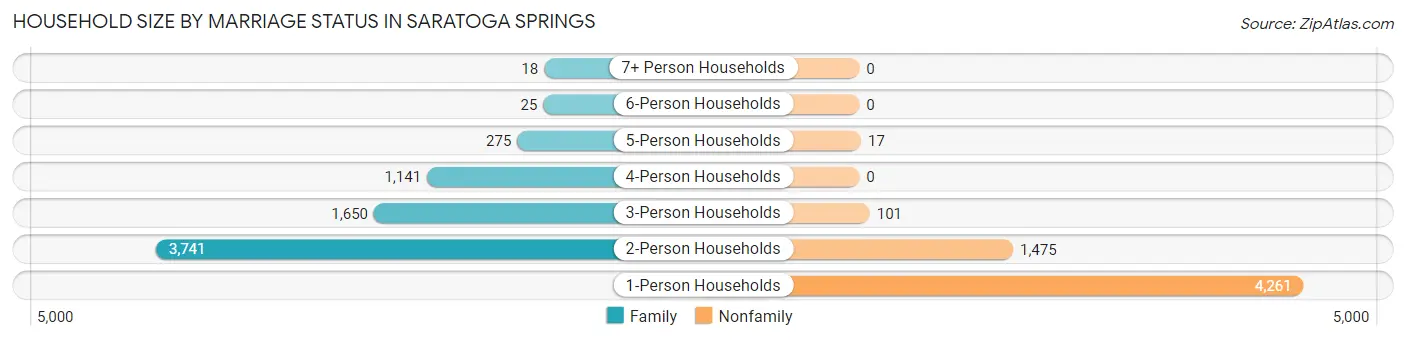
| Household Size | Family Households | Nonfamily Households |
| 1-Person Households | - | 4,261 (33.5%) |
| 2-Person Households | 3,741 (29.4%) | 1,475 (11.6%) |
| 3-Person Households | 1,650 (13.0%) | 101 (0.8%) |
| 4-Person Households | 1,141 (9.0%) | 0 (0.0%) |
| 5-Person Households | 275 (2.2%) | 17 (0.1%) |
| 6-Person Households | 25 (0.2%) | 0 (0.0%) |
| 7+ Person Households | 18 (0.1%) | 0 (0.0%) |
| Total | 6,850 (53.9%) | 5,854 (46.1%) |
Female Fertility in Saratoga Springs
Fertility by Age in Saratoga Springs
Average fertility rate in Saratoga Springs is 31.0 births per 1,000 women. Women in the age bracket of 35 to 50 years have the highest fertility rate with 43.0 births per 1,000 women. Women in the age bracket of 35 to 50 years acount for 53.0% of all women with births.
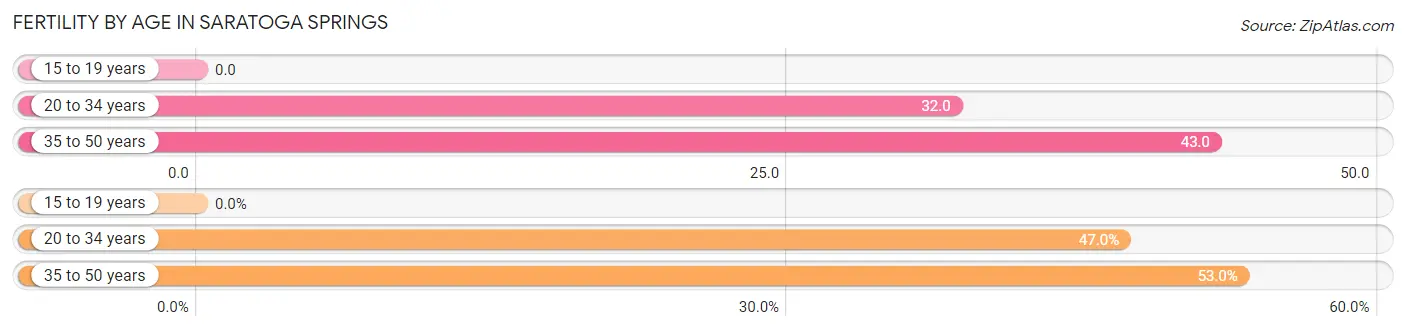
| Age Bracket | Women with Births | Births / 1,000 Women |
| 15 to 19 years | 0 (0.0%) | 0.0 |
| 20 to 34 years | 101 (47.0%) | 32.0 |
| 35 to 50 years | 114 (53.0%) | 43.0 |
| Total | 215 (100.0%) | 31.0 |
Fertility by Age by Marriage Status in Saratoga Springs
84.7% of women with births (215) in Saratoga Springs are married. The highest percentage of unmarried women with births falls into 20 to 34 years age bracket with 20.8% of them unmarried at the time of birth, while the lowest percentage of unmarried women with births belong to 35 to 50 years age bracket with 10.5% of them unmarried.
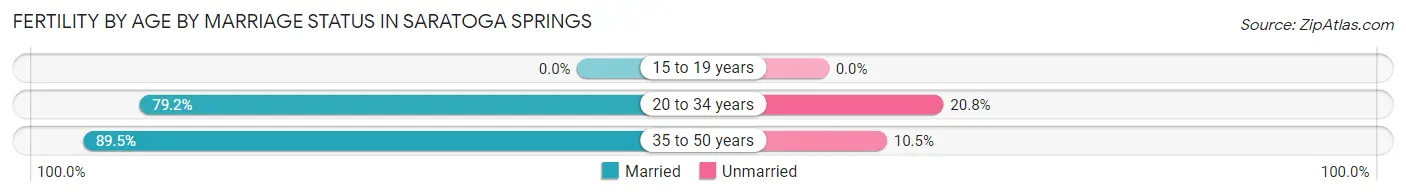
| Age Bracket | Married | Unmarried |
| 15 to 19 years | 0 (0.0%) | 0 (0.0%) |
| 20 to 34 years | 80 (79.2%) | 21 (20.8%) |
| 35 to 50 years | 102 (89.5%) | 12 (10.5%) |
| Total | 182 (84.7%) | 33 (15.3%) |
Fertility by Education in Saratoga Springs
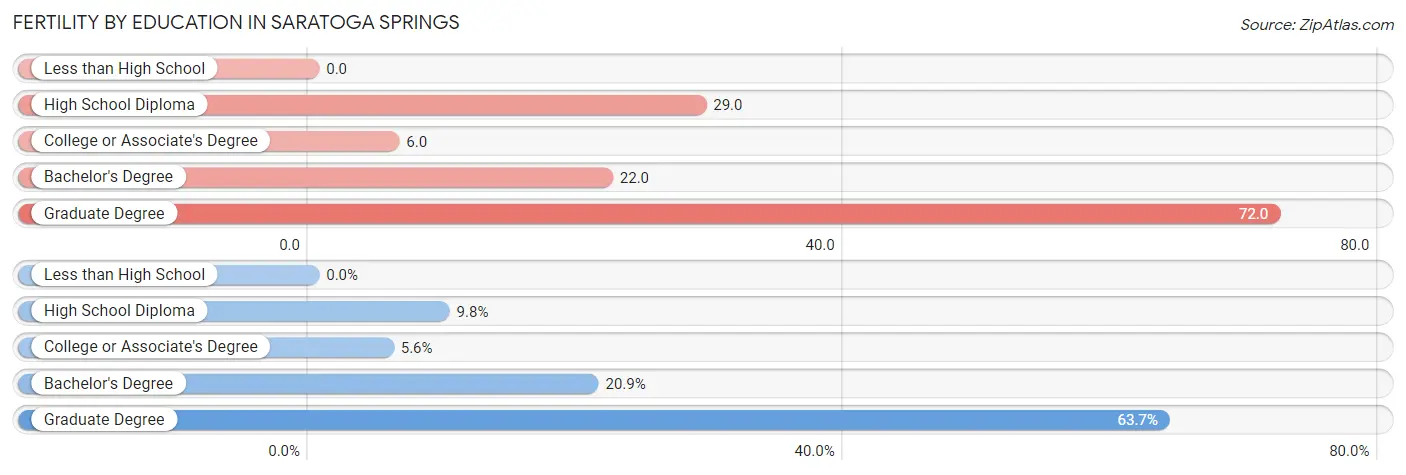
| Educational Attainment | Women with Births | Births / 1,000 Women |
| Less than High School | 0 (0.0%) | 0.0 |
| High School Diploma | 21 (9.8%) | 29.0 |
| College or Associate's Degree | 12 (5.6%) | 6.0 |
| Bachelor's Degree | 45 (20.9%) | 22.0 |
| Graduate Degree | 137 (63.7%) | 72.0 |
| Total | 215 (100.0%) | 31.0 |
Fertility by Education by Marriage Status in Saratoga Springs
15.3% of women with births in Saratoga Springs are unmarried. Women with the educational attainment of bachelor's degree are most likely to be married with 100.0% of them married at childbirth, while women with the educational attainment of high school diploma are least likely to be married with 100.0% of them unmarried at childbirth.
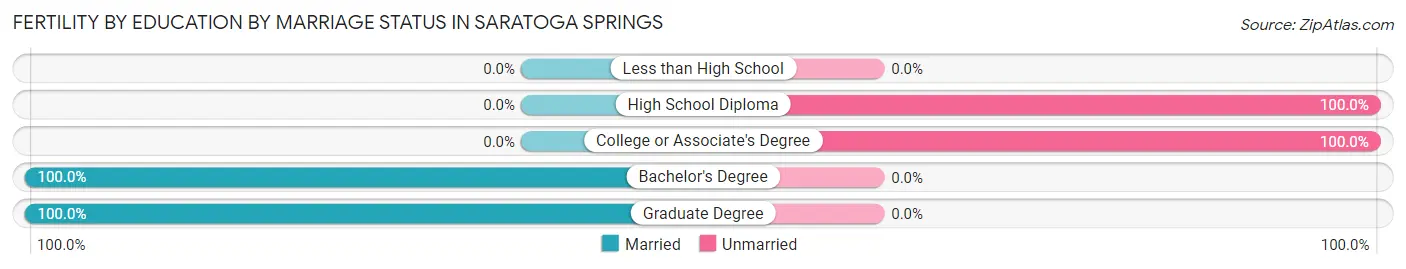
| Educational Attainment | Married | Unmarried |
| Less than High School | 0 (0.0%) | 0 (0.0%) |
| High School Diploma | 0 (0.0%) | 21 (100.0%) |
| College or Associate's Degree | 0 (0.0%) | 12 (100.0%) |
| Bachelor's Degree | 45 (100.0%) | 0 (0.0%) |
| Graduate Degree | 137 (100.0%) | 0 (0.0%) |
| Total | 182 (84.7%) | 33 (15.3%) |
Employment Characteristics in Saratoga Springs
Employment by Class of Employer in Saratoga Springs
Among the 15,103 employed individuals in Saratoga Springs, private company employees (8,557 | 56.7%), not-for-profit organizations (2,104 | 13.9%), and local government employees (1,218 | 8.1%) make up the most common classes of employment.
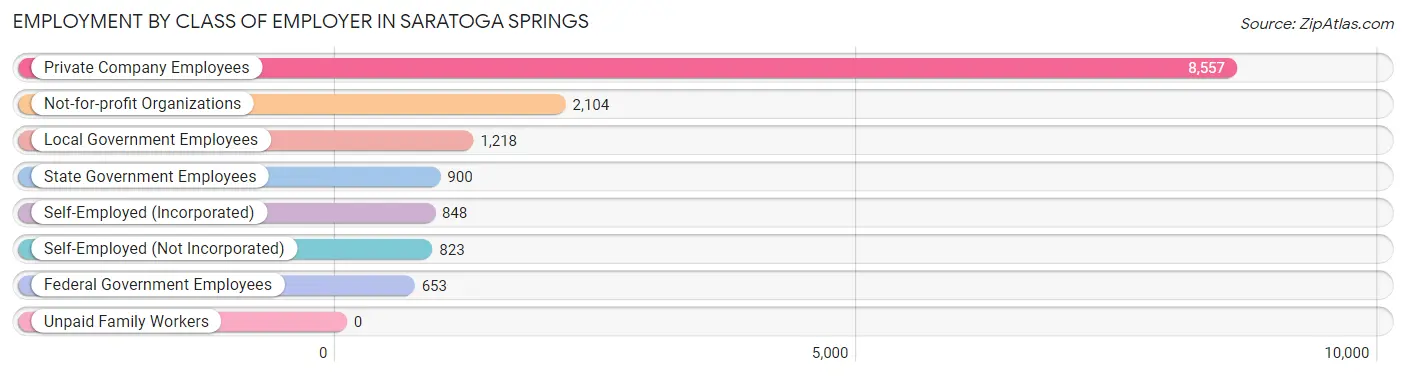
| Employer Class | # Employees | % Employees |
| Private Company Employees | 8,557 | 56.7% |
| Self-Employed (Incorporated) | 848 | 5.6% |
| Self-Employed (Not Incorporated) | 823 | 5.4% |
| Not-for-profit Organizations | 2,104 | 13.9% |
| Local Government Employees | 1,218 | 8.1% |
| State Government Employees | 900 | 6.0% |
| Federal Government Employees | 653 | 4.3% |
| Unpaid Family Workers | 0 | 0.0% |
| Total | 15,103 | 100.0% |
Employment Status by Age in Saratoga Springs
According to the labor force statistics for Saratoga Springs, out of the total population over 16 years of age (24,981), 63.6% or 15,888 individuals are in the labor force, with 2.7% or 429 of them unemployed. The age group with the highest labor force participation rate is 25 to 29 years, with 93.5% or 1,968 individuals in the labor force. Within the labor force, the 60 to 64 years age range has the highest percentage of unemployed individuals, with 10.2% or 133 of them being unemployed.
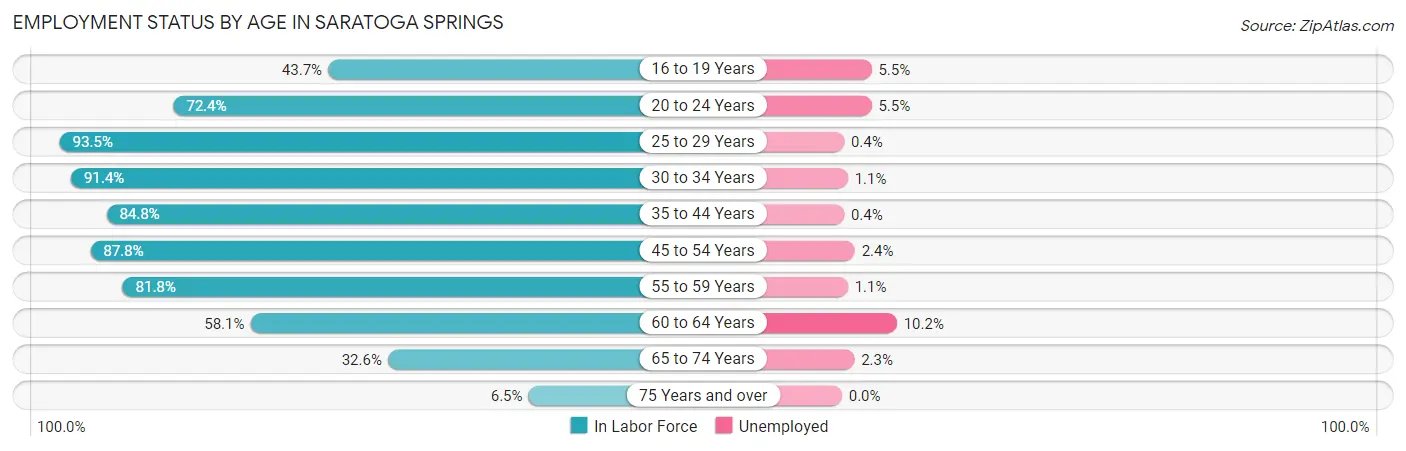
| Age Bracket | In Labor Force | Unemployed |
| 16 to 19 Years | 911 (43.7%) | 50 (5.5%) |
| 20 to 24 Years | 1,717 (72.4%) | 94 (5.5%) |
| 25 to 29 Years | 1,968 (93.5%) | 8 (0.4%) |
| 30 to 34 Years | 1,440 (91.4%) | 16 (1.1%) |
| 35 to 44 Years | 3,004 (84.8%) | 12 (0.4%) |
| 45 to 54 Years | 2,829 (87.8%) | 68 (2.4%) |
| 55 to 59 Years | 1,499 (81.8%) | 16 (1.1%) |
| 60 to 64 Years | 1,307 (58.1%) | 133 (10.2%) |
| 65 to 74 Years | 1,028 (32.6%) | 24 (2.3%) |
| 75 Years and over | 185 (6.5%) | 0 (0.0%) |
| Total | 15,888 (63.6%) | 429 (2.7%) |
Employment Status by Educational Attainment in Saratoga Springs
According to labor force statistics for Saratoga Springs, 82.9% of individuals (12,044) out of the total population between 25 and 64 years of age (14,528) are in the labor force, with 2.1% or 253 of them being unemployed. The group with the highest labor force participation rate are those with the educational attainment of bachelor's degree or higher, with 87.8% or 7,903 individuals in the labor force. Within the labor force, individuals with college / associate degree education have the highest percentage of unemployment, with 8.3% or 171 of them being unemployed.
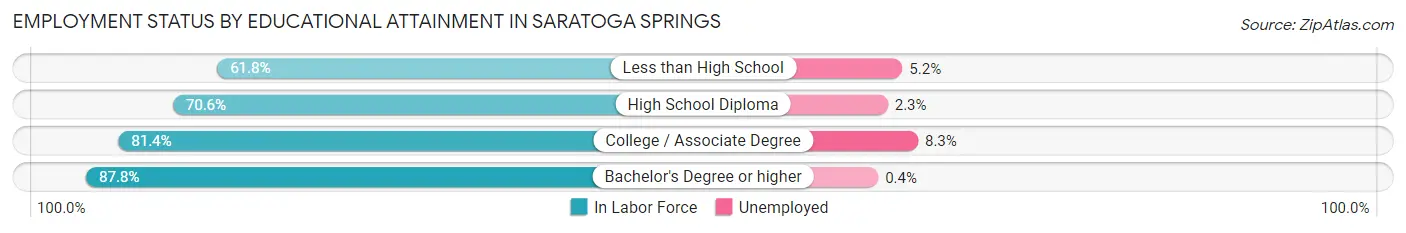
| Educational Attainment | In Labor Force | Unemployed |
| Less than High School | 248 (61.8%) | 21 (5.2%) |
| High School Diploma | 1,832 (70.6%) | 60 (2.3%) |
| College / Associate Degree | 2,060 (81.4%) | 210 (8.3%) |
| Bachelor's Degree or higher | 7,903 (87.8%) | 36 (0.4%) |
| Total | 12,044 (82.9%) | 305 (2.1%) |
Employment Occupations by Sex in Saratoga Springs
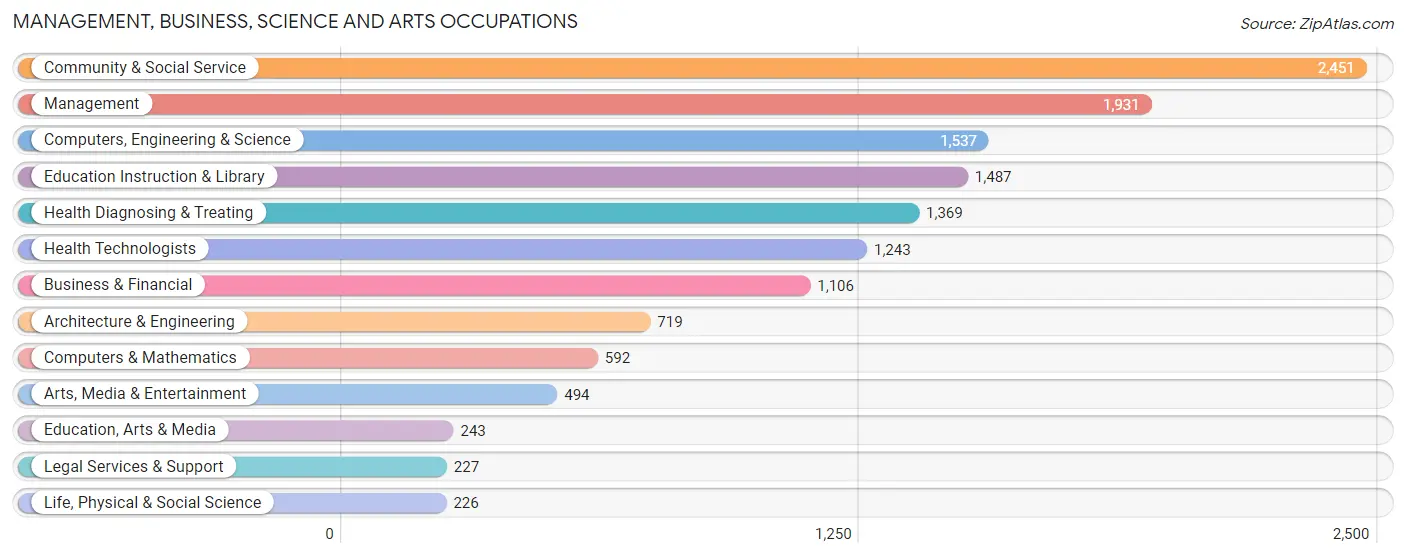
Management, Business, Science and Arts Occupations
The most common Management, Business, Science and Arts occupations in Saratoga Springs are Community & Social Service (2,451 | 16.1%), Management (1,931 | 12.7%), Computers, Engineering & Science (1,537 | 10.1%), Education Instruction & Library (1,487 | 9.8%), and Health Diagnosing & Treating (1,369 | 9.0%).
Management, Business, Science and Arts Occupations by Sex
Within the Management, Business, Science and Arts occupations in Saratoga Springs, the most male-oriented occupations are Architecture & Engineering (87.2%), Computers & Mathematics (86.8%), and Computers, Engineering & Science (84.7%), while the most female-oriented occupations are Education, Arts & Media (100.0%), Education Instruction & Library (72.5%), and Health Diagnosing & Treating (70.5%).
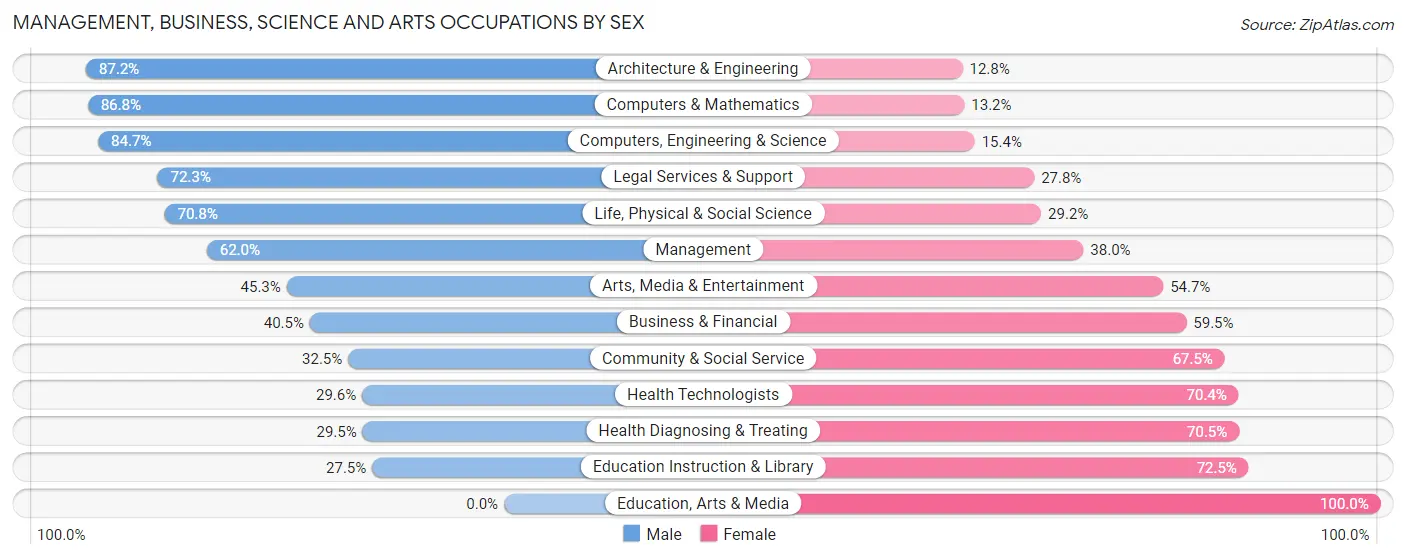
| Occupation | Male | Female |
| Management | 1,197 (62.0%) | 734 (38.0%) |
| Business & Financial | 448 (40.5%) | 658 (59.5%) |
| Computers, Engineering & Science | 1,301 (84.7%) | 236 (15.3%) |
| Computers & Mathematics | 514 (86.8%) | 78 (13.2%) |
| Architecture & Engineering | 627 (87.2%) | 92 (12.8%) |
| Life, Physical & Social Science | 160 (70.8%) | 66 (29.2%) |
| Community & Social Service | 797 (32.5%) | 1,654 (67.5%) |
| Education, Arts & Media | 0 (0.0%) | 243 (100.0%) |
| Legal Services & Support | 164 (72.3%) | 63 (27.8%) |
| Education Instruction & Library | 409 (27.5%) | 1,078 (72.5%) |
| Arts, Media & Entertainment | 224 (45.3%) | 270 (54.7%) |
| Health Diagnosing & Treating | 404 (29.5%) | 965 (70.5%) |
| Health Technologists | 368 (29.6%) | 875 (70.4%) |
| Total (Category) | 4,147 (49.4%) | 4,247 (50.6%) |
| Total (Overall) | 7,619 (50.0%) | 7,629 (50.0%) |
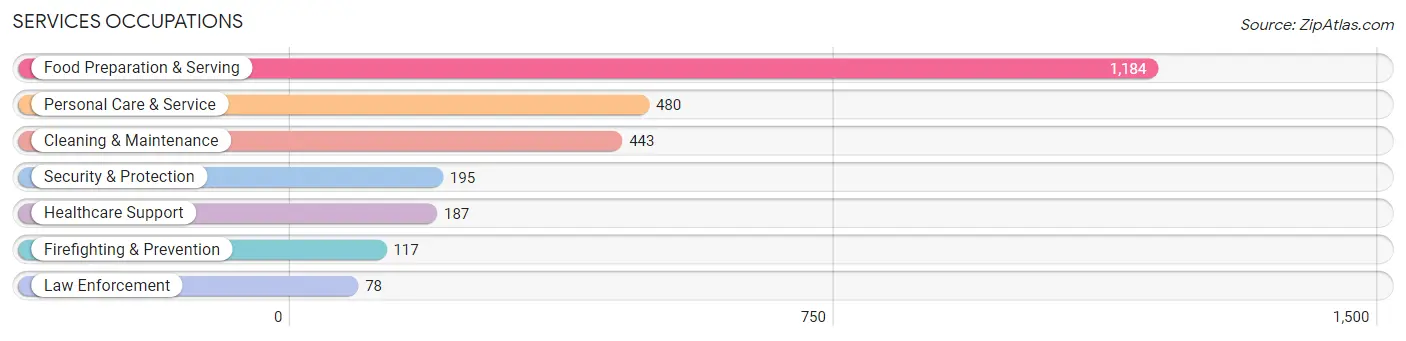
Services Occupations
The most common Services occupations in Saratoga Springs are Food Preparation & Serving (1,184 | 7.8%), Personal Care & Service (480 | 3.2%), Cleaning & Maintenance (443 | 2.9%), Security & Protection (195 | 1.3%), and Healthcare Support (187 | 1.2%).
Services Occupations by Sex
Within the Services occupations in Saratoga Springs, the most male-oriented occupations are Law Enforcement (93.6%), Security & Protection (86.2%), and Firefighting & Prevention (81.2%), while the most female-oriented occupations are Personal Care & Service (77.7%), Healthcare Support (75.9%), and Food Preparation & Serving (56.3%).
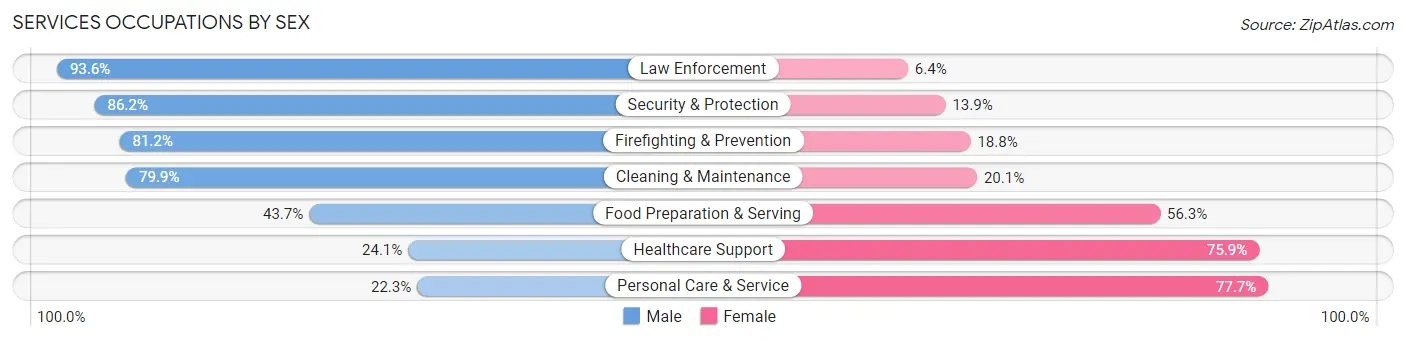
| Occupation | Male | Female |
| Healthcare Support | 45 (24.1%) | 142 (75.9%) |
| Security & Protection | 168 (86.2%) | 27 (13.9%) |
| Firefighting & Prevention | 95 (81.2%) | 22 (18.8%) |
| Law Enforcement | 73 (93.6%) | 5 (6.4%) |
| Food Preparation & Serving | 517 (43.7%) | 667 (56.3%) |
| Cleaning & Maintenance | 354 (79.9%) | 89 (20.1%) |
| Personal Care & Service | 107 (22.3%) | 373 (77.7%) |
| Total (Category) | 1,191 (47.8%) | 1,298 (52.1%) |
| Total (Overall) | 7,619 (50.0%) | 7,629 (50.0%) |
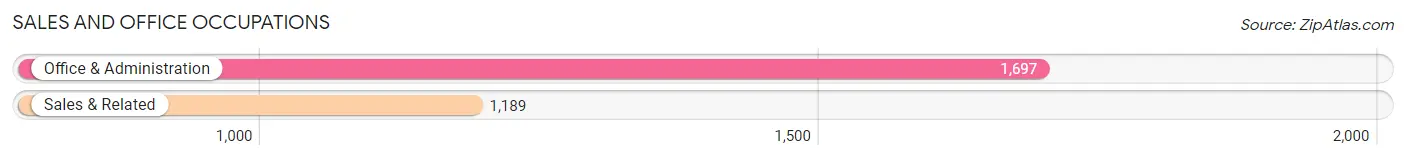
Sales and Office Occupations
The most common Sales and Office occupations in Saratoga Springs are Office & Administration (1,697 | 11.1%), and Sales & Related (1,189 | 7.8%).
Sales and Office Occupations by Sex
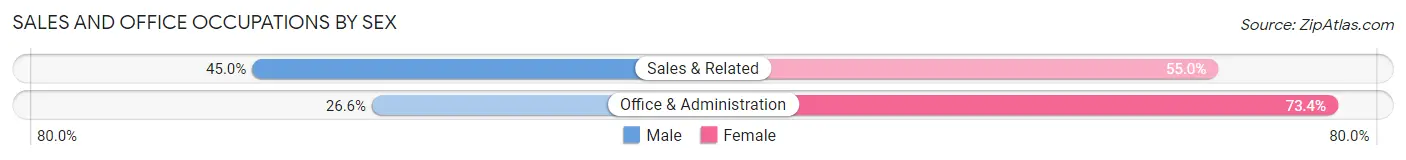
| Occupation | Male | Female |
| Sales & Related | 535 (45.0%) | 654 (55.0%) |
| Office & Administration | 451 (26.6%) | 1,246 (73.4%) |
| Total (Category) | 986 (34.2%) | 1,900 (65.8%) |
| Total (Overall) | 7,619 (50.0%) | 7,629 (50.0%) |
Natural Resources, Construction and Maintenance Occupations
The most common Natural Resources, Construction and Maintenance occupations in Saratoga Springs are Construction & Extraction (334 | 2.2%), Installation, Maintenance & Repair (172 | 1.1%), and Farming, Fishing & Forestry (32 | 0.2%).
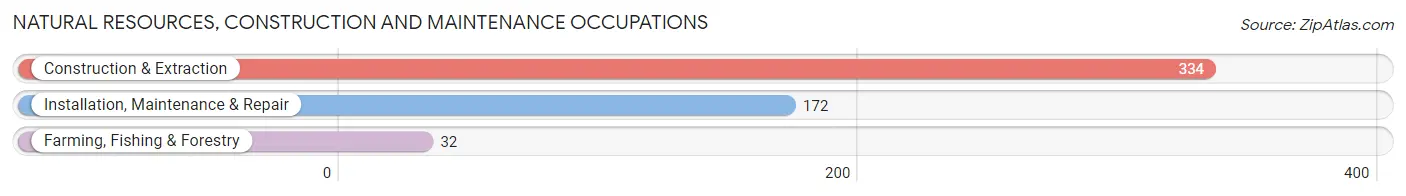
Natural Resources, Construction and Maintenance Occupations by Sex
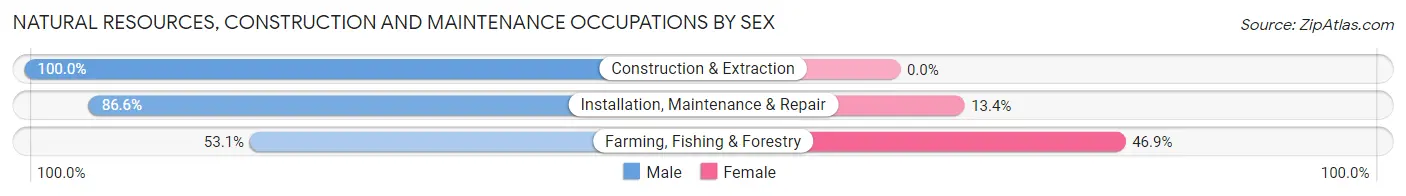
| Occupation | Male | Female |
| Farming, Fishing & Forestry | 17 (53.1%) | 15 (46.9%) |
| Construction & Extraction | 334 (100.0%) | 0 (0.0%) |
| Installation, Maintenance & Repair | 149 (86.6%) | 23 (13.4%) |
| Total (Category) | 500 (92.9%) | 38 (7.1%) |
| Total (Overall) | 7,619 (50.0%) | 7,629 (50.0%) |
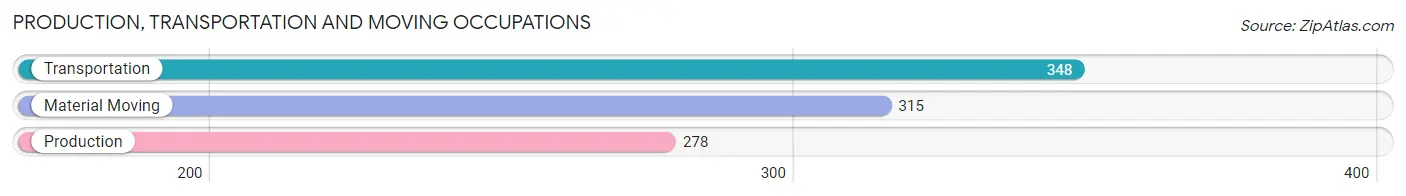
Production, Transportation and Moving Occupations
The most common Production, Transportation and Moving occupations in Saratoga Springs are Transportation (348 | 2.3%), Material Moving (315 | 2.1%), and Production (278 | 1.8%).
Production, Transportation and Moving Occupations by Sex
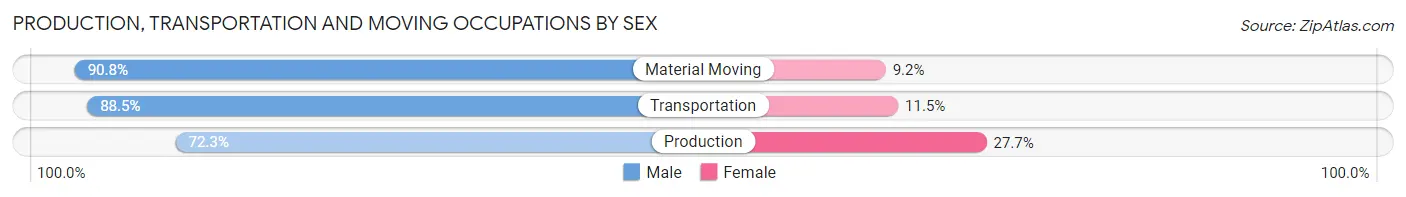
| Occupation | Male | Female |
| Production | 201 (72.3%) | 77 (27.7%) |
| Transportation | 308 (88.5%) | 40 (11.5%) |
| Material Moving | 286 (90.8%) | 29 (9.2%) |
| Total (Category) | 795 (84.5%) | 146 (15.5%) |
| Total (Overall) | 7,619 (50.0%) | 7,629 (50.0%) |
Employment Industries by Sex in Saratoga Springs
Employment Industries in Saratoga Springs
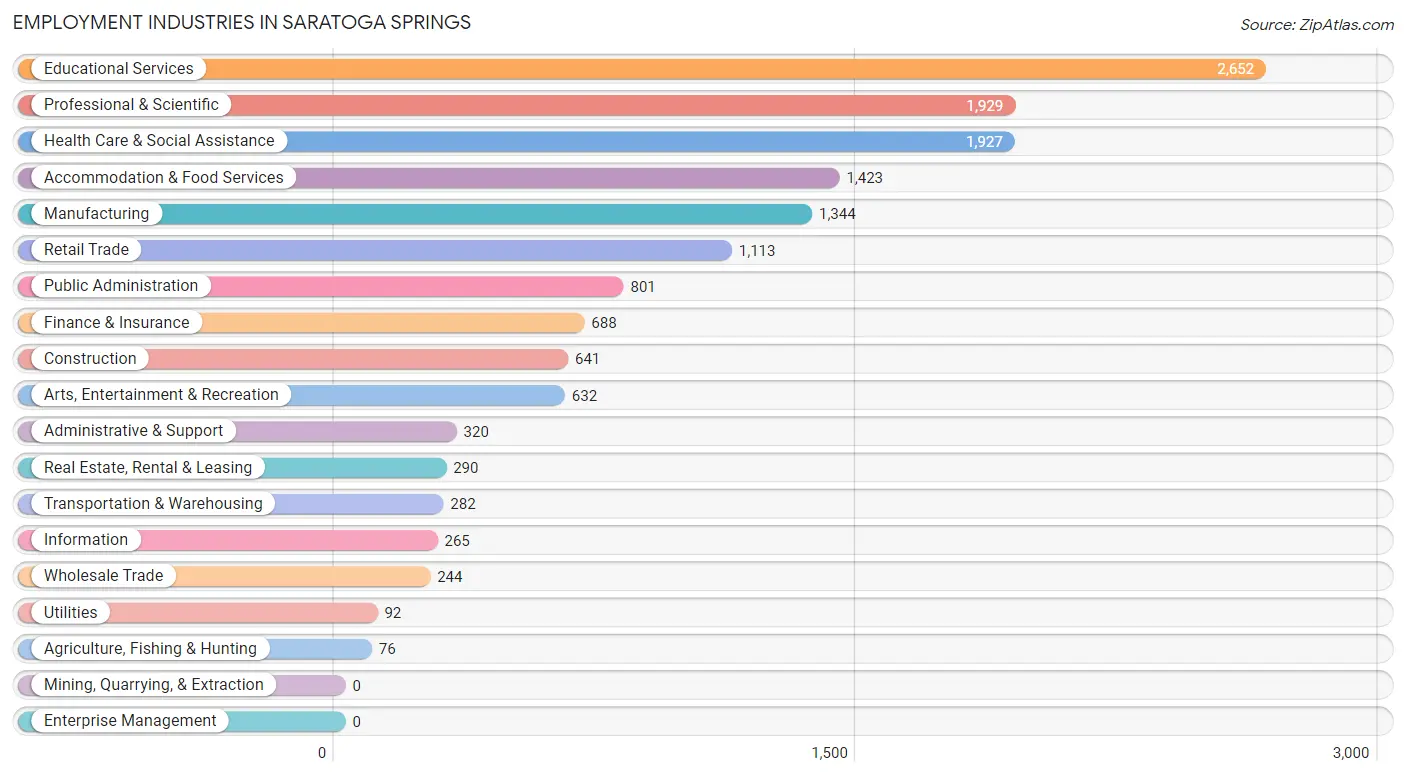
The major employment industries in Saratoga Springs include Educational Services (2,652 | 17.4%), Professional & Scientific (1,929 | 12.7%), Health Care & Social Assistance (1,927 | 12.6%), Accommodation & Food Services (1,423 | 9.3%), and Manufacturing (1,344 | 8.8%).
Employment Industries by Sex in Saratoga Springs
The Saratoga Springs industries that see more men than women are Construction (91.9%), Administrative & Support (82.2%), and Utilities (81.5%), whereas the industries that tend to have a higher number of women are Arts, Entertainment & Recreation (75.0%), Health Care & Social Assistance (70.4%), and Educational Services (66.5%).
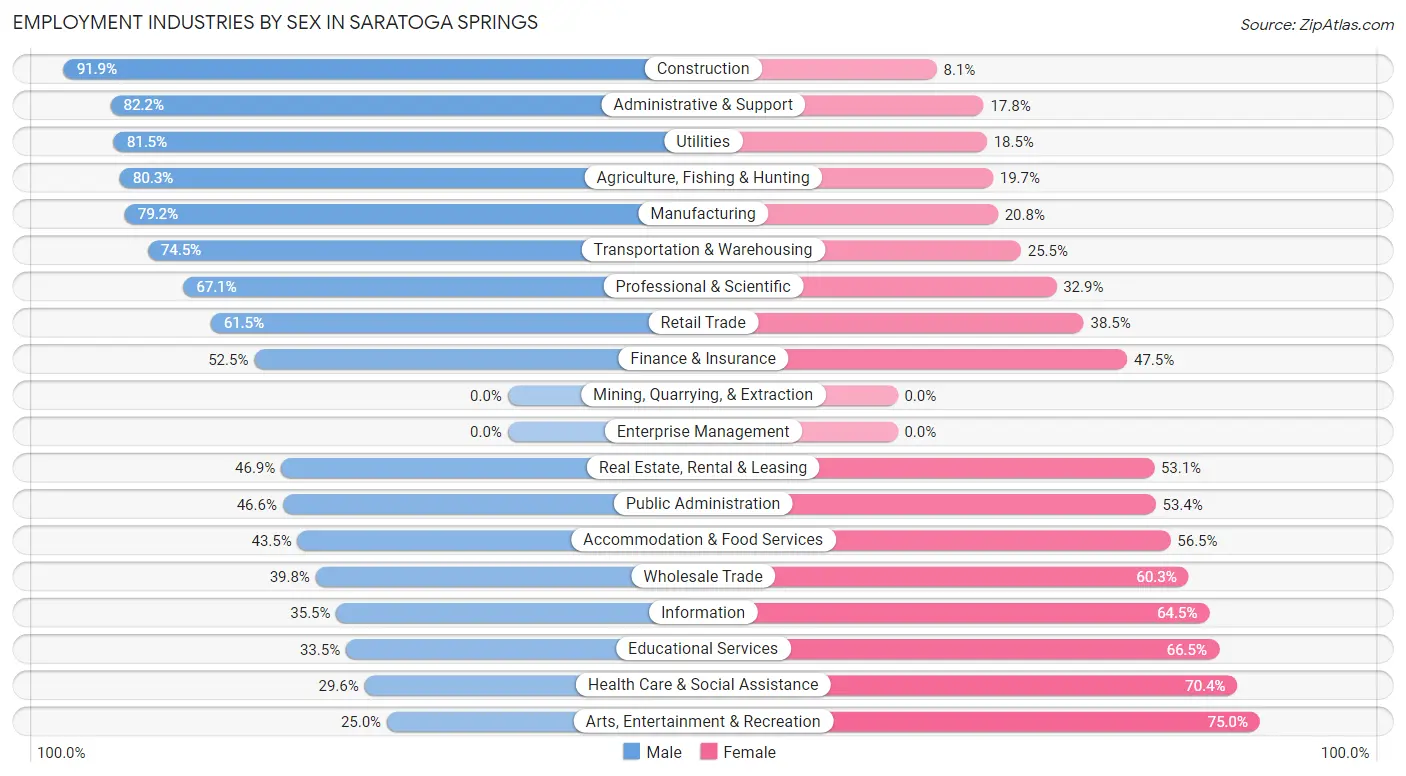
| Industry | Male | Female |
| Agriculture, Fishing & Hunting | 61 (80.3%) | 15 (19.7%) |
| Mining, Quarrying, & Extraction | 0 (0.0%) | 0 (0.0%) |
| Construction | 589 (91.9%) | 52 (8.1%) |
| Manufacturing | 1,065 (79.2%) | 279 (20.8%) |
| Wholesale Trade | 97 (39.8%) | 147 (60.3%) |
| Retail Trade | 684 (61.5%) | 429 (38.5%) |
| Transportation & Warehousing | 210 (74.5%) | 72 (25.5%) |
| Utilities | 75 (81.5%) | 17 (18.5%) |
| Information | 94 (35.5%) | 171 (64.5%) |
| Finance & Insurance | 361 (52.5%) | 327 (47.5%) |
| Real Estate, Rental & Leasing | 136 (46.9%) | 154 (53.1%) |
| Professional & Scientific | 1,295 (67.1%) | 634 (32.9%) |
| Enterprise Management | 0 (0.0%) | 0 (0.0%) |
| Administrative & Support | 263 (82.2%) | 57 (17.8%) |
| Educational Services | 888 (33.5%) | 1,764 (66.5%) |
| Health Care & Social Assistance | 571 (29.6%) | 1,356 (70.4%) |
| Arts, Entertainment & Recreation | 158 (25.0%) | 474 (75.0%) |
| Accommodation & Food Services | 619 (43.5%) | 804 (56.5%) |
| Public Administration | 373 (46.6%) | 428 (53.4%) |
| Total | 7,619 (50.0%) | 7,629 (50.0%) |
Education in Saratoga Springs
School Enrollment in Saratoga Springs
The most common levels of schooling among the 6,509 students in Saratoga Springs are college / undergraduate (2,911 | 44.7%), high school (1,086 | 16.7%), and elementary school (841 | 12.9%).
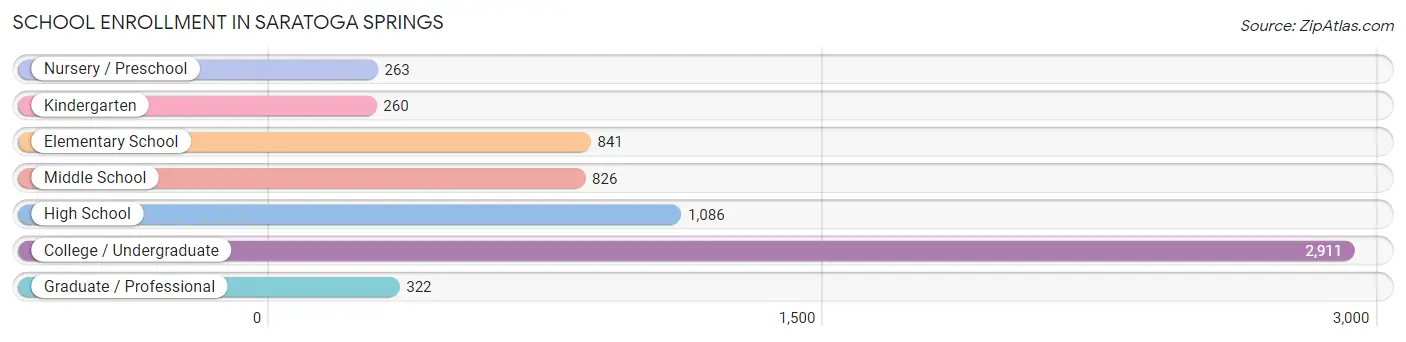
| School Level | # Students | % Students |
| Nursery / Preschool | 263 | 4.0% |
| Kindergarten | 260 | 4.0% |
| Elementary School | 841 | 12.9% |
| Middle School | 826 | 12.7% |
| High School | 1,086 | 16.7% |
| College / Undergraduate | 2,911 | 44.7% |
| Graduate / Professional | 322 | 5.0% |
| Total | 6,509 | 100.0% |
School Enrollment by Age by Funding Source in Saratoga Springs
Out of a total of 6,509 students who are enrolled in schools in Saratoga Springs, 2,831 (43.5%) attend a private institution, while the remaining 3,678 (56.5%) are enrolled in public schools. The age group of 18 to 19 year olds has the highest likelihood of being enrolled in private schools, with 1,303 (84.5% in the age bracket) enrolled. Conversely, the age group of 10 to 14 year olds has the lowest likelihood of being enrolled in a private school, with 1,074 (97.5% in the age bracket) attending a public institution.
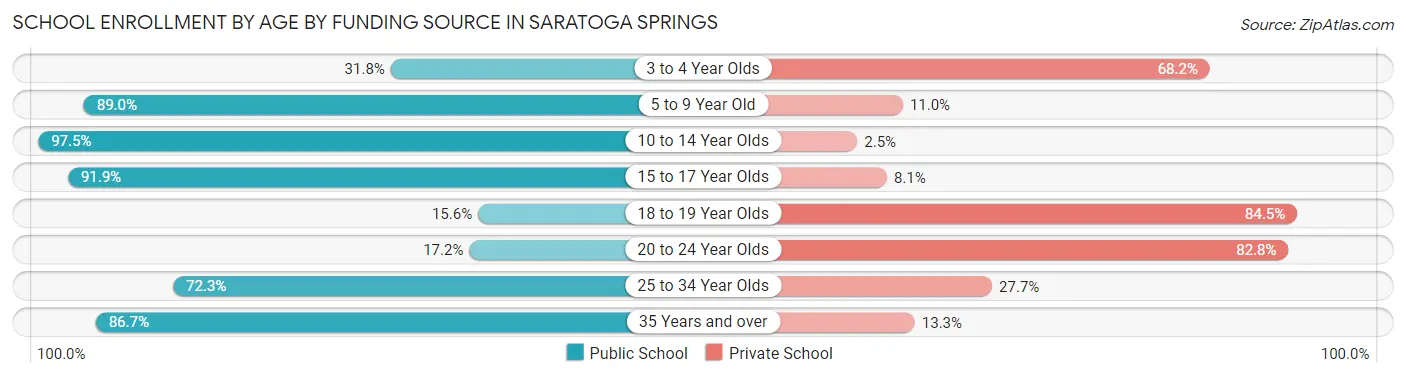
| Age Bracket | Public School | Private School |
| 3 to 4 Year Olds | 70 (31.8%) | 150 (68.2%) |
| 5 to 9 Year Old | 959 (89.0%) | 119 (11.0%) |
| 10 to 14 Year Olds | 1,074 (97.5%) | 28 (2.5%) |
| 15 to 17 Year Olds | 615 (91.9%) | 54 (8.1%) |
| 18 to 19 Year Olds | 240 (15.5%) | 1,303 (84.5%) |
| 20 to 24 Year Olds | 216 (17.2%) | 1,041 (82.8%) |
| 25 to 34 Year Olds | 272 (72.3%) | 104 (27.7%) |
| 35 Years and over | 229 (86.7%) | 35 (13.3%) |
| Total | 3,678 (56.5%) | 2,831 (43.5%) |
Educational Attainment by Field of Study in Saratoga Springs
Business (2,090 | 15.8%), education (1,681 | 12.7%), social sciences (1,314 | 9.9%), psychology (1,253 | 9.4%), and science & technology (1,192 | 9.0%) are the most common fields of study among 13,268 individuals in Saratoga Springs who have obtained a bachelor's degree or higher.
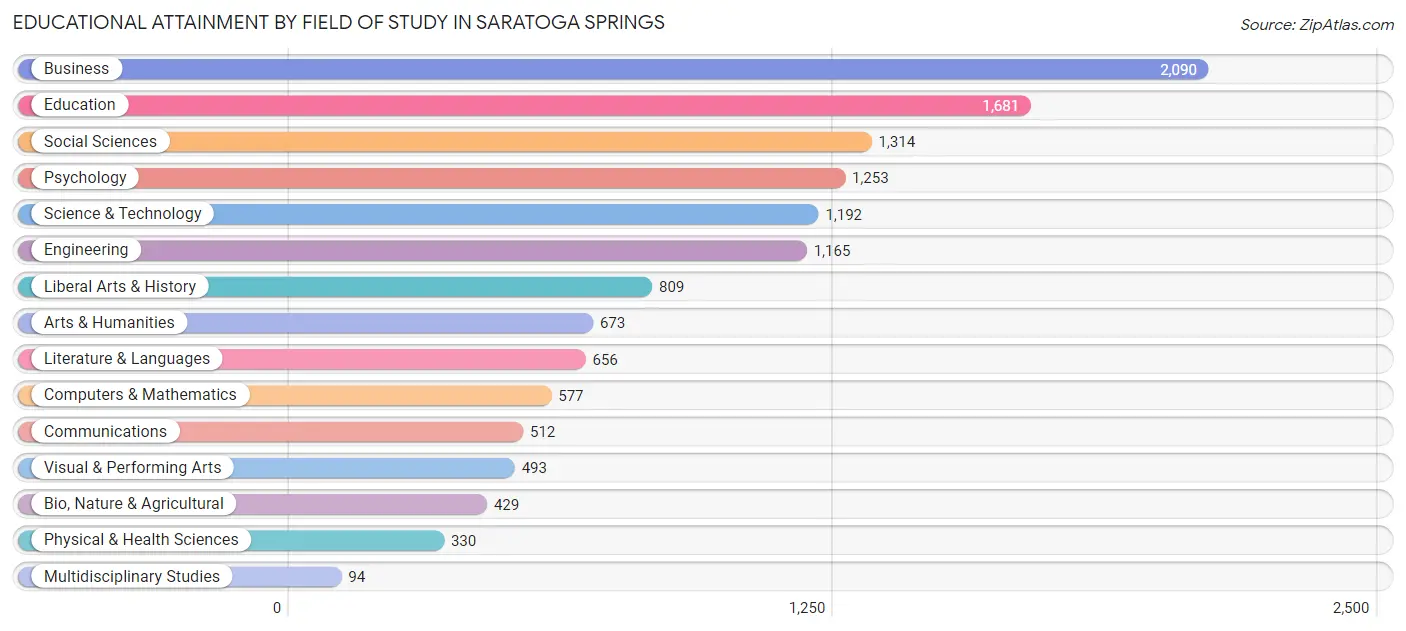
| Field of Study | # Graduates | % Graduates |
| Computers & Mathematics | 577 | 4.3% |
| Bio, Nature & Agricultural | 429 | 3.2% |
| Physical & Health Sciences | 330 | 2.5% |
| Psychology | 1,253 | 9.4% |
| Social Sciences | 1,314 | 9.9% |
| Engineering | 1,165 | 8.8% |
| Multidisciplinary Studies | 94 | 0.7% |
| Science & Technology | 1,192 | 9.0% |
| Business | 2,090 | 15.8% |
| Education | 1,681 | 12.7% |
| Literature & Languages | 656 | 4.9% |
| Liberal Arts & History | 809 | 6.1% |
| Visual & Performing Arts | 493 | 3.7% |
| Communications | 512 | 3.9% |
| Arts & Humanities | 673 | 5.1% |
| Total | 13,268 | 100.0% |
Transportation & Commute in Saratoga Springs
Vehicle Availability by Sex in Saratoga Springs
The most prevalent vehicle ownership categories in Saratoga Springs are males with 2 vehicles (3,627, accounting for 49.9%) and females with 2 vehicles (3,297, making up 51.5%).
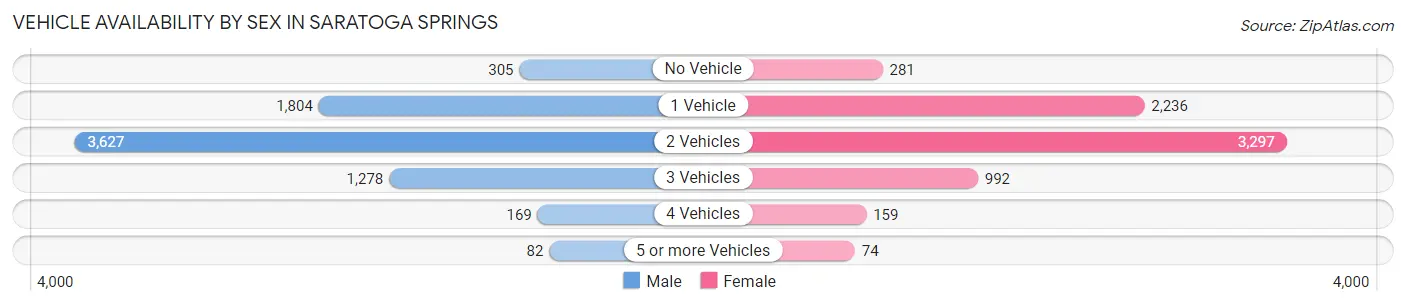
| Vehicles Available | Male | Female |
| No Vehicle | 305 (4.2%) | 281 (4.0%) |
| 1 Vehicle | 1,804 (24.8%) | 2,236 (31.8%) |
| 2 Vehicles | 3,627 (49.9%) | 3,297 (46.8%) |
| 3 Vehicles | 1,278 (17.6%) | 992 (14.1%) |
| 4 Vehicles | 169 (2.3%) | 159 (2.3%) |
| 5 or more Vehicles | 82 (1.1%) | 74 (1.1%) |
| Total | 7,265 (100.0%) | 7,039 (100.0%) |
Commute Time in Saratoga Springs
The most frequently occuring commute durations in Saratoga Springs are 10 to 14 minutes (2,480 commuters, 20.4%), 5 to 9 minutes (1,840 commuters, 15.2%), and 30 to 34 minutes (1,477 commuters, 12.2%).
| Commute Time | # Commuters | % Commuters |
| Less than 5 Minutes | 738 | 6.1% |
| 5 to 9 Minutes | 1,840 | 15.2% |
| 10 to 14 Minutes | 2,480 | 20.4% |
| 15 to 19 Minutes | 967 | 8.0% |
| 20 to 24 Minutes | 1,189 | 9.8% |
| 25 to 29 Minutes | 718 | 5.9% |
| 30 to 34 Minutes | 1,477 | 12.2% |
| 35 to 39 Minutes | 378 | 3.1% |
| 40 to 44 Minutes | 636 | 5.2% |
| 45 to 59 Minutes | 1,029 | 8.5% |
| 60 to 89 Minutes | 276 | 2.3% |
| 90 or more Minutes | 403 | 3.3% |
Commute Time by Sex in Saratoga Springs
The most common commute times in Saratoga Springs are 10 to 14 minutes (1,155 commuters, 19.2%) for males and 10 to 14 minutes (1,325 commuters, 21.6%) for females.
| Commute Time | Male | Female |
| Less than 5 Minutes | 215 (3.6%) | 523 (8.5%) |
| 5 to 9 Minutes | 902 (15.0%) | 938 (15.3%) |
| 10 to 14 Minutes | 1,155 (19.2%) | 1,325 (21.6%) |
| 15 to 19 Minutes | 508 (8.5%) | 459 (7.5%) |
| 20 to 24 Minutes | 640 (10.7%) | 549 (9.0%) |
| 25 to 29 Minutes | 511 (8.5%) | 207 (3.4%) |
| 30 to 34 Minutes | 625 (10.4%) | 852 (13.9%) |
| 35 to 39 Minutes | 256 (4.3%) | 122 (2.0%) |
| 40 to 44 Minutes | 424 (7.1%) | 212 (3.5%) |
| 45 to 59 Minutes | 597 (9.9%) | 432 (7.0%) |
| 60 to 89 Minutes | 133 (2.2%) | 143 (2.3%) |
| 90 or more Minutes | 39 (0.6%) | 364 (5.9%) |
Time of Departure to Work by Sex in Saratoga Springs
The most frequent times of departure to work in Saratoga Springs are 7:00 AM to 7:29 AM (1,107, 18.4%) for males and 8:00 AM to 8:29 AM (983, 16.1%) for females.
| Time of Departure | Male | Female |
| 12:00 AM to 4:59 AM | 49 (0.8%) | 16 (0.3%) |
| 5:00 AM to 5:29 AM | 192 (3.2%) | 56 (0.9%) |
| 5:30 AM to 5:59 AM | 205 (3.4%) | 231 (3.8%) |
| 6:00 AM to 6:29 AM | 276 (4.6%) | 543 (8.9%) |
| 6:30 AM to 6:59 AM | 887 (14.8%) | 667 (10.9%) |
| 7:00 AM to 7:29 AM | 1,107 (18.4%) | 783 (12.8%) |
| 7:30 AM to 7:59 AM | 499 (8.3%) | 580 (9.5%) |
| 8:00 AM to 8:29 AM | 981 (16.3%) | 983 (16.1%) |
| 8:30 AM to 8:59 AM | 590 (9.8%) | 598 (9.8%) |
| 9:00 AM to 9:59 AM | 293 (4.9%) | 547 (8.9%) |
| 10:00 AM to 10:59 AM | 148 (2.5%) | 267 (4.4%) |
| 11:00 AM to 11:59 AM | 84 (1.4%) | 136 (2.2%) |
| 12:00 PM to 3:59 PM | 444 (7.4%) | 468 (7.6%) |
| 4:00 PM to 11:59 PM | 250 (4.2%) | 251 (4.1%) |
| Total | 6,005 (100.0%) | 6,126 (100.0%) |
Housing Occupancy in Saratoga Springs
Occupancy by Ownership in Saratoga Springs
Of the total 12,704 dwellings in Saratoga Springs, owner-occupied units account for 7,195 (56.6%), while renter-occupied units make up 5,509 (43.4%).
| Occupancy | # Housing Units | % Housing Units |
| Owner Occupied Housing Units | 7,195 | 56.6% |
| Renter-Occupied Housing Units | 5,509 | 43.4% |
| Total Occupied Housing Units | 12,704 | 100.0% |
Occupancy by Household Size in Saratoga Springs
| Household Size | # Housing Units | % Housing Units |
| 1-Person Household | 4,261 | 33.5% |
| 2-Person Household | 5,216 | 41.1% |
| 3-Person Household | 1,751 | 13.8% |
| 4+ Person Household | 1,476 | 11.6% |
| Total Housing Units | 12,704 | 100.0% |
Occupancy by Ownership by Household Size in Saratoga Springs
| Household Size | Owner-occupied | Renter-occupied |
| 1-Person Household | 1,526 (35.8%) | 2,735 (64.2%) |
| 2-Person Household | 3,164 (60.7%) | 2,052 (39.3%) |
| 3-Person Household | 1,204 (68.8%) | 547 (31.2%) |
| 4+ Person Household | 1,301 (88.1%) | 175 (11.9%) |
| Total Housing Units | 7,195 (56.6%) | 5,509 (43.4%) |
Occupancy by Educational Attainment in Saratoga Springs
| Household Size | Owner-occupied | Renter-occupied |
| Less than High School | 233 (53.2%) | 205 (46.8%) |
| High School Diploma | 597 (36.7%) | 1,028 (63.3%) |
| College/Associate Degree | 1,384 (55.4%) | 1,115 (44.6%) |
| Bachelor's Degree or higher | 4,981 (61.2%) | 3,161 (38.8%) |
Occupancy by Age of Householder in Saratoga Springs
| Age Bracket | # Households | % Households |
| Under 35 Years | 2,745 | 21.6% |
| 35 to 44 Years | 1,998 | 15.7% |
| 45 to 54 Years | 1,831 | 14.4% |
| 55 to 64 Years | 2,377 | 18.7% |
| 65 to 74 Years | 2,059 | 16.2% |
| 75 to 84 Years | 1,232 | 9.7% |
| 85 Years and Over | 462 | 3.6% |
| Total | 12,704 | 100.0% |
Housing Finances in Saratoga Springs
Median Income by Occupancy in Saratoga Springs
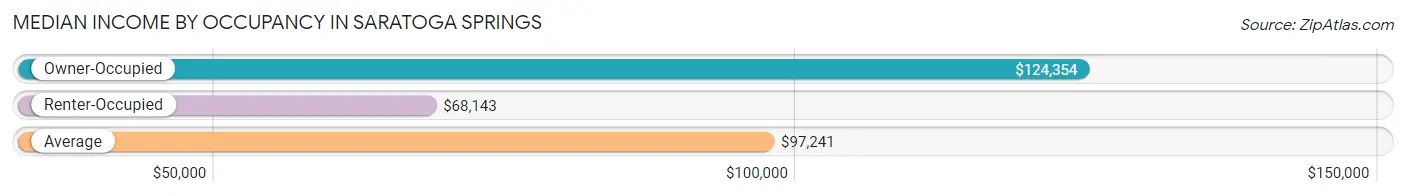
| Occupancy Type | # Households | Median Income |
| Owner-Occupied | 7,195 (56.6%) | $124,354 |
| Renter-Occupied | 5,509 (43.4%) | $68,143 |
| Average | 12,704 (100.0%) | $97,241 |
Occupancy by Householder Income Bracket in Saratoga Springs
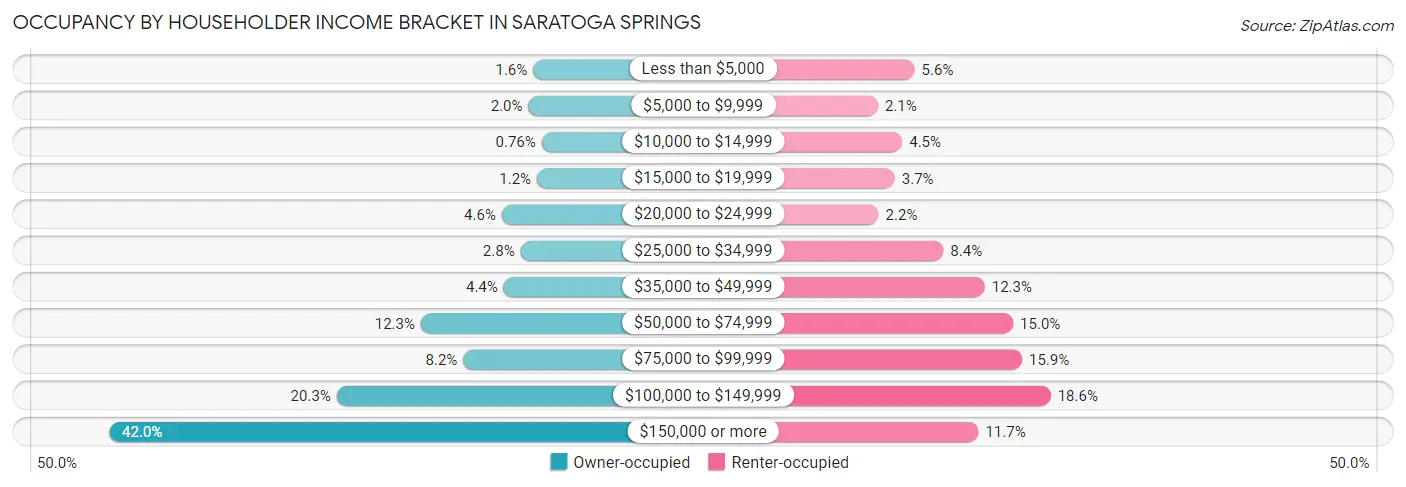
| Income Bracket | Owner-occupied | Renter-occupied |
| Less than $5,000 | 113 (1.6%) | 310 (5.6%) |
| $5,000 to $9,999 | 146 (2.0%) | 118 (2.1%) |
| $10,000 to $14,999 | 55 (0.8%) | 245 (4.4%) |
| $15,000 to $19,999 | 87 (1.2%) | 206 (3.7%) |
| $20,000 to $24,999 | 328 (4.6%) | 121 (2.2%) |
| $25,000 to $34,999 | 199 (2.8%) | 461 (8.4%) |
| $35,000 to $49,999 | 315 (4.4%) | 678 (12.3%) |
| $50,000 to $74,999 | 883 (12.3%) | 827 (15.0%) |
| $75,000 to $99,999 | 592 (8.2%) | 874 (15.9%) |
| $100,000 to $149,999 | 1,459 (20.3%) | 1,024 (18.6%) |
| $150,000 or more | 3,018 (41.9%) | 645 (11.7%) |
| Total | 7,195 (100.0%) | 5,509 (100.0%) |
Monthly Housing Cost Tiers in Saratoga Springs
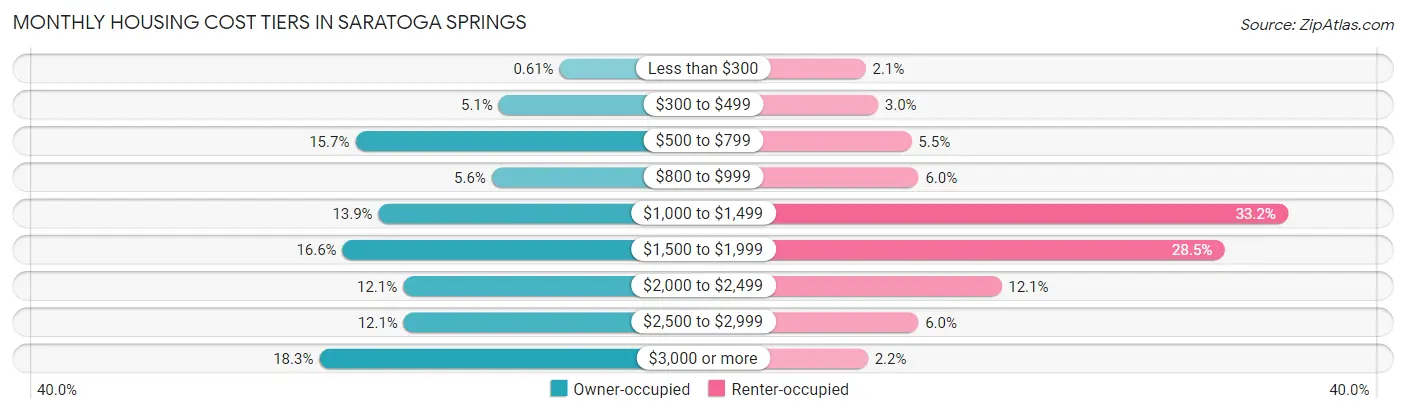
| Monthly Cost | Owner-occupied | Renter-occupied |
| Less than $300 | 44 (0.6%) | 114 (2.1%) |
| $300 to $499 | 366 (5.1%) | 164 (3.0%) |
| $500 to $799 | 1,126 (15.7%) | 300 (5.4%) |
| $800 to $999 | 403 (5.6%) | 329 (6.0%) |
| $1,000 to $1,499 | 1,003 (13.9%) | 1,827 (33.2%) |
| $1,500 to $1,999 | 1,194 (16.6%) | 1,569 (28.5%) |
| $2,000 to $2,499 | 873 (12.1%) | 665 (12.1%) |
| $2,500 to $2,999 | 869 (12.1%) | 328 (5.9%) |
| $3,000 or more | 1,317 (18.3%) | 123 (2.2%) |
| Total | 7,195 (100.0%) | 5,509 (100.0%) |
Physical Housing Characteristics in Saratoga Springs
Housing Structures in Saratoga Springs
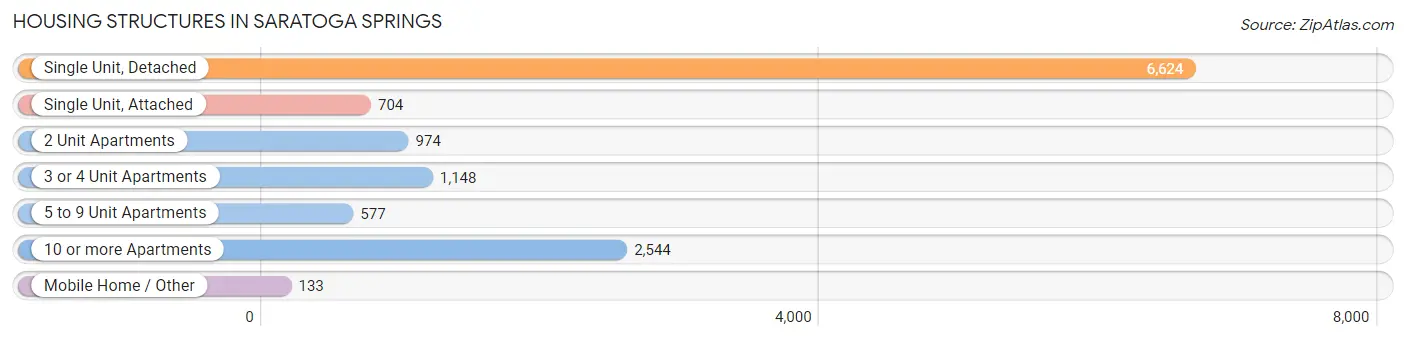
| Structure Type | # Housing Units | % Housing Units |
| Single Unit, Detached | 6,624 | 52.1% |
| Single Unit, Attached | 704 | 5.5% |
| 2 Unit Apartments | 974 | 7.7% |
| 3 or 4 Unit Apartments | 1,148 | 9.0% |
| 5 to 9 Unit Apartments | 577 | 4.5% |
| 10 or more Apartments | 2,544 | 20.0% |
| Mobile Home / Other | 133 | 1.1% |
| Total | 12,704 | 100.0% |
Housing Structures by Occupancy in Saratoga Springs
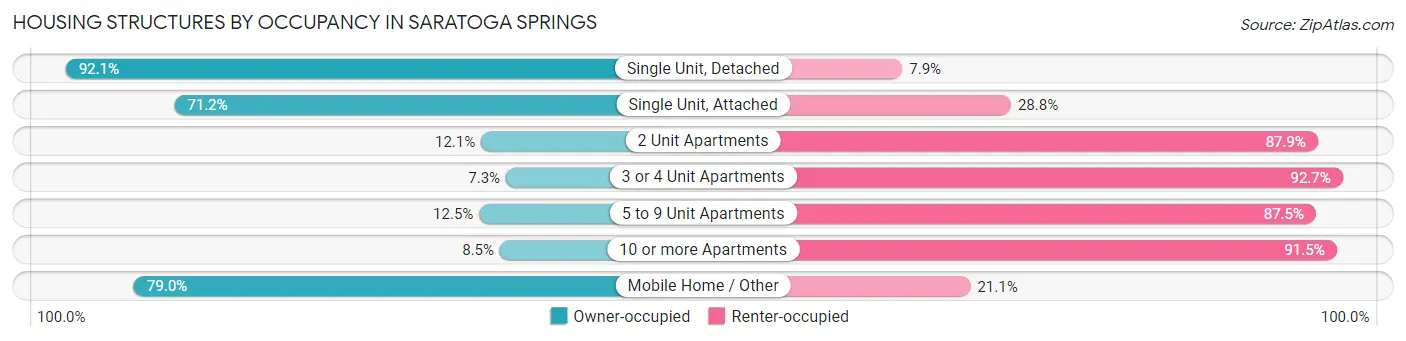
| Structure Type | Owner-occupied | Renter-occupied |
| Single Unit, Detached | 6,099 (92.1%) | 525 (7.9%) |
| Single Unit, Attached | 501 (71.2%) | 203 (28.8%) |
| 2 Unit Apartments | 118 (12.1%) | 856 (87.9%) |
| 3 or 4 Unit Apartments | 84 (7.3%) | 1,064 (92.7%) |
| 5 to 9 Unit Apartments | 72 (12.5%) | 505 (87.5%) |
| 10 or more Apartments | 216 (8.5%) | 2,328 (91.5%) |
| Mobile Home / Other | 105 (78.9%) | 28 (21.0%) |
| Total | 7,195 (56.6%) | 5,509 (43.4%) |
Housing Structures by Number of Rooms in Saratoga Springs
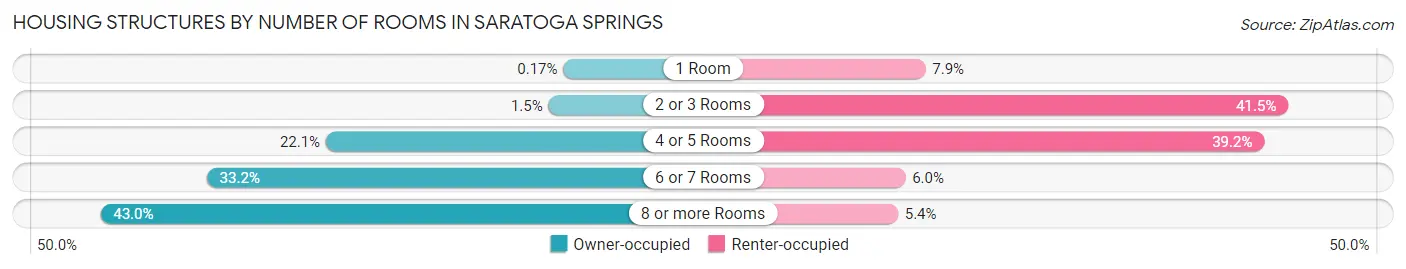
| Number of Rooms | Owner-occupied | Renter-occupied |
| 1 Room | 12 (0.2%) | 435 (7.9%) |
| 2 or 3 Rooms | 111 (1.5%) | 2,284 (41.5%) |
| 4 or 5 Rooms | 1,592 (22.1%) | 2,162 (39.2%) |
| 6 or 7 Rooms | 2,386 (33.2%) | 333 (6.0%) |
| 8 or more Rooms | 3,094 (43.0%) | 295 (5.3%) |
| Total | 7,195 (100.0%) | 5,509 (100.0%) |
Housing Structure by Heating Type in Saratoga Springs
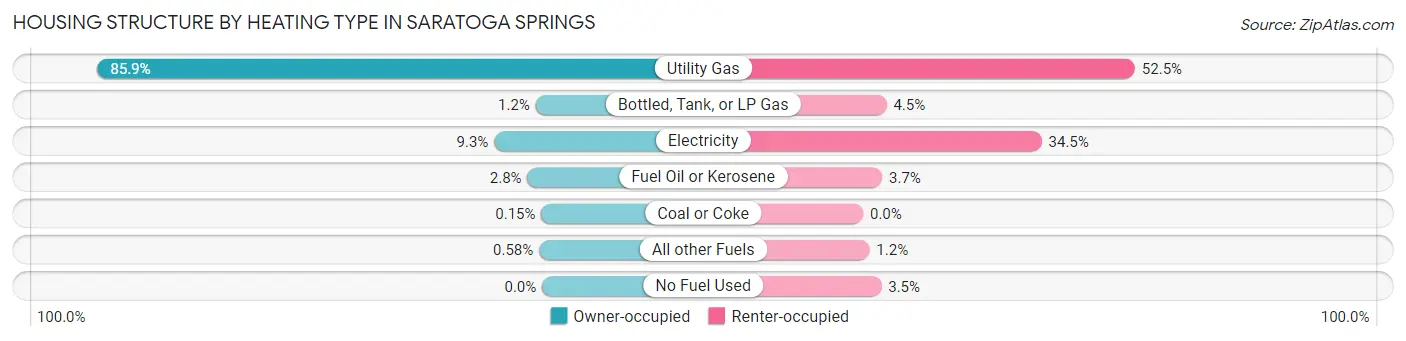
| Heating Type | Owner-occupied | Renter-occupied |
| Utility Gas | 6,183 (85.9%) | 2,894 (52.5%) |
| Bottled, Tank, or LP Gas | 89 (1.2%) | 249 (4.5%) |
| Electricity | 666 (9.3%) | 1,901 (34.5%) |
| Fuel Oil or Kerosene | 204 (2.8%) | 203 (3.7%) |
| Coal or Coke | 11 (0.2%) | 0 (0.0%) |
| All other Fuels | 42 (0.6%) | 68 (1.2%) |
| No Fuel Used | 0 (0.0%) | 194 (3.5%) |
| Total | 7,195 (100.0%) | 5,509 (100.0%) |
Household Vehicle Usage in Saratoga Springs
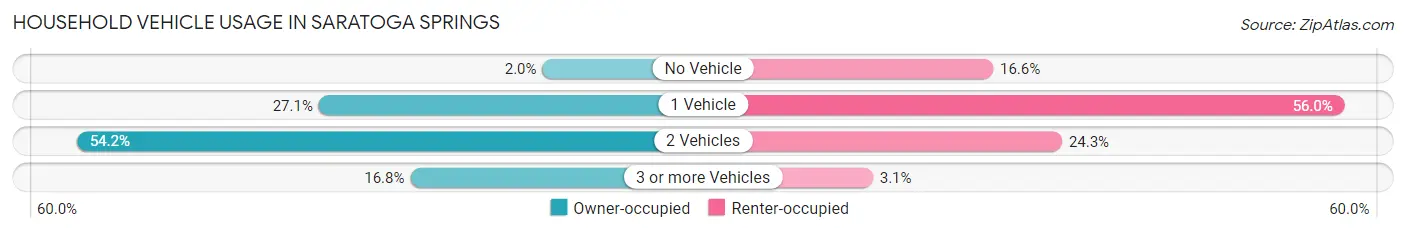
| Vehicles per Household | Owner-occupied | Renter-occupied |
| No Vehicle | 144 (2.0%) | 914 (16.6%) |
| 1 Vehicle | 1,946 (27.1%) | 3,084 (56.0%) |
| 2 Vehicles | 3,897 (54.2%) | 1,339 (24.3%) |
| 3 or more Vehicles | 1,208 (16.8%) | 172 (3.1%) |
| Total | 7,195 (100.0%) | 5,509 (100.0%) |
Real Estate & Mortgages in Saratoga Springs
Real Estate and Mortgage Overview in Saratoga Springs
| Characteristic | Without Mortgage | With Mortgage |
| Housing Units | 2,625 | 4,570 |
| Median Property Value | $403,700 | $433,200 |
| Median Household Income | $80,689 | $2,388 |
| Monthly Housing Costs | $760 | $1,307 |
| Real Estate Taxes | $4,978 | $0 |
Property Value by Mortgage Status in Saratoga Springs
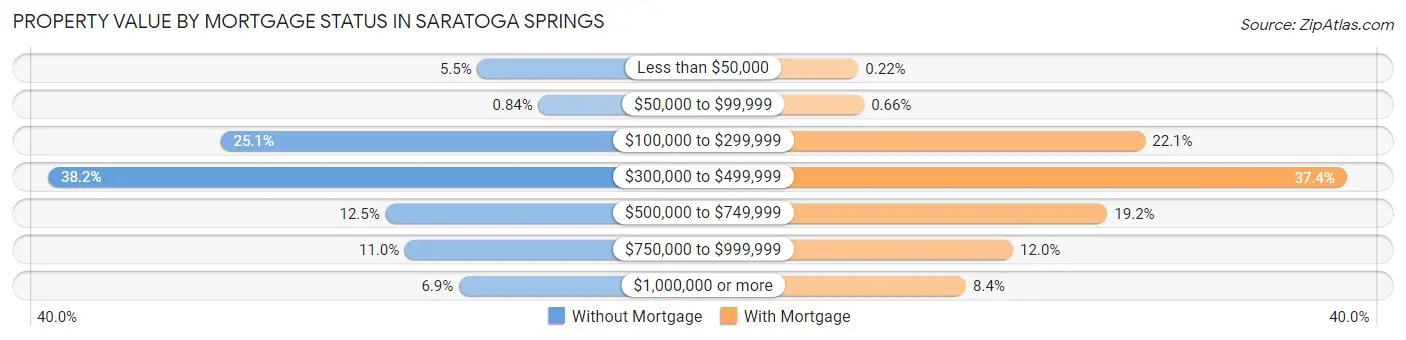
| Property Value | Without Mortgage | With Mortgage |
| Less than $50,000 | 144 (5.5%) | 10 (0.2%) |
| $50,000 to $99,999 | 22 (0.8%) | 30 (0.7%) |
| $100,000 to $299,999 | 658 (25.1%) | 1,009 (22.1%) |
| $300,000 to $499,999 | 1,003 (38.2%) | 1,710 (37.4%) |
| $500,000 to $749,999 | 328 (12.5%) | 877 (19.2%) |
| $750,000 to $999,999 | 289 (11.0%) | 549 (12.0%) |
| $1,000,000 or more | 181 (6.9%) | 385 (8.4%) |
| Total | 2,625 (100.0%) | 4,570 (100.0%) |
Household Income by Mortgage Status in Saratoga Springs
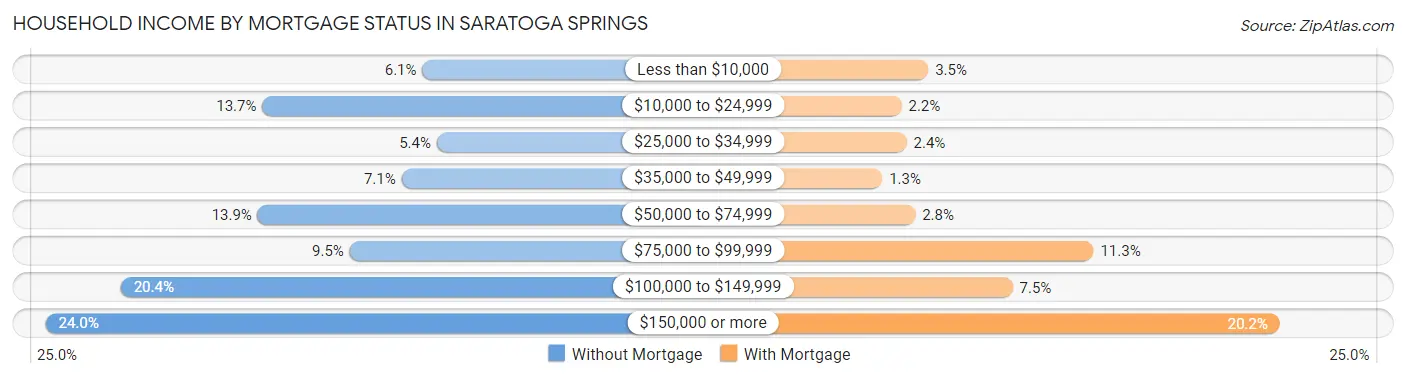
| Household Income | Without Mortgage | With Mortgage |
| Less than $10,000 | 159 (6.1%) | 158 (3.5%) |
| $10,000 to $24,999 | 359 (13.7%) | 100 (2.2%) |
| $25,000 to $34,999 | 141 (5.4%) | 111 (2.4%) |
| $35,000 to $49,999 | 185 (7.0%) | 58 (1.3%) |
| $50,000 to $74,999 | 365 (13.9%) | 130 (2.8%) |
| $75,000 to $99,999 | 250 (9.5%) | 518 (11.3%) |
| $100,000 to $149,999 | 536 (20.4%) | 342 (7.5%) |
| $150,000 or more | 630 (24.0%) | 923 (20.2%) |
| Total | 2,625 (100.0%) | 4,570 (100.0%) |
Property Value to Household Income Ratio in Saratoga Springs
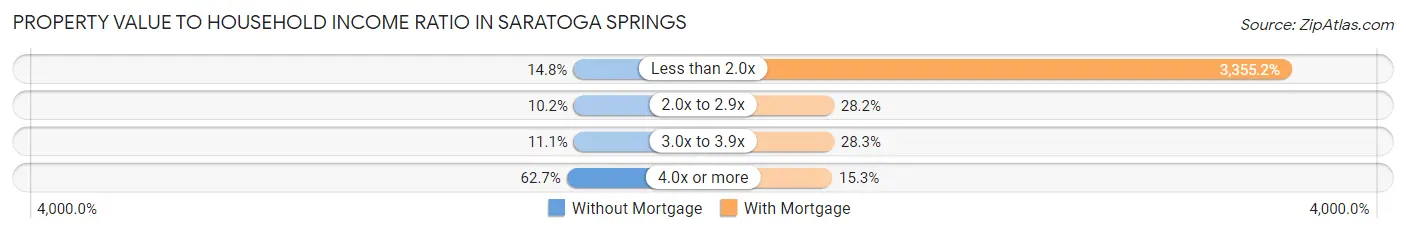
| Value-to-Income Ratio | Without Mortgage | With Mortgage |
| Less than 2.0x | 388 (14.8%) | 153,333 (3,355.2%) |
| 2.0x to 2.9x | 267 (10.2%) | 1,287 (28.2%) |
| 3.0x to 3.9x | 291 (11.1%) | 1,293 (28.3%) |
| 4.0x or more | 1,646 (62.7%) | 700 (15.3%) |
| Total | 2,625 (100.0%) | 4,570 (100.0%) |
Real Estate Taxes by Mortgage Status in Saratoga Springs
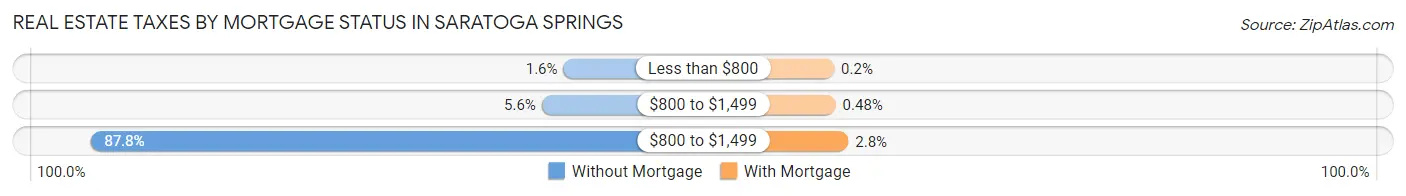
| Property Taxes | Without Mortgage | With Mortgage |
| Less than $800 | 42 (1.6%) | 9 (0.2%) |
| $800 to $1,499 | 146 (5.6%) | 22 (0.5%) |
| $800 to $1,499 | 2,305 (87.8%) | 128 (2.8%) |
| Total | 2,625 (100.0%) | 4,570 (100.0%) |
Health & Disability in Saratoga Springs
Health Insurance Coverage by Age in Saratoga Springs
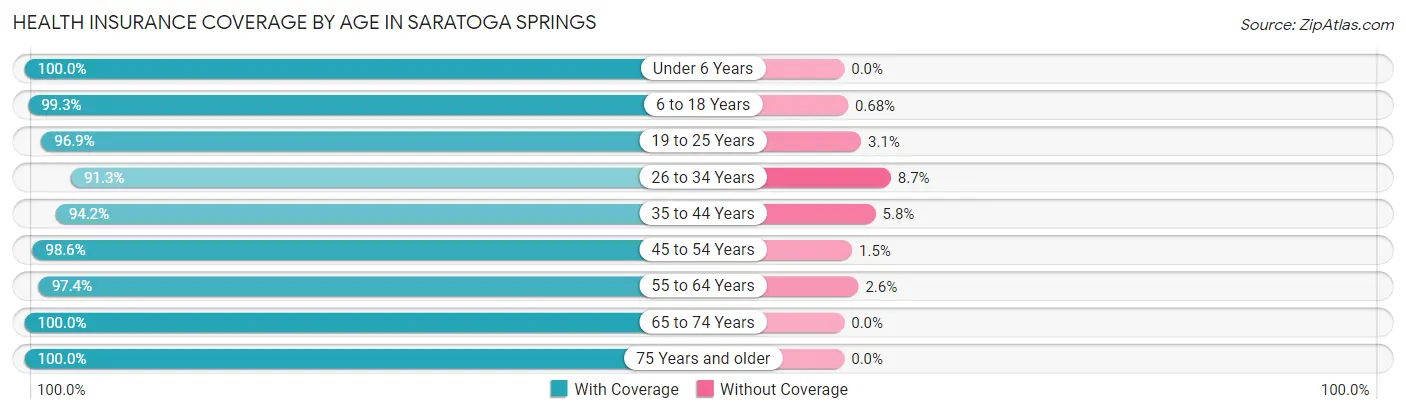
| Age Bracket | With Coverage | Without Coverage |
| Under 6 Years | 1,240 (100.0%) | 0 (0.0%) |
| 6 to 18 Years | 3,499 (99.3%) | 24 (0.7%) |
| 19 to 25 Years | 3,438 (96.9%) | 111 (3.1%) |
| 26 to 34 Years | 2,884 (91.3%) | 274 (8.7%) |
| 35 to 44 Years | 3,271 (94.2%) | 203 (5.8%) |
| 45 to 54 Years | 3,133 (98.6%) | 46 (1.5%) |
| 55 to 64 Years | 3,948 (97.4%) | 107 (2.6%) |
| 65 to 74 Years | 3,105 (100.0%) | 0 (0.0%) |
| 75 Years and older | 2,505 (100.0%) | 0 (0.0%) |
| Total | 27,023 (97.3%) | 765 (2.8%) |
Health Insurance Coverage by Citizenship Status in Saratoga Springs
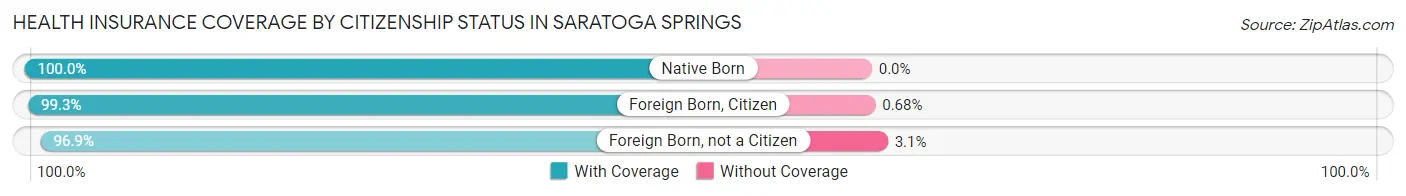
| Citizenship Status | With Coverage | Without Coverage |
| Native Born | 1,240 (100.0%) | 0 (0.0%) |
| Foreign Born, Citizen | 3,499 (99.3%) | 24 (0.7%) |
| Foreign Born, not a Citizen | 3,438 (96.9%) | 111 (3.1%) |
Health Insurance Coverage by Household Income in Saratoga Springs
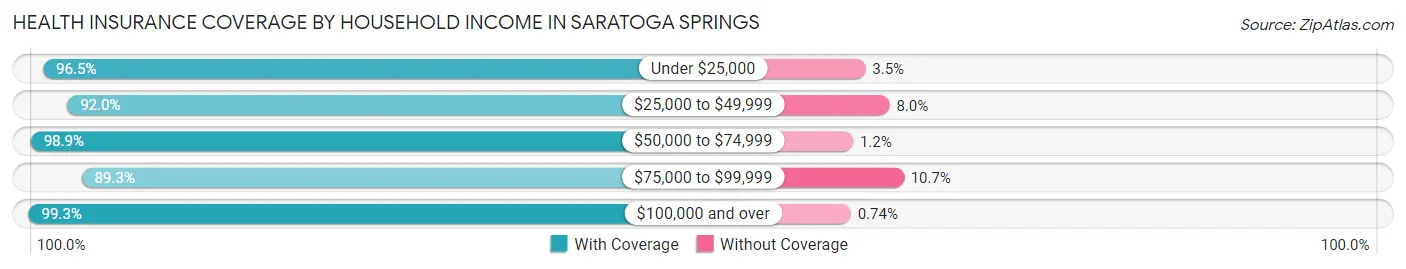
| Household Income | With Coverage | Without Coverage |
| Under $25,000 | 2,413 (96.5%) | 87 (3.5%) |
| $25,000 to $49,999 | 2,245 (92.0%) | 195 (8.0%) |
| $50,000 to $74,999 | 3,005 (98.9%) | 35 (1.1%) |
| $75,000 to $99,999 | 2,640 (89.3%) | 315 (10.7%) |
| $100,000 and over | 14,580 (99.3%) | 109 (0.7%) |
Public vs Private Health Insurance Coverage by Age in Saratoga Springs
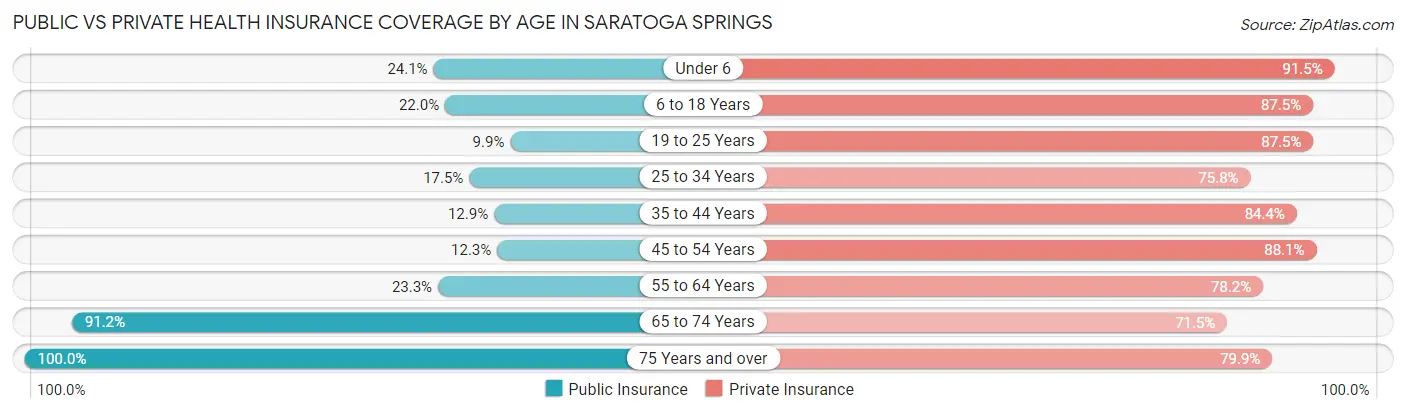
| Age Bracket | Public Insurance | Private Insurance |
| Under 6 | 299 (24.1%) | 1,134 (91.4%) |
| 6 to 18 Years | 774 (22.0%) | 3,081 (87.5%) |
| 19 to 25 Years | 350 (9.9%) | 3,106 (87.5%) |
| 25 to 34 Years | 552 (17.5%) | 2,395 (75.8%) |
| 35 to 44 Years | 447 (12.9%) | 2,933 (84.4%) |
| 45 to 54 Years | 391 (12.3%) | 2,800 (88.1%) |
| 55 to 64 Years | 944 (23.3%) | 3,171 (78.2%) |
| 65 to 74 Years | 2,833 (91.2%) | 2,221 (71.5%) |
| 75 Years and over | 2,505 (100.0%) | 2,001 (79.9%) |
| Total | 9,095 (32.7%) | 22,842 (82.2%) |
Disability Status by Sex by Age in Saratoga Springs
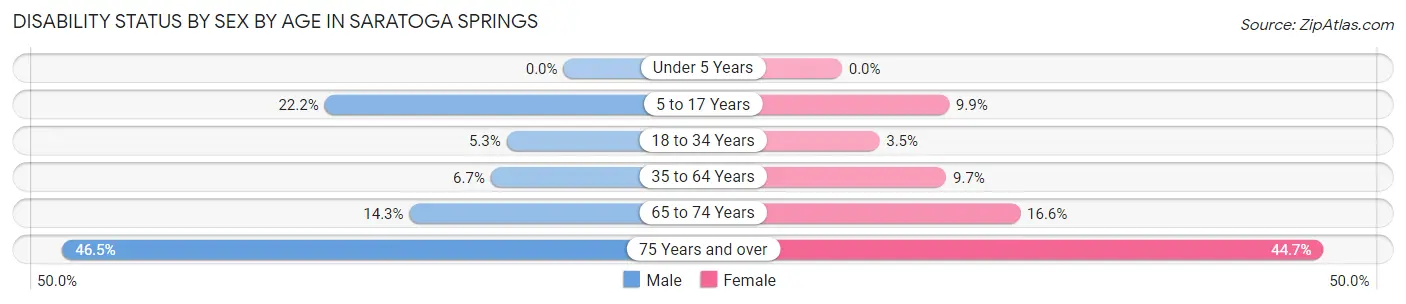
| Age Bracket | Male | Female |
| Under 5 Years | 0 (0.0%) | 0 (0.0%) |
| 5 to 17 Years | 355 (22.2%) | 134 (9.9%) |
| 18 to 34 Years | 185 (5.3%) | 139 (3.5%) |
| 35 to 64 Years | 328 (6.7%) | 566 (9.7%) |
| 65 to 74 Years | 220 (14.3%) | 259 (16.6%) |
| 75 Years and over | 452 (46.5%) | 685 (44.7%) |
Disability Class by Sex by Age in Saratoga Springs
Disability Class: Hearing Difficulty
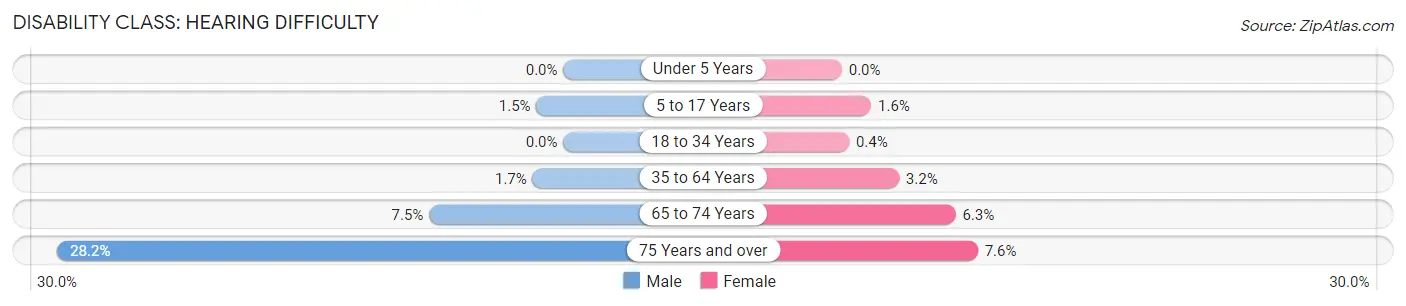
| Age Bracket | Male | Female |
| Under 5 Years | 0 (0.0%) | 0 (0.0%) |
| 5 to 17 Years | 24 (1.5%) | 22 (1.6%) |
| 18 to 34 Years | 0 (0.0%) | 16 (0.4%) |
| 35 to 64 Years | 83 (1.7%) | 186 (3.2%) |
| 65 to 74 Years | 115 (7.5%) | 99 (6.3%) |
| 75 Years and over | 274 (28.2%) | 116 (7.6%) |
Disability Class: Vision Difficulty
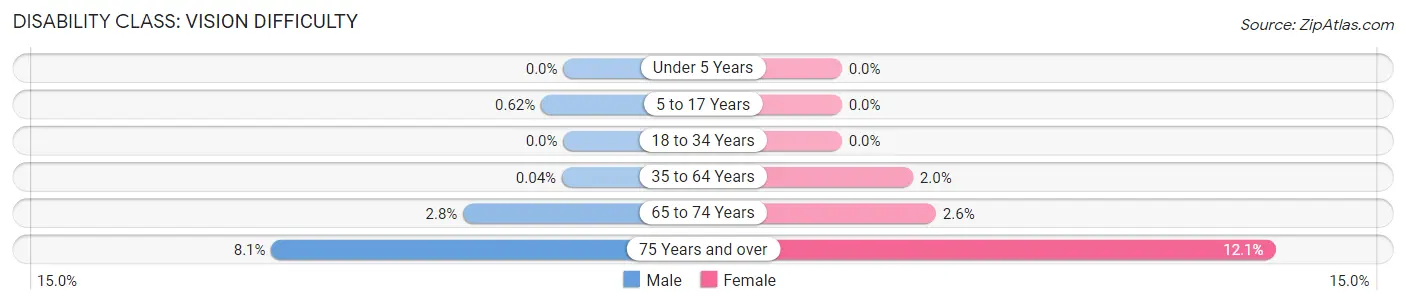
| Age Bracket | Male | Female |
| Under 5 Years | 0 (0.0%) | 0 (0.0%) |
| 5 to 17 Years | 10 (0.6%) | 0 (0.0%) |
| 18 to 34 Years | 0 (0.0%) | 0 (0.0%) |
| 35 to 64 Years | 2 (0.0%) | 116 (2.0%) |
| 65 to 74 Years | 43 (2.8%) | 41 (2.6%) |
| 75 Years and over | 79 (8.1%) | 185 (12.1%) |
Disability Class: Cognitive Difficulty
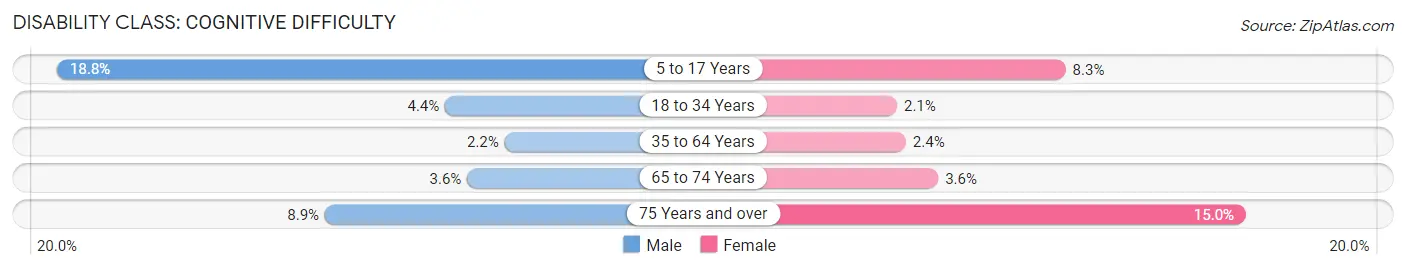
| Age Bracket | Male | Female |
| 5 to 17 Years | 301 (18.8%) | 112 (8.3%) |
| 18 to 34 Years | 154 (4.4%) | 82 (2.1%) |
| 35 to 64 Years | 106 (2.2%) | 139 (2.4%) |
| 65 to 74 Years | 55 (3.6%) | 56 (3.6%) |
| 75 Years and over | 86 (8.8%) | 230 (15.0%) |
Disability Class: Ambulatory Difficulty
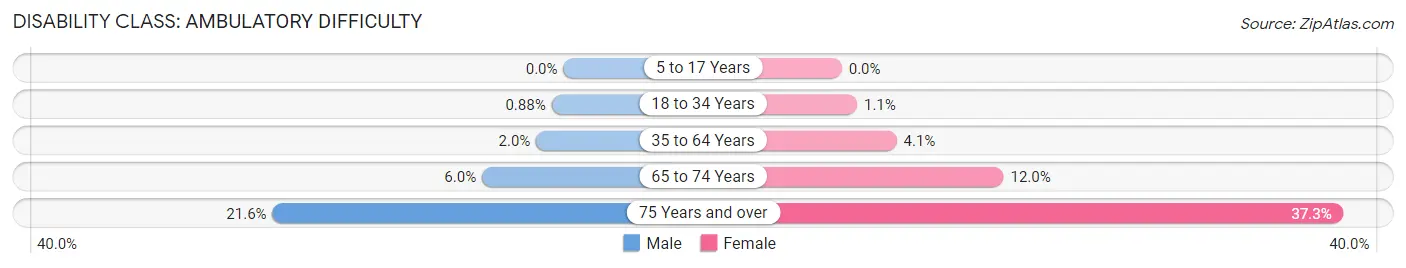
| Age Bracket | Male | Female |
| 5 to 17 Years | 0 (0.0%) | 0 (0.0%) |
| 18 to 34 Years | 31 (0.9%) | 45 (1.1%) |
| 35 to 64 Years | 98 (2.0%) | 238 (4.1%) |
| 65 to 74 Years | 93 (6.0%) | 188 (12.0%) |
| 75 Years and over | 210 (21.6%) | 571 (37.2%) |
Disability Class: Self-Care Difficulty
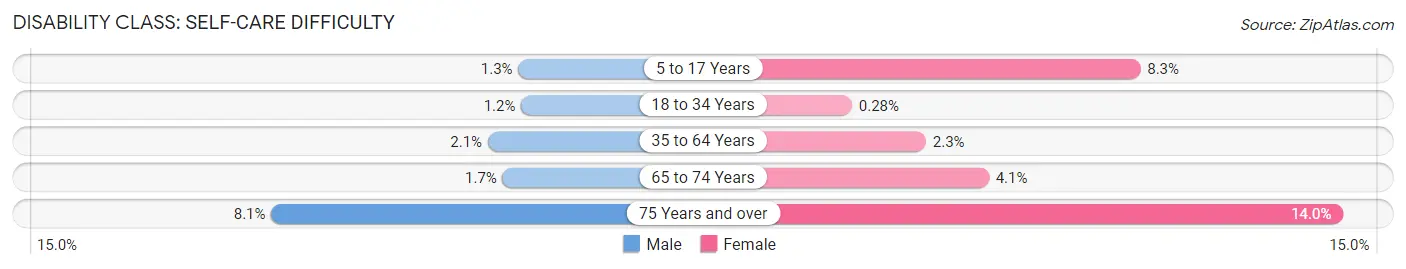
| Age Bracket | Male | Female |
| 5 to 17 Years | 20 (1.3%) | 112 (8.3%) |
| 18 to 34 Years | 41 (1.2%) | 11 (0.3%) |
| 35 to 64 Years | 102 (2.1%) | 137 (2.3%) |
| 65 to 74 Years | 26 (1.7%) | 64 (4.1%) |
| 75 Years and over | 79 (8.1%) | 214 (14.0%) |
Technology Access in Saratoga Springs
Computing Device Access in Saratoga Springs
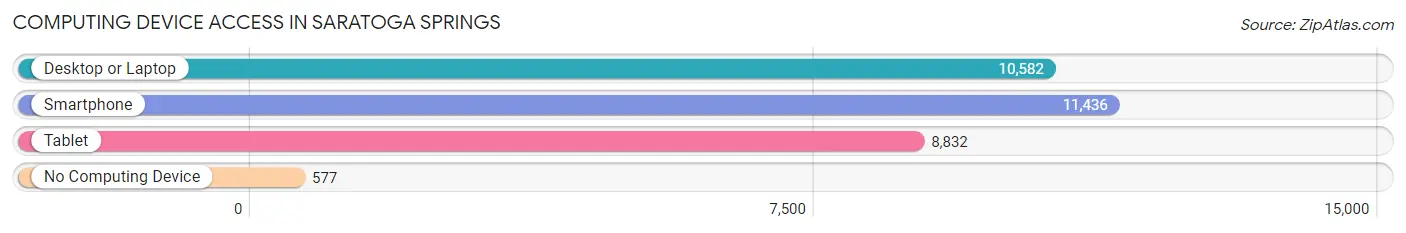
| Device Type | # Households | % Households |
| Desktop or Laptop | 10,582 | 83.3% |
| Smartphone | 11,436 | 90.0% |
| Tablet | 8,832 | 69.5% |
| No Computing Device | 577 | 4.5% |
| Total | 12,704 | 100.0% |
Internet Access in Saratoga Springs
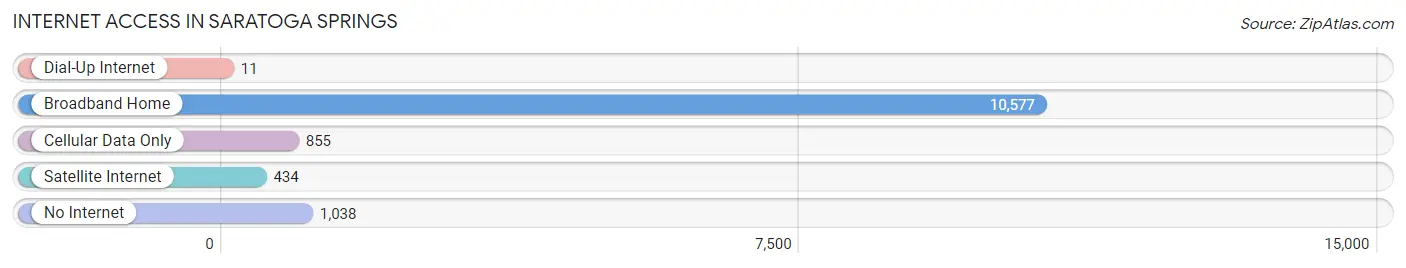
| Internet Type | # Households | % Households |
| Dial-Up Internet | 11 | 0.1% |
| Broadband Home | 10,577 | 83.3% |
| Cellular Data Only | 855 | 6.7% |
| Satellite Internet | 434 | 3.4% |
| No Internet | 1,038 | 8.2% |
| Total | 12,704 | 100.0% |
Saratoga Springs Summary
Saratoga Springs is a city located in Saratoga County, New York, United States. The population was 26,586 at the 2010 census. The name reflects the presence of mineral springs in the area, which has made Saratoga a popular resort destination for over 200 years. Saratoga Springs was ranked tenth in the list of the top 10 places to live in New York State for 2020 according to Niche.
History
The area that is now Saratoga Springs was originally inhabited by the Mohawk and Iroquois Native American tribes. The first European settlers arrived in the area in the late 17th century. The first permanent settlement was established in 1776 by Gideon Putnam, who built a sawmill and gristmill on the banks of the Kayaderosseras Creek.
In the 19th century, the city became a popular resort destination due to its mineral springs. The Saratoga Race Course was established in 1863, and the Saratoga Performing Arts Center opened in 1966.
Geography
Saratoga Springs is located in the southeastern corner of Saratoga County, New York, at the northern end of the Hudson Valley. The city is situated on the east side of the Kayaderosseras Creek, which flows southward into the Hudson River. The city is bordered by the towns of Wilton to the north, Malta to the east, and Stillwater to the south.
The city has a total area of 10.3 square miles, of which 10.2 square miles is land and 0.1 square miles is water. The terrain is generally flat, with some rolling hills in the northern and eastern parts of the city.
Economy
Saratoga Springs is a major tourist destination, with a variety of attractions, including the Saratoga Race Course, Saratoga Performing Arts Center, Saratoga Spa State Park, and Saratoga Casino and Raceway. The city is also home to several corporate headquarters, including GlobalFoundries, Price Chopper Supermarkets, and AngioDynamics.
The city's largest employers are Saratoga Hospital, Saratoga Casino and Raceway, and the Saratoga County government. The median household income in Saratoga Springs is $63,845, and the median family income is $77,845.
Demographics
As of the 2010 census, there were 26,586 people, 10,717 households, and 6,845 families residing in the city. The population density was 2,597.3 people per square mile. The racial makeup of the city was 94.2% White, 1.7% African American, 0.2% Native American, 1.9% Asian, 0.1% Pacific Islander, 0.7% from other races, and 1.3% from two or more races. Hispanic or Latino of any race were 3.2% of the population.
The median age in the city was 40.3 years. 22.2% of residents were under the age of 18; 8.2% were between the ages of 18 and 24; 25.2% were from 25 to 44; 28.3% were from 45 to 64; and 16.1% were 65 years of age or older. The gender makeup of the city was 48.3% male and 51.7% female.
Conclusion
Saratoga Springs is a city located in Saratoga County, New York, United States. The city has a long history as a popular resort destination due to its mineral springs, and is home to several corporate headquarters. The population of the city is 26,586, with a median household income of $63,845. The city is a major tourist destination, with a variety of attractions, and is also home to several large employers.
Common Questions
What is Per Capita Income in Saratoga Springs?
Per Capita income in Saratoga Springs is $57,836.
What is the Median Family Income in Saratoga Springs?
Median Family Income in Saratoga Springs is $132,965.
What is the Median Household income in Saratoga Springs?
Median Household Income in Saratoga Springs is $97,241.
What is Income or Wage Gap in Saratoga Springs?
Income or Wage Gap in Saratoga Springs is 30.3%.
Women in Saratoga Springs earn 69.7 cents for every dollar earned by a man.
What is Inequality or Gini Index in Saratoga Springs?
Inequality or Gini Index in Saratoga Springs is 0.47.
What is the Total Population of Saratoga Springs?
Total Population of Saratoga Springs is 28,505.
What is the Total Male Population of Saratoga Springs?
Total Male Population of Saratoga Springs is 13,346.
What is the Total Female Population of Saratoga Springs?
Total Female Population of Saratoga Springs is 15,159.
What is the Ratio of Males per 100 Females in Saratoga Springs?
There are 88.04 Males per 100 Females in Saratoga Springs.
What is the Ratio of Females per 100 Males in Saratoga Springs?
There are 113.58 Females per 100 Males in Saratoga Springs.
What is the Median Population Age in Saratoga Springs?
Median Population Age in Saratoga Springs is 41.8 Years.
What is the Average Family Size in Saratoga Springs
Average Family Size in Saratoga Springs is 2.6 People.
What is the Average Household Size in Saratoga Springs
Average Household Size in Saratoga Springs is 2.0 People.
How Large is the Labor Force in Saratoga Springs?
There are 15,888 People in the Labor Forcein in Saratoga Springs.
What is the Percentage of People in the Labor Force in Saratoga Springs?
63.6% of People are in the Labor Force in Saratoga Springs.
What is the Unemployment Rate in Saratoga Springs?
Unemployment Rate in Saratoga Springs is 2.7%.