Northwest Ithaca, NY Map & Demographics
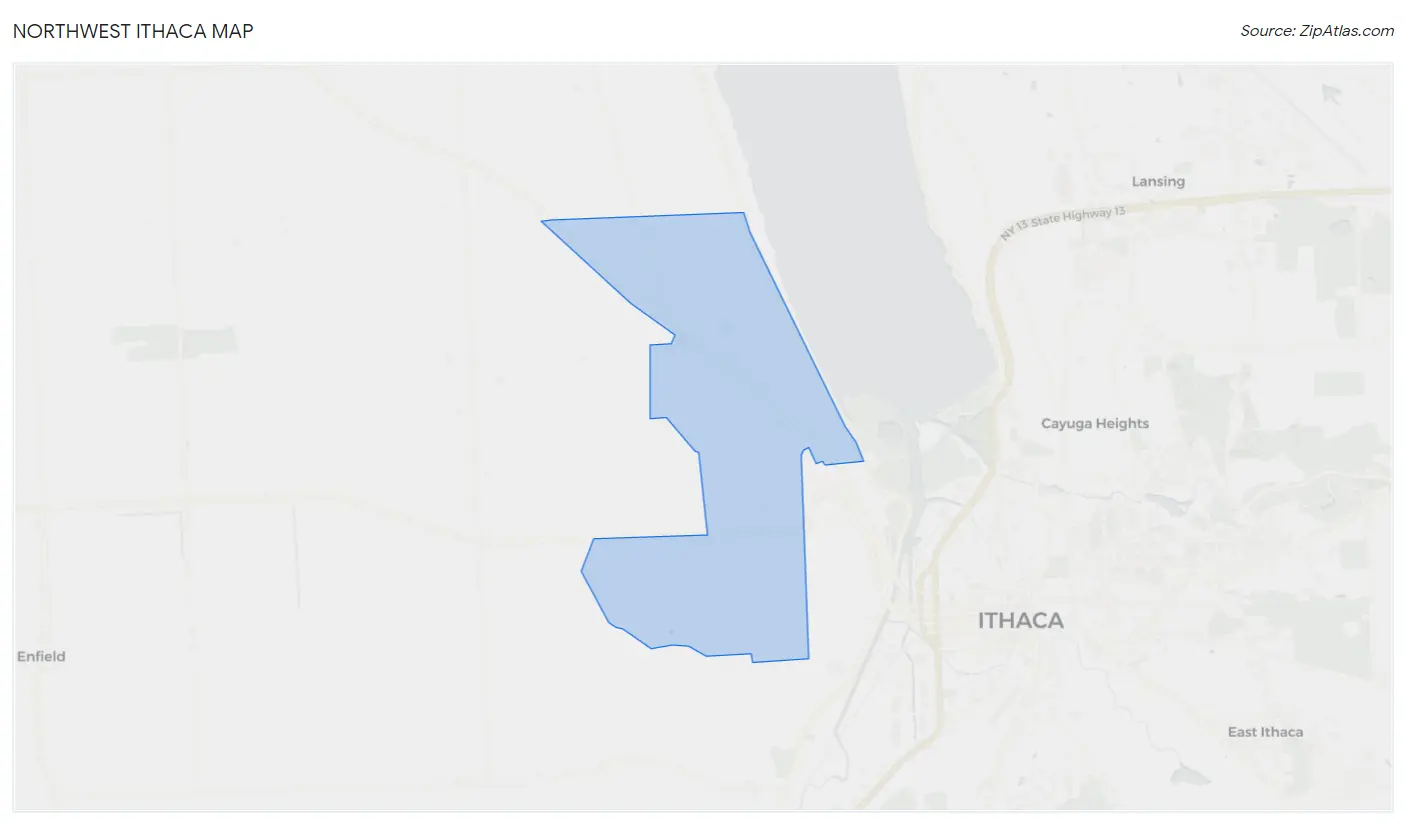
Northwest Ithaca Map
Northwest Ithaca Overview
$33,831
PER CAPITA INCOME
$68,684
AVG FAMILY INCOME
$53,393
AVG HOUSEHOLD INCOME
20.3%
WAGE / INCOME GAP [ % ]
79.7¢/ $1
WAGE / INCOME GAP [ $ ]
0.48
INEQUALITY / GINI INDEX
1,796
TOTAL POPULATION
716
MALE POPULATION
1,080
FEMALE POPULATION
66.30
MALES / 100 FEMALES
150.84
FEMALES / 100 MALES
54.1
MEDIAN AGE
2.4
AVG FAMILY SIZE
1.9
AVG HOUSEHOLD SIZE
784
LABOR FORCE [ PEOPLE ]
52.4%
PERCENT IN LABOR FORCE
1.7%
UNEMPLOYMENT RATE
Income in Northwest Ithaca
Income Overview in Northwest Ithaca
Per Capita Income in Northwest Ithaca is $33,831, while median incomes of families and households are $68,684 and $53,393 respectively.
| Characteristic | Number | Measure |
| Per Capita Income | 1,796 | $33,831 |
| Median Family Income | 484 | $68,684 |
| Mean Family Income | 484 | $80,757 |
| Median Household Income | 875 | $53,393 |
| Mean Household Income | 875 | $69,199 |
| Income Deficit | 484 | $0 |
| Wage / Income Gap (%) | 1,796 | 20.32% |
| Wage / Income Gap ($) | 1,796 | 79.68¢ per $1 |
| Gini / Inequality Index | 1,796 | 0.48 |
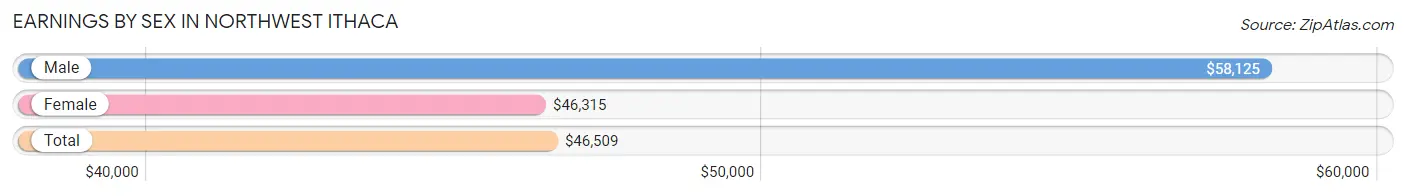
Earnings by Sex in Northwest Ithaca
Average Earnings in Northwest Ithaca are $46,509, $58,125 for men and $46,315 for women, a difference of 20.3%.
| Sex | Number | Average Earnings |
| Male | 333 (42.0%) | $58,125 |
| Female | 459 (58.0%) | $46,315 |
| Total | 792 (100.0%) | $46,509 |
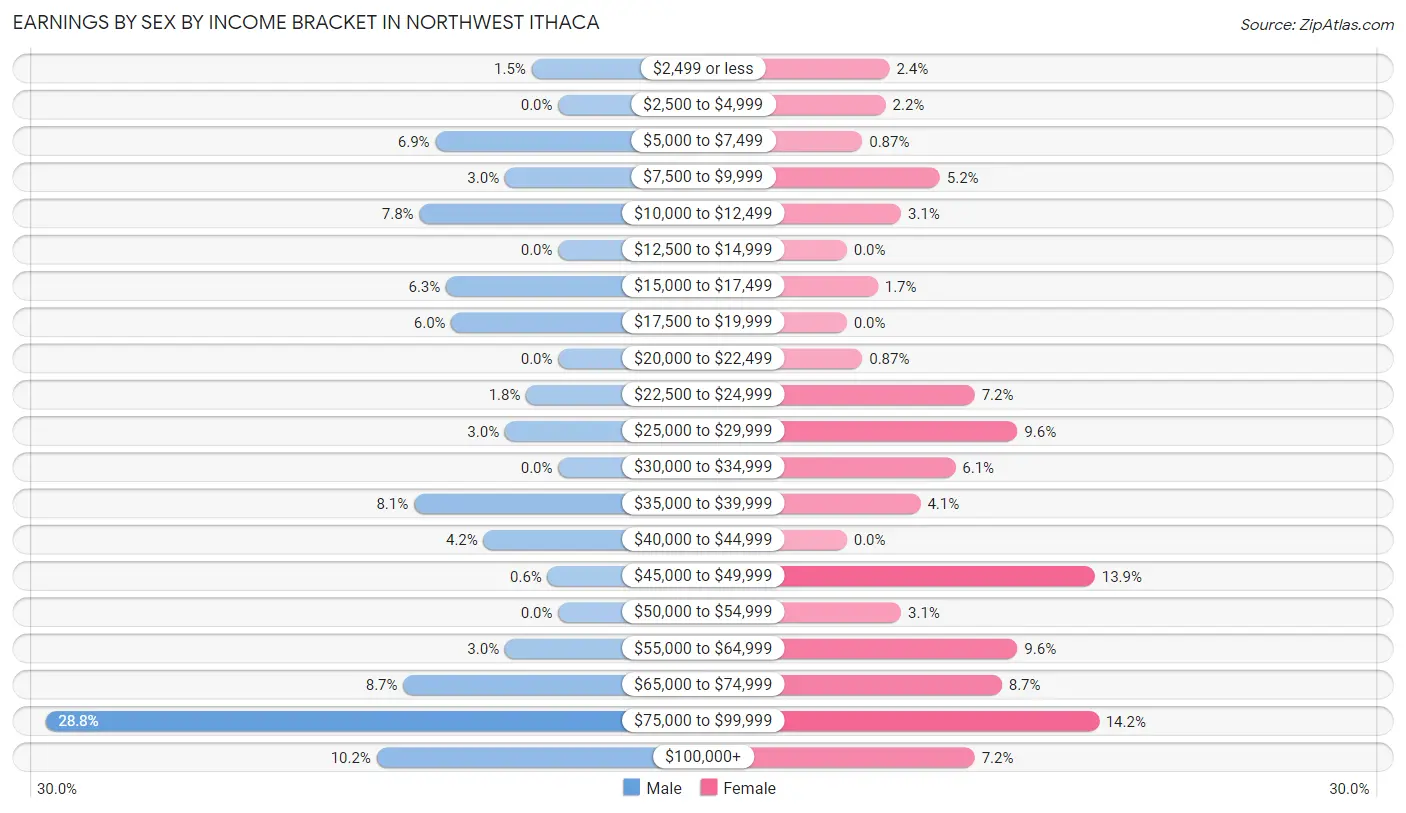
Earnings by Sex by Income Bracket in Northwest Ithaca
The most common earnings brackets in Northwest Ithaca are $75,000 to $99,999 for men (96 | 28.8%) and $75,000 to $99,999 for women (65 | 14.2%).
| Income | Male | Female |
| $2,499 or less | 5 (1.5%) | 11 (2.4%) |
| $2,500 to $4,999 | 0 (0.0%) | 10 (2.2%) |
| $5,000 to $7,499 | 23 (6.9%) | 4 (0.9%) |
| $7,500 to $9,999 | 10 (3.0%) | 24 (5.2%) |
| $10,000 to $12,499 | 26 (7.8%) | 14 (3.0%) |
| $12,500 to $14,999 | 0 (0.0%) | 0 (0.0%) |
| $15,000 to $17,499 | 21 (6.3%) | 8 (1.7%) |
| $17,500 to $19,999 | 20 (6.0%) | 0 (0.0%) |
| $20,000 to $22,499 | 0 (0.0%) | 4 (0.9%) |
| $22,500 to $24,999 | 6 (1.8%) | 33 (7.2%) |
| $25,000 to $29,999 | 10 (3.0%) | 44 (9.6%) |
| $30,000 to $34,999 | 0 (0.0%) | 28 (6.1%) |
| $35,000 to $39,999 | 27 (8.1%) | 19 (4.1%) |
| $40,000 to $44,999 | 14 (4.2%) | 0 (0.0%) |
| $45,000 to $49,999 | 2 (0.6%) | 64 (13.9%) |
| $50,000 to $54,999 | 0 (0.0%) | 14 (3.0%) |
| $55,000 to $64,999 | 10 (3.0%) | 44 (9.6%) |
| $65,000 to $74,999 | 29 (8.7%) | 40 (8.7%) |
| $75,000 to $99,999 | 96 (28.8%) | 65 (14.2%) |
| $100,000+ | 34 (10.2%) | 33 (7.2%) |
| Total | 333 (100.0%) | 459 (100.0%) |
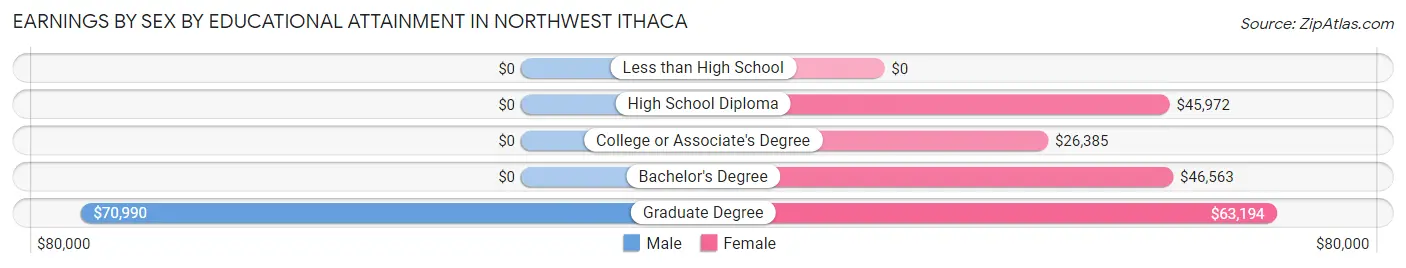
Earnings by Sex by Educational Attainment in Northwest Ithaca
Average earnings in Northwest Ithaca are $70,208 for men and $46,530 for women, a difference of 33.7%. Men with an educational attainment of graduate degree enjoy the highest average annual earnings of $70,990, while those with graduate degree education earn the least with $70,990. Women with an educational attainment of graduate degree earn the most with the average annual earnings of $63,194, while those with college or associate's degree education have the smallest earnings of $26,385.
| Educational Attainment | Male Income | Female Income |
| Less than High School | - | - |
| High School Diploma | - | - |
| College or Associate's Degree | - | - |
| Bachelor's Degree | - | - |
| Graduate Degree | $70,990 | $63,194 |
| Total | $70,208 | $46,530 |
Family Income in Northwest Ithaca
Family Income Brackets in Northwest Ithaca
According to the Northwest Ithaca family income data, there are 108 families falling into the $50,000 to $74,999 income range, which is the most common income bracket and makes up 22.3% of all families.
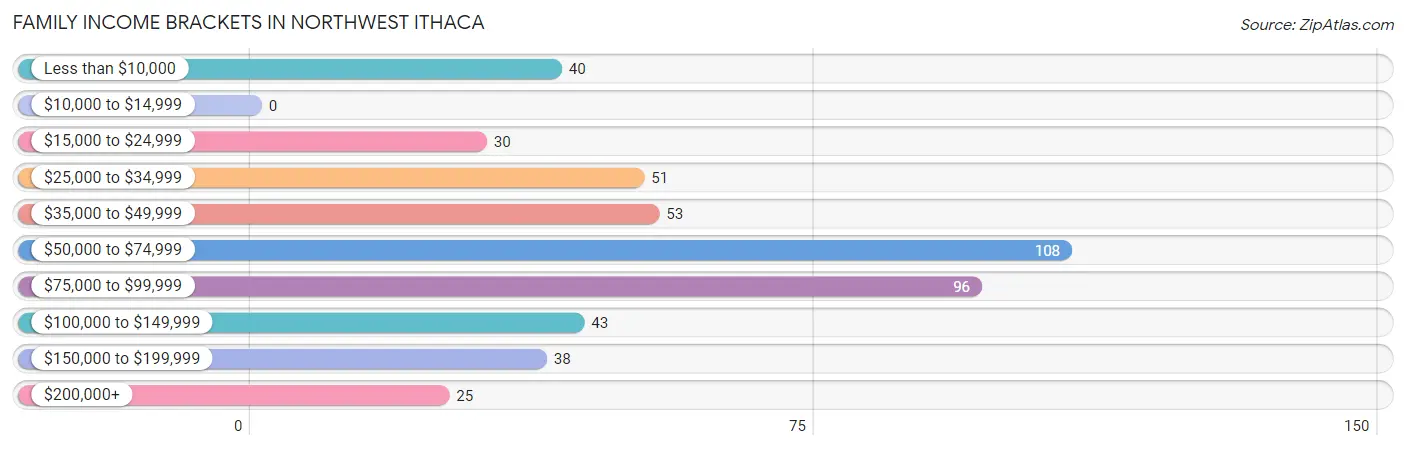
| Income Bracket | # Families | % Families |
| Less than $10,000 | 40 | 8.3% |
| $10,000 to $14,999 | 0 | 0.0% |
| $15,000 to $24,999 | 30 | 6.2% |
| $25,000 to $34,999 | 51 | 10.5% |
| $35,000 to $49,999 | 53 | 11.0% |
| $50,000 to $74,999 | 108 | 22.3% |
| $75,000 to $99,999 | 96 | 19.8% |
| $100,000 to $149,999 | 43 | 8.9% |
| $150,000 to $199,999 | 38 | 7.9% |
| $200,000+ | 25 | 5.2% |
Family Income by Famaliy Size in Northwest Ithaca
3-person families (37 | 7.6%) account for the highest median family income in Northwest Ithaca with $66,375 per family, while 2-person families (372 | 76.9%) have the highest median income of $28,750 per family member.
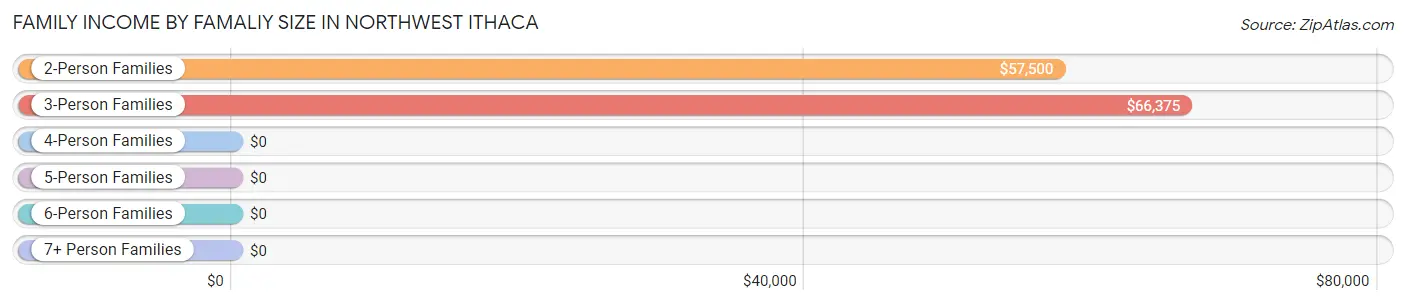
| Income Bracket | # Families | Median Income |
| 2-Person Families | 372 (76.9%) | $57,500 |
| 3-Person Families | 37 (7.6%) | $66,375 |
| 4-Person Families | 51 (10.5%) | $0 |
| 5-Person Families | 24 (5.0%) | $0 |
| 6-Person Families | 0 (0.0%) | $0 |
| 7+ Person Families | 0 (0.0%) | $0 |
| Total | 484 (100.0%) | $68,684 |
Family Income by Number of Earners in Northwest Ithaca
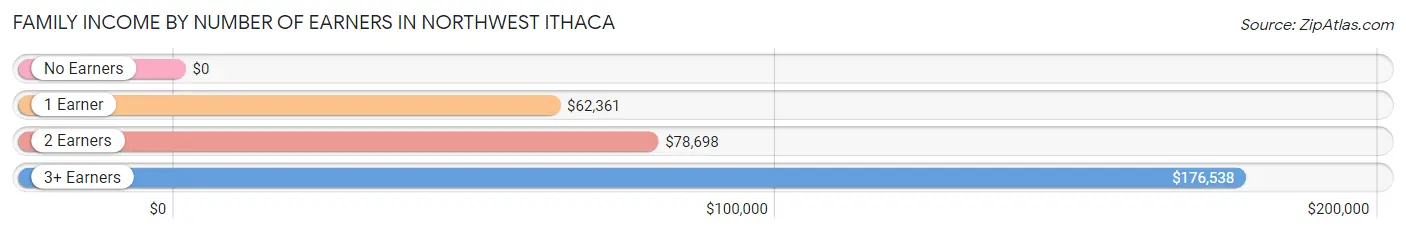
| Number of Earners | # Families | Median Income |
| No Earners | 92 (19.0%) | $0 |
| 1 Earner | 239 (49.4%) | $62,361 |
| 2 Earners | 129 (26.7%) | $78,698 |
| 3+ Earners | 24 (5.0%) | $176,538 |
| Total | 484 (100.0%) | $68,684 |
Household Income in Northwest Ithaca
Household Income Brackets in Northwest Ithaca
With 161 households falling in the category, the $75,000 to $99,999 income range is the most frequent in Northwest Ithaca, accounting for 18.4% of all households. In contrast, only 25 households (2.9%) fall into the $200,000+ income bracket, making it the least populous group.
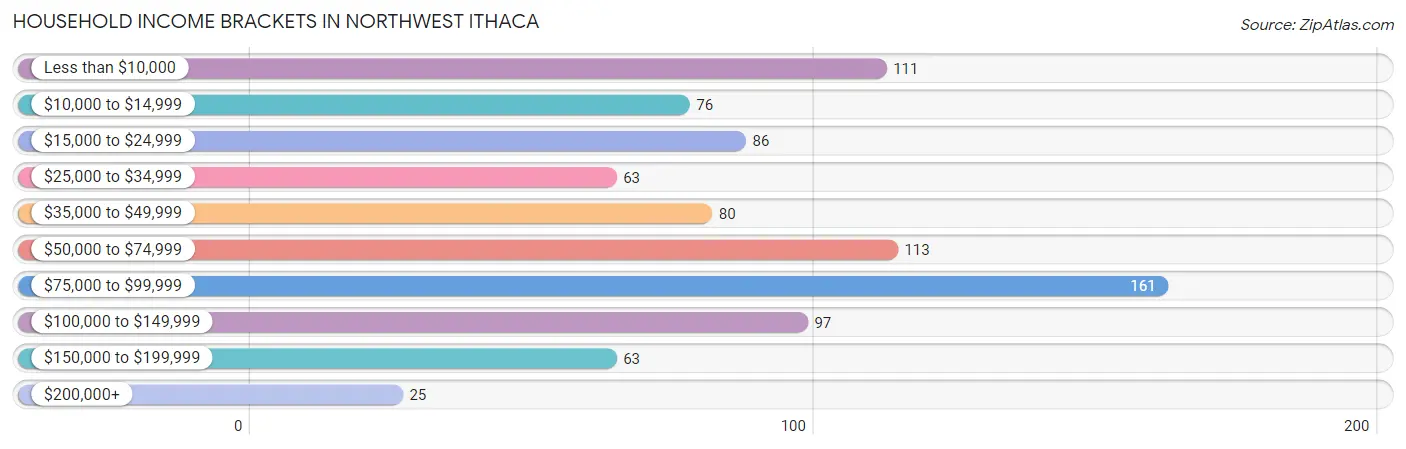
| Income Bracket | # Households | % Households |
| Less than $10,000 | 111 | 12.7% |
| $10,000 to $14,999 | 76 | 8.7% |
| $15,000 to $24,999 | 86 | 9.8% |
| $25,000 to $34,999 | 63 | 7.2% |
| $35,000 to $49,999 | 80 | 9.1% |
| $50,000 to $74,999 | 113 | 12.9% |
| $75,000 to $99,999 | 161 | 18.4% |
| $100,000 to $149,999 | 97 | 11.1% |
| $150,000 to $199,999 | 63 | 7.2% |
| $200,000+ | 25 | 2.9% |
Household Income by Householder Age in Northwest Ithaca
The median household income in Northwest Ithaca is $53,393, with the highest median household income of $72,750 found in the 25 to 44 years age bracket for the primary householder. A total of 204 households (23.3%) fall into this category.
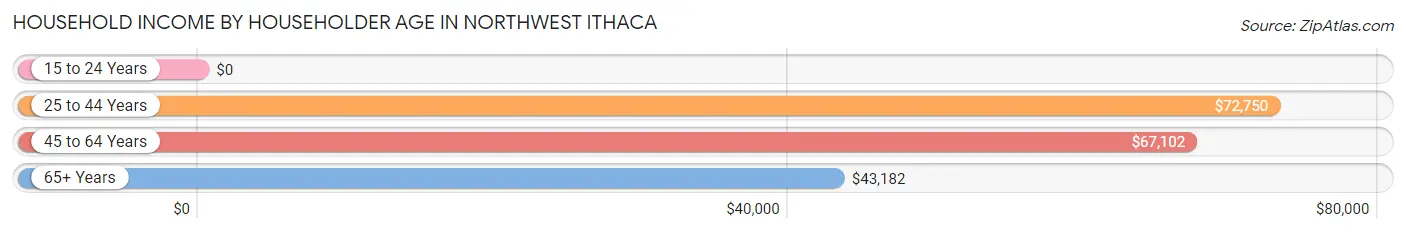
| Income Bracket | # Households | Median Income |
| 15 to 24 Years | 0 (0.0%) | $0 |
| 25 to 44 Years | 204 (23.3%) | $72,750 |
| 45 to 64 Years | 321 (36.7%) | $67,102 |
| 65+ Years | 350 (40.0%) | $43,182 |
| Total | 875 (100.0%) | $53,393 |
Poverty in Northwest Ithaca
Income Below Poverty by Sex and Age in Northwest Ithaca
With 13.3% poverty level for males and 17.1% for females among the residents of Northwest Ithaca, 5 year old males and 75 year old and over females are the most vulnerable to poverty, with 15 males (55.6%) and 47 females (32.0%) in their respective age groups living below the poverty level.
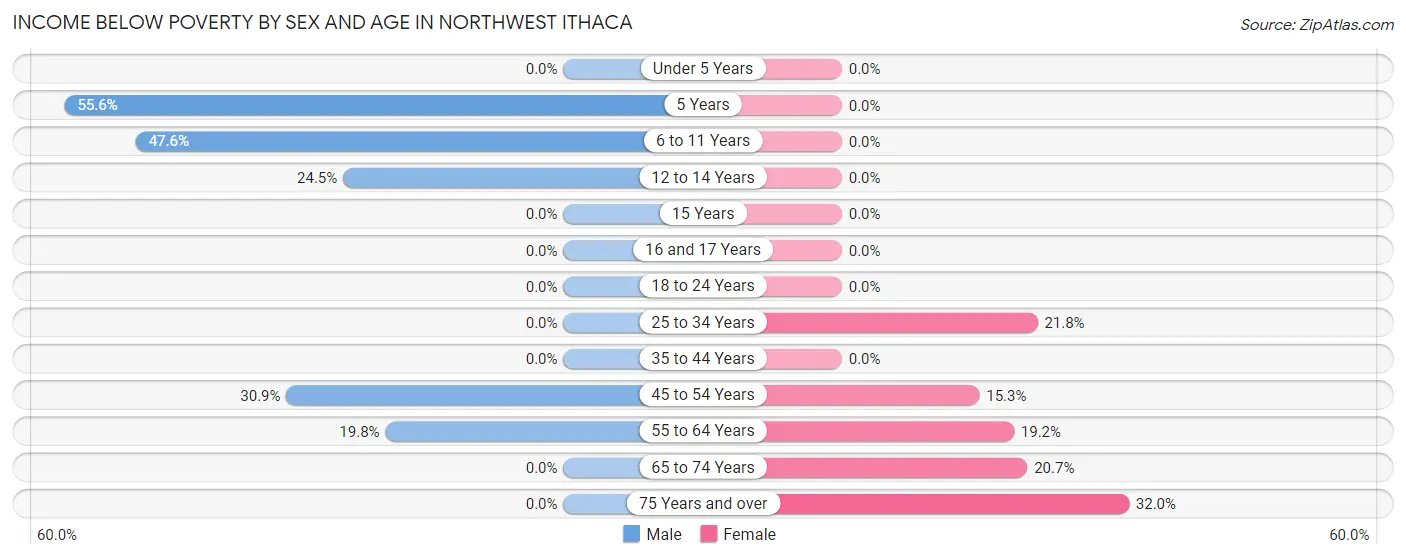
| Age Bracket | Male | Female |
| Under 5 Years | 0 (0.0%) | 0 (0.0%) |
| 5 Years | 15 (55.6%) | 0 (0.0%) |
| 6 to 11 Years | 10 (47.6%) | 0 (0.0%) |
| 12 to 14 Years | 13 (24.5%) | 0 (0.0%) |
| 15 Years | 0 (0.0%) | 0 (0.0%) |
| 16 and 17 Years | 0 (0.0%) | 0 (0.0%) |
| 18 to 24 Years | 0 (0.0%) | 0 (0.0%) |
| 25 to 34 Years | 0 (0.0%) | 39 (21.8%) |
| 35 to 44 Years | 0 (0.0%) | 0 (0.0%) |
| 45 to 54 Years | 29 (30.8%) | 15 (15.3%) |
| 55 to 64 Years | 22 (19.8%) | 32 (19.2%) |
| 65 to 74 Years | 0 (0.0%) | 38 (20.6%) |
| 75 Years and over | 0 (0.0%) | 47 (32.0%) |
| Total | 89 (13.3%) | 171 (17.1%) |
Income Above Poverty by Sex and Age in Northwest Ithaca
According to the poverty statistics in Northwest Ithaca, males aged under 5 years and females aged under 5 years are the age groups that are most secure financially, with 100.0% of males and 100.0% of females in these age groups living above the poverty line.
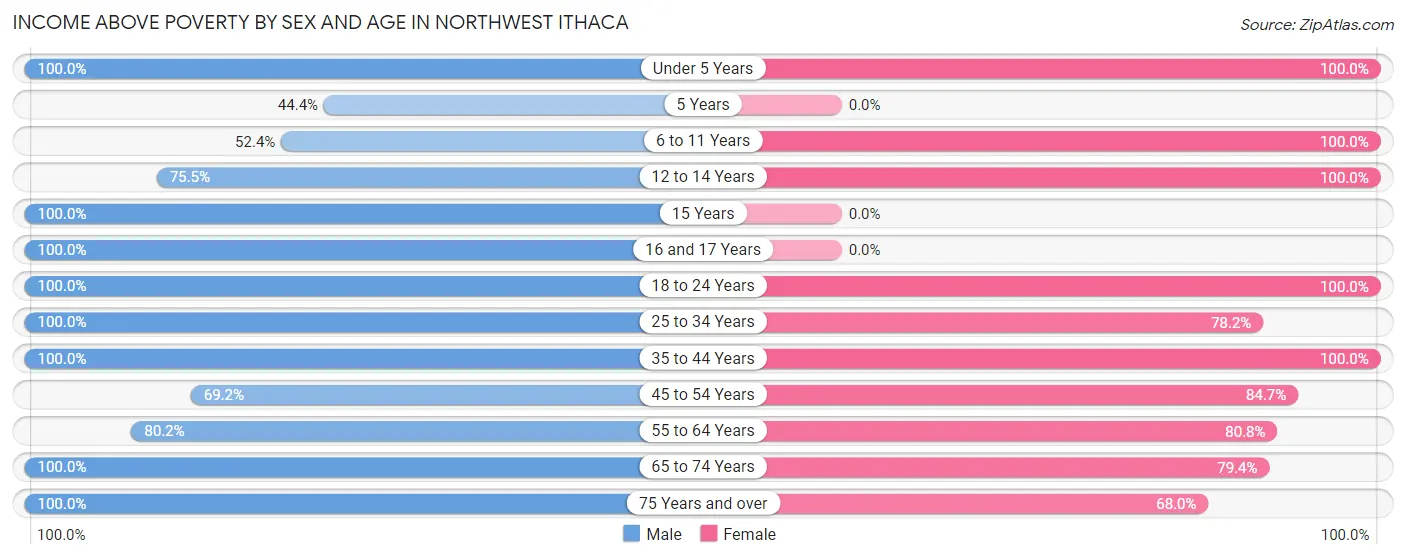
| Age Bracket | Male | Female |
| Under 5 Years | 41 (100.0%) | 30 (100.0%) |
| 5 Years | 12 (44.4%) | 0 (0.0%) |
| 6 to 11 Years | 11 (52.4%) | 86 (100.0%) |
| 12 to 14 Years | 40 (75.5%) | 23 (100.0%) |
| 15 Years | 18 (100.0%) | 0 (0.0%) |
| 16 and 17 Years | 28 (100.0%) | 0 (0.0%) |
| 18 to 24 Years | 22 (100.0%) | 10 (100.0%) |
| 25 to 34 Years | 75 (100.0%) | 140 (78.2%) |
| 35 to 44 Years | 36 (100.0%) | 78 (100.0%) |
| 45 to 54 Years | 65 (69.2%) | 83 (84.7%) |
| 55 to 64 Years | 89 (80.2%) | 135 (80.8%) |
| 65 to 74 Years | 95 (100.0%) | 146 (79.3%) |
| 75 Years and over | 48 (100.0%) | 100 (68.0%) |
| Total | 580 (86.7%) | 831 (82.9%) |
Income Below Poverty Among Married-Couple Families in Northwest Ithaca
The poverty statistics for married-couple families in Northwest Ithaca show that 5.5% or 15 of the total 273 families live below the poverty line. Families with no children have the highest poverty rate of 7.6%, comprising of 15 families. On the other hand, families with 1 or 2 children have the lowest poverty rate of 0.0%, which includes 0 families.
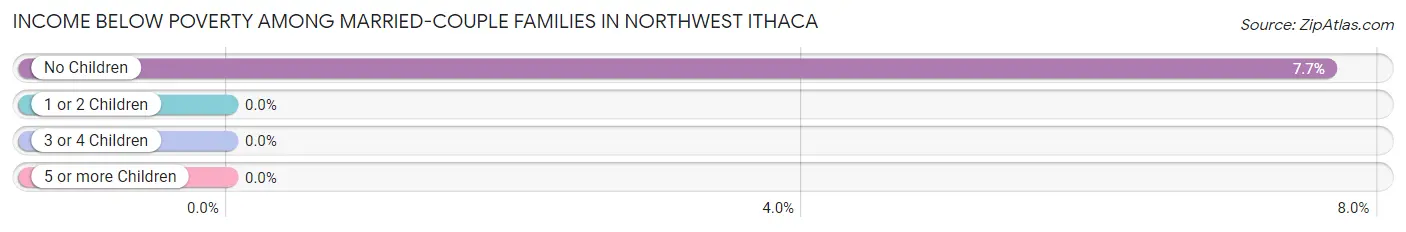
| Children | Above Poverty | Below Poverty |
| No Children | 181 (92.3%) | 15 (7.6%) |
| 1 or 2 Children | 75 (100.0%) | 0 (0.0%) |
| 3 or 4 Children | 2 (100.0%) | 0 (0.0%) |
| 5 or more Children | 0 (0.0%) | 0 (0.0%) |
| Total | 258 (94.5%) | 15 (5.5%) |
Income Below Poverty Among Single-Parent Households in Northwest Ithaca
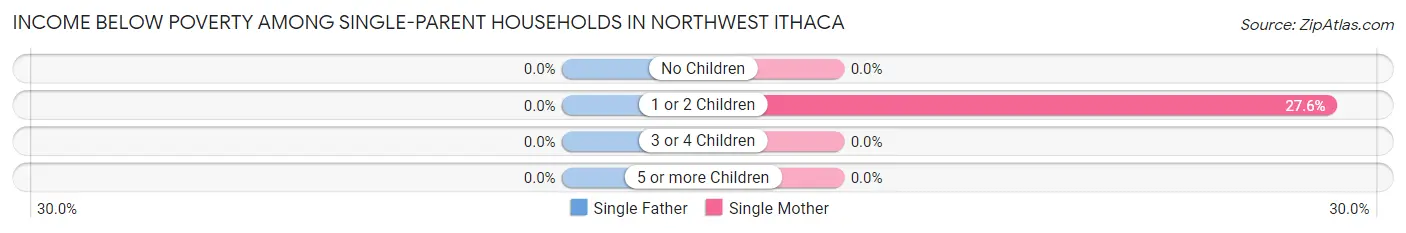
| Children | Single Father | Single Mother |
| No Children | 0 (0.0%) | 0 (0.0%) |
| 1 or 2 Children | 0 (0.0%) | 40 (27.6%) |
| 3 or 4 Children | 0 (0.0%) | 0 (0.0%) |
| 5 or more Children | 0 (0.0%) | 0 (0.0%) |
| Total | 0 (0.0%) | 40 (22.0%) |
Income Below Poverty Among Married-Couple vs Single-Parent Households in Northwest Ithaca
The poverty data for Northwest Ithaca shows that 15 of the married-couple family households (5.5%) and 40 of the single-parent households (19.0%) are living below the poverty level. Within the married-couple family households, those with no children have the highest poverty rate, with 15 households (7.6%) falling below the poverty line. Among the single-parent households, those with 1 or 2 children have the highest poverty rate, with 40 household (25.0%) living below poverty.
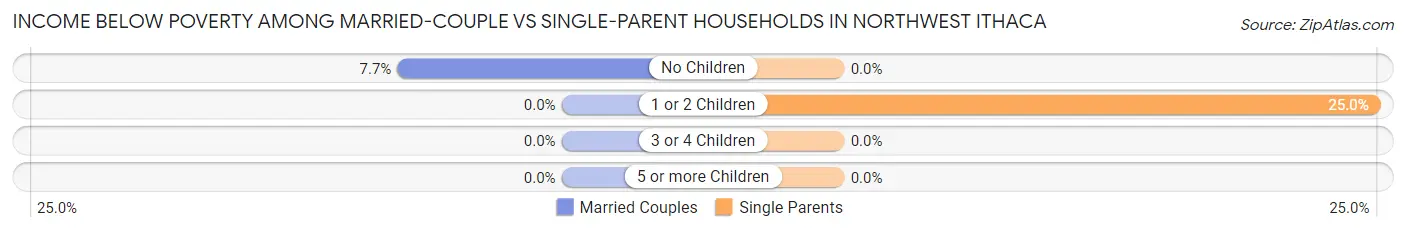
| Children | Married-Couple Families | Single-Parent Households |
| No Children | 15 (7.6%) | 0 (0.0%) |
| 1 or 2 Children | 0 (0.0%) | 40 (25.0%) |
| 3 or 4 Children | 0 (0.0%) | 0 (0.0%) |
| 5 or more Children | 0 (0.0%) | 0 (0.0%) |
| Total | 15 (5.5%) | 40 (19.0%) |
Race in Northwest Ithaca
The most populous races in Northwest Ithaca are White / Caucasian (1,422 | 79.2%), Two or more Races (203 | 11.3%), and Black / African American (120 | 6.7%).
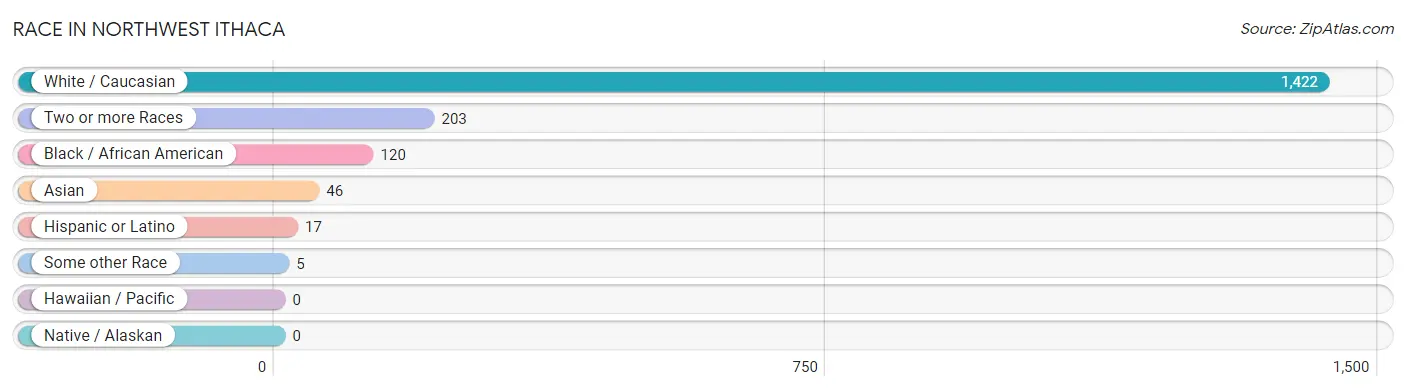
| Race | # Population | % Population |
| Asian | 46 | 2.6% |
| Black / African American | 120 | 6.7% |
| Hawaiian / Pacific | 0 | 0.0% |
| Hispanic or Latino | 17 | 0.9% |
| Native / Alaskan | 0 | 0.0% |
| White / Caucasian | 1,422 | 79.2% |
| Two or more Races | 203 | 11.3% |
| Some other Race | 5 | 0.3% |
| Total | 1,796 | 100.0% |
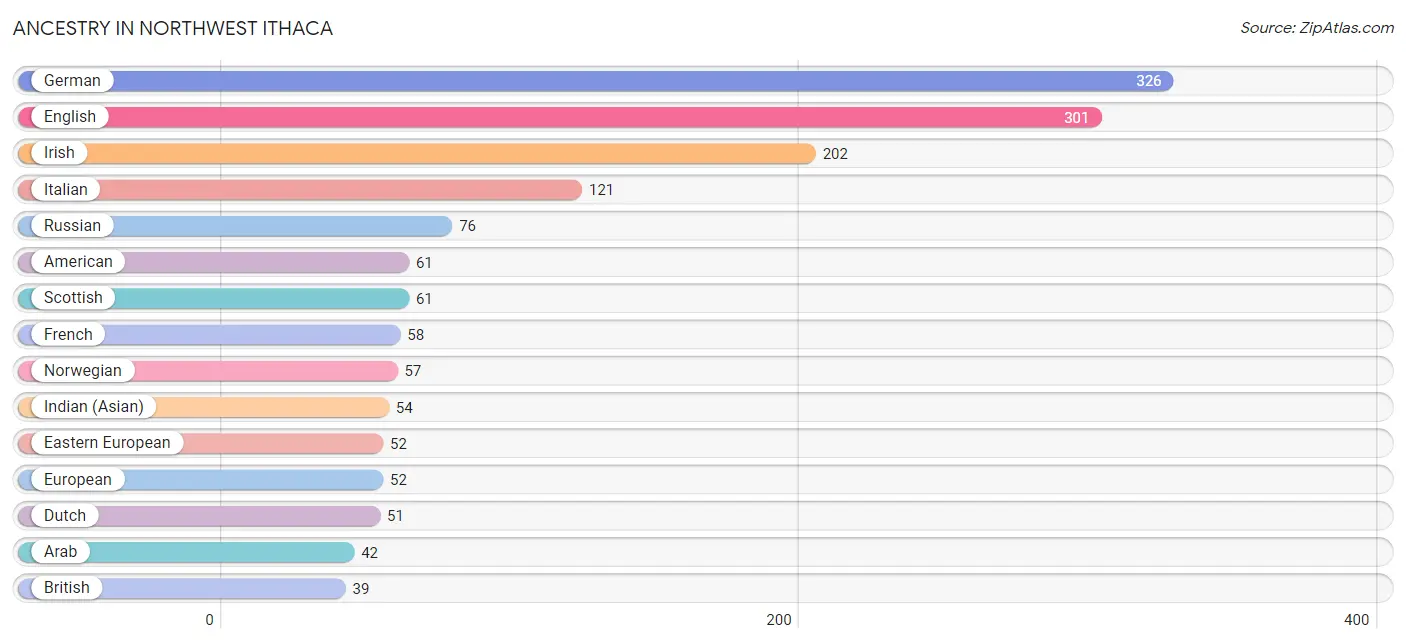
Ancestry in Northwest Ithaca
The most populous ancestries reported in Northwest Ithaca are German (326 | 18.1%), English (301 | 16.8%), Irish (202 | 11.3%), Italian (121 | 6.7%), and Russian (76 | 4.2%), together accounting for 57.1% of all Northwest Ithaca residents.
| Ancestry | # Population | % Population |
| African | 11 | 0.6% |
| American | 61 | 3.4% |
| Arab | 42 | 2.3% |
| Bhutanese | 14 | 0.8% |
| British | 39 | 2.2% |
| Bulgarian | 6 | 0.3% |
| Burmese | 27 | 1.5% |
| Canadian | 13 | 0.7% |
| Czech | 13 | 0.7% |
| Czechoslovakian | 3 | 0.2% |
| Danish | 13 | 0.7% |
| Dutch | 51 | 2.8% |
| Eastern European | 52 | 2.9% |
| Egyptian | 22 | 1.2% |
| English | 301 | 16.8% |
| European | 52 | 2.9% |
| Finnish | 27 | 1.5% |
| French | 58 | 3.2% |
| French Canadian | 22 | 1.2% |
| German | 326 | 18.1% |
| Greek | 21 | 1.2% |
| Hungarian | 18 | 1.0% |
| Indian (Asian) | 54 | 3.0% |
| Iraqi | 20 | 1.1% |
| Irish | 202 | 11.3% |
| Italian | 121 | 6.7% |
| Mexican | 3 | 0.2% |
| Norwegian | 57 | 3.2% |
| Polish | 30 | 1.7% |
| Portuguese | 10 | 0.6% |
| Russian | 76 | 4.2% |
| Scotch-Irish | 10 | 0.6% |
| Scottish | 61 | 3.4% |
| Slovak | 15 | 0.8% |
| Spanish | 10 | 0.6% |
| Subsaharan African | 20 | 1.1% |
| Swedish | 17 | 0.9% |
| Swiss | 32 | 1.8% |
| Ukrainian | 28 | 1.6% |
| Welsh | 27 | 1.5% | View All 40 Rows |
Immigrants in Northwest Ithaca
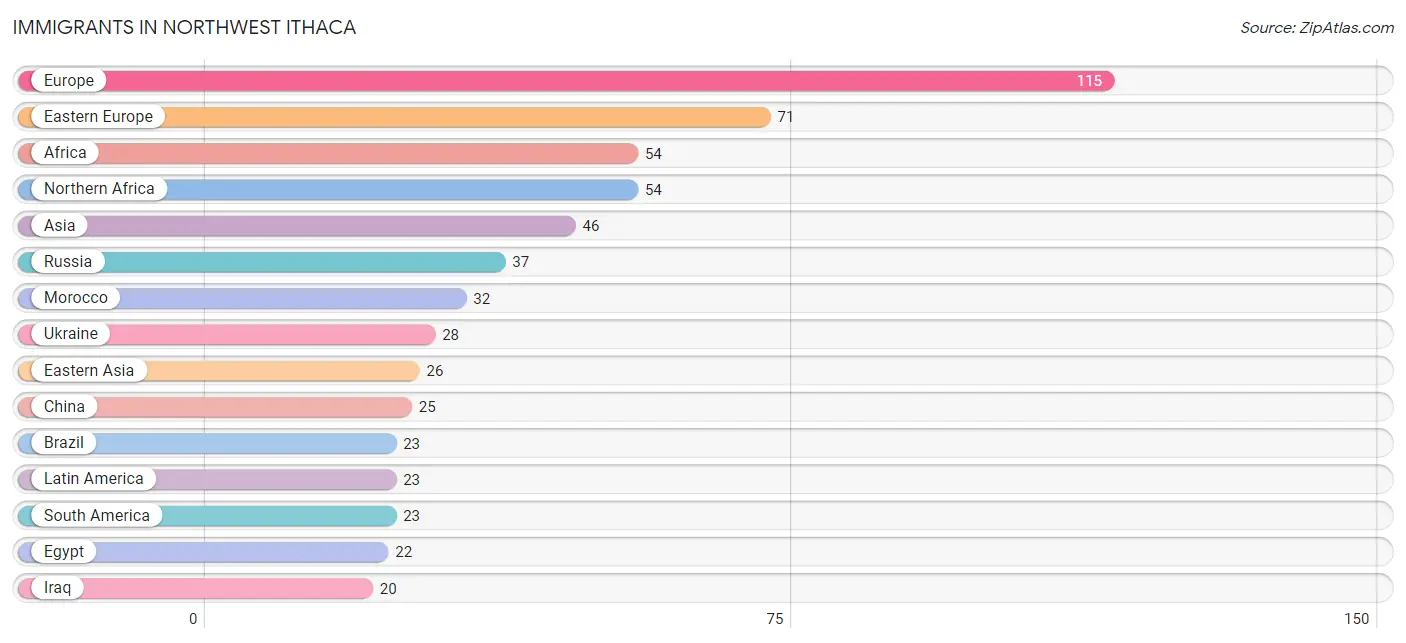
The most numerous immigrant groups reported in Northwest Ithaca came from Europe (115 | 6.4%), Eastern Europe (71 | 4.0%), Africa (54 | 3.0%), Northern Africa (54 | 3.0%), and Asia (46 | 2.6%), together accounting for 18.9% of all Northwest Ithaca residents.
| Immigration Origin | # Population | % Population |
| Africa | 54 | 3.0% |
| Asia | 46 | 2.6% |
| Austria | 18 | 1.0% |
| Brazil | 23 | 1.3% |
| Bulgaria | 6 | 0.3% |
| Canada | 13 | 0.7% |
| China | 25 | 1.4% |
| Eastern Asia | 26 | 1.5% |
| Eastern Europe | 71 | 4.0% |
| Egypt | 22 | 1.2% |
| England | 4 | 0.2% |
| Europe | 115 | 6.4% |
| Hong Kong | 6 | 0.3% |
| Iraq | 20 | 1.1% |
| Ireland | 7 | 0.4% |
| Italy | 8 | 0.4% |
| Japan | 1 | 0.1% |
| Latin America | 23 | 1.3% |
| Morocco | 32 | 1.8% |
| Northern Africa | 54 | 3.0% |
| Northern Europe | 18 | 1.0% |
| Russia | 37 | 2.1% |
| South America | 23 | 1.3% |
| Southern Europe | 8 | 0.4% |
| Sweden | 7 | 0.4% |
| Ukraine | 28 | 1.6% |
| Western Asia | 20 | 1.1% |
| Western Europe | 18 | 1.0% | View All 28 Rows |
Sex and Age in Northwest Ithaca
Sex and Age in Northwest Ithaca
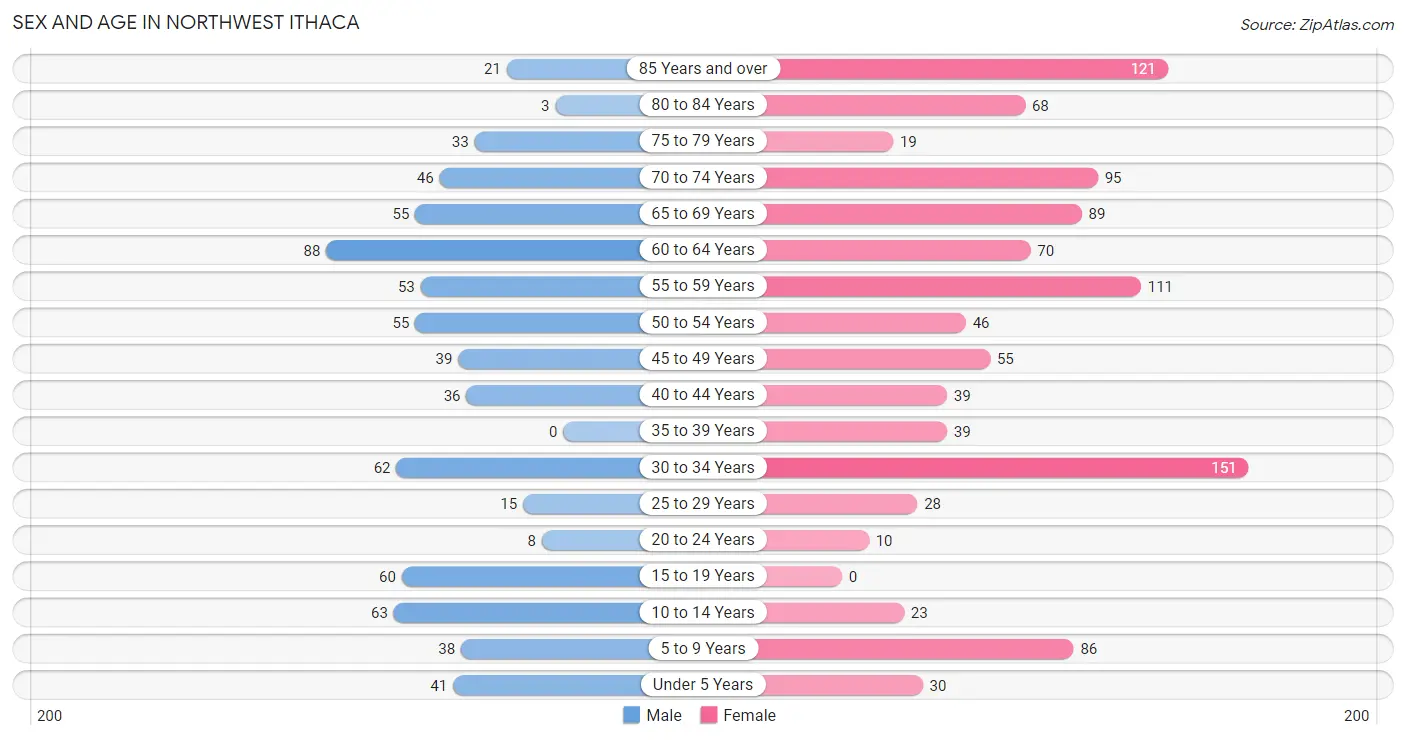
The most populous age groups in Northwest Ithaca are 60 to 64 Years (88 | 12.3%) for men and 30 to 34 Years (151 | 14.0%) for women.
| Age Bracket | Male | Female |
| Under 5 Years | 41 (5.7%) | 30 (2.8%) |
| 5 to 9 Years | 38 (5.3%) | 86 (8.0%) |
| 10 to 14 Years | 63 (8.8%) | 23 (2.1%) |
| 15 to 19 Years | 60 (8.4%) | 0 (0.0%) |
| 20 to 24 Years | 8 (1.1%) | 10 (0.9%) |
| 25 to 29 Years | 15 (2.1%) | 28 (2.6%) |
| 30 to 34 Years | 62 (8.7%) | 151 (14.0%) |
| 35 to 39 Years | 0 (0.0%) | 39 (3.6%) |
| 40 to 44 Years | 36 (5.0%) | 39 (3.6%) |
| 45 to 49 Years | 39 (5.4%) | 55 (5.1%) |
| 50 to 54 Years | 55 (7.7%) | 46 (4.3%) |
| 55 to 59 Years | 53 (7.4%) | 111 (10.3%) |
| 60 to 64 Years | 88 (12.3%) | 70 (6.5%) |
| 65 to 69 Years | 55 (7.7%) | 89 (8.2%) |
| 70 to 74 Years | 46 (6.4%) | 95 (8.8%) |
| 75 to 79 Years | 33 (4.6%) | 19 (1.8%) |
| 80 to 84 Years | 3 (0.4%) | 68 (6.3%) |
| 85 Years and over | 21 (2.9%) | 121 (11.2%) |
| Total | 716 (100.0%) | 1,080 (100.0%) |
Families and Households in Northwest Ithaca
Median Family Size in Northwest Ithaca
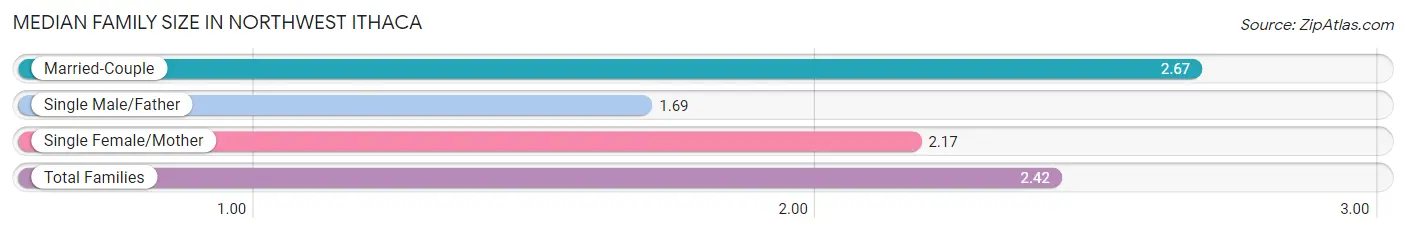
The median family size in Northwest Ithaca is 2.42 persons per family, with married-couple families (273 | 56.4%) accounting for the largest median family size of 2.67 persons per family. On the other hand, single male/father families (29 | 6.0%) represent the smallest median family size with 1.69 persons per family.
| Family Type | # Families | Family Size |
| Married-Couple | 273 (56.4%) | 2.67 |
| Single Male/Father | 29 (6.0%) | 1.69 |
| Single Female/Mother | 182 (37.6%) | 2.17 |
| Total Families | 484 (100.0%) | 2.42 |
Median Household Size in Northwest Ithaca
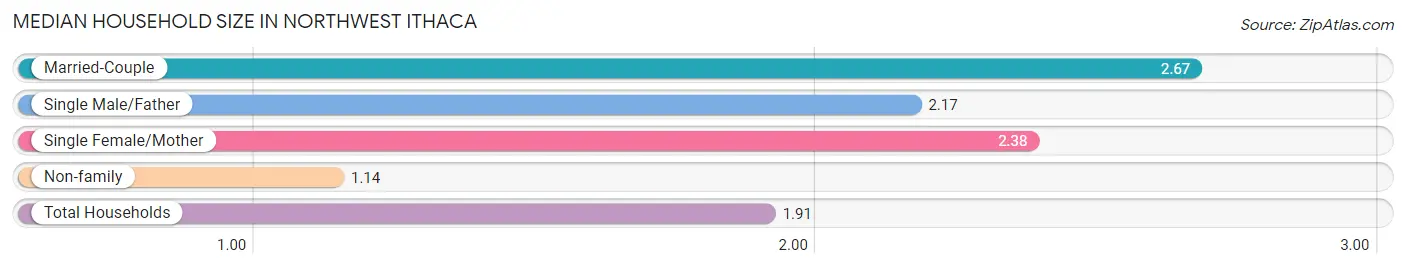
The median household size in Northwest Ithaca is 1.91 persons per household, with married-couple households (273 | 31.2%) accounting for the largest median household size of 2.67 persons per household. non-family households (391 | 44.7%) represent the smallest median household size with 1.14 persons per household.
| Household Type | # Households | Household Size |
| Married-Couple | 273 (31.2%) | 2.67 |
| Single Male/Father | 29 (3.3%) | 2.17 |
| Single Female/Mother | 182 (20.8%) | 2.38 |
| Non-family | 391 (44.7%) | 1.14 |
| Total Households | 875 (100.0%) | 1.91 |
Household Size by Marriage Status in Northwest Ithaca
Out of a total of 875 households in Northwest Ithaca, 484 (55.3%) are family households, while 391 (44.7%) are nonfamily households. The most numerous type of family households are 2-person households, comprising 332, and the most common type of nonfamily households are 1-person households, comprising 337.
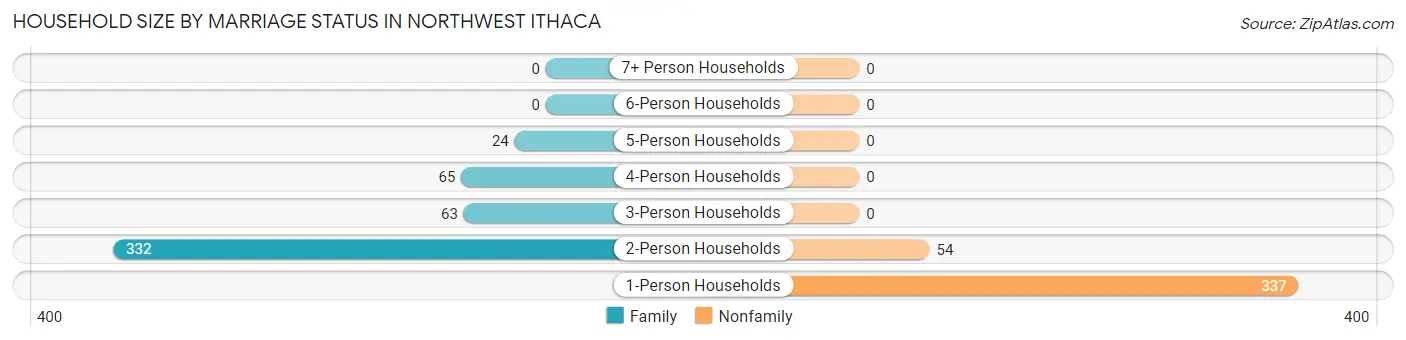
| Household Size | Family Households | Nonfamily Households |
| 1-Person Households | - | 337 (38.5%) |
| 2-Person Households | 332 (37.9%) | 54 (6.2%) |
| 3-Person Households | 63 (7.2%) | 0 (0.0%) |
| 4-Person Households | 65 (7.4%) | 0 (0.0%) |
| 5-Person Households | 24 (2.7%) | 0 (0.0%) |
| 6-Person Households | 0 (0.0%) | 0 (0.0%) |
| 7+ Person Households | 0 (0.0%) | 0 (0.0%) |
| Total | 484 (55.3%) | 391 (44.7%) |
Female Fertility in Northwest Ithaca
Fertility by Age in Northwest Ithaca
Average fertility rate in Northwest Ithaca is 112.0 births per 1,000 women. Women in the age bracket of 35 to 50 years have the highest fertility rate with 128.0 births per 1,000 women. Women in the age bracket of 20 to 34 years acount for 51.3% of all women with births.
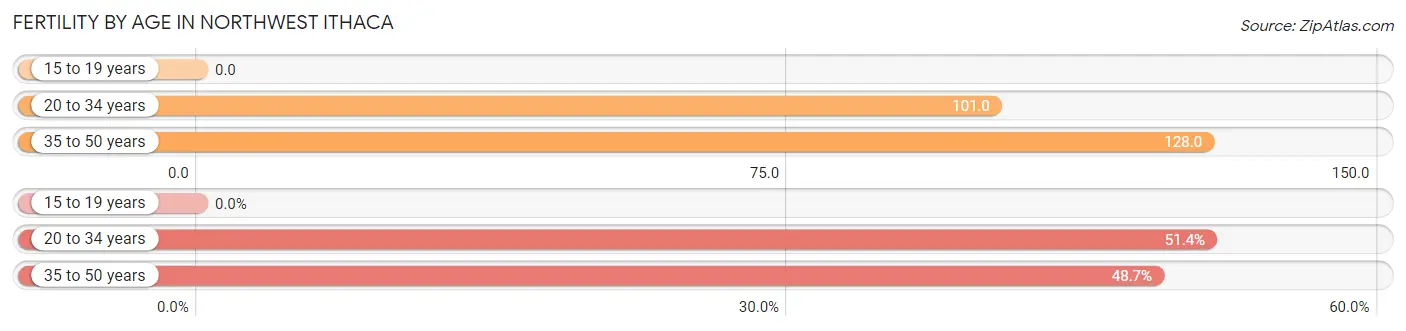
| Age Bracket | Women with Births | Births / 1,000 Women |
| 15 to 19 years | 0 (0.0%) | 0.0 |
| 20 to 34 years | 19 (51.3%) | 101.0 |
| 35 to 50 years | 18 (48.6%) | 128.0 |
| Total | 37 (100.0%) | 112.0 |
Fertility by Age by Marriage Status in Northwest Ithaca
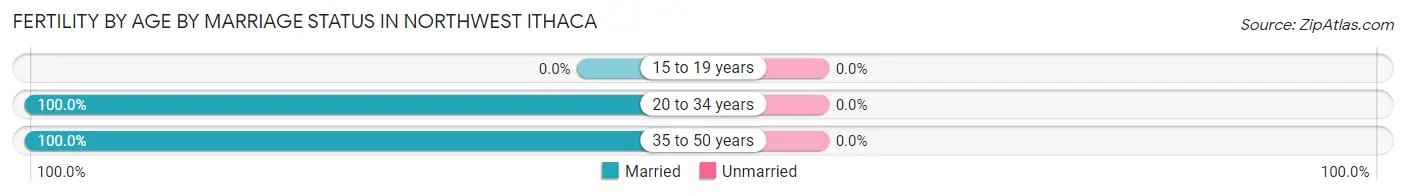
| Age Bracket | Married | Unmarried |
| 15 to 19 years | 0 (0.0%) | 0 (0.0%) |
| 20 to 34 years | 19 (100.0%) | 0 (0.0%) |
| 35 to 50 years | 18 (100.0%) | 0 (0.0%) |
| Total | 37 (100.0%) | 0 (0.0%) |
Fertility by Education in Northwest Ithaca
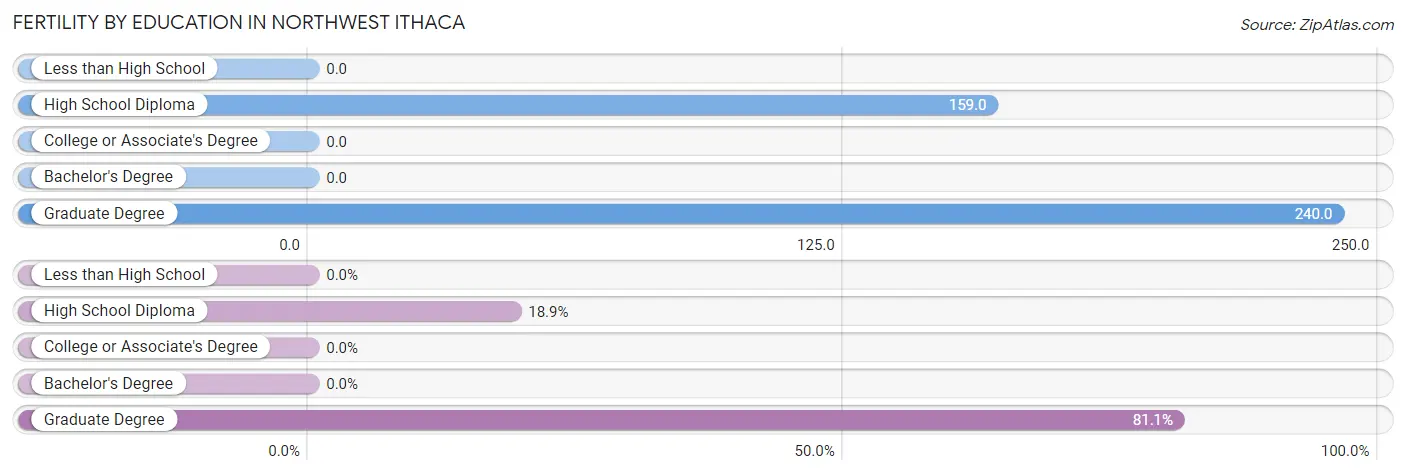
| Educational Attainment | Women with Births | Births / 1,000 Women |
| Less than High School | 0 (0.0%) | 0.0 |
| High School Diploma | 7 (18.9%) | 159.0 |
| College or Associate's Degree | 0 (0.0%) | 0.0 |
| Bachelor's Degree | 0 (0.0%) | 0.0 |
| Graduate Degree | 30 (81.1%) | 240.0 |
| Total | 37 (100.0%) | 112.0 |
Fertility by Education by Marriage Status in Northwest Ithaca
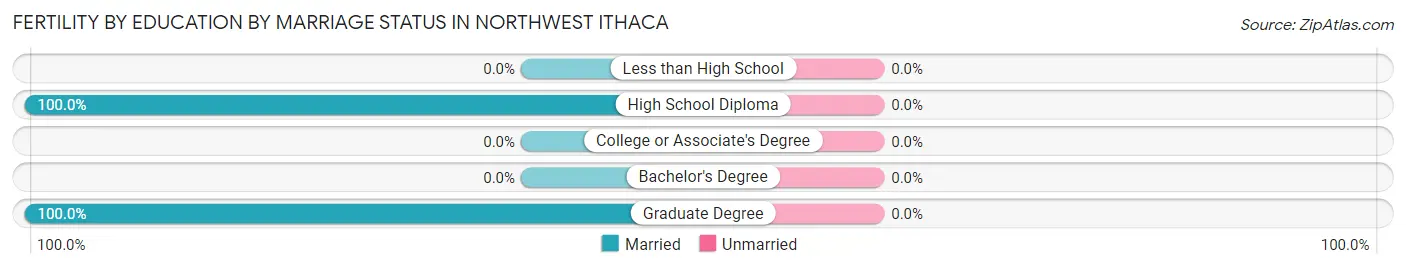
| Educational Attainment | Married | Unmarried |
| Less than High School | 0 (0.0%) | 0 (0.0%) |
| High School Diploma | 7 (100.0%) | 0 (0.0%) |
| College or Associate's Degree | 0 (0.0%) | 0 (0.0%) |
| Bachelor's Degree | 0 (0.0%) | 0 (0.0%) |
| Graduate Degree | 30 (100.0%) | 0 (0.0%) |
| Total | 37 (100.0%) | 0 (0.0%) |
Employment Characteristics in Northwest Ithaca
Employment by Class of Employer in Northwest Ithaca
Among the 761 employed individuals in Northwest Ithaca, not-for-profit organizations (294 | 38.6%), private company employees (271 | 35.6%), and self-employed (not incorporated) (58 | 7.6%) make up the most common classes of employment.
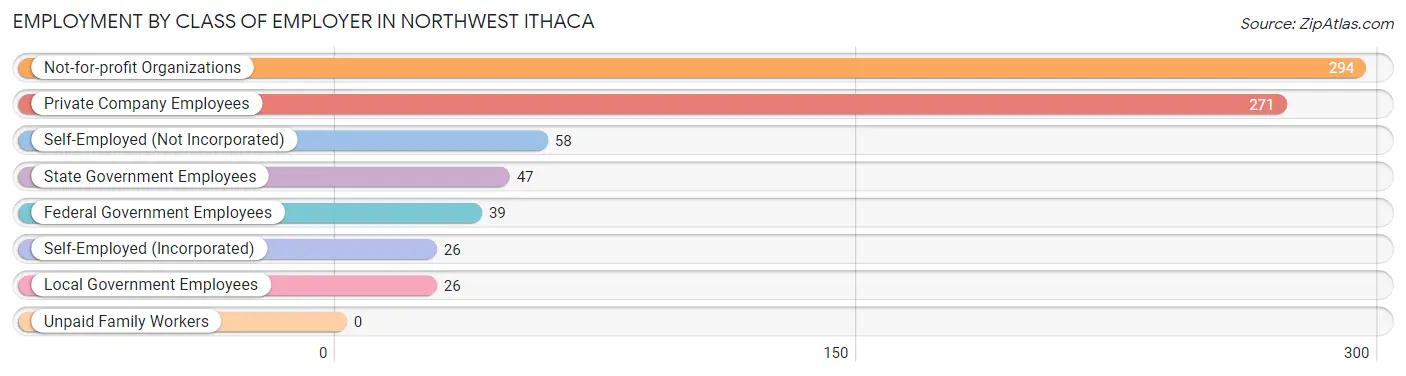
| Employer Class | # Employees | % Employees |
| Private Company Employees | 271 | 35.6% |
| Self-Employed (Incorporated) | 26 | 3.4% |
| Self-Employed (Not Incorporated) | 58 | 7.6% |
| Not-for-profit Organizations | 294 | 38.6% |
| Local Government Employees | 26 | 3.4% |
| State Government Employees | 47 | 6.2% |
| Federal Government Employees | 39 | 5.1% |
| Unpaid Family Workers | 0 | 0.0% |
| Total | 761 | 100.0% |
Employment Status by Age in Northwest Ithaca
According to the labor force statistics for Northwest Ithaca, out of the total population over 16 years of age (1,497), 52.4% or 784 individuals are in the labor force, with 1.7% or 13 of them unemployed. The age group with the highest labor force participation rate is 25 to 29 years, with 100.0% or 43 individuals in the labor force. Within the labor force, the 75 years and over age range has the highest percentage of unemployed individuals, with 50.0% or 9 of them being unemployed.
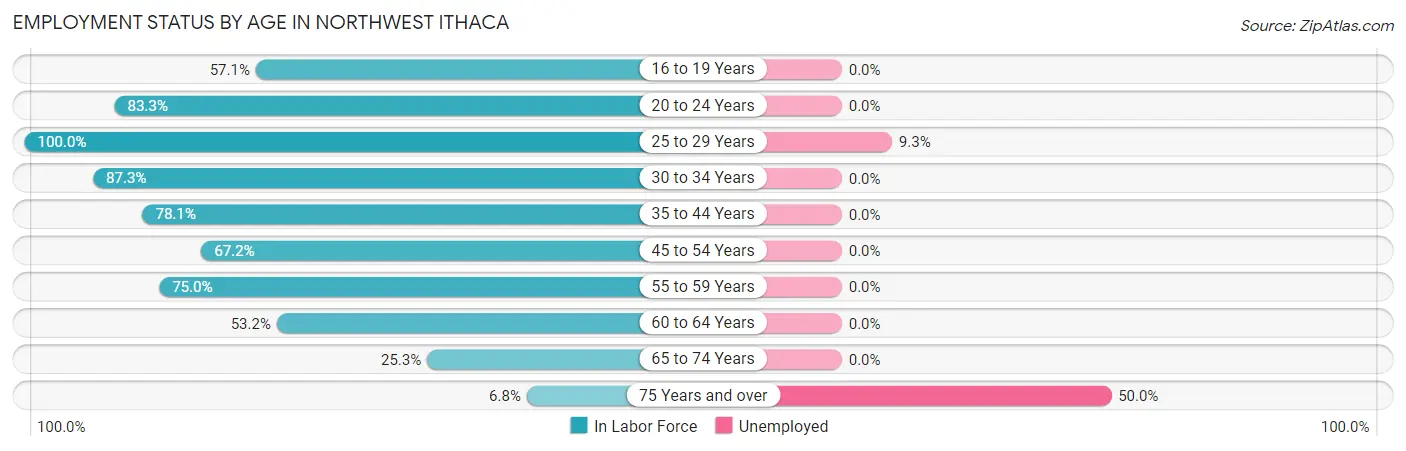
| Age Bracket | In Labor Force | Unemployed |
| 16 to 19 Years | 24 (57.1%) | 0 (0.0%) |
| 20 to 24 Years | 15 (83.3%) | 0 (0.0%) |
| 25 to 29 Years | 43 (100.0%) | 4 (9.3%) |
| 30 to 34 Years | 186 (87.3%) | 0 (0.0%) |
| 35 to 44 Years | 89 (78.1%) | 0 (0.0%) |
| 45 to 54 Years | 131 (67.2%) | 0 (0.0%) |
| 55 to 59 Years | 123 (75.0%) | 0 (0.0%) |
| 60 to 64 Years | 84 (53.2%) | 0 (0.0%) |
| 65 to 74 Years | 72 (25.3%) | 0 (0.0%) |
| 75 Years and over | 18 (6.8%) | 9 (50.0%) |
| Total | 784 (52.4%) | 13 (1.7%) |
Employment Status by Educational Attainment in Northwest Ithaca
According to labor force statistics for Northwest Ithaca, 74.0% of individuals (656) out of the total population between 25 and 64 years of age (887) are in the labor force, with 0.6% or 4 of them being unemployed. The group with the highest labor force participation rate are those with the educational attainment of bachelor's degree or higher, with 91.7% or 442 individuals in the labor force. Within the labor force, individuals with bachelor's degree or higher education have the highest percentage of unemployment, with 0.9% or 4 of them being unemployed.
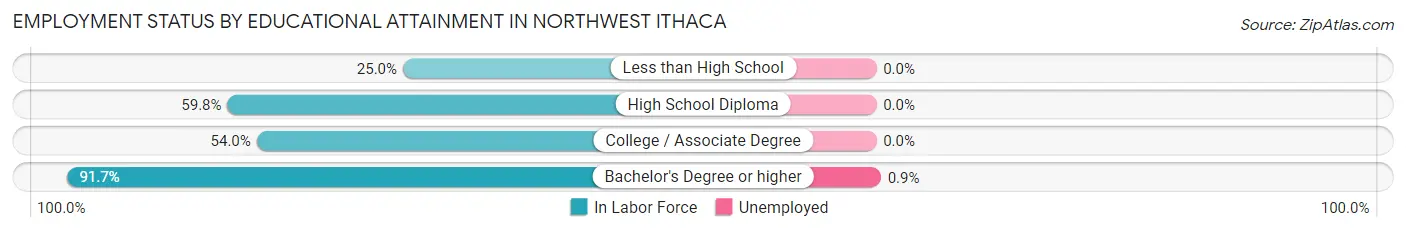
| Educational Attainment | In Labor Force | Unemployed |
| Less than High School | 9 (25.0%) | 0 (0.0%) |
| High School Diploma | 58 (59.8%) | 0 (0.0%) |
| College / Associate Degree | 147 (54.0%) | 0 (0.0%) |
| Bachelor's Degree or higher | 442 (91.7%) | 4 (0.9%) |
| Total | 656 (74.0%) | 5 (0.6%) |
Employment Occupations by Sex in Northwest Ithaca
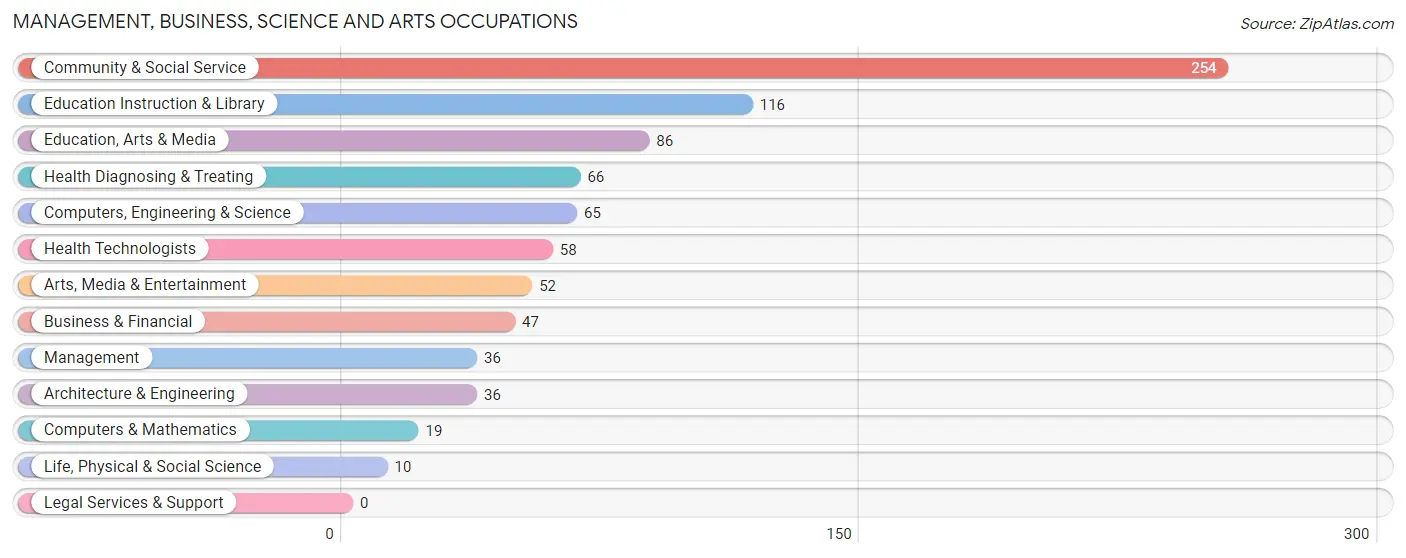
Management, Business, Science and Arts Occupations
The most common Management, Business, Science and Arts occupations in Northwest Ithaca are Community & Social Service (254 | 32.9%), Education Instruction & Library (116 | 15.0%), Education, Arts & Media (86 | 11.1%), Health Diagnosing & Treating (66 | 8.6%), and Computers, Engineering & Science (65 | 8.4%).
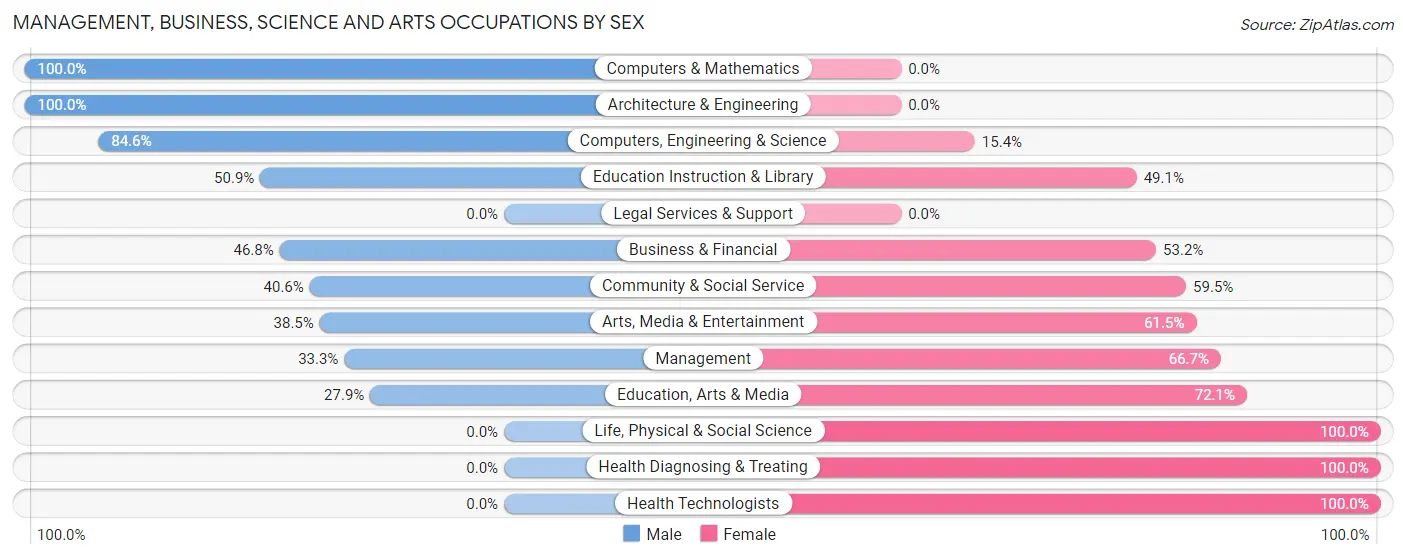
Management, Business, Science and Arts Occupations by Sex
Within the Management, Business, Science and Arts occupations in Northwest Ithaca, the most male-oriented occupations are Computers & Mathematics (100.0%), Architecture & Engineering (100.0%), and Computers, Engineering & Science (84.6%), while the most female-oriented occupations are Life, Physical & Social Science (100.0%), Health Diagnosing & Treating (100.0%), and Health Technologists (100.0%).
| Occupation | Male | Female |
| Management | 12 (33.3%) | 24 (66.7%) |
| Business & Financial | 22 (46.8%) | 25 (53.2%) |
| Computers, Engineering & Science | 55 (84.6%) | 10 (15.4%) |
| Computers & Mathematics | 19 (100.0%) | 0 (0.0%) |
| Architecture & Engineering | 36 (100.0%) | 0 (0.0%) |
| Life, Physical & Social Science | 0 (0.0%) | 10 (100.0%) |
| Community & Social Service | 103 (40.6%) | 151 (59.5%) |
| Education, Arts & Media | 24 (27.9%) | 62 (72.1%) |
| Legal Services & Support | 0 (0.0%) | 0 (0.0%) |
| Education Instruction & Library | 59 (50.9%) | 57 (49.1%) |
| Arts, Media & Entertainment | 20 (38.5%) | 32 (61.5%) |
| Health Diagnosing & Treating | 0 (0.0%) | 66 (100.0%) |
| Health Technologists | 0 (0.0%) | 58 (100.0%) |
| Total (Category) | 192 (41.0%) | 276 (59.0%) |
| Total (Overall) | 333 (43.1%) | 439 (56.9%) |
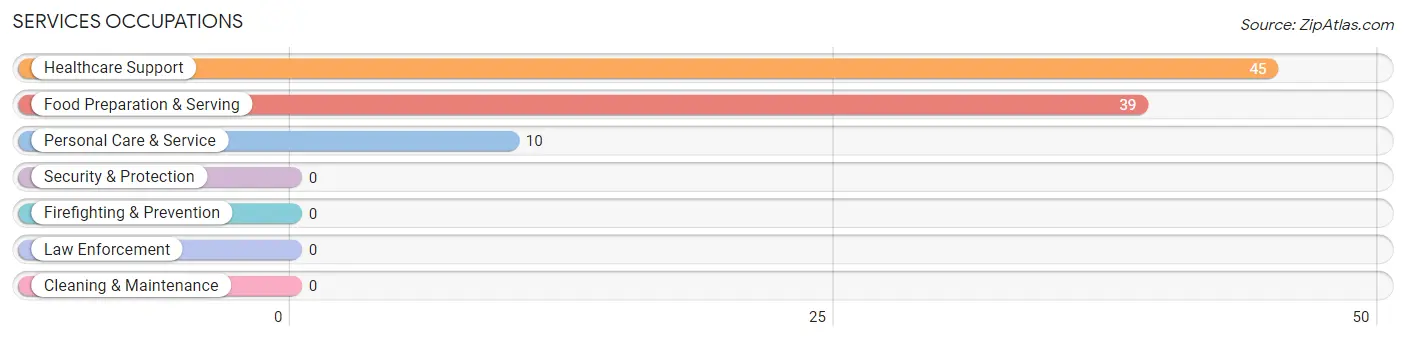
Services Occupations
The most common Services occupations in Northwest Ithaca are Healthcare Support (45 | 5.8%), Food Preparation & Serving (39 | 5.1%), and Personal Care & Service (10 | 1.3%).
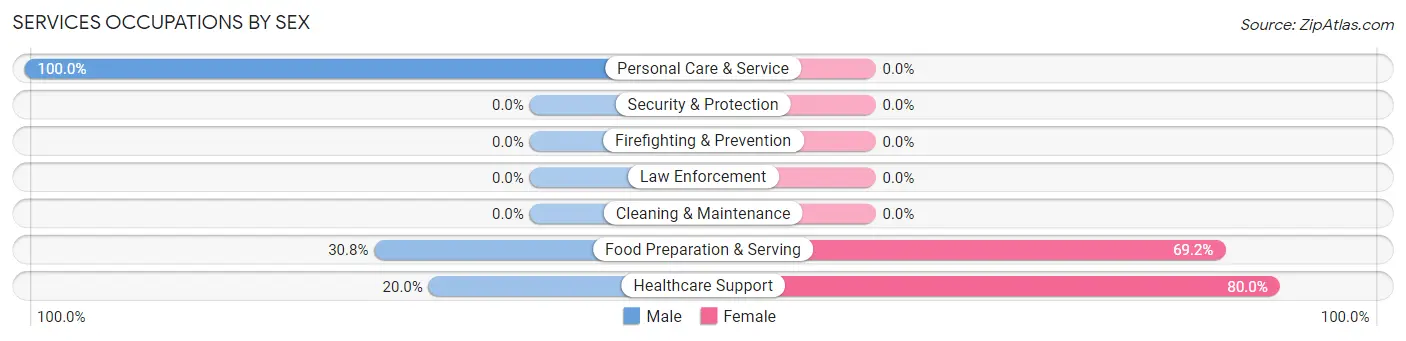
Services Occupations by Sex
Within the Services occupations in Northwest Ithaca, the most male-oriented occupations are Personal Care & Service (100.0%), Food Preparation & Serving (30.8%), and Healthcare Support (20.0%), while the most female-oriented occupations are Healthcare Support (80.0%), and Food Preparation & Serving (69.2%).
| Occupation | Male | Female |
| Healthcare Support | 9 (20.0%) | 36 (80.0%) |
| Security & Protection | 0 (0.0%) | 0 (0.0%) |
| Firefighting & Prevention | 0 (0.0%) | 0 (0.0%) |
| Law Enforcement | 0 (0.0%) | 0 (0.0%) |
| Food Preparation & Serving | 12 (30.8%) | 27 (69.2%) |
| Cleaning & Maintenance | 0 (0.0%) | 0 (0.0%) |
| Personal Care & Service | 10 (100.0%) | 0 (0.0%) |
| Total (Category) | 31 (33.0%) | 63 (67.0%) |
| Total (Overall) | 333 (43.1%) | 439 (56.9%) |
Sales and Office Occupations
The most common Sales and Office occupations in Northwest Ithaca are Sales & Related (91 | 11.8%), and Office & Administration (69 | 8.9%).
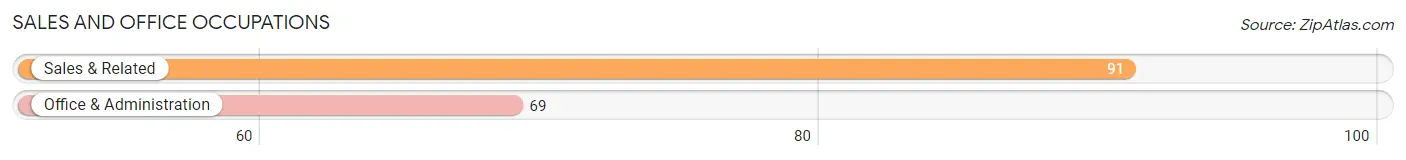
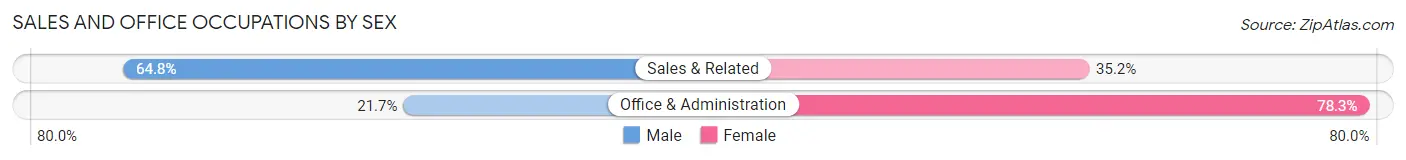
Sales and Office Occupations by Sex
| Occupation | Male | Female |
| Sales & Related | 59 (64.8%) | 32 (35.2%) |
| Office & Administration | 15 (21.7%) | 54 (78.3%) |
| Total (Category) | 74 (46.3%) | 86 (53.7%) |
| Total (Overall) | 333 (43.1%) | 439 (56.9%) |
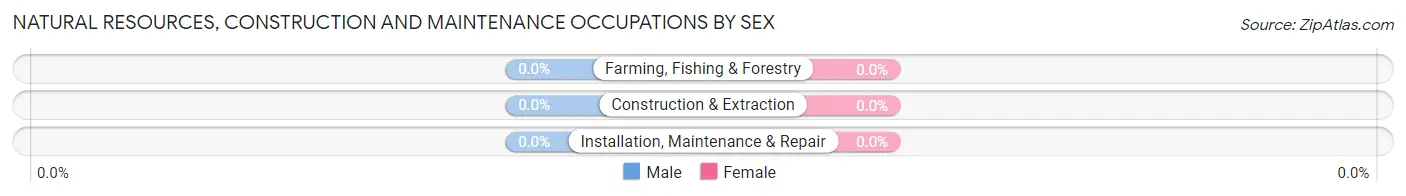
Natural Resources, Construction and Maintenance Occupations

Natural Resources, Construction and Maintenance Occupations by Sex
| Occupation | Male | Female |
| Farming, Fishing & Forestry | 0 (0.0%) | 0 (0.0%) |
| Construction & Extraction | 0 (0.0%) | 0 (0.0%) |
| Installation, Maintenance & Repair | 0 (0.0%) | 0 (0.0%) |
| Total (Category) | 0 (0.0%) | 0 (0.0%) |
| Total (Overall) | 333 (43.1%) | 439 (56.9%) |
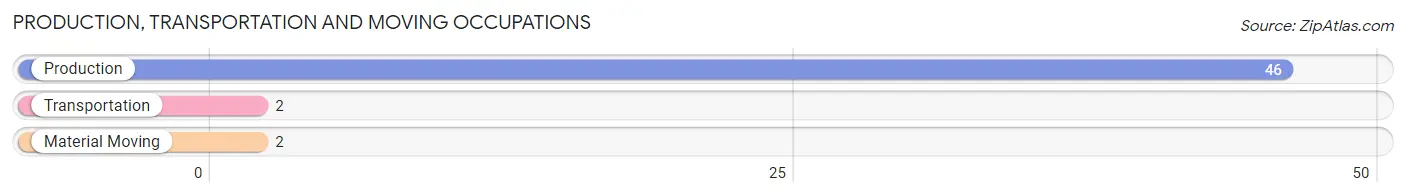
Production, Transportation and Moving Occupations
The most common Production, Transportation and Moving occupations in Northwest Ithaca are Production (46 | 6.0%), Transportation (2 | 0.3%), and Material Moving (2 | 0.3%).
Production, Transportation and Moving Occupations by Sex
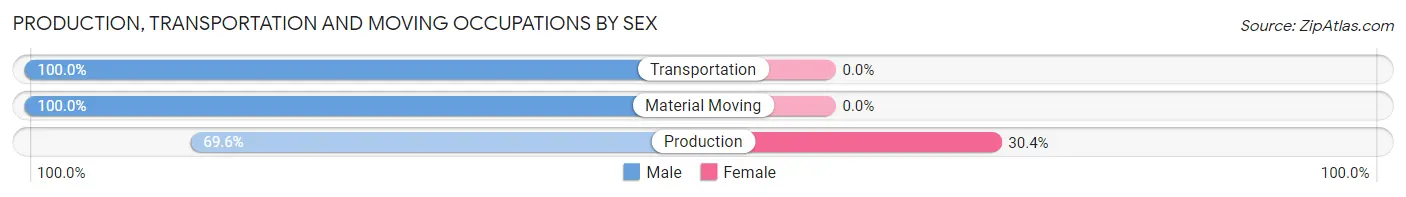
| Occupation | Male | Female |
| Production | 32 (69.6%) | 14 (30.4%) |
| Transportation | 2 (100.0%) | 0 (0.0%) |
| Material Moving | 2 (100.0%) | 0 (0.0%) |
| Total (Category) | 36 (72.0%) | 14 (28.0%) |
| Total (Overall) | 333 (43.1%) | 439 (56.9%) |
Employment Industries by Sex in Northwest Ithaca
Employment Industries in Northwest Ithaca
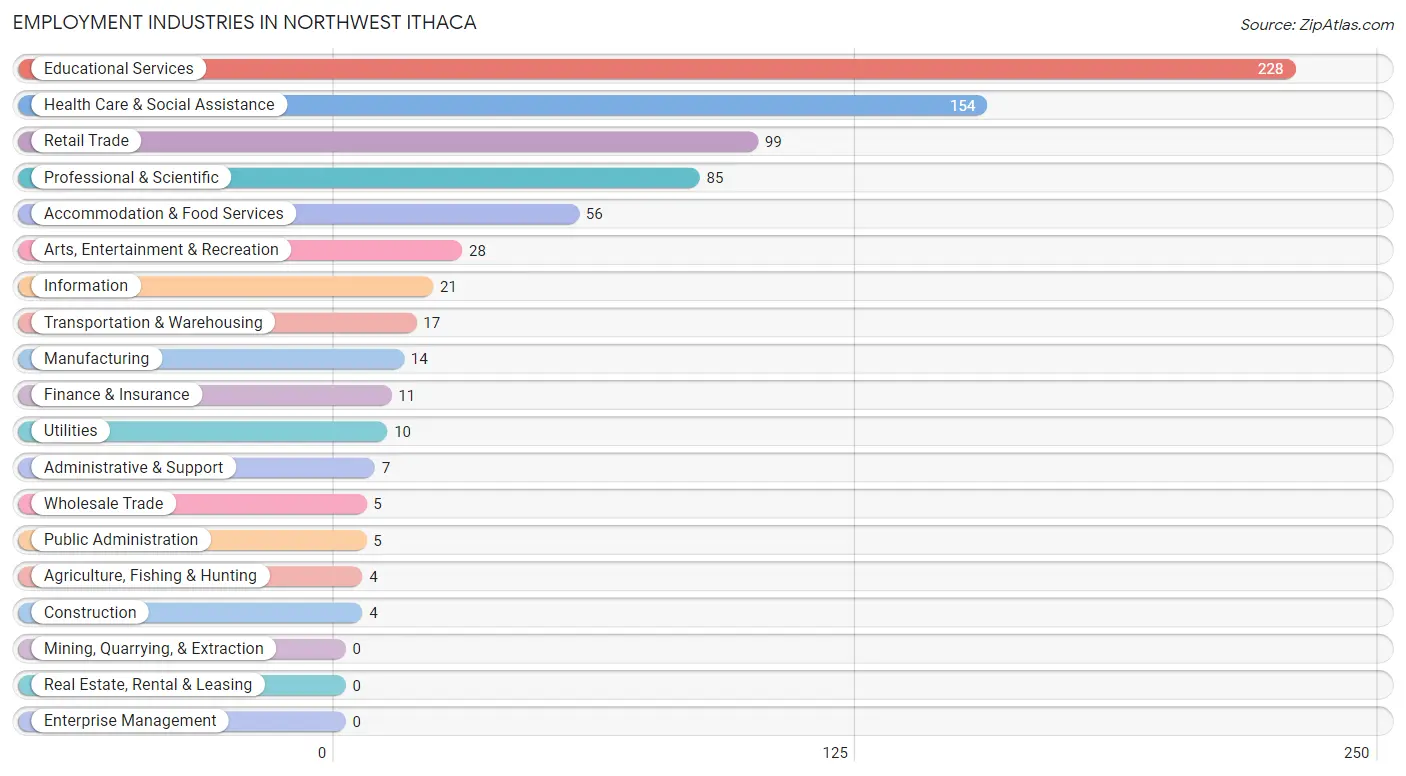
The major employment industries in Northwest Ithaca include Educational Services (228 | 29.5%), Health Care & Social Assistance (154 | 20.0%), Retail Trade (99 | 12.8%), Professional & Scientific (85 | 11.0%), and Accommodation & Food Services (56 | 7.2%).
Employment Industries by Sex in Northwest Ithaca
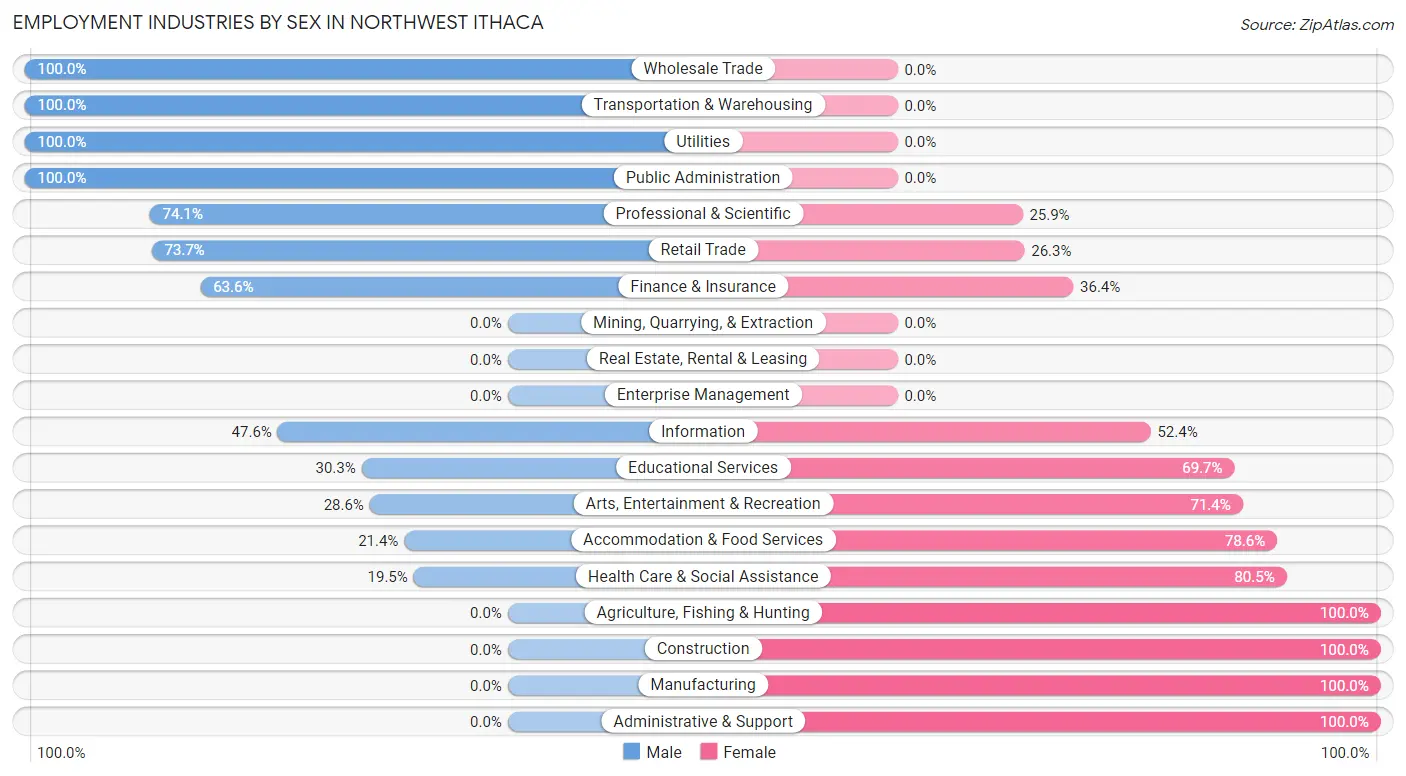
The Northwest Ithaca industries that see more men than women are Wholesale Trade (100.0%), Transportation & Warehousing (100.0%), and Utilities (100.0%), whereas the industries that tend to have a higher number of women are Agriculture, Fishing & Hunting (100.0%), Construction (100.0%), and Manufacturing (100.0%).
| Industry | Male | Female |
| Agriculture, Fishing & Hunting | 0 (0.0%) | 4 (100.0%) |
| Mining, Quarrying, & Extraction | 0 (0.0%) | 0 (0.0%) |
| Construction | 0 (0.0%) | 4 (100.0%) |
| Manufacturing | 0 (0.0%) | 14 (100.0%) |
| Wholesale Trade | 5 (100.0%) | 0 (0.0%) |
| Retail Trade | 73 (73.7%) | 26 (26.3%) |
| Transportation & Warehousing | 17 (100.0%) | 0 (0.0%) |
| Utilities | 10 (100.0%) | 0 (0.0%) |
| Information | 10 (47.6%) | 11 (52.4%) |
| Finance & Insurance | 7 (63.6%) | 4 (36.4%) |
| Real Estate, Rental & Leasing | 0 (0.0%) | 0 (0.0%) |
| Professional & Scientific | 63 (74.1%) | 22 (25.9%) |
| Enterprise Management | 0 (0.0%) | 0 (0.0%) |
| Administrative & Support | 0 (0.0%) | 7 (100.0%) |
| Educational Services | 69 (30.3%) | 159 (69.7%) |
| Health Care & Social Assistance | 30 (19.5%) | 124 (80.5%) |
| Arts, Entertainment & Recreation | 8 (28.6%) | 20 (71.4%) |
| Accommodation & Food Services | 12 (21.4%) | 44 (78.6%) |
| Public Administration | 5 (100.0%) | 0 (0.0%) |
| Total | 333 (43.1%) | 439 (56.9%) |
Education in Northwest Ithaca
School Enrollment in Northwest Ithaca
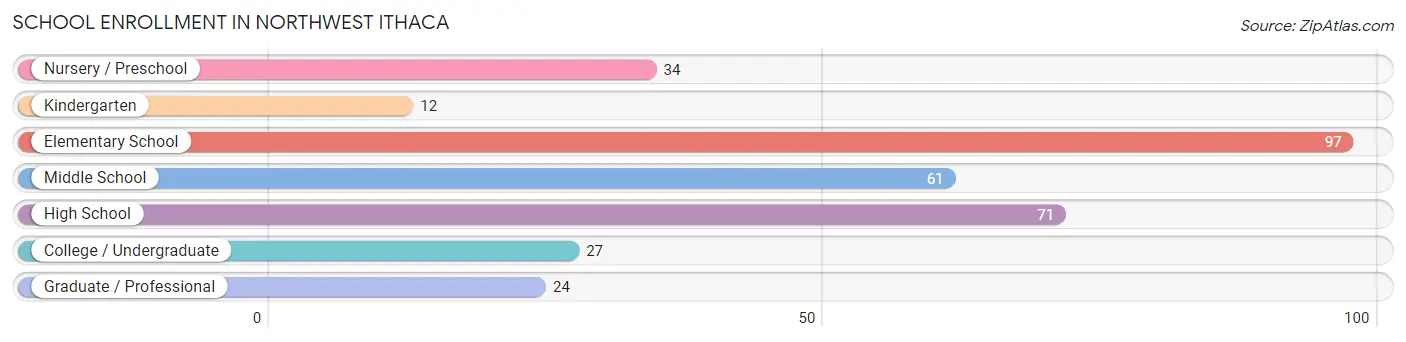
The most common levels of schooling among the 326 students in Northwest Ithaca are elementary school (97 | 29.7%), high school (71 | 21.8%), and middle school (61 | 18.7%).
| School Level | # Students | % Students |
| Nursery / Preschool | 34 | 10.4% |
| Kindergarten | 12 | 3.7% |
| Elementary School | 97 | 29.7% |
| Middle School | 61 | 18.7% |
| High School | 71 | 21.8% |
| College / Undergraduate | 27 | 8.3% |
| Graduate / Professional | 24 | 7.4% |
| Total | 326 | 100.0% |
School Enrollment by Age by Funding Source in Northwest Ithaca
Out of a total of 326 students who are enrolled in schools in Northwest Ithaca, 49 (15.0%) attend a private institution, while the remaining 277 (85.0%) are enrolled in public schools. The age group of 18 to 19 year olds has the highest likelihood of being enrolled in private schools, with 8 (100.0% in the age bracket) enrolled. Conversely, the age group of 5 to 9 year old has the lowest likelihood of being enrolled in a private school, with 124 (100.0% in the age bracket) attending a public institution.
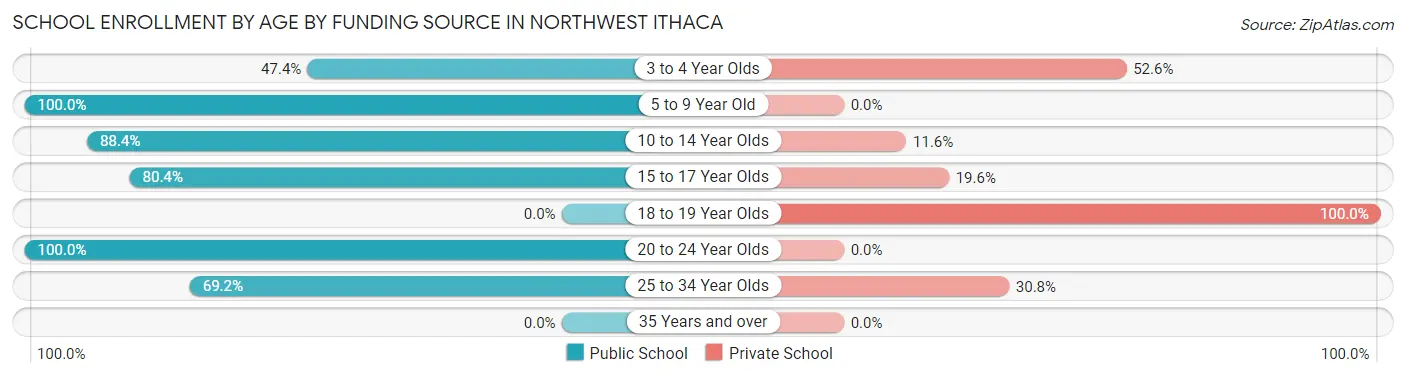
| Age Bracket | Public School | Private School |
| 3 to 4 Year Olds | 9 (47.4%) | 10 (52.6%) |
| 5 to 9 Year Old | 124 (100.0%) | 0 (0.0%) |
| 10 to 14 Year Olds | 76 (88.4%) | 10 (11.6%) |
| 15 to 17 Year Olds | 37 (80.4%) | 9 (19.6%) |
| 18 to 19 Year Olds | 0 (0.0%) | 8 (100.0%) |
| 20 to 24 Year Olds | 4 (100.0%) | 0 (0.0%) |
| 25 to 34 Year Olds | 27 (69.2%) | 12 (30.8%) |
| 35 Years and over | 0 (0.0%) | 0 (0.0%) |
| Total | 277 (85.0%) | 49 (15.0%) |
Educational Attainment by Field of Study in Northwest Ithaca
Education (106 | 13.3%), social sciences (103 | 12.9%), literature & languages (103 | 12.9%), psychology (73 | 9.1%), and engineering (73 | 9.1%) are the most common fields of study among 800 individuals in Northwest Ithaca who have obtained a bachelor's degree or higher.
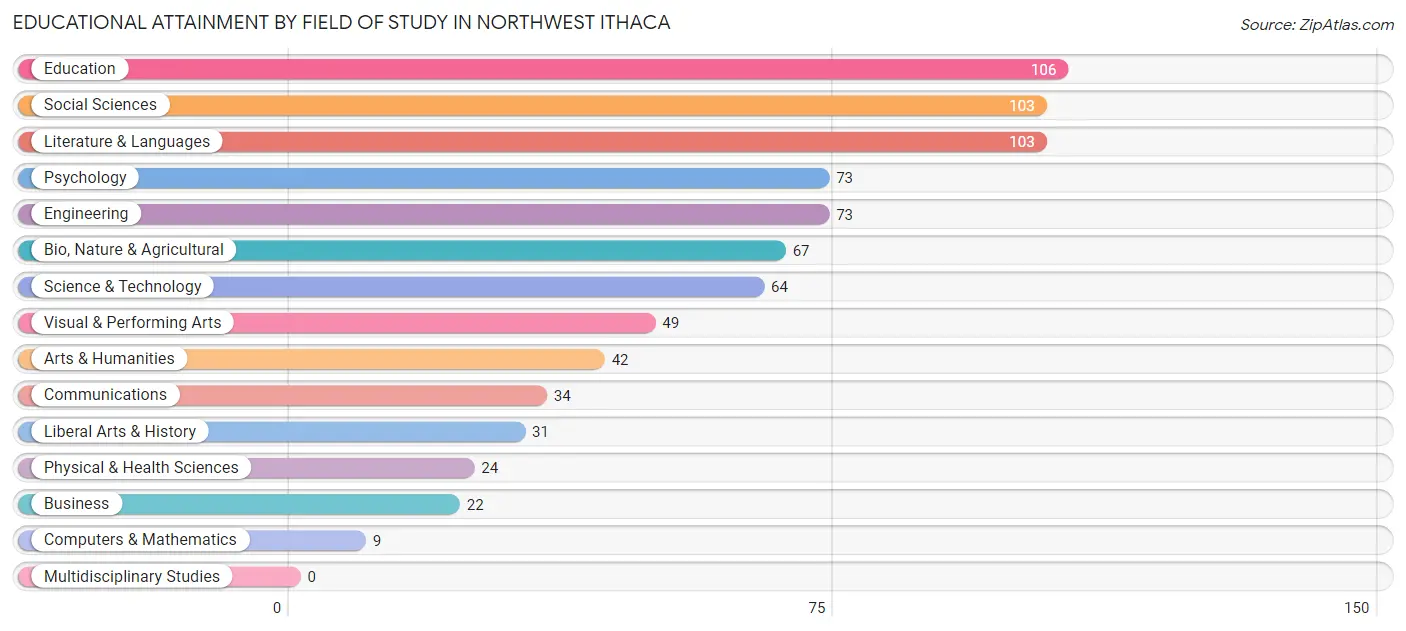
| Field of Study | # Graduates | % Graduates |
| Computers & Mathematics | 9 | 1.1% |
| Bio, Nature & Agricultural | 67 | 8.4% |
| Physical & Health Sciences | 24 | 3.0% |
| Psychology | 73 | 9.1% |
| Social Sciences | 103 | 12.9% |
| Engineering | 73 | 9.1% |
| Multidisciplinary Studies | 0 | 0.0% |
| Science & Technology | 64 | 8.0% |
| Business | 22 | 2.8% |
| Education | 106 | 13.3% |
| Literature & Languages | 103 | 12.9% |
| Liberal Arts & History | 31 | 3.9% |
| Visual & Performing Arts | 49 | 6.1% |
| Communications | 34 | 4.3% |
| Arts & Humanities | 42 | 5.2% |
| Total | 800 | 100.0% |
Transportation & Commute in Northwest Ithaca
Vehicle Availability by Sex in Northwest Ithaca
The most prevalent vehicle ownership categories in Northwest Ithaca are males with 2 vehicles (129, accounting for 38.7%) and females with 2 vehicles (129, making up 30.1%).
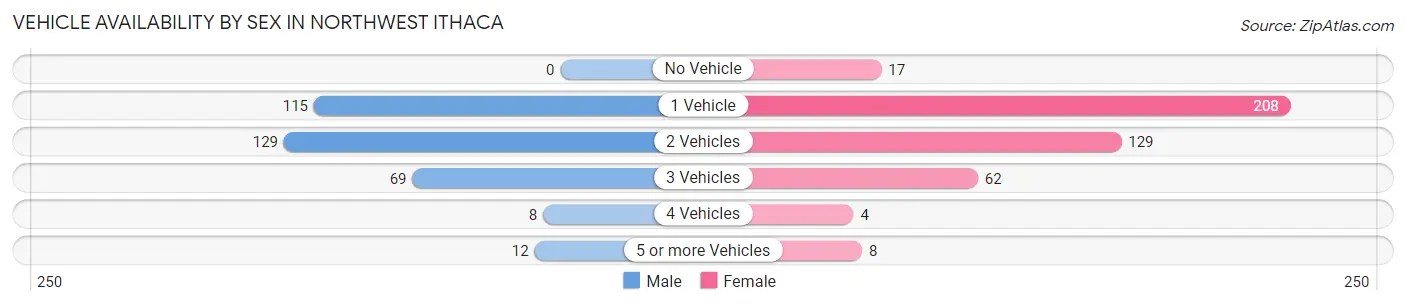
| Vehicles Available | Male | Female |
| No Vehicle | 0 (0.0%) | 17 (4.0%) |
| 1 Vehicle | 115 (34.5%) | 208 (48.6%) |
| 2 Vehicles | 129 (38.7%) | 129 (30.1%) |
| 3 Vehicles | 69 (20.7%) | 62 (14.5%) |
| 4 Vehicles | 8 (2.4%) | 4 (0.9%) |
| 5 or more Vehicles | 12 (3.6%) | 8 (1.9%) |
| Total | 333 (100.0%) | 428 (100.0%) |
Commute Time in Northwest Ithaca
The most frequently occuring commute durations in Northwest Ithaca are 15 to 19 minutes (180 commuters, 28.6%), 20 to 24 minutes (129 commuters, 20.5%), and 10 to 14 minutes (106 commuters, 16.9%).
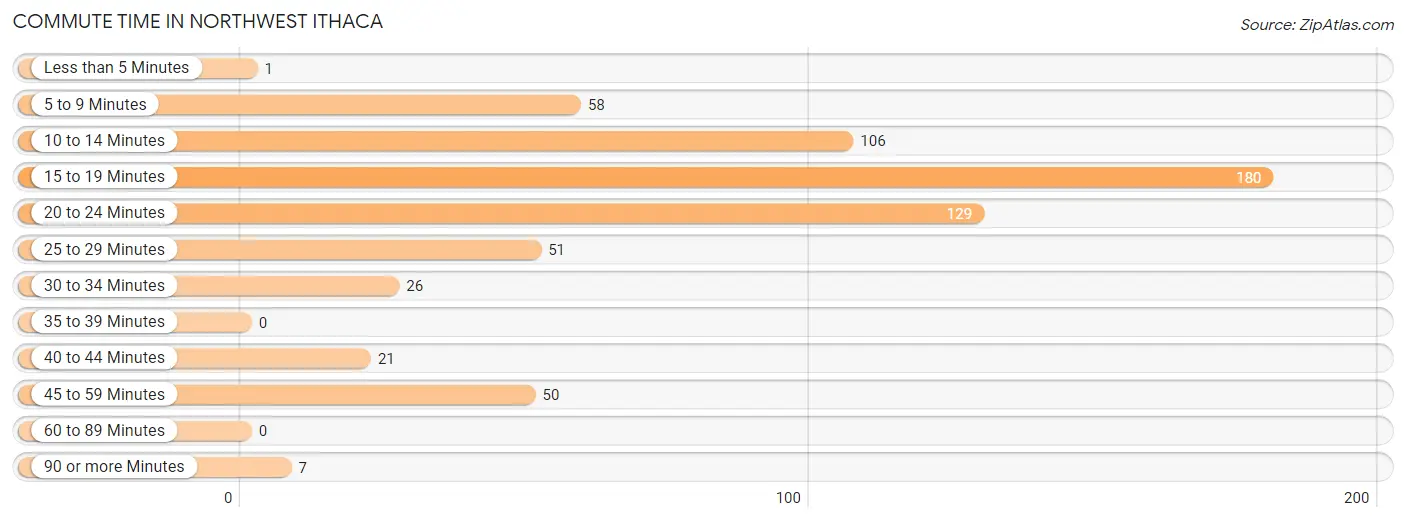
| Commute Time | # Commuters | % Commuters |
| Less than 5 Minutes | 1 | 0.2% |
| 5 to 9 Minutes | 58 | 9.2% |
| 10 to 14 Minutes | 106 | 16.9% |
| 15 to 19 Minutes | 180 | 28.6% |
| 20 to 24 Minutes | 129 | 20.5% |
| 25 to 29 Minutes | 51 | 8.1% |
| 30 to 34 Minutes | 26 | 4.1% |
| 35 to 39 Minutes | 0 | 0.0% |
| 40 to 44 Minutes | 21 | 3.3% |
| 45 to 59 Minutes | 50 | 8.0% |
| 60 to 89 Minutes | 0 | 0.0% |
| 90 or more Minutes | 7 | 1.1% |
Commute Time by Sex in Northwest Ithaca
The most common commute times in Northwest Ithaca are 15 to 19 minutes (128 commuters, 47.4%) for males and 20 to 24 minutes (94 commuters, 26.2%) for females.
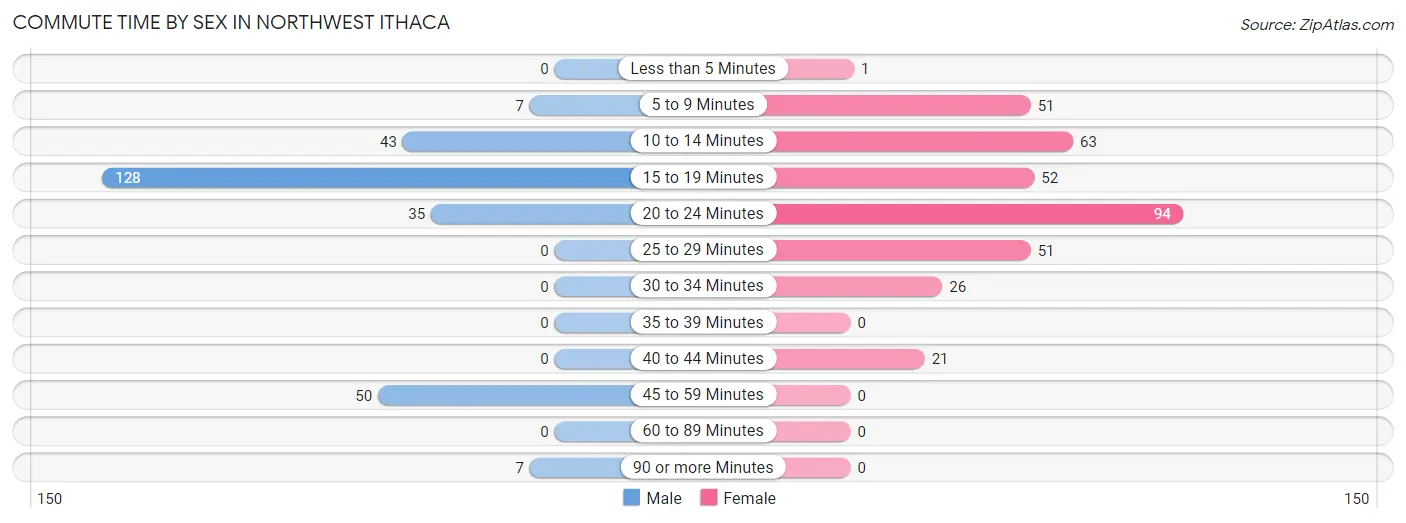
| Commute Time | Male | Female |
| Less than 5 Minutes | 0 (0.0%) | 1 (0.3%) |
| 5 to 9 Minutes | 7 (2.6%) | 51 (14.2%) |
| 10 to 14 Minutes | 43 (15.9%) | 63 (17.5%) |
| 15 to 19 Minutes | 128 (47.4%) | 52 (14.5%) |
| 20 to 24 Minutes | 35 (13.0%) | 94 (26.2%) |
| 25 to 29 Minutes | 0 (0.0%) | 51 (14.2%) |
| 30 to 34 Minutes | 0 (0.0%) | 26 (7.2%) |
| 35 to 39 Minutes | 0 (0.0%) | 0 (0.0%) |
| 40 to 44 Minutes | 0 (0.0%) | 21 (5.9%) |
| 45 to 59 Minutes | 50 (18.5%) | 0 (0.0%) |
| 60 to 89 Minutes | 0 (0.0%) | 0 (0.0%) |
| 90 or more Minutes | 7 (2.6%) | 0 (0.0%) |
Time of Departure to Work by Sex in Northwest Ithaca
The most frequent times of departure to work in Northwest Ithaca are 7:00 AM to 7:29 AM (84, 31.1%) for males and 8:00 AM to 8:29 AM (104, 29.0%) for females.
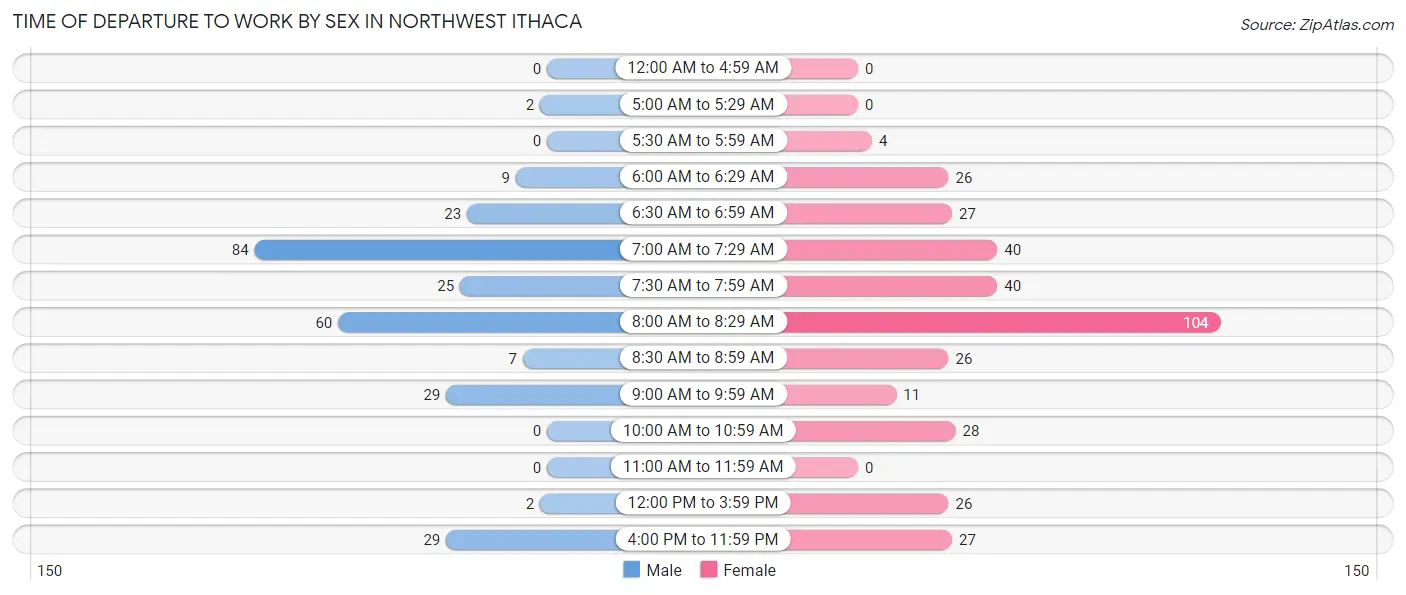
| Time of Departure | Male | Female |
| 12:00 AM to 4:59 AM | 0 (0.0%) | 0 (0.0%) |
| 5:00 AM to 5:29 AM | 2 (0.7%) | 0 (0.0%) |
| 5:30 AM to 5:59 AM | 0 (0.0%) | 4 (1.1%) |
| 6:00 AM to 6:29 AM | 9 (3.3%) | 26 (7.2%) |
| 6:30 AM to 6:59 AM | 23 (8.5%) | 27 (7.5%) |
| 7:00 AM to 7:29 AM | 84 (31.1%) | 40 (11.1%) |
| 7:30 AM to 7:59 AM | 25 (9.3%) | 40 (11.1%) |
| 8:00 AM to 8:29 AM | 60 (22.2%) | 104 (29.0%) |
| 8:30 AM to 8:59 AM | 7 (2.6%) | 26 (7.2%) |
| 9:00 AM to 9:59 AM | 29 (10.7%) | 11 (3.1%) |
| 10:00 AM to 10:59 AM | 0 (0.0%) | 28 (7.8%) |
| 11:00 AM to 11:59 AM | 0 (0.0%) | 0 (0.0%) |
| 12:00 PM to 3:59 PM | 2 (0.7%) | 26 (7.2%) |
| 4:00 PM to 11:59 PM | 29 (10.7%) | 27 (7.5%) |
| Total | 270 (100.0%) | 359 (100.0%) |
Housing Occupancy in Northwest Ithaca
Occupancy by Ownership in Northwest Ithaca
Of the total 875 dwellings in Northwest Ithaca, owner-occupied units account for 390 (44.6%), while renter-occupied units make up 485 (55.4%).
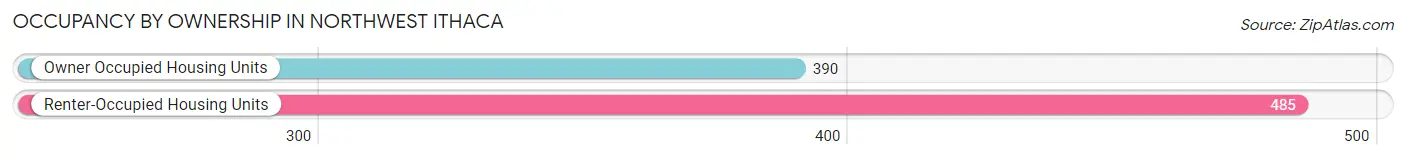
| Occupancy | # Housing Units | % Housing Units |
| Owner Occupied Housing Units | 390 | 44.6% |
| Renter-Occupied Housing Units | 485 | 55.4% |
| Total Occupied Housing Units | 875 | 100.0% |
Occupancy by Household Size in Northwest Ithaca
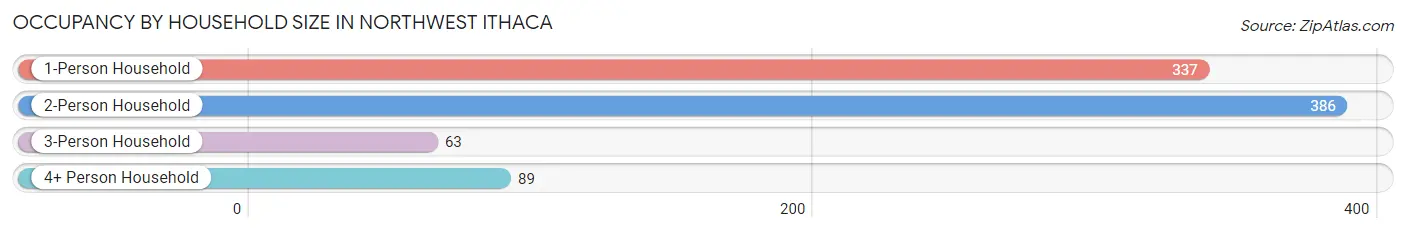
| Household Size | # Housing Units | % Housing Units |
| 1-Person Household | 337 | 38.5% |
| 2-Person Household | 386 | 44.1% |
| 3-Person Household | 63 | 7.2% |
| 4+ Person Household | 89 | 10.2% |
| Total Housing Units | 875 | 100.0% |
Occupancy by Ownership by Household Size in Northwest Ithaca
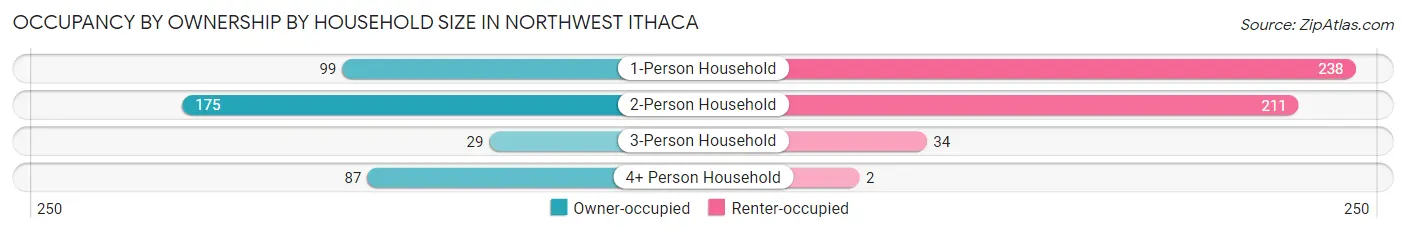
| Household Size | Owner-occupied | Renter-occupied |
| 1-Person Household | 99 (29.4%) | 238 (70.6%) |
| 2-Person Household | 175 (45.3%) | 211 (54.7%) |
| 3-Person Household | 29 (46.0%) | 34 (54.0%) |
| 4+ Person Household | 87 (97.8%) | 2 (2.2%) |
| Total Housing Units | 390 (44.6%) | 485 (55.4%) |
Occupancy by Educational Attainment in Northwest Ithaca
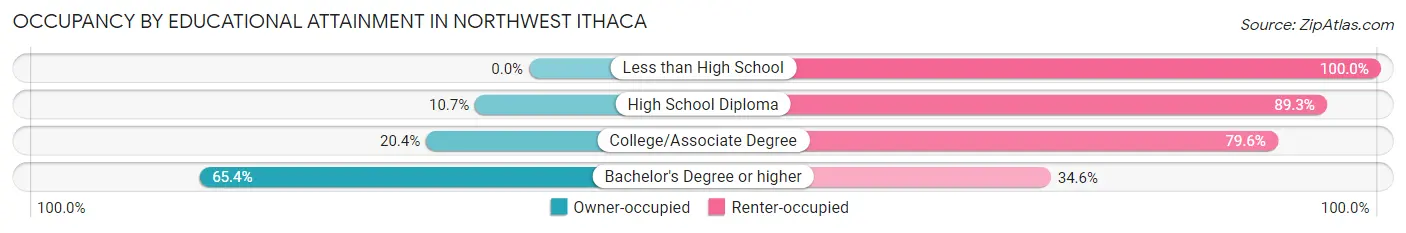
| Household Size | Owner-occupied | Renter-occupied |
| Less than High School | 0 (0.0%) | 34 (100.0%) |
| High School Diploma | 14 (10.7%) | 117 (89.3%) |
| College/Associate Degree | 40 (20.4%) | 156 (79.6%) |
| Bachelor's Degree or higher | 336 (65.4%) | 178 (34.6%) |
Occupancy by Age of Householder in Northwest Ithaca
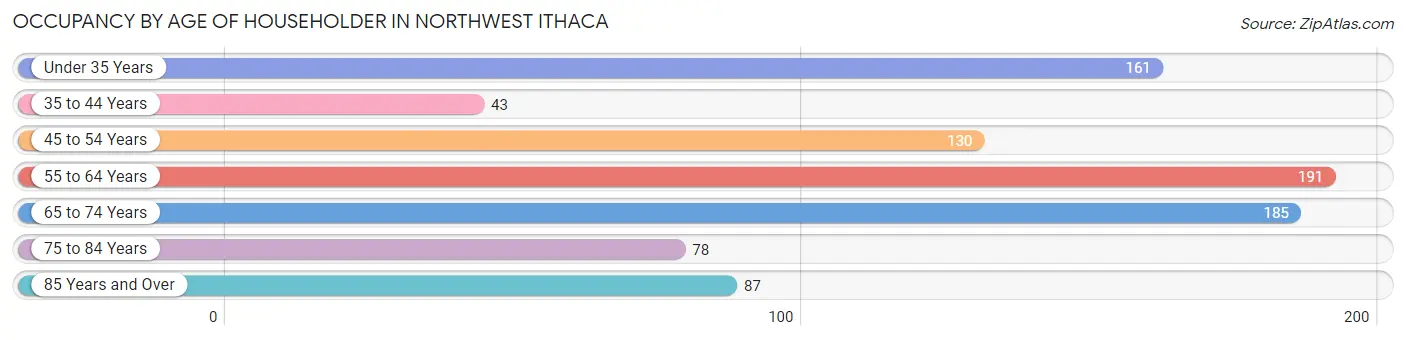
| Age Bracket | # Households | % Households |
| Under 35 Years | 161 | 18.4% |
| 35 to 44 Years | 43 | 4.9% |
| 45 to 54 Years | 130 | 14.9% |
| 55 to 64 Years | 191 | 21.8% |
| 65 to 74 Years | 185 | 21.1% |
| 75 to 84 Years | 78 | 8.9% |
| 85 Years and Over | 87 | 9.9% |
| Total | 875 | 100.0% |
Housing Finances in Northwest Ithaca
Median Income by Occupancy in Northwest Ithaca
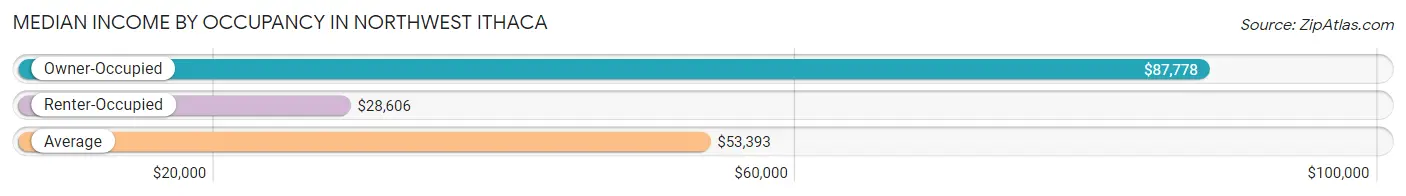
| Occupancy Type | # Households | Median Income |
| Owner-Occupied | 390 (44.6%) | $87,778 |
| Renter-Occupied | 485 (55.4%) | $28,606 |
| Average | 875 (100.0%) | $53,393 |
Occupancy by Householder Income Bracket in Northwest Ithaca
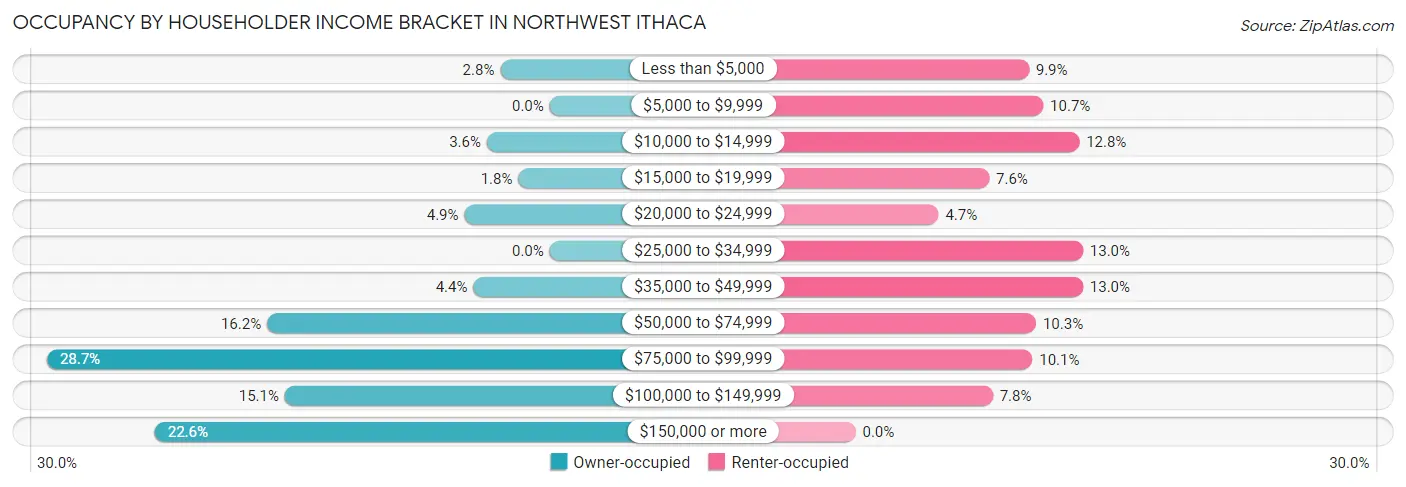
| Income Bracket | Owner-occupied | Renter-occupied |
| Less than $5,000 | 11 (2.8%) | 48 (9.9%) |
| $5,000 to $9,999 | 0 (0.0%) | 52 (10.7%) |
| $10,000 to $14,999 | 14 (3.6%) | 62 (12.8%) |
| $15,000 to $19,999 | 7 (1.8%) | 37 (7.6%) |
| $20,000 to $24,999 | 19 (4.9%) | 23 (4.7%) |
| $25,000 to $34,999 | 0 (0.0%) | 63 (13.0%) |
| $35,000 to $49,999 | 17 (4.4%) | 63 (13.0%) |
| $50,000 to $74,999 | 63 (16.2%) | 50 (10.3%) |
| $75,000 to $99,999 | 112 (28.7%) | 49 (10.1%) |
| $100,000 to $149,999 | 59 (15.1%) | 38 (7.8%) |
| $150,000 or more | 88 (22.6%) | 0 (0.0%) |
| Total | 390 (100.0%) | 485 (100.0%) |
Monthly Housing Cost Tiers in Northwest Ithaca
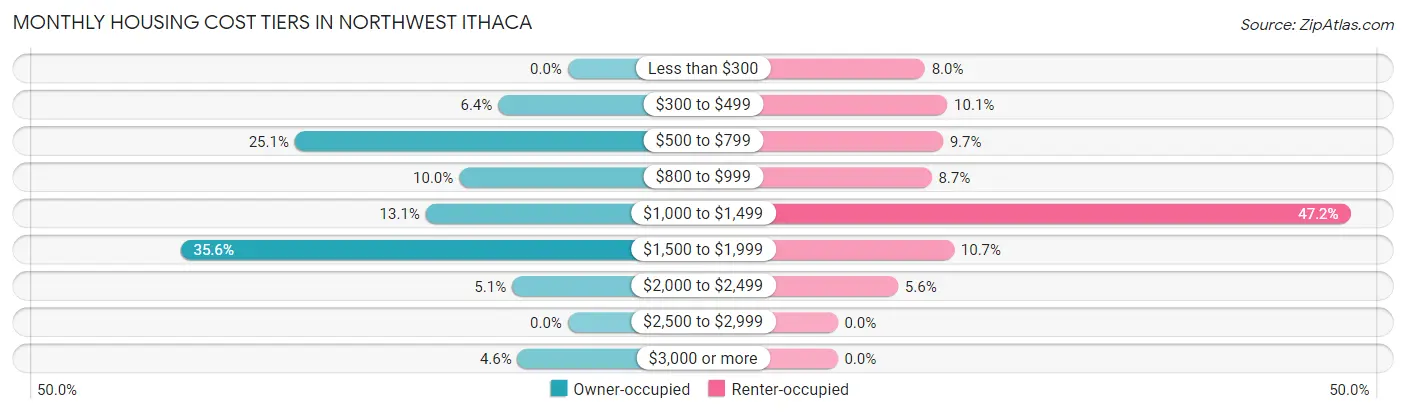
| Monthly Cost | Owner-occupied | Renter-occupied |
| Less than $300 | 0 (0.0%) | 39 (8.0%) |
| $300 to $499 | 25 (6.4%) | 49 (10.1%) |
| $500 to $799 | 98 (25.1%) | 47 (9.7%) |
| $800 to $999 | 39 (10.0%) | 42 (8.7%) |
| $1,000 to $1,499 | 51 (13.1%) | 229 (47.2%) |
| $1,500 to $1,999 | 139 (35.6%) | 52 (10.7%) |
| $2,000 to $2,499 | 20 (5.1%) | 27 (5.6%) |
| $2,500 to $2,999 | 0 (0.0%) | 0 (0.0%) |
| $3,000 or more | 18 (4.6%) | 0 (0.0%) |
| Total | 390 (100.0%) | 485 (100.0%) |
Physical Housing Characteristics in Northwest Ithaca
Housing Structures in Northwest Ithaca
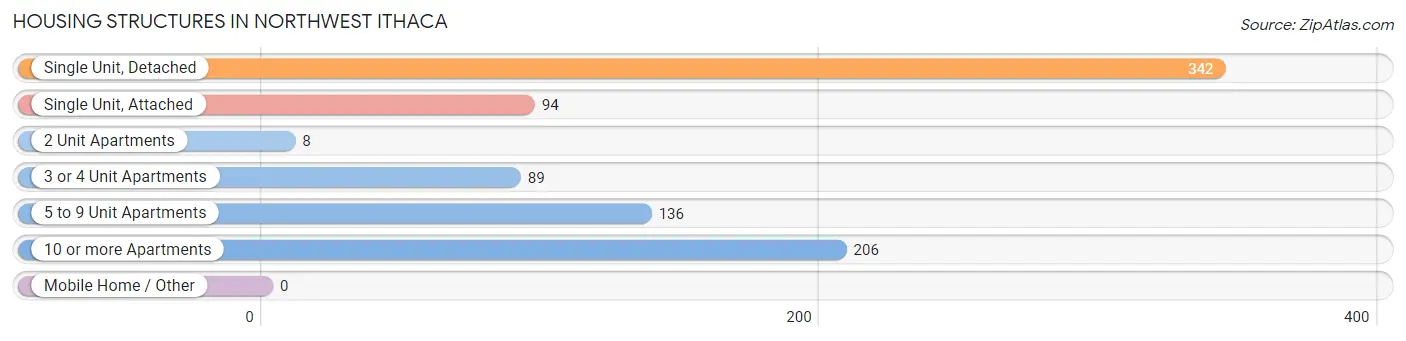
| Structure Type | # Housing Units | % Housing Units |
| Single Unit, Detached | 342 | 39.1% |
| Single Unit, Attached | 94 | 10.7% |
| 2 Unit Apartments | 8 | 0.9% |
| 3 or 4 Unit Apartments | 89 | 10.2% |
| 5 to 9 Unit Apartments | 136 | 15.5% |
| 10 or more Apartments | 206 | 23.5% |
| Mobile Home / Other | 0 | 0.0% |
| Total | 875 | 100.0% |
Housing Structures by Occupancy in Northwest Ithaca
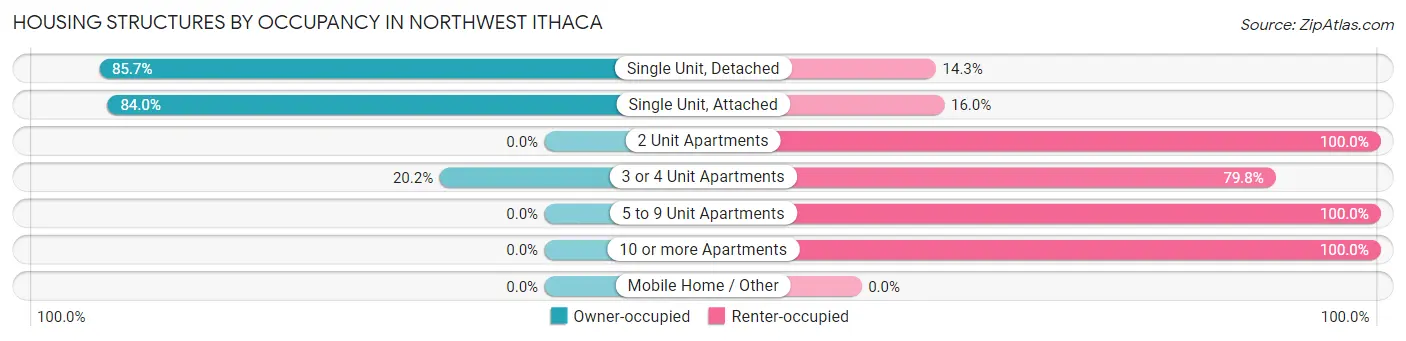
| Structure Type | Owner-occupied | Renter-occupied |
| Single Unit, Detached | 293 (85.7%) | 49 (14.3%) |
| Single Unit, Attached | 79 (84.0%) | 15 (16.0%) |
| 2 Unit Apartments | 0 (0.0%) | 8 (100.0%) |
| 3 or 4 Unit Apartments | 18 (20.2%) | 71 (79.8%) |
| 5 to 9 Unit Apartments | 0 (0.0%) | 136 (100.0%) |
| 10 or more Apartments | 0 (0.0%) | 206 (100.0%) |
| Mobile Home / Other | 0 (0.0%) | 0 (0.0%) |
| Total | 390 (44.6%) | 485 (55.4%) |
Housing Structures by Number of Rooms in Northwest Ithaca
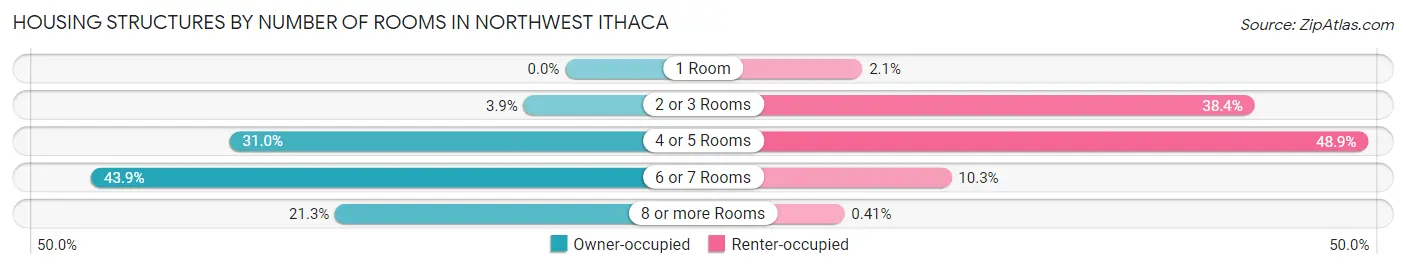
| Number of Rooms | Owner-occupied | Renter-occupied |
| 1 Room | 0 (0.0%) | 10 (2.1%) |
| 2 or 3 Rooms | 15 (3.8%) | 186 (38.4%) |
| 4 or 5 Rooms | 121 (31.0%) | 237 (48.9%) |
| 6 or 7 Rooms | 171 (43.9%) | 50 (10.3%) |
| 8 or more Rooms | 83 (21.3%) | 2 (0.4%) |
| Total | 390 (100.0%) | 485 (100.0%) |
Housing Structure by Heating Type in Northwest Ithaca
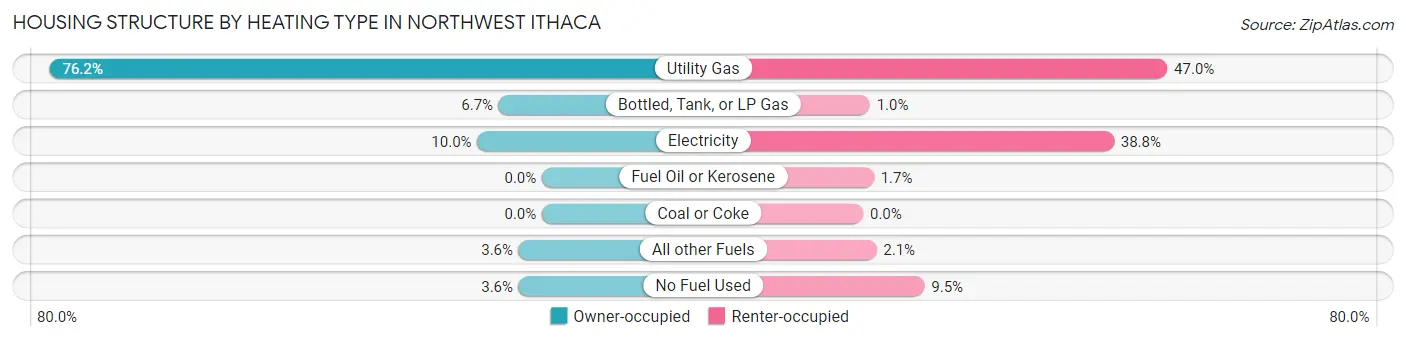
| Heating Type | Owner-occupied | Renter-occupied |
| Utility Gas | 297 (76.1%) | 228 (47.0%) |
| Bottled, Tank, or LP Gas | 26 (6.7%) | 5 (1.0%) |
| Electricity | 39 (10.0%) | 188 (38.8%) |
| Fuel Oil or Kerosene | 0 (0.0%) | 8 (1.7%) |
| Coal or Coke | 0 (0.0%) | 0 (0.0%) |
| All other Fuels | 14 (3.6%) | 10 (2.1%) |
| No Fuel Used | 14 (3.6%) | 46 (9.5%) |
| Total | 390 (100.0%) | 485 (100.0%) |
Household Vehicle Usage in Northwest Ithaca
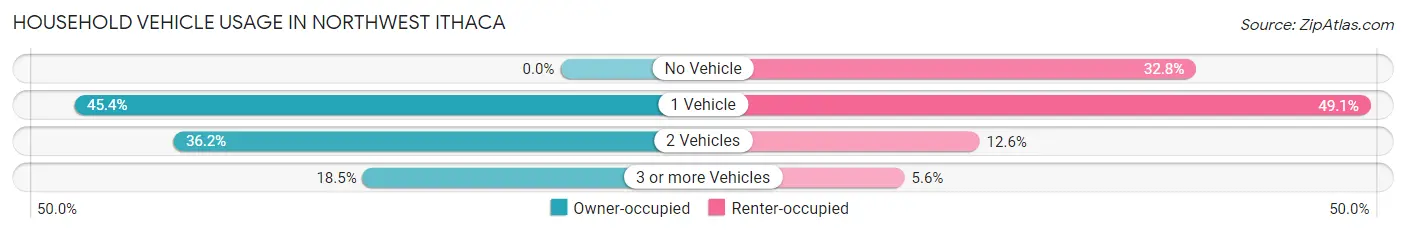
| Vehicles per Household | Owner-occupied | Renter-occupied |
| No Vehicle | 0 (0.0%) | 159 (32.8%) |
| 1 Vehicle | 177 (45.4%) | 238 (49.1%) |
| 2 Vehicles | 141 (36.1%) | 61 (12.6%) |
| 3 or more Vehicles | 72 (18.5%) | 27 (5.6%) |
| Total | 390 (100.0%) | 485 (100.0%) |
Real Estate & Mortgages in Northwest Ithaca
Real Estate and Mortgage Overview in Northwest Ithaca
| Characteristic | Without Mortgage | With Mortgage |
| Housing Units | 169 | 221 |
| Median Property Value | $255,200 | $273,000 |
| Median Household Income | $61,250 | $70 |
| Monthly Housing Costs | $750 | $18 |
| Real Estate Taxes | $4,776 | $0 |
Property Value by Mortgage Status in Northwest Ithaca
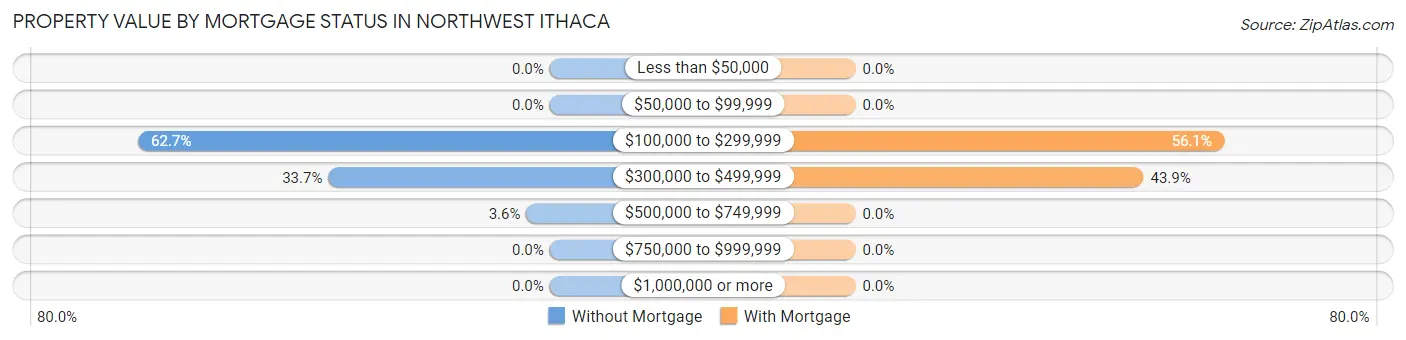
| Property Value | Without Mortgage | With Mortgage |
| Less than $50,000 | 0 (0.0%) | 0 (0.0%) |
| $50,000 to $99,999 | 0 (0.0%) | 0 (0.0%) |
| $100,000 to $299,999 | 106 (62.7%) | 124 (56.1%) |
| $300,000 to $499,999 | 57 (33.7%) | 97 (43.9%) |
| $500,000 to $749,999 | 6 (3.5%) | 0 (0.0%) |
| $750,000 to $999,999 | 0 (0.0%) | 0 (0.0%) |
| $1,000,000 or more | 0 (0.0%) | 0 (0.0%) |
| Total | 169 (100.0%) | 221 (100.0%) |
Household Income by Mortgage Status in Northwest Ithaca
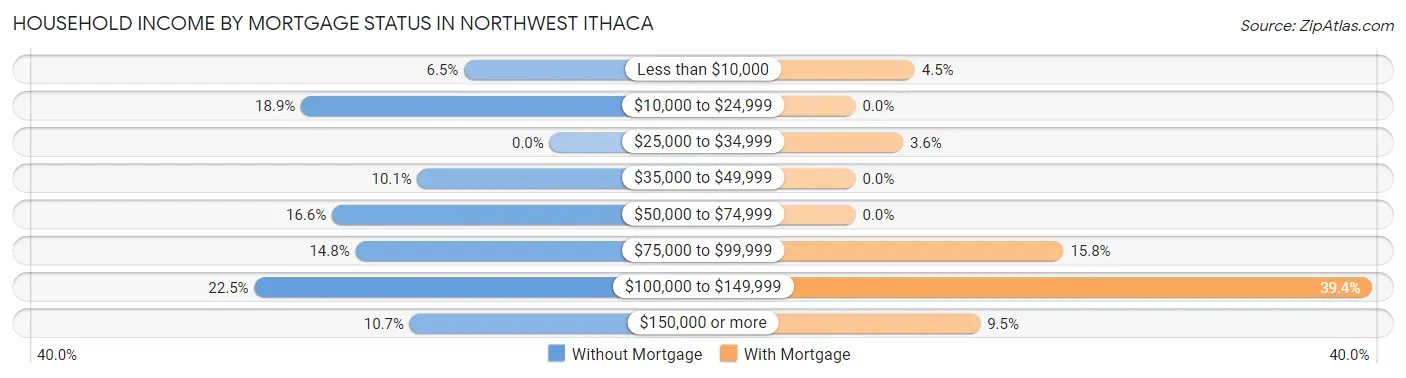
| Household Income | Without Mortgage | With Mortgage |
| Less than $10,000 | 11 (6.5%) | 10 (4.5%) |
| $10,000 to $24,999 | 32 (18.9%) | 0 (0.0%) |
| $25,000 to $34,999 | 0 (0.0%) | 8 (3.6%) |
| $35,000 to $49,999 | 17 (10.1%) | 0 (0.0%) |
| $50,000 to $74,999 | 28 (16.6%) | 0 (0.0%) |
| $75,000 to $99,999 | 25 (14.8%) | 35 (15.8%) |
| $100,000 to $149,999 | 38 (22.5%) | 87 (39.4%) |
| $150,000 or more | 18 (10.6%) | 21 (9.5%) |
| Total | 169 (100.0%) | 221 (100.0%) |
Property Value to Household Income Ratio in Northwest Ithaca
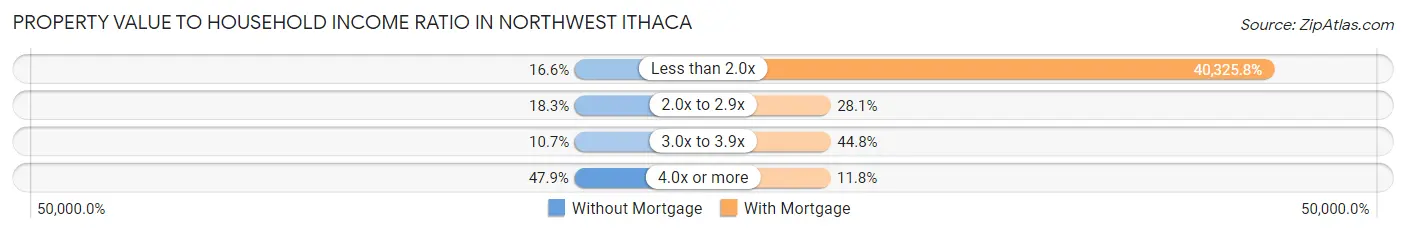
| Value-to-Income Ratio | Without Mortgage | With Mortgage |
| Less than 2.0x | 28 (16.6%) | 89,120 (40,325.8%) |
| 2.0x to 2.9x | 31 (18.3%) | 62 (28.1%) |
| 3.0x to 3.9x | 18 (10.6%) | 99 (44.8%) |
| 4.0x or more | 81 (47.9%) | 26 (11.8%) |
| Total | 169 (100.0%) | 221 (100.0%) |
Real Estate Taxes by Mortgage Status in Northwest Ithaca
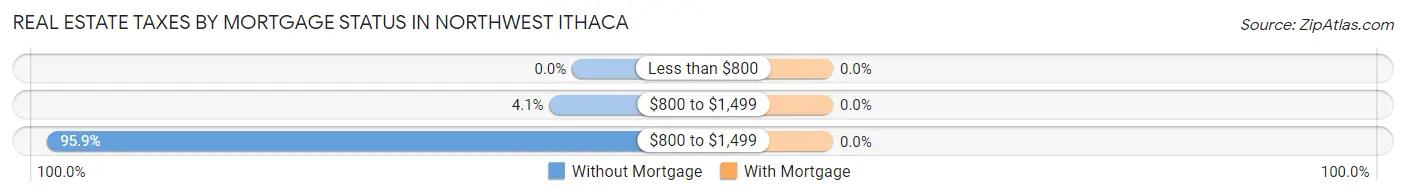
| Property Taxes | Without Mortgage | With Mortgage |
| Less than $800 | 0 (0.0%) | 0 (0.0%) |
| $800 to $1,499 | 7 (4.1%) | 0 (0.0%) |
| $800 to $1,499 | 162 (95.9%) | 0 (0.0%) |
| Total | 169 (100.0%) | 221 (100.0%) |
Health & Disability in Northwest Ithaca
Health Insurance Coverage by Age in Northwest Ithaca
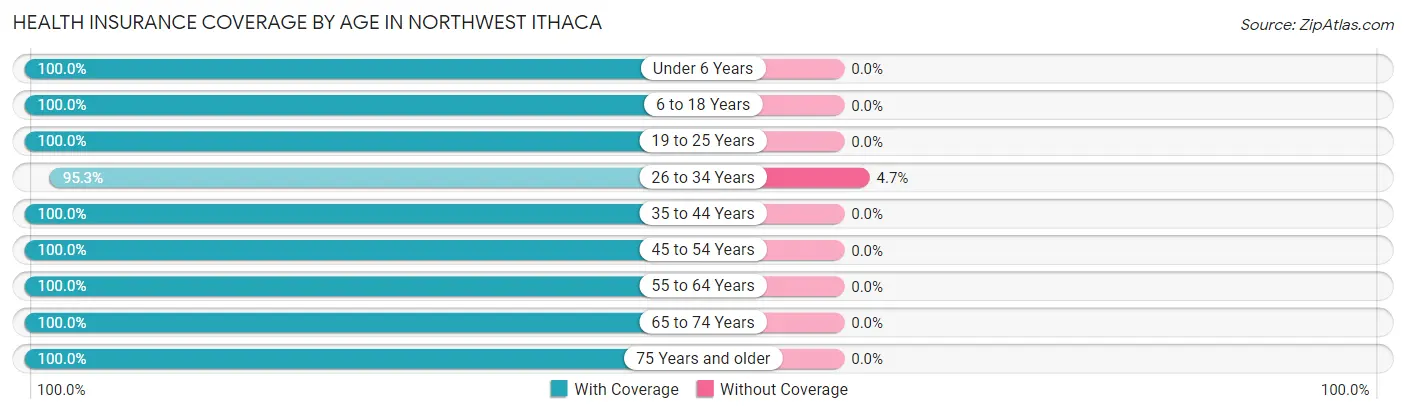
| Age Bracket | With Coverage | Without Coverage |
| Under 6 Years | 98 (100.0%) | 0 (0.0%) |
| 6 to 18 Years | 237 (100.0%) | 0 (0.0%) |
| 19 to 25 Years | 24 (100.0%) | 0 (0.0%) |
| 26 to 34 Years | 242 (95.3%) | 12 (4.7%) |
| 35 to 44 Years | 114 (100.0%) | 0 (0.0%) |
| 45 to 54 Years | 192 (100.0%) | 0 (0.0%) |
| 55 to 64 Years | 278 (100.0%) | 0 (0.0%) |
| 65 to 74 Years | 279 (100.0%) | 0 (0.0%) |
| 75 Years and older | 195 (100.0%) | 0 (0.0%) |
| Total | 1,659 (99.3%) | 12 (0.7%) |
Health Insurance Coverage by Citizenship Status in Northwest Ithaca
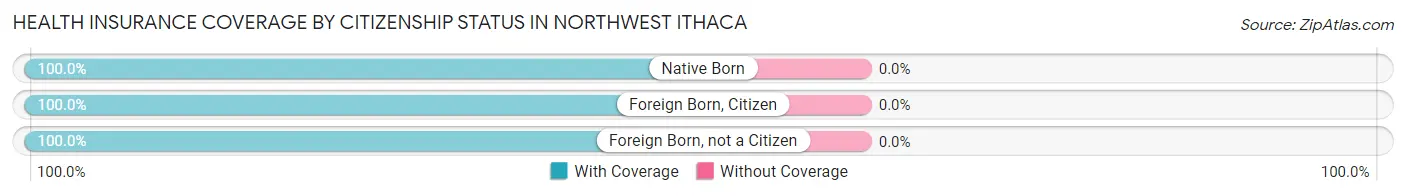
| Citizenship Status | With Coverage | Without Coverage |
| Native Born | 98 (100.0%) | 0 (0.0%) |
| Foreign Born, Citizen | 237 (100.0%) | 0 (0.0%) |
| Foreign Born, not a Citizen | 24 (100.0%) | 0 (0.0%) |
Health Insurance Coverage by Household Income in Northwest Ithaca
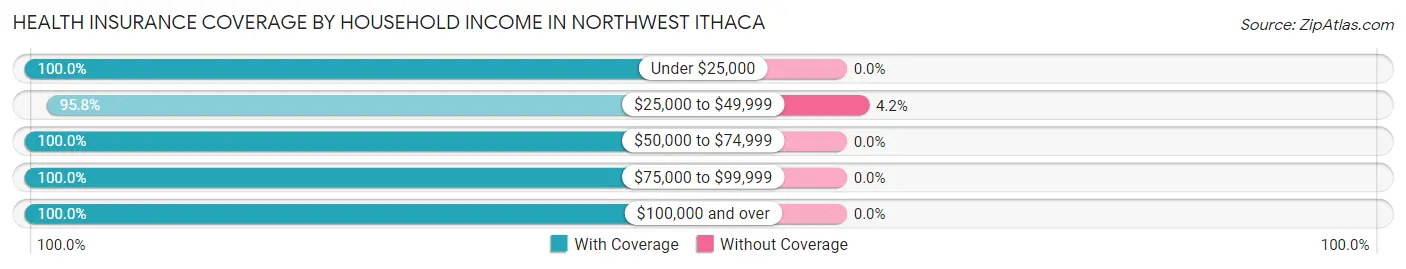
| Household Income | With Coverage | Without Coverage |
| Under $25,000 | 327 (100.0%) | 0 (0.0%) |
| $25,000 to $49,999 | 276 (95.8%) | 12 (4.2%) |
| $50,000 to $74,999 | 245 (100.0%) | 0 (0.0%) |
| $75,000 to $99,999 | 354 (100.0%) | 0 (0.0%) |
| $100,000 and over | 457 (100.0%) | 0 (0.0%) |
Public vs Private Health Insurance Coverage by Age in Northwest Ithaca
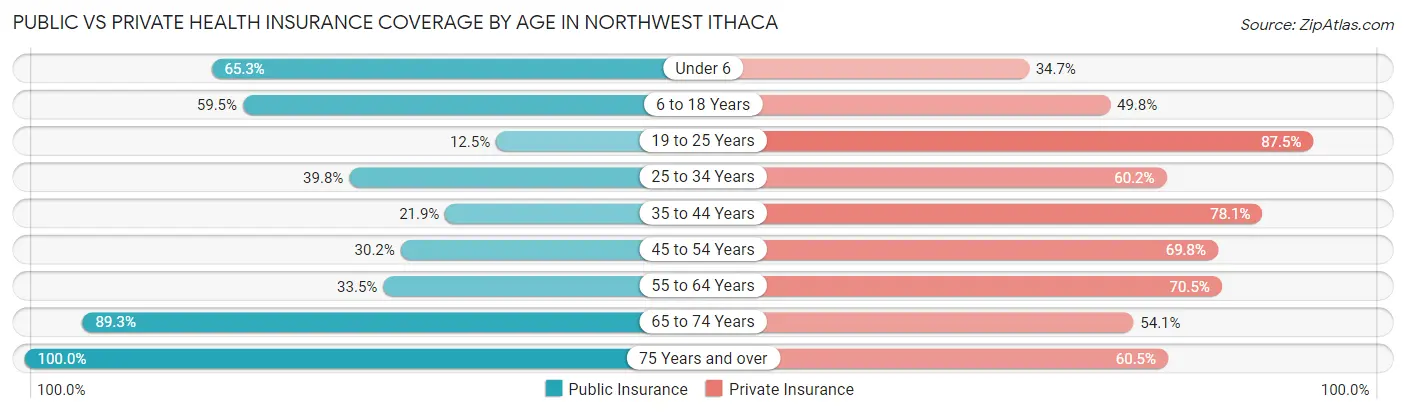
| Age Bracket | Public Insurance | Private Insurance |
| Under 6 | 64 (65.3%) | 34 (34.7%) |
| 6 to 18 Years | 141 (59.5%) | 118 (49.8%) |
| 19 to 25 Years | 3 (12.5%) | 21 (87.5%) |
| 25 to 34 Years | 101 (39.8%) | 153 (60.2%) |
| 35 to 44 Years | 25 (21.9%) | 89 (78.1%) |
| 45 to 54 Years | 58 (30.2%) | 134 (69.8%) |
| 55 to 64 Years | 93 (33.5%) | 196 (70.5%) |
| 65 to 74 Years | 249 (89.2%) | 151 (54.1%) |
| 75 Years and over | 195 (100.0%) | 118 (60.5%) |
| Total | 929 (55.6%) | 1,014 (60.7%) |
Disability Status by Sex by Age in Northwest Ithaca
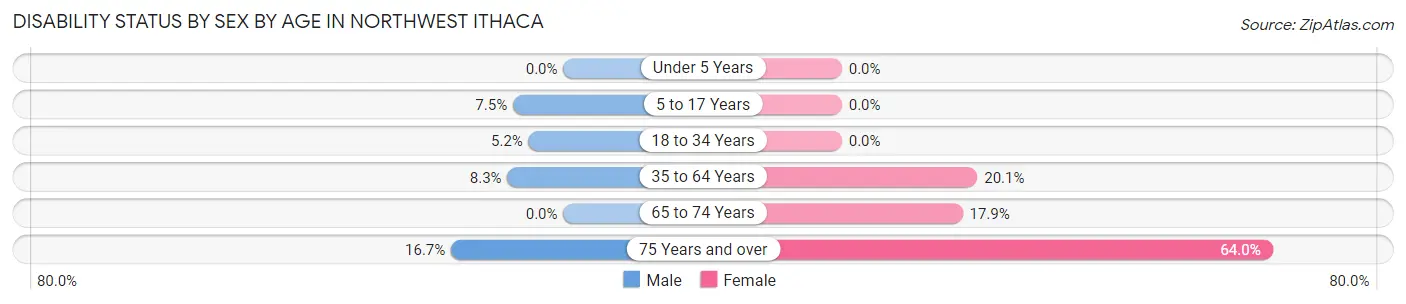
| Age Bracket | Male | Female |
| Under 5 Years | 0 (0.0%) | 0 (0.0%) |
| 5 to 17 Years | 11 (7.5%) | 0 (0.0%) |
| 18 to 34 Years | 5 (5.1%) | 0 (0.0%) |
| 35 to 64 Years | 20 (8.3%) | 69 (20.1%) |
| 65 to 74 Years | 0 (0.0%) | 33 (17.9%) |
| 75 Years and over | 8 (16.7%) | 94 (63.9%) |
Disability Class by Sex by Age in Northwest Ithaca
Disability Class: Hearing Difficulty
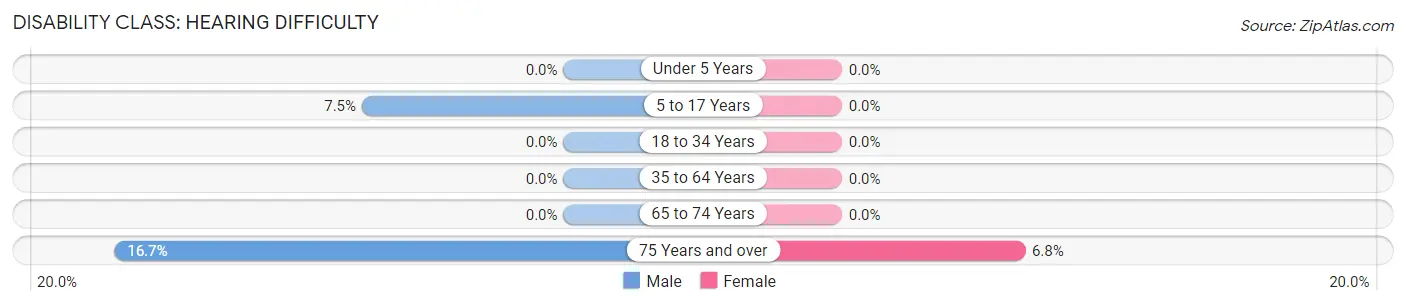
| Age Bracket | Male | Female |
| Under 5 Years | 0 (0.0%) | 0 (0.0%) |
| 5 to 17 Years | 11 (7.5%) | 0 (0.0%) |
| 18 to 34 Years | 0 (0.0%) | 0 (0.0%) |
| 35 to 64 Years | 0 (0.0%) | 0 (0.0%) |
| 65 to 74 Years | 0 (0.0%) | 0 (0.0%) |
| 75 Years and over | 8 (16.7%) | 10 (6.8%) |
Disability Class: Vision Difficulty
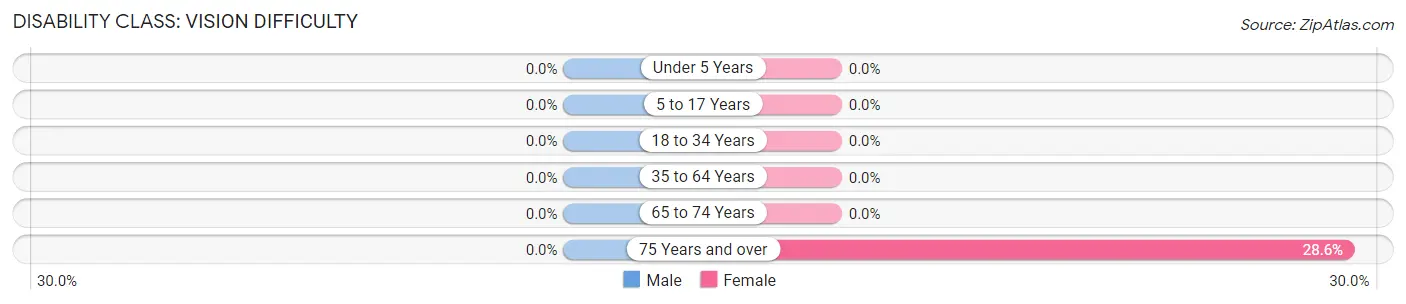
| Age Bracket | Male | Female |
| Under 5 Years | 0 (0.0%) | 0 (0.0%) |
| 5 to 17 Years | 0 (0.0%) | 0 (0.0%) |
| 18 to 34 Years | 0 (0.0%) | 0 (0.0%) |
| 35 to 64 Years | 0 (0.0%) | 0 (0.0%) |
| 65 to 74 Years | 0 (0.0%) | 0 (0.0%) |
| 75 Years and over | 0 (0.0%) | 42 (28.6%) |
Disability Class: Cognitive Difficulty
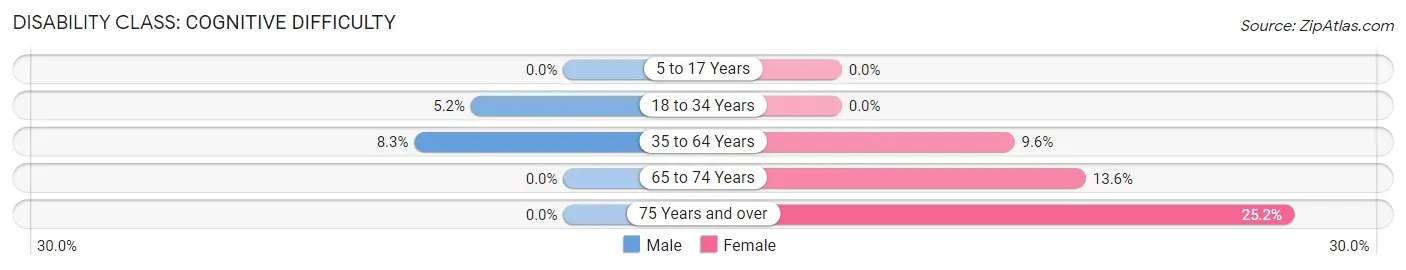
| Age Bracket | Male | Female |
| 5 to 17 Years | 0 (0.0%) | 0 (0.0%) |
| 18 to 34 Years | 5 (5.1%) | 0 (0.0%) |
| 35 to 64 Years | 20 (8.3%) | 33 (9.6%) |
| 65 to 74 Years | 0 (0.0%) | 25 (13.6%) |
| 75 Years and over | 0 (0.0%) | 37 (25.2%) |
Disability Class: Ambulatory Difficulty
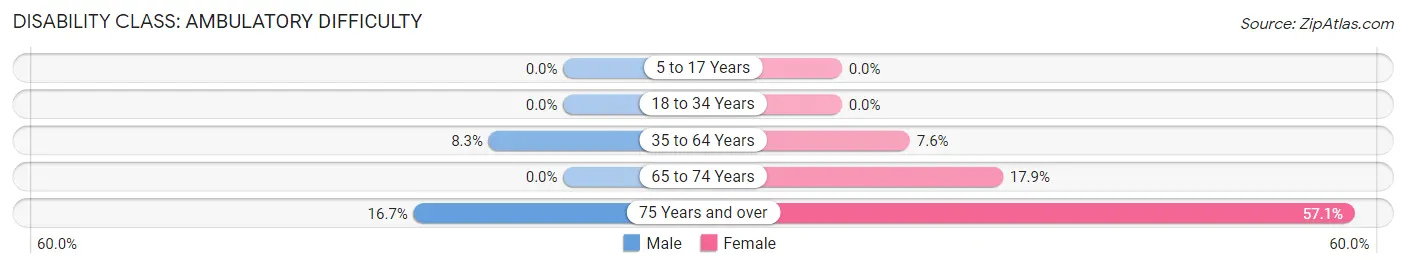
| Age Bracket | Male | Female |
| 5 to 17 Years | 0 (0.0%) | 0 (0.0%) |
| 18 to 34 Years | 0 (0.0%) | 0 (0.0%) |
| 35 to 64 Years | 20 (8.3%) | 26 (7.6%) |
| 65 to 74 Years | 0 (0.0%) | 33 (17.9%) |
| 75 Years and over | 8 (16.7%) | 84 (57.1%) |
Disability Class: Self-Care Difficulty
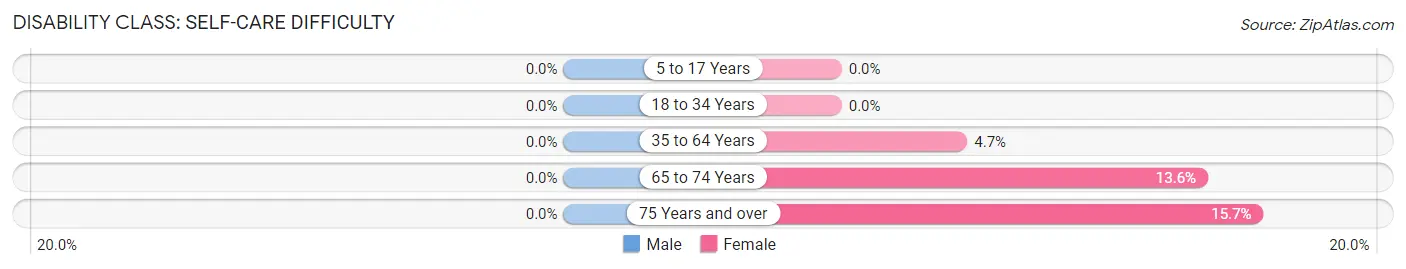
| Age Bracket | Male | Female |
| 5 to 17 Years | 0 (0.0%) | 0 (0.0%) |
| 18 to 34 Years | 0 (0.0%) | 0 (0.0%) |
| 35 to 64 Years | 0 (0.0%) | 16 (4.7%) |
| 65 to 74 Years | 0 (0.0%) | 25 (13.6%) |
| 75 Years and over | 0 (0.0%) | 23 (15.7%) |
Technology Access in Northwest Ithaca
Computing Device Access in Northwest Ithaca
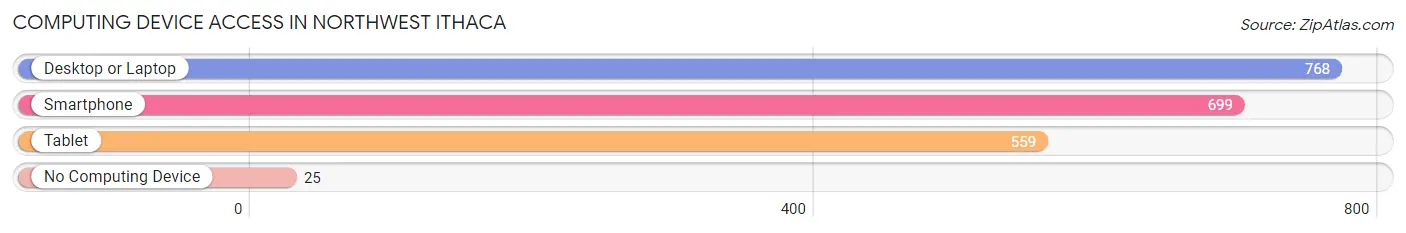
| Device Type | # Households | % Households |
| Desktop or Laptop | 768 | 87.8% |
| Smartphone | 699 | 79.9% |
| Tablet | 559 | 63.9% |
| No Computing Device | 25 | 2.9% |
| Total | 875 | 100.0% |
Internet Access in Northwest Ithaca
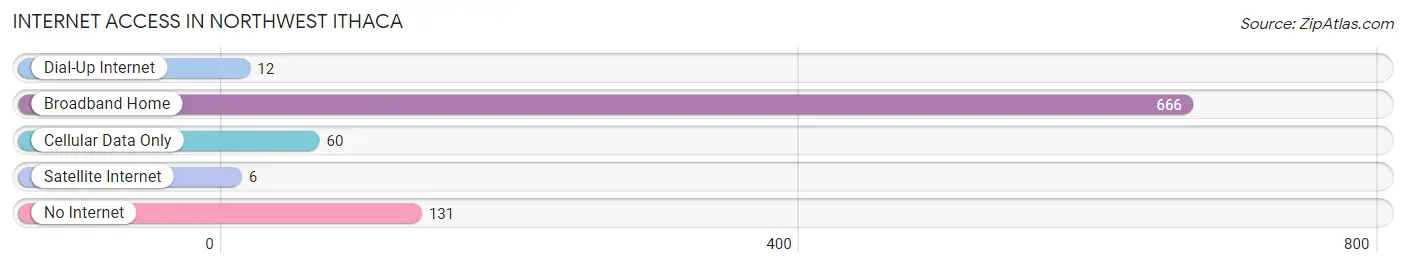
| Internet Type | # Households | % Households |
| Dial-Up Internet | 12 | 1.4% |
| Broadband Home | 666 | 76.1% |
| Cellular Data Only | 60 | 6.9% |
| Satellite Internet | 6 | 0.7% |
| No Internet | 131 | 15.0% |
| Total | 875 | 100.0% |
Northwest Ithaca Summary
Northwest Ithaca, NY is a small city located in the Finger Lakes region of New York State. It is situated on the northern shore of Cayuga Lake, the largest of the Finger Lakes. The city is home to Cornell University, Ithaca College, and Tompkins Cortland Community College. It is also home to a vibrant arts and culture scene, with numerous galleries, theaters, and music venues.
History
The area that is now Northwest Ithaca was originally inhabited by the Cayuga Nation, a member of the Iroquois Confederacy. The first European settlers arrived in the area in the late 1700s, and the city was officially incorporated in 1817. In the 19th century, the city became a center for education, with the founding of Cornell University in 1865. The city also became a hub for industry, with the opening of the Ithaca Gun Company in 1880.
Geography
Northwest Ithaca is located in the Finger Lakes region of New York State. It is situated on the northern shore of Cayuga Lake, the largest of the Finger Lakes. The city is bordered by the towns of Lansing to the north, Dryden to the east, and Danby to the south. The city is located at an elevation of approximately 400 feet above sea level.
Economy
Northwest Ithaca is home to a diverse economy. The city is a major center for education, with Cornell University, Ithaca College, and Tompkins Cortland Community College all located in the city. The city is also home to a number of technology companies, including IBM, Microsoft, and Google. The city is also home to a number of manufacturing companies, including the Ithaca Gun Company and the Ithaca Brewing Company.
Demographics
As of the 2010 census, the population of Northwest Ithaca was 30,014. The racial makeup of the city was 79.2% White, 8.3% African American, 0.3% Native American, 8.2% Asian, 0.1% Pacific Islander, and 3.9% from other races. The median household income was $37,837, and the median family income was $50,919. The per capita income was $25,945. The city has a poverty rate of 22.3%.
Conclusion
Northwest Ithaca, NY is a small city located in the Finger Lakes region of New York State. It is situated on the northern shore of Cayuga Lake, the largest of the Finger Lakes. The city is home to a diverse economy, with a major focus on education, technology, and manufacturing. The population of the city is 30,014, with a median household income of $37,837 and a poverty rate of 22.3%. The city is home to a vibrant arts and culture scene, with numerous galleries, theaters, and music venues.
Common Questions
What is Per Capita Income in Northwest Ithaca?
Per Capita income in Northwest Ithaca is $33,831.
What is the Median Family Income in Northwest Ithaca?
Median Family Income in Northwest Ithaca is $68,684.
What is the Median Household income in Northwest Ithaca?
Median Household Income in Northwest Ithaca is $53,393.
What is Income or Wage Gap in Northwest Ithaca?
Income or Wage Gap in Northwest Ithaca is 20.3%.
Women in Northwest Ithaca earn 79.7 cents for every dollar earned by a man.
What is Inequality or Gini Index in Northwest Ithaca?
Inequality or Gini Index in Northwest Ithaca is 0.48.
What is the Total Population of Northwest Ithaca?
Total Population of Northwest Ithaca is 1,796.
What is the Total Male Population of Northwest Ithaca?
Total Male Population of Northwest Ithaca is 716.
What is the Total Female Population of Northwest Ithaca?
Total Female Population of Northwest Ithaca is 1,080.
What is the Ratio of Males per 100 Females in Northwest Ithaca?
There are 66.30 Males per 100 Females in Northwest Ithaca.
What is the Ratio of Females per 100 Males in Northwest Ithaca?
There are 150.84 Females per 100 Males in Northwest Ithaca.
What is the Median Population Age in Northwest Ithaca?
Median Population Age in Northwest Ithaca is 54.1 Years.
What is the Average Family Size in Northwest Ithaca
Average Family Size in Northwest Ithaca is 2.4 People.
What is the Average Household Size in Northwest Ithaca
Average Household Size in Northwest Ithaca is 1.9 People.
How Large is the Labor Force in Northwest Ithaca?
There are 784 People in the Labor Forcein in Northwest Ithaca.
What is the Percentage of People in the Labor Force in Northwest Ithaca?
52.4% of People are in the Labor Force in Northwest Ithaca.
What is the Unemployment Rate in Northwest Ithaca?
Unemployment Rate in Northwest Ithaca is 1.7%.