South Corning, NY Map & Demographics
South Corning Map
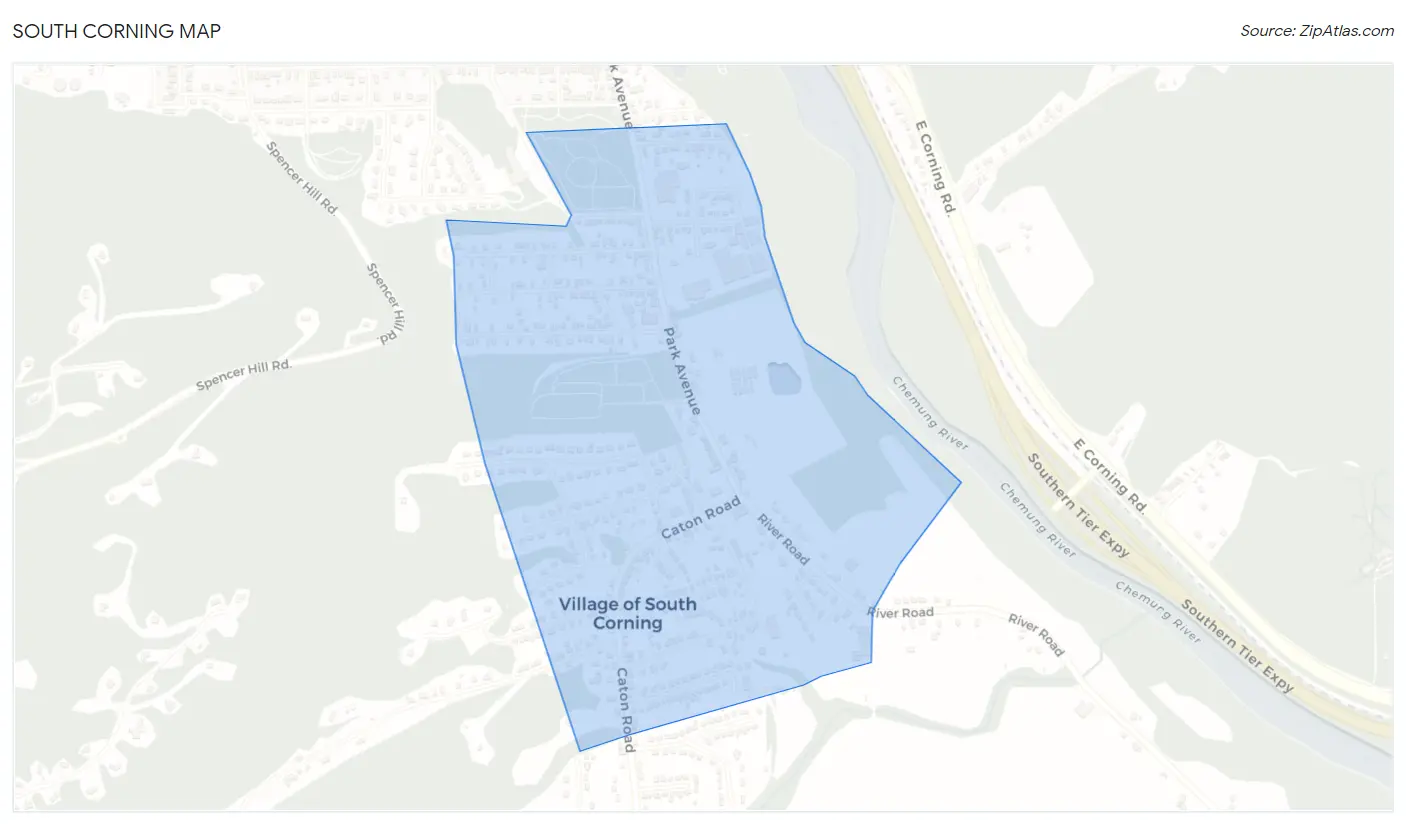
South Corning Overview
$38,684
PER CAPITA INCOME
$80,078
AVG FAMILY INCOME
$64,125
AVG HOUSEHOLD INCOME
20.4%
WAGE / INCOME GAP [ % ]
79.6¢/ $1
WAGE / INCOME GAP [ $ ]
0.43
INEQUALITY / GINI INDEX
966
TOTAL POPULATION
445
MALE POPULATION
521
FEMALE POPULATION
85.41
MALES / 100 FEMALES
117.08
FEMALES / 100 MALES
43.1
MEDIAN AGE
2.7
AVG FAMILY SIZE
2.1
AVG HOUSEHOLD SIZE
533
LABOR FORCE [ PEOPLE ]
67.6%
PERCENT IN LABOR FORCE
11.6%
UNEMPLOYMENT RATE
South Corning Area Codes
Income in South Corning
Income Overview in South Corning
Per Capita Income in South Corning is $38,684, while median incomes of families and households are $80,078 and $64,125 respectively.
| Characteristic | Number | Measure |
| Per Capita Income | 966 | $38,684 |
| Median Family Income | 267 | $80,078 |
| Mean Family Income | 267 | $91,891 |
| Median Household Income | 452 | $64,125 |
| Mean Household Income | 452 | $83,017 |
| Income Deficit | 267 | $0 |
| Wage / Income Gap (%) | 966 | 20.42% |
| Wage / Income Gap ($) | 966 | 79.58¢ per $1 |
| Gini / Inequality Index | 966 | 0.43 |
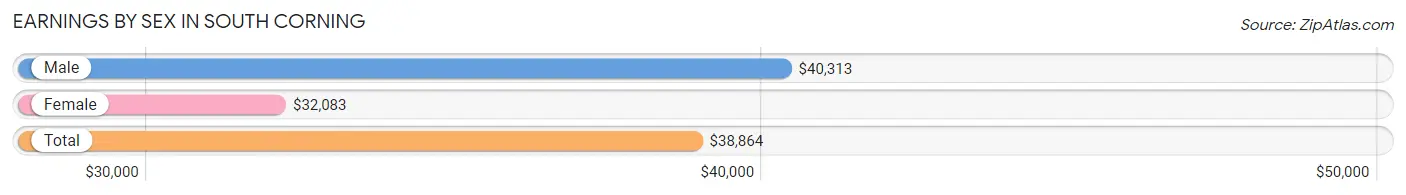
Earnings by Sex in South Corning
Average Earnings in South Corning are $38,864, $40,313 for men and $32,083 for women, a difference of 20.4%.
| Sex | Number | Average Earnings |
| Male | 290 (54.1%) | $40,313 |
| Female | 246 (45.9%) | $32,083 |
| Total | 536 (100.0%) | $38,864 |
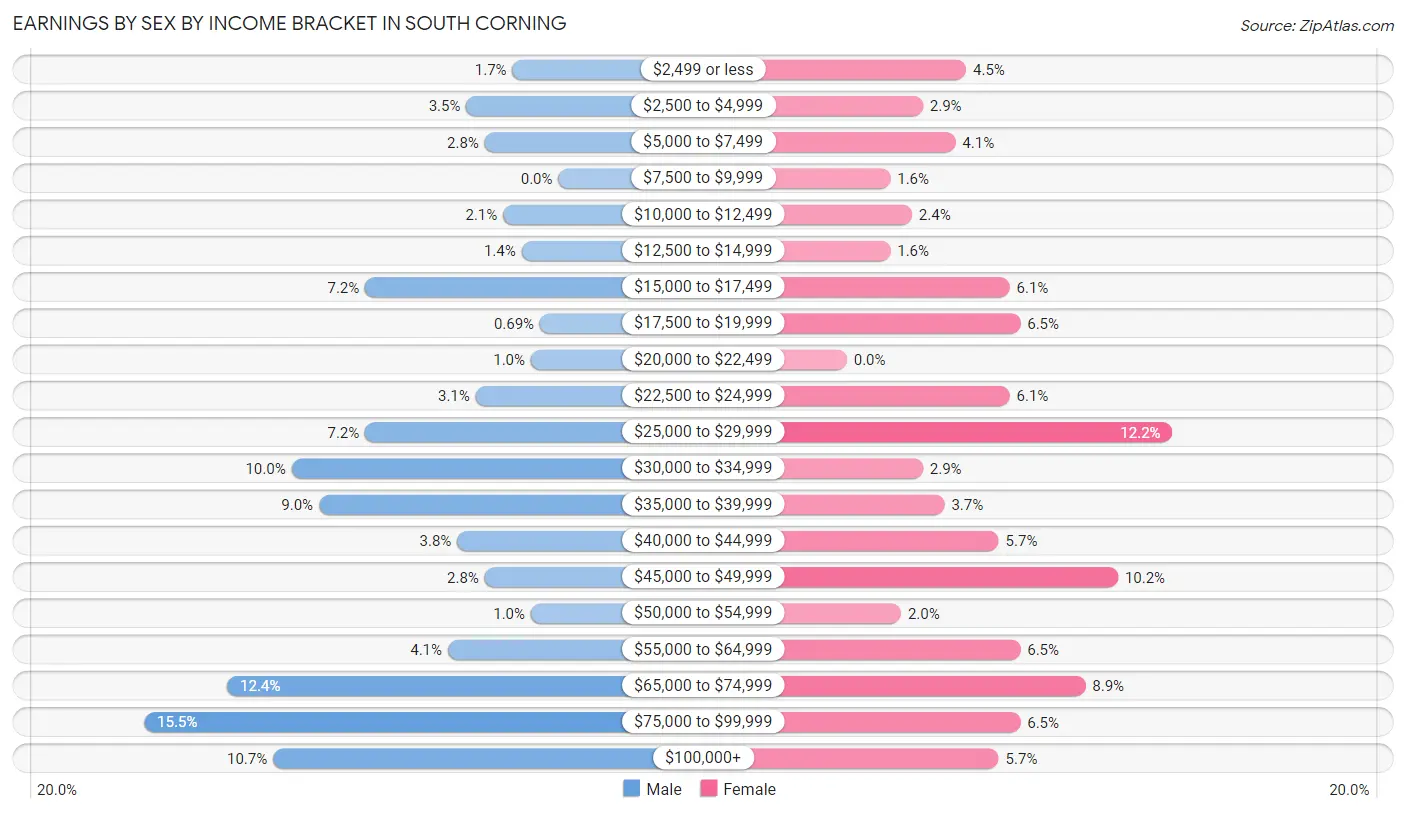
Earnings by Sex by Income Bracket in South Corning
The most common earnings brackets in South Corning are $75,000 to $99,999 for men (45 | 15.5%) and $25,000 to $29,999 for women (30 | 12.2%).
| Income | Male | Female |
| $2,499 or less | 5 (1.7%) | 11 (4.5%) |
| $2,500 to $4,999 | 10 (3.5%) | 7 (2.9%) |
| $5,000 to $7,499 | 8 (2.8%) | 10 (4.1%) |
| $7,500 to $9,999 | 0 (0.0%) | 4 (1.6%) |
| $10,000 to $12,499 | 6 (2.1%) | 6 (2.4%) |
| $12,500 to $14,999 | 4 (1.4%) | 4 (1.6%) |
| $15,000 to $17,499 | 21 (7.2%) | 15 (6.1%) |
| $17,500 to $19,999 | 2 (0.7%) | 16 (6.5%) |
| $20,000 to $22,499 | 3 (1.0%) | 0 (0.0%) |
| $22,500 to $24,999 | 9 (3.1%) | 15 (6.1%) |
| $25,000 to $29,999 | 21 (7.2%) | 30 (12.2%) |
| $30,000 to $34,999 | 29 (10.0%) | 7 (2.9%) |
| $35,000 to $39,999 | 26 (9.0%) | 9 (3.7%) |
| $40,000 to $44,999 | 11 (3.8%) | 14 (5.7%) |
| $45,000 to $49,999 | 8 (2.8%) | 25 (10.2%) |
| $50,000 to $54,999 | 3 (1.0%) | 5 (2.0%) |
| $55,000 to $64,999 | 12 (4.1%) | 16 (6.5%) |
| $65,000 to $74,999 | 36 (12.4%) | 22 (8.9%) |
| $75,000 to $99,999 | 45 (15.5%) | 16 (6.5%) |
| $100,000+ | 31 (10.7%) | 14 (5.7%) |
| Total | 290 (100.0%) | 246 (100.0%) |
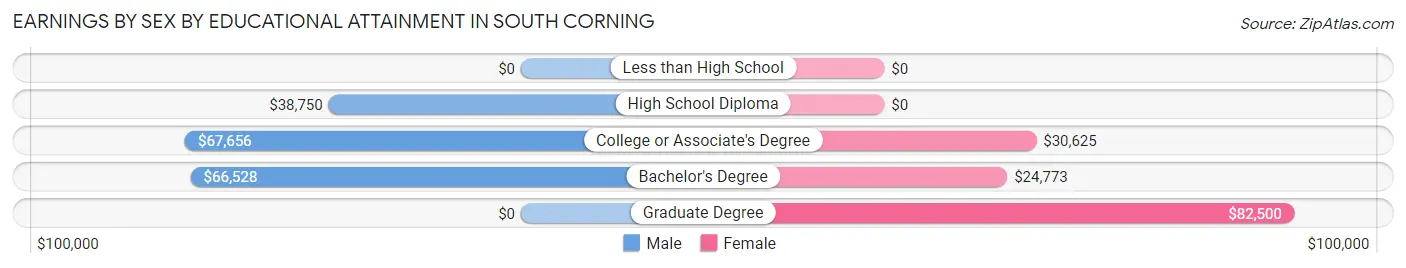
Earnings by Sex by Educational Attainment in South Corning
Average earnings in South Corning are $53,333 for men and $43,125 for women, a difference of 19.1%. Men with an educational attainment of college or associate's degree enjoy the highest average annual earnings of $67,656, while those with high school diploma education earn the least with $38,750. Women with an educational attainment of graduate degree earn the most with the average annual earnings of $82,500, while those with bachelor's degree education have the smallest earnings of $24,773.
| Educational Attainment | Male Income | Female Income |
| Less than High School | - | - |
| High School Diploma | $38,750 | $0 |
| College or Associate's Degree | $67,656 | $30,625 |
| Bachelor's Degree | $66,528 | $24,773 |
| Graduate Degree | - | - |
| Total | $53,333 | $43,125 |
Family Income in South Corning
Family Income Brackets in South Corning
According to the South Corning family income data, there are 56 families falling into the $75,000 to $99,999 income range, which is the most common income bracket and makes up 21.0% of all families.
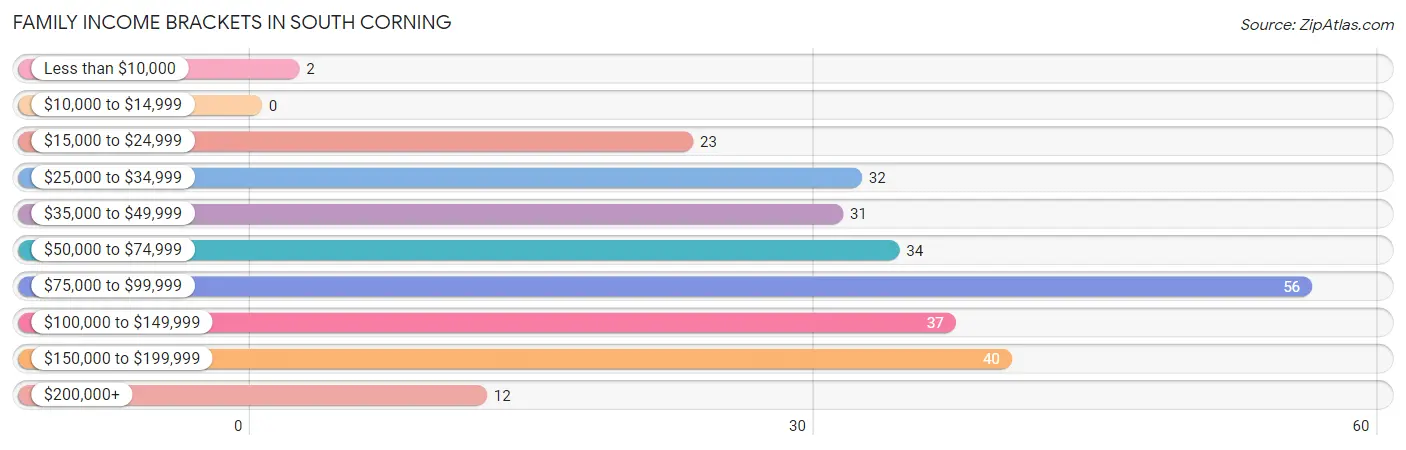
| Income Bracket | # Families | % Families |
| Less than $10,000 | 2 | 0.7% |
| $10,000 to $14,999 | 0 | 0.0% |
| $15,000 to $24,999 | 23 | 8.6% |
| $25,000 to $34,999 | 32 | 12.0% |
| $35,000 to $49,999 | 31 | 11.6% |
| $50,000 to $74,999 | 34 | 12.7% |
| $75,000 to $99,999 | 56 | 21.0% |
| $100,000 to $149,999 | 37 | 13.9% |
| $150,000 to $199,999 | 40 | 15.0% |
| $200,000+ | 12 | 4.5% |
Family Income by Famaliy Size in South Corning
3-person families (45 | 16.9%) account for the highest median family income in South Corning with $103,839 per family, while 3-person families (45 | 16.9%) have the highest median income of $34,613 per family member.
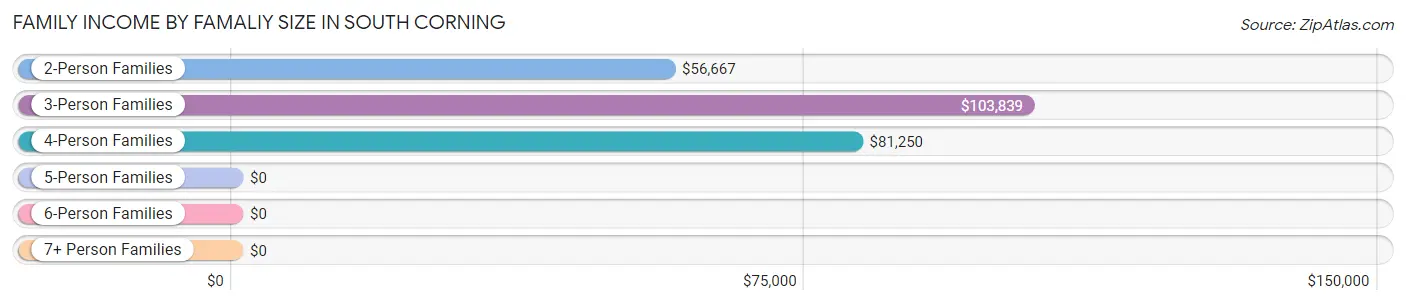
| Income Bracket | # Families | Median Income |
| 2-Person Families | 154 (57.7%) | $56,667 |
| 3-Person Families | 45 (16.9%) | $103,839 |
| 4-Person Families | 54 (20.2%) | $81,250 |
| 5-Person Families | 14 (5.2%) | $0 |
| 6-Person Families | 0 (0.0%) | $0 |
| 7+ Person Families | 0 (0.0%) | $0 |
| Total | 267 (100.0%) | $80,078 |
Family Income by Number of Earners in South Corning
The median family income in South Corning is $80,078, with families comprising 2 earners (111) having the highest median family income of $103,281, while families with 1 earner (89) have the lowest median family income of $48,750, accounting for 41.6% and 33.3% of families, respectively.
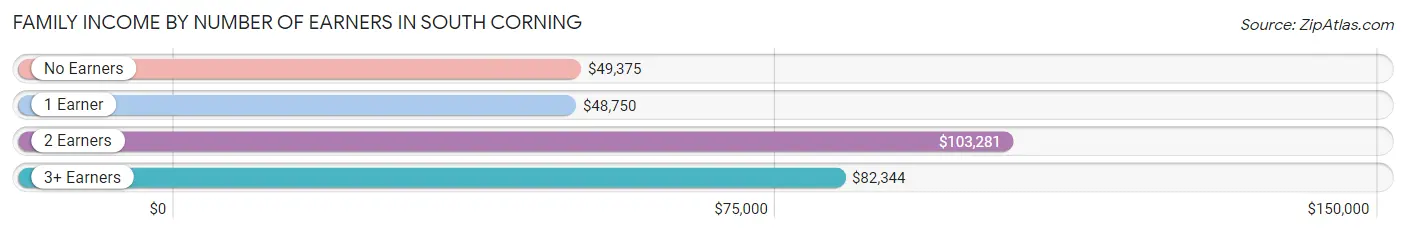
| Number of Earners | # Families | Median Income |
| No Earners | 37 (13.9%) | $49,375 |
| 1 Earner | 89 (33.3%) | $48,750 |
| 2 Earners | 111 (41.6%) | $103,281 |
| 3+ Earners | 30 (11.2%) | $82,344 |
| Total | 267 (100.0%) | $80,078 |
Household Income in South Corning
Household Income Brackets in South Corning
With 80 households falling in the category, the $50,000 to $74,999 income range is the most frequent in South Corning, accounting for 17.7% of all households. In contrast, only 4 households (0.9%) fall into the $10,000 to $14,999 income bracket, making it the least populous group.
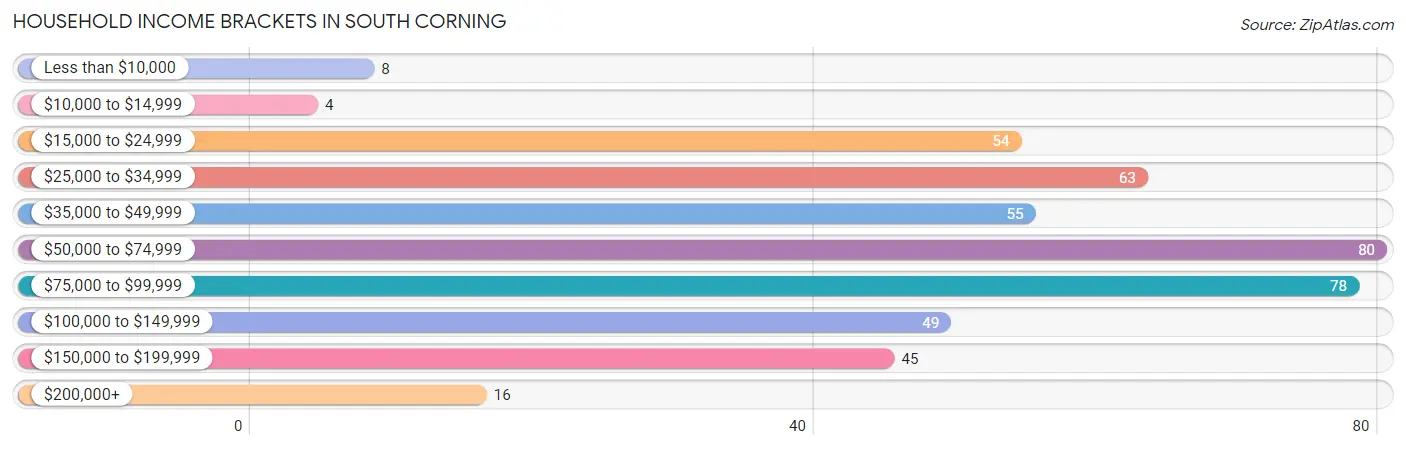
| Income Bracket | # Households | % Households |
| Less than $10,000 | 8 | 1.8% |
| $10,000 to $14,999 | 4 | 0.9% |
| $15,000 to $24,999 | 54 | 11.9% |
| $25,000 to $34,999 | 63 | 13.9% |
| $35,000 to $49,999 | 55 | 12.2% |
| $50,000 to $74,999 | 80 | 17.7% |
| $75,000 to $99,999 | 78 | 17.3% |
| $100,000 to $149,999 | 49 | 10.8% |
| $150,000 to $199,999 | 45 | 10.0% |
| $200,000+ | 16 | 3.5% |
Household Income by Householder Age in South Corning
The median household income in South Corning is $64,125, with the highest median household income of $77,000 found in the 25 to 44 years age bracket for the primary householder. A total of 122 households (27.0%) fall into this category. Meanwhile, the 15 to 24 years age bracket for the primary householder has the lowest median household income of $33,438, with 17 households (3.8%) in this group.
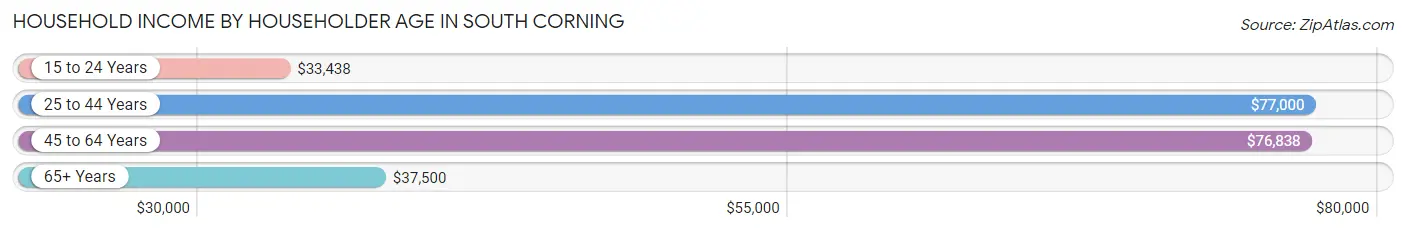
| Income Bracket | # Households | Median Income |
| 15 to 24 Years | 17 (3.8%) | $33,438 |
| 25 to 44 Years | 122 (27.0%) | $77,000 |
| 45 to 64 Years | 195 (43.1%) | $76,838 |
| 65+ Years | 118 (26.1%) | $37,500 |
| Total | 452 (100.0%) | $64,125 |
Poverty in South Corning
Income Below Poverty by Sex and Age in South Corning
With 5.4% poverty level for males and 10.6% for females among the residents of South Corning, 6 to 11 year old males and 12 to 14 year old females are the most vulnerable to poverty, with 11 males (73.3%) and 23 females (50.0%) in their respective age groups living below the poverty level.
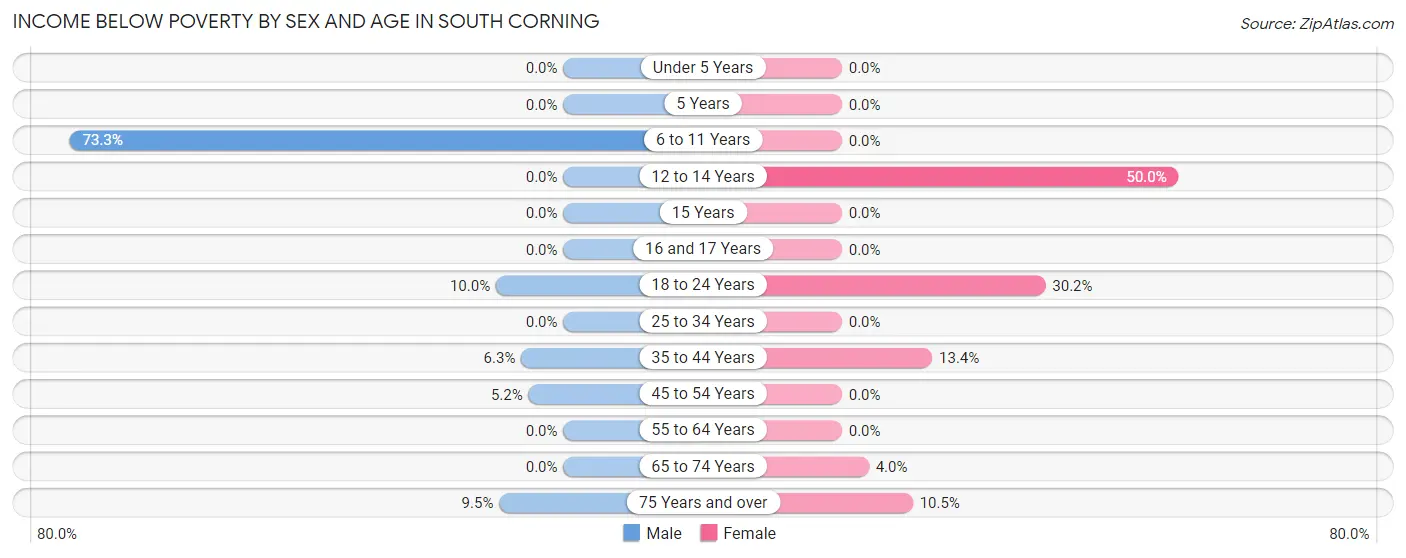
| Age Bracket | Male | Female |
| Under 5 Years | 0 (0.0%) | 0 (0.0%) |
| 5 Years | 0 (0.0%) | 0 (0.0%) |
| 6 to 11 Years | 11 (73.3%) | 0 (0.0%) |
| 12 to 14 Years | 0 (0.0%) | 23 (50.0%) |
| 15 Years | 0 (0.0%) | 0 (0.0%) |
| 16 and 17 Years | 0 (0.0%) | 0 (0.0%) |
| 18 to 24 Years | 4 (10.0%) | 13 (30.2%) |
| 25 to 34 Years | 0 (0.0%) | 0 (0.0%) |
| 35 to 44 Years | 4 (6.2%) | 11 (13.4%) |
| 45 to 54 Years | 3 (5.2%) | 0 (0.0%) |
| 55 to 64 Years | 0 (0.0%) | 0 (0.0%) |
| 65 to 74 Years | 0 (0.0%) | 2 (4.0%) |
| 75 Years and over | 2 (9.5%) | 6 (10.5%) |
| Total | 24 (5.4%) | 55 (10.6%) |
Income Above Poverty by Sex and Age in South Corning
According to the poverty statistics in South Corning, males aged under 5 years and females aged under 5 years are the age groups that are most secure financially, with 100.0% of males and 100.0% of females in these age groups living above the poverty line.
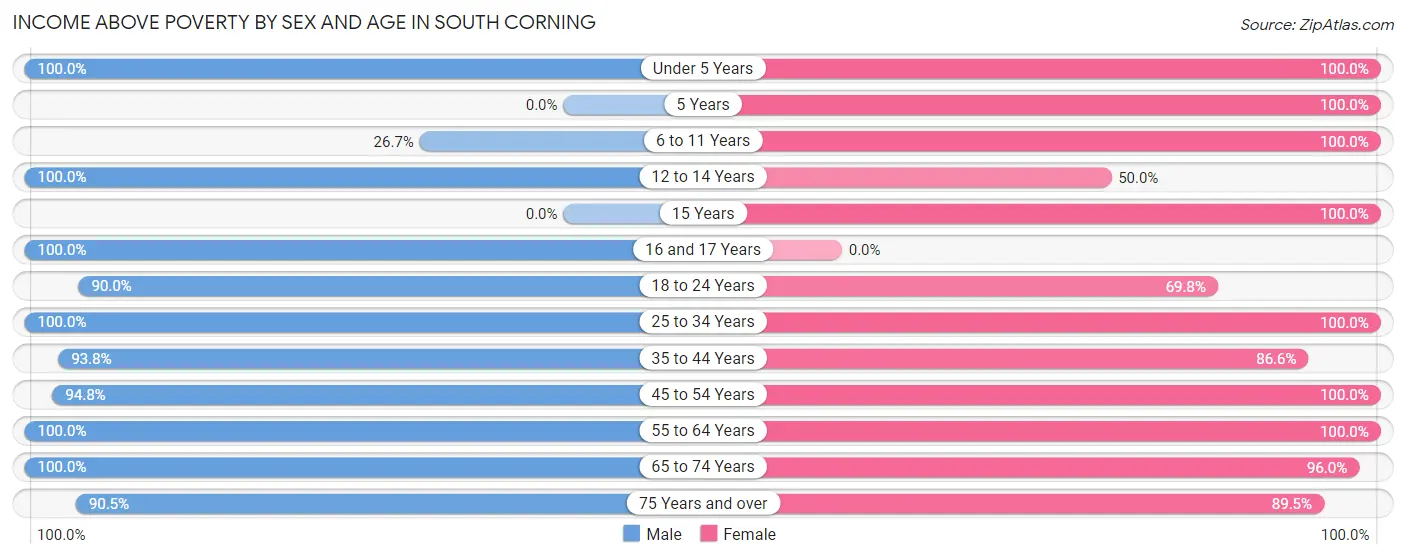
| Age Bracket | Male | Female |
| Under 5 Years | 36 (100.0%) | 25 (100.0%) |
| 5 Years | 0 (0.0%) | 2 (100.0%) |
| 6 to 11 Years | 4 (26.7%) | 35 (100.0%) |
| 12 to 14 Years | 7 (100.0%) | 23 (50.0%) |
| 15 Years | 0 (0.0%) | 11 (100.0%) |
| 16 and 17 Years | 12 (100.0%) | 0 (0.0%) |
| 18 to 24 Years | 36 (90.0%) | 30 (69.8%) |
| 25 to 34 Years | 54 (100.0%) | 57 (100.0%) |
| 35 to 44 Years | 60 (93.8%) | 71 (86.6%) |
| 45 to 54 Years | 55 (94.8%) | 42 (100.0%) |
| 55 to 64 Years | 91 (100.0%) | 71 (100.0%) |
| 65 to 74 Years | 47 (100.0%) | 48 (96.0%) |
| 75 Years and over | 19 (90.5%) | 51 (89.5%) |
| Total | 421 (94.6%) | 466 (89.4%) |
Income Below Poverty Among Married-Couple Families in South Corning
The poverty statistics for married-couple families in South Corning show that 1.0% or 2 of the total 200 families live below the poverty line. Families with no children have the highest poverty rate of 1.8%, comprising of 2 families. On the other hand, families with 1 or 2 children have the lowest poverty rate of 0.0%, which includes 0 families.
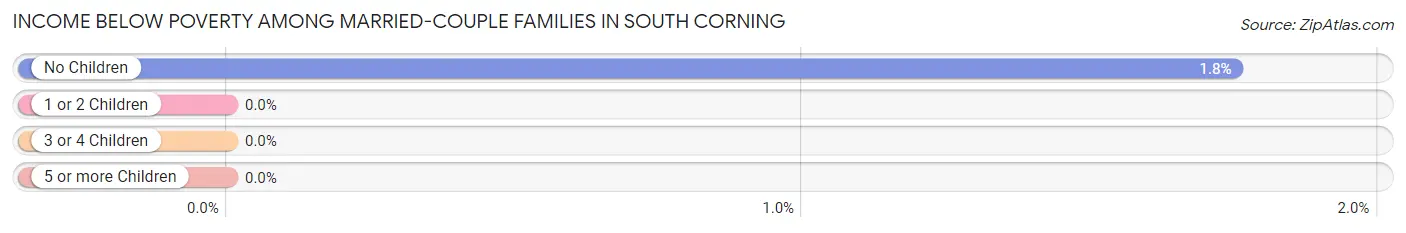
| Children | Above Poverty | Below Poverty |
| No Children | 112 (98.3%) | 2 (1.8%) |
| 1 or 2 Children | 82 (100.0%) | 0 (0.0%) |
| 3 or 4 Children | 4 (100.0%) | 0 (0.0%) |
| 5 or more Children | 0 (0.0%) | 0 (0.0%) |
| Total | 198 (99.0%) | 2 (1.0%) |
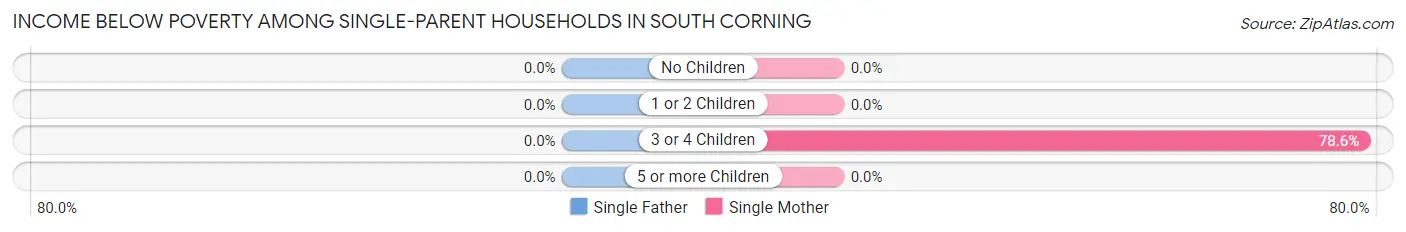
Income Below Poverty Among Single-Parent Households in South Corning
| Children | Single Father | Single Mother |
| No Children | 0 (0.0%) | 0 (0.0%) |
| 1 or 2 Children | 0 (0.0%) | 0 (0.0%) |
| 3 or 4 Children | 0 (0.0%) | 11 (78.6%) |
| 5 or more Children | 0 (0.0%) | 0 (0.0%) |
| Total | 0 (0.0%) | 11 (23.4%) |
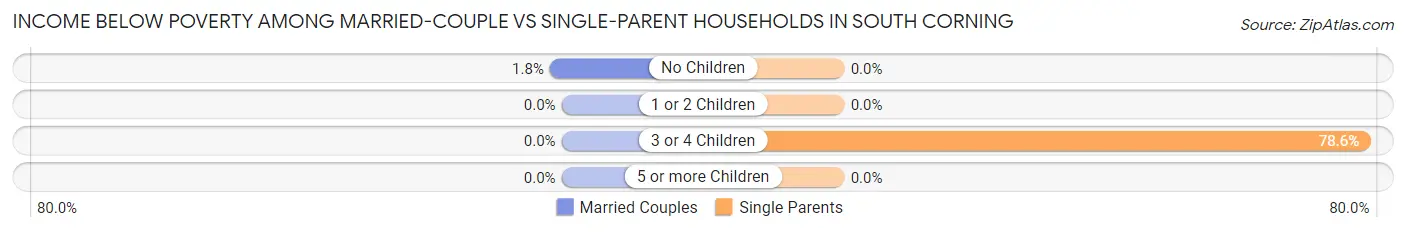
Income Below Poverty Among Married-Couple vs Single-Parent Households in South Corning
The poverty data for South Corning shows that 2 of the married-couple family households (1.0%) and 11 of the single-parent households (16.4%) are living below the poverty level. Within the married-couple family households, those with no children have the highest poverty rate, with 2 households (1.8%) falling below the poverty line. Among the single-parent households, those with 3 or 4 children have the highest poverty rate, with 11 household (78.6%) living below poverty.
| Children | Married-Couple Families | Single-Parent Households |
| No Children | 2 (1.8%) | 0 (0.0%) |
| 1 or 2 Children | 0 (0.0%) | 0 (0.0%) |
| 3 or 4 Children | 0 (0.0%) | 11 (78.6%) |
| 5 or more Children | 0 (0.0%) | 0 (0.0%) |
| Total | 2 (1.0%) | 11 (16.4%) |
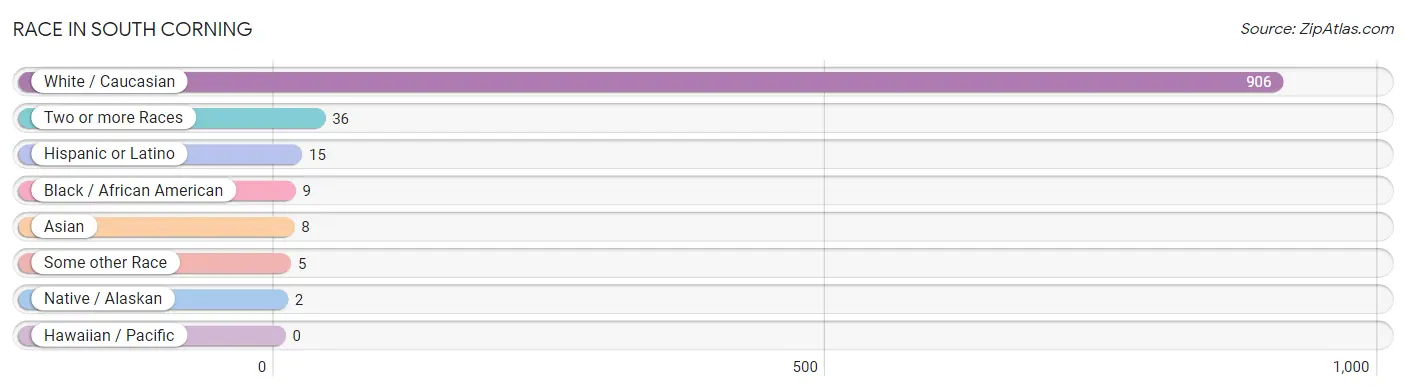
Race in South Corning
The most populous races in South Corning are White / Caucasian (906 | 93.8%), Two or more Races (36 | 3.7%), and Hispanic or Latino (15 | 1.5%).
| Race | # Population | % Population |
| Asian | 8 | 0.8% |
| Black / African American | 9 | 0.9% |
| Hawaiian / Pacific | 0 | 0.0% |
| Hispanic or Latino | 15 | 1.5% |
| Native / Alaskan | 2 | 0.2% |
| White / Caucasian | 906 | 93.8% |
| Two or more Races | 36 | 3.7% |
| Some other Race | 5 | 0.5% |
| Total | 966 | 100.0% |
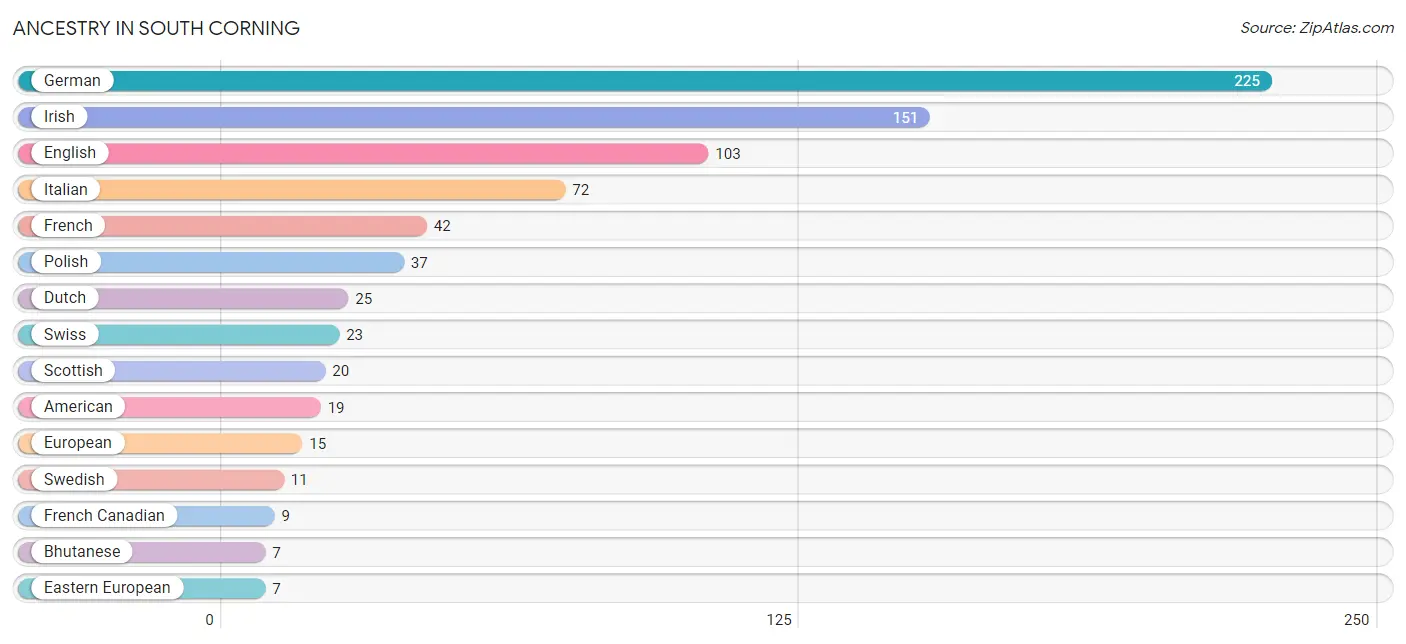
Ancestry in South Corning
The most populous ancestries reported in South Corning are German (225 | 23.3%), Irish (151 | 15.6%), English (103 | 10.7%), Italian (72 | 7.4%), and French (42 | 4.3%), together accounting for 61.4% of all South Corning residents.
| Ancestry | # Population | % Population |
| American | 19 | 2.0% |
| Bhutanese | 7 | 0.7% |
| Burmese | 2 | 0.2% |
| Czech | 2 | 0.2% |
| Dutch | 25 | 2.6% |
| Eastern European | 7 | 0.7% |
| English | 103 | 10.7% |
| European | 15 | 1.5% |
| French | 42 | 4.3% |
| French Canadian | 9 | 0.9% |
| German | 225 | 23.3% |
| German Russian | 4 | 0.4% |
| Indian (Asian) | 2 | 0.2% |
| Irish | 151 | 15.6% |
| Italian | 72 | 7.4% |
| Mexican | 6 | 0.6% |
| Pakistani | 2 | 0.2% |
| Polish | 37 | 3.8% |
| Portuguese | 2 | 0.2% |
| Puerto Rican | 6 | 0.6% |
| Scotch-Irish | 2 | 0.2% |
| Scottish | 20 | 2.1% |
| Spaniard | 3 | 0.3% |
| Sri Lankan | 6 | 0.6% |
| Swedish | 11 | 1.1% |
| Swiss | 23 | 2.4% | View All 26 Rows |
Immigrants in South Corning
The most numerous immigrant groups reported in South Corning came from Asia (13 | 1.3%), Western Asia (7 | 0.7%), Europe (5 | 0.5%), South Eastern Asia (4 | 0.4%), and Vietnam (4 | 0.4%), together accounting for 3.4% of all South Corning residents.
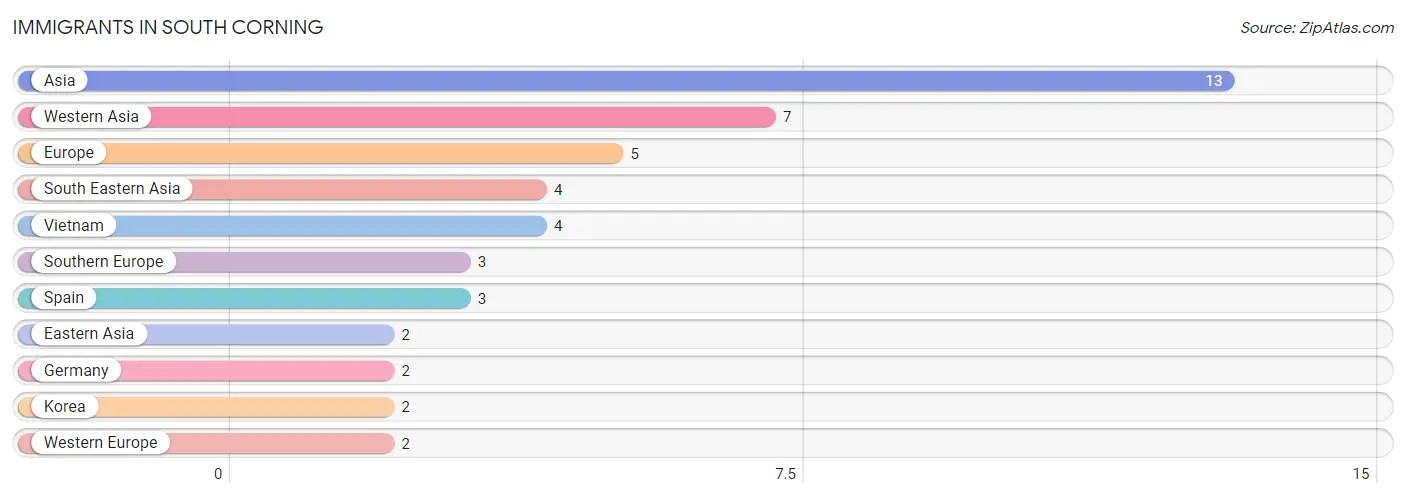
| Immigration Origin | # Population | % Population |
| Asia | 13 | 1.3% |
| Eastern Asia | 2 | 0.2% |
| Europe | 5 | 0.5% |
| Germany | 2 | 0.2% |
| Korea | 2 | 0.2% |
| South Eastern Asia | 4 | 0.4% |
| Southern Europe | 3 | 0.3% |
| Spain | 3 | 0.3% |
| Vietnam | 4 | 0.4% |
| Western Asia | 7 | 0.7% |
| Western Europe | 2 | 0.2% | View All 11 Rows |
Sex and Age in South Corning
Sex and Age in South Corning
The most populous age groups in South Corning are 60 to 64 Years (46 | 10.3%) for men and 10 to 14 Years (52 | 10.0%) for women.
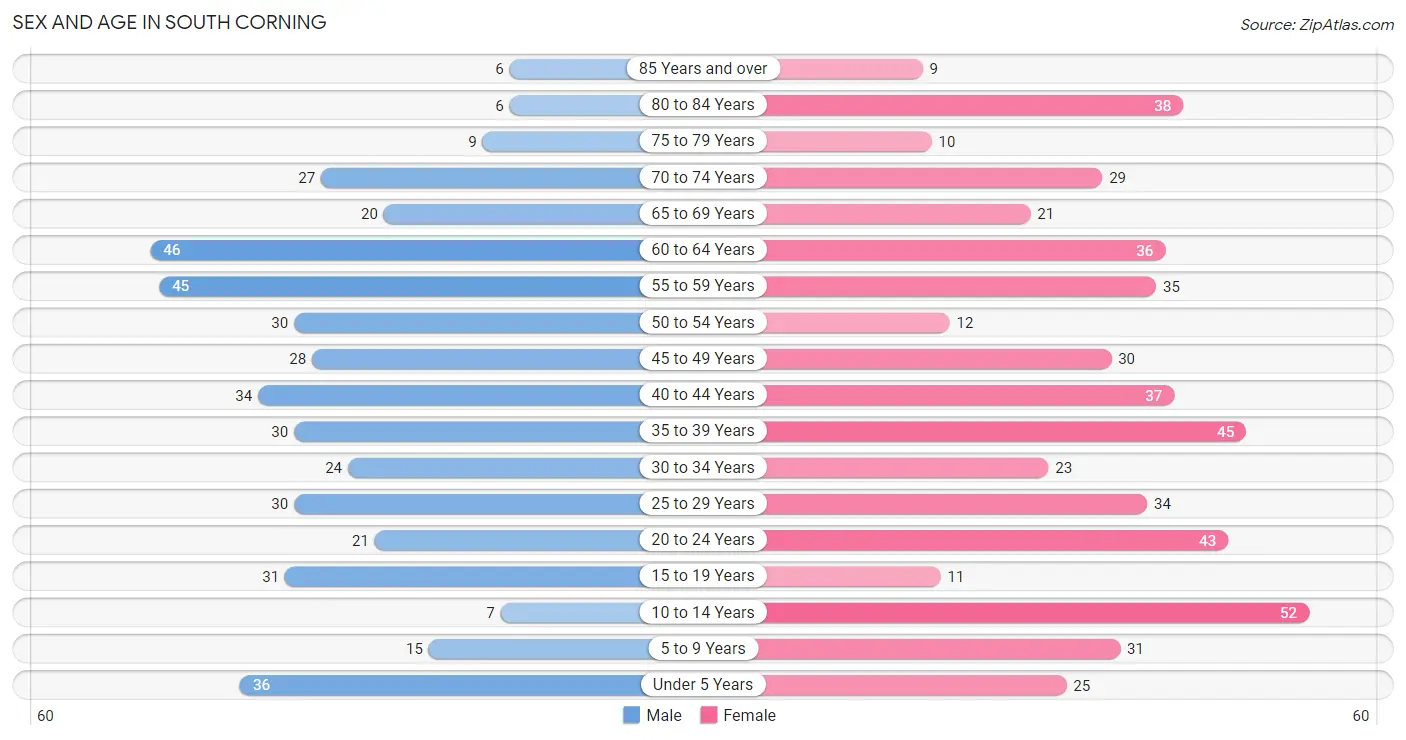
| Age Bracket | Male | Female |
| Under 5 Years | 36 (8.1%) | 25 (4.8%) |
| 5 to 9 Years | 15 (3.4%) | 31 (5.9%) |
| 10 to 14 Years | 7 (1.6%) | 52 (10.0%) |
| 15 to 19 Years | 31 (7.0%) | 11 (2.1%) |
| 20 to 24 Years | 21 (4.7%) | 43 (8.3%) |
| 25 to 29 Years | 30 (6.7%) | 34 (6.5%) |
| 30 to 34 Years | 24 (5.4%) | 23 (4.4%) |
| 35 to 39 Years | 30 (6.7%) | 45 (8.6%) |
| 40 to 44 Years | 34 (7.6%) | 37 (7.1%) |
| 45 to 49 Years | 28 (6.3%) | 30 (5.8%) |
| 50 to 54 Years | 30 (6.7%) | 12 (2.3%) |
| 55 to 59 Years | 45 (10.1%) | 35 (6.7%) |
| 60 to 64 Years | 46 (10.3%) | 36 (6.9%) |
| 65 to 69 Years | 20 (4.5%) | 21 (4.0%) |
| 70 to 74 Years | 27 (6.1%) | 29 (5.6%) |
| 75 to 79 Years | 9 (2.0%) | 10 (1.9%) |
| 80 to 84 Years | 6 (1.3%) | 38 (7.3%) |
| 85 Years and over | 6 (1.3%) | 9 (1.7%) |
| Total | 445 (100.0%) | 521 (100.0%) |
Families and Households in South Corning
Median Family Size in South Corning
The median family size in South Corning is 2.70 persons per family, with single female/mother families (47 | 17.6%) accounting for the largest median family size of 2.79 persons per family. On the other hand, single male/father families (20 | 7.5%) represent the smallest median family size with 2.00 persons per family.
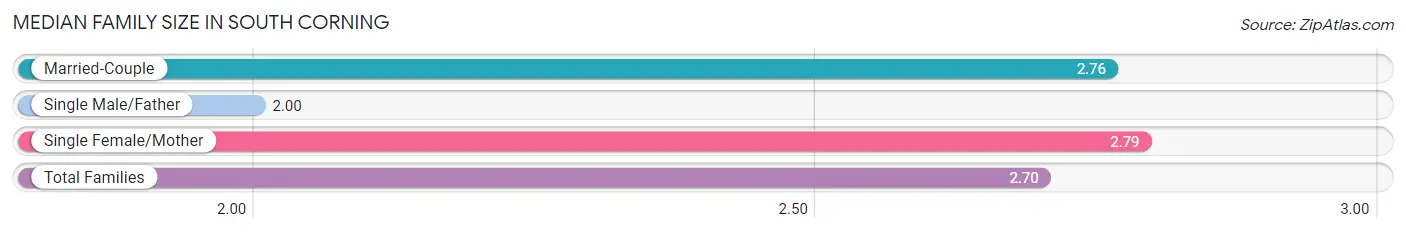
| Family Type | # Families | Family Size |
| Married-Couple | 200 (74.9%) | 2.76 |
| Single Male/Father | 20 (7.5%) | 2.00 |
| Single Female/Mother | 47 (17.6%) | 2.79 |
| Total Families | 267 (100.0%) | 2.70 |
Median Household Size in South Corning
The median household size in South Corning is 2.14 persons per household, with single female/mother households (47 | 10.4%) accounting for the largest median household size of 3.02 persons per household. non-family households (185 | 40.9%) represent the smallest median household size with 1.26 persons per household.
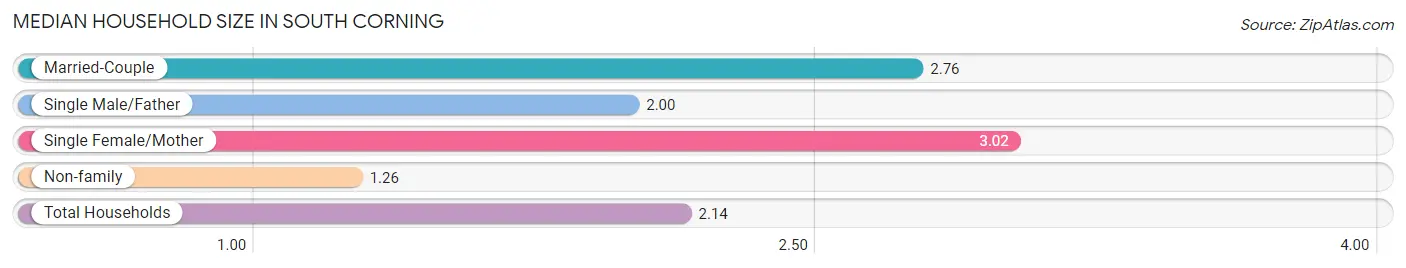
| Household Type | # Households | Household Size |
| Married-Couple | 200 (44.3%) | 2.76 |
| Single Male/Father | 20 (4.4%) | 2.00 |
| Single Female/Mother | 47 (10.4%) | 3.02 |
| Non-family | 185 (40.9%) | 1.26 |
| Total Households | 452 (100.0%) | 2.14 |
Household Size by Marriage Status in South Corning
Out of a total of 452 households in South Corning, 267 (59.1%) are family households, while 185 (40.9%) are nonfamily households. The most numerous type of family households are 2-person households, comprising 145, and the most common type of nonfamily households are 1-person households, comprising 154.
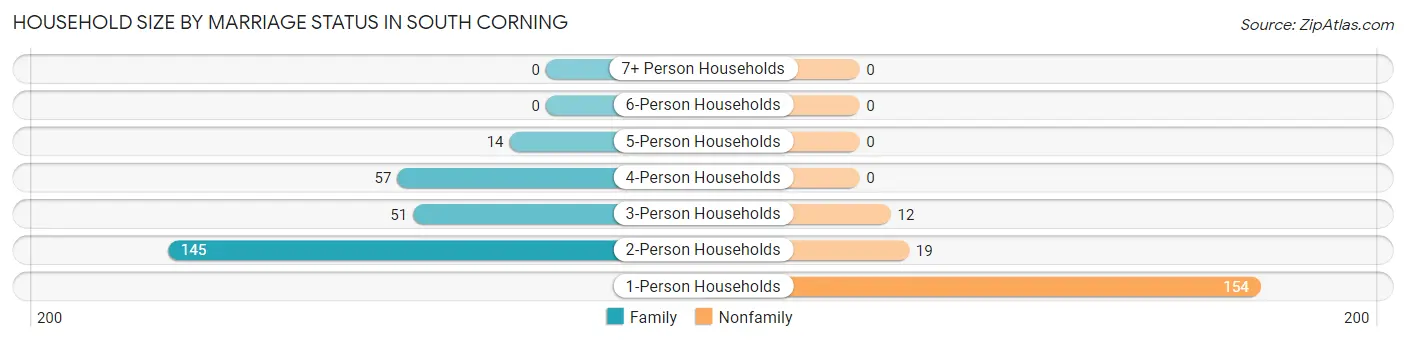
| Household Size | Family Households | Nonfamily Households |
| 1-Person Households | - | 154 (34.1%) |
| 2-Person Households | 145 (32.1%) | 19 (4.2%) |
| 3-Person Households | 51 (11.3%) | 12 (2.6%) |
| 4-Person Households | 57 (12.6%) | 0 (0.0%) |
| 5-Person Households | 14 (3.1%) | 0 (0.0%) |
| 6-Person Households | 0 (0.0%) | 0 (0.0%) |
| 7+ Person Households | 0 (0.0%) | 0 (0.0%) |
| Total | 267 (59.1%) | 185 (40.9%) |
Female Fertility in South Corning
Fertility by Age in South Corning
Average fertility rate in South Corning is 72.0 births per 1,000 women. Women in the age bracket of 20 to 34 years have the highest fertility rate with 160.0 births per 1,000 women. Women in the age bracket of 20 to 34 years acount for 100.0% of all women with births.
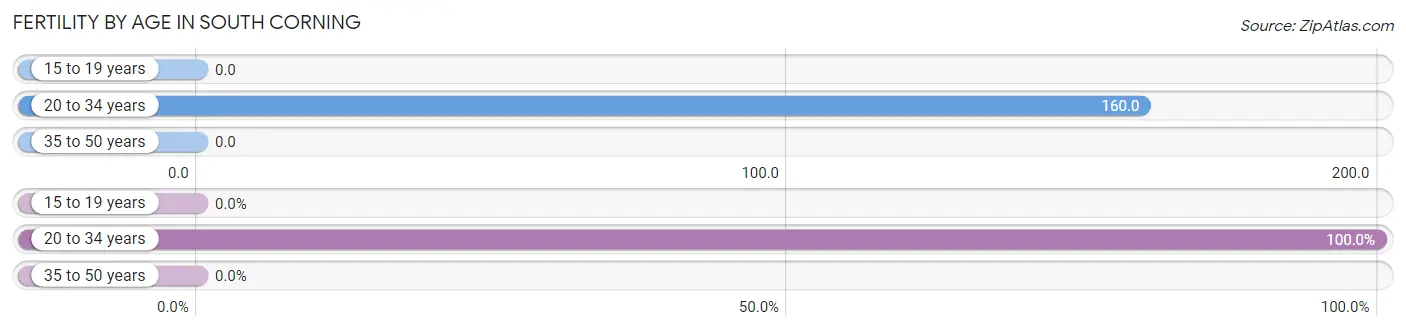
| Age Bracket | Women with Births | Births / 1,000 Women |
| 15 to 19 years | 0 (0.0%) | 0.0 |
| 20 to 34 years | 16 (100.0%) | 160.0 |
| 35 to 50 years | 0 (0.0%) | 0.0 |
| Total | 16 (100.0%) | 72.0 |
Fertility by Age by Marriage Status in South Corning
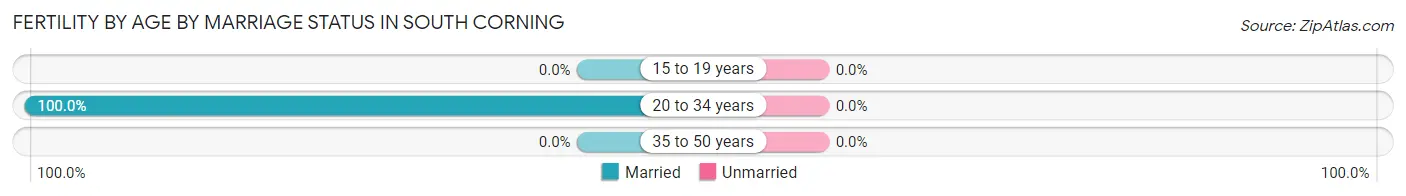
| Age Bracket | Married | Unmarried |
| 15 to 19 years | 0 (0.0%) | 0 (0.0%) |
| 20 to 34 years | 16 (100.0%) | 0 (0.0%) |
| 35 to 50 years | 0 (0.0%) | 0 (0.0%) |
| Total | 16 (100.0%) | 0 (0.0%) |
Fertility by Education in South Corning
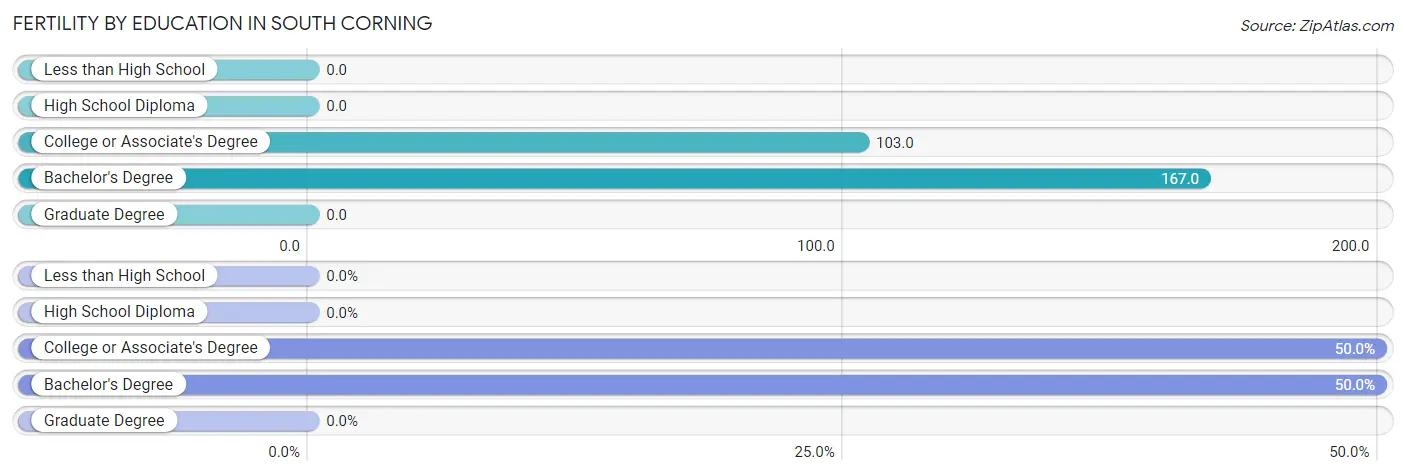
| Educational Attainment | Women with Births | Births / 1,000 Women |
| Less than High School | 0 (0.0%) | 0.0 |
| High School Diploma | 0 (0.0%) | 0.0 |
| College or Associate's Degree | 8 (50.0%) | 103.0 |
| Bachelor's Degree | 8 (50.0%) | 167.0 |
| Graduate Degree | 0 (0.0%) | 0.0 |
| Total | 16 (100.0%) | 72.0 |
Fertility by Education by Marriage Status in South Corning
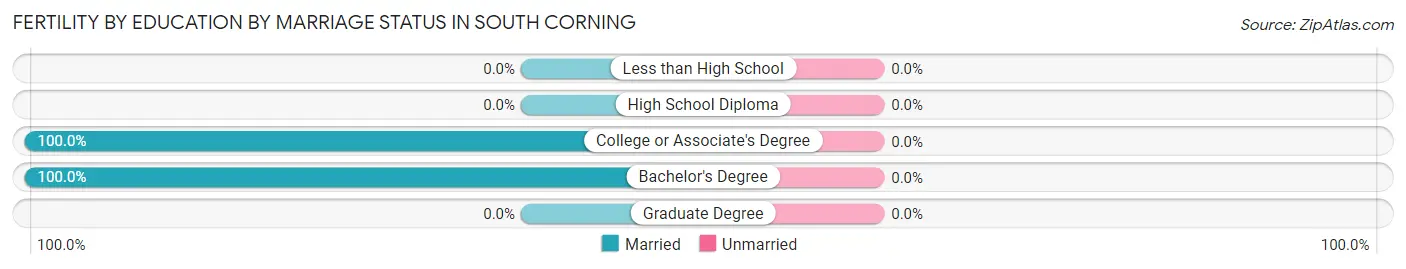
| Educational Attainment | Married | Unmarried |
| Less than High School | 0 (0.0%) | 0 (0.0%) |
| High School Diploma | 0 (0.0%) | 0 (0.0%) |
| College or Associate's Degree | 8 (100.0%) | 0 (0.0%) |
| Bachelor's Degree | 8 (100.0%) | 0 (0.0%) |
| Graduate Degree | 0 (0.0%) | 0 (0.0%) |
| Total | 16 (100.0%) | 0 (0.0%) |
Employment Characteristics in South Corning
Employment by Class of Employer in South Corning
Among the 460 employed individuals in South Corning, private company employees (314 | 68.3%), not-for-profit organizations (68 | 14.8%), and local government employees (32 | 7.0%) make up the most common classes of employment.
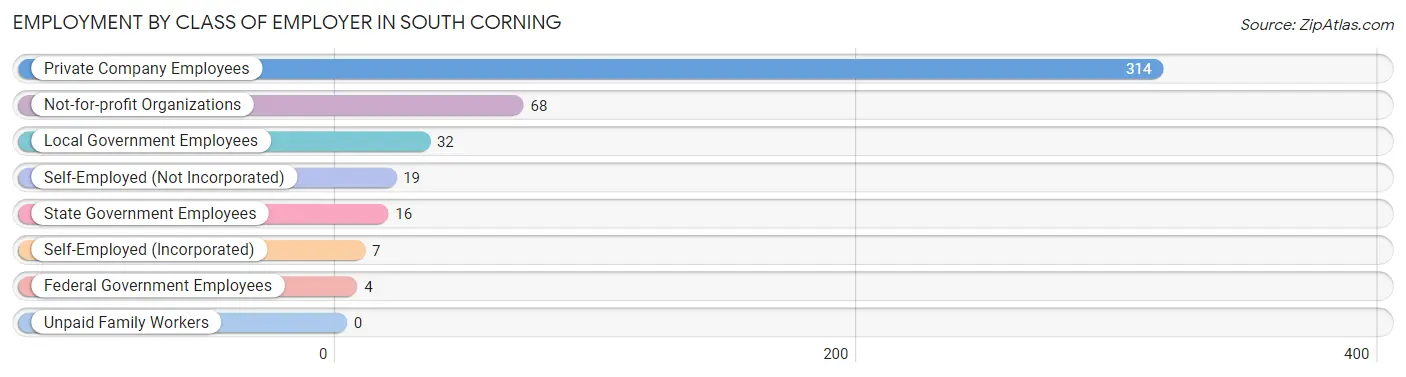
| Employer Class | # Employees | % Employees |
| Private Company Employees | 314 | 68.3% |
| Self-Employed (Incorporated) | 7 | 1.5% |
| Self-Employed (Not Incorporated) | 19 | 4.1% |
| Not-for-profit Organizations | 68 | 14.8% |
| Local Government Employees | 32 | 7.0% |
| State Government Employees | 16 | 3.5% |
| Federal Government Employees | 4 | 0.9% |
| Unpaid Family Workers | 0 | 0.0% |
| Total | 460 | 100.0% |
Employment Status by Age in South Corning
According to the labor force statistics for South Corning, out of the total population over 16 years of age (789), 67.6% or 533 individuals are in the labor force, with 11.6% or 62 of them unemployed. The age group with the highest labor force participation rate is 35 to 44 years, with 98.6% or 144 individuals in the labor force. Within the labor force, the 25 to 29 years age range has the highest percentage of unemployed individuals, with 30.0% or 15 of them being unemployed.
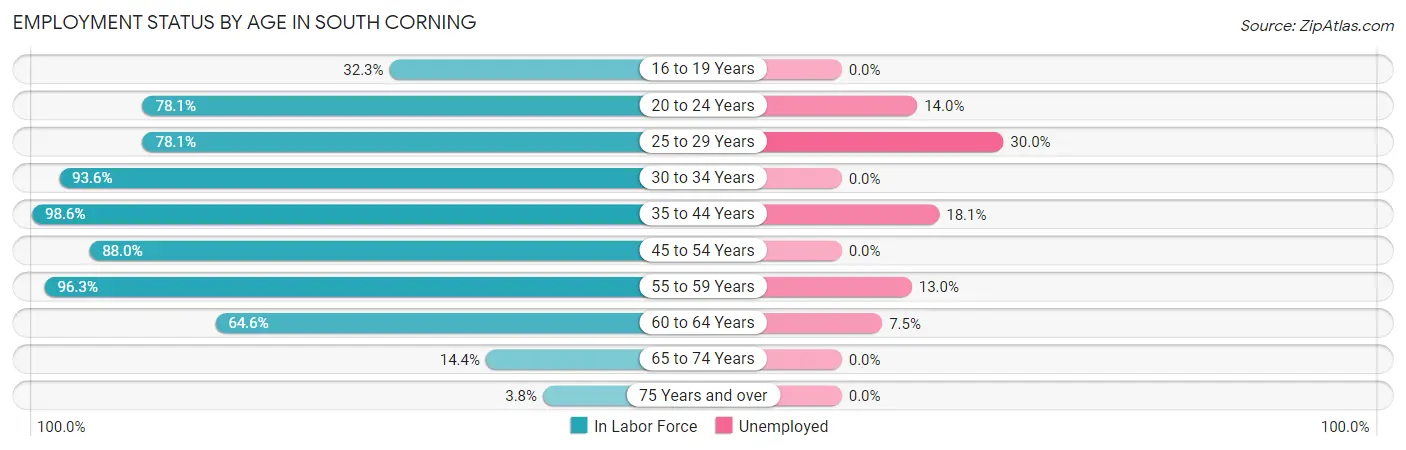
| Age Bracket | In Labor Force | Unemployed |
| 16 to 19 Years | 10 (32.3%) | 0 (0.0%) |
| 20 to 24 Years | 50 (78.1%) | 7 (14.0%) |
| 25 to 29 Years | 50 (78.1%) | 15 (30.0%) |
| 30 to 34 Years | 44 (93.6%) | 0 (0.0%) |
| 35 to 44 Years | 144 (98.6%) | 26 (18.1%) |
| 45 to 54 Years | 88 (88.0%) | 0 (0.0%) |
| 55 to 59 Years | 77 (96.3%) | 10 (13.0%) |
| 60 to 64 Years | 53 (64.6%) | 4 (7.5%) |
| 65 to 74 Years | 14 (14.4%) | 0 (0.0%) |
| 75 Years and over | 3 (3.8%) | 0 (0.0%) |
| Total | 533 (67.6%) | 62 (11.6%) |
Employment Status by Educational Attainment in South Corning
According to labor force statistics for South Corning, 87.9% of individuals (456) out of the total population between 25 and 64 years of age (519) are in the labor force, with 12.1% or 55 of them being unemployed. The group with the highest labor force participation rate are those with the educational attainment of bachelor's degree or higher, with 94.2% or 161 individuals in the labor force. Within the labor force, individuals with less than high school education have the highest percentage of unemployment, with 100.0% or 14 of them being unemployed.
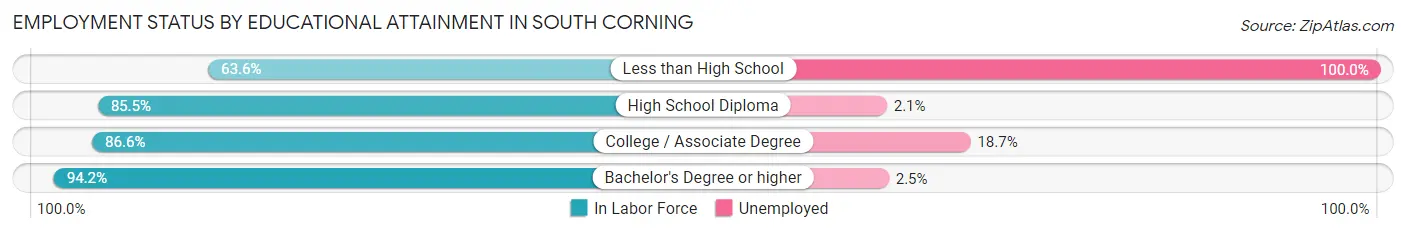
| Educational Attainment | In Labor Force | Unemployed |
| Less than High School | 14 (63.6%) | 22 (100.0%) |
| High School Diploma | 94 (85.5%) | 2 (2.1%) |
| College / Associate Degree | 187 (86.6%) | 40 (18.7%) |
| Bachelor's Degree or higher | 161 (94.2%) | 4 (2.5%) |
| Total | 456 (87.9%) | 63 (12.1%) |
Employment Occupations by Sex in South Corning
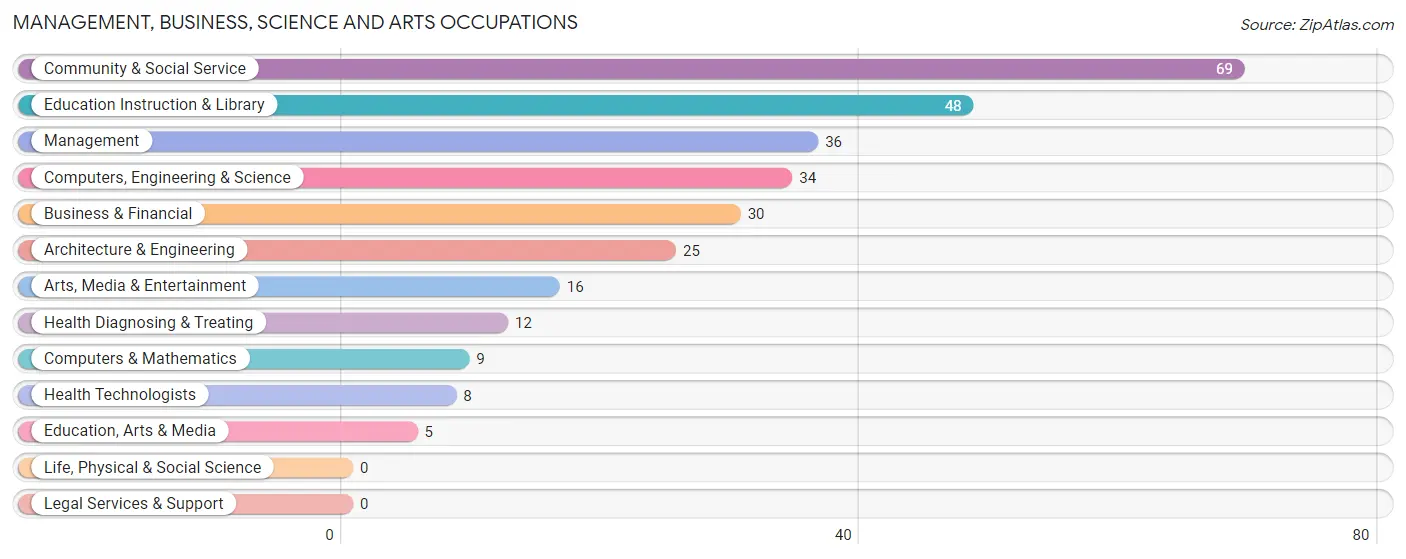
Management, Business, Science and Arts Occupations
The most common Management, Business, Science and Arts occupations in South Corning are Community & Social Service (69 | 14.6%), Education Instruction & Library (48 | 10.2%), Management (36 | 7.6%), Computers, Engineering & Science (34 | 7.2%), and Business & Financial (30 | 6.4%).
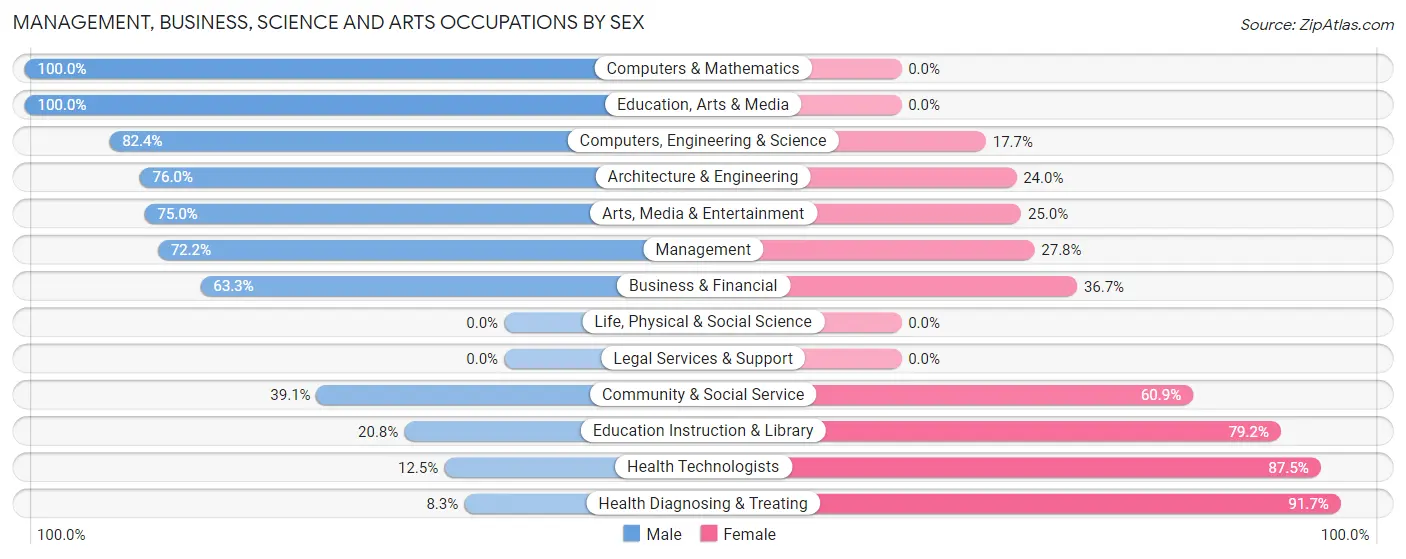
Management, Business, Science and Arts Occupations by Sex
Within the Management, Business, Science and Arts occupations in South Corning, the most male-oriented occupations are Computers & Mathematics (100.0%), Education, Arts & Media (100.0%), and Computers, Engineering & Science (82.4%), while the most female-oriented occupations are Health Diagnosing & Treating (91.7%), Health Technologists (87.5%), and Education Instruction & Library (79.2%).
| Occupation | Male | Female |
| Management | 26 (72.2%) | 10 (27.8%) |
| Business & Financial | 19 (63.3%) | 11 (36.7%) |
| Computers, Engineering & Science | 28 (82.4%) | 6 (17.6%) |
| Computers & Mathematics | 9 (100.0%) | 0 (0.0%) |
| Architecture & Engineering | 19 (76.0%) | 6 (24.0%) |
| Life, Physical & Social Science | 0 (0.0%) | 0 (0.0%) |
| Community & Social Service | 27 (39.1%) | 42 (60.9%) |
| Education, Arts & Media | 5 (100.0%) | 0 (0.0%) |
| Legal Services & Support | 0 (0.0%) | 0 (0.0%) |
| Education Instruction & Library | 10 (20.8%) | 38 (79.2%) |
| Arts, Media & Entertainment | 12 (75.0%) | 4 (25.0%) |
| Health Diagnosing & Treating | 1 (8.3%) | 11 (91.7%) |
| Health Technologists | 1 (12.5%) | 7 (87.5%) |
| Total (Category) | 101 (55.8%) | 80 (44.2%) |
| Total (Overall) | 258 (54.8%) | 213 (45.2%) |
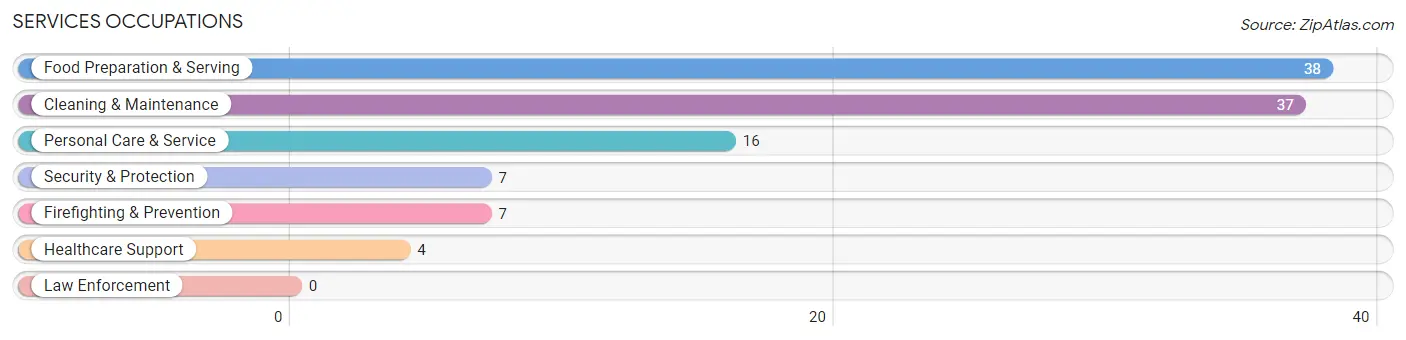
Services Occupations
The most common Services occupations in South Corning are Food Preparation & Serving (38 | 8.1%), Cleaning & Maintenance (37 | 7.9%), Personal Care & Service (16 | 3.4%), Security & Protection (7 | 1.5%), and Firefighting & Prevention (7 | 1.5%).
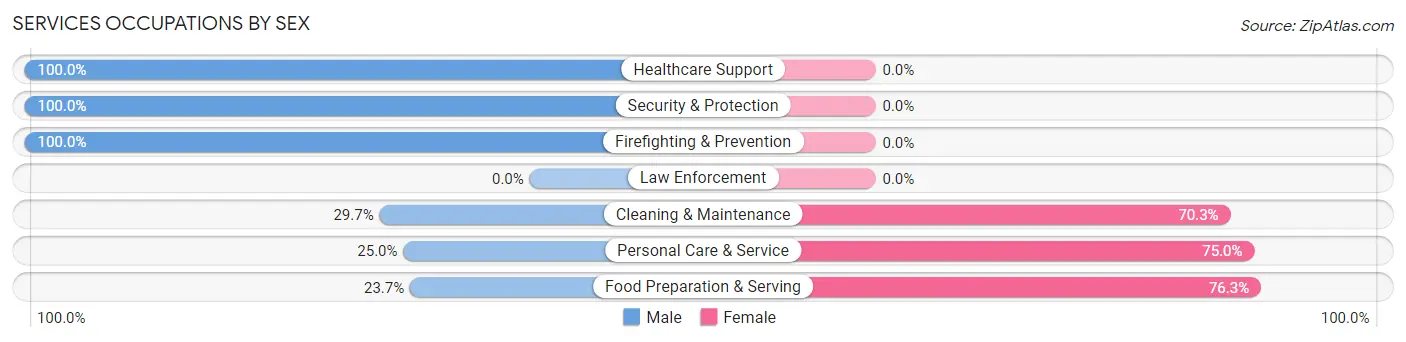
Services Occupations by Sex
Within the Services occupations in South Corning, the most male-oriented occupations are Healthcare Support (100.0%), Security & Protection (100.0%), and Firefighting & Prevention (100.0%), while the most female-oriented occupations are Food Preparation & Serving (76.3%), Personal Care & Service (75.0%), and Cleaning & Maintenance (70.3%).
| Occupation | Male | Female |
| Healthcare Support | 4 (100.0%) | 0 (0.0%) |
| Security & Protection | 7 (100.0%) | 0 (0.0%) |
| Firefighting & Prevention | 7 (100.0%) | 0 (0.0%) |
| Law Enforcement | 0 (0.0%) | 0 (0.0%) |
| Food Preparation & Serving | 9 (23.7%) | 29 (76.3%) |
| Cleaning & Maintenance | 11 (29.7%) | 26 (70.3%) |
| Personal Care & Service | 4 (25.0%) | 12 (75.0%) |
| Total (Category) | 35 (34.3%) | 67 (65.7%) |
| Total (Overall) | 258 (54.8%) | 213 (45.2%) |
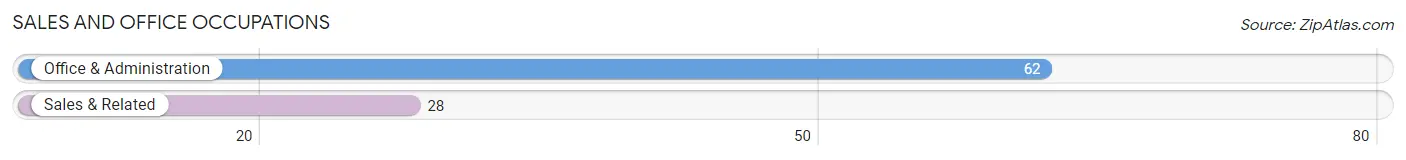
Sales and Office Occupations
The most common Sales and Office occupations in South Corning are Office & Administration (62 | 13.2%), and Sales & Related (28 | 5.9%).
Sales and Office Occupations by Sex
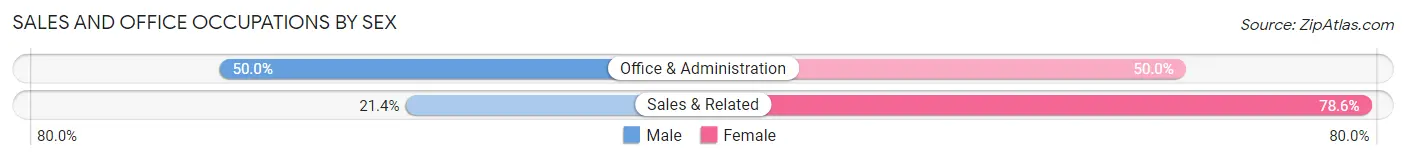
| Occupation | Male | Female |
| Sales & Related | 6 (21.4%) | 22 (78.6%) |
| Office & Administration | 31 (50.0%) | 31 (50.0%) |
| Total (Category) | 37 (41.1%) | 53 (58.9%) |
| Total (Overall) | 258 (54.8%) | 213 (45.2%) |
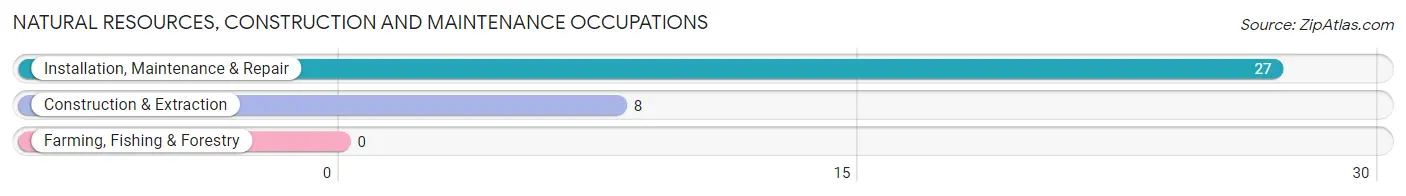
Natural Resources, Construction and Maintenance Occupations
The most common Natural Resources, Construction and Maintenance occupations in South Corning are Installation, Maintenance & Repair (27 | 5.7%), and Construction & Extraction (8 | 1.7%).
Natural Resources, Construction and Maintenance Occupations by Sex
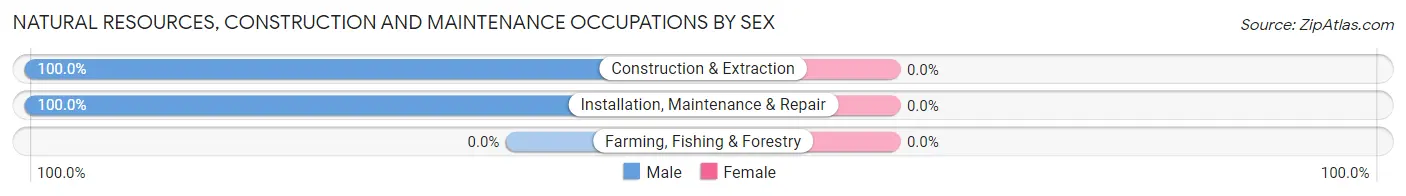
| Occupation | Male | Female |
| Farming, Fishing & Forestry | 0 (0.0%) | 0 (0.0%) |
| Construction & Extraction | 8 (100.0%) | 0 (0.0%) |
| Installation, Maintenance & Repair | 27 (100.0%) | 0 (0.0%) |
| Total (Category) | 35 (100.0%) | 0 (0.0%) |
| Total (Overall) | 258 (54.8%) | 213 (45.2%) |
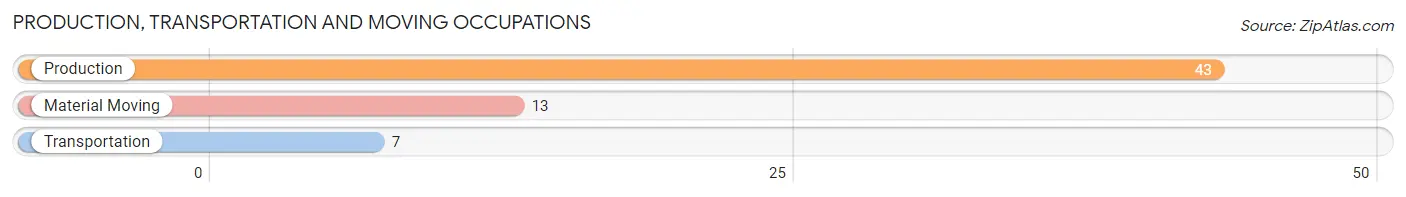
Production, Transportation and Moving Occupations
The most common Production, Transportation and Moving occupations in South Corning are Production (43 | 9.1%), Material Moving (13 | 2.8%), and Transportation (7 | 1.5%).
Production, Transportation and Moving Occupations by Sex
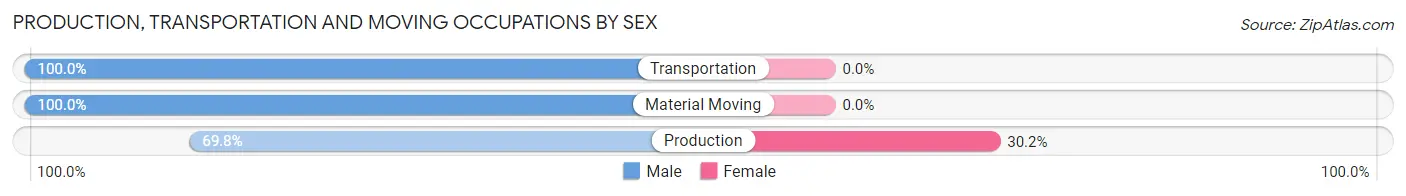
| Occupation | Male | Female |
| Production | 30 (69.8%) | 13 (30.2%) |
| Transportation | 7 (100.0%) | 0 (0.0%) |
| Material Moving | 13 (100.0%) | 0 (0.0%) |
| Total (Category) | 50 (79.4%) | 13 (20.6%) |
| Total (Overall) | 258 (54.8%) | 213 (45.2%) |
Employment Industries by Sex in South Corning
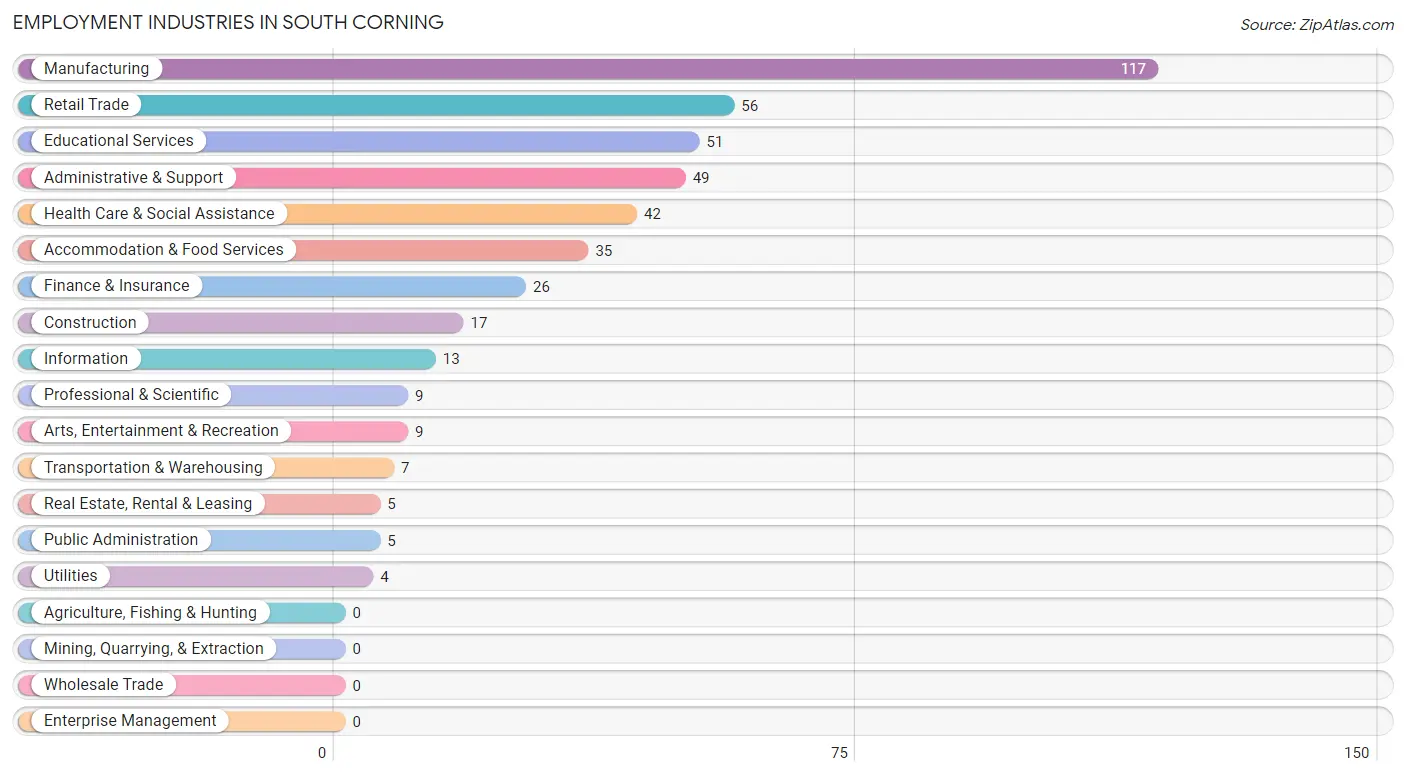
Employment Industries in South Corning
The major employment industries in South Corning include Manufacturing (117 | 24.8%), Retail Trade (56 | 11.9%), Educational Services (51 | 10.8%), Administrative & Support (49 | 10.4%), and Health Care & Social Assistance (42 | 8.9%).
Employment Industries by Sex in South Corning
The South Corning industries that see more men than women are Transportation & Warehousing (100.0%), Information (100.0%), and Real Estate, Rental & Leasing (100.0%), whereas the industries that tend to have a higher number of women are Utilities (100.0%), Finance & Insurance (84.6%), and Educational Services (80.4%).
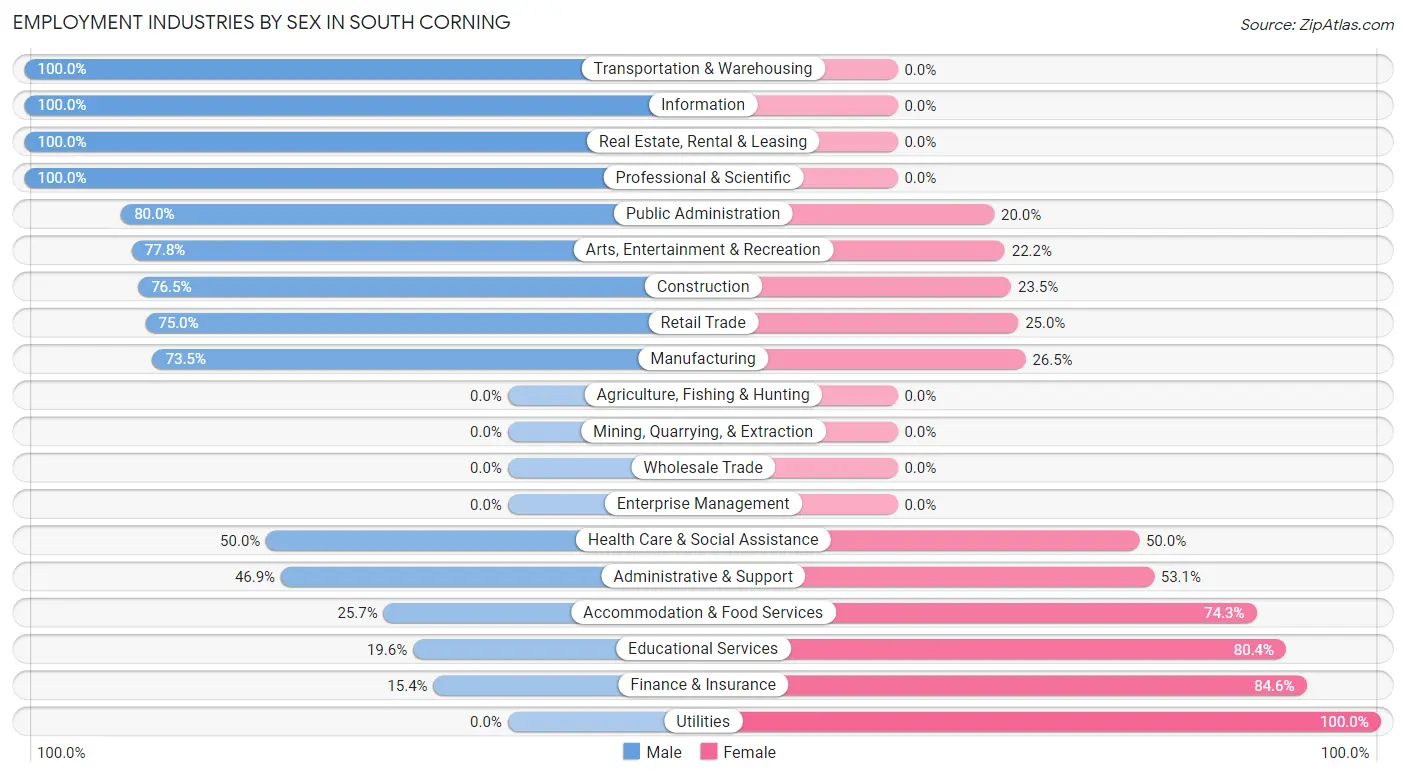
| Industry | Male | Female |
| Agriculture, Fishing & Hunting | 0 (0.0%) | 0 (0.0%) |
| Mining, Quarrying, & Extraction | 0 (0.0%) | 0 (0.0%) |
| Construction | 13 (76.5%) | 4 (23.5%) |
| Manufacturing | 86 (73.5%) | 31 (26.5%) |
| Wholesale Trade | 0 (0.0%) | 0 (0.0%) |
| Retail Trade | 42 (75.0%) | 14 (25.0%) |
| Transportation & Warehousing | 7 (100.0%) | 0 (0.0%) |
| Utilities | 0 (0.0%) | 4 (100.0%) |
| Information | 13 (100.0%) | 0 (0.0%) |
| Finance & Insurance | 4 (15.4%) | 22 (84.6%) |
| Real Estate, Rental & Leasing | 5 (100.0%) | 0 (0.0%) |
| Professional & Scientific | 9 (100.0%) | 0 (0.0%) |
| Enterprise Management | 0 (0.0%) | 0 (0.0%) |
| Administrative & Support | 23 (46.9%) | 26 (53.1%) |
| Educational Services | 10 (19.6%) | 41 (80.4%) |
| Health Care & Social Assistance | 21 (50.0%) | 21 (50.0%) |
| Arts, Entertainment & Recreation | 7 (77.8%) | 2 (22.2%) |
| Accommodation & Food Services | 9 (25.7%) | 26 (74.3%) |
| Public Administration | 4 (80.0%) | 1 (20.0%) |
| Total | 258 (54.8%) | 213 (45.2%) |
Education in South Corning
School Enrollment in South Corning
The most common levels of schooling among the 223 students in South Corning are college / undergraduate (65 | 29.1%), elementary school (44 | 19.7%), and high school (44 | 19.7%).
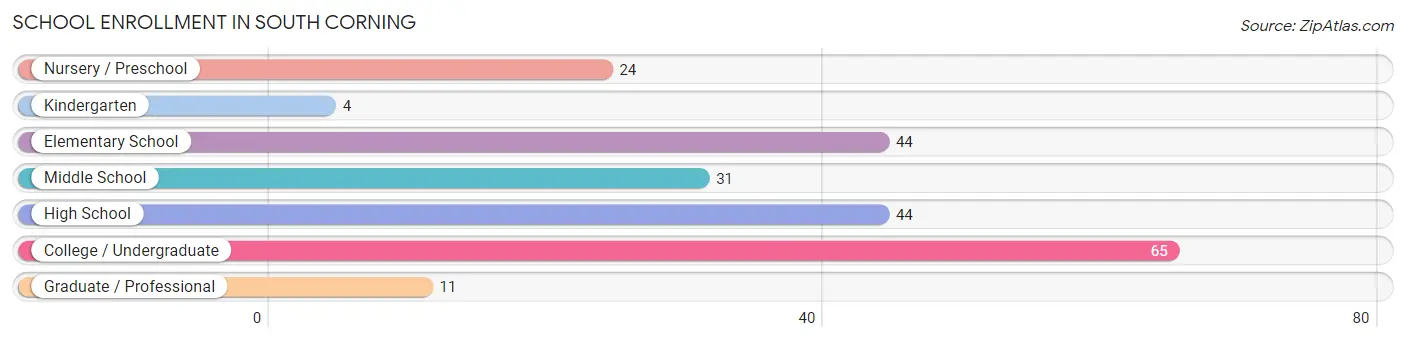
| School Level | # Students | % Students |
| Nursery / Preschool | 24 | 10.8% |
| Kindergarten | 4 | 1.8% |
| Elementary School | 44 | 19.7% |
| Middle School | 31 | 13.9% |
| High School | 44 | 19.7% |
| College / Undergraduate | 65 | 29.1% |
| Graduate / Professional | 11 | 4.9% |
| Total | 223 | 100.0% |
School Enrollment by Age by Funding Source in South Corning
Out of a total of 223 students who are enrolled in schools in South Corning, 29 (13.0%) attend a private institution, while the remaining 194 (87.0%) are enrolled in public schools. The age group of 25 to 34 year olds has the highest likelihood of being enrolled in private schools, with 6 (54.5% in the age bracket) enrolled. Conversely, the age group of 3 to 4 year olds has the lowest likelihood of being enrolled in a private school, with 24 (100.0% in the age bracket) attending a public institution.
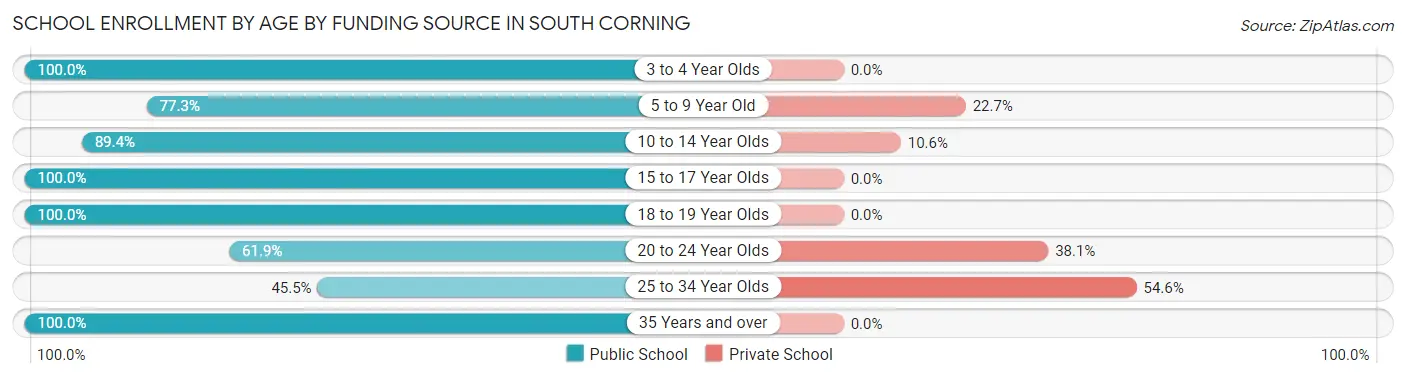
| Age Bracket | Public School | Private School |
| 3 to 4 Year Olds | 24 (100.0%) | 0 (0.0%) |
| 5 to 9 Year Old | 34 (77.3%) | 10 (22.7%) |
| 10 to 14 Year Olds | 42 (89.4%) | 5 (10.6%) |
| 15 to 17 Year Olds | 23 (100.0%) | 0 (0.0%) |
| 18 to 19 Year Olds | 19 (100.0%) | 0 (0.0%) |
| 20 to 24 Year Olds | 13 (61.9%) | 8 (38.1%) |
| 25 to 34 Year Olds | 5 (45.5%) | 6 (54.5%) |
| 35 Years and over | 34 (100.0%) | 0 (0.0%) |
| Total | 194 (87.0%) | 29 (13.0%) |
Educational Attainment by Field of Study in South Corning
Business (52 | 24.1%), education (40 | 18.5%), engineering (30 | 13.9%), psychology (17 | 7.9%), and social sciences (12 | 5.6%) are the most common fields of study among 216 individuals in South Corning who have obtained a bachelor's degree or higher.
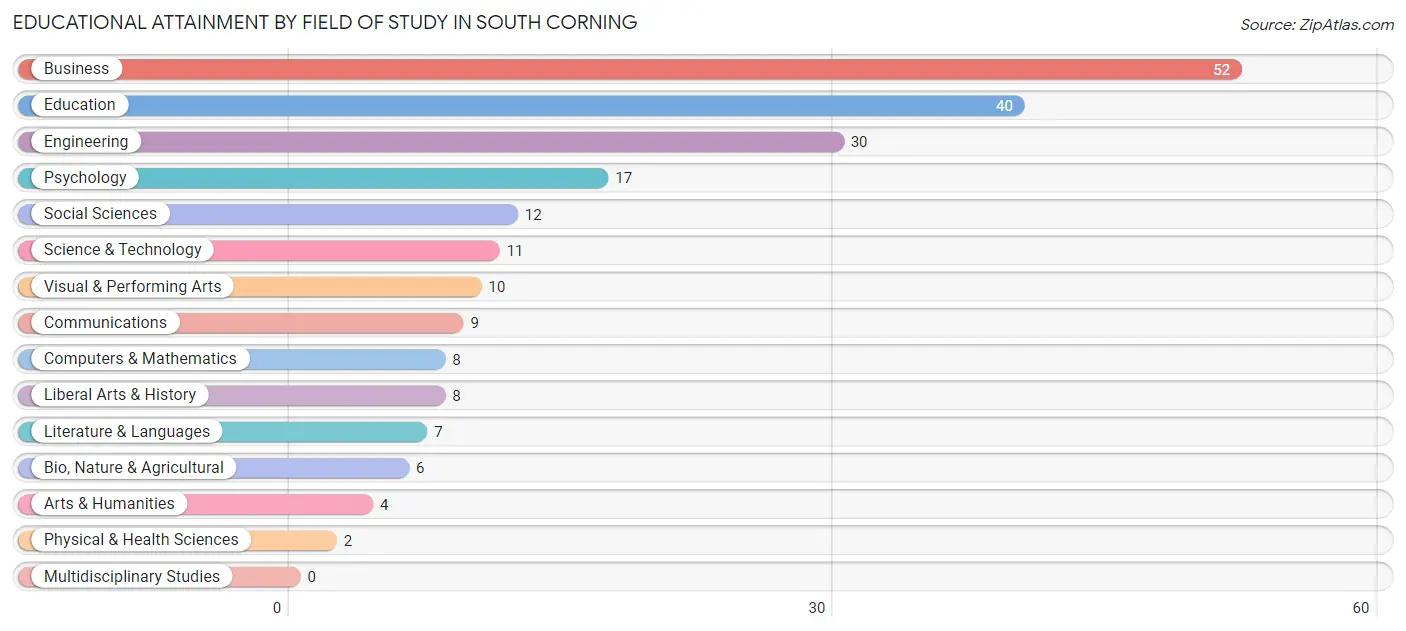
| Field of Study | # Graduates | % Graduates |
| Computers & Mathematics | 8 | 3.7% |
| Bio, Nature & Agricultural | 6 | 2.8% |
| Physical & Health Sciences | 2 | 0.9% |
| Psychology | 17 | 7.9% |
| Social Sciences | 12 | 5.6% |
| Engineering | 30 | 13.9% |
| Multidisciplinary Studies | 0 | 0.0% |
| Science & Technology | 11 | 5.1% |
| Business | 52 | 24.1% |
| Education | 40 | 18.5% |
| Literature & Languages | 7 | 3.2% |
| Liberal Arts & History | 8 | 3.7% |
| Visual & Performing Arts | 10 | 4.6% |
| Communications | 9 | 4.2% |
| Arts & Humanities | 4 | 1.8% |
| Total | 216 | 100.0% |
Transportation & Commute in South Corning
Vehicle Availability by Sex in South Corning
The most prevalent vehicle ownership categories in South Corning are males with 2 vehicles (110, accounting for 43.1%) and females with 2 vehicles (78, making up 53.7%).
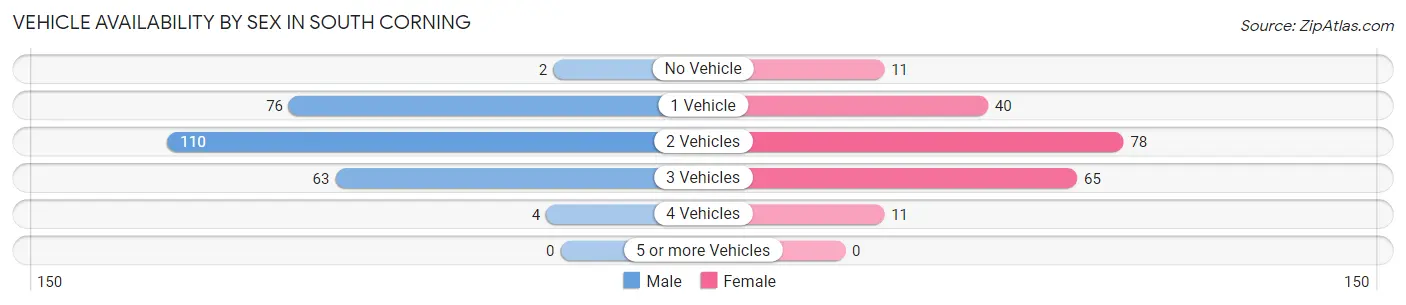
| Vehicles Available | Male | Female |
| No Vehicle | 2 (0.8%) | 11 (5.4%) |
| 1 Vehicle | 76 (29.8%) | 40 (19.5%) |
| 2 Vehicles | 110 (43.1%) | 78 (38.1%) |
| 3 Vehicles | 63 (24.7%) | 65 (31.7%) |
| 4 Vehicles | 4 (1.6%) | 11 (5.4%) |
| 5 or more Vehicles | 0 (0.0%) | 0 (0.0%) |
| Total | 255 (100.0%) | 205 (100.0%) |
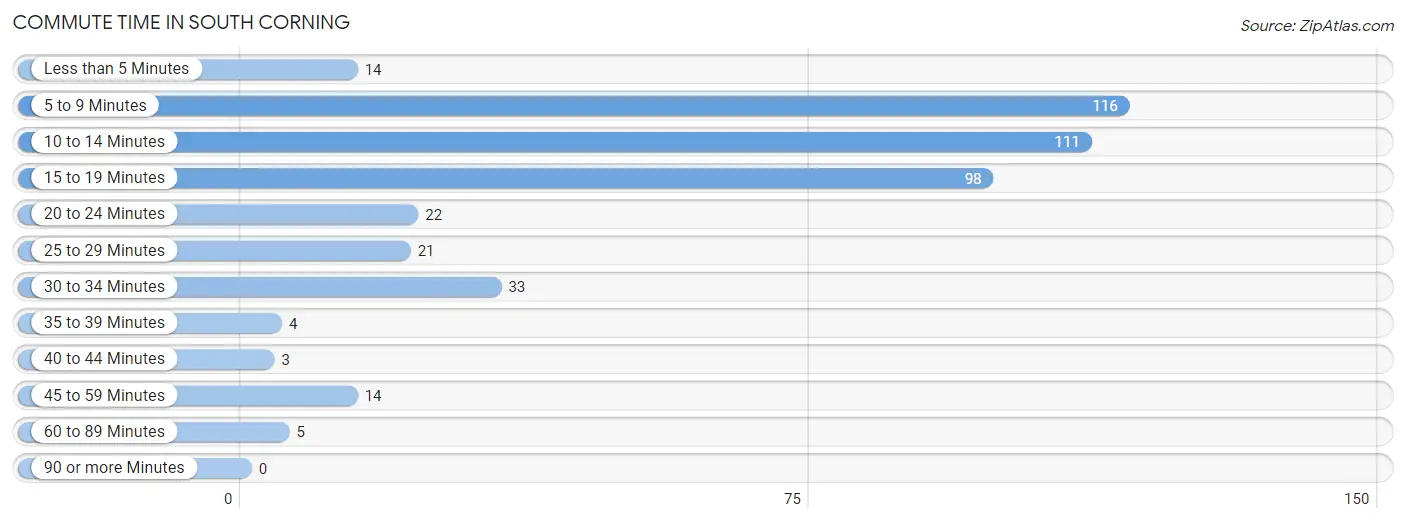
Commute Time in South Corning
The most frequently occuring commute durations in South Corning are 5 to 9 minutes (116 commuters, 26.3%), 10 to 14 minutes (111 commuters, 25.2%), and 15 to 19 minutes (98 commuters, 22.2%).
| Commute Time | # Commuters | % Commuters |
| Less than 5 Minutes | 14 | 3.2% |
| 5 to 9 Minutes | 116 | 26.3% |
| 10 to 14 Minutes | 111 | 25.2% |
| 15 to 19 Minutes | 98 | 22.2% |
| 20 to 24 Minutes | 22 | 5.0% |
| 25 to 29 Minutes | 21 | 4.8% |
| 30 to 34 Minutes | 33 | 7.5% |
| 35 to 39 Minutes | 4 | 0.9% |
| 40 to 44 Minutes | 3 | 0.7% |
| 45 to 59 Minutes | 14 | 3.2% |
| 60 to 89 Minutes | 5 | 1.1% |
| 90 or more Minutes | 0 | 0.0% |
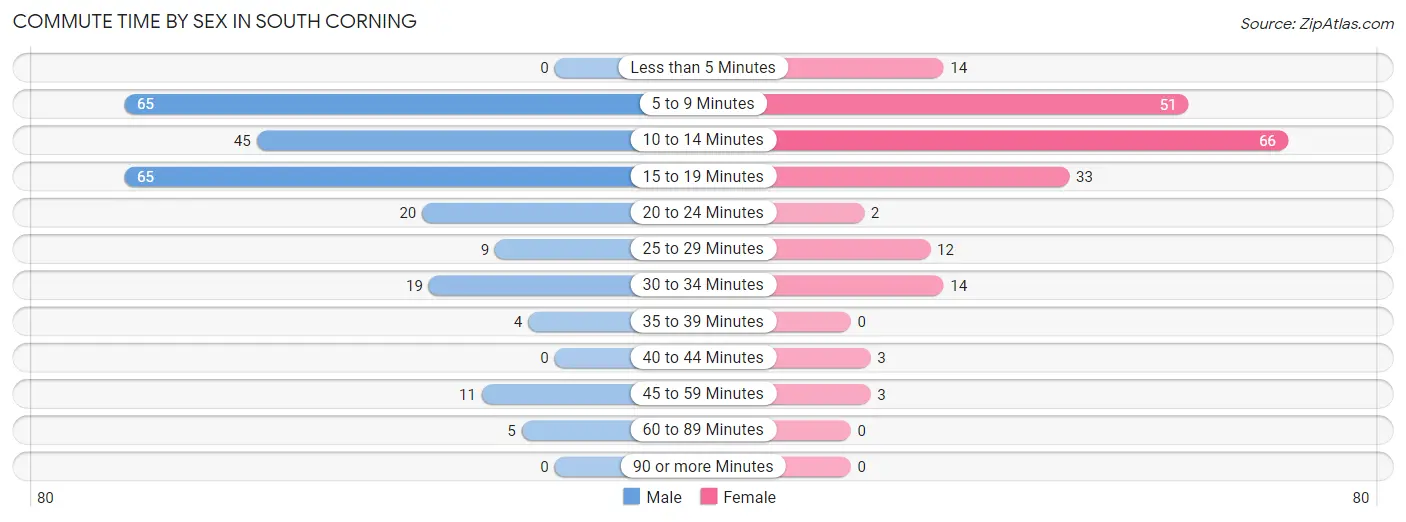
Commute Time by Sex in South Corning
The most common commute times in South Corning are 5 to 9 minutes (65 commuters, 26.8%) for males and 10 to 14 minutes (66 commuters, 33.3%) for females.
| Commute Time | Male | Female |
| Less than 5 Minutes | 0 (0.0%) | 14 (7.1%) |
| 5 to 9 Minutes | 65 (26.8%) | 51 (25.8%) |
| 10 to 14 Minutes | 45 (18.5%) | 66 (33.3%) |
| 15 to 19 Minutes | 65 (26.8%) | 33 (16.7%) |
| 20 to 24 Minutes | 20 (8.2%) | 2 (1.0%) |
| 25 to 29 Minutes | 9 (3.7%) | 12 (6.1%) |
| 30 to 34 Minutes | 19 (7.8%) | 14 (7.1%) |
| 35 to 39 Minutes | 4 (1.7%) | 0 (0.0%) |
| 40 to 44 Minutes | 0 (0.0%) | 3 (1.5%) |
| 45 to 59 Minutes | 11 (4.5%) | 3 (1.5%) |
| 60 to 89 Minutes | 5 (2.1%) | 0 (0.0%) |
| 90 or more Minutes | 0 (0.0%) | 0 (0.0%) |
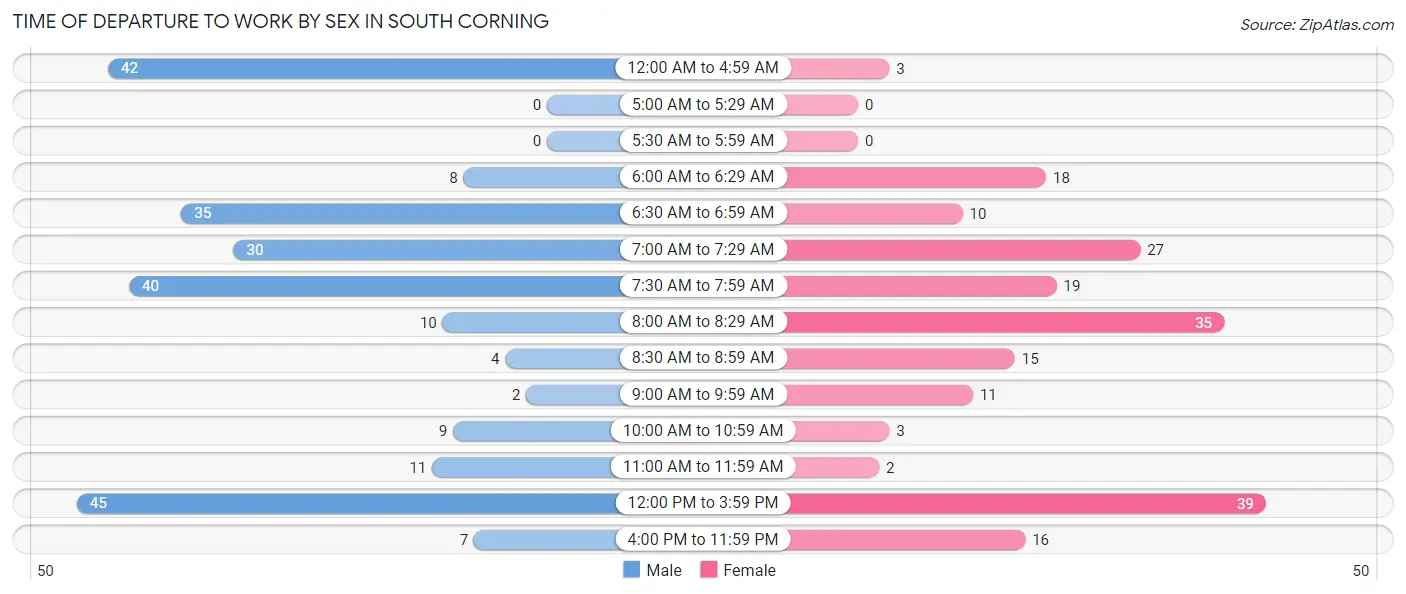
Time of Departure to Work by Sex in South Corning
The most frequent times of departure to work in South Corning are 12:00 PM to 3:59 PM (45, 18.5%) for males and 12:00 PM to 3:59 PM (39, 19.7%) for females.
| Time of Departure | Male | Female |
| 12:00 AM to 4:59 AM | 42 (17.3%) | 3 (1.5%) |
| 5:00 AM to 5:29 AM | 0 (0.0%) | 0 (0.0%) |
| 5:30 AM to 5:59 AM | 0 (0.0%) | 0 (0.0%) |
| 6:00 AM to 6:29 AM | 8 (3.3%) | 18 (9.1%) |
| 6:30 AM to 6:59 AM | 35 (14.4%) | 10 (5.1%) |
| 7:00 AM to 7:29 AM | 30 (12.3%) | 27 (13.6%) |
| 7:30 AM to 7:59 AM | 40 (16.5%) | 19 (9.6%) |
| 8:00 AM to 8:29 AM | 10 (4.1%) | 35 (17.7%) |
| 8:30 AM to 8:59 AM | 4 (1.7%) | 15 (7.6%) |
| 9:00 AM to 9:59 AM | 2 (0.8%) | 11 (5.6%) |
| 10:00 AM to 10:59 AM | 9 (3.7%) | 3 (1.5%) |
| 11:00 AM to 11:59 AM | 11 (4.5%) | 2 (1.0%) |
| 12:00 PM to 3:59 PM | 45 (18.5%) | 39 (19.7%) |
| 4:00 PM to 11:59 PM | 7 (2.9%) | 16 (8.1%) |
| Total | 243 (100.0%) | 198 (100.0%) |
Housing Occupancy in South Corning
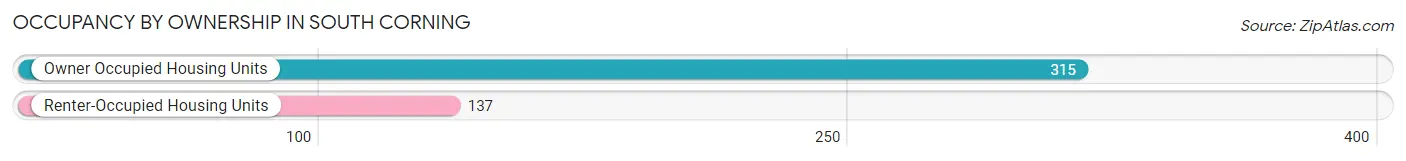
Occupancy by Ownership in South Corning
Of the total 452 dwellings in South Corning, owner-occupied units account for 315 (69.7%), while renter-occupied units make up 137 (30.3%).
| Occupancy | # Housing Units | % Housing Units |
| Owner Occupied Housing Units | 315 | 69.7% |
| Renter-Occupied Housing Units | 137 | 30.3% |
| Total Occupied Housing Units | 452 | 100.0% |
Occupancy by Household Size in South Corning
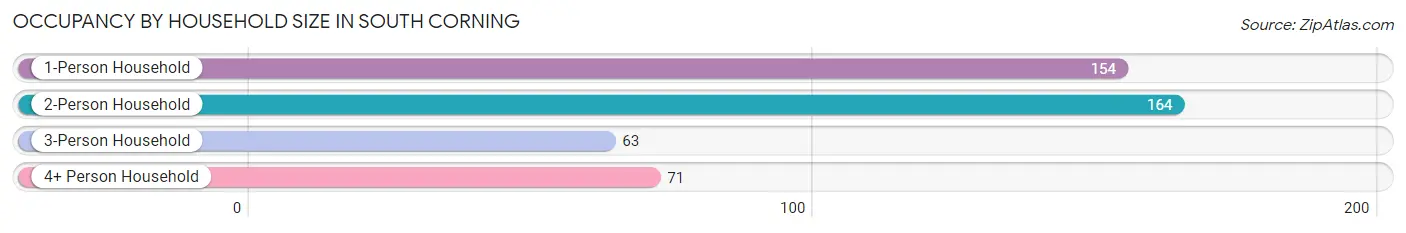
| Household Size | # Housing Units | % Housing Units |
| 1-Person Household | 154 | 34.1% |
| 2-Person Household | 164 | 36.3% |
| 3-Person Household | 63 | 13.9% |
| 4+ Person Household | 71 | 15.7% |
| Total Housing Units | 452 | 100.0% |
Occupancy by Ownership by Household Size in South Corning
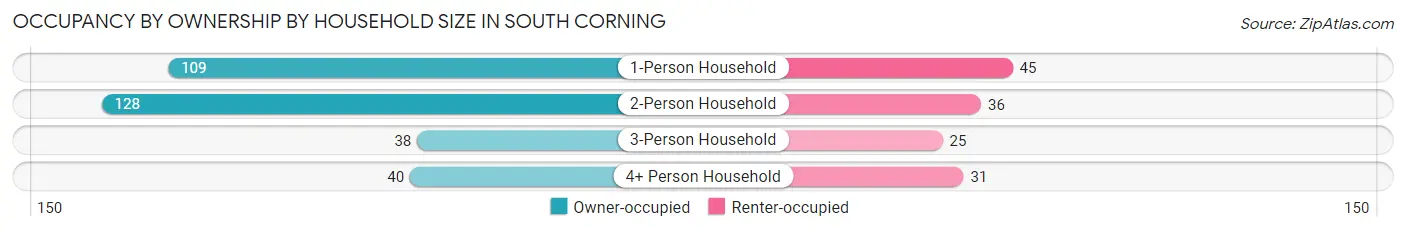
| Household Size | Owner-occupied | Renter-occupied |
| 1-Person Household | 109 (70.8%) | 45 (29.2%) |
| 2-Person Household | 128 (78.0%) | 36 (22.0%) |
| 3-Person Household | 38 (60.3%) | 25 (39.7%) |
| 4+ Person Household | 40 (56.3%) | 31 (43.7%) |
| Total Housing Units | 315 (69.7%) | 137 (30.3%) |
Occupancy by Educational Attainment in South Corning
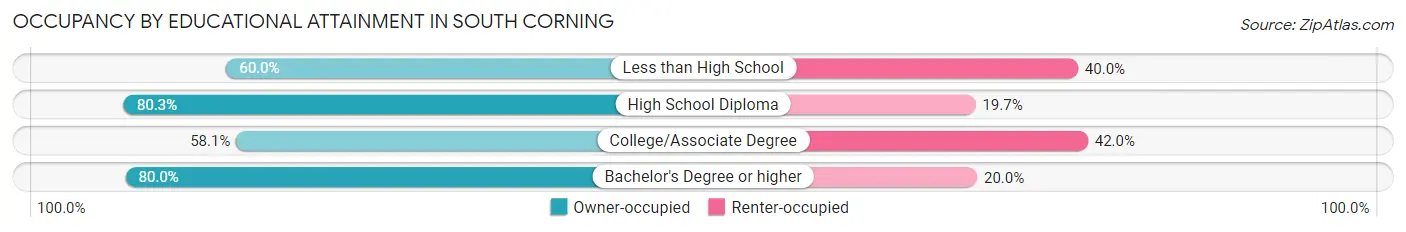
| Household Size | Owner-occupied | Renter-occupied |
| Less than High School | 6 (60.0%) | 4 (40.0%) |
| High School Diploma | 102 (80.3%) | 25 (19.7%) |
| College/Associate Degree | 119 (58.1%) | 86 (41.9%) |
| Bachelor's Degree or higher | 88 (80.0%) | 22 (20.0%) |
Occupancy by Age of Householder in South Corning
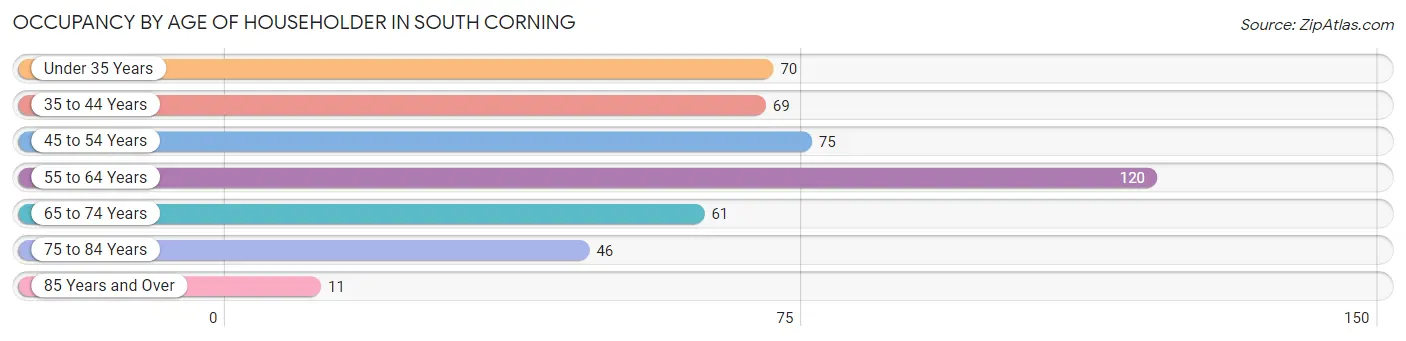
| Age Bracket | # Households | % Households |
| Under 35 Years | 70 | 15.5% |
| 35 to 44 Years | 69 | 15.3% |
| 45 to 54 Years | 75 | 16.6% |
| 55 to 64 Years | 120 | 26.6% |
| 65 to 74 Years | 61 | 13.5% |
| 75 to 84 Years | 46 | 10.2% |
| 85 Years and Over | 11 | 2.4% |
| Total | 452 | 100.0% |
Housing Finances in South Corning
Median Income by Occupancy in South Corning
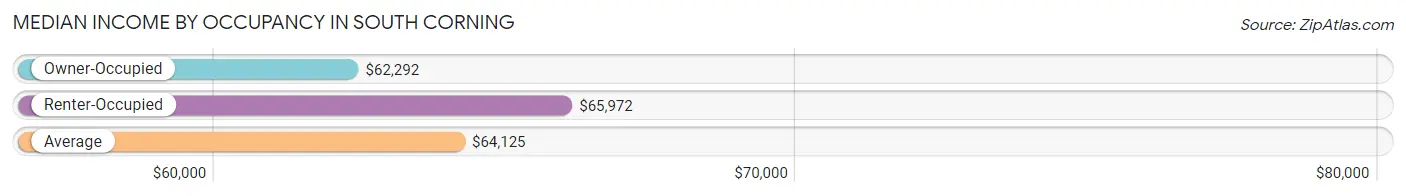
| Occupancy Type | # Households | Median Income |
| Owner-Occupied | 315 (69.7%) | $62,292 |
| Renter-Occupied | 137 (30.3%) | $65,972 |
| Average | 452 (100.0%) | $64,125 |
Occupancy by Householder Income Bracket in South Corning
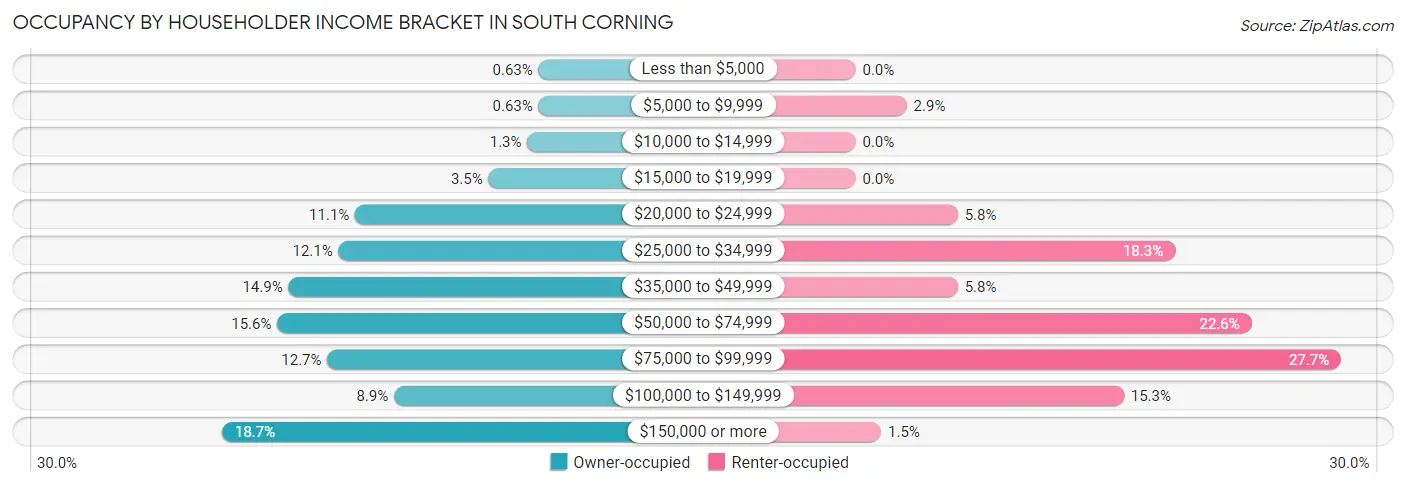
| Income Bracket | Owner-occupied | Renter-occupied |
| Less than $5,000 | 2 (0.6%) | 0 (0.0%) |
| $5,000 to $9,999 | 2 (0.6%) | 4 (2.9%) |
| $10,000 to $14,999 | 4 (1.3%) | 0 (0.0%) |
| $15,000 to $19,999 | 11 (3.5%) | 0 (0.0%) |
| $20,000 to $24,999 | 35 (11.1%) | 8 (5.8%) |
| $25,000 to $34,999 | 38 (12.1%) | 25 (18.2%) |
| $35,000 to $49,999 | 47 (14.9%) | 8 (5.8%) |
| $50,000 to $74,999 | 49 (15.6%) | 31 (22.6%) |
| $75,000 to $99,999 | 40 (12.7%) | 38 (27.7%) |
| $100,000 to $149,999 | 28 (8.9%) | 21 (15.3%) |
| $150,000 or more | 59 (18.7%) | 2 (1.5%) |
| Total | 315 (100.0%) | 137 (100.0%) |
Monthly Housing Cost Tiers in South Corning
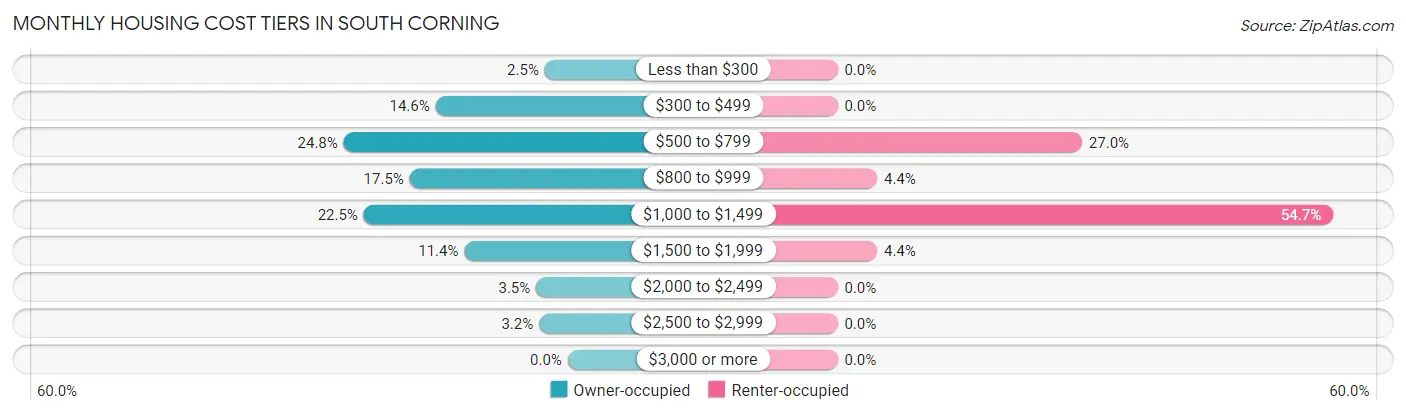
| Monthly Cost | Owner-occupied | Renter-occupied |
| Less than $300 | 8 (2.5%) | 0 (0.0%) |
| $300 to $499 | 46 (14.6%) | 0 (0.0%) |
| $500 to $799 | 78 (24.8%) | 37 (27.0%) |
| $800 to $999 | 55 (17.5%) | 6 (4.4%) |
| $1,000 to $1,499 | 71 (22.5%) | 75 (54.7%) |
| $1,500 to $1,999 | 36 (11.4%) | 6 (4.4%) |
| $2,000 to $2,499 | 11 (3.5%) | 0 (0.0%) |
| $2,500 to $2,999 | 10 (3.2%) | 0 (0.0%) |
| $3,000 or more | 0 (0.0%) | 0 (0.0%) |
| Total | 315 (100.0%) | 137 (100.0%) |
Physical Housing Characteristics in South Corning
Housing Structures in South Corning
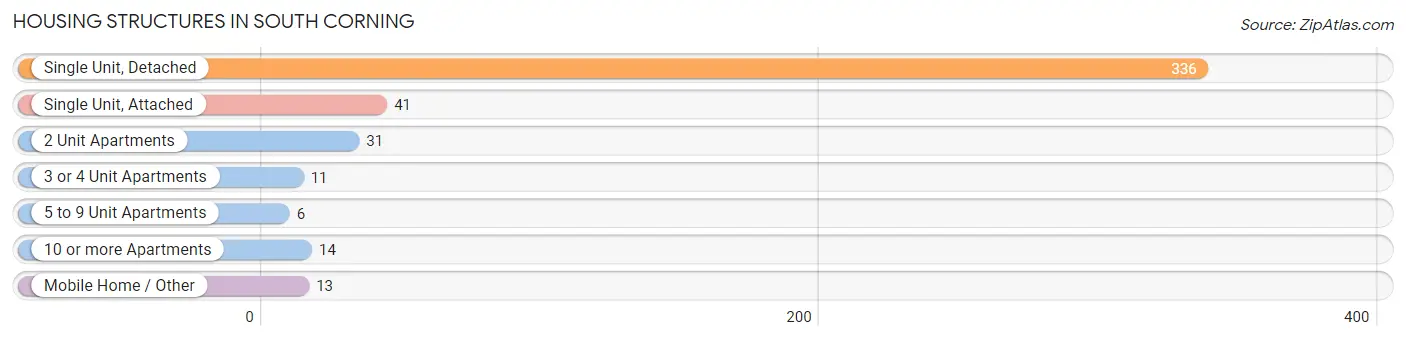
| Structure Type | # Housing Units | % Housing Units |
| Single Unit, Detached | 336 | 74.3% |
| Single Unit, Attached | 41 | 9.1% |
| 2 Unit Apartments | 31 | 6.9% |
| 3 or 4 Unit Apartments | 11 | 2.4% |
| 5 to 9 Unit Apartments | 6 | 1.3% |
| 10 or more Apartments | 14 | 3.1% |
| Mobile Home / Other | 13 | 2.9% |
| Total | 452 | 100.0% |
Housing Structures by Occupancy in South Corning
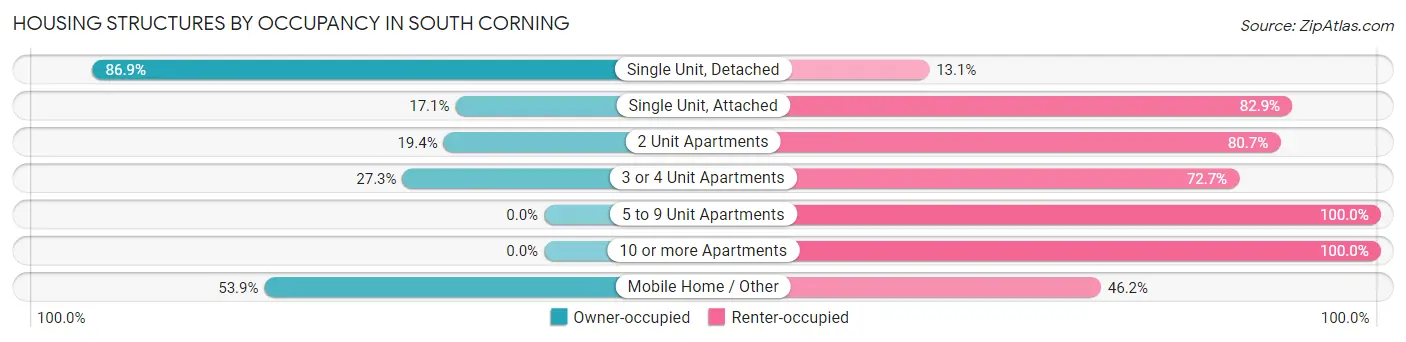
| Structure Type | Owner-occupied | Renter-occupied |
| Single Unit, Detached | 292 (86.9%) | 44 (13.1%) |
| Single Unit, Attached | 7 (17.1%) | 34 (82.9%) |
| 2 Unit Apartments | 6 (19.4%) | 25 (80.6%) |
| 3 or 4 Unit Apartments | 3 (27.3%) | 8 (72.7%) |
| 5 to 9 Unit Apartments | 0 (0.0%) | 6 (100.0%) |
| 10 or more Apartments | 0 (0.0%) | 14 (100.0%) |
| Mobile Home / Other | 7 (53.8%) | 6 (46.2%) |
| Total | 315 (69.7%) | 137 (30.3%) |
Housing Structures by Number of Rooms in South Corning
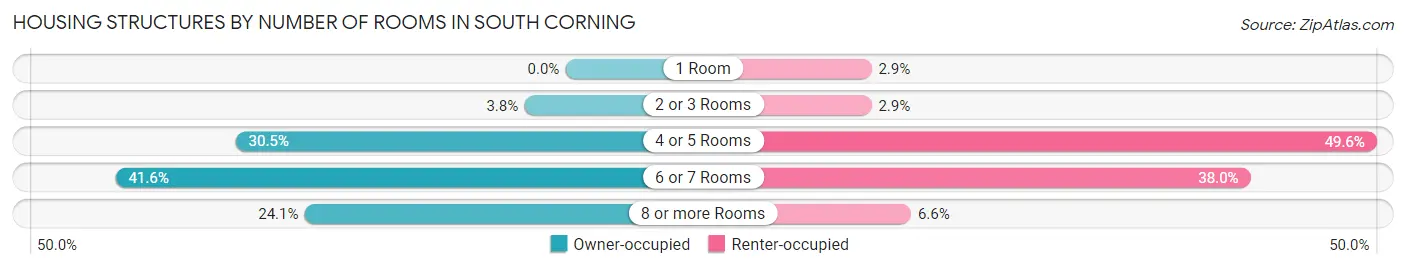
| Number of Rooms | Owner-occupied | Renter-occupied |
| 1 Room | 0 (0.0%) | 4 (2.9%) |
| 2 or 3 Rooms | 12 (3.8%) | 4 (2.9%) |
| 4 or 5 Rooms | 96 (30.5%) | 68 (49.6%) |
| 6 or 7 Rooms | 131 (41.6%) | 52 (38.0%) |
| 8 or more Rooms | 76 (24.1%) | 9 (6.6%) |
| Total | 315 (100.0%) | 137 (100.0%) |
Housing Structure by Heating Type in South Corning
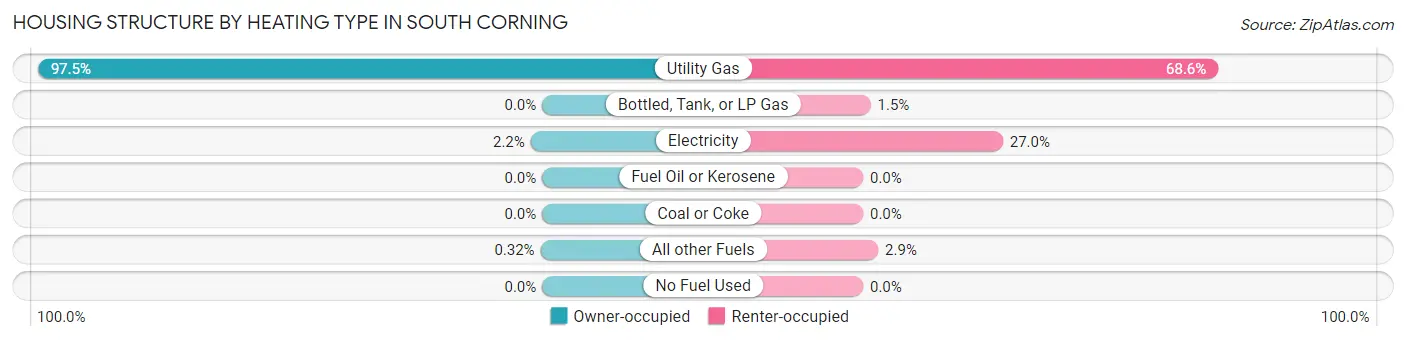
| Heating Type | Owner-occupied | Renter-occupied |
| Utility Gas | 307 (97.5%) | 94 (68.6%) |
| Bottled, Tank, or LP Gas | 0 (0.0%) | 2 (1.5%) |
| Electricity | 7 (2.2%) | 37 (27.0%) |
| Fuel Oil or Kerosene | 0 (0.0%) | 0 (0.0%) |
| Coal or Coke | 0 (0.0%) | 0 (0.0%) |
| All other Fuels | 1 (0.3%) | 4 (2.9%) |
| No Fuel Used | 0 (0.0%) | 0 (0.0%) |
| Total | 315 (100.0%) | 137 (100.0%) |
Household Vehicle Usage in South Corning
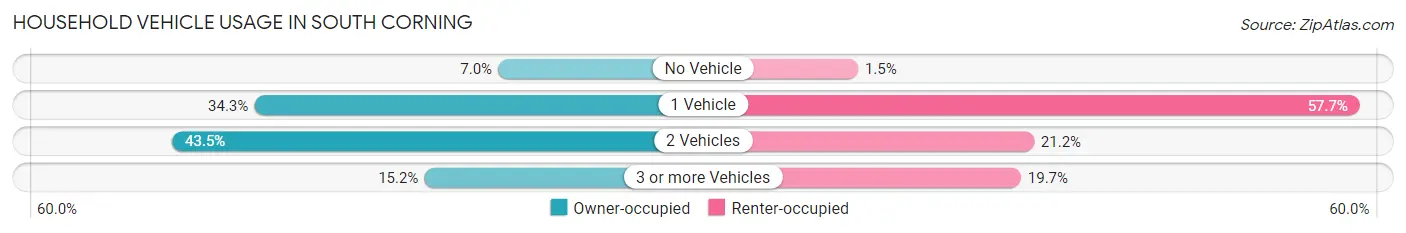
| Vehicles per Household | Owner-occupied | Renter-occupied |
| No Vehicle | 22 (7.0%) | 2 (1.5%) |
| 1 Vehicle | 108 (34.3%) | 79 (57.7%) |
| 2 Vehicles | 137 (43.5%) | 29 (21.2%) |
| 3 or more Vehicles | 48 (15.2%) | 27 (19.7%) |
| Total | 315 (100.0%) | 137 (100.0%) |
Real Estate & Mortgages in South Corning
Real Estate and Mortgage Overview in South Corning
| Characteristic | Without Mortgage | With Mortgage |
| Housing Units | 137 | 178 |
| Median Property Value | $108,500 | $134,900 |
| Median Household Income | $63,750 | $42 |
| Monthly Housing Costs | $562 | $0 |
| Real Estate Taxes | $2,924 | $7 |
Property Value by Mortgage Status in South Corning
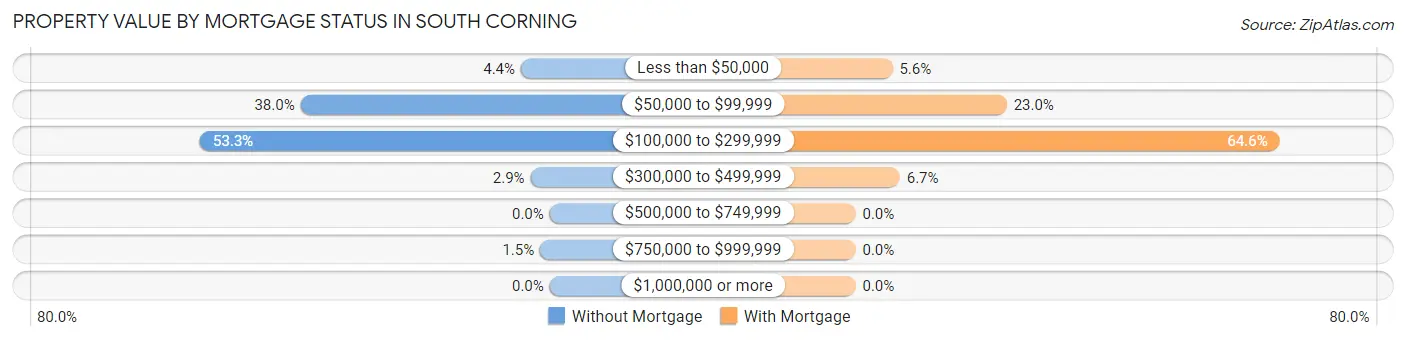
| Property Value | Without Mortgage | With Mortgage |
| Less than $50,000 | 6 (4.4%) | 10 (5.6%) |
| $50,000 to $99,999 | 52 (38.0%) | 41 (23.0%) |
| $100,000 to $299,999 | 73 (53.3%) | 115 (64.6%) |
| $300,000 to $499,999 | 4 (2.9%) | 12 (6.7%) |
| $500,000 to $749,999 | 0 (0.0%) | 0 (0.0%) |
| $750,000 to $999,999 | 2 (1.5%) | 0 (0.0%) |
| $1,000,000 or more | 0 (0.0%) | 0 (0.0%) |
| Total | 137 (100.0%) | 178 (100.0%) |
Household Income by Mortgage Status in South Corning
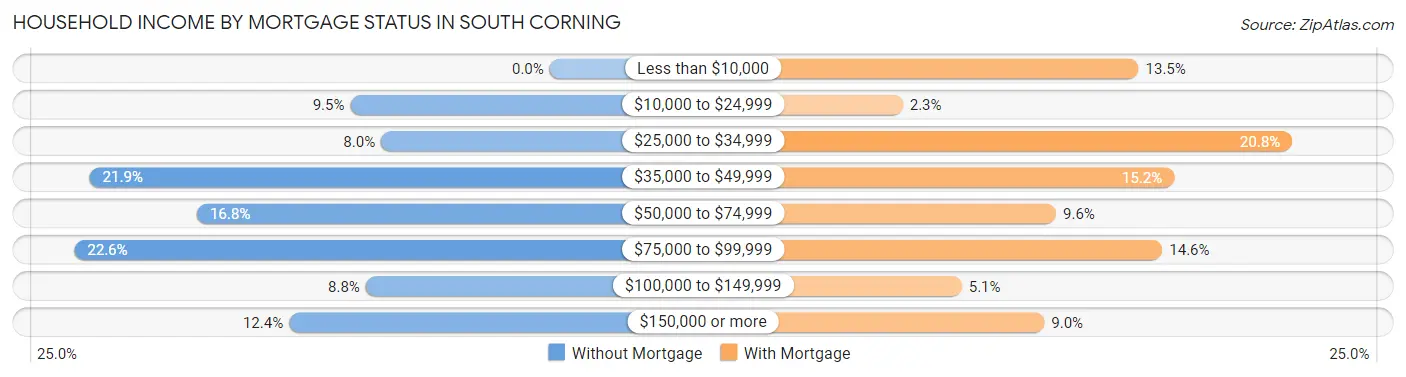
| Household Income | Without Mortgage | With Mortgage |
| Less than $10,000 | 0 (0.0%) | 24 (13.5%) |
| $10,000 to $24,999 | 13 (9.5%) | 4 (2.2%) |
| $25,000 to $34,999 | 11 (8.0%) | 37 (20.8%) |
| $35,000 to $49,999 | 30 (21.9%) | 27 (15.2%) |
| $50,000 to $74,999 | 23 (16.8%) | 17 (9.6%) |
| $75,000 to $99,999 | 31 (22.6%) | 26 (14.6%) |
| $100,000 to $149,999 | 12 (8.8%) | 9 (5.1%) |
| $150,000 or more | 17 (12.4%) | 16 (9.0%) |
| Total | 137 (100.0%) | 178 (100.0%) |
Property Value to Household Income Ratio in South Corning
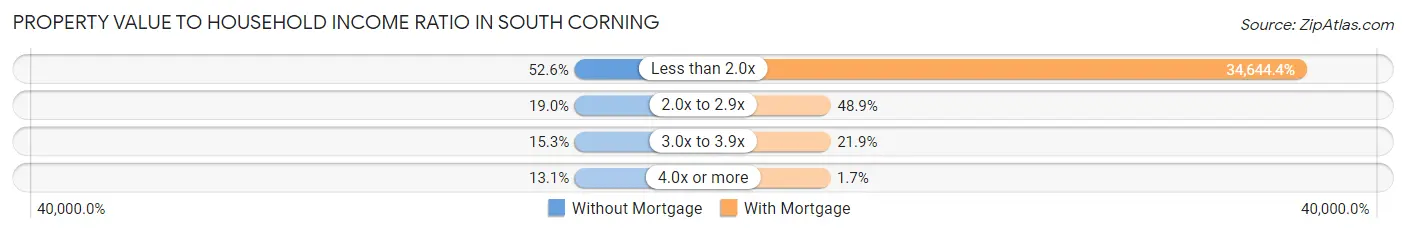
| Value-to-Income Ratio | Without Mortgage | With Mortgage |
| Less than 2.0x | 72 (52.5%) | 61,667 (34,644.4%) |
| 2.0x to 2.9x | 26 (19.0%) | 87 (48.9%) |
| 3.0x to 3.9x | 21 (15.3%) | 39 (21.9%) |
| 4.0x or more | 18 (13.1%) | 3 (1.7%) |
| Total | 137 (100.0%) | 178 (100.0%) |
Real Estate Taxes by Mortgage Status in South Corning
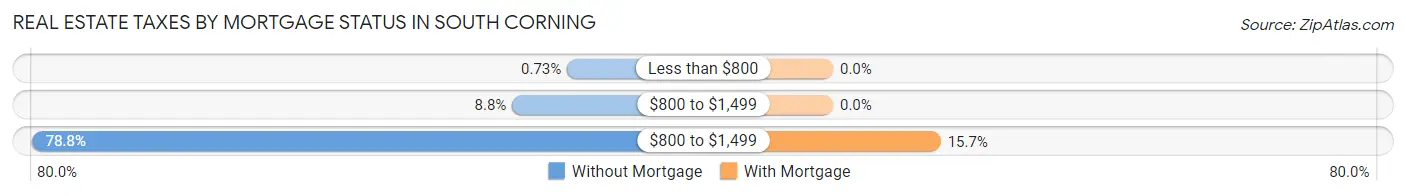
| Property Taxes | Without Mortgage | With Mortgage |
| Less than $800 | 1 (0.7%) | 0 (0.0%) |
| $800 to $1,499 | 12 (8.8%) | 0 (0.0%) |
| $800 to $1,499 | 108 (78.8%) | 28 (15.7%) |
| Total | 137 (100.0%) | 178 (100.0%) |
Health & Disability in South Corning
Health Insurance Coverage by Age in South Corning
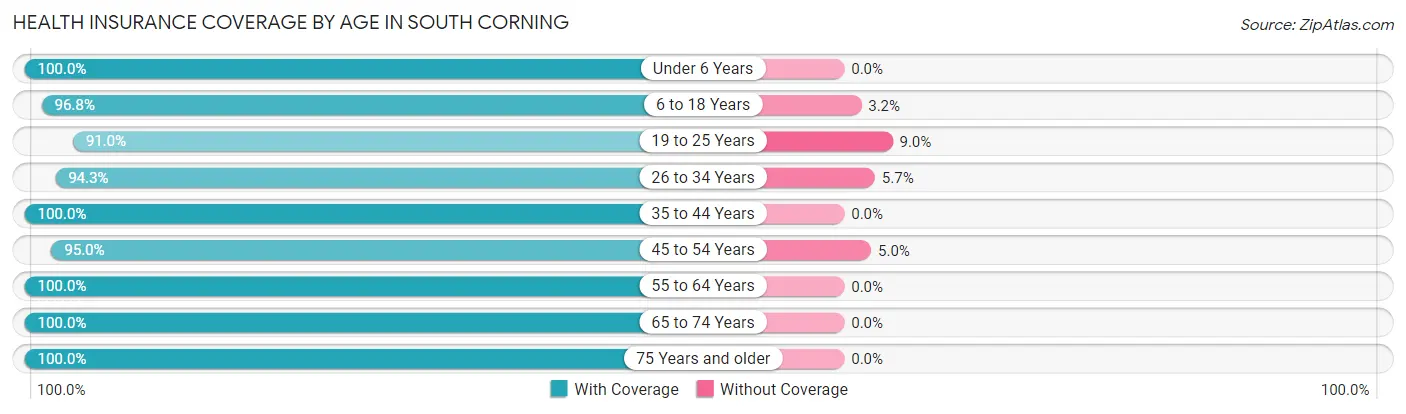
| Age Bracket | With Coverage | Without Coverage |
| Under 6 Years | 63 (100.0%) | 0 (0.0%) |
| 6 to 18 Years | 122 (96.8%) | 4 (3.2%) |
| 19 to 25 Years | 81 (91.0%) | 8 (9.0%) |
| 26 to 34 Years | 99 (94.3%) | 6 (5.7%) |
| 35 to 44 Years | 146 (100.0%) | 0 (0.0%) |
| 45 to 54 Years | 95 (95.0%) | 5 (5.0%) |
| 55 to 64 Years | 162 (100.0%) | 0 (0.0%) |
| 65 to 74 Years | 97 (100.0%) | 0 (0.0%) |
| 75 Years and older | 78 (100.0%) | 0 (0.0%) |
| Total | 943 (97.6%) | 23 (2.4%) |
Health Insurance Coverage by Citizenship Status in South Corning
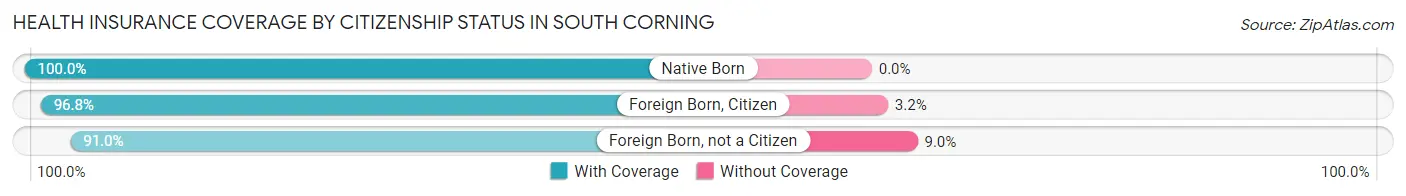
| Citizenship Status | With Coverage | Without Coverage |
| Native Born | 63 (100.0%) | 0 (0.0%) |
| Foreign Born, Citizen | 122 (96.8%) | 4 (3.2%) |
| Foreign Born, not a Citizen | 81 (91.0%) | 8 (9.0%) |
Health Insurance Coverage by Household Income in South Corning
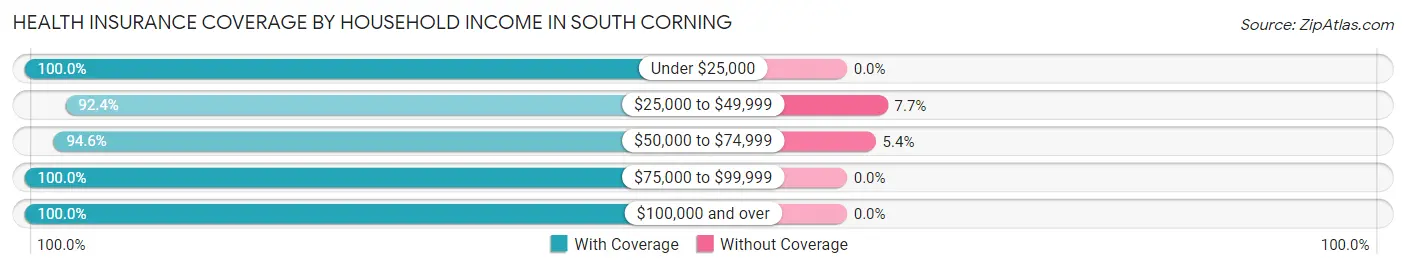
| Household Income | With Coverage | Without Coverage |
| Under $25,000 | 119 (100.0%) | 0 (0.0%) |
| $25,000 to $49,999 | 181 (92.3%) | 15 (7.6%) |
| $50,000 to $74,999 | 140 (94.6%) | 8 (5.4%) |
| $75,000 to $99,999 | 204 (100.0%) | 0 (0.0%) |
| $100,000 and over | 299 (100.0%) | 0 (0.0%) |
Public vs Private Health Insurance Coverage by Age in South Corning
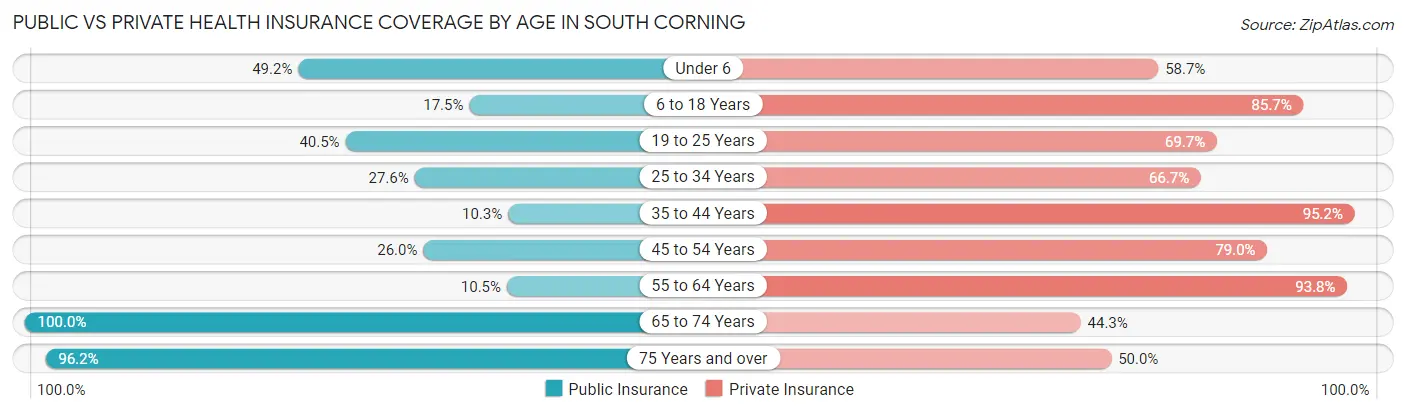
| Age Bracket | Public Insurance | Private Insurance |
| Under 6 | 31 (49.2%) | 37 (58.7%) |
| 6 to 18 Years | 22 (17.5%) | 108 (85.7%) |
| 19 to 25 Years | 36 (40.5%) | 62 (69.7%) |
| 25 to 34 Years | 29 (27.6%) | 70 (66.7%) |
| 35 to 44 Years | 15 (10.3%) | 139 (95.2%) |
| 45 to 54 Years | 26 (26.0%) | 79 (79.0%) |
| 55 to 64 Years | 17 (10.5%) | 152 (93.8%) |
| 65 to 74 Years | 97 (100.0%) | 43 (44.3%) |
| 75 Years and over | 75 (96.2%) | 39 (50.0%) |
| Total | 348 (36.0%) | 729 (75.5%) |
Disability Status by Sex by Age in South Corning
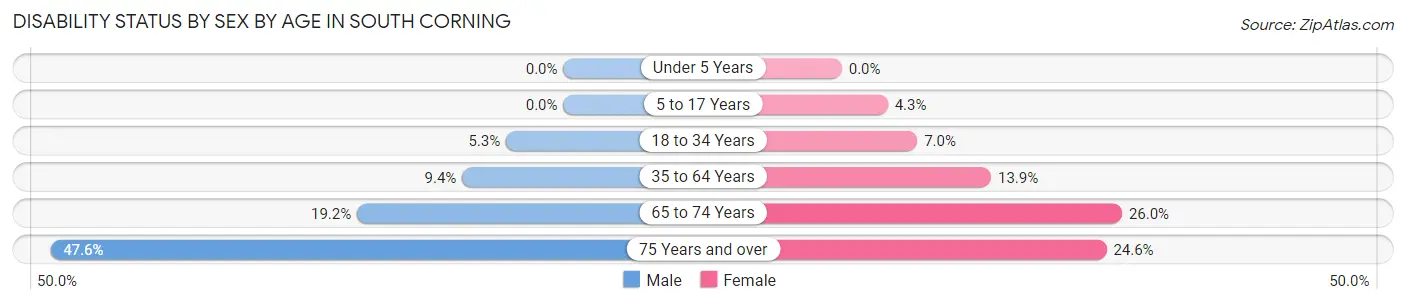
| Age Bracket | Male | Female |
| Under 5 Years | 0 (0.0%) | 0 (0.0%) |
| 5 to 17 Years | 0 (0.0%) | 4 (4.3%) |
| 18 to 34 Years | 5 (5.3%) | 7 (7.0%) |
| 35 to 64 Years | 20 (9.4%) | 27 (13.9%) |
| 65 to 74 Years | 9 (19.2%) | 13 (26.0%) |
| 75 Years and over | 10 (47.6%) | 14 (24.6%) |
Disability Class by Sex by Age in South Corning
Disability Class: Hearing Difficulty
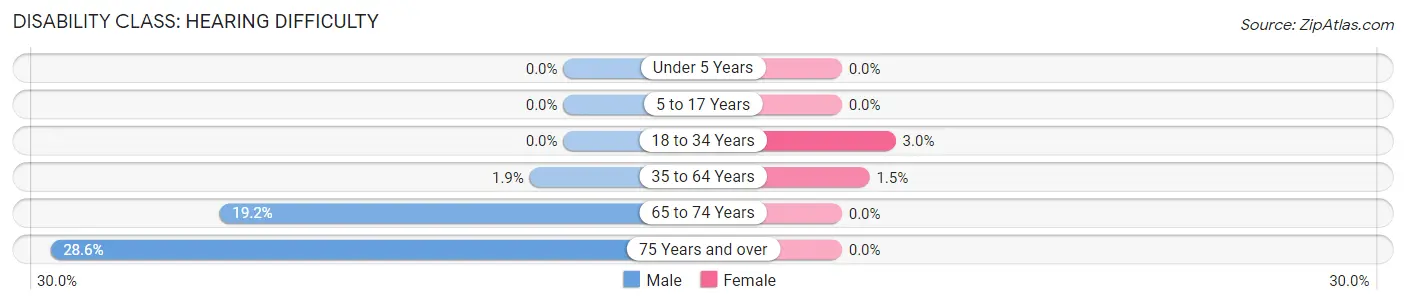
| Age Bracket | Male | Female |
| Under 5 Years | 0 (0.0%) | 0 (0.0%) |
| 5 to 17 Years | 0 (0.0%) | 0 (0.0%) |
| 18 to 34 Years | 0 (0.0%) | 3 (3.0%) |
| 35 to 64 Years | 4 (1.9%) | 3 (1.5%) |
| 65 to 74 Years | 9 (19.2%) | 0 (0.0%) |
| 75 Years and over | 6 (28.6%) | 0 (0.0%) |
Disability Class: Vision Difficulty
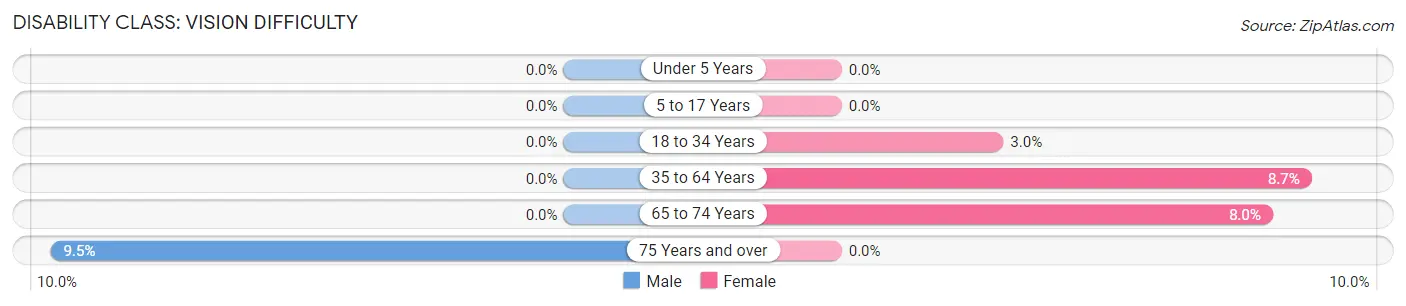
| Age Bracket | Male | Female |
| Under 5 Years | 0 (0.0%) | 0 (0.0%) |
| 5 to 17 Years | 0 (0.0%) | 0 (0.0%) |
| 18 to 34 Years | 0 (0.0%) | 3 (3.0%) |
| 35 to 64 Years | 0 (0.0%) | 17 (8.7%) |
| 65 to 74 Years | 0 (0.0%) | 4 (8.0%) |
| 75 Years and over | 2 (9.5%) | 0 (0.0%) |
Disability Class: Cognitive Difficulty
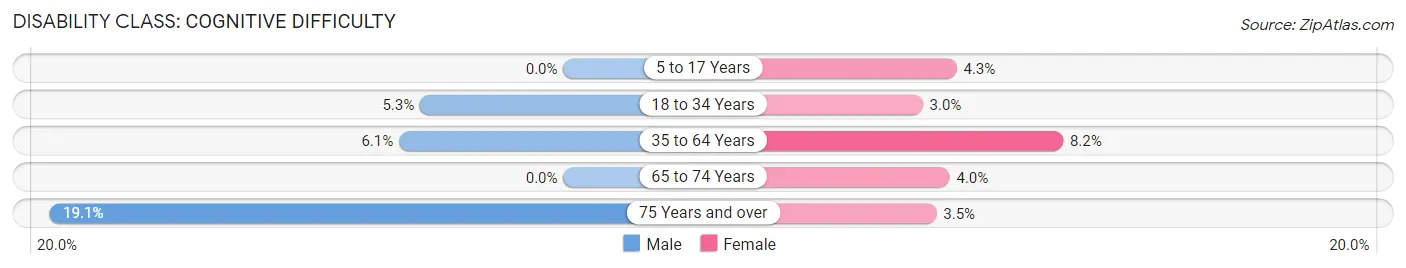
| Age Bracket | Male | Female |
| 5 to 17 Years | 0 (0.0%) | 4 (4.3%) |
| 18 to 34 Years | 5 (5.3%) | 3 (3.0%) |
| 35 to 64 Years | 13 (6.1%) | 16 (8.2%) |
| 65 to 74 Years | 0 (0.0%) | 2 (4.0%) |
| 75 Years and over | 4 (19.1%) | 2 (3.5%) |
Disability Class: Ambulatory Difficulty
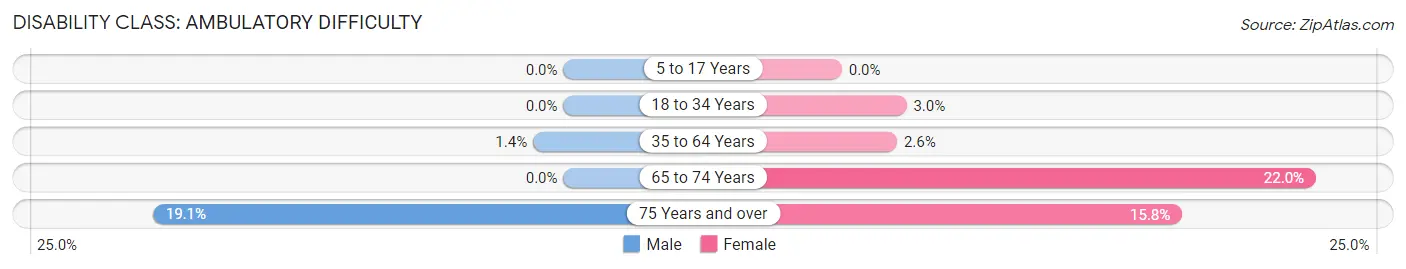
| Age Bracket | Male | Female |
| 5 to 17 Years | 0 (0.0%) | 0 (0.0%) |
| 18 to 34 Years | 0 (0.0%) | 3 (3.0%) |
| 35 to 64 Years | 3 (1.4%) | 5 (2.6%) |
| 65 to 74 Years | 0 (0.0%) | 11 (22.0%) |
| 75 Years and over | 4 (19.1%) | 9 (15.8%) |
Disability Class: Self-Care Difficulty
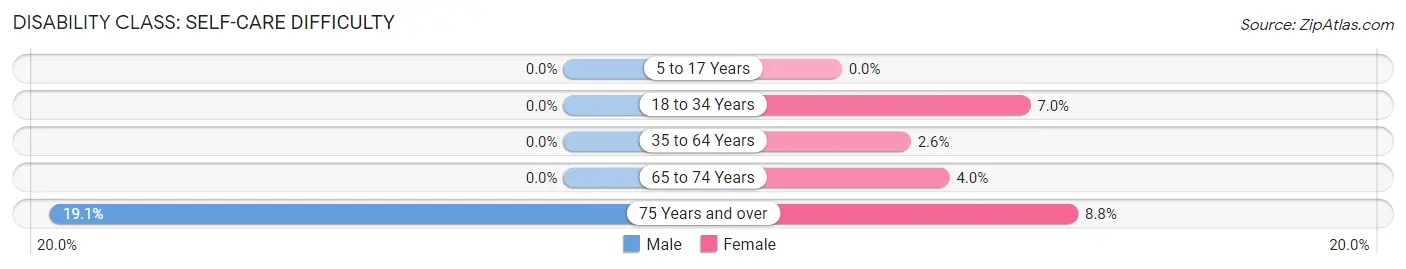
| Age Bracket | Male | Female |
| 5 to 17 Years | 0 (0.0%) | 0 (0.0%) |
| 18 to 34 Years | 0 (0.0%) | 7 (7.0%) |
| 35 to 64 Years | 0 (0.0%) | 5 (2.6%) |
| 65 to 74 Years | 0 (0.0%) | 2 (4.0%) |
| 75 Years and over | 4 (19.1%) | 5 (8.8%) |
Technology Access in South Corning
Computing Device Access in South Corning
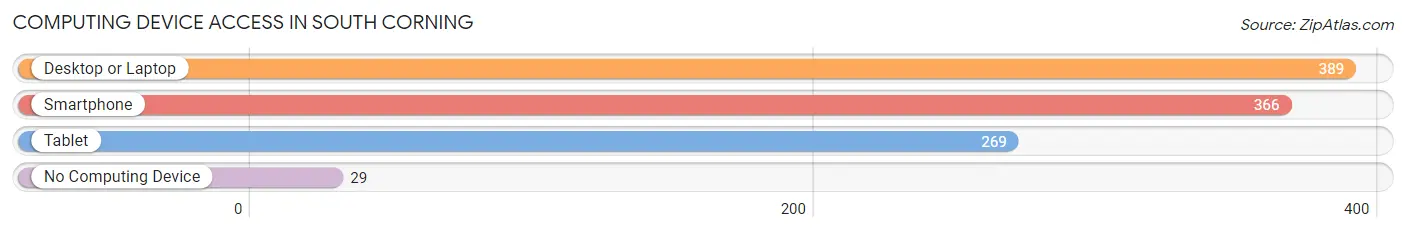
| Device Type | # Households | % Households |
| Desktop or Laptop | 389 | 86.1% |
| Smartphone | 366 | 81.0% |
| Tablet | 269 | 59.5% |
| No Computing Device | 29 | 6.4% |
| Total | 452 | 100.0% |
Internet Access in South Corning
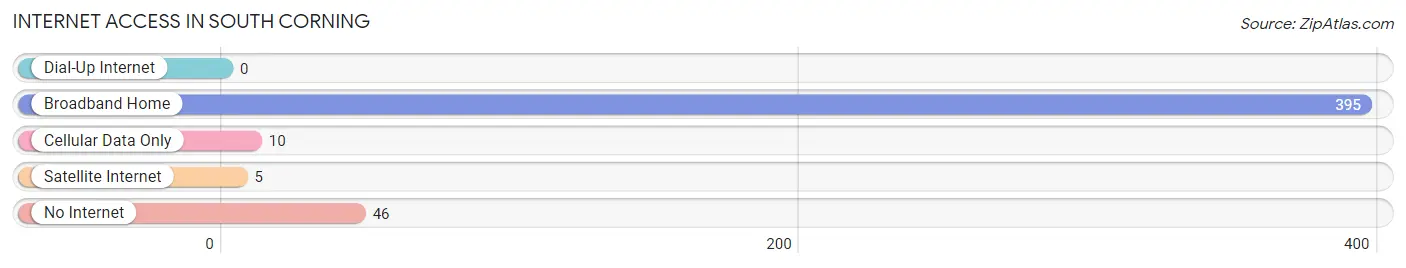
| Internet Type | # Households | % Households |
| Dial-Up Internet | 0 | 0.0% |
| Broadband Home | 395 | 87.4% |
| Cellular Data Only | 10 | 2.2% |
| Satellite Internet | 5 | 1.1% |
| No Internet | 46 | 10.2% |
| Total | 452 | 100.0% |
South Corning Summary
Corning, New York is a small city located in the Finger Lakes region of New York State. It is situated on the Chemung River, about 30 miles south of Elmira and about 60 miles south of Syracuse. The city is the county seat of Steuben County and is home to Corning Incorporated, a Fortune 500 company and the world’s leading manufacturer of glass and ceramics.
History
The area that is now Corning was first settled in 1796 by Zephaniah Platt, a Revolutionary War veteran from Connecticut. Platt purchased the land from the local Native American tribes and established a small settlement. The settlement was initially called the Town of Painted Post, after a nearby Native American post that was painted with symbols. In 1836, the settlement was renamed Corning, after Erastus Corning, a prominent Albany businessman and politician.
The city of Corning was officially incorporated in 1848. During the 19th century, the city grew rapidly, becoming an important center for glass and ceramics production. Corning Incorporated was founded in 1851 and quickly became the city’s largest employer. The company’s products, including Pyrex and CorningWare, were in high demand and helped to fuel the city’s growth.
In the early 20th century, Corning became a major center for the production of optical glass. The city was home to the Corning Glass Works, which produced lenses for eyeglasses, microscopes, and other optical instruments. The company also developed the first low-loss optical fiber, which revolutionized the telecommunications industry.
Geography
Corning is located in the Finger Lakes region of New York State. The city is situated on the Chemung River, about 30 miles south of Elmira and about 60 miles south of Syracuse. The city is surrounded by rolling hills and is located at the northern end of the Finger Lakes.
The city has a total area of 8.3 square miles, of which 8.2 square miles is land and 0.1 square miles is water. The terrain is mostly flat, with some hills in the northern and western parts of the city.
Economy
Corning’s economy is largely based on the manufacturing industry. The city is home to Corning Incorporated, a Fortune 500 company and the world’s leading manufacturer of glass and ceramics. The company’s products are used in a variety of industries, including telecommunications, automotive, aerospace, and medical.
In addition to Corning Incorporated, the city is home to several other major employers, including Corning Community College, Corning Hospital, and Corning-Painted Post School District. The city also has a thriving tourism industry, with several wineries, museums, and other attractions.
Demographics
As of the 2010 census, Corning had a population of 11,183. The city’s population is predominantly white (93.2%), with small percentages of African Americans (2.3%), Asians (1.3%), and other races (3.2%). The median household income is $41,945, and the median age is 40.
Corning is a diverse city, with a variety of religious denominations represented. The largest religious group is the Roman Catholic Church, followed by the United Methodist Church, the Episcopal Church, and the Lutheran Church. The city also has a large Jewish population.
Common Questions
What is Per Capita Income in South Corning?
Per Capita income in South Corning is $38,684.
What is the Median Family Income in South Corning?
Median Family Income in South Corning is $80,078.
What is the Median Household income in South Corning?
Median Household Income in South Corning is $64,125.
What is Income or Wage Gap in South Corning?
Income or Wage Gap in South Corning is 20.4%.
Women in South Corning earn 79.6 cents for every dollar earned by a man.
What is Inequality or Gini Index in South Corning?
Inequality or Gini Index in South Corning is 0.43.
What is the Total Population of South Corning?
Total Population of South Corning is 966.
What is the Total Male Population of South Corning?
Total Male Population of South Corning is 445.
What is the Total Female Population of South Corning?
Total Female Population of South Corning is 521.
What is the Ratio of Males per 100 Females in South Corning?
There are 85.41 Males per 100 Females in South Corning.
What is the Ratio of Females per 100 Males in South Corning?
There are 117.08 Females per 100 Males in South Corning.
What is the Median Population Age in South Corning?
Median Population Age in South Corning is 43.1 Years.
What is the Average Family Size in South Corning
Average Family Size in South Corning is 2.7 People.
What is the Average Household Size in South Corning
Average Household Size in South Corning is 2.1 People.
How Large is the Labor Force in South Corning?
There are 533 People in the Labor Forcein in South Corning.
What is the Percentage of People in the Labor Force in South Corning?
67.6% of People are in the Labor Force in South Corning.
What is the Unemployment Rate in South Corning?
Unemployment Rate in South Corning is 11.6%.