Zip Codes with the Highest Percentage of Population Employed in Architecture & Engineering in Poughkeepsie, NY
RELATED REPORTS & OPTIONS
Architecture & Engineering
Poughkeepsie
Compare Zip Codes
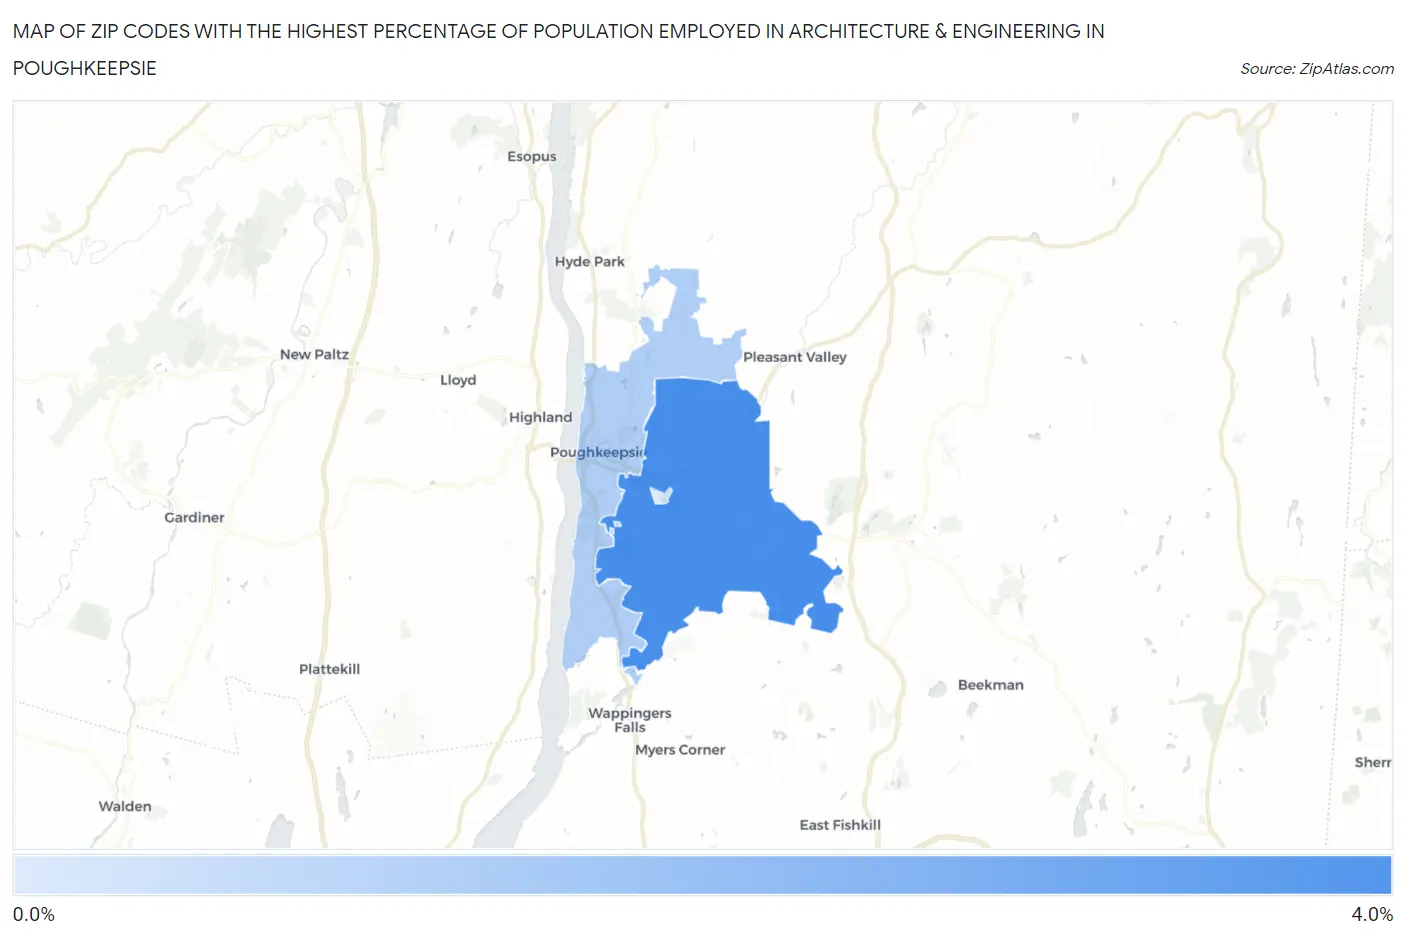
Map of Zip Codes with the Highest Percentage of Population Employed in Architecture & Engineering in Poughkeepsie
0.64%
3.1%
Zip Codes with the Highest Percentage of Population Employed in Architecture & Engineering in Poughkeepsie, NY
| Zip Code | % Employed | vs State | vs National | |
| 1. | 12603 | 3.1% | 1.6%(+1.46)#279 | 2.1%(+0.919)#4,817 |
| 2. | 12601 | 1.4% | 1.6%(-0.219)#774 | 2.1%(-0.757)#13,641 |
| 3. | 12604 | 0.64% | 1.6%(-0.975)#1,144 | 2.1%(-1.51)#19,359 |
1
Common Questions
What are the Top Zip Codes with the Highest Percentage of Population Employed in Architecture & Engineering in Poughkeepsie, NY?
Top Zip Codes with the Highest Percentage of Population Employed in Architecture & Engineering in Poughkeepsie, NY are:
What zip code has the Highest Percentage of Population Employed in Architecture & Engineering in Poughkeepsie, NY?
12603 has the Highest Percentage of Population Employed in Architecture & Engineering in Poughkeepsie, NY with 3.1%.
What is the Percentage of Population Employed in Architecture & Engineering in Poughkeepsie, NY?
Percentage of Population Employed in Architecture & Engineering in Poughkeepsie is 2.4%.
What is the Percentage of Population Employed in Architecture & Engineering in New York?
Percentage of Population Employed in Architecture & Engineering in New York is 1.6%.
What is the Percentage of Population Employed in Architecture & Engineering in the United States?
Percentage of Population Employed in Architecture & Engineering in the United States is 2.1%.