Niskayuna, NY Map & Demographics
Niskayuna Map
Niskayuna Overview
$58,180
PER CAPITA INCOME
$157,261
AVG FAMILY INCOME
$125,910
AVG HOUSEHOLD INCOME
40.1%
WAGE / INCOME GAP [ % ]
59.9¢/ $1
WAGE / INCOME GAP [ $ ]
0.37
INEQUALITY / GINI INDEX
20,629
TOTAL POPULATION
10,022
MALE POPULATION
10,607
FEMALE POPULATION
94.48
MALES / 100 FEMALES
105.84
FEMALES / 100 MALES
42.7
MEDIAN AGE
3.2
AVG FAMILY SIZE
2.6
AVG HOUSEHOLD SIZE
10,406
LABOR FORCE [ PEOPLE ]
65.0%
PERCENT IN LABOR FORCE
2.7%
UNEMPLOYMENT RATE
Niskayuna Area Codes
Income in Niskayuna
Income Overview in Niskayuna
Per Capita Income in Niskayuna is $58,180, while median incomes of families and households are $157,261 and $125,910 respectively.
| Characteristic | Number | Measure |
| Per Capita Income | 20,629 | $58,180 |
| Median Family Income | 5,443 | $157,261 |
| Mean Family Income | 5,443 | $175,404 |
| Median Household Income | 7,921 | $125,910 |
| Mean Household Income | 7,921 | $149,136 |
| Income Deficit | 5,443 | $0 |
| Wage / Income Gap (%) | 20,629 | 40.06% |
| Wage / Income Gap ($) | 20,629 | 59.94¢ per $1 |
| Gini / Inequality Index | 20,629 | 0.37 |
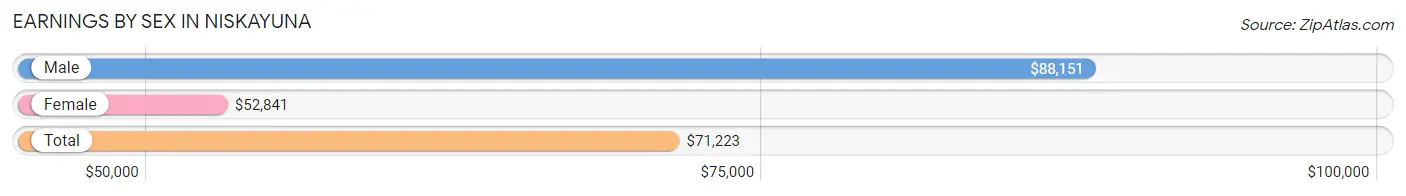
Earnings by Sex in Niskayuna
Average Earnings in Niskayuna are $71,223, $88,151 for men and $52,841 for women, a difference of 40.1%.
| Sex | Number | Average Earnings |
| Male | 5,669 (51.6%) | $88,151 |
| Female | 5,318 (48.4%) | $52,841 |
| Total | 10,987 (100.0%) | $71,223 |
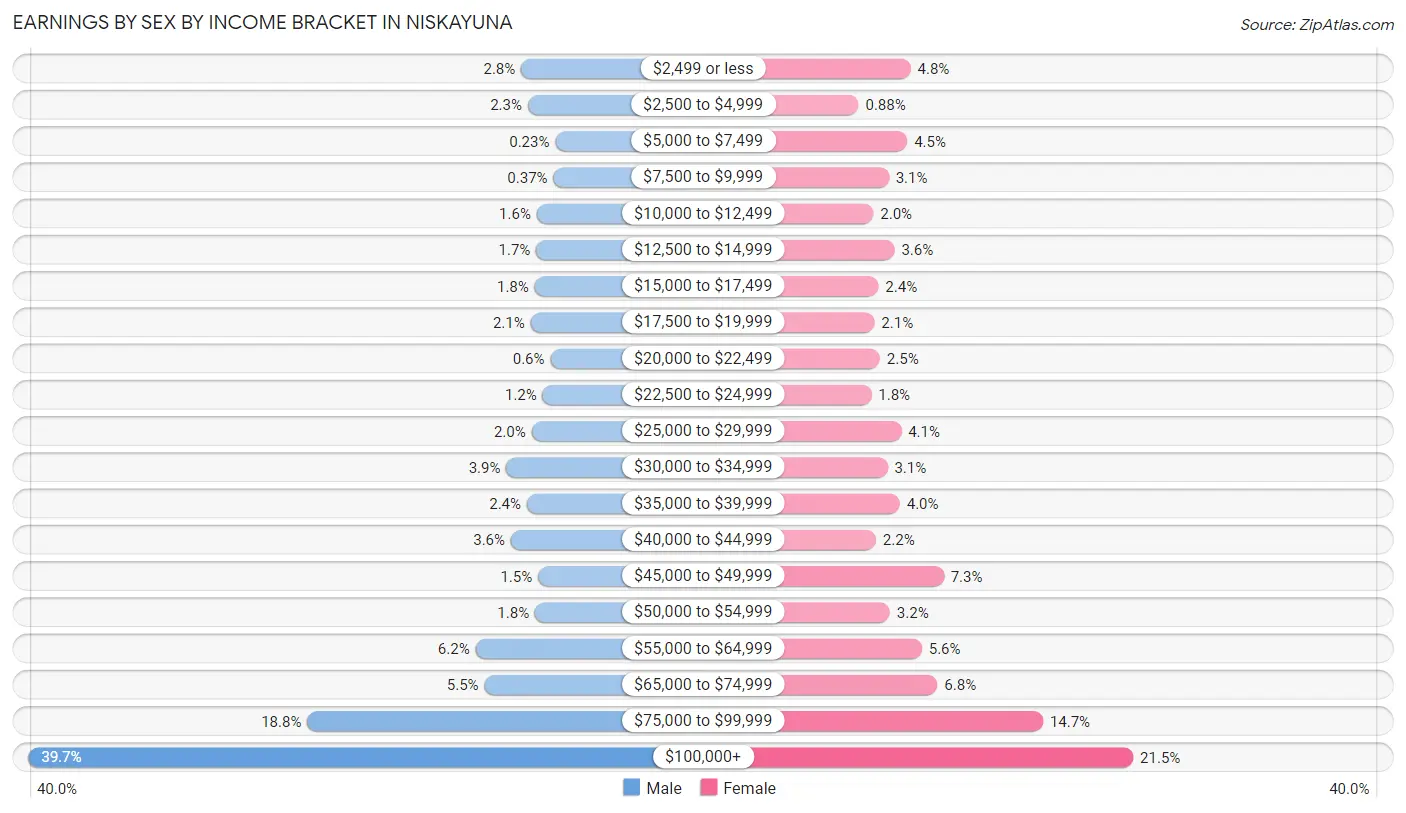
Earnings by Sex by Income Bracket in Niskayuna
The most common earnings brackets in Niskayuna are $100,000+ for men (2,252 | 39.7%) and $100,000+ for women (1,141 | 21.5%).
| Income | Male | Female |
| $2,499 or less | 158 (2.8%) | 254 (4.8%) |
| $2,500 to $4,999 | 130 (2.3%) | 47 (0.9%) |
| $5,000 to $7,499 | 13 (0.2%) | 241 (4.5%) |
| $7,500 to $9,999 | 21 (0.4%) | 167 (3.1%) |
| $10,000 to $12,499 | 92 (1.6%) | 106 (2.0%) |
| $12,500 to $14,999 | 94 (1.7%) | 190 (3.6%) |
| $15,000 to $17,499 | 101 (1.8%) | 126 (2.4%) |
| $17,500 to $19,999 | 118 (2.1%) | 110 (2.1%) |
| $20,000 to $22,499 | 34 (0.6%) | 132 (2.5%) |
| $22,500 to $24,999 | 67 (1.2%) | 98 (1.8%) |
| $25,000 to $29,999 | 114 (2.0%) | 217 (4.1%) |
| $30,000 to $34,999 | 221 (3.9%) | 162 (3.0%) |
| $35,000 to $39,999 | 134 (2.4%) | 211 (4.0%) |
| $40,000 to $44,999 | 202 (3.6%) | 116 (2.2%) |
| $45,000 to $49,999 | 86 (1.5%) | 386 (7.3%) |
| $50,000 to $54,999 | 99 (1.8%) | 172 (3.2%) |
| $55,000 to $64,999 | 352 (6.2%) | 299 (5.6%) |
| $65,000 to $74,999 | 314 (5.5%) | 361 (6.8%) |
| $75,000 to $99,999 | 1,067 (18.8%) | 782 (14.7%) |
| $100,000+ | 2,252 (39.7%) | 1,141 (21.5%) |
| Total | 5,669 (100.0%) | 5,318 (100.0%) |
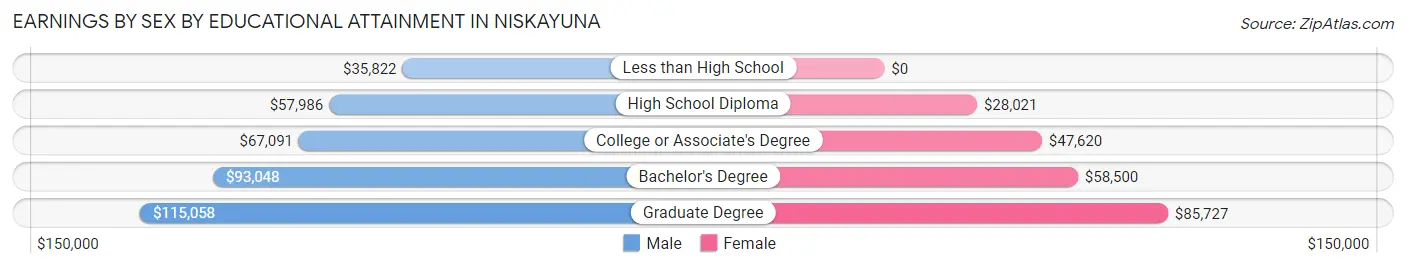
Earnings by Sex by Educational Attainment in Niskayuna
Average earnings in Niskayuna are $91,780 for men and $60,459 for women, a difference of 34.1%. Men with an educational attainment of graduate degree enjoy the highest average annual earnings of $115,058, while those with less than high school education earn the least with $35,822. Women with an educational attainment of graduate degree earn the most with the average annual earnings of $85,727, while those with high school diploma education have the smallest earnings of $28,021.
| Educational Attainment | Male Income | Female Income |
| Less than High School | $35,822 | $0 |
| High School Diploma | $57,986 | $28,021 |
| College or Associate's Degree | $67,091 | $47,620 |
| Bachelor's Degree | $93,048 | $58,500 |
| Graduate Degree | $115,058 | $85,727 |
| Total | $91,780 | $60,459 |
Family Income in Niskayuna
Family Income Brackets in Niskayuna
According to the Niskayuna family income data, there are 1,573 families falling into the $200,000+ income range, which is the most common income bracket and makes up 28.9% of all families. Conversely, the $10,000 to $14,999 income bracket is the least frequent group with only 5 families (0.1%) belonging to this category.
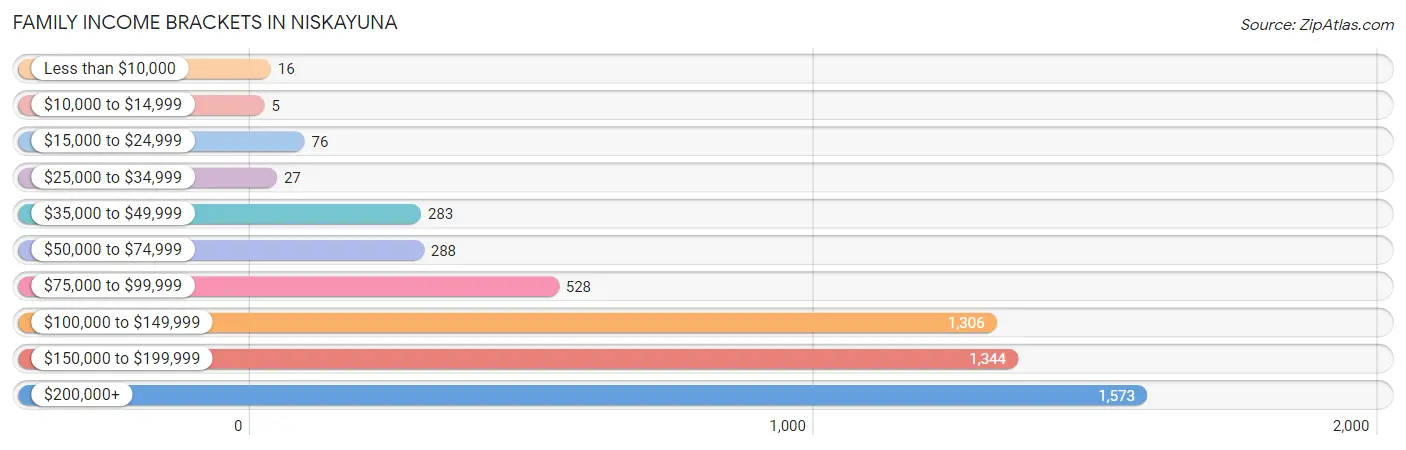
| Income Bracket | # Families | % Families |
| Less than $10,000 | 16 | 0.3% |
| $10,000 to $14,999 | 5 | 0.1% |
| $15,000 to $24,999 | 76 | 1.4% |
| $25,000 to $34,999 | 27 | 0.5% |
| $35,000 to $49,999 | 283 | 5.2% |
| $50,000 to $74,999 | 288 | 5.3% |
| $75,000 to $99,999 | 528 | 9.7% |
| $100,000 to $149,999 | 1,306 | 24.0% |
| $150,000 to $199,999 | 1,344 | 24.7% |
| $200,000+ | 1,573 | 28.9% |
Family Income by Famaliy Size in Niskayuna
6-person families (165 | 3.0%) account for the highest median family income in Niskayuna with $210,815 per family, while 2-person families (2,481 | 45.6%) have the highest median income of $66,444 per family member.
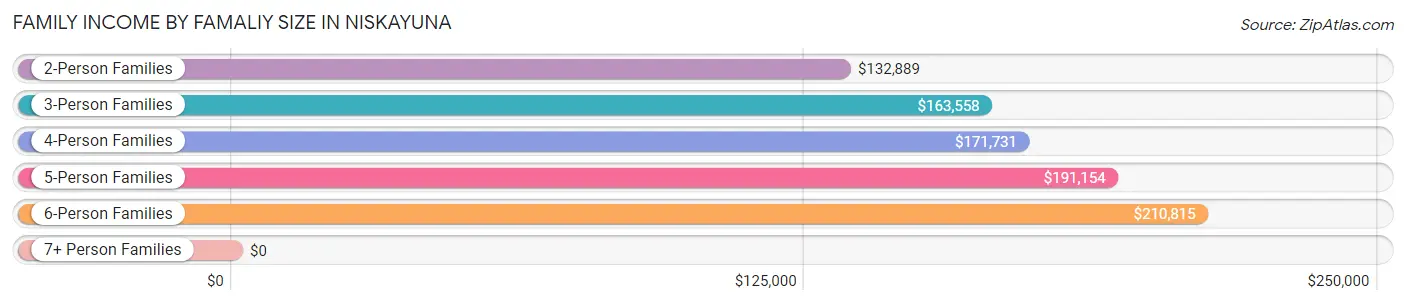
| Income Bracket | # Families | Median Income |
| 2-Person Families | 2,481 (45.6%) | $132,889 |
| 3-Person Families | 1,065 (19.6%) | $163,558 |
| 4-Person Families | 1,264 (23.2%) | $171,731 |
| 5-Person Families | 450 (8.3%) | $191,154 |
| 6-Person Families | 165 (3.0%) | $210,815 |
| 7+ Person Families | 18 (0.3%) | $0 |
| Total | 5,443 (100.0%) | $157,261 |
Family Income by Number of Earners in Niskayuna
The median family income in Niskayuna is $157,261, with families comprising 3+ earners (525) having the highest median family income of $177,316, while families with no earners (800) have the lowest median family income of $115,167, accounting for 9.7% and 14.7% of families, respectively.
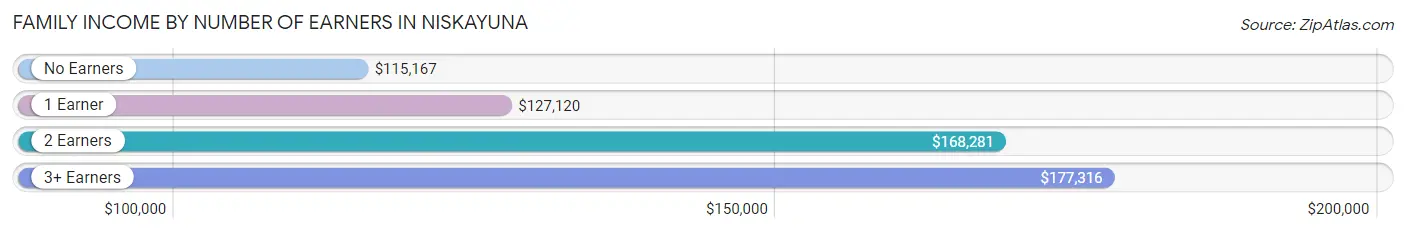
| Number of Earners | # Families | Median Income |
| No Earners | 800 (14.7%) | $115,167 |
| 1 Earner | 1,273 (23.4%) | $127,120 |
| 2 Earners | 2,845 (52.3%) | $168,281 |
| 3+ Earners | 525 (9.7%) | $177,316 |
| Total | 5,443 (100.0%) | $157,261 |
Household Income in Niskayuna
Household Income Brackets in Niskayuna
With 1,814 households falling in the category, the $100,000 to $149,999 income range is the most frequent in Niskayuna, accounting for 22.9% of all households. In contrast, only 95 households (1.2%) fall into the $15,000 to $24,999 income bracket, making it the least populous group.
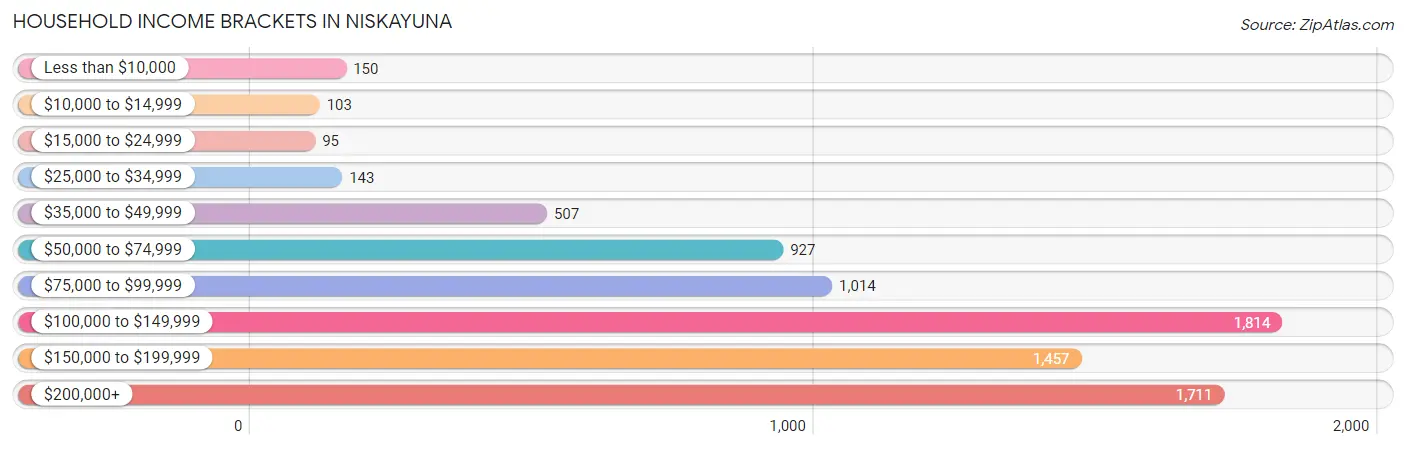
| Income Bracket | # Households | % Households |
| Less than $10,000 | 150 | 1.9% |
| $10,000 to $14,999 | 103 | 1.3% |
| $15,000 to $24,999 | 95 | 1.2% |
| $25,000 to $34,999 | 143 | 1.8% |
| $35,000 to $49,999 | 507 | 6.4% |
| $50,000 to $74,999 | 927 | 11.7% |
| $75,000 to $99,999 | 1,014 | 12.8% |
| $100,000 to $149,999 | 1,814 | 22.9% |
| $150,000 to $199,999 | 1,457 | 18.4% |
| $200,000+ | 1,711 | 21.6% |
Household Income by Householder Age in Niskayuna
The median household income in Niskayuna is $125,910, with the highest median household income of $145,547 found in the 45 to 64 years age bracket for the primary householder. A total of 3,035 households (38.3%) fall into this category. Meanwhile, the 15 to 24 years age bracket for the primary householder has the lowest median household income of $0, with 49 households (0.6%) in this group.
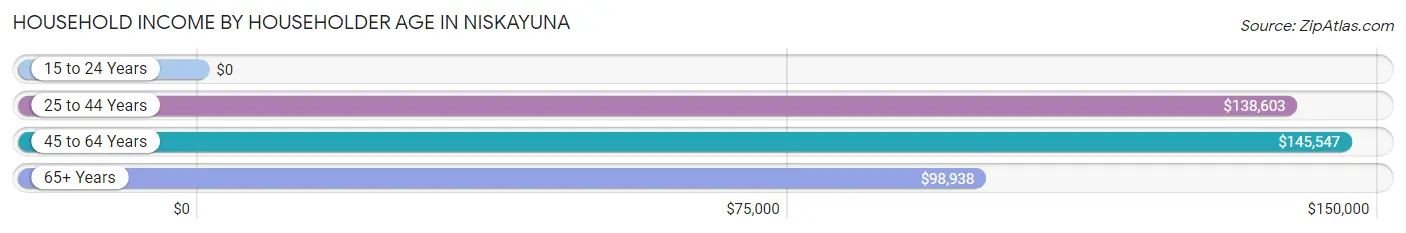
| Income Bracket | # Households | Median Income |
| 15 to 24 Years | 49 (0.6%) | $0 |
| 25 to 44 Years | 2,454 (31.0%) | $138,603 |
| 45 to 64 Years | 3,035 (38.3%) | $145,547 |
| 65+ Years | 2,383 (30.1%) | $98,938 |
| Total | 7,921 (100.0%) | $125,910 |
Poverty in Niskayuna
Income Below Poverty by Sex and Age in Niskayuna
With 2.1% poverty level for males and 3.0% for females among the residents of Niskayuna, 5 year old males and 65 to 74 year old females are the most vulnerable to poverty, with 24 males (18.6%) and 104 females (8.0%) in their respective age groups living below the poverty level.
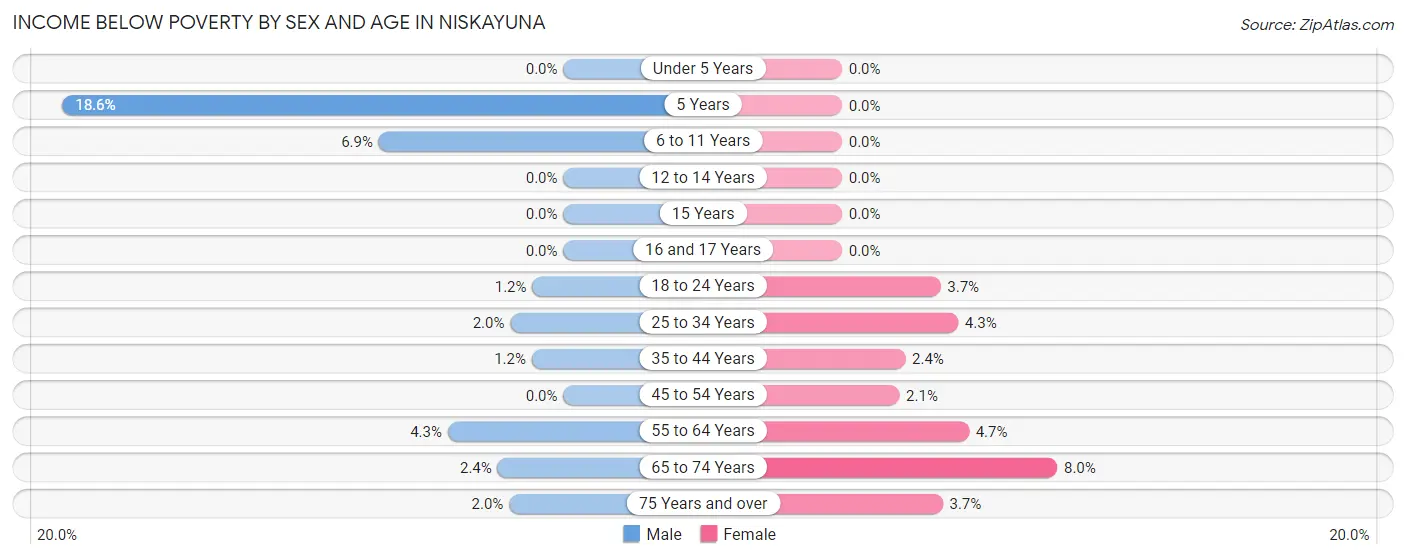
| Age Bracket | Male | Female |
| Under 5 Years | 0 (0.0%) | 0 (0.0%) |
| 5 Years | 24 (18.6%) | 0 (0.0%) |
| 6 to 11 Years | 48 (6.9%) | 0 (0.0%) |
| 12 to 14 Years | 0 (0.0%) | 0 (0.0%) |
| 15 Years | 0 (0.0%) | 0 (0.0%) |
| 16 and 17 Years | 0 (0.0%) | 0 (0.0%) |
| 18 to 24 Years | 3 (1.1%) | 20 (3.7%) |
| 25 to 34 Years | 16 (2.0%) | 35 (4.3%) |
| 35 to 44 Years | 20 (1.2%) | 36 (2.4%) |
| 45 to 54 Years | 0 (0.0%) | 31 (2.1%) |
| 55 to 64 Years | 62 (4.3%) | 61 (4.7%) |
| 65 to 74 Years | 25 (2.4%) | 104 (8.0%) |
| 75 Years and over | 13 (2.0%) | 31 (3.7%) |
| Total | 211 (2.1%) | 318 (3.0%) |
Income Above Poverty by Sex and Age in Niskayuna
According to the poverty statistics in Niskayuna, males aged under 5 years and females aged under 5 years are the age groups that are most secure financially, with 100.0% of males and 100.0% of females in these age groups living above the poverty line.
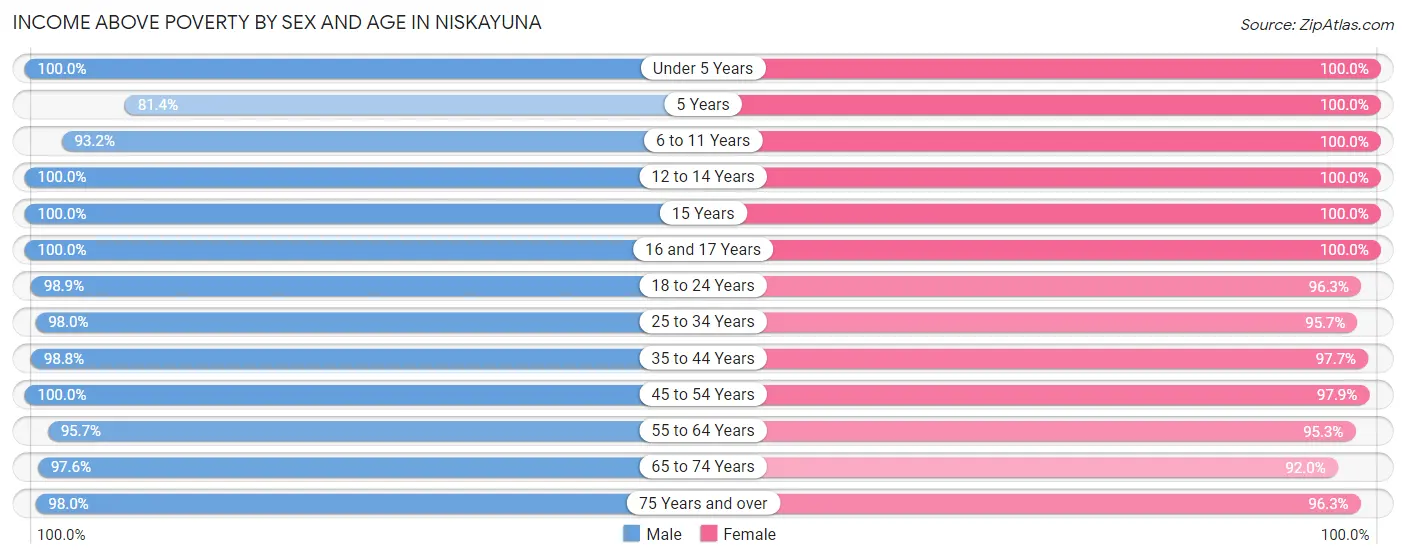
| Age Bracket | Male | Female |
| Under 5 Years | 729 (100.0%) | 430 (100.0%) |
| 5 Years | 105 (81.4%) | 159 (100.0%) |
| 6 to 11 Years | 653 (93.1%) | 1,122 (100.0%) |
| 12 to 14 Years | 558 (100.0%) | 395 (100.0%) |
| 15 Years | 264 (100.0%) | 114 (100.0%) |
| 16 and 17 Years | 244 (100.0%) | 462 (100.0%) |
| 18 to 24 Years | 258 (98.9%) | 526 (96.3%) |
| 25 to 34 Years | 798 (98.0%) | 778 (95.7%) |
| 35 to 44 Years | 1,690 (98.8%) | 1,494 (97.7%) |
| 45 to 54 Years | 1,425 (100.0%) | 1,422 (97.9%) |
| 55 to 64 Years | 1,383 (95.7%) | 1,234 (95.3%) |
| 65 to 74 Years | 999 (97.6%) | 1,197 (92.0%) |
| 75 Years and over | 635 (98.0%) | 798 (96.3%) |
| Total | 9,741 (97.9%) | 10,131 (97.0%) |
Income Below Poverty Among Married-Couple Families in Niskayuna
The poverty statistics for married-couple families in Niskayuna show that 0.8% or 39 of the total 4,807 families live below the poverty line. Families with no children have the highest poverty rate of 1.6%, comprising of 39 families. On the other hand, families with 1 or 2 children have the lowest poverty rate of 0.0%, which includes 0 families.
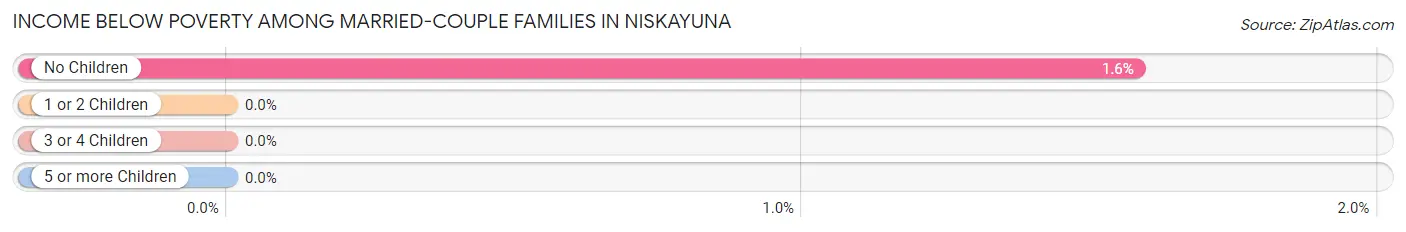
| Children | Above Poverty | Below Poverty |
| No Children | 2,429 (98.4%) | 39 (1.6%) |
| 1 or 2 Children | 1,867 (100.0%) | 0 (0.0%) |
| 3 or 4 Children | 472 (100.0%) | 0 (0.0%) |
| 5 or more Children | 0 (0.0%) | 0 (0.0%) |
| Total | 4,768 (99.2%) | 39 (0.8%) |
Income Below Poverty Among Single-Parent Households in Niskayuna
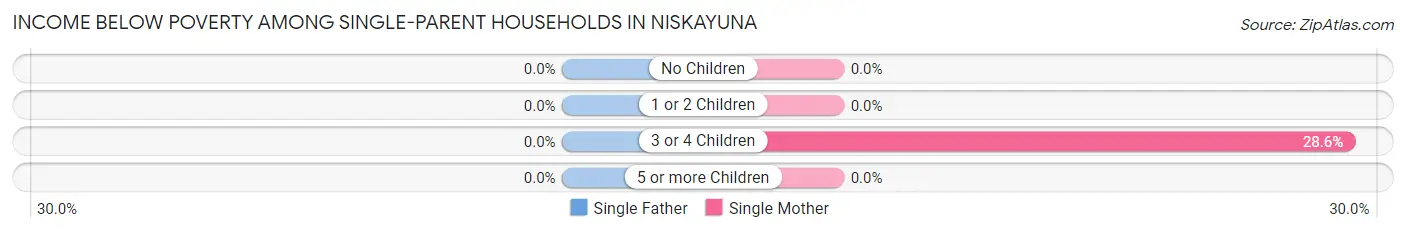
| Children | Single Father | Single Mother |
| No Children | 0 (0.0%) | 0 (0.0%) |
| 1 or 2 Children | 0 (0.0%) | 0 (0.0%) |
| 3 or 4 Children | 0 (0.0%) | 12 (28.6%) |
| 5 or more Children | 0 (0.0%) | 0 (0.0%) |
| Total | 0 (0.0%) | 12 (2.9%) |
Income Below Poverty Among Married-Couple vs Single-Parent Households in Niskayuna
The poverty data for Niskayuna shows that 39 of the married-couple family households (0.8%) and 12 of the single-parent households (1.9%) are living below the poverty level. Within the married-couple family households, those with no children have the highest poverty rate, with 39 households (1.6%) falling below the poverty line. Among the single-parent households, those with 3 or 4 children have the highest poverty rate, with 12 household (28.6%) living below poverty.
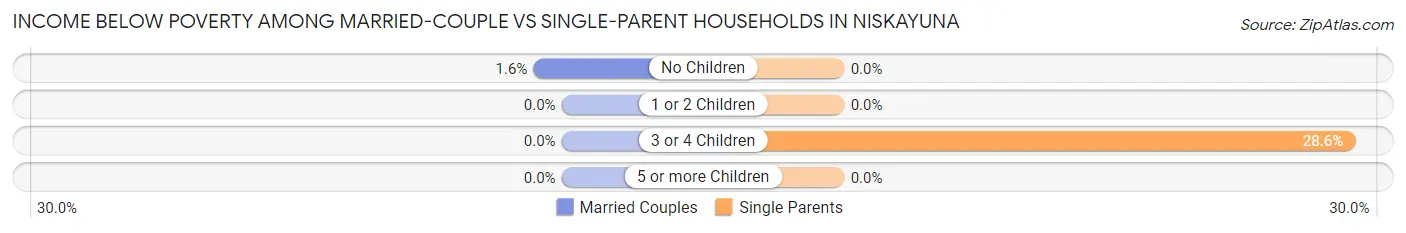
| Children | Married-Couple Families | Single-Parent Households |
| No Children | 39 (1.6%) | 0 (0.0%) |
| 1 or 2 Children | 0 (0.0%) | 0 (0.0%) |
| 3 or 4 Children | 0 (0.0%) | 12 (28.6%) |
| 5 or more Children | 0 (0.0%) | 0 (0.0%) |
| Total | 39 (0.8%) | 12 (1.9%) |
Race in Niskayuna
The most populous races in Niskayuna are White / Caucasian (16,571 | 80.3%), Asian (1,825 | 8.8%), and Two or more Races (1,431 | 6.9%).
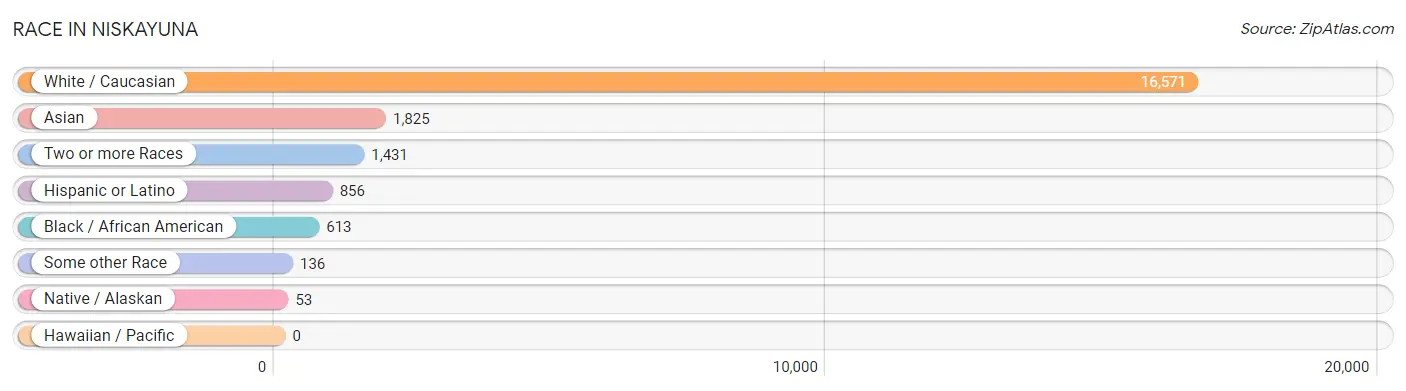
| Race | # Population | % Population |
| Asian | 1,825 | 8.8% |
| Black / African American | 613 | 3.0% |
| Hawaiian / Pacific | 0 | 0.0% |
| Hispanic or Latino | 856 | 4.2% |
| Native / Alaskan | 53 | 0.3% |
| White / Caucasian | 16,571 | 80.3% |
| Two or more Races | 1,431 | 6.9% |
| Some other Race | 136 | 0.7% |
| Total | 20,629 | 100.0% |
Ancestry in Niskayuna
The most populous ancestries reported in Niskayuna are Italian (4,386 | 21.3%), Irish (4,134 | 20.0%), German (2,815 | 13.7%), English (2,240 | 10.9%), and American (1,312 | 6.4%), together accounting for 72.2% of all Niskayuna residents.
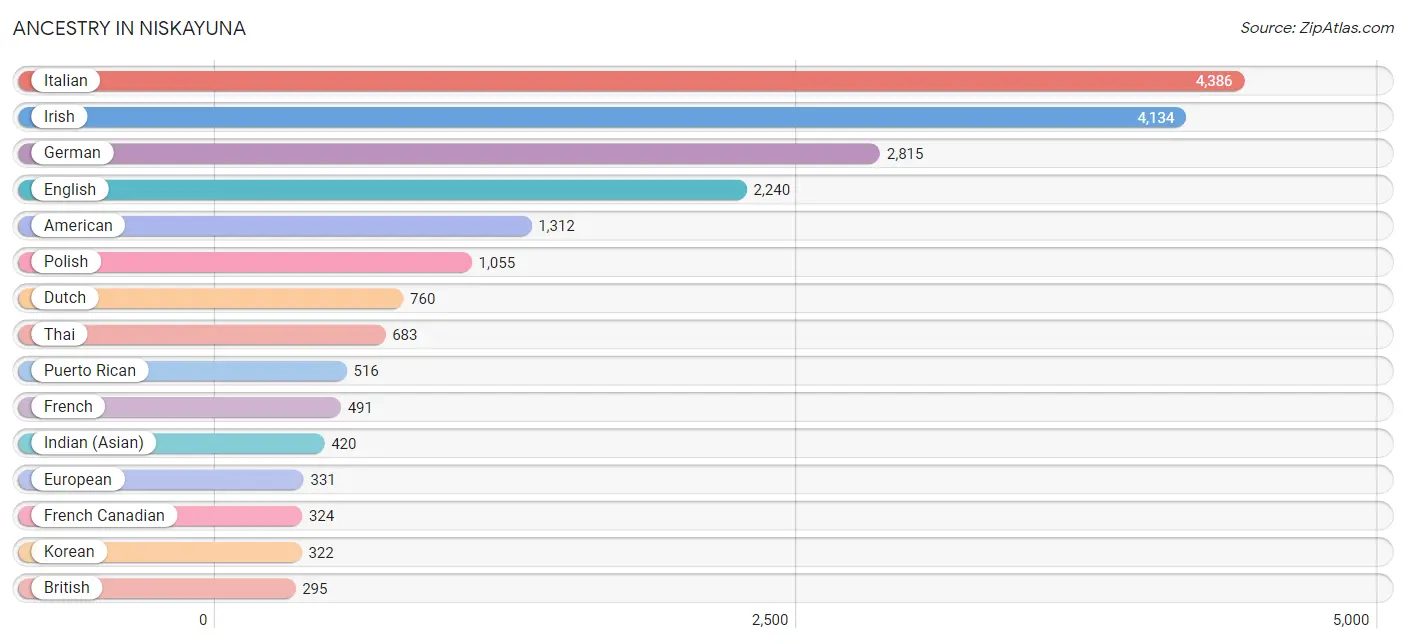
| Ancestry | # Population | % Population |
| African | 26 | 0.1% |
| American | 1,312 | 6.4% |
| Arab | 50 | 0.2% |
| Austrian | 97 | 0.5% |
| Belgian | 20 | 0.1% |
| Bhutanese | 75 | 0.4% |
| Blackfeet | 81 | 0.4% |
| Bolivian | 14 | 0.1% |
| British | 295 | 1.4% |
| Burmese | 235 | 1.1% |
| Canadian | 56 | 0.3% |
| Central American | 29 | 0.1% |
| Central American Indian | 53 | 0.3% |
| Chilean | 75 | 0.4% |
| Colombian | 17 | 0.1% |
| Costa Rican | 12 | 0.1% |
| Cuban | 6 | 0.0% |
| Czech | 30 | 0.2% |
| Danish | 23 | 0.1% |
| Dutch | 760 | 3.7% |
| Eastern European | 261 | 1.3% |
| Ecuadorian | 82 | 0.4% |
| Egyptian | 13 | 0.1% |
| English | 2,240 | 10.9% |
| European | 331 | 1.6% |
| Filipino | 16 | 0.1% |
| French | 491 | 2.4% |
| French Canadian | 324 | 1.6% |
| German | 2,815 | 13.7% |
| Ghanaian | 5 | 0.0% |
| Greek | 55 | 0.3% |
| Guyanese | 207 | 1.0% |
| Hungarian | 218 | 1.1% |
| Indian (Asian) | 420 | 2.0% |
| Indonesian | 52 | 0.3% |
| Irish | 4,134 | 20.0% |
| Italian | 4,386 | 21.3% |
| Jamaican | 34 | 0.2% |
| Kiowa | 81 | 0.4% |
| Korean | 322 | 1.6% |
| Lebanese | 50 | 0.2% |
| Lithuanian | 111 | 0.5% |
| Mexican | 69 | 0.3% |
| Nigerian | 18 | 0.1% |
| Northern European | 81 | 0.4% |
| Norwegian | 119 | 0.6% |
| Panamanian | 17 | 0.1% |
| Pennsylvania German | 19 | 0.1% |
| Polish | 1,055 | 5.1% |
| Portuguese | 26 | 0.1% |
| Puerto Rican | 516 | 2.5% |
| Romanian | 33 | 0.2% |
| Russian | 278 | 1.3% |
| Scandinavian | 27 | 0.1% |
| Scotch-Irish | 198 | 1.0% |
| Scottish | 289 | 1.4% |
| Sioux | 81 | 0.4% |
| Slavic | 18 | 0.1% |
| Slovak | 186 | 0.9% |
| South American | 236 | 1.1% |
| Sri Lankan | 35 | 0.2% |
| Subsaharan African | 99 | 0.5% |
| Swedish | 268 | 1.3% |
| Swiss | 44 | 0.2% |
| Thai | 683 | 3.3% |
| Turkish | 51 | 0.3% |
| Ukrainian | 163 | 0.8% |
| Uruguayan | 17 | 0.1% |
| Venezuelan | 31 | 0.2% |
| Vietnamese | 18 | 0.1% |
| Welsh | 290 | 1.4% | View All 71 Rows |
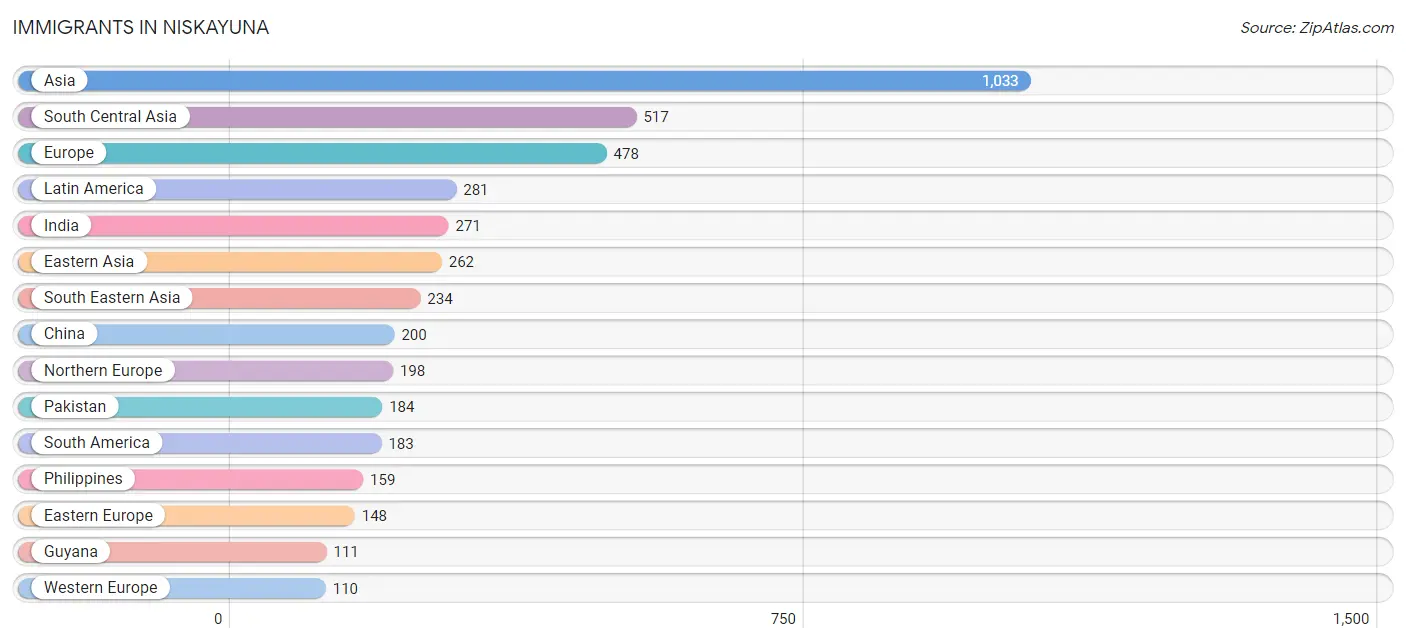
Immigrants in Niskayuna
The most numerous immigrant groups reported in Niskayuna came from Asia (1,033 | 5.0%), South Central Asia (517 | 2.5%), Europe (478 | 2.3%), Latin America (281 | 1.4%), and India (271 | 1.3%), together accounting for 12.5% of all Niskayuna residents.
| Immigration Origin | # Population | % Population |
| Africa | 101 | 0.5% |
| Asia | 1,033 | 5.0% |
| Bangladesh | 18 | 0.1% |
| Belarus | 46 | 0.2% |
| Cameroon | 50 | 0.2% |
| Caribbean | 62 | 0.3% |
| Central America | 36 | 0.2% |
| Chile | 31 | 0.2% |
| China | 200 | 1.0% |
| Costa Rica | 12 | 0.1% |
| Eastern Asia | 262 | 1.3% |
| Eastern Europe | 148 | 0.7% |
| Ecuador | 27 | 0.1% |
| England | 35 | 0.2% |
| Europe | 478 | 2.3% |
| Germany | 87 | 0.4% |
| Ghana | 5 | 0.0% |
| Guyana | 111 | 0.5% |
| India | 271 | 1.3% |
| Ireland | 66 | 0.3% |
| Italy | 22 | 0.1% |
| Jamaica | 62 | 0.3% |
| Japan | 10 | 0.1% |
| Kazakhstan | 14 | 0.1% |
| Korea | 52 | 0.3% |
| Laos | 15 | 0.1% |
| Latin America | 281 | 1.4% |
| Mexico | 7 | 0.0% |
| Middle Africa | 50 | 0.2% |
| Nepal | 7 | 0.0% |
| Netherlands | 8 | 0.0% |
| Nigeria | 46 | 0.2% |
| Northern Europe | 198 | 1.0% |
| Pakistan | 184 | 0.9% |
| Panama | 17 | 0.1% |
| Philippines | 159 | 0.8% |
| Poland | 21 | 0.1% |
| Romania | 17 | 0.1% |
| Russia | 43 | 0.2% |
| Scotland | 10 | 0.1% |
| South America | 183 | 0.9% |
| South Central Asia | 517 | 2.5% |
| South Eastern Asia | 234 | 1.1% |
| Southern Europe | 22 | 0.1% |
| Sri Lanka | 23 | 0.1% |
| Switzerland | 15 | 0.1% |
| Taiwan | 38 | 0.2% |
| Turkey | 20 | 0.1% |
| Ukraine | 21 | 0.1% |
| Venezuela | 14 | 0.1% |
| Vietnam | 34 | 0.2% |
| Western Africa | 51 | 0.3% |
| Western Asia | 20 | 0.1% |
| Western Europe | 110 | 0.5% | View All 54 Rows |
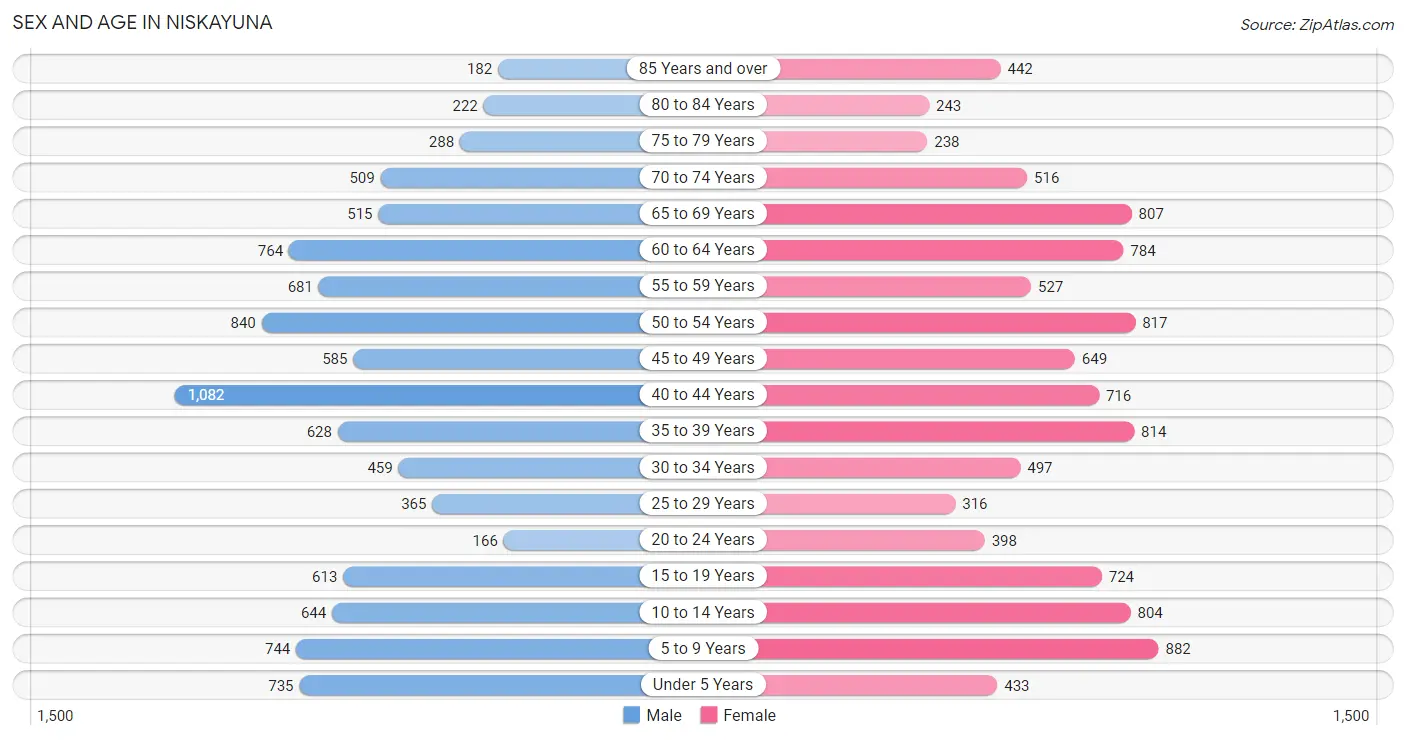
Sex and Age in Niskayuna
Sex and Age in Niskayuna
The most populous age groups in Niskayuna are 40 to 44 Years (1,082 | 10.8%) for men and 5 to 9 Years (882 | 8.3%) for women.
| Age Bracket | Male | Female |
| Under 5 Years | 735 (7.3%) | 433 (4.1%) |
| 5 to 9 Years | 744 (7.4%) | 882 (8.3%) |
| 10 to 14 Years | 644 (6.4%) | 804 (7.6%) |
| 15 to 19 Years | 613 (6.1%) | 724 (6.8%) |
| 20 to 24 Years | 166 (1.7%) | 398 (3.7%) |
| 25 to 29 Years | 365 (3.6%) | 316 (3.0%) |
| 30 to 34 Years | 459 (4.6%) | 497 (4.7%) |
| 35 to 39 Years | 628 (6.3%) | 814 (7.7%) |
| 40 to 44 Years | 1,082 (10.8%) | 716 (6.8%) |
| 45 to 49 Years | 585 (5.8%) | 649 (6.1%) |
| 50 to 54 Years | 840 (8.4%) | 817 (7.7%) |
| 55 to 59 Years | 681 (6.8%) | 527 (5.0%) |
| 60 to 64 Years | 764 (7.6%) | 784 (7.4%) |
| 65 to 69 Years | 515 (5.1%) | 807 (7.6%) |
| 70 to 74 Years | 509 (5.1%) | 516 (4.9%) |
| 75 to 79 Years | 288 (2.9%) | 238 (2.2%) |
| 80 to 84 Years | 222 (2.2%) | 243 (2.3%) |
| 85 Years and over | 182 (1.8%) | 442 (4.2%) |
| Total | 10,022 (100.0%) | 10,607 (100.0%) |
Families and Households in Niskayuna
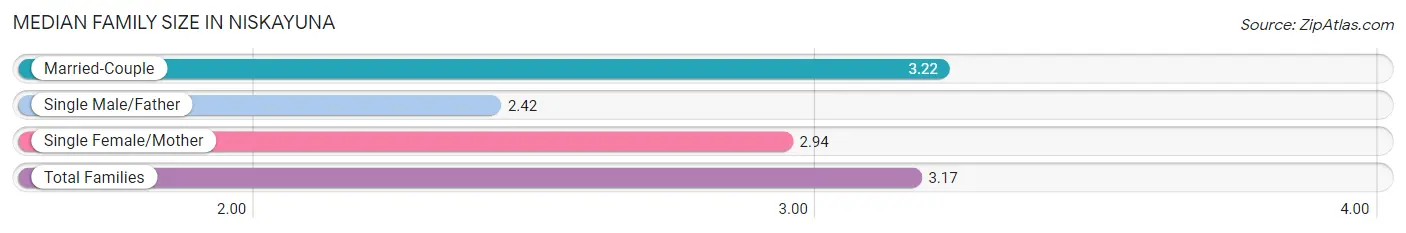
Median Family Size in Niskayuna
The median family size in Niskayuna is 3.17 persons per family, with married-couple families (4,807 | 88.3%) accounting for the largest median family size of 3.22 persons per family. On the other hand, single male/father families (217 | 4.0%) represent the smallest median family size with 2.42 persons per family.
| Family Type | # Families | Family Size |
| Married-Couple | 4,807 (88.3%) | 3.22 |
| Single Male/Father | 217 (4.0%) | 2.42 |
| Single Female/Mother | 419 (7.7%) | 2.94 |
| Total Families | 5,443 (100.0%) | 3.17 |
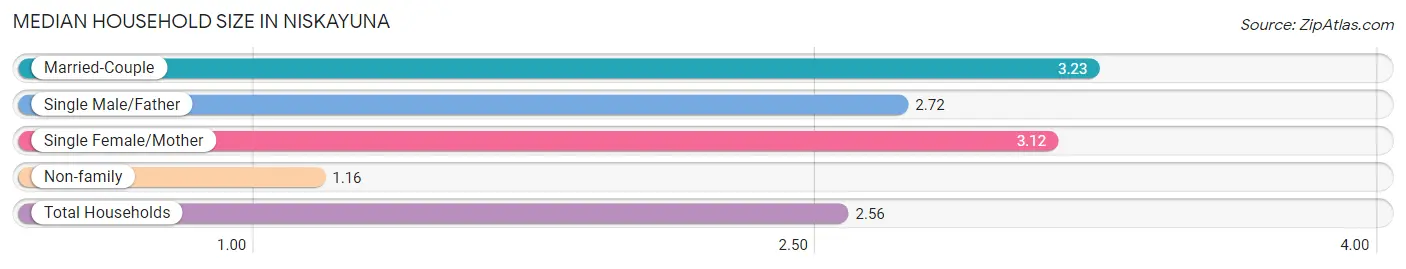
Median Household Size in Niskayuna
The median household size in Niskayuna is 2.56 persons per household, with married-couple households (4,807 | 60.7%) accounting for the largest median household size of 3.23 persons per household. non-family households (2,478 | 31.3%) represent the smallest median household size with 1.16 persons per household.
| Household Type | # Households | Household Size |
| Married-Couple | 4,807 (60.7%) | 3.23 |
| Single Male/Father | 217 (2.7%) | 2.72 |
| Single Female/Mother | 419 (5.3%) | 3.12 |
| Non-family | 2,478 (31.3%) | 1.16 |
| Total Households | 7,921 (100.0%) | 2.56 |
Household Size by Marriage Status in Niskayuna
Out of a total of 7,921 households in Niskayuna, 5,443 (68.7%) are family households, while 2,478 (31.3%) are nonfamily households. The most numerous type of family households are 2-person households, comprising 2,445, and the most common type of nonfamily households are 1-person households, comprising 2,126.
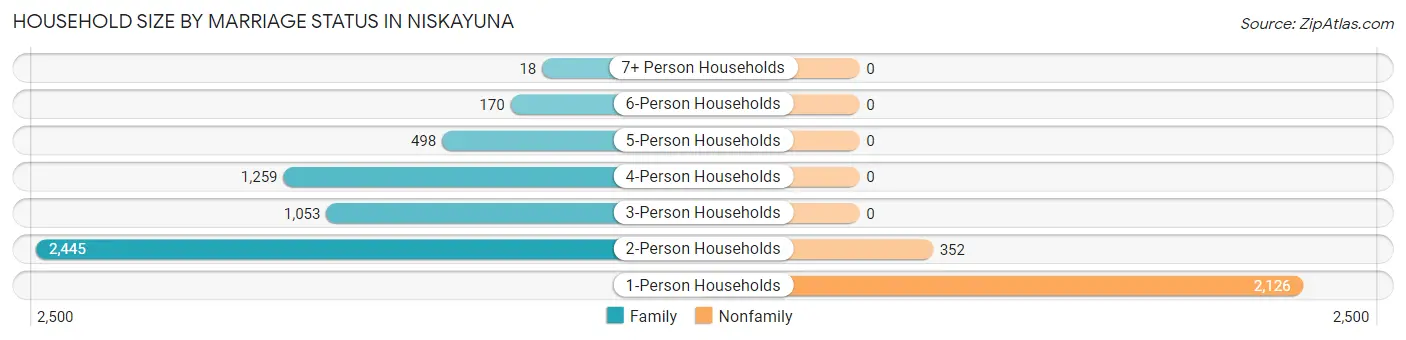
| Household Size | Family Households | Nonfamily Households |
| 1-Person Households | - | 2,126 (26.8%) |
| 2-Person Households | 2,445 (30.9%) | 352 (4.4%) |
| 3-Person Households | 1,053 (13.3%) | 0 (0.0%) |
| 4-Person Households | 1,259 (15.9%) | 0 (0.0%) |
| 5-Person Households | 498 (6.3%) | 0 (0.0%) |
| 6-Person Households | 170 (2.1%) | 0 (0.0%) |
| 7+ Person Households | 18 (0.2%) | 0 (0.0%) |
| Total | 5,443 (68.7%) | 2,478 (31.3%) |
Female Fertility in Niskayuna
Fertility by Age in Niskayuna
Average fertility rate in Niskayuna is 49.0 births per 1,000 women. Women in the age bracket of 20 to 34 years have the highest fertility rate with 105.0 births per 1,000 women. Women in the age bracket of 20 to 34 years acount for 60.8% of all women with births.
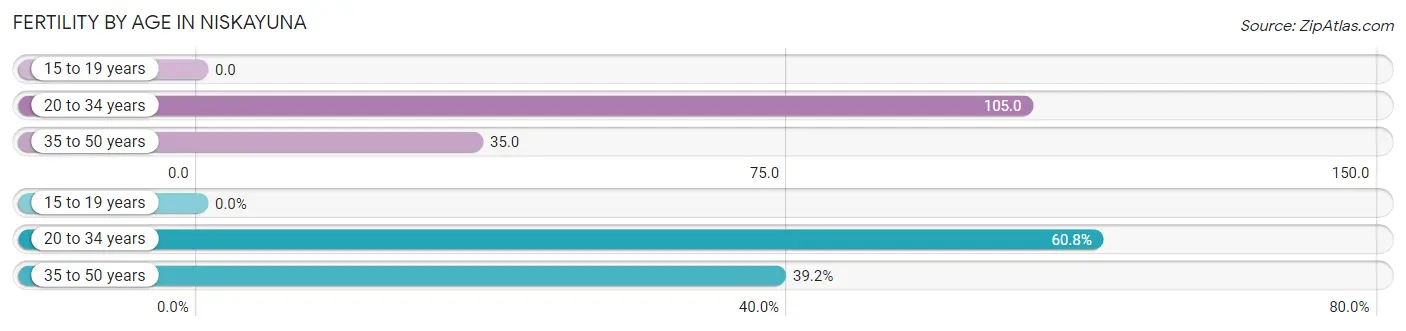
| Age Bracket | Women with Births | Births / 1,000 Women |
| 15 to 19 years | 0 (0.0%) | 0.0 |
| 20 to 34 years | 127 (60.8%) | 105.0 |
| 35 to 50 years | 82 (39.2%) | 35.0 |
| Total | 209 (100.0%) | 49.0 |
Fertility by Age by Marriage Status in Niskayuna
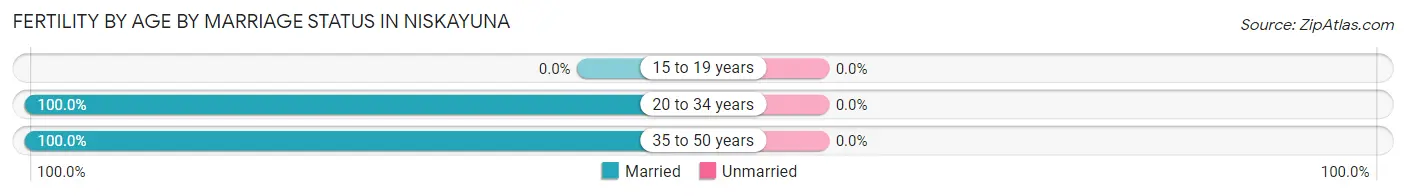
| Age Bracket | Married | Unmarried |
| 15 to 19 years | 0 (0.0%) | 0 (0.0%) |
| 20 to 34 years | 127 (100.0%) | 0 (0.0%) |
| 35 to 50 years | 82 (100.0%) | 0 (0.0%) |
| Total | 209 (100.0%) | 0 (0.0%) |
Fertility by Education in Niskayuna
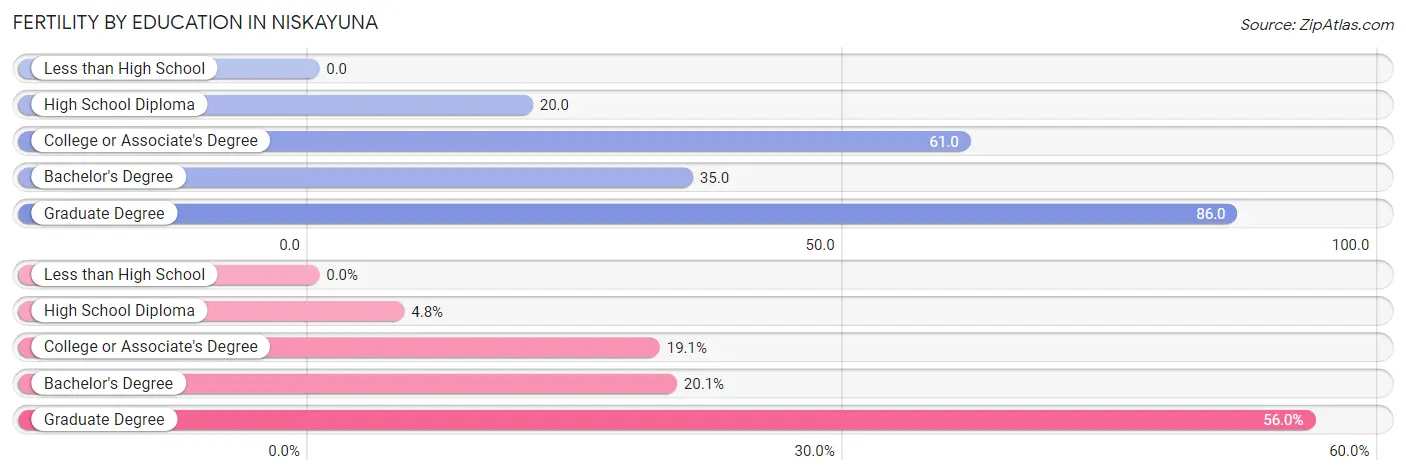
| Educational Attainment | Women with Births | Births / 1,000 Women |
| Less than High School | 0 (0.0%) | 0.0 |
| High School Diploma | 10 (4.8%) | 20.0 |
| College or Associate's Degree | 40 (19.1%) | 61.0 |
| Bachelor's Degree | 42 (20.1%) | 35.0 |
| Graduate Degree | 117 (56.0%) | 86.0 |
| Total | 209 (100.0%) | 49.0 |
Fertility by Education by Marriage Status in Niskayuna
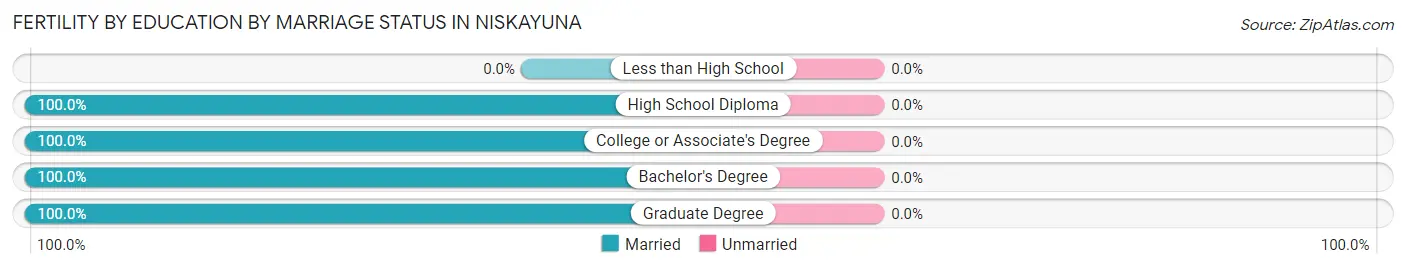
| Educational Attainment | Married | Unmarried |
| Less than High School | 0 (0.0%) | 0 (0.0%) |
| High School Diploma | 10 (100.0%) | 0 (0.0%) |
| College or Associate's Degree | 40 (100.0%) | 0 (0.0%) |
| Bachelor's Degree | 42 (100.0%) | 0 (0.0%) |
| Graduate Degree | 117 (100.0%) | 0 (0.0%) |
| Total | 209 (100.0%) | 0 (0.0%) |
Employment Characteristics in Niskayuna
Employment by Class of Employer in Niskayuna
Among the 9,995 employed individuals in Niskayuna, private company employees (5,132 | 51.3%), not-for-profit organizations (1,946 | 19.5%), and state government employees (1,169 | 11.7%) make up the most common classes of employment.
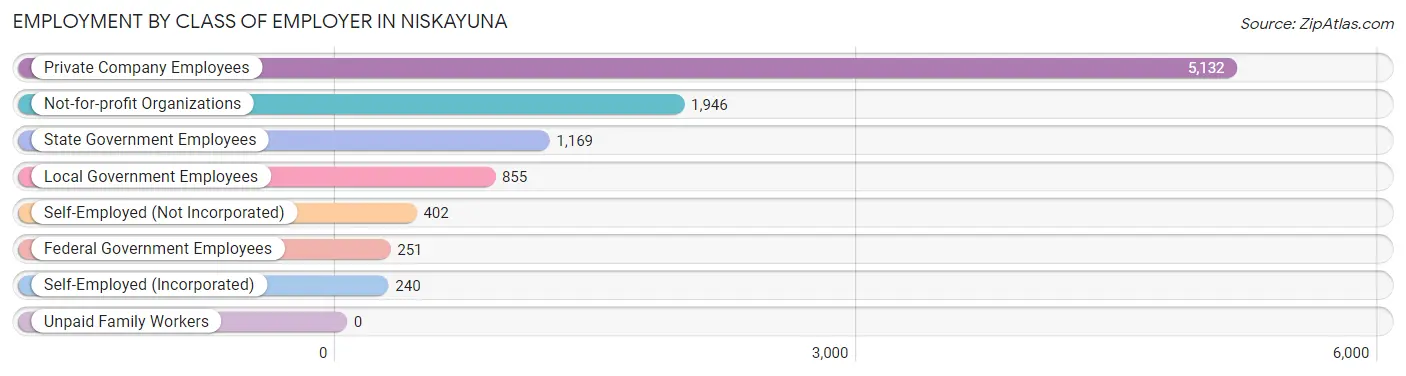
| Employer Class | # Employees | % Employees |
| Private Company Employees | 5,132 | 51.3% |
| Self-Employed (Incorporated) | 240 | 2.4% |
| Self-Employed (Not Incorporated) | 402 | 4.0% |
| Not-for-profit Organizations | 1,946 | 19.5% |
| Local Government Employees | 855 | 8.6% |
| State Government Employees | 1,169 | 11.7% |
| Federal Government Employees | 251 | 2.5% |
| Unpaid Family Workers | 0 | 0.0% |
| Total | 9,995 | 100.0% |
Employment Status by Age in Niskayuna
According to the labor force statistics for Niskayuna, out of the total population over 16 years of age (16,009), 65.0% or 10,406 individuals are in the labor force, with 2.7% or 281 of them unemployed. The age group with the highest labor force participation rate is 45 to 54 years, with 95.8% or 2,770 individuals in the labor force. Within the labor force, the 16 to 19 years age range has the highest percentage of unemployed individuals, with 19.0% or 42 of them being unemployed.
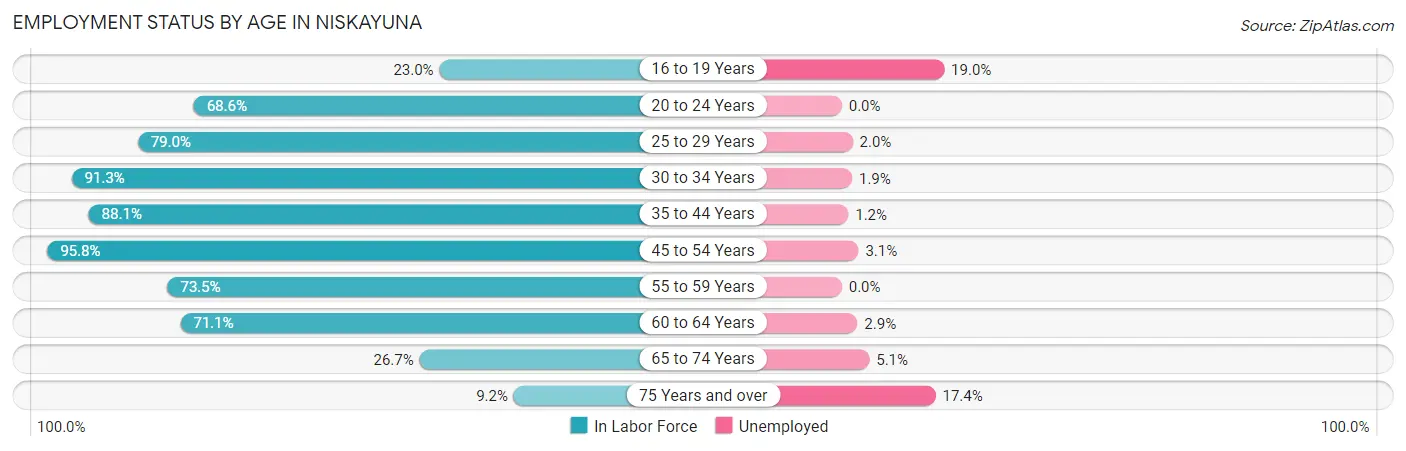
| Age Bracket | In Labor Force | Unemployed |
| 16 to 19 Years | 221 (23.0%) | 42 (19.0%) |
| 20 to 24 Years | 387 (68.6%) | 0 (0.0%) |
| 25 to 29 Years | 538 (79.0%) | 11 (2.0%) |
| 30 to 34 Years | 873 (91.3%) | 17 (1.9%) |
| 35 to 44 Years | 2,854 (88.1%) | 34 (1.2%) |
| 45 to 54 Years | 2,770 (95.8%) | 86 (3.1%) |
| 55 to 59 Years | 888 (73.5%) | 0 (0.0%) |
| 60 to 64 Years | 1,101 (71.1%) | 32 (2.9%) |
| 65 to 74 Years | 627 (26.7%) | 32 (5.1%) |
| 75 Years and over | 149 (9.2%) | 26 (17.4%) |
| Total | 10,406 (65.0%) | 281 (2.7%) |
Employment Status by Educational Attainment in Niskayuna
According to labor force statistics for Niskayuna, 85.7% of individuals (9,019) out of the total population between 25 and 64 years of age (10,524) are in the labor force, with 2.0% or 180 of them being unemployed. The group with the highest labor force participation rate are those with the educational attainment of bachelor's degree or higher, with 90.7% or 6,205 individuals in the labor force. Within the labor force, individuals with high school diploma education have the highest percentage of unemployment, with 3.4% or 30 of them being unemployed.
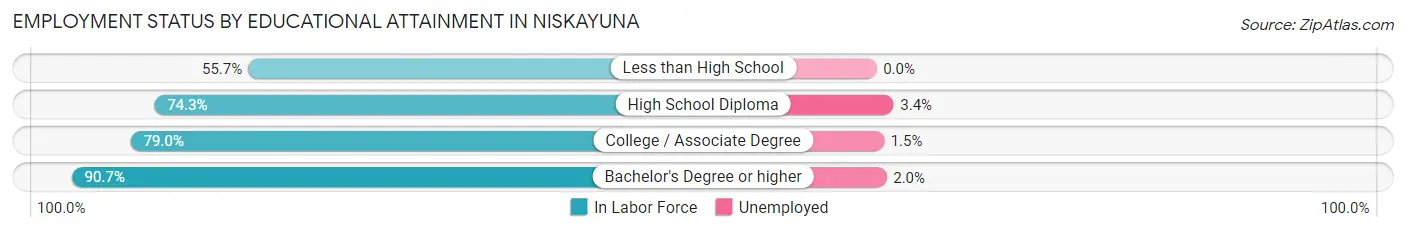
| Educational Attainment | In Labor Force | Unemployed |
| Less than High School | 88 (55.7%) | 0 (0.0%) |
| High School Diploma | 895 (74.3%) | 41 (3.4%) |
| College / Associate Degree | 1,833 (79.0%) | 35 (1.5%) |
| Bachelor's Degree or higher | 6,205 (90.7%) | 137 (2.0%) |
| Total | 9,019 (85.7%) | 210 (2.0%) |
Employment Occupations by Sex in Niskayuna
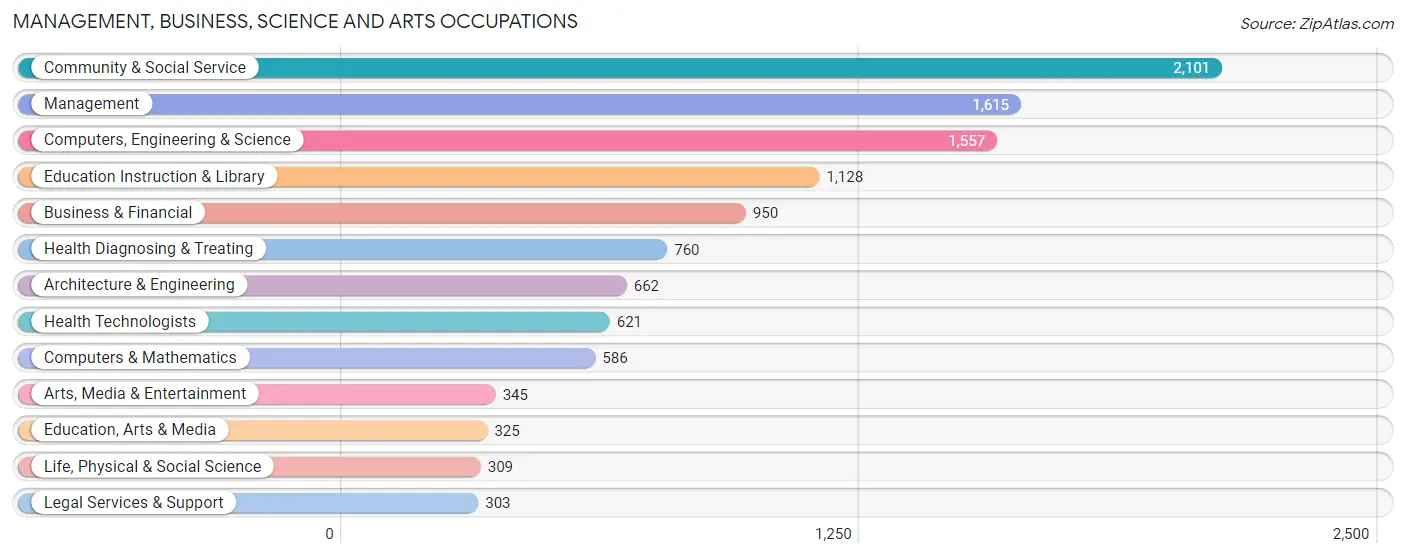
Management, Business, Science and Arts Occupations
The most common Management, Business, Science and Arts occupations in Niskayuna are Community & Social Service (2,101 | 20.8%), Management (1,615 | 16.0%), Computers, Engineering & Science (1,557 | 15.4%), Education Instruction & Library (1,128 | 11.2%), and Business & Financial (950 | 9.4%).
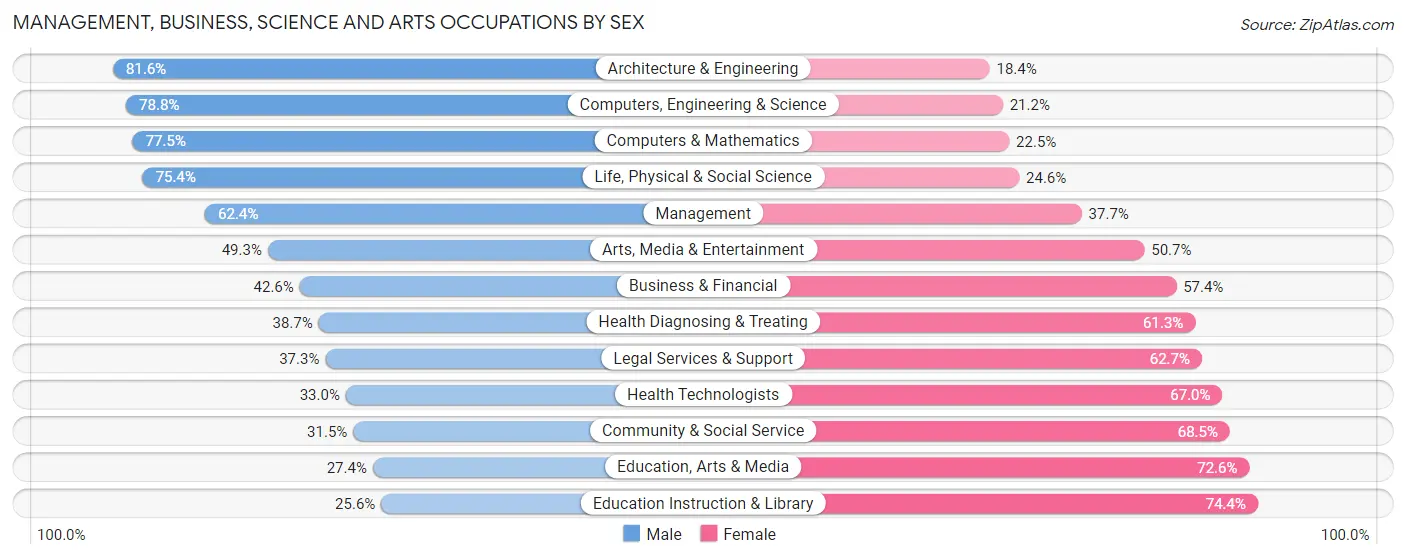
Management, Business, Science and Arts Occupations by Sex
Within the Management, Business, Science and Arts occupations in Niskayuna, the most male-oriented occupations are Architecture & Engineering (81.6%), Computers, Engineering & Science (78.8%), and Computers & Mathematics (77.5%), while the most female-oriented occupations are Education Instruction & Library (74.4%), Education, Arts & Media (72.6%), and Community & Social Service (68.5%).
| Occupation | Male | Female |
| Management | 1,007 (62.4%) | 608 (37.7%) |
| Business & Financial | 405 (42.6%) | 545 (57.4%) |
| Computers, Engineering & Science | 1,227 (78.8%) | 330 (21.2%) |
| Computers & Mathematics | 454 (77.5%) | 132 (22.5%) |
| Architecture & Engineering | 540 (81.6%) | 122 (18.4%) |
| Life, Physical & Social Science | 233 (75.4%) | 76 (24.6%) |
| Community & Social Service | 661 (31.5%) | 1,440 (68.5%) |
| Education, Arts & Media | 89 (27.4%) | 236 (72.6%) |
| Legal Services & Support | 113 (37.3%) | 190 (62.7%) |
| Education Instruction & Library | 289 (25.6%) | 839 (74.4%) |
| Arts, Media & Entertainment | 170 (49.3%) | 175 (50.7%) |
| Health Diagnosing & Treating | 294 (38.7%) | 466 (61.3%) |
| Health Technologists | 205 (33.0%) | 416 (67.0%) |
| Total (Category) | 3,594 (51.5%) | 3,389 (48.5%) |
| Total (Overall) | 5,281 (52.3%) | 4,824 (47.7%) |
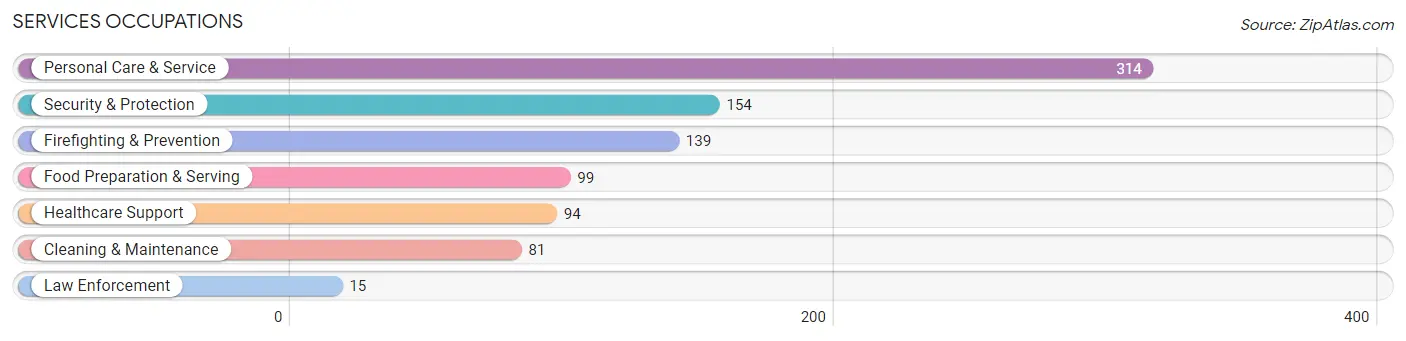
Services Occupations
The most common Services occupations in Niskayuna are Personal Care & Service (314 | 3.1%), Security & Protection (154 | 1.5%), Firefighting & Prevention (139 | 1.4%), Food Preparation & Serving (99 | 1.0%), and Healthcare Support (94 | 0.9%).
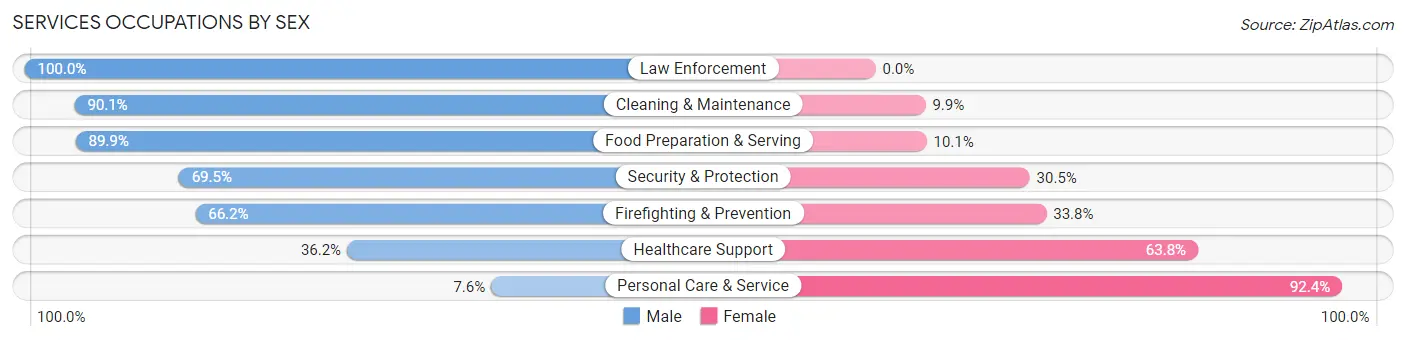
Services Occupations by Sex
Within the Services occupations in Niskayuna, the most male-oriented occupations are Law Enforcement (100.0%), Cleaning & Maintenance (90.1%), and Food Preparation & Serving (89.9%), while the most female-oriented occupations are Personal Care & Service (92.4%), Healthcare Support (63.8%), and Firefighting & Prevention (33.8%).
| Occupation | Male | Female |
| Healthcare Support | 34 (36.2%) | 60 (63.8%) |
| Security & Protection | 107 (69.5%) | 47 (30.5%) |
| Firefighting & Prevention | 92 (66.2%) | 47 (33.8%) |
| Law Enforcement | 15 (100.0%) | 0 (0.0%) |
| Food Preparation & Serving | 89 (89.9%) | 10 (10.1%) |
| Cleaning & Maintenance | 73 (90.1%) | 8 (9.9%) |
| Personal Care & Service | 24 (7.6%) | 290 (92.4%) |
| Total (Category) | 327 (44.1%) | 415 (55.9%) |
| Total (Overall) | 5,281 (52.3%) | 4,824 (47.7%) |
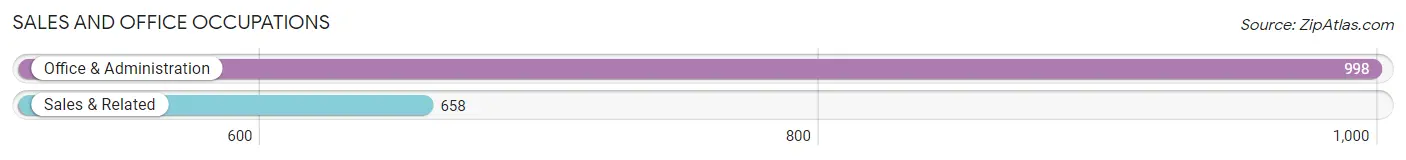
Sales and Office Occupations
The most common Sales and Office occupations in Niskayuna are Office & Administration (998 | 9.9%), and Sales & Related (658 | 6.5%).
Sales and Office Occupations by Sex
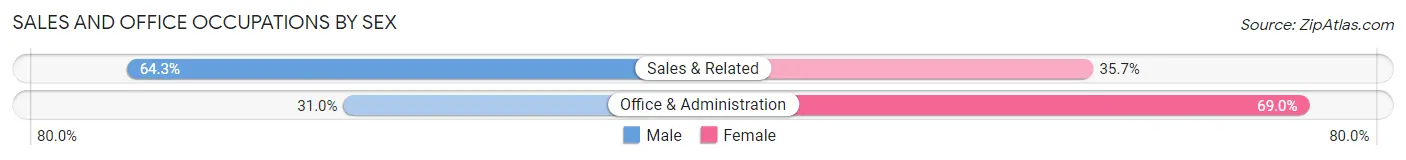
| Occupation | Male | Female |
| Sales & Related | 423 (64.3%) | 235 (35.7%) |
| Office & Administration | 309 (31.0%) | 689 (69.0%) |
| Total (Category) | 732 (44.2%) | 924 (55.8%) |
| Total (Overall) | 5,281 (52.3%) | 4,824 (47.7%) |
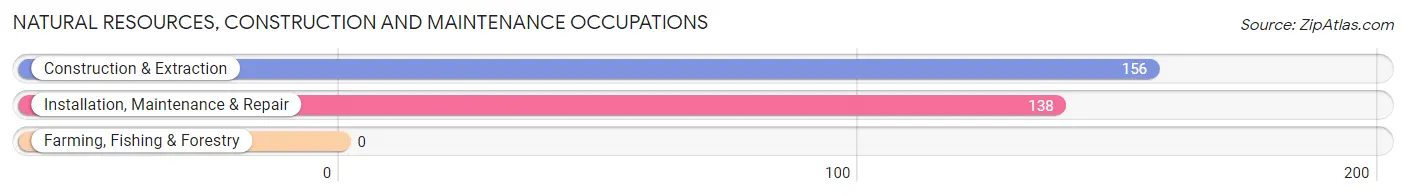
Natural Resources, Construction and Maintenance Occupations
The most common Natural Resources, Construction and Maintenance occupations in Niskayuna are Construction & Extraction (156 | 1.5%), and Installation, Maintenance & Repair (138 | 1.4%).
Natural Resources, Construction and Maintenance Occupations by Sex
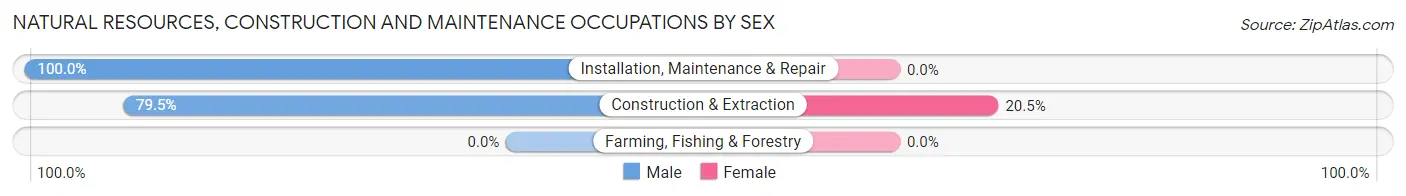
| Occupation | Male | Female |
| Farming, Fishing & Forestry | 0 (0.0%) | 0 (0.0%) |
| Construction & Extraction | 124 (79.5%) | 32 (20.5%) |
| Installation, Maintenance & Repair | 138 (100.0%) | 0 (0.0%) |
| Total (Category) | 262 (89.1%) | 32 (10.9%) |
| Total (Overall) | 5,281 (52.3%) | 4,824 (47.7%) |
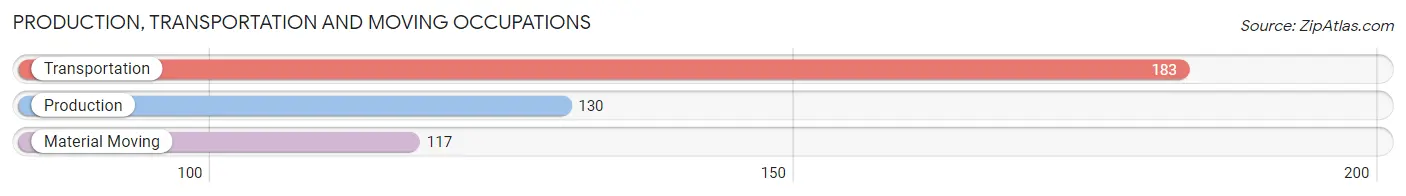
Production, Transportation and Moving Occupations
The most common Production, Transportation and Moving occupations in Niskayuna are Transportation (183 | 1.8%), Production (130 | 1.3%), and Material Moving (117 | 1.2%).
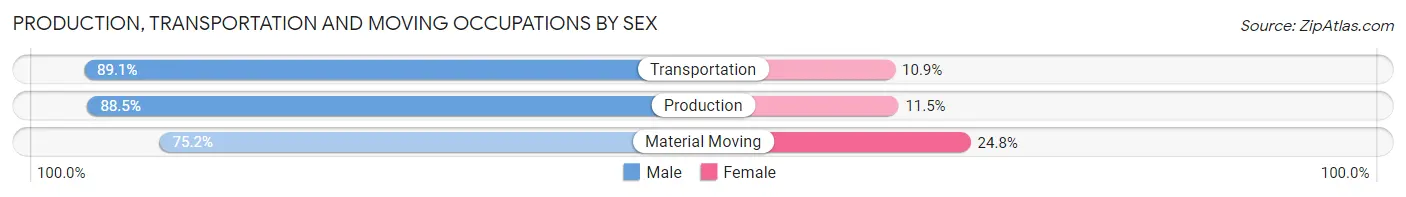
Production, Transportation and Moving Occupations by Sex
| Occupation | Male | Female |
| Production | 115 (88.5%) | 15 (11.5%) |
| Transportation | 163 (89.1%) | 20 (10.9%) |
| Material Moving | 88 (75.2%) | 29 (24.8%) |
| Total (Category) | 366 (85.1%) | 64 (14.9%) |
| Total (Overall) | 5,281 (52.3%) | 4,824 (47.7%) |
Employment Industries by Sex in Niskayuna
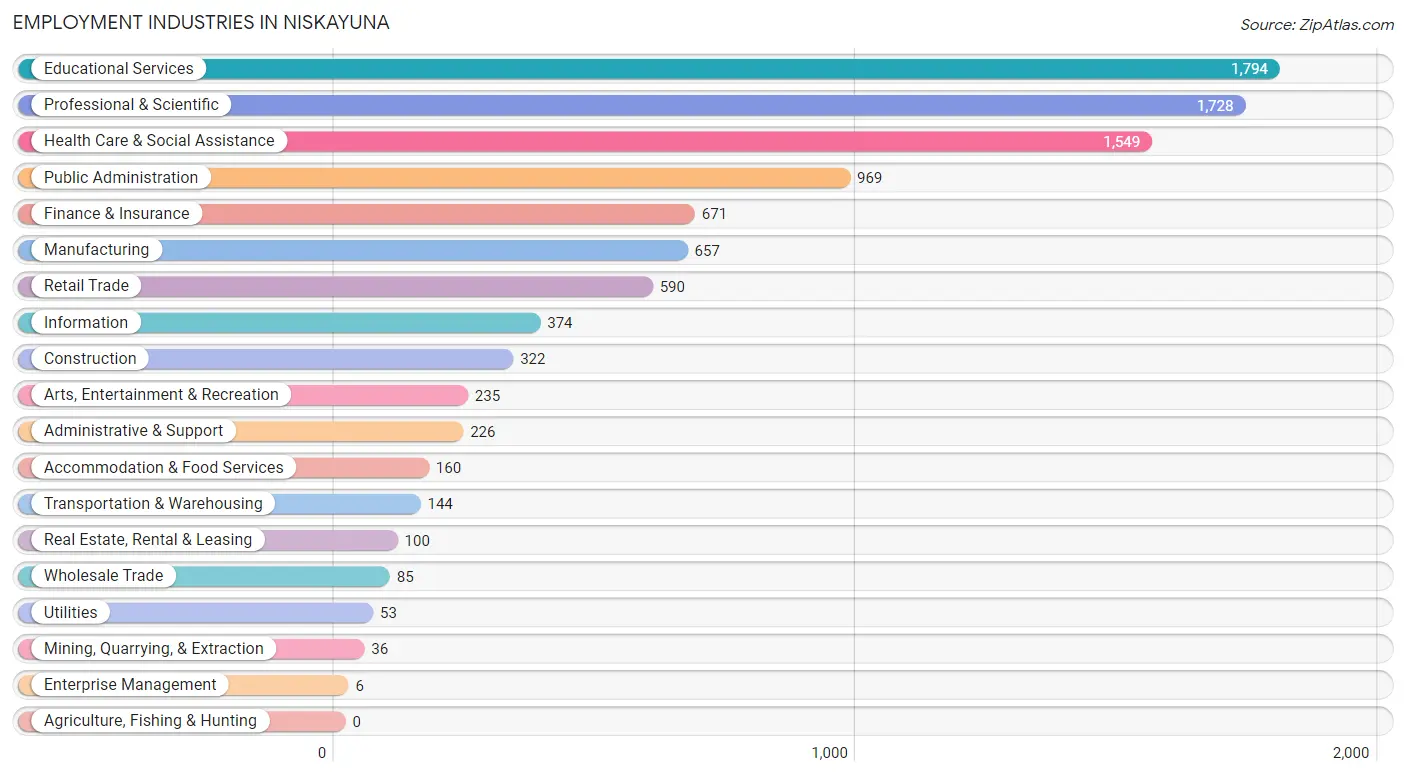
Employment Industries in Niskayuna
The major employment industries in Niskayuna include Educational Services (1,794 | 17.7%), Professional & Scientific (1,728 | 17.1%), Health Care & Social Assistance (1,549 | 15.3%), Public Administration (969 | 9.6%), and Finance & Insurance (671 | 6.6%).
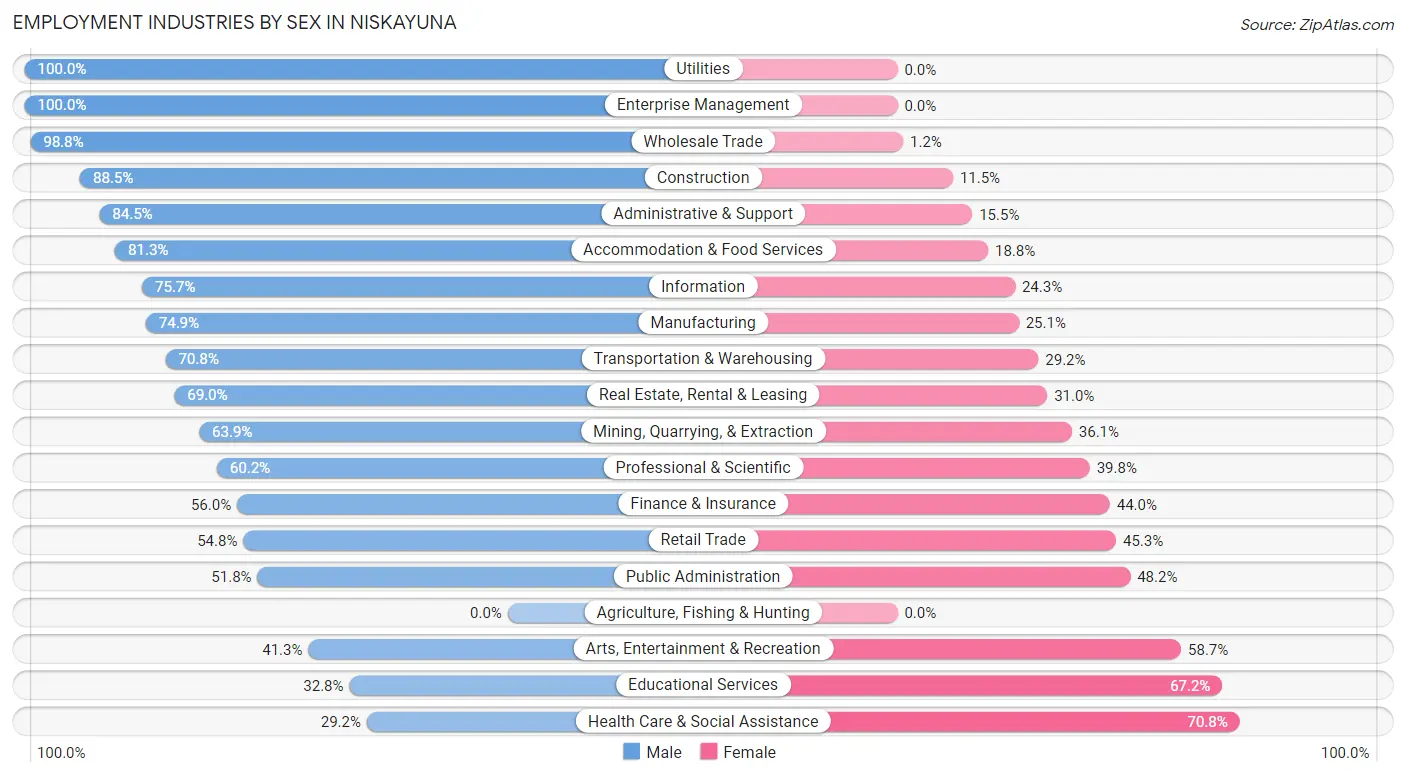
Employment Industries by Sex in Niskayuna
The Niskayuna industries that see more men than women are Utilities (100.0%), Enterprise Management (100.0%), and Wholesale Trade (98.8%), whereas the industries that tend to have a higher number of women are Health Care & Social Assistance (70.8%), Educational Services (67.2%), and Arts, Entertainment & Recreation (58.7%).
| Industry | Male | Female |
| Agriculture, Fishing & Hunting | 0 (0.0%) | 0 (0.0%) |
| Mining, Quarrying, & Extraction | 23 (63.9%) | 13 (36.1%) |
| Construction | 285 (88.5%) | 37 (11.5%) |
| Manufacturing | 492 (74.9%) | 165 (25.1%) |
| Wholesale Trade | 84 (98.8%) | 1 (1.2%) |
| Retail Trade | 323 (54.7%) | 267 (45.3%) |
| Transportation & Warehousing | 102 (70.8%) | 42 (29.2%) |
| Utilities | 53 (100.0%) | 0 (0.0%) |
| Information | 283 (75.7%) | 91 (24.3%) |
| Finance & Insurance | 376 (56.0%) | 295 (44.0%) |
| Real Estate, Rental & Leasing | 69 (69.0%) | 31 (31.0%) |
| Professional & Scientific | 1,040 (60.2%) | 688 (39.8%) |
| Enterprise Management | 6 (100.0%) | 0 (0.0%) |
| Administrative & Support | 191 (84.5%) | 35 (15.5%) |
| Educational Services | 588 (32.8%) | 1,206 (67.2%) |
| Health Care & Social Assistance | 452 (29.2%) | 1,097 (70.8%) |
| Arts, Entertainment & Recreation | 97 (41.3%) | 138 (58.7%) |
| Accommodation & Food Services | 130 (81.2%) | 30 (18.8%) |
| Public Administration | 502 (51.8%) | 467 (48.2%) |
| Total | 5,281 (52.3%) | 4,824 (47.7%) |
Education in Niskayuna
School Enrollment in Niskayuna
The most common levels of schooling among the 5,018 students in Niskayuna are middle school (1,277 | 25.5%), high school (1,269 | 25.3%), and elementary school (1,053 | 21.0%).
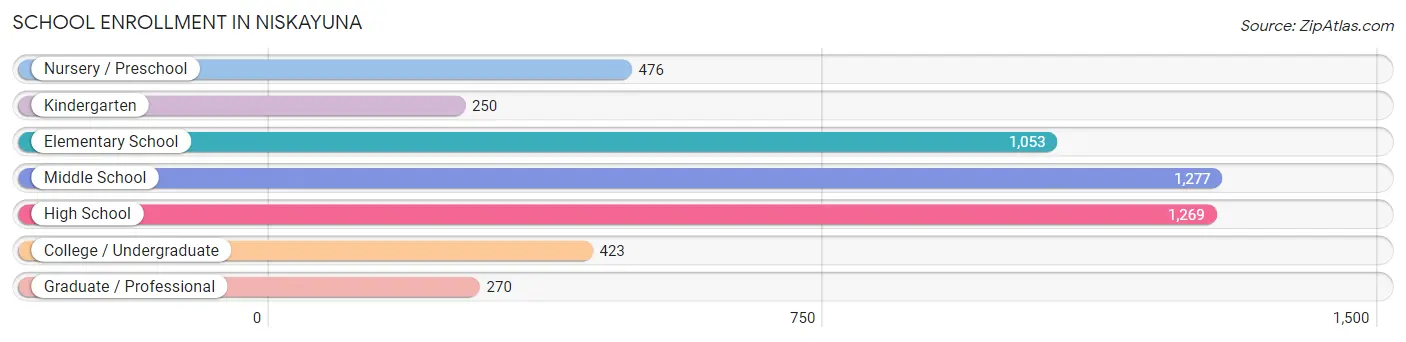
| School Level | # Students | % Students |
| Nursery / Preschool | 476 | 9.5% |
| Kindergarten | 250 | 5.0% |
| Elementary School | 1,053 | 21.0% |
| Middle School | 1,277 | 25.5% |
| High School | 1,269 | 25.3% |
| College / Undergraduate | 423 | 8.4% |
| Graduate / Professional | 270 | 5.4% |
| Total | 5,018 | 100.0% |
School Enrollment by Age by Funding Source in Niskayuna
Out of a total of 5,018 students who are enrolled in schools in Niskayuna, 813 (16.2%) attend a private institution, while the remaining 4,205 (83.8%) are enrolled in public schools. The age group of 25 to 34 year olds has the highest likelihood of being enrolled in private schools, with 109 (81.3% in the age bracket) enrolled. Conversely, the age group of 15 to 17 year olds has the lowest likelihood of being enrolled in a private school, with 1,043 (96.2% in the age bracket) attending a public institution.
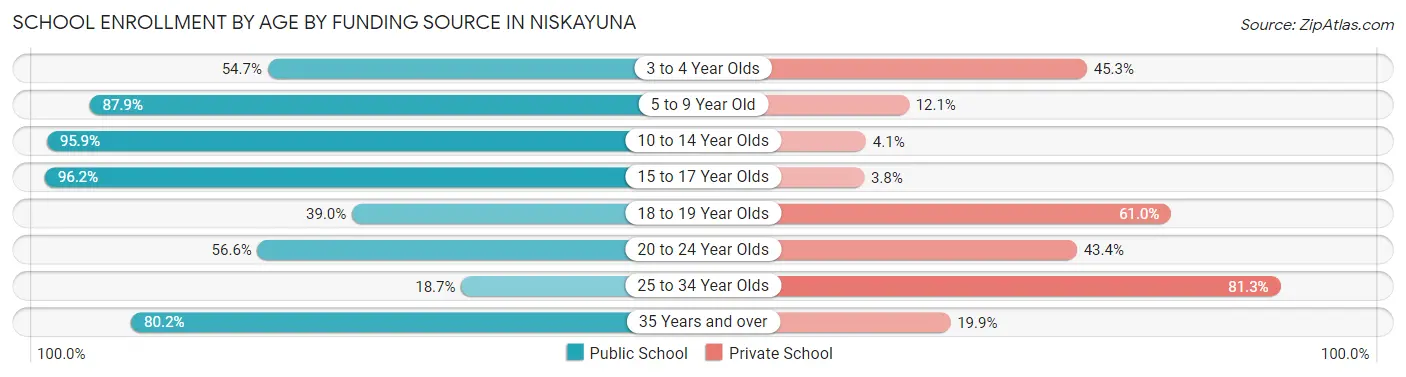
| Age Bracket | Public School | Private School |
| 3 to 4 Year Olds | 180 (54.7%) | 149 (45.3%) |
| 5 to 9 Year Old | 1,256 (87.9%) | 173 (12.1%) |
| 10 to 14 Year Olds | 1,342 (95.9%) | 58 (4.1%) |
| 15 to 17 Year Olds | 1,043 (96.2%) | 41 (3.8%) |
| 18 to 19 Year Olds | 78 (39.0%) | 122 (61.0%) |
| 20 to 24 Year Olds | 176 (56.6%) | 135 (43.4%) |
| 25 to 34 Year Olds | 25 (18.7%) | 109 (81.3%) |
| 35 Years and over | 105 (80.1%) | 26 (19.9%) |
| Total | 4,205 (83.8%) | 813 (16.2%) |
Educational Attainment by Field of Study in Niskayuna
Business (1,546 | 15.5%), engineering (1,176 | 11.8%), social sciences (1,162 | 11.7%), education (1,067 | 10.7%), and bio, nature & agricultural (783 | 7.9%) are the most common fields of study among 9,940 individuals in Niskayuna who have obtained a bachelor's degree or higher.
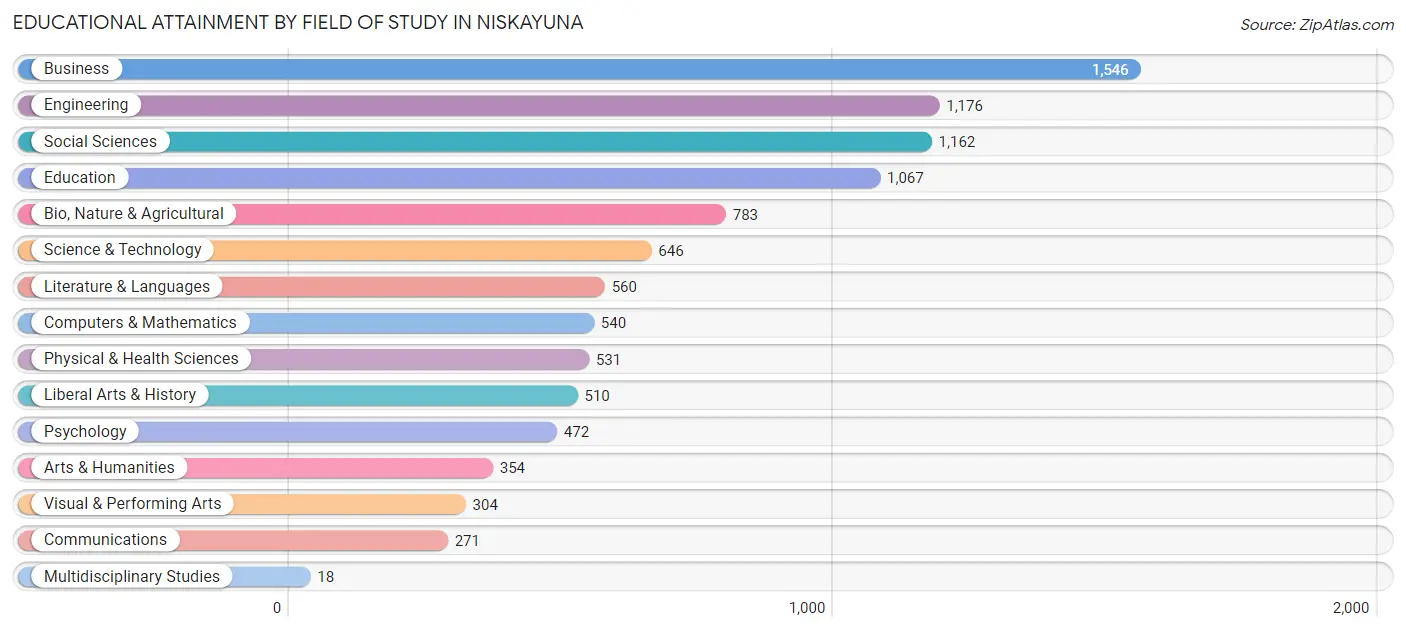
| Field of Study | # Graduates | % Graduates |
| Computers & Mathematics | 540 | 5.4% |
| Bio, Nature & Agricultural | 783 | 7.9% |
| Physical & Health Sciences | 531 | 5.3% |
| Psychology | 472 | 4.8% |
| Social Sciences | 1,162 | 11.7% |
| Engineering | 1,176 | 11.8% |
| Multidisciplinary Studies | 18 | 0.2% |
| Science & Technology | 646 | 6.5% |
| Business | 1,546 | 15.5% |
| Education | 1,067 | 10.7% |
| Literature & Languages | 560 | 5.6% |
| Liberal Arts & History | 510 | 5.1% |
| Visual & Performing Arts | 304 | 3.1% |
| Communications | 271 | 2.7% |
| Arts & Humanities | 354 | 3.6% |
| Total | 9,940 | 100.0% |
Transportation & Commute in Niskayuna
Vehicle Availability by Sex in Niskayuna
The most prevalent vehicle ownership categories in Niskayuna are males with 2 vehicles (2,895, accounting for 55.3%) and females with 2 vehicles (2,615, making up 61.2%).
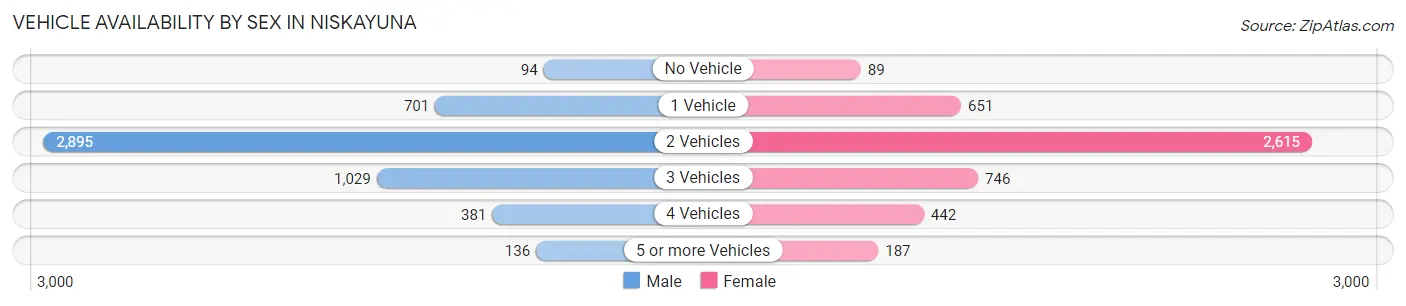
| Vehicles Available | Male | Female |
| No Vehicle | 94 (1.8%) | 89 (1.9%) |
| 1 Vehicle | 701 (13.4%) | 651 (13.8%) |
| 2 Vehicles | 2,895 (55.3%) | 2,615 (55.3%) |
| 3 Vehicles | 1,029 (19.7%) | 746 (15.8%) |
| 4 Vehicles | 381 (7.3%) | 442 (9.3%) |
| 5 or more Vehicles | 136 (2.6%) | 187 (4.0%) |
| Total | 5,236 (100.0%) | 4,730 (100.0%) |
Commute Time in Niskayuna
The most frequently occuring commute durations in Niskayuna are 15 to 19 minutes (1,447 commuters, 17.5%), 30 to 34 minutes (1,276 commuters, 15.4%), and 20 to 24 minutes (1,220 commuters, 14.7%).
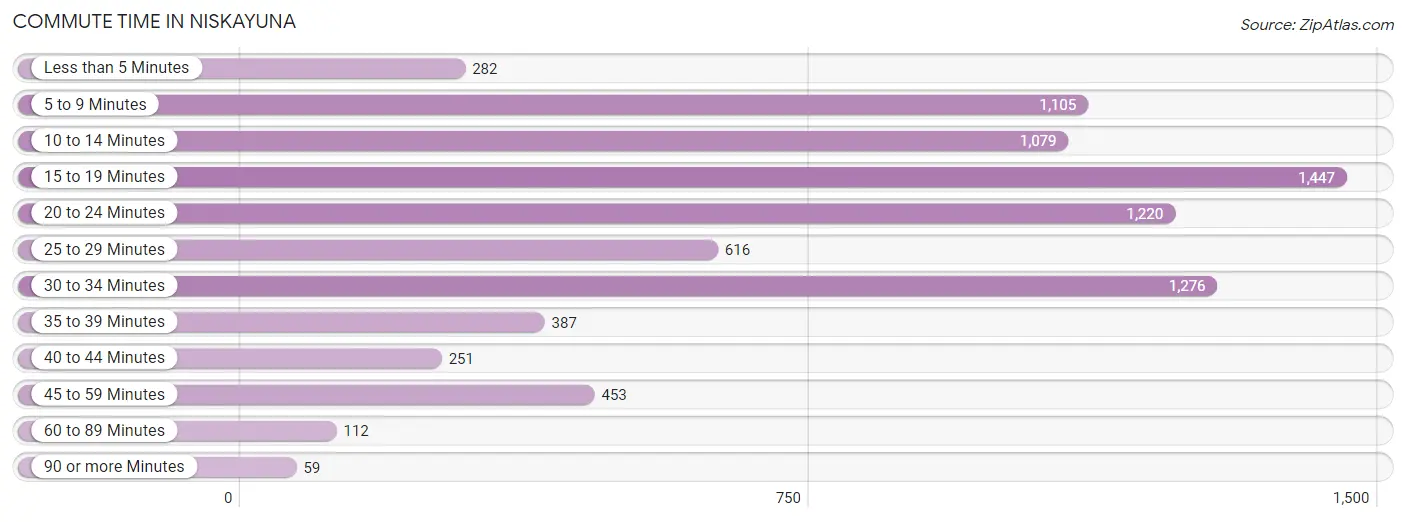
| Commute Time | # Commuters | % Commuters |
| Less than 5 Minutes | 282 | 3.4% |
| 5 to 9 Minutes | 1,105 | 13.3% |
| 10 to 14 Minutes | 1,079 | 13.0% |
| 15 to 19 Minutes | 1,447 | 17.5% |
| 20 to 24 Minutes | 1,220 | 14.7% |
| 25 to 29 Minutes | 616 | 7.4% |
| 30 to 34 Minutes | 1,276 | 15.4% |
| 35 to 39 Minutes | 387 | 4.7% |
| 40 to 44 Minutes | 251 | 3.0% |
| 45 to 59 Minutes | 453 | 5.5% |
| 60 to 89 Minutes | 112 | 1.3% |
| 90 or more Minutes | 59 | 0.7% |
Commute Time by Sex in Niskayuna
The most common commute times in Niskayuna are 15 to 19 minutes (732 commuters, 17.1%) for males and 15 to 19 minutes (715 commuters, 17.9%) for females.
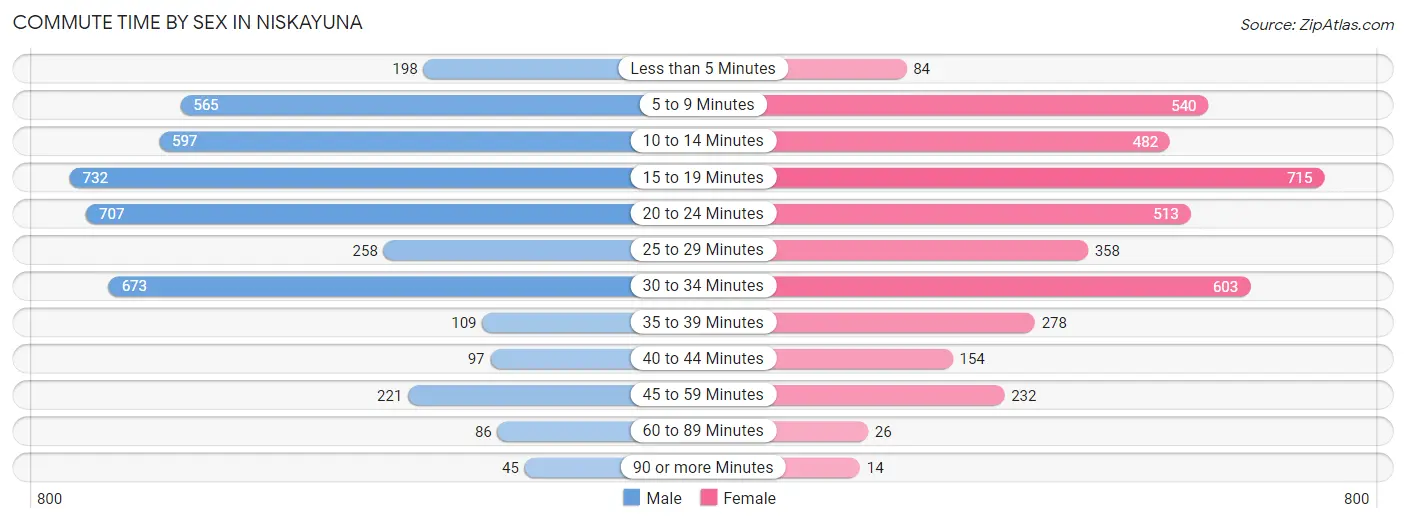
| Commute Time | Male | Female |
| Less than 5 Minutes | 198 (4.6%) | 84 (2.1%) |
| 5 to 9 Minutes | 565 (13.2%) | 540 (13.5%) |
| 10 to 14 Minutes | 597 (13.9%) | 482 (12.0%) |
| 15 to 19 Minutes | 732 (17.1%) | 715 (17.9%) |
| 20 to 24 Minutes | 707 (16.5%) | 513 (12.8%) |
| 25 to 29 Minutes | 258 (6.0%) | 358 (8.9%) |
| 30 to 34 Minutes | 673 (15.7%) | 603 (15.1%) |
| 35 to 39 Minutes | 109 (2.5%) | 278 (7.0%) |
| 40 to 44 Minutes | 97 (2.3%) | 154 (3.8%) |
| 45 to 59 Minutes | 221 (5.1%) | 232 (5.8%) |
| 60 to 89 Minutes | 86 (2.0%) | 26 (0.6%) |
| 90 or more Minutes | 45 (1.1%) | 14 (0.4%) |
Time of Departure to Work by Sex in Niskayuna
The most frequent times of departure to work in Niskayuna are 8:00 AM to 8:29 AM (849, 19.8%) for males and 8:00 AM to 8:29 AM (927, 23.2%) for females.
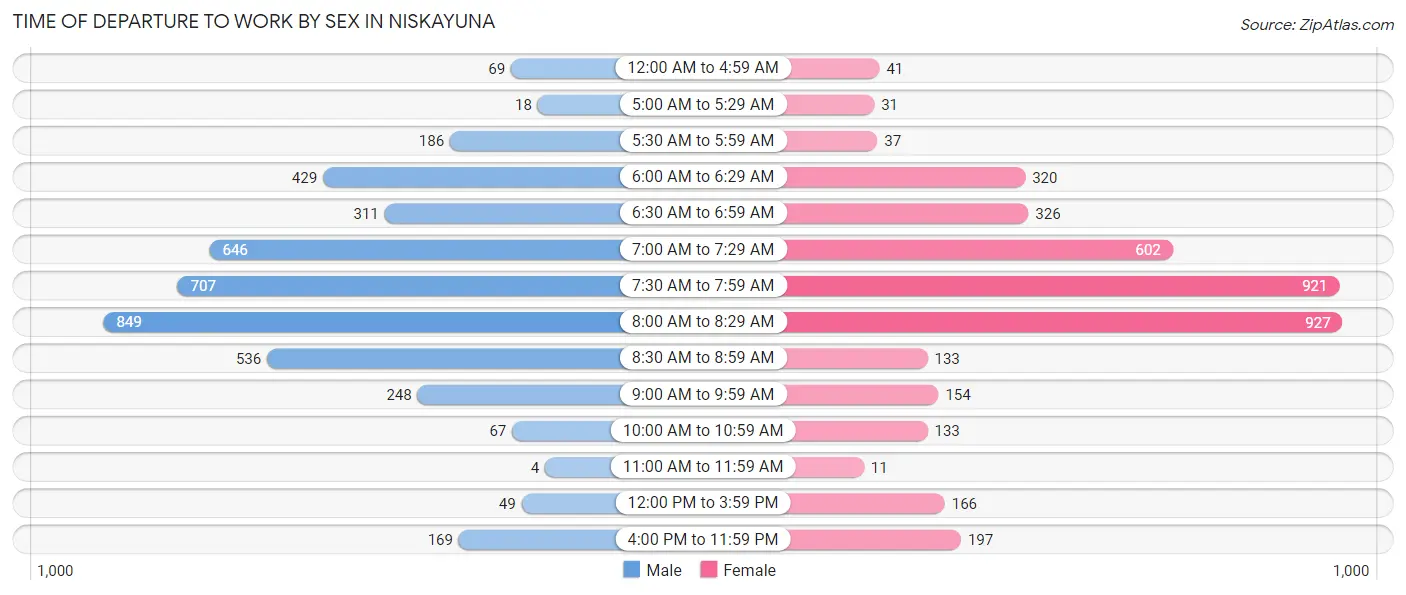
| Time of Departure | Male | Female |
| 12:00 AM to 4:59 AM | 69 (1.6%) | 41 (1.0%) |
| 5:00 AM to 5:29 AM | 18 (0.4%) | 31 (0.8%) |
| 5:30 AM to 5:59 AM | 186 (4.3%) | 37 (0.9%) |
| 6:00 AM to 6:29 AM | 429 (10.0%) | 320 (8.0%) |
| 6:30 AM to 6:59 AM | 311 (7.2%) | 326 (8.2%) |
| 7:00 AM to 7:29 AM | 646 (15.1%) | 602 (15.0%) |
| 7:30 AM to 7:59 AM | 707 (16.5%) | 921 (23.0%) |
| 8:00 AM to 8:29 AM | 849 (19.8%) | 927 (23.2%) |
| 8:30 AM to 8:59 AM | 536 (12.5%) | 133 (3.3%) |
| 9:00 AM to 9:59 AM | 248 (5.8%) | 154 (3.8%) |
| 10:00 AM to 10:59 AM | 67 (1.6%) | 133 (3.3%) |
| 11:00 AM to 11:59 AM | 4 (0.1%) | 11 (0.3%) |
| 12:00 PM to 3:59 PM | 49 (1.1%) | 166 (4.2%) |
| 4:00 PM to 11:59 PM | 169 (3.9%) | 197 (4.9%) |
| Total | 4,288 (100.0%) | 3,999 (100.0%) |
Housing Occupancy in Niskayuna
Occupancy by Ownership in Niskayuna
Of the total 7,921 dwellings in Niskayuna, owner-occupied units account for 6,527 (82.4%), while renter-occupied units make up 1,394 (17.6%).
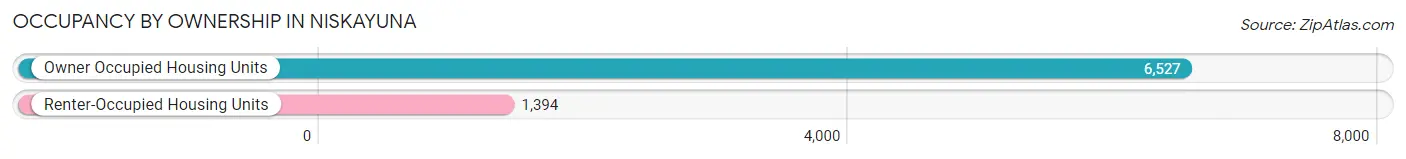
| Occupancy | # Housing Units | % Housing Units |
| Owner Occupied Housing Units | 6,527 | 82.4% |
| Renter-Occupied Housing Units | 1,394 | 17.6% |
| Total Occupied Housing Units | 7,921 | 100.0% |
Occupancy by Household Size in Niskayuna
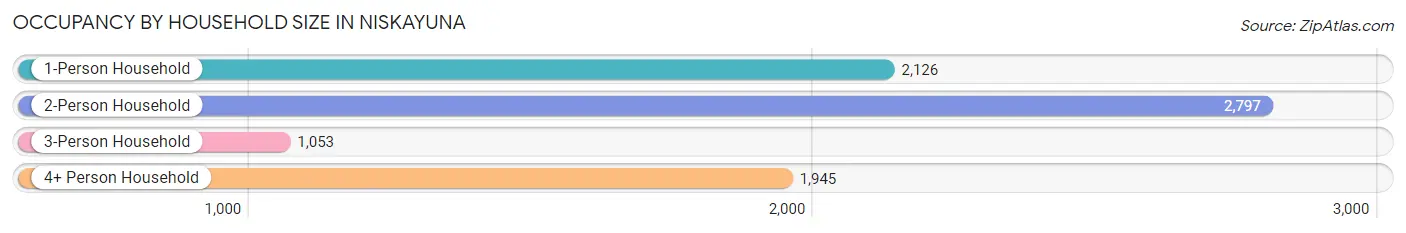
| Household Size | # Housing Units | % Housing Units |
| 1-Person Household | 2,126 | 26.8% |
| 2-Person Household | 2,797 | 35.3% |
| 3-Person Household | 1,053 | 13.3% |
| 4+ Person Household | 1,945 | 24.5% |
| Total Housing Units | 7,921 | 100.0% |
Occupancy by Ownership by Household Size in Niskayuna
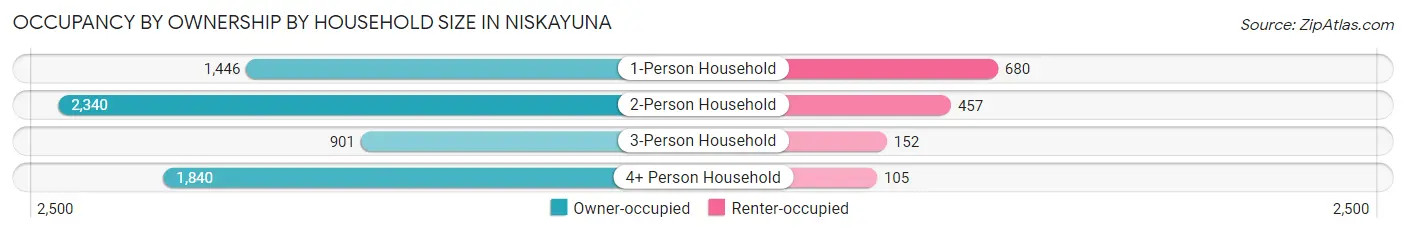
| Household Size | Owner-occupied | Renter-occupied |
| 1-Person Household | 1,446 (68.0%) | 680 (32.0%) |
| 2-Person Household | 2,340 (83.7%) | 457 (16.3%) |
| 3-Person Household | 901 (85.6%) | 152 (14.4%) |
| 4+ Person Household | 1,840 (94.6%) | 105 (5.4%) |
| Total Housing Units | 6,527 (82.4%) | 1,394 (17.6%) |
Occupancy by Educational Attainment in Niskayuna
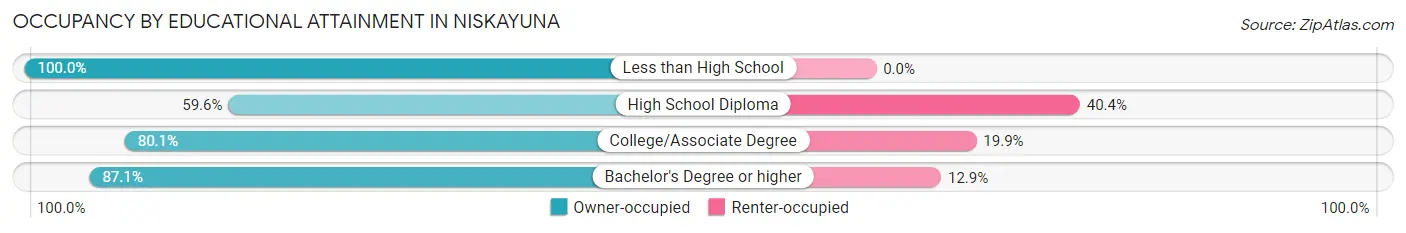
| Household Size | Owner-occupied | Renter-occupied |
| Less than High School | 22 (100.0%) | 0 (0.0%) |
| High School Diploma | 589 (59.6%) | 399 (40.4%) |
| College/Associate Degree | 1,210 (80.1%) | 300 (19.9%) |
| Bachelor's Degree or higher | 4,706 (87.1%) | 695 (12.9%) |
Occupancy by Age of Householder in Niskayuna
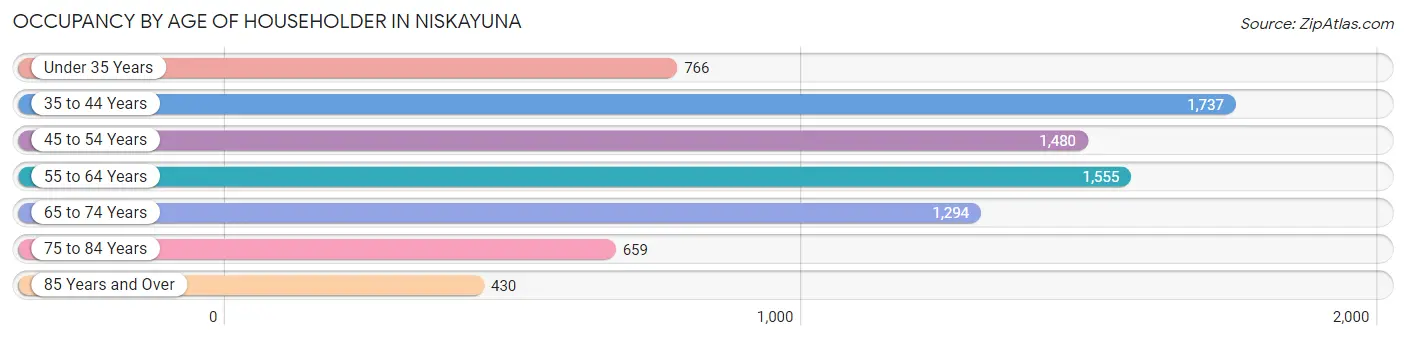
| Age Bracket | # Households | % Households |
| Under 35 Years | 766 | 9.7% |
| 35 to 44 Years | 1,737 | 21.9% |
| 45 to 54 Years | 1,480 | 18.7% |
| 55 to 64 Years | 1,555 | 19.6% |
| 65 to 74 Years | 1,294 | 16.3% |
| 75 to 84 Years | 659 | 8.3% |
| 85 Years and Over | 430 | 5.4% |
| Total | 7,921 | 100.0% |
Housing Finances in Niskayuna
Median Income by Occupancy in Niskayuna
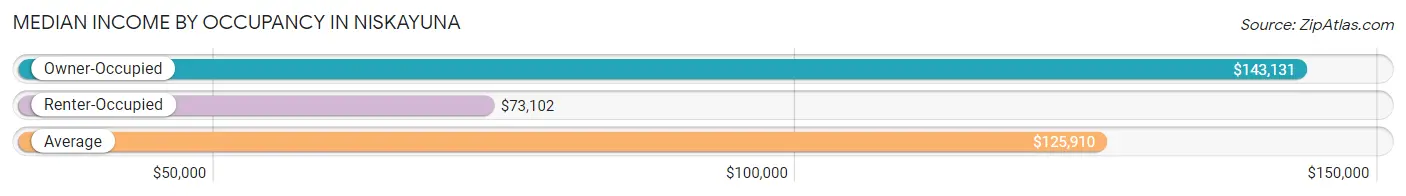
| Occupancy Type | # Households | Median Income |
| Owner-Occupied | 6,527 (82.4%) | $143,131 |
| Renter-Occupied | 1,394 (17.6%) | $73,102 |
| Average | 7,921 (100.0%) | $125,910 |
Occupancy by Householder Income Bracket in Niskayuna
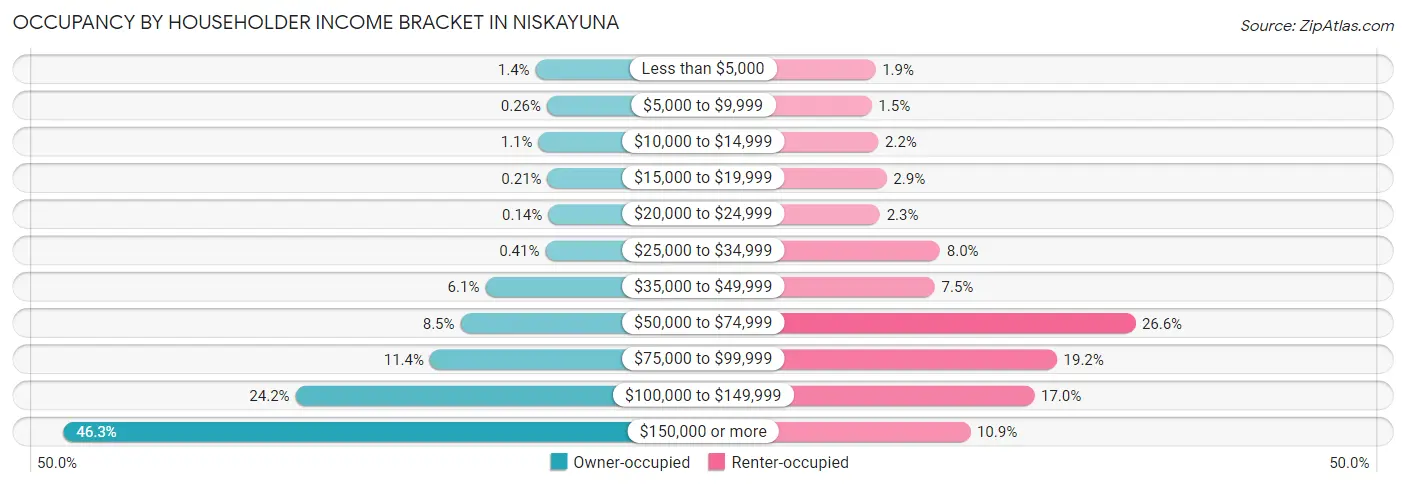
| Income Bracket | Owner-occupied | Renter-occupied |
| Less than $5,000 | 88 (1.3%) | 26 (1.9%) |
| $5,000 to $9,999 | 17 (0.3%) | 21 (1.5%) |
| $10,000 to $14,999 | 70 (1.1%) | 30 (2.1%) |
| $15,000 to $19,999 | 14 (0.2%) | 41 (2.9%) |
| $20,000 to $24,999 | 9 (0.1%) | 32 (2.3%) |
| $25,000 to $34,999 | 27 (0.4%) | 112 (8.0%) |
| $35,000 to $49,999 | 400 (6.1%) | 105 (7.5%) |
| $50,000 to $74,999 | 555 (8.5%) | 371 (26.6%) |
| $75,000 to $99,999 | 745 (11.4%) | 267 (19.2%) |
| $100,000 to $149,999 | 1,580 (24.2%) | 237 (17.0%) |
| $150,000 or more | 3,022 (46.3%) | 152 (10.9%) |
| Total | 6,527 (100.0%) | 1,394 (100.0%) |
Monthly Housing Cost Tiers in Niskayuna
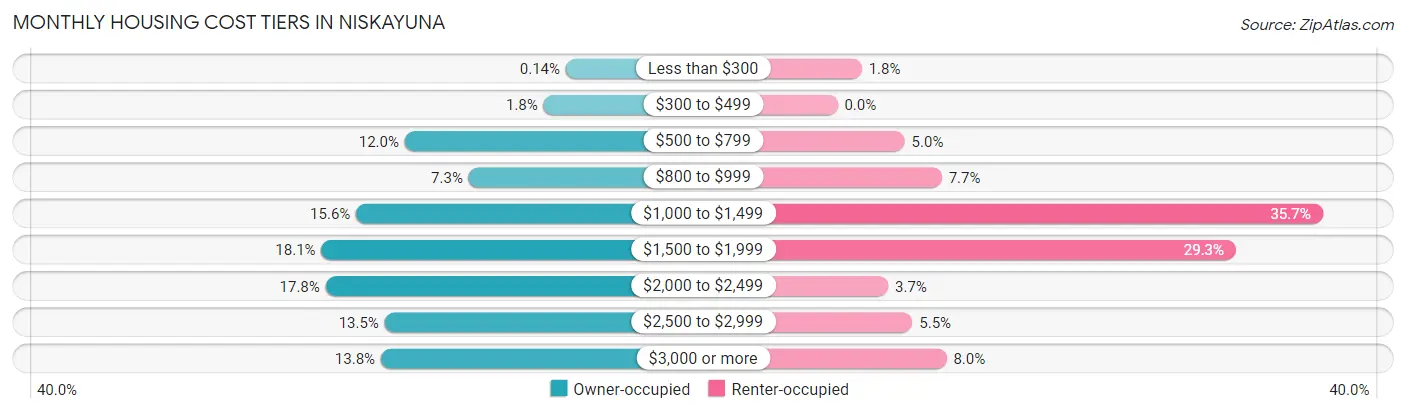
| Monthly Cost | Owner-occupied | Renter-occupied |
| Less than $300 | 9 (0.1%) | 25 (1.8%) |
| $300 to $499 | 116 (1.8%) | 0 (0.0%) |
| $500 to $799 | 783 (12.0%) | 69 (5.0%) |
| $800 to $999 | 476 (7.3%) | 107 (7.7%) |
| $1,000 to $1,499 | 1,017 (15.6%) | 498 (35.7%) |
| $1,500 to $1,999 | 1,184 (18.1%) | 409 (29.3%) |
| $2,000 to $2,499 | 1,164 (17.8%) | 52 (3.7%) |
| $2,500 to $2,999 | 880 (13.5%) | 77 (5.5%) |
| $3,000 or more | 898 (13.8%) | 112 (8.0%) |
| Total | 6,527 (100.0%) | 1,394 (100.0%) |
Physical Housing Characteristics in Niskayuna
Housing Structures in Niskayuna
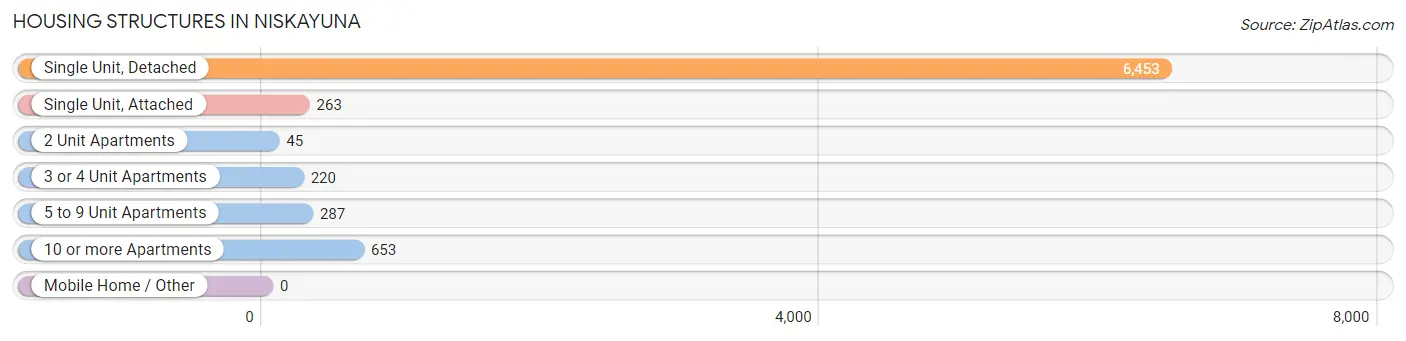
| Structure Type | # Housing Units | % Housing Units |
| Single Unit, Detached | 6,453 | 81.5% |
| Single Unit, Attached | 263 | 3.3% |
| 2 Unit Apartments | 45 | 0.6% |
| 3 or 4 Unit Apartments | 220 | 2.8% |
| 5 to 9 Unit Apartments | 287 | 3.6% |
| 10 or more Apartments | 653 | 8.2% |
| Mobile Home / Other | 0 | 0.0% |
| Total | 7,921 | 100.0% |
Housing Structures by Occupancy in Niskayuna
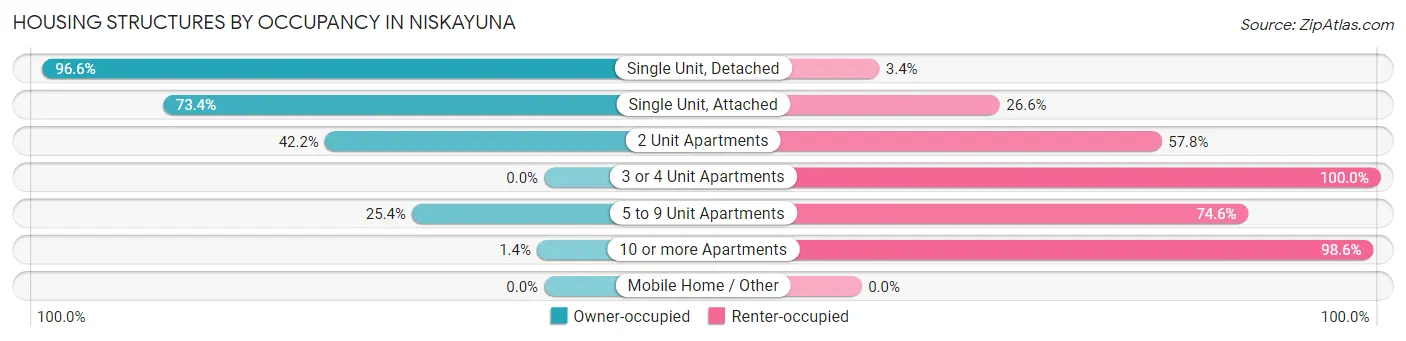
| Structure Type | Owner-occupied | Renter-occupied |
| Single Unit, Detached | 6,233 (96.6%) | 220 (3.4%) |
| Single Unit, Attached | 193 (73.4%) | 70 (26.6%) |
| 2 Unit Apartments | 19 (42.2%) | 26 (57.8%) |
| 3 or 4 Unit Apartments | 0 (0.0%) | 220 (100.0%) |
| 5 to 9 Unit Apartments | 73 (25.4%) | 214 (74.6%) |
| 10 or more Apartments | 9 (1.4%) | 644 (98.6%) |
| Mobile Home / Other | 0 (0.0%) | 0 (0.0%) |
| Total | 6,527 (82.4%) | 1,394 (17.6%) |
Housing Structures by Number of Rooms in Niskayuna
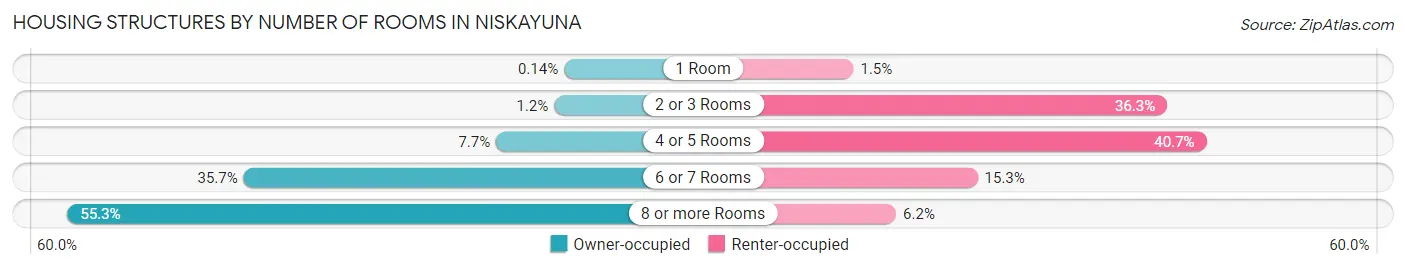
| Number of Rooms | Owner-occupied | Renter-occupied |
| 1 Room | 9 (0.1%) | 21 (1.5%) |
| 2 or 3 Rooms | 80 (1.2%) | 506 (36.3%) |
| 4 or 5 Rooms | 501 (7.7%) | 567 (40.7%) |
| 6 or 7 Rooms | 2,330 (35.7%) | 213 (15.3%) |
| 8 or more Rooms | 3,607 (55.3%) | 87 (6.2%) |
| Total | 6,527 (100.0%) | 1,394 (100.0%) |
Housing Structure by Heating Type in Niskayuna
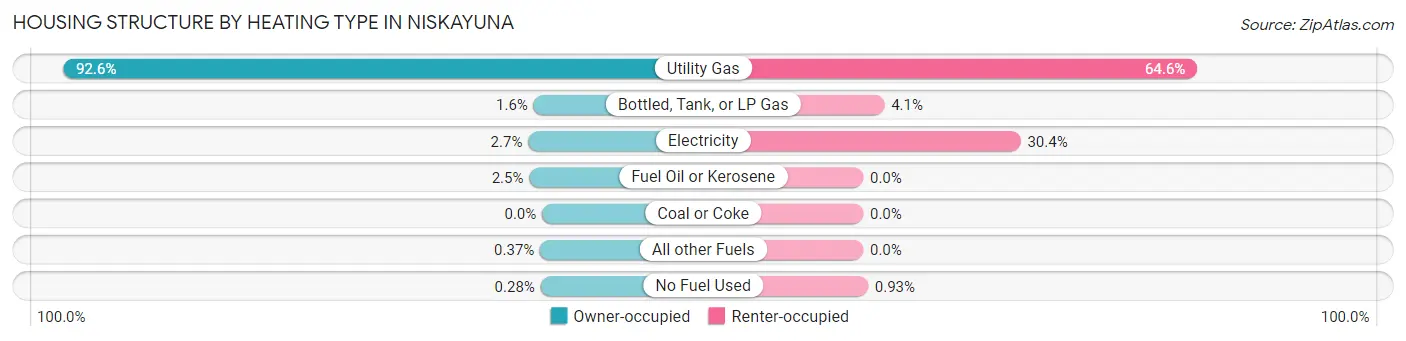
| Heating Type | Owner-occupied | Renter-occupied |
| Utility Gas | 6,043 (92.6%) | 900 (64.6%) |
| Bottled, Tank, or LP Gas | 106 (1.6%) | 57 (4.1%) |
| Electricity | 175 (2.7%) | 424 (30.4%) |
| Fuel Oil or Kerosene | 161 (2.5%) | 0 (0.0%) |
| Coal or Coke | 0 (0.0%) | 0 (0.0%) |
| All other Fuels | 24 (0.4%) | 0 (0.0%) |
| No Fuel Used | 18 (0.3%) | 13 (0.9%) |
| Total | 6,527 (100.0%) | 1,394 (100.0%) |
Household Vehicle Usage in Niskayuna
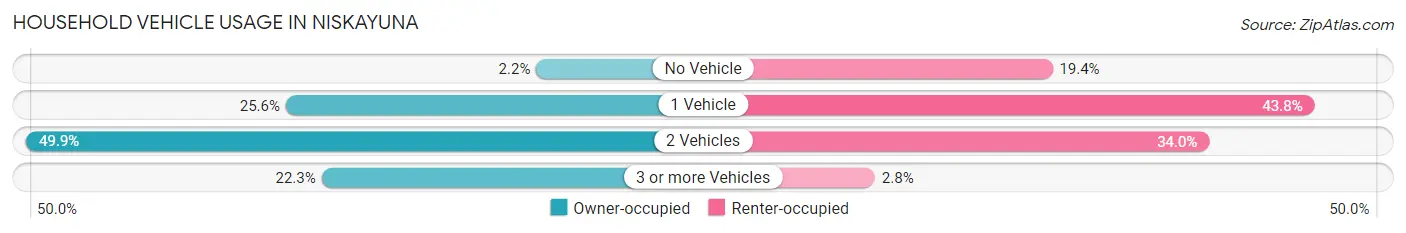
| Vehicles per Household | Owner-occupied | Renter-occupied |
| No Vehicle | 146 (2.2%) | 270 (19.4%) |
| 1 Vehicle | 1,672 (25.6%) | 611 (43.8%) |
| 2 Vehicles | 3,255 (49.9%) | 474 (34.0%) |
| 3 or more Vehicles | 1,454 (22.3%) | 39 (2.8%) |
| Total | 6,527 (100.0%) | 1,394 (100.0%) |
Real Estate & Mortgages in Niskayuna
Real Estate and Mortgage Overview in Niskayuna
| Characteristic | Without Mortgage | With Mortgage |
| Housing Units | 2,428 | 4,099 |
| Median Property Value | $299,300 | $311,300 |
| Median Household Income | $113,571 | $2,210 |
| Monthly Housing Costs | $941 | $898 |
| Real Estate Taxes | $7,507 | $16 |
Property Value by Mortgage Status in Niskayuna
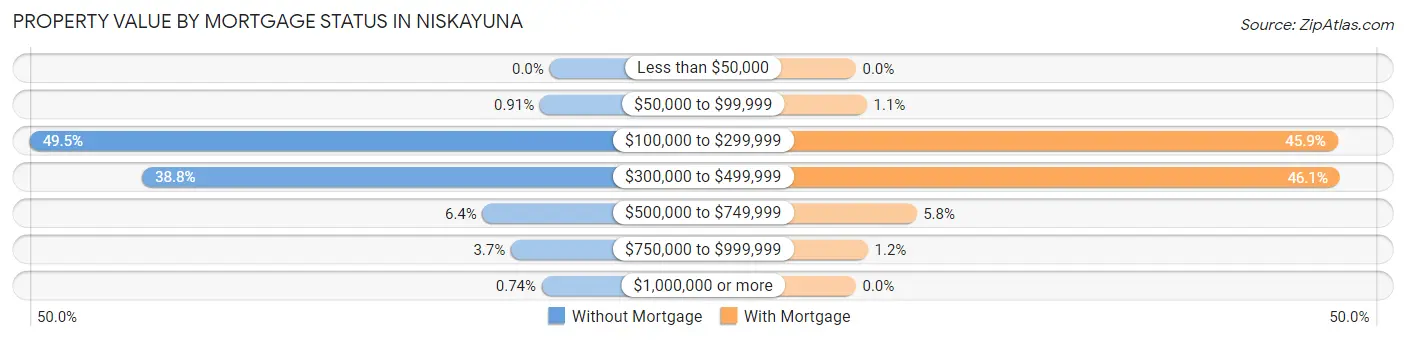
| Property Value | Without Mortgage | With Mortgage |
| Less than $50,000 | 0 (0.0%) | 0 (0.0%) |
| $50,000 to $99,999 | 22 (0.9%) | 43 (1.1%) |
| $100,000 to $299,999 | 1,202 (49.5%) | 1,882 (45.9%) |
| $300,000 to $499,999 | 942 (38.8%) | 1,890 (46.1%) |
| $500,000 to $749,999 | 155 (6.4%) | 237 (5.8%) |
| $750,000 to $999,999 | 89 (3.7%) | 47 (1.1%) |
| $1,000,000 or more | 18 (0.7%) | 0 (0.0%) |
| Total | 2,428 (100.0%) | 4,099 (100.0%) |
Household Income by Mortgage Status in Niskayuna
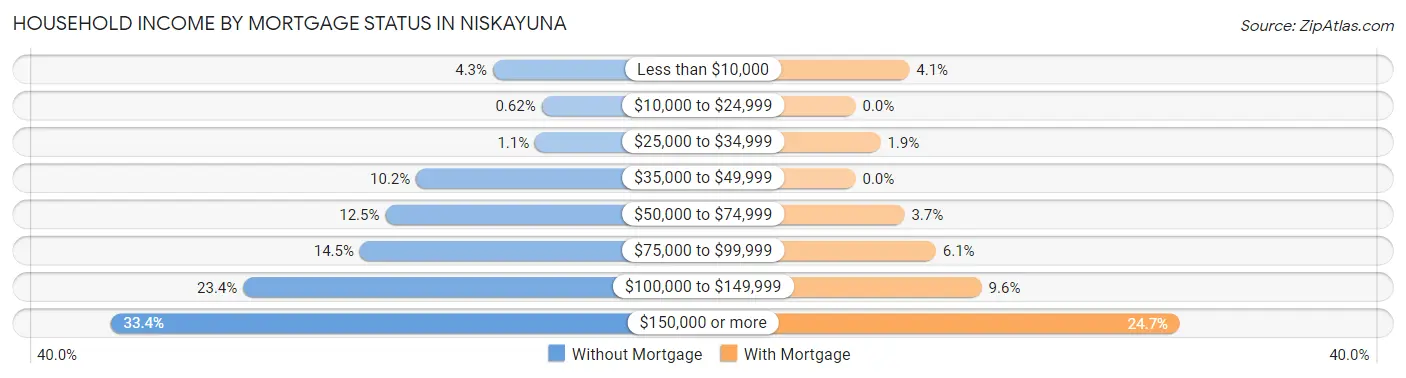
| Household Income | Without Mortgage | With Mortgage |
| Less than $10,000 | 105 (4.3%) | 168 (4.1%) |
| $10,000 to $24,999 | 15 (0.6%) | 0 (0.0%) |
| $25,000 to $34,999 | 27 (1.1%) | 78 (1.9%) |
| $35,000 to $49,999 | 247 (10.2%) | 0 (0.0%) |
| $50,000 to $74,999 | 304 (12.5%) | 153 (3.7%) |
| $75,000 to $99,999 | 351 (14.5%) | 251 (6.1%) |
| $100,000 to $149,999 | 567 (23.4%) | 394 (9.6%) |
| $150,000 or more | 812 (33.4%) | 1,013 (24.7%) |
| Total | 2,428 (100.0%) | 4,099 (100.0%) |
Property Value to Household Income Ratio in Niskayuna
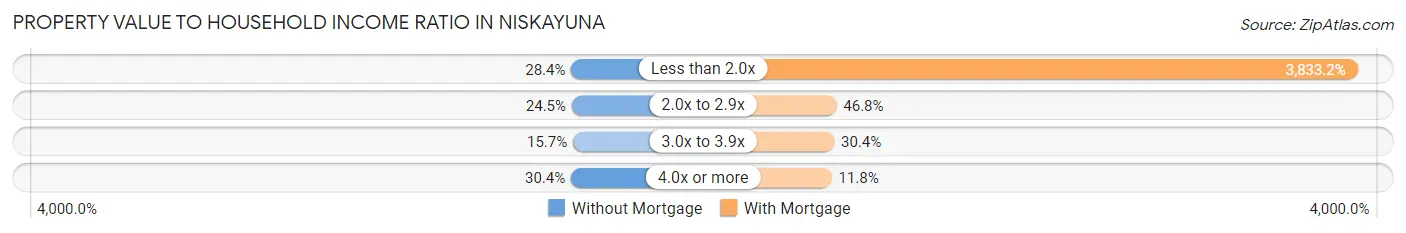
| Value-to-Income Ratio | Without Mortgage | With Mortgage |
| Less than 2.0x | 690 (28.4%) | 157,121 (3,833.1%) |
| 2.0x to 2.9x | 594 (24.5%) | 1,920 (46.8%) |
| 3.0x to 3.9x | 381 (15.7%) | 1,244 (30.3%) |
| 4.0x or more | 737 (30.3%) | 483 (11.8%) |
| Total | 2,428 (100.0%) | 4,099 (100.0%) |
Real Estate Taxes by Mortgage Status in Niskayuna
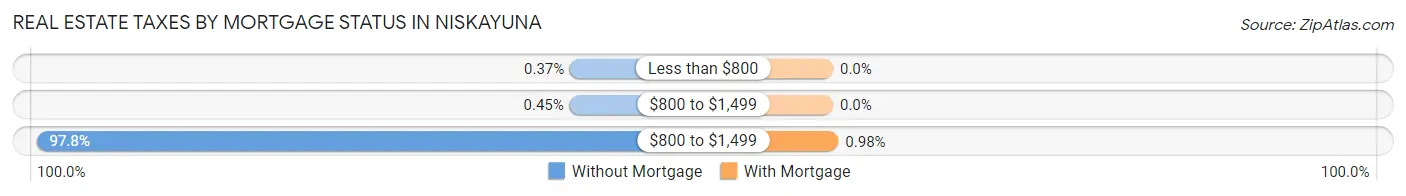
| Property Taxes | Without Mortgage | With Mortgage |
| Less than $800 | 9 (0.4%) | 0 (0.0%) |
| $800 to $1,499 | 11 (0.4%) | 0 (0.0%) |
| $800 to $1,499 | 2,375 (97.8%) | 40 (1.0%) |
| Total | 2,428 (100.0%) | 4,099 (100.0%) |
Health & Disability in Niskayuna
Health Insurance Coverage by Age in Niskayuna
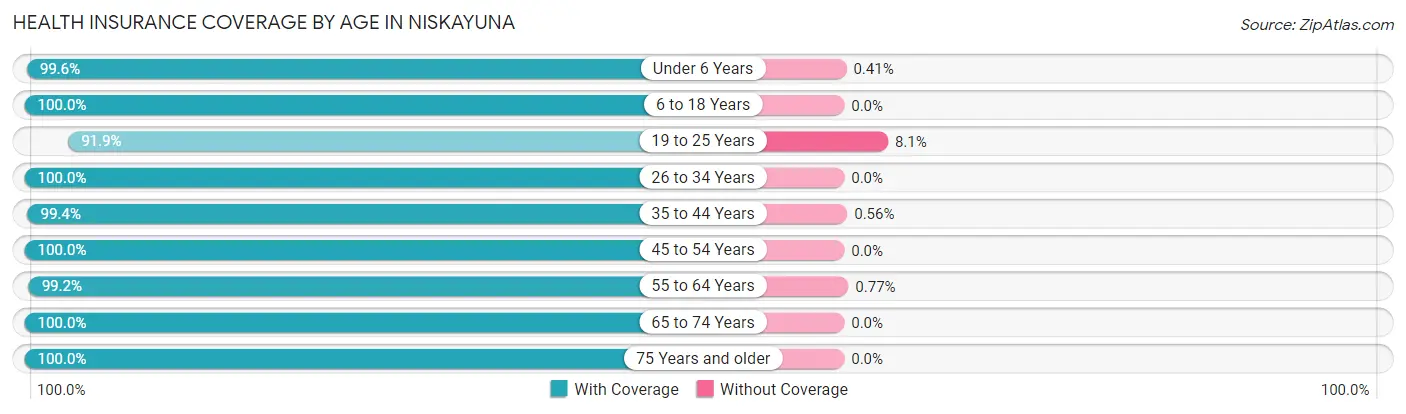
| Age Bracket | With Coverage | Without Coverage |
| Under 6 Years | 1,450 (99.6%) | 6 (0.4%) |
| 6 to 18 Years | 4,009 (100.0%) | 0 (0.0%) |
| 19 to 25 Years | 722 (91.9%) | 64 (8.1%) |
| 26 to 34 Years | 1,499 (100.0%) | 0 (0.0%) |
| 35 to 44 Years | 3,222 (99.4%) | 18 (0.6%) |
| 45 to 54 Years | 2,878 (100.0%) | 0 (0.0%) |
| 55 to 64 Years | 2,719 (99.2%) | 21 (0.8%) |
| 65 to 74 Years | 2,325 (100.0%) | 0 (0.0%) |
| 75 Years and older | 1,477 (100.0%) | 0 (0.0%) |
| Total | 20,301 (99.5%) | 109 (0.5%) |
Health Insurance Coverage by Citizenship Status in Niskayuna
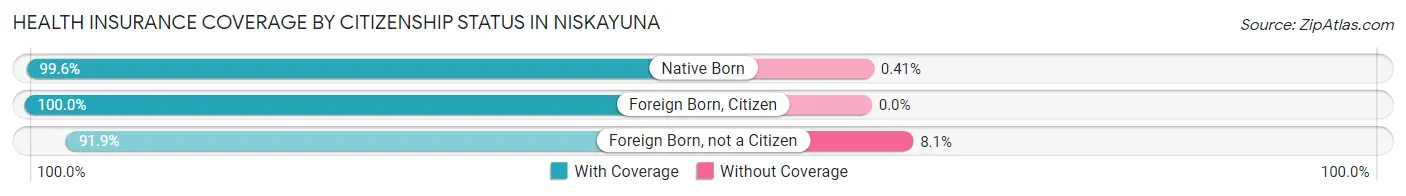
| Citizenship Status | With Coverage | Without Coverage |
| Native Born | 1,450 (99.6%) | 6 (0.4%) |
| Foreign Born, Citizen | 4,009 (100.0%) | 0 (0.0%) |
| Foreign Born, not a Citizen | 722 (91.9%) | 64 (8.1%) |
Health Insurance Coverage by Household Income in Niskayuna
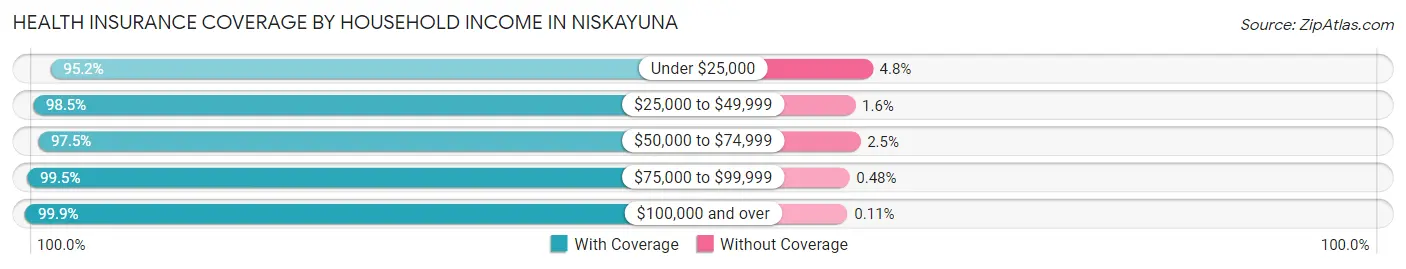
| Household Income | With Coverage | Without Coverage |
| Under $25,000 | 414 (95.2%) | 21 (4.8%) |
| $25,000 to $49,999 | 1,142 (98.5%) | 18 (1.5%) |
| $50,000 to $74,999 | 1,709 (97.5%) | 44 (2.5%) |
| $75,000 to $99,999 | 1,874 (99.5%) | 9 (0.5%) |
| $100,000 and over | 14,999 (99.9%) | 17 (0.1%) |
Public vs Private Health Insurance Coverage by Age in Niskayuna
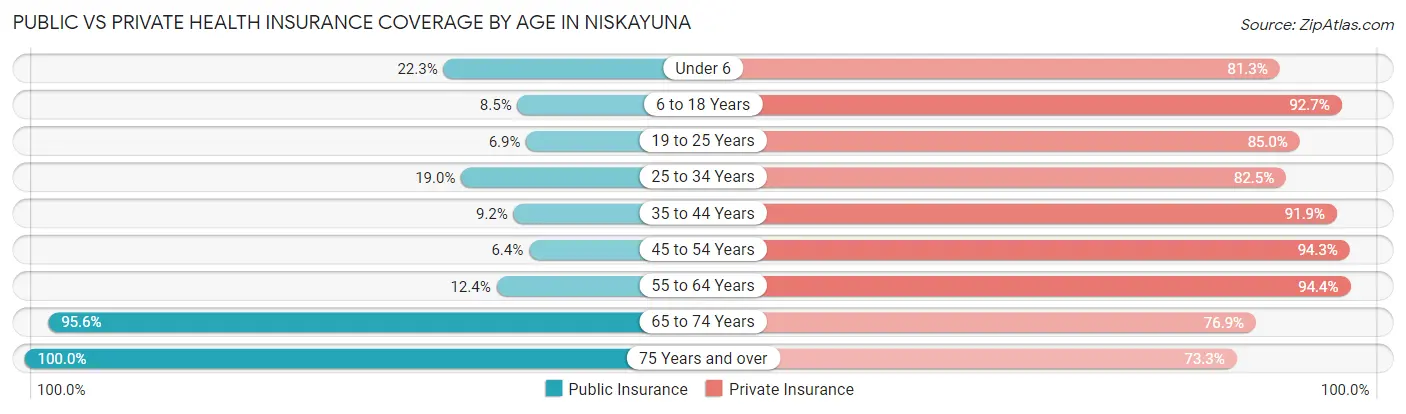
| Age Bracket | Public Insurance | Private Insurance |
| Under 6 | 324 (22.3%) | 1,183 (81.2%) |
| 6 to 18 Years | 341 (8.5%) | 3,718 (92.7%) |
| 19 to 25 Years | 54 (6.9%) | 668 (85.0%) |
| 25 to 34 Years | 284 (19.0%) | 1,236 (82.5%) |
| 35 to 44 Years | 299 (9.2%) | 2,977 (91.9%) |
| 45 to 54 Years | 183 (6.4%) | 2,713 (94.3%) |
| 55 to 64 Years | 340 (12.4%) | 2,586 (94.4%) |
| 65 to 74 Years | 2,223 (95.6%) | 1,787 (76.9%) |
| 75 Years and over | 1,477 (100.0%) | 1,082 (73.3%) |
| Total | 5,525 (27.1%) | 17,950 (87.9%) |
Disability Status by Sex by Age in Niskayuna
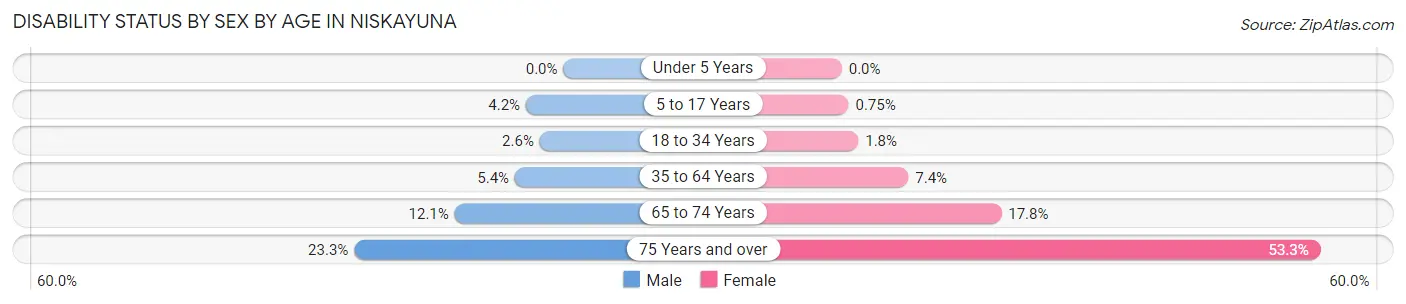
| Age Bracket | Male | Female |
| Under 5 Years | 0 (0.0%) | 0 (0.0%) |
| 5 to 17 Years | 79 (4.2%) | 17 (0.7%) |
| 18 to 34 Years | 28 (2.6%) | 25 (1.8%) |
| 35 to 64 Years | 247 (5.4%) | 317 (7.4%) |
| 65 to 74 Years | 124 (12.1%) | 231 (17.8%) |
| 75 Years and over | 151 (23.3%) | 442 (53.3%) |
Disability Class by Sex by Age in Niskayuna
Disability Class: Hearing Difficulty
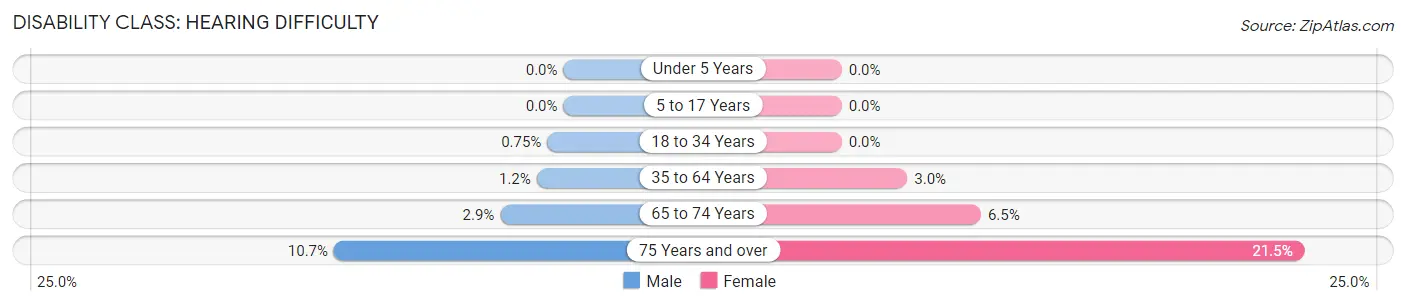
| Age Bracket | Male | Female |
| Under 5 Years | 0 (0.0%) | 0 (0.0%) |
| 5 to 17 Years | 0 (0.0%) | 0 (0.0%) |
| 18 to 34 Years | 8 (0.7%) | 0 (0.0%) |
| 35 to 64 Years | 57 (1.2%) | 130 (3.0%) |
| 65 to 74 Years | 30 (2.9%) | 84 (6.5%) |
| 75 Years and over | 69 (10.6%) | 178 (21.5%) |
Disability Class: Vision Difficulty
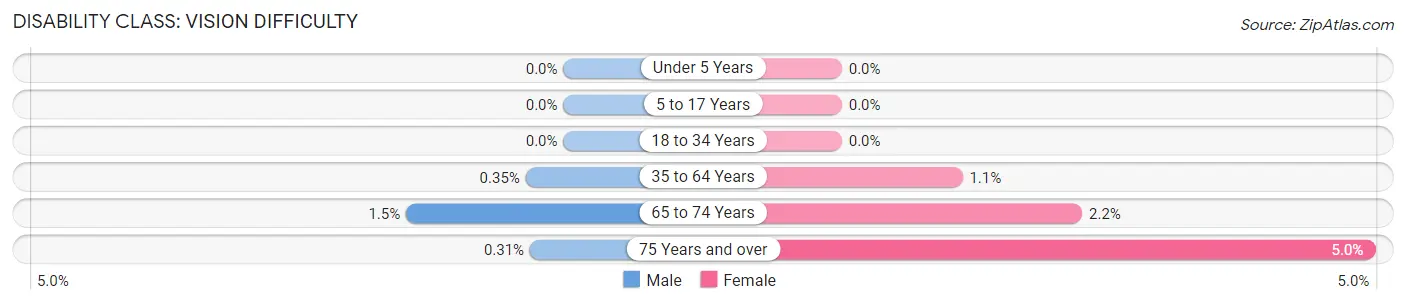
| Age Bracket | Male | Female |
| Under 5 Years | 0 (0.0%) | 0 (0.0%) |
| 5 to 17 Years | 0 (0.0%) | 0 (0.0%) |
| 18 to 34 Years | 0 (0.0%) | 0 (0.0%) |
| 35 to 64 Years | 16 (0.4%) | 48 (1.1%) |
| 65 to 74 Years | 15 (1.5%) | 29 (2.2%) |
| 75 Years and over | 2 (0.3%) | 41 (5.0%) |
Disability Class: Cognitive Difficulty
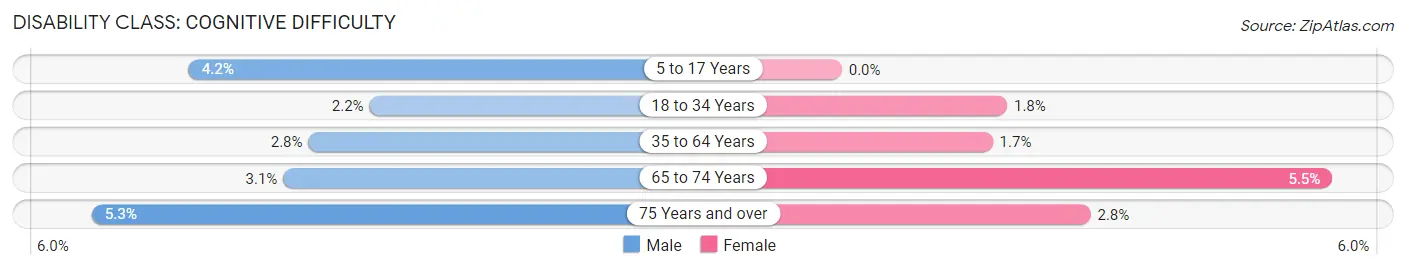
| Age Bracket | Male | Female |
| 5 to 17 Years | 79 (4.2%) | 0 (0.0%) |
| 18 to 34 Years | 23 (2.2%) | 25 (1.8%) |
| 35 to 64 Years | 130 (2.8%) | 72 (1.7%) |
| 65 to 74 Years | 32 (3.1%) | 71 (5.5%) |
| 75 Years and over | 34 (5.2%) | 23 (2.8%) |
Disability Class: Ambulatory Difficulty
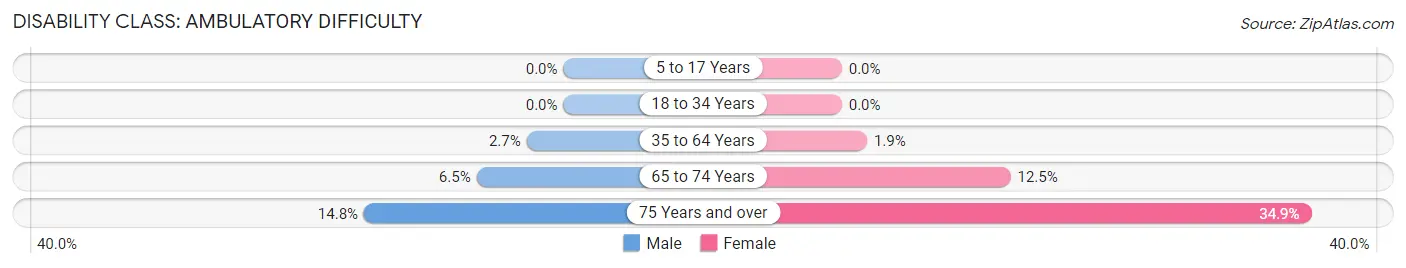
| Age Bracket | Male | Female |
| 5 to 17 Years | 0 (0.0%) | 0 (0.0%) |
| 18 to 34 Years | 0 (0.0%) | 0 (0.0%) |
| 35 to 64 Years | 125 (2.7%) | 80 (1.9%) |
| 65 to 74 Years | 66 (6.5%) | 163 (12.5%) |
| 75 Years and over | 96 (14.8%) | 289 (34.9%) |
Disability Class: Self-Care Difficulty
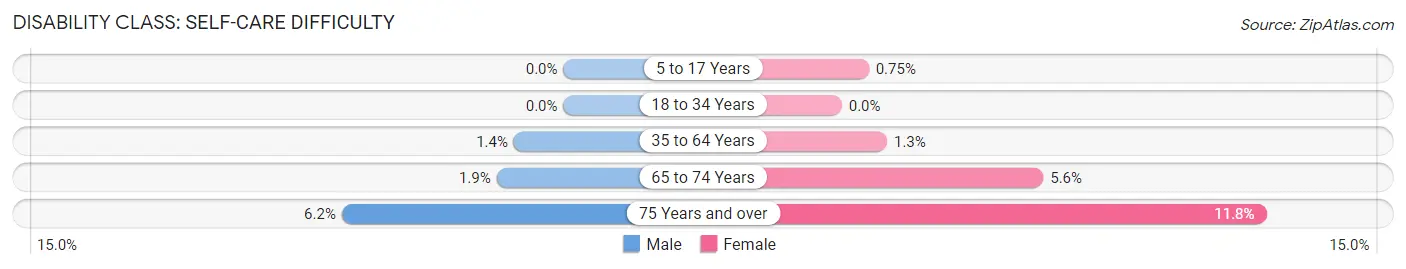
| Age Bracket | Male | Female |
| 5 to 17 Years | 0 (0.0%) | 17 (0.7%) |
| 18 to 34 Years | 0 (0.0%) | 0 (0.0%) |
| 35 to 64 Years | 63 (1.4%) | 54 (1.3%) |
| 65 to 74 Years | 19 (1.9%) | 73 (5.6%) |
| 75 Years and over | 40 (6.2%) | 98 (11.8%) |
Technology Access in Niskayuna
Computing Device Access in Niskayuna
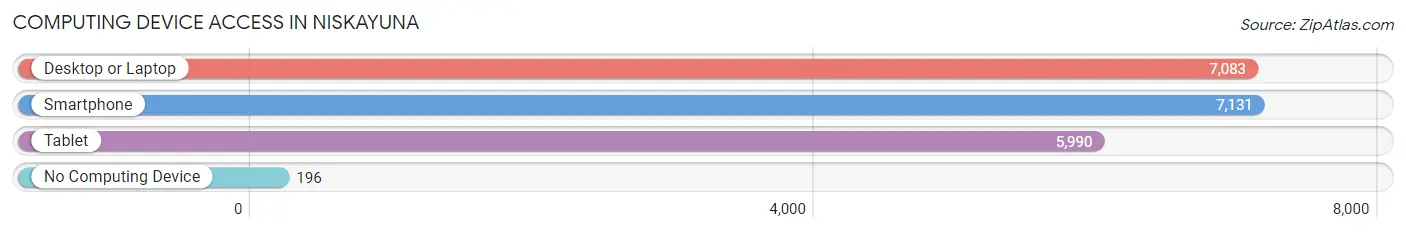
| Device Type | # Households | % Households |
| Desktop or Laptop | 7,083 | 89.4% |
| Smartphone | 7,131 | 90.0% |
| Tablet | 5,990 | 75.6% |
| No Computing Device | 196 | 2.5% |
| Total | 7,921 | 100.0% |
Internet Access in Niskayuna
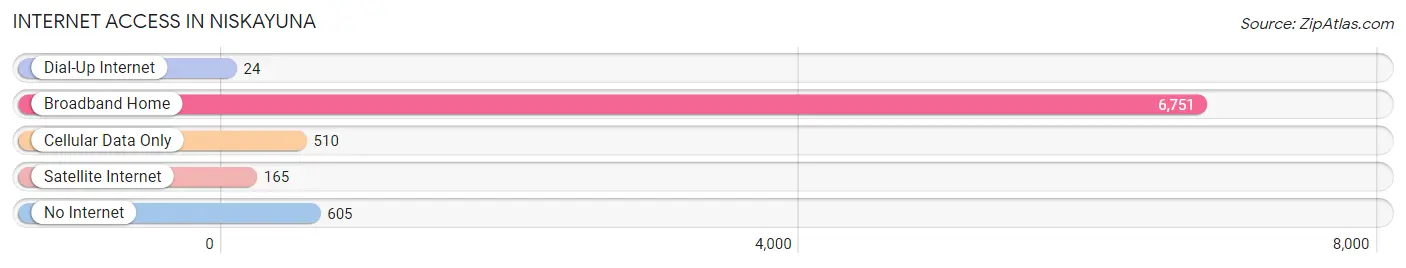
| Internet Type | # Households | % Households |
| Dial-Up Internet | 24 | 0.3% |
| Broadband Home | 6,751 | 85.2% |
| Cellular Data Only | 510 | 6.4% |
| Satellite Internet | 165 | 2.1% |
| No Internet | 605 | 7.6% |
| Total | 7,921 | 100.0% |
Niskayuna Summary
Niskayuna is a town located in Schenectady County, New York, United States. It is a suburb of the nearby city of Schenectady, and is located just north of the Mohawk River. The town had a population of 21,781 as of the 2010 census.
History
The area that is now Niskayuna was originally inhabited by the Mohawk people, who were part of the Iroquois Confederacy. The first European settlers arrived in the area in the late 17th century, and the town was officially established in 1793. The town was named after a Mohawk chief named Niskayuna, who was a leader of the local tribe.
The town was originally an agricultural community, and the first gristmill was built in 1790. The town was also home to several mills, including a paper mill, a sawmill, and a tannery. The town was also home to several iron works, which were important to the local economy.
In the late 19th century, the town began to experience rapid growth due to the development of the nearby city of Schenectady. The town was also home to several large estates, which were owned by wealthy families from the city.
Geography
Niskayuna is located in the northeastern part of Schenectady County, and is bordered by the towns of Clifton Park, Colonie, Glenville, and Rotterdam. The town is located just north of the Mohawk River, and is about 10 miles north of the city of Schenectady.
The town has a total area of 16.2 square miles, of which 16.1 square miles is land and 0.1 square miles is water. The town is mostly flat, with some rolling hills in the northern part of the town.
Economy
Niskayuna is primarily a residential community, and the town's economy is largely based on the service industry. The town is home to several large employers, including General Electric, Knolls Atomic Power Laboratory, and the State University of New York at Albany.
The town is also home to several shopping centers, including the Niskayuna Shopping Center and the Mohawk Commons Shopping Center. The town is also home to several restaurants, bars, and other businesses.
Demographics
As of the 2010 census, there were 21,781 people, 8,717 households, and 5,945 families living in the town. The population density was 1,346.2 people per square mile. The racial makeup of the town was 87.2% White, 5.3% African American, 0.2% Native American, 4.3% Asian, 0.1% Pacific Islander, 0.7% from other races, and 2.2% from two or more races. Hispanic or Latino of any race were 3.2% of the population.
The median income for a household in the town was $76,945, and the median income for a family was $93,945. The per capita income for the town was $37,945. About 3.2% of families and 4.7% of the population were below the poverty line, including 5.3% of those under age 18 and 4.2% of those age 65 or over.
Common Questions
What is Per Capita Income in Niskayuna?
Per Capita income in Niskayuna is $58,180.
What is the Median Family Income in Niskayuna?
Median Family Income in Niskayuna is $157,261.
What is the Median Household income in Niskayuna?
Median Household Income in Niskayuna is $125,910.
What is Income or Wage Gap in Niskayuna?
Income or Wage Gap in Niskayuna is 40.1%.
Women in Niskayuna earn 59.9 cents for every dollar earned by a man.
What is Inequality or Gini Index in Niskayuna?
Inequality or Gini Index in Niskayuna is 0.37.
What is the Total Population of Niskayuna?
Total Population of Niskayuna is 20,629.
What is the Total Male Population of Niskayuna?
Total Male Population of Niskayuna is 10,022.
What is the Total Female Population of Niskayuna?
Total Female Population of Niskayuna is 10,607.
What is the Ratio of Males per 100 Females in Niskayuna?
There are 94.48 Males per 100 Females in Niskayuna.
What is the Ratio of Females per 100 Males in Niskayuna?
There are 105.84 Females per 100 Males in Niskayuna.
What is the Median Population Age in Niskayuna?
Median Population Age in Niskayuna is 42.7 Years.
What is the Average Family Size in Niskayuna
Average Family Size in Niskayuna is 3.2 People.
What is the Average Household Size in Niskayuna
Average Household Size in Niskayuna is 2.6 People.
How Large is the Labor Force in Niskayuna?
There are 10,406 People in the Labor Forcein in Niskayuna.
What is the Percentage of People in the Labor Force in Niskayuna?
65.0% of People are in the Labor Force in Niskayuna.
What is the Unemployment Rate in Niskayuna?
Unemployment Rate in Niskayuna is 2.7%.