Zip Codes with the Highest Percentage of Immigrants from Burma / Myanmar in Washington

RELATED REPORTS & OPTIONS

Burma / Myanmar
Population
Families and Households
Female Fertility
Female Fertility (Unmarried)
Race (Community Size)
Race (Percentage)
Ancestry (Community Size)
AfghanAfricanAlaska NativeAlaskan AthabascanAlbanianAleutAlsatianAmericanApacheArabArapahoArgentineanArmenianAssyrian / Chaldean / SyriacAustralianAustrianBahamianBangladeshiBarbadianBasqueBelgianBelizeanBermudanBhutaneseBlackfeetBolivianBrazilianBritishBritish West IndianBulgarianBurmeseCajunCambodianCanadianCape VerdeanCarpatho RusynCelticCentral AmericanCentral American IndianCherokeeCheyenneChickasawChileanChineseChippewaChoctawColombianColvilleComancheCosta RicanCreeCreekCroatianCrowCubanCypriotCzechCzechoslovakianDanishDelawareDominicanDutchDutch West IndianEastern EuropeanEcuadorianEgyptianEnglishEstonianEthiopianEuropeanFijianFilipinoFinnishFrenchFrench American IndianFrench CanadianGermanGerman RussianGhanaianGreekGuamanian / ChamorroGuatemalanGuyaneseHaitianHmongHonduranHopiHoumaHungarianIcelanderIndian (Asian)IndonesianInupiatIranianIraqiIrishIroquoisIsraeliItalianJamaicanJapaneseJordanianKenyanKiowaKoreanLaotianLatvianLebaneseLiberianLithuanianLumbeeLuxembourgerMacedonianMalaysianMalteseMarshalleseMenomineeMexicanMexican American IndianMongolianMoroccanNative HawaiianNavajoNepaleseNew ZealanderNicaraguanNigerianNorthern EuropeanNorwegianOkinawanOsageOttawaPaiutePakistaniPalestinianPanamanianParaguayanPennsylvania GermanPeruvianPimaPolishPortuguesePotawatomiPuebloPuerto RicanPuget Sound SalishRomanianRussianSalvadoranSamoanScandinavianScotch-IrishScottishSeminoleSenegaleseSerbianShoshoneSierra LeoneanSiouxSlavicSlovakSloveneSomaliSouth AfricanSouth AmericanSouth American IndianSoviet UnionSpaniardSpanishSpanish AmericanSpanish American IndianSri LankanSubsaharan AfricanSudaneseSwedishSwissSyrianTaiwaneseThaiTlingit-HaidaTohono O'OdhamTonganTrinidadian and TobagonianTsimshianTurkishU.S. Virgin IslanderUgandanUkrainianUruguayanUteVenezuelanVietnameseWelshWest IndianYakamaYaquiYugoslavianYumanYup'ikZimbabwean
Ancestry (Percentage)
AfghanAfricanAlaska NativeAlaskan AthabascanAlbanianAleutAlsatianAmericanApacheArabArapahoArgentineanArmenianAssyrian / Chaldean / SyriacAustralianAustrianBahamianBangladeshiBarbadianBasqueBelgianBelizeanBermudanBhutaneseBlackfeetBolivianBrazilianBritishBritish West IndianBulgarianBurmeseCajunCambodianCanadianCape VerdeanCarpatho RusynCelticCentral AmericanCentral American IndianCherokeeCheyenneChickasawChileanChineseChippewaChoctawColombianColvilleComancheCosta RicanCreeCreekCroatianCrowCubanCypriotCzechCzechoslovakianDanishDelawareDominicanDutchDutch West IndianEastern EuropeanEcuadorianEgyptianEnglishEstonianEthiopianEuropeanFijianFilipinoFinnishFrenchFrench American IndianFrench CanadianGermanGerman RussianGhanaianGreekGuamanian / ChamorroGuatemalanGuyaneseHaitianHmongHonduranHopiHoumaHungarianIcelanderIndian (Asian)IndonesianInupiatIranianIraqiIrishIroquoisIsraeliItalianJamaicanJapaneseJordanianKenyanKiowaKoreanLaotianLatvianLebaneseLiberianLithuanianLumbeeLuxembourgerMacedonianMalaysianMalteseMarshalleseMenomineeMexicanMexican American IndianMongolianMoroccanNative HawaiianNavajoNepaleseNew ZealanderNicaraguanNigerianNorthern EuropeanNorwegianOkinawanOsageOttawaPaiutePakistaniPalestinianPanamanianParaguayanPennsylvania GermanPeruvianPimaPolishPortuguesePotawatomiPuebloPuerto RicanPuget Sound SalishRomanianRussianSalvadoranSamoanScandinavianScotch-IrishScottishSeminoleSenegaleseSerbianShoshoneSierra LeoneanSiouxSlavicSlovakSloveneSomaliSouth AfricanSouth AmericanSouth American IndianSoviet UnionSpaniardSpanishSpanish AmericanSpanish American IndianSri LankanSubsaharan AfricanSudaneseSwedishSwissSyrianTaiwaneseThaiTlingit-HaidaTohono O'OdhamTonganTrinidadian and TobagonianTsimshianTurkishU.S. Virgin IslanderUgandanUkrainianUruguayanUteVenezuelanVietnameseWelshWest IndianYakamaYaquiYugoslavianYumanYup'ikZimbabwean
Immigrant Origin (Total)
AfghanistanAfricaAlbaniaArgentinaArmeniaAsiaAustraliaAustriaAzoresBahamasBangladeshBarbadosBelarusBelgiumBelizeBoliviaBosnia and HerzegovinaBrazilBulgariaBurma / MyanmarCabo VerdeCambodiaCameroonCanadaCaribbeanCentral AmericaChileChinaColombiaCongoCosta RicaCroatiaCubaCzechoslovakiaDenmarkDominicaDominican RepublicEastern AfricaEastern AsiaEastern EuropeEcuadorEgyptEl SalvadorEnglandEritreaEthiopiaEuropeFijiFranceGermanyGhanaGreeceGrenadaGuatemalaGuyanaHaitiHondurasHong KongHungaryIndiaIndonesiaIranIraqIrelandIsraelItalyJamaicaJapanJordanKazakhstanKenyaKoreaKuwaitLaosLatin AmericaLatviaLebanonLiberiaLithuaniaMalaysiaMexicoMicronesiaMiddle AfricaMoldovaMoroccoNepalNetherlandsNicaraguaNigeriaNorth MacedoniaNorthern AfricaNorthern EuropeNorwayOceaniaPakistanPanamaPeruPhilippinesPolandPortugalRomaniaRussiaSaudi ArabiaScotlandSenegalSerbiaSierra LeoneSingaporeSomaliaSouth AfricaSouth AmericaSouth Central AsiaSouth Eastern AsiaSouthern EuropeSpainSri LankaSt. Vincent and the GrenadinesSudanSwedenSwitzerlandSyriaTaiwanThailandTrinidad and TobagoTurkeyUgandaUkraineUruguayUzbekistanVenezuelaVietnamWest IndiesWestern AfricaWestern AsiaWestern EuropeYemenZaireZimbabwe
Immigrant Origin (Percentage)
AfghanistanAfricaAlbaniaArgentinaArmeniaAsiaAustraliaAustriaAzoresBahamasBangladeshBarbadosBelarusBelgiumBelizeBoliviaBosnia and HerzegovinaBrazilBulgariaBurma / MyanmarCabo VerdeCambodiaCameroonCanadaCaribbeanCentral AmericaChileChinaColombiaCongoCosta RicaCroatiaCubaCzechoslovakiaDenmarkDominicaDominican RepublicEastern AfricaEastern AsiaEastern EuropeEcuadorEgyptEl SalvadorEnglandEritreaEthiopiaEuropeFijiFranceGermanyGhanaGreeceGrenadaGuatemalaGuyanaHaitiHondurasHong KongHungaryIndiaIndonesiaIranIraqIrelandIsraelItalyJamaicaJapanJordanKazakhstanKenyaKoreaKuwaitLaosLatin AmericaLatviaLebanonLiberiaLithuaniaMalaysiaMexicoMicronesiaMiddle AfricaMoldovaMoroccoNepalNetherlandsNicaraguaNigeriaNorth MacedoniaNorthern AfricaNorthern EuropeNorwayOceaniaPakistanPanamaPeruPhilippinesPolandPortugalRomaniaRussiaSaudi ArabiaScotlandSenegalSerbiaSierra LeoneSingaporeSomaliaSouth AfricaSouth AmericaSouth Central AsiaSouth Eastern AsiaSouthern EuropeSpainSri LankaSt. Vincent and the GrenadinesSudanSwedenSwitzerlandSyriaTaiwanThailandTrinidad and TobagoTurkeyUgandaUkraineUruguayUzbekistanVenezuelaVietnamWest IndiesWestern AfricaWestern AsiaWestern EuropeYemenZaireZimbabwe
Income
Income (Families)
Income (Households)
Poverty
Poverty (Families)
Unemployment
Employment Occupations
Employment Industries
Employer Class
Commute Time
Commute Means
School Enrollment
Education by Degree Field
Occupancy
Finances
Physical Characteristics
Washington
Compare Zip Codes
Comparison Subject

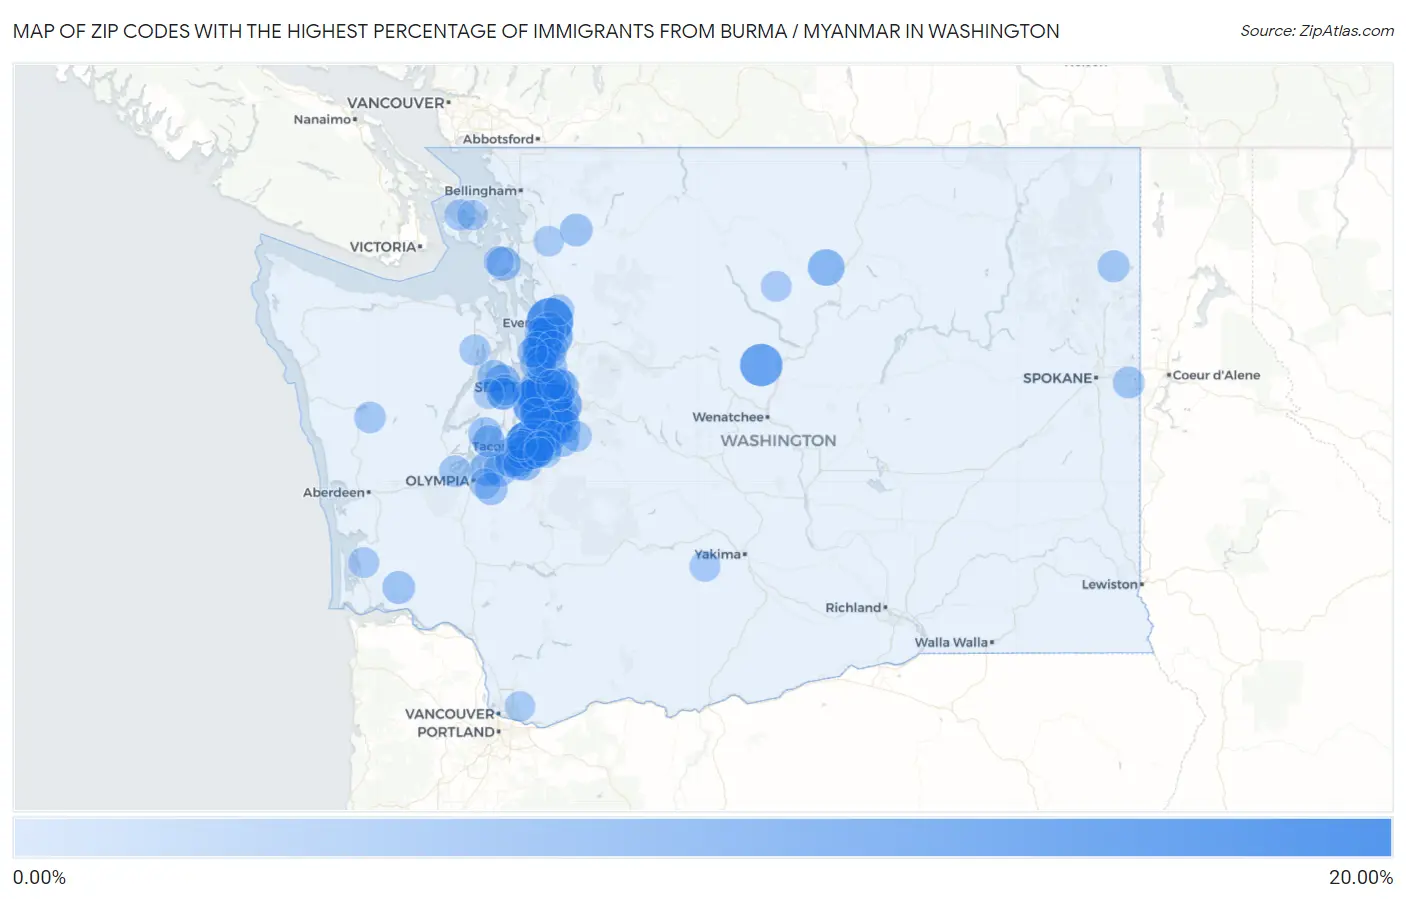
Map of Zip Codes with the Highest Percentage of Immigrants from Burma / Myanmar in Washington

0.00%
4.00%
Zip Codes with the Highest Percentage of Immigrants from Burma / Myanmar in Washington Map

Zip Codes with the Highest Percentage of Immigrants from Burma / Myanmar in Washington

Zip Code Burma / Myanmar vs State vs National
1.988293.45%0.041%(+3.41)#200.047%(+3.40)#375
2.982072.89%0.041%(+2.85)#210.047%(+2.84)#376
3.980301.19%0.041%(+1.15)#220.047%(+1.15)#377
4.981681.05%0.041%(+1.01)#230.047%(+1.000)#378
5.981880.81%0.041%(+0.765)#240.047%(+0.759)#379
6.982660.68%0.041%(+0.637)#1650.047%(+0.630)#3,527
7.980320.48%0.041%(+0.439)#1660.047%(+0.433)#3,528
8.980100.47%0.041%(+0.432)#1670.047%(+0.426)#3,529
9.980310.45%0.041%(+0.413)#1680.047%(+0.407)#3,530
10.988480.43%0.041%(+0.391)#2270.047%(+0.385)#5,542
11.992070.39%0.041%(+0.350)#2280.047%(+0.344)#5,543
12.993370.38%0.041%(+0.339)#2290.047%(+0.333)#5,544
13.992180.36%0.041%(+0.321)#2330.047%(+0.314)#5,788
14.989420.34%0.041%(+0.297)#2750.047%(+0.291)#7,576
15.985960.24%0.041%(+0.199)#3310.047%(+0.193)#10,494
16.984080.24%0.041%(+0.197)#3320.047%(+0.190)#10,495
17.980060.24%0.041%(+0.195)#3330.047%(+0.189)#10,496
18.992050.22%0.041%(+0.180)#3340.047%(+0.174)#10,497
19.993010.22%0.041%(+0.178)#3350.047%(+0.172)#10,498
20.980420.22%0.041%(+0.176)#3360.047%(+0.169)#10,499
21.984030.20%0.041%(+0.156)#3370.047%(+0.150)#10,500
22.982750.15%0.041%(+0.113)#3380.047%(+0.107)#10,501
23.992020.15%0.041%(+0.112)#3390.047%(+0.106)#10,502
24.986070.14%0.041%(+0.099)#3400.047%(+0.093)#10,503
25.984070.12%0.041%(+0.082)#3410.047%(+0.076)#10,504
26.986840.11%0.041%(+0.072)#3420.047%(+0.066)#10,505
27.981480.11%0.041%(+0.071)#3430.047%(+0.065)#10,506
28.980260.10%0.041%(+0.061)#3440.047%(+0.055)#10,507
29.984330.093%0.041%(+0.052)#3450.047%(+0.046)#10,508
30.981330.084%0.041%(+0.043)#3460.047%(+0.037)#10,509
31.980360.078%0.041%(+0.037)#3470.047%(+0.031)#10,510
32.992010.077%0.041%(+0.036)#3480.047%(+0.030)#10,511
33.980030.070%0.041%(+0.029)#3490.047%(+0.023)#10,512
34.981990.067%0.041%(+0.026)#3500.047%(+0.020)#10,513
35.980450.065%0.041%(+0.024)#3510.047%(+0.017)#10,514
36.986820.064%0.041%(+0.023)#3520.047%(+0.017)#10,515
37.980920.063%0.041%(+0.022)#3530.047%(+0.016)#10,516
38.983750.058%0.041%(+0.017)#3540.047%(+0.011)#10,517
39.982250.050%0.041%(+0.009)#3550.047%(+0.003)#10,518
40.981180.045%0.041%(+0.004)#3560.047%(-0.002)#10,519
41.982040.043%0.041%(+0.002)#3570.047%(-0.004)#10,520
42.982820.034%0.041%(-0.007)#3580.047%(-0.013)#10,521
43.991630.033%0.041%(-0.009)#3590.047%(-0.015)#10,522
44.980870.024%0.041%(-0.017)#3600.047%(-0.024)#10,523
45.980340.019%0.041%(-0.022)#3610.047%(-0.028)#10,524
46.983740.018%0.041%(-0.024)#3620.047%(-0.030)#10,525
47.982030.016%0.041%(-0.025)#3630.047%(-0.031)#10,526
48.981050.016%0.041%(-0.025)#3640.047%(-0.032)#10,527
49.982010.0098%0.041%(-0.031)#3650.047%(-0.038)#10,528
50.980580.0095%0.041%(-0.032)#3660.047%(-0.038)#10,529
51.981150.0092%0.041%(-0.032)#3670.047%(-0.038)#10,530
52.984980.0071%0.041%(-0.034)#3680.047%(-0.040)#10,531

Common Questions

What are the Top 10 Zip Codes with the Highest Percentage of Immigrants from Burma / Myanmar in Washington?
Top 10 Zip Codes with the Highest Percentage of Immigrants from Burma / Myanmar in Washington are:
#1
3.45%
#2
2.89%
#3
1.19%
#4
1.05%
#5
0.81%
#6
0.68%
#7
0.48%
#8
0.47%
#9
0.45%
#10
0.43%
What zip code has the Highest Percentage of Immigrants from Burma / Myanmar in Washington?
98829 has the Highest Percentage of Immigrants from Burma / Myanmar in Washington with 3.45%.
What is the Percentage of Immigrants from Burma / Myanmar in the State of Washington?
Percentage of Immigrants from Burma / Myanmar in Washington is 0.041%.
What is the Percentage of Immigrants from Burma / Myanmar in the United States?
Percentage of Immigrants from Burma / Myanmar in the United States is 0.047%.