Nixon, PA Map & Demographics
Nixon Map
Nixon Overview
$58,026
PER CAPITA INCOME
$150,223
AVG FAMILY INCOME
$124,815
AVG HOUSEHOLD INCOME
0.40
INEQUALITY / GINI INDEX
1,483
TOTAL POPULATION
692
MALE POPULATION
791
FEMALE POPULATION
87.48
MALES / 100 FEMALES
114.31
FEMALES / 100 MALES
45.7
MEDIAN AGE
3.1
AVG FAMILY SIZE
2.7
AVG HOUSEHOLD SIZE
868
LABOR FORCE [ PEOPLE ]
71.3%
PERCENT IN LABOR FORCE
2.8%
UNEMPLOYMENT RATE
Income in Nixon
Income Overview in Nixon
Per Capita Income in Nixon is $58,026, while median incomes of families and households are $150,223 and $124,815 respectively.
| Characteristic | Number | Measure |
| Per Capita Income | 1,483 | $58,026 |
| Median Family Income | 427 | $150,223 |
| Mean Family Income | 427 | $176,785 |
| Median Household Income | 540 | $124,815 |
| Mean Household Income | 540 | $156,682 |
| Income Deficit | 427 | $0 |
| Wage / Income Gap (%) | 1,483 | 0.00% |
| Wage / Income Gap ($) | 1,483 | 100.00¢ per $1 |
| Gini / Inequality Index | 1,483 | 0.40 |
Earnings by Sex in Nixon
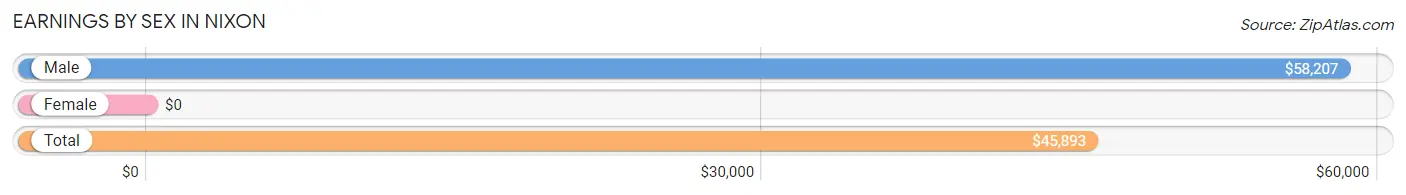
| Sex | Number | Average Earnings |
| Male | 579 (61.9%) | $58,207 |
| Female | 356 (38.1%) | $0 |
| Total | 935 (100.0%) | $45,893 |
Earnings by Sex by Income Bracket in Nixon
The most common earnings brackets in Nixon are $100,000+ for men (163 | 28.1%) and $7,500 to $9,999 for women (77 | 21.6%).
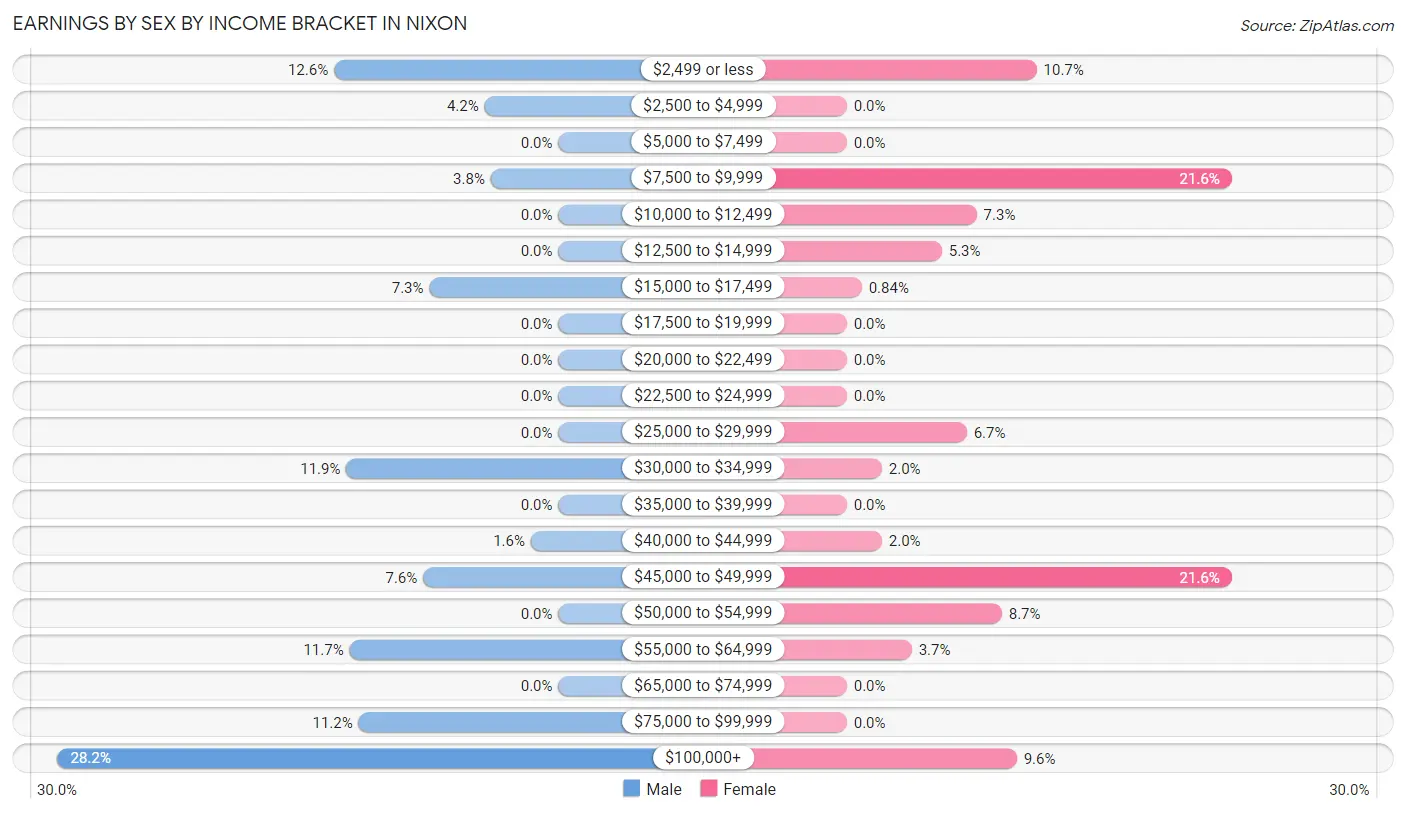
| Income | Male | Female |
| $2,499 or less | 73 (12.6%) | 38 (10.7%) |
| $2,500 to $4,999 | 24 (4.2%) | 0 (0.0%) |
| $5,000 to $7,499 | 0 (0.0%) | 0 (0.0%) |
| $7,500 to $9,999 | 22 (3.8%) | 77 (21.6%) |
| $10,000 to $12,499 | 0 (0.0%) | 26 (7.3%) |
| $12,500 to $14,999 | 0 (0.0%) | 19 (5.3%) |
| $15,000 to $17,499 | 42 (7.2%) | 3 (0.8%) |
| $17,500 to $19,999 | 0 (0.0%) | 0 (0.0%) |
| $20,000 to $22,499 | 0 (0.0%) | 0 (0.0%) |
| $22,500 to $24,999 | 0 (0.0%) | 0 (0.0%) |
| $25,000 to $29,999 | 0 (0.0%) | 24 (6.7%) |
| $30,000 to $34,999 | 69 (11.9%) | 7 (2.0%) |
| $35,000 to $39,999 | 0 (0.0%) | 0 (0.0%) |
| $40,000 to $44,999 | 9 (1.5%) | 7 (2.0%) |
| $45,000 to $49,999 | 44 (7.6%) | 77 (21.6%) |
| $50,000 to $54,999 | 0 (0.0%) | 31 (8.7%) |
| $55,000 to $64,999 | 68 (11.7%) | 13 (3.6%) |
| $65,000 to $74,999 | 0 (0.0%) | 0 (0.0%) |
| $75,000 to $99,999 | 65 (11.2%) | 0 (0.0%) |
| $100,000+ | 163 (28.1%) | 34 (9.6%) |
| Total | 579 (100.0%) | 356 (100.0%) |
Earnings by Sex by Educational Attainment in Nixon
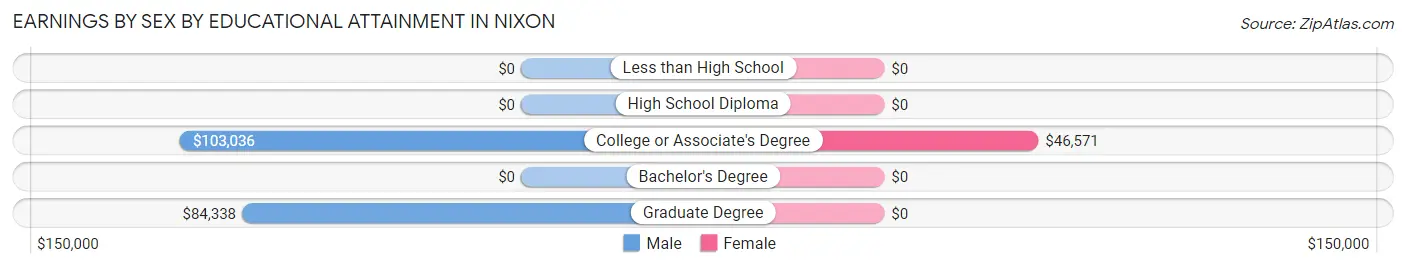
| Educational Attainment | Male Income | Female Income |
| Less than High School | - | - |
| High School Diploma | - | - |
| College or Associate's Degree | $103,036 | $46,571 |
| Bachelor's Degree | - | - |
| Graduate Degree | $84,338 | $0 |
| Total | $63,478 | $0 |
Family Income in Nixon
Family Income Brackets in Nixon
According to the Nixon family income data, there are 137 families falling into the $150,000 to $199,999 income range, which is the most common income bracket and makes up 32.1% of all families.
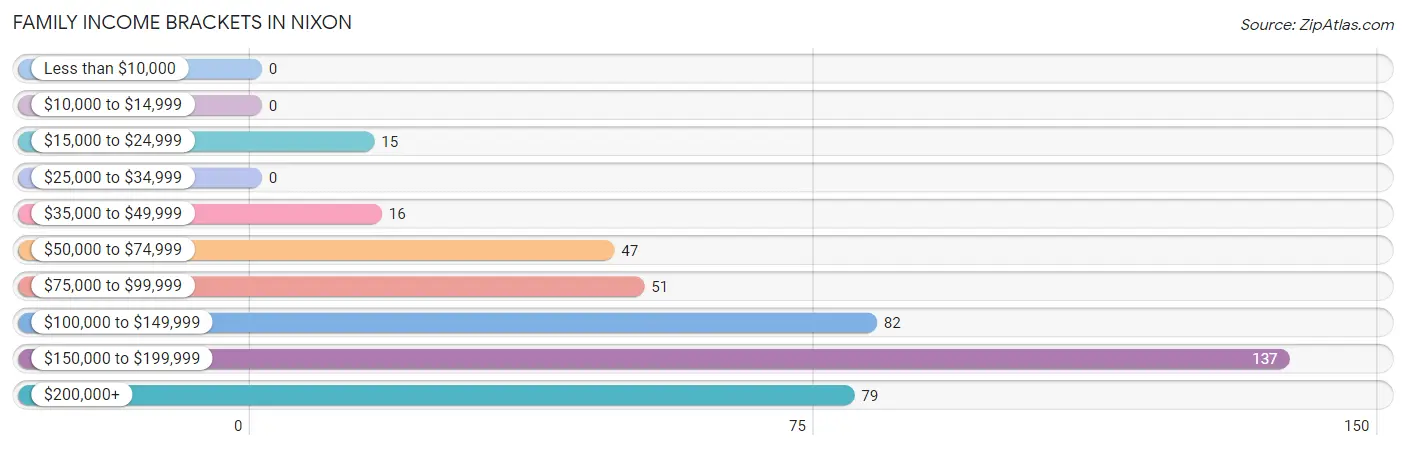
| Income Bracket | # Families | % Families |
| Less than $10,000 | 0 | 0.0% |
| $10,000 to $14,999 | 0 | 0.0% |
| $15,000 to $24,999 | 15 | 3.5% |
| $25,000 to $34,999 | 0 | 0.0% |
| $35,000 to $49,999 | 16 | 3.7% |
| $50,000 to $74,999 | 47 | 11.0% |
| $75,000 to $99,999 | 51 | 11.9% |
| $100,000 to $149,999 | 82 | 19.2% |
| $150,000 to $199,999 | 137 | 32.1% |
| $200,000+ | 79 | 18.5% |
Family Income by Famaliy Size in Nixon
3-person families (122 | 28.6%) account for the highest median family income in Nixon with $167,969 per family, while 3-person families (122 | 28.6%) have the highest median income of $55,990 per family member.
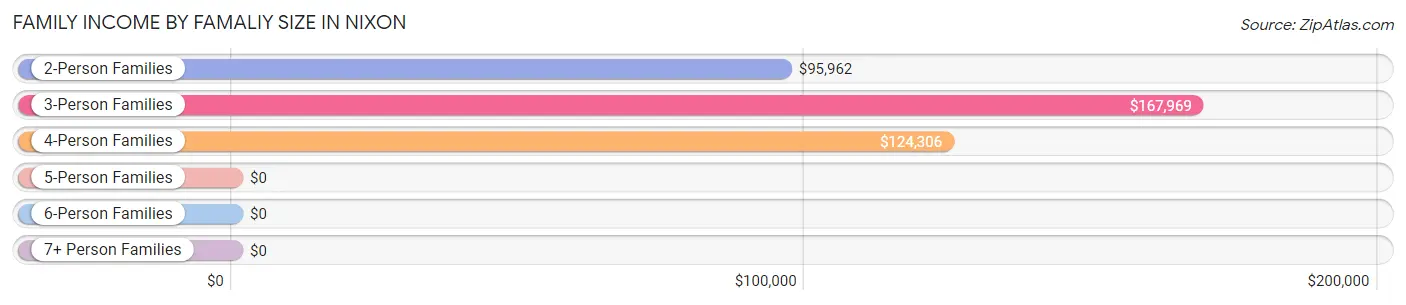
| Income Bracket | # Families | Median Income |
| 2-Person Families | 176 (41.2%) | $95,962 |
| 3-Person Families | 122 (28.6%) | $167,969 |
| 4-Person Families | 118 (27.6%) | $124,306 |
| 5-Person Families | 3 (0.7%) | $0 |
| 6-Person Families | 8 (1.9%) | $0 |
| 7+ Person Families | 0 (0.0%) | $0 |
| Total | 427 (100.0%) | $150,223 |
Family Income by Number of Earners in Nixon
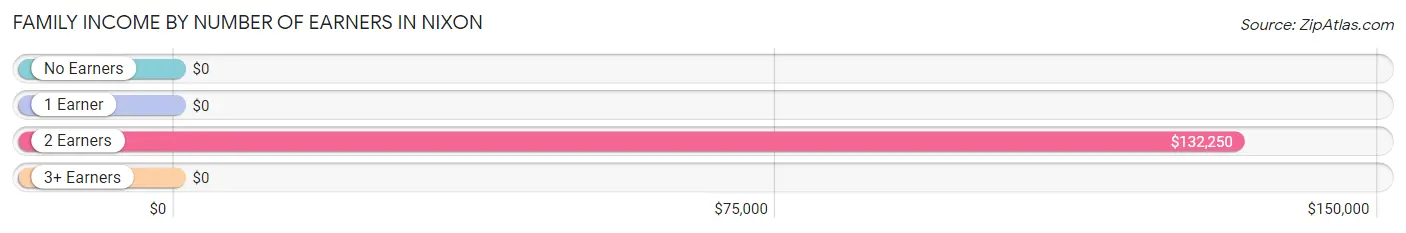
| Number of Earners | # Families | Median Income |
| No Earners | 44 (10.3%) | $0 |
| 1 Earner | 109 (25.5%) | $0 |
| 2 Earners | 221 (51.8%) | $132,250 |
| 3+ Earners | 53 (12.4%) | $0 |
| Total | 427 (100.0%) | $150,223 |
Household Income in Nixon
Household Income Brackets in Nixon
With 137 households falling in the category, the $150,000 to $199,999 income range is the most frequent in Nixon, accounting for 25.4% of all households.
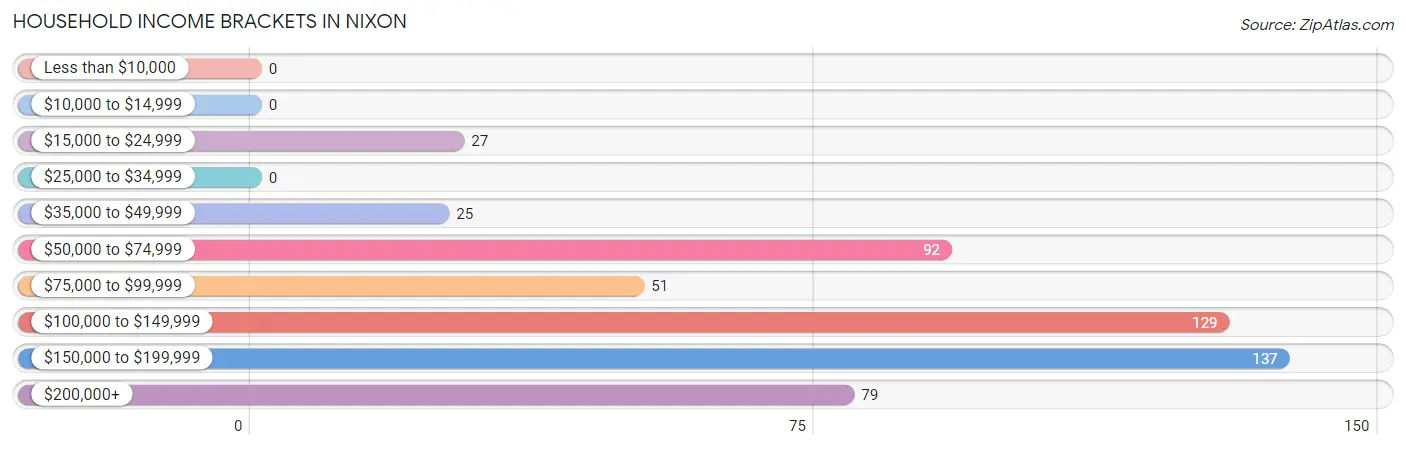
| Income Bracket | # Households | % Households |
| Less than $10,000 | 0 | 0.0% |
| $10,000 to $14,999 | 0 | 0.0% |
| $15,000 to $24,999 | 27 | 5.0% |
| $25,000 to $34,999 | 0 | 0.0% |
| $35,000 to $49,999 | 25 | 4.6% |
| $50,000 to $74,999 | 92 | 17.0% |
| $75,000 to $99,999 | 51 | 9.4% |
| $100,000 to $149,999 | 129 | 23.9% |
| $150,000 to $199,999 | 137 | 25.4% |
| $200,000+ | 79 | 14.6% |
Household Income by Householder Age in Nixon
The median household income in Nixon is $124,815, with the highest median household income of $165,472 found in the 65+ years age bracket for the primary householder. A total of 181 households (33.5%) fall into this category.
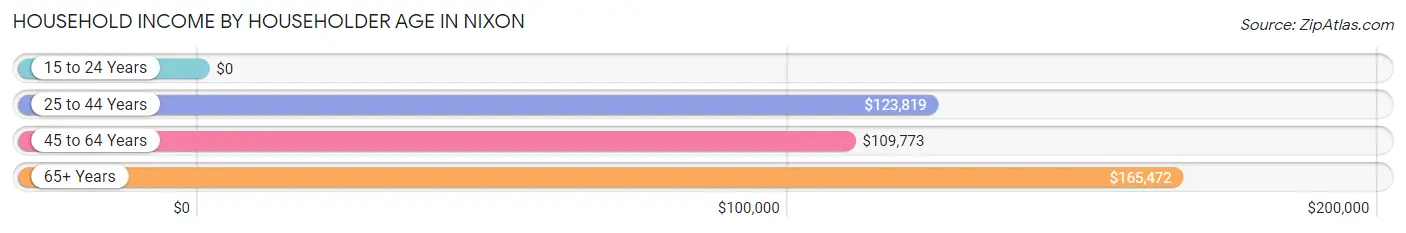
| Income Bracket | # Households | Median Income |
| 15 to 24 Years | 0 (0.0%) | $0 |
| 25 to 44 Years | 189 (35.0%) | $123,819 |
| 45 to 64 Years | 170 (31.5%) | $109,773 |
| 65+ Years | 181 (33.5%) | $165,472 |
| Total | 540 (100.0%) | $124,815 |
Poverty in Nixon
Income Below Poverty by Sex and Age in Nixon
With 0.7% poverty level for males and 2.8% for females among the residents of Nixon, 25 to 34 year old males and 45 to 54 year old females are the most vulnerable to poverty, with 3 males (11.1%) and 22 females (17.9%) in their respective age groups living below the poverty level.
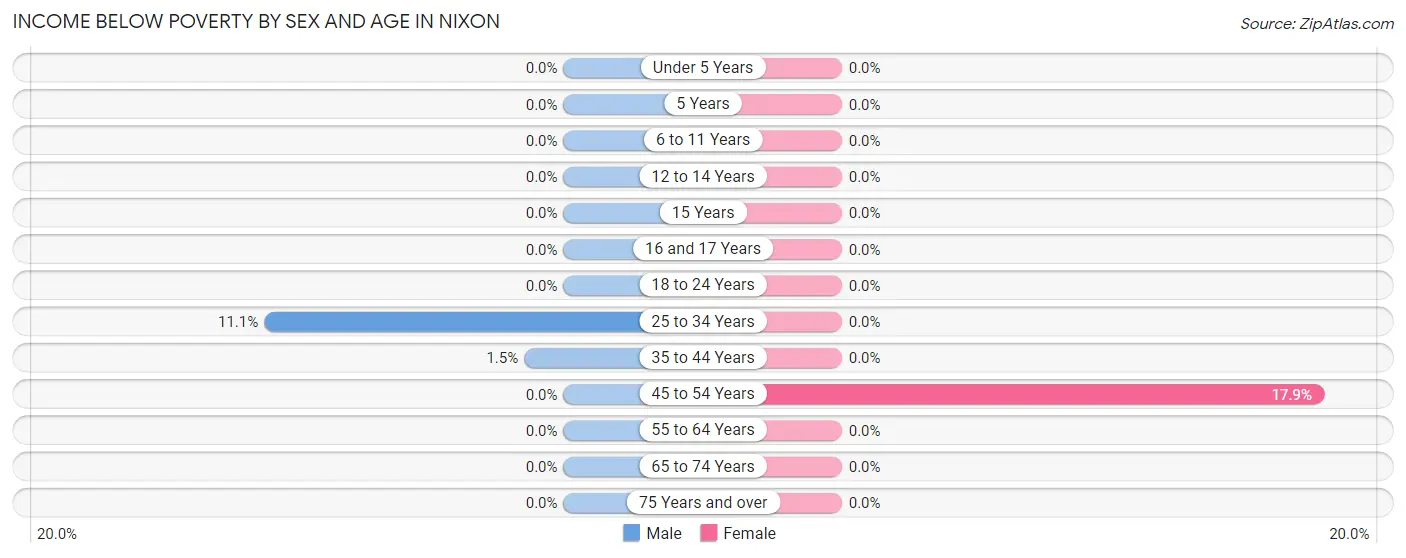
| Age Bracket | Male | Female |
| Under 5 Years | 0 (0.0%) | 0 (0.0%) |
| 5 Years | 0 (0.0%) | 0 (0.0%) |
| 6 to 11 Years | 0 (0.0%) | 0 (0.0%) |
| 12 to 14 Years | 0 (0.0%) | 0 (0.0%) |
| 15 Years | 0 (0.0%) | 0 (0.0%) |
| 16 and 17 Years | 0 (0.0%) | 0 (0.0%) |
| 18 to 24 Years | 0 (0.0%) | 0 (0.0%) |
| 25 to 34 Years | 3 (11.1%) | 0 (0.0%) |
| 35 to 44 Years | 2 (1.5%) | 0 (0.0%) |
| 45 to 54 Years | 0 (0.0%) | 22 (17.9%) |
| 55 to 64 Years | 0 (0.0%) | 0 (0.0%) |
| 65 to 74 Years | 0 (0.0%) | 0 (0.0%) |
| 75 Years and over | 0 (0.0%) | 0 (0.0%) |
| Total | 5 (0.7%) | 22 (2.8%) |
Income Above Poverty by Sex and Age in Nixon
According to the poverty statistics in Nixon, males aged under 5 years and females aged under 5 years are the age groups that are most secure financially, with 100.0% of males and 100.0% of females in these age groups living above the poverty line.
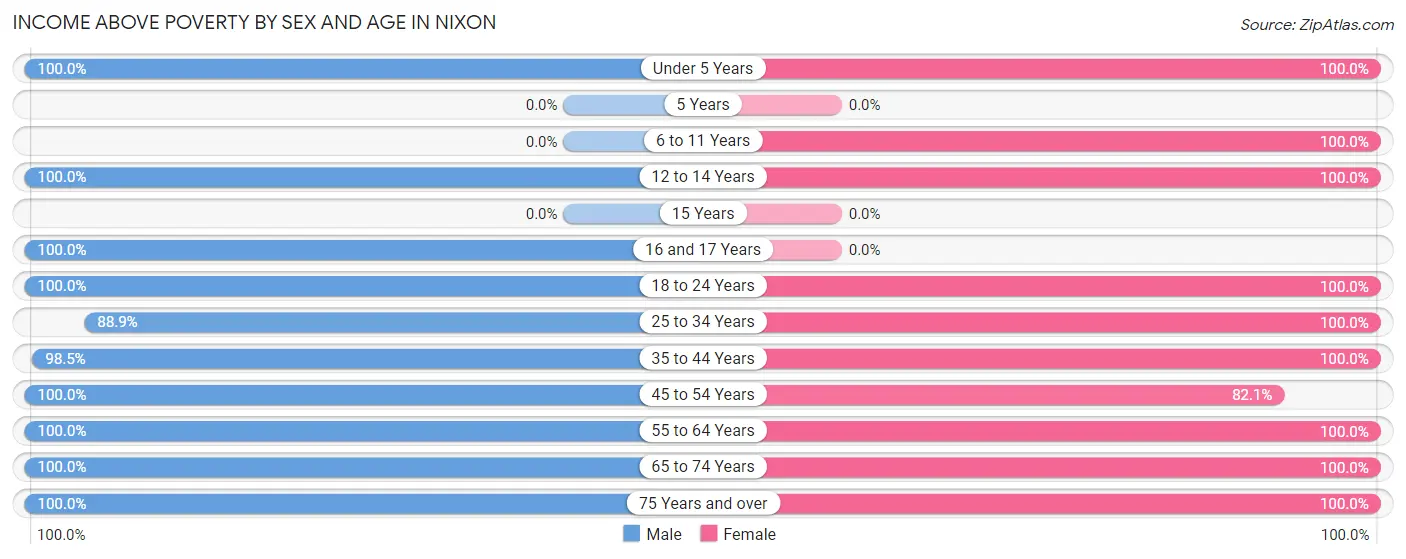
| Age Bracket | Male | Female |
| Under 5 Years | 8 (100.0%) | 129 (100.0%) |
| 5 Years | 0 (0.0%) | 0 (0.0%) |
| 6 to 11 Years | 0 (0.0%) | 105 (100.0%) |
| 12 to 14 Years | 11 (100.0%) | 12 (100.0%) |
| 15 Years | 0 (0.0%) | 0 (0.0%) |
| 16 and 17 Years | 33 (100.0%) | 0 (0.0%) |
| 18 to 24 Years | 69 (100.0%) | 26 (100.0%) |
| 25 to 34 Years | 24 (88.9%) | 118 (100.0%) |
| 35 to 44 Years | 135 (98.5%) | 61 (100.0%) |
| 45 to 54 Years | 105 (100.0%) | 101 (82.1%) |
| 55 to 64 Years | 135 (100.0%) | 43 (100.0%) |
| 65 to 74 Years | 62 (100.0%) | 66 (100.0%) |
| 75 Years and over | 105 (100.0%) | 108 (100.0%) |
| Total | 687 (99.3%) | 769 (97.2%) |
Income Below Poverty Among Married-Couple Families in Nixon
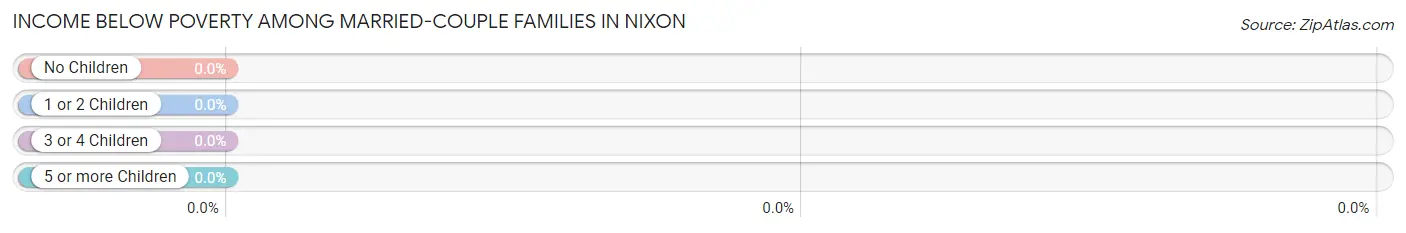
| Children | Above Poverty | Below Poverty |
| No Children | 246 (100.0%) | 0 (0.0%) |
| 1 or 2 Children | 134 (100.0%) | 0 (0.0%) |
| 3 or 4 Children | 11 (100.0%) | 0 (0.0%) |
| 5 or more Children | 0 (0.0%) | 0 (0.0%) |
| Total | 391 (100.0%) | 0 (0.0%) |
Income Below Poverty Among Single-Parent Households in Nixon
| Children | Single Father | Single Mother |
| No Children | 0 (0.0%) | 0 (0.0%) |
| 1 or 2 Children | 0 (0.0%) | 0 (0.0%) |
| 3 or 4 Children | 0 (0.0%) | 0 (0.0%) |
| 5 or more Children | 0 (0.0%) | 0 (0.0%) |
| Total | 0 (0.0%) | 0 (0.0%) |
Income Below Poverty Among Married-Couple vs Single-Parent Households in Nixon
| Children | Married-Couple Families | Single-Parent Households |
| No Children | 0 (0.0%) | 0 (0.0%) |
| 1 or 2 Children | 0 (0.0%) | 0 (0.0%) |
| 3 or 4 Children | 0 (0.0%) | 0 (0.0%) |
| 5 or more Children | 0 (0.0%) | 0 (0.0%) |
| Total | 0 (0.0%) | 0 (0.0%) |
Race in Nixon
The most populous races in Nixon are White / Caucasian (1,392 | 93.9%), Two or more Races (83 | 5.6%), and Hispanic or Latino (25 | 1.7%).
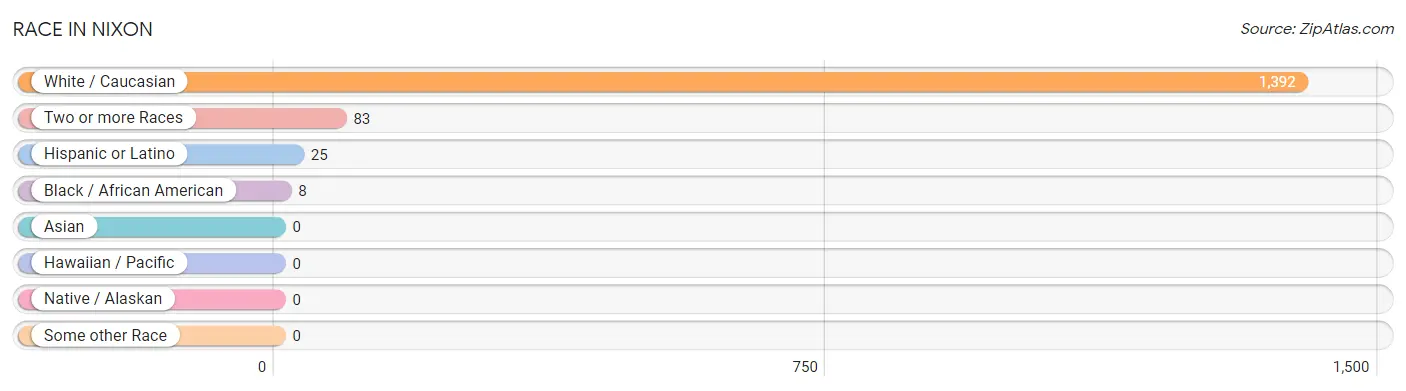
| Race | # Population | % Population |
| Asian | 0 | 0.0% |
| Black / African American | 8 | 0.5% |
| Hawaiian / Pacific | 0 | 0.0% |
| Hispanic or Latino | 25 | 1.7% |
| Native / Alaskan | 0 | 0.0% |
| White / Caucasian | 1,392 | 93.9% |
| Two or more Races | 83 | 5.6% |
| Some other Race | 0 | 0.0% |
| Total | 1,483 | 100.0% |
Ancestry in Nixon
The most populous ancestries reported in Nixon are German (568 | 38.3%), Irish (301 | 20.3%), Italian (196 | 13.2%), English (172 | 11.6%), and Polish (92 | 6.2%), together accounting for 89.6% of all Nixon residents.
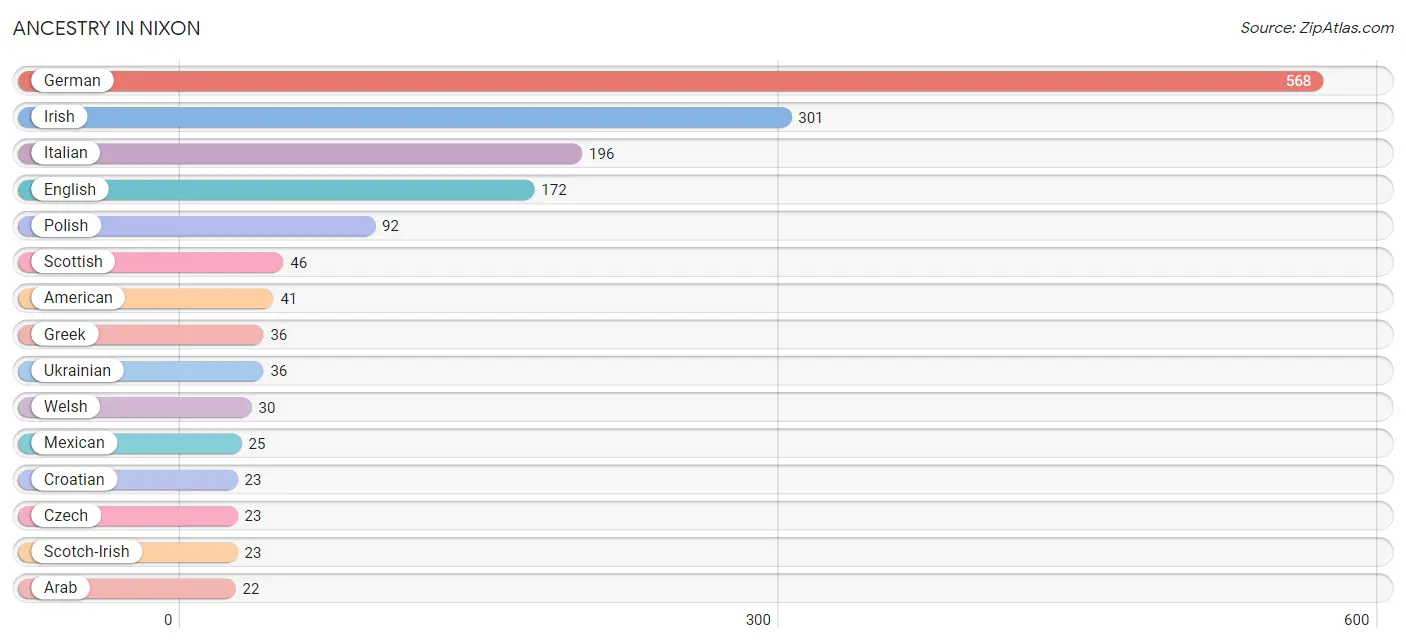
| Ancestry | # Population | % Population |
| American | 41 | 2.8% |
| Arab | 22 | 1.5% |
| Croatian | 23 | 1.5% |
| Czech | 23 | 1.5% |
| Dutch | 22 | 1.5% |
| Eastern European | 19 | 1.3% |
| English | 172 | 11.6% |
| French | 9 | 0.6% |
| German | 568 | 38.3% |
| Greek | 36 | 2.4% |
| Irish | 301 | 20.3% |
| Italian | 196 | 13.2% |
| Mexican | 25 | 1.7% |
| Polish | 92 | 6.2% |
| Scotch-Irish | 23 | 1.5% |
| Scottish | 46 | 3.1% |
| Serbian | 13 | 0.9% |
| Syrian | 22 | 1.5% |
| Turkish | 12 | 0.8% |
| Ukrainian | 36 | 2.4% |
| Welsh | 30 | 2.0% | View All 21 Rows |
Immigrants in Nixon
The most numerous immigrant groups reported in Nixon came from Central America (25 | 1.7%), Latin America (25 | 1.7%), and Mexico (25 | 1.7%), together accounting for 5.1% of all Nixon residents.
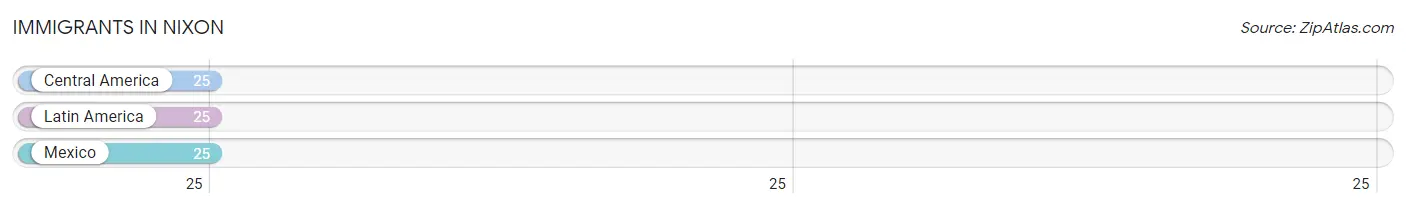
| Immigration Origin | # Population | % Population |
| Central America | 25 | 1.7% |
| Latin America | 25 | 1.7% |
| Mexico | 25 | 1.7% | View All 3 Rows |
Sex and Age in Nixon
Sex and Age in Nixon
The most populous age groups in Nixon are 60 to 64 Years (122 | 17.6%) for men and Under 5 Years (129 | 16.3%) for women.
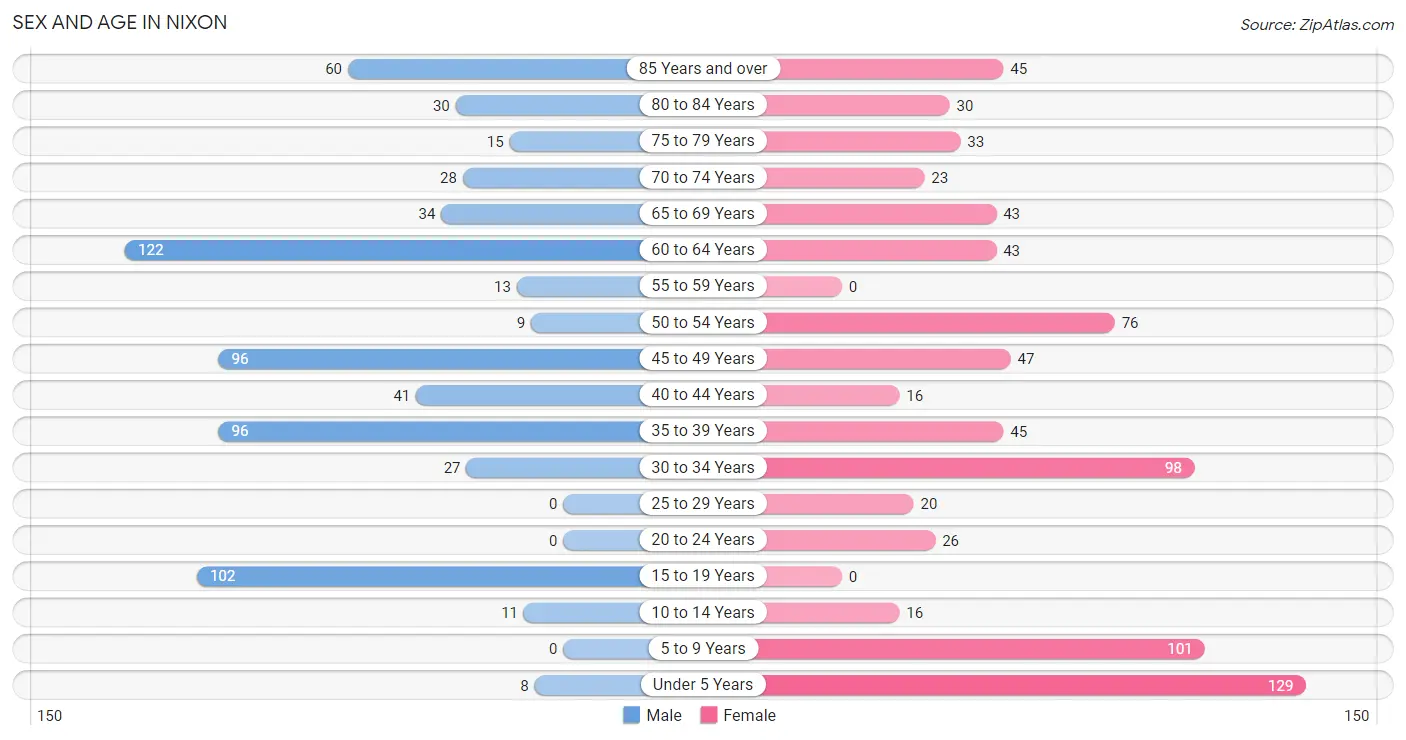
| Age Bracket | Male | Female |
| Under 5 Years | 8 (1.2%) | 129 (16.3%) |
| 5 to 9 Years | 0 (0.0%) | 101 (12.8%) |
| 10 to 14 Years | 11 (1.6%) | 16 (2.0%) |
| 15 to 19 Years | 102 (14.7%) | 0 (0.0%) |
| 20 to 24 Years | 0 (0.0%) | 26 (3.3%) |
| 25 to 29 Years | 0 (0.0%) | 20 (2.5%) |
| 30 to 34 Years | 27 (3.9%) | 98 (12.4%) |
| 35 to 39 Years | 96 (13.9%) | 45 (5.7%) |
| 40 to 44 Years | 41 (5.9%) | 16 (2.0%) |
| 45 to 49 Years | 96 (13.9%) | 47 (5.9%) |
| 50 to 54 Years | 9 (1.3%) | 76 (9.6%) |
| 55 to 59 Years | 13 (1.9%) | 0 (0.0%) |
| 60 to 64 Years | 122 (17.6%) | 43 (5.4%) |
| 65 to 69 Years | 34 (4.9%) | 43 (5.4%) |
| 70 to 74 Years | 28 (4.1%) | 23 (2.9%) |
| 75 to 79 Years | 15 (2.2%) | 33 (4.2%) |
| 80 to 84 Years | 30 (4.3%) | 30 (3.8%) |
| 85 Years and over | 60 (8.7%) | 45 (5.7%) |
| Total | 692 (100.0%) | 791 (100.0%) |
Families and Households in Nixon
Median Family Size in Nixon
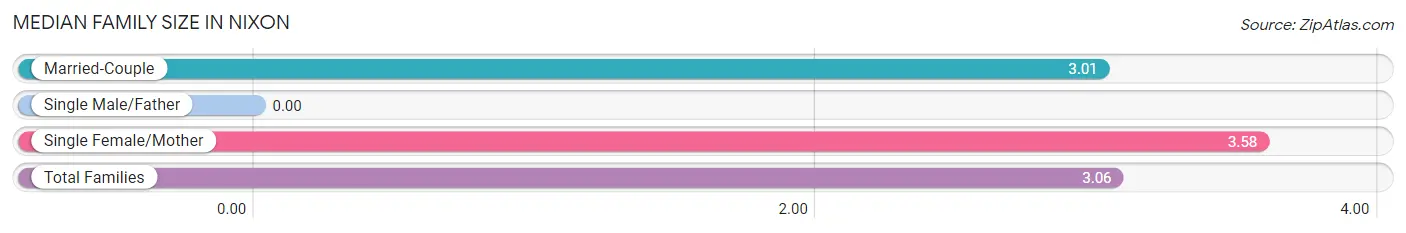
| Family Type | # Families | Family Size |
| Married-Couple | 391 (91.6%) | 3.01 |
| Single Male/Father | 0 (0.0%) | - |
| Single Female/Mother | 36 (8.4%) | 3.58 |
| Total Families | 427 (100.0%) | 3.06 |
Median Household Size in Nixon
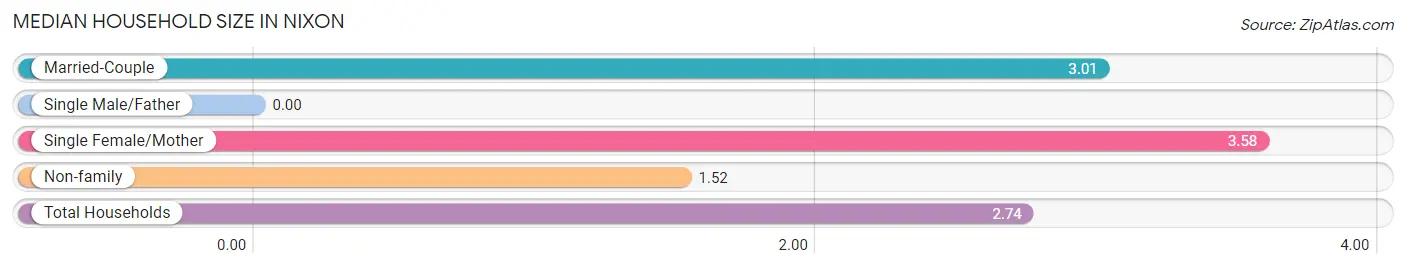
| Household Type | # Households | Household Size |
| Married-Couple | 391 (72.4%) | 3.01 |
| Single Male/Father | 0 (0.0%) | - |
| Single Female/Mother | 36 (6.7%) | 3.58 |
| Non-family | 113 (20.9%) | 1.52 |
| Total Households | 540 (100.0%) | 2.74 |
Household Size by Marriage Status in Nixon
Out of a total of 540 households in Nixon, 427 (79.1%) are family households, while 113 (20.9%) are nonfamily households. The most numerous type of family households are 2-person households, comprising 176, and the most common type of nonfamily households are 2-person households, comprising 69.
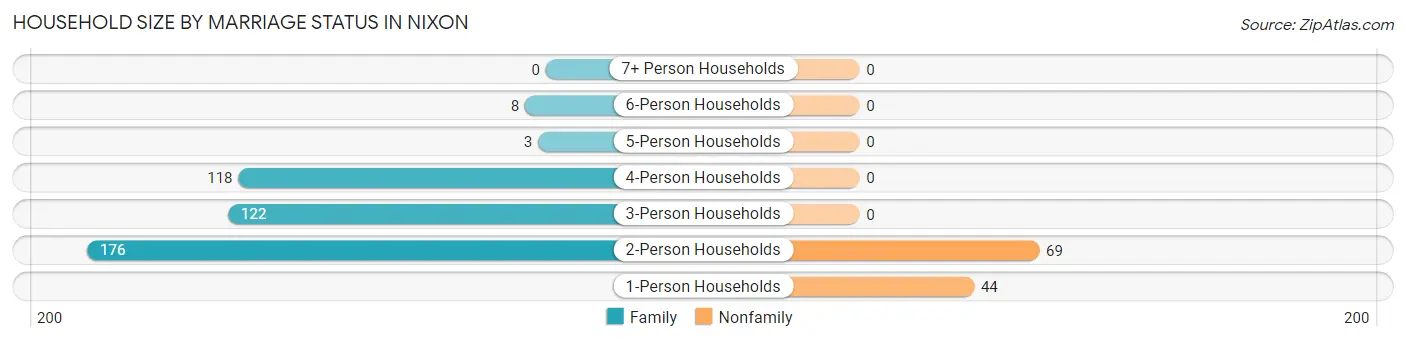
| Household Size | Family Households | Nonfamily Households |
| 1-Person Households | - | 44 (8.2%) |
| 2-Person Households | 176 (32.6%) | 69 (12.8%) |
| 3-Person Households | 122 (22.6%) | 0 (0.0%) |
| 4-Person Households | 118 (21.8%) | 0 (0.0%) |
| 5-Person Households | 3 (0.6%) | 0 (0.0%) |
| 6-Person Households | 8 (1.5%) | 0 (0.0%) |
| 7+ Person Households | 0 (0.0%) | 0 (0.0%) |
| Total | 427 (79.1%) | 113 (20.9%) |
Female Fertility in Nixon
Fertility by Age in Nixon
| Age Bracket | Women with Births | Births / 1,000 Women |
| 15 to 19 years | 0 (0.0%) | 0.0 |
| 20 to 34 years | 0 (0.0%) | 0.0 |
| 35 to 50 years | 0 (0.0%) | 0.0 |
| Total | 0 (0.0%) | 0.0 |
Fertility by Age by Marriage Status in Nixon
| Age Bracket | Married | Unmarried |
| 15 to 19 years | 0 (0.0%) | 0 (0.0%) |
| 20 to 34 years | 0 (0.0%) | 0 (0.0%) |
| 35 to 50 years | 0 (0.0%) | 0 (0.0%) |
| Total | 0 (0.0%) | 0 (0.0%) |
Fertility by Education in Nixon
| Educational Attainment | Women with Births | Births / 1,000 Women |
| Less than High School | 0 (0.0%) | 0.0 |
| High School Diploma | 0 (0.0%) | 0.0 |
| College or Associate's Degree | 0 (0.0%) | 0.0 |
| Bachelor's Degree | 0 (0.0%) | 0.0 |
| Graduate Degree | 0 (0.0%) | 0.0 |
| Total | 0 (0.0%) | 0.0 |
Fertility by Education by Marriage Status in Nixon
| Educational Attainment | Married | Unmarried |
| Less than High School | 0 (0.0%) | 0 (0.0%) |
| High School Diploma | 0 (0.0%) | 0 (0.0%) |
| College or Associate's Degree | 0 (0.0%) | 0 (0.0%) |
| Bachelor's Degree | 0 (0.0%) | 0 (0.0%) |
| Graduate Degree | 0 (0.0%) | 0 (0.0%) |
| Total | 0 (0.0%) | 0 (0.0%) |
Employment Characteristics in Nixon
Employment by Class of Employer in Nixon
Among the 831 employed individuals in Nixon, private company employees (545 | 65.6%), federal government employees (89 | 10.7%), and self-employed (incorporated) (59 | 7.1%) make up the most common classes of employment.
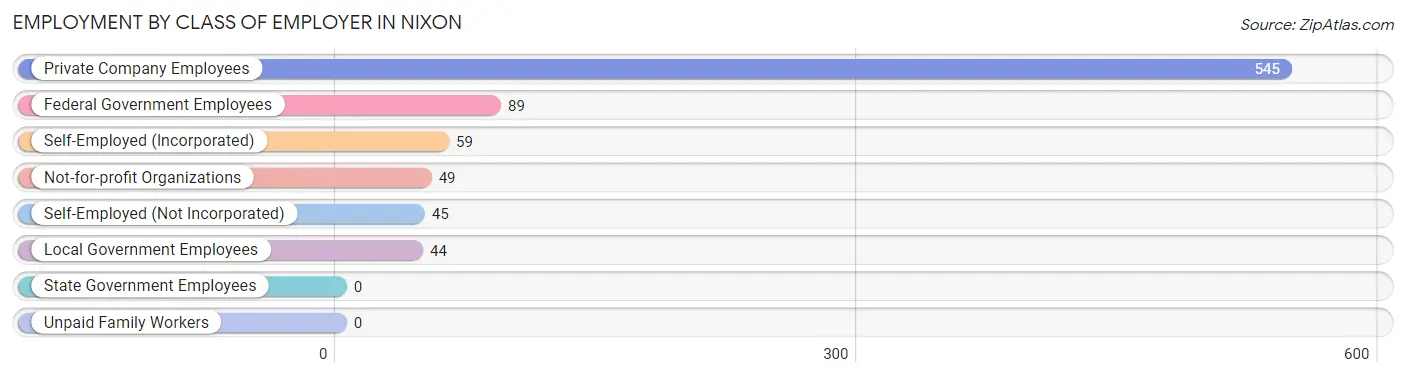
| Employer Class | # Employees | % Employees |
| Private Company Employees | 545 | 65.6% |
| Self-Employed (Incorporated) | 59 | 7.1% |
| Self-Employed (Not Incorporated) | 45 | 5.4% |
| Not-for-profit Organizations | 49 | 5.9% |
| Local Government Employees | 44 | 5.3% |
| State Government Employees | 0 | 0.0% |
| Federal Government Employees | 89 | 10.7% |
| Unpaid Family Workers | 0 | 0.0% |
| Total | 831 | 100.0% |
Employment Status by Age in Nixon
According to the labor force statistics for Nixon, out of the total population over 16 years of age (1,218), 71.3% or 868 individuals are in the labor force, with 2.8% or 24 of them unemployed. The age group with the highest labor force participation rate is 20 to 24 years, with 100.0% or 26 individuals in the labor force. Within the labor force, the 65 to 74 years age range has the highest percentage of unemployed individuals, with 61.5% or 24 of them being unemployed.
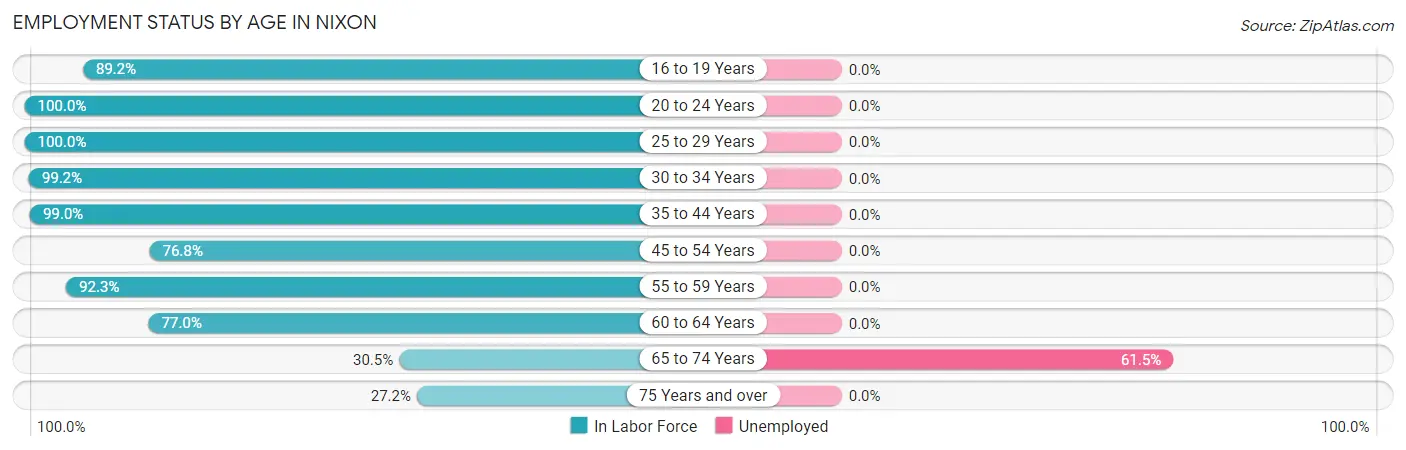
| Age Bracket | In Labor Force | Unemployed |
| 16 to 19 Years | 91 (89.2%) | 0 (0.0%) |
| 20 to 24 Years | 26 (100.0%) | 0 (0.0%) |
| 25 to 29 Years | 20 (100.0%) | 0 (0.0%) |
| 30 to 34 Years | 124 (99.2%) | 0 (0.0%) |
| 35 to 44 Years | 196 (99.0%) | 0 (0.0%) |
| 45 to 54 Years | 175 (76.8%) | 0 (0.0%) |
| 55 to 59 Years | 12 (92.3%) | 0 (0.0%) |
| 60 to 64 Years | 127 (77.0%) | 0 (0.0%) |
| 65 to 74 Years | 39 (30.5%) | 24 (61.5%) |
| 75 Years and over | 58 (27.2%) | 0 (0.0%) |
| Total | 868 (71.3%) | 24 (2.8%) |
Employment Status by Educational Attainment in Nixon
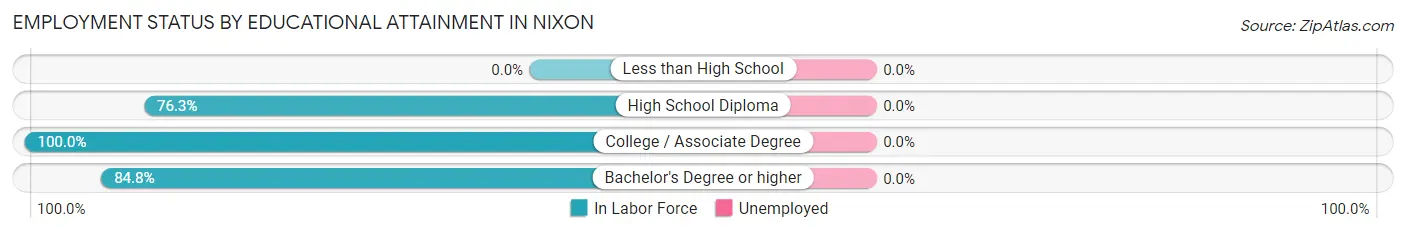
| Educational Attainment | In Labor Force | Unemployed |
| Less than High School | 0 (0.0%) | 0 (0.0%) |
| High School Diploma | 122 (76.3%) | 0 (0.0%) |
| College / Associate Degree | 224 (100.0%) | 0 (0.0%) |
| Bachelor's Degree or higher | 308 (84.8%) | 0 (0.0%) |
| Total | 654 (87.3%) | 0 (0.0%) |
Employment Occupations by Sex in Nixon
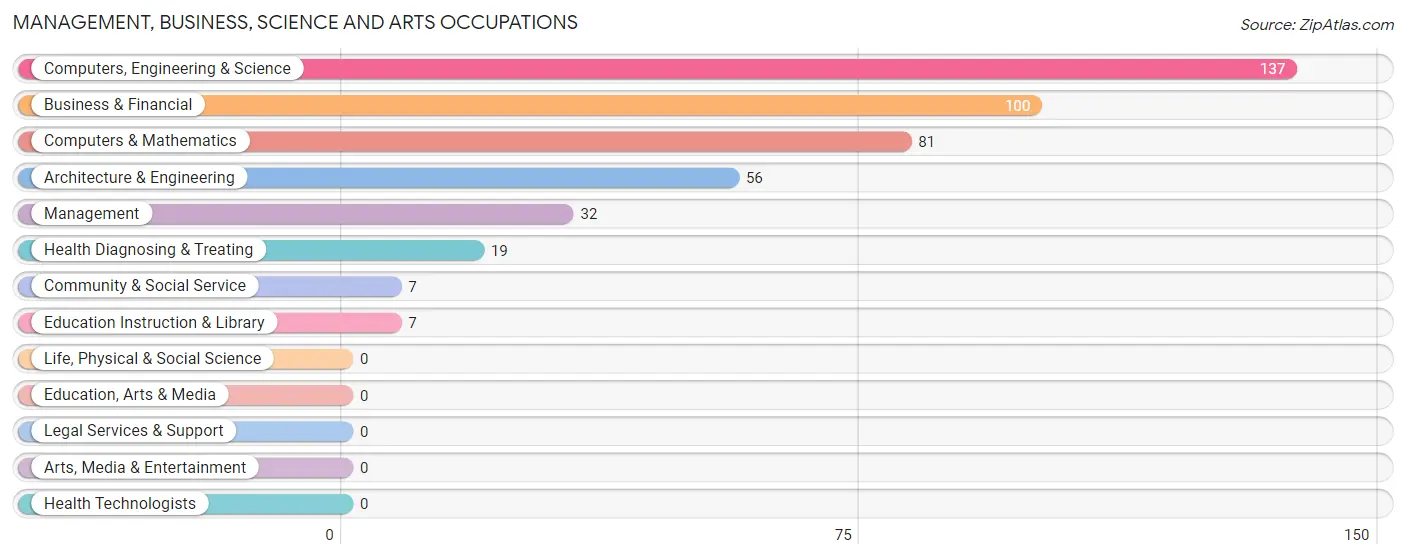
Management, Business, Science and Arts Occupations
The most common Management, Business, Science and Arts occupations in Nixon are Computers, Engineering & Science (137 | 16.2%), Business & Financial (100 | 11.8%), Computers & Mathematics (81 | 9.6%), Architecture & Engineering (56 | 6.6%), and Management (32 | 3.8%).
Management, Business, Science and Arts Occupations by Sex
Within the Management, Business, Science and Arts occupations in Nixon, the most male-oriented occupations are Architecture & Engineering (87.5%), Computers, Engineering & Science (75.2%), and Business & Financial (75.0%), while the most female-oriented occupations are Community & Social Service (100.0%), Education Instruction & Library (100.0%), and Health Diagnosing & Treating (100.0%).
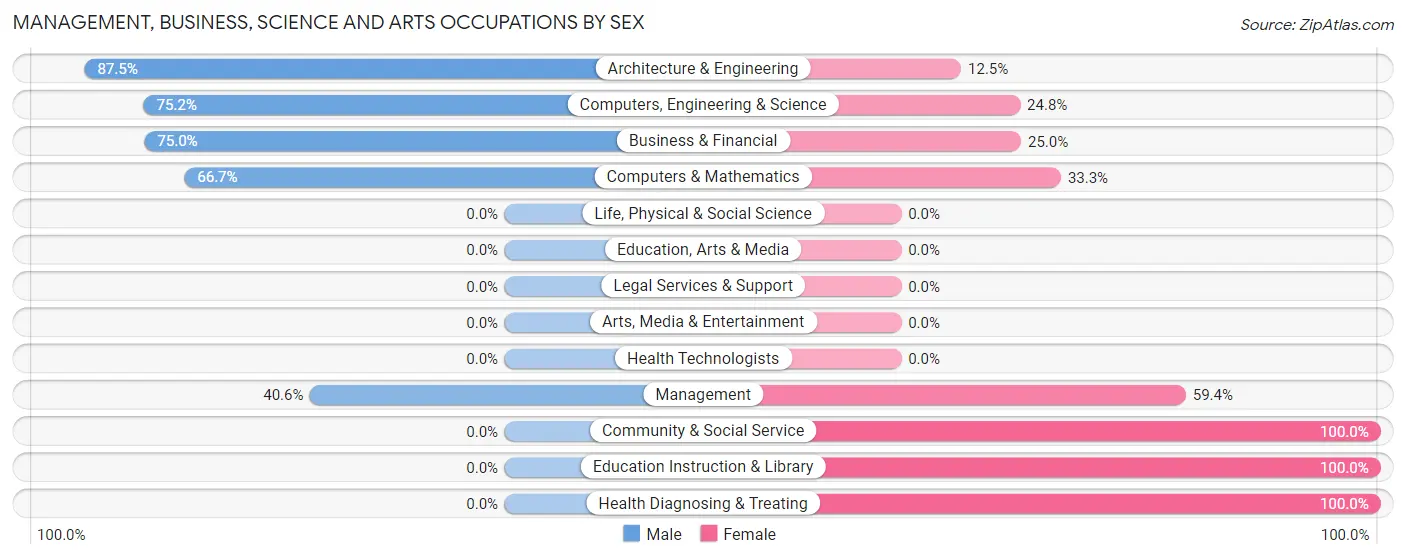
| Occupation | Male | Female |
| Management | 13 (40.6%) | 19 (59.4%) |
| Business & Financial | 75 (75.0%) | 25 (25.0%) |
| Computers, Engineering & Science | 103 (75.2%) | 34 (24.8%) |
| Computers & Mathematics | 54 (66.7%) | 27 (33.3%) |
| Architecture & Engineering | 49 (87.5%) | 7 (12.5%) |
| Life, Physical & Social Science | 0 (0.0%) | 0 (0.0%) |
| Community & Social Service | 0 (0.0%) | 7 (100.0%) |
| Education, Arts & Media | 0 (0.0%) | 0 (0.0%) |
| Legal Services & Support | 0 (0.0%) | 0 (0.0%) |
| Education Instruction & Library | 0 (0.0%) | 7 (100.0%) |
| Arts, Media & Entertainment | 0 (0.0%) | 0 (0.0%) |
| Health Diagnosing & Treating | 0 (0.0%) | 19 (100.0%) |
| Health Technologists | 0 (0.0%) | 0 (0.0%) |
| Total (Category) | 191 (64.7%) | 104 (35.2%) |
| Total (Overall) | 549 (65.0%) | 295 (34.9%) |
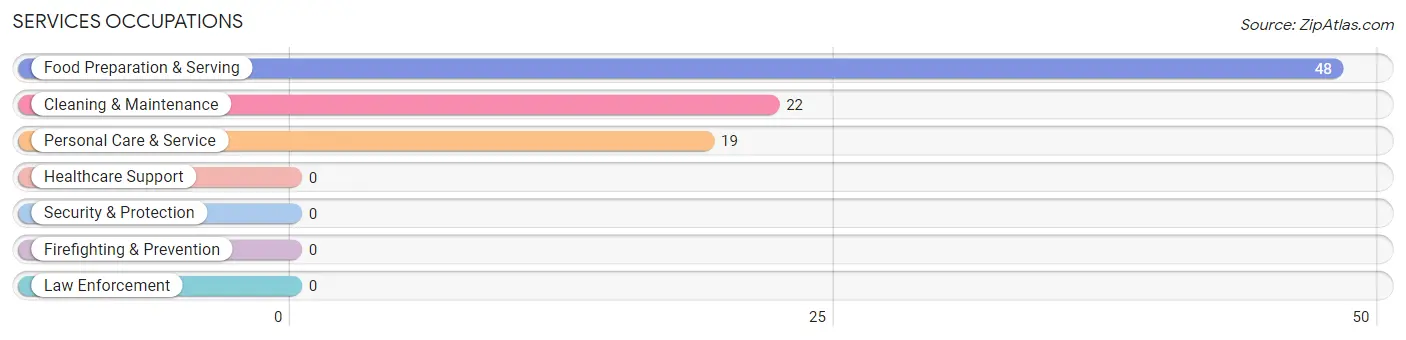
Services Occupations
The most common Services occupations in Nixon are Food Preparation & Serving (48 | 5.7%), Cleaning & Maintenance (22 | 2.6%), and Personal Care & Service (19 | 2.2%).
Services Occupations by Sex
Within the Services occupations in Nixon, the most male-oriented occupations are Cleaning & Maintenance (100.0%), and Food Preparation & Serving (45.8%), while the most female-oriented occupations are Personal Care & Service (100.0%), and Food Preparation & Serving (54.2%).
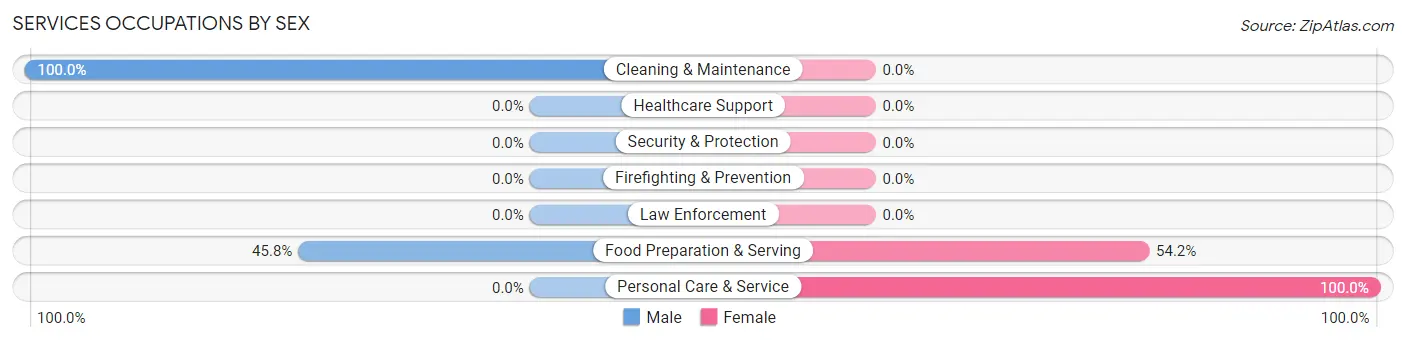
| Occupation | Male | Female |
| Healthcare Support | 0 (0.0%) | 0 (0.0%) |
| Security & Protection | 0 (0.0%) | 0 (0.0%) |
| Firefighting & Prevention | 0 (0.0%) | 0 (0.0%) |
| Law Enforcement | 0 (0.0%) | 0 (0.0%) |
| Food Preparation & Serving | 22 (45.8%) | 26 (54.2%) |
| Cleaning & Maintenance | 22 (100.0%) | 0 (0.0%) |
| Personal Care & Service | 0 (0.0%) | 19 (100.0%) |
| Total (Category) | 44 (49.4%) | 45 (50.6%) |
| Total (Overall) | 549 (65.0%) | 295 (34.9%) |
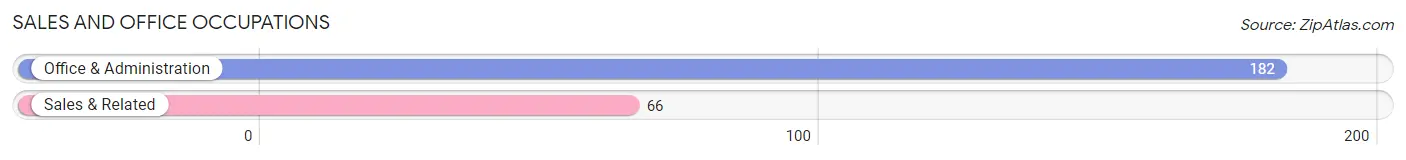
Sales and Office Occupations
The most common Sales and Office occupations in Nixon are Office & Administration (182 | 21.6%), and Sales & Related (66 | 7.8%).
Sales and Office Occupations by Sex
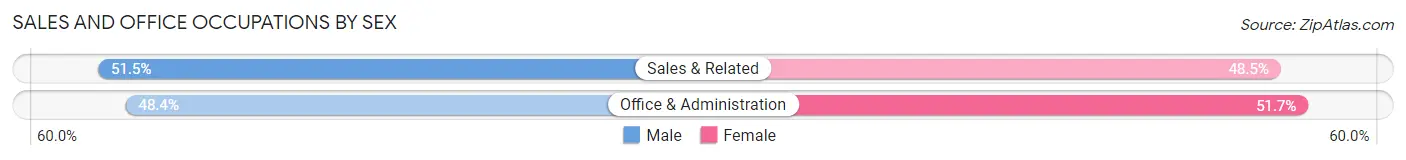
| Occupation | Male | Female |
| Sales & Related | 34 (51.5%) | 32 (48.5%) |
| Office & Administration | 88 (48.3%) | 94 (51.6%) |
| Total (Category) | 122 (49.2%) | 126 (50.8%) |
| Total (Overall) | 549 (65.0%) | 295 (34.9%) |
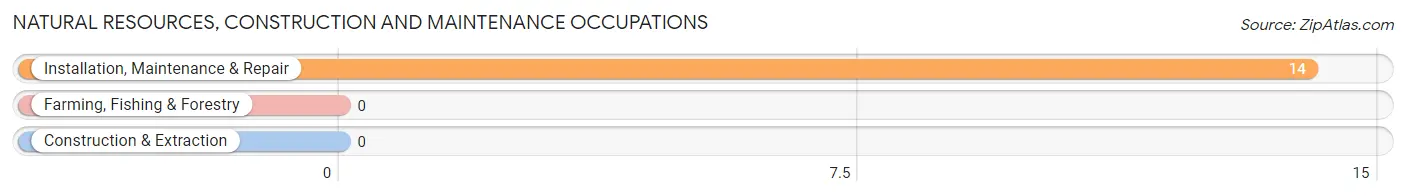
Natural Resources, Construction and Maintenance Occupations
The most common Natural Resources, Construction and Maintenance occupations in Nixon are , and Installation, Maintenance & Repair (14 | 1.7%).
Natural Resources, Construction and Maintenance Occupations by Sex
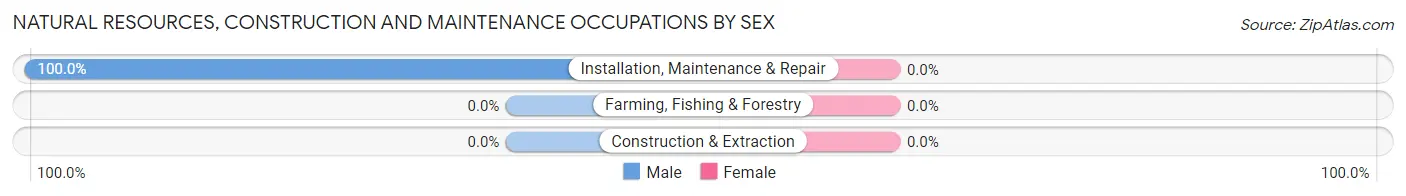
| Occupation | Male | Female |
| Farming, Fishing & Forestry | 0 (0.0%) | 0 (0.0%) |
| Construction & Extraction | 0 (0.0%) | 0 (0.0%) |
| Installation, Maintenance & Repair | 14 (100.0%) | 0 (0.0%) |
| Total (Category) | 14 (100.0%) | 0 (0.0%) |
| Total (Overall) | 549 (65.0%) | 295 (34.9%) |
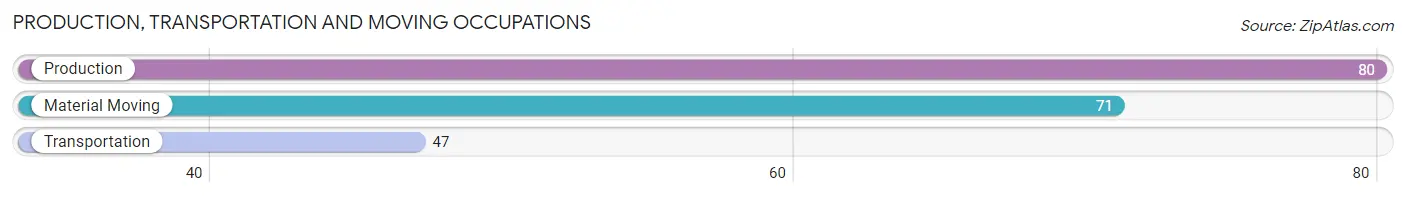
Production, Transportation and Moving Occupations
The most common Production, Transportation and Moving occupations in Nixon are Production (80 | 9.5%), Material Moving (71 | 8.4%), and Transportation (47 | 5.6%).
Production, Transportation and Moving Occupations by Sex
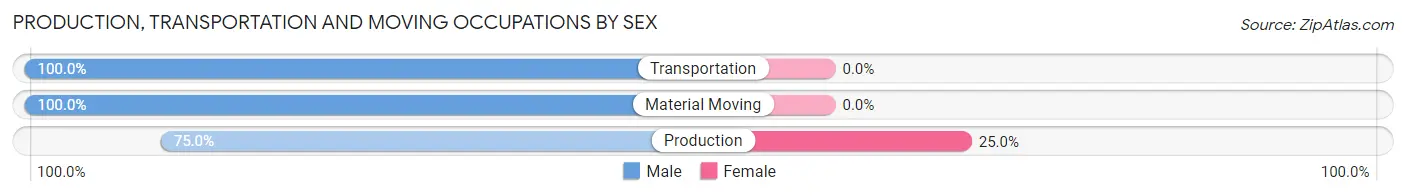
| Occupation | Male | Female |
| Production | 60 (75.0%) | 20 (25.0%) |
| Transportation | 47 (100.0%) | 0 (0.0%) |
| Material Moving | 71 (100.0%) | 0 (0.0%) |
| Total (Category) | 178 (89.9%) | 20 (10.1%) |
| Total (Overall) | 549 (65.0%) | 295 (34.9%) |
Employment Industries by Sex in Nixon
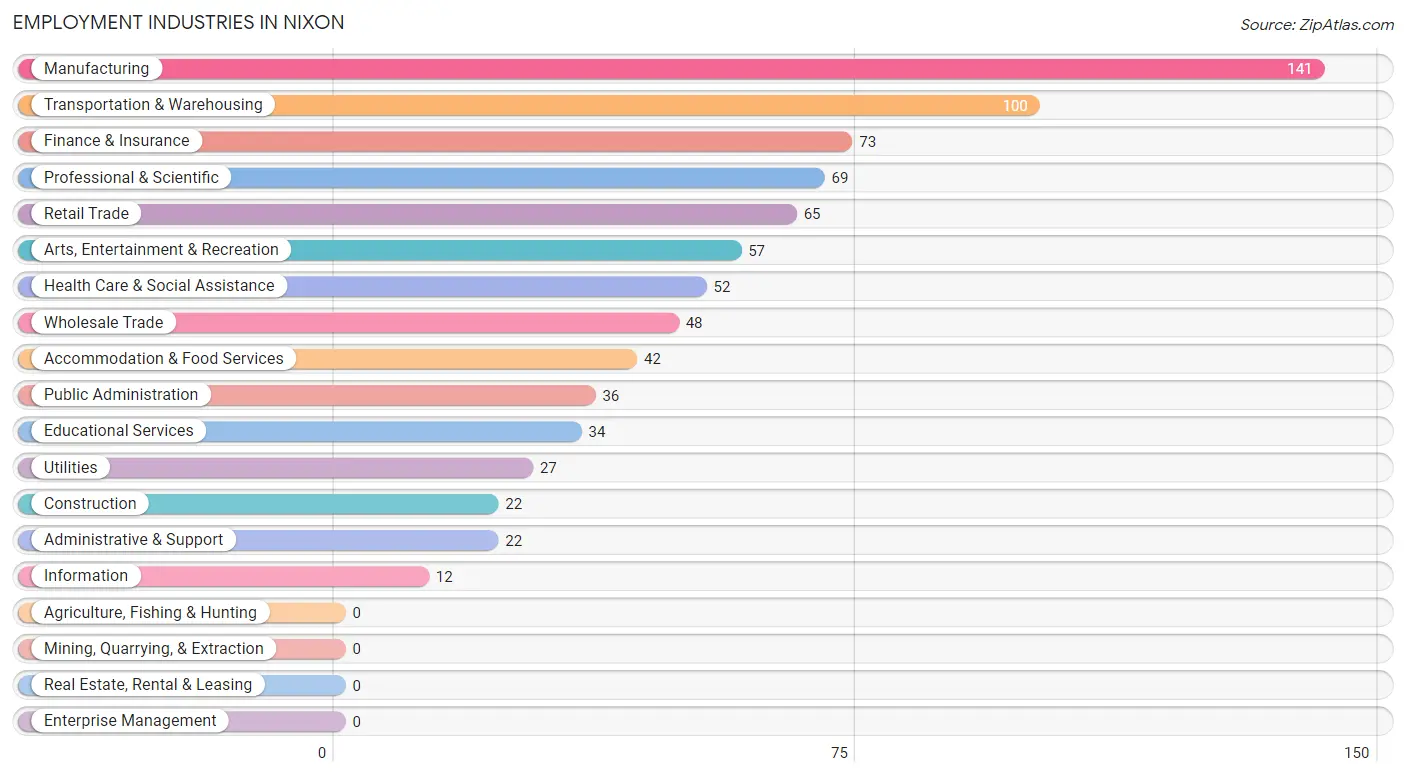
Employment Industries in Nixon
The major employment industries in Nixon include Manufacturing (141 | 16.7%), Transportation & Warehousing (100 | 11.8%), Finance & Insurance (73 | 8.6%), Professional & Scientific (69 | 8.2%), and Retail Trade (65 | 7.7%).
Employment Industries by Sex in Nixon
The Nixon industries that see more men than women are Construction (100.0%), Retail Trade (100.0%), and Transportation & Warehousing (100.0%), whereas the industries that tend to have a higher number of women are Utilities (100.0%), Educational Services (100.0%), and Health Care & Social Assistance (96.2%).
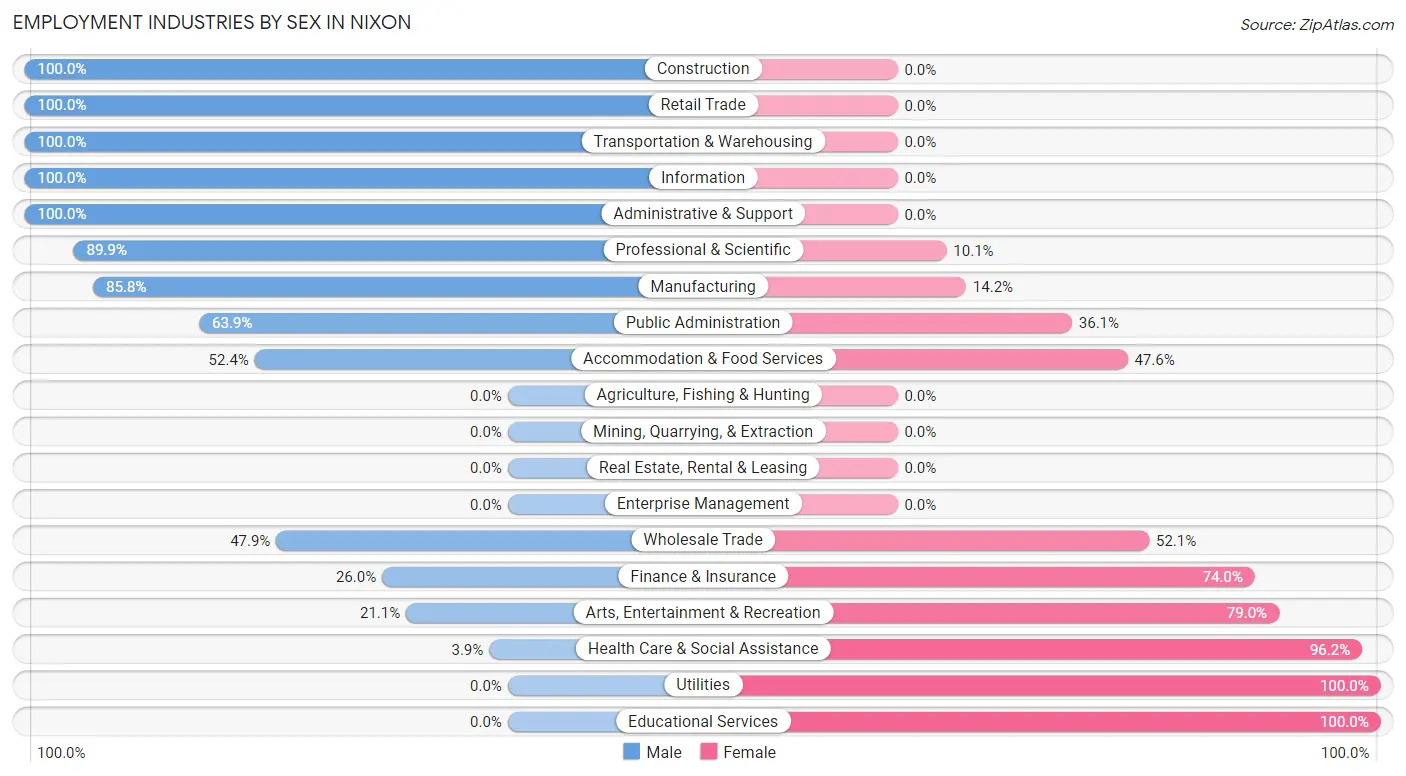
| Industry | Male | Female |
| Agriculture, Fishing & Hunting | 0 (0.0%) | 0 (0.0%) |
| Mining, Quarrying, & Extraction | 0 (0.0%) | 0 (0.0%) |
| Construction | 22 (100.0%) | 0 (0.0%) |
| Manufacturing | 121 (85.8%) | 20 (14.2%) |
| Wholesale Trade | 23 (47.9%) | 25 (52.1%) |
| Retail Trade | 65 (100.0%) | 0 (0.0%) |
| Transportation & Warehousing | 100 (100.0%) | 0 (0.0%) |
| Utilities | 0 (0.0%) | 27 (100.0%) |
| Information | 12 (100.0%) | 0 (0.0%) |
| Finance & Insurance | 19 (26.0%) | 54 (74.0%) |
| Real Estate, Rental & Leasing | 0 (0.0%) | 0 (0.0%) |
| Professional & Scientific | 62 (89.9%) | 7 (10.1%) |
| Enterprise Management | 0 (0.0%) | 0 (0.0%) |
| Administrative & Support | 22 (100.0%) | 0 (0.0%) |
| Educational Services | 0 (0.0%) | 34 (100.0%) |
| Health Care & Social Assistance | 2 (3.8%) | 50 (96.2%) |
| Arts, Entertainment & Recreation | 12 (21.0%) | 45 (78.9%) |
| Accommodation & Food Services | 22 (52.4%) | 20 (47.6%) |
| Public Administration | 23 (63.9%) | 13 (36.1%) |
| Total | 549 (65.0%) | 295 (34.9%) |
Education in Nixon
School Enrollment in Nixon
The most common levels of schooling among the 331 students in Nixon are college / undergraduate (107 | 32.3%), elementary school (60 | 18.1%), and high school (59 | 17.8%).
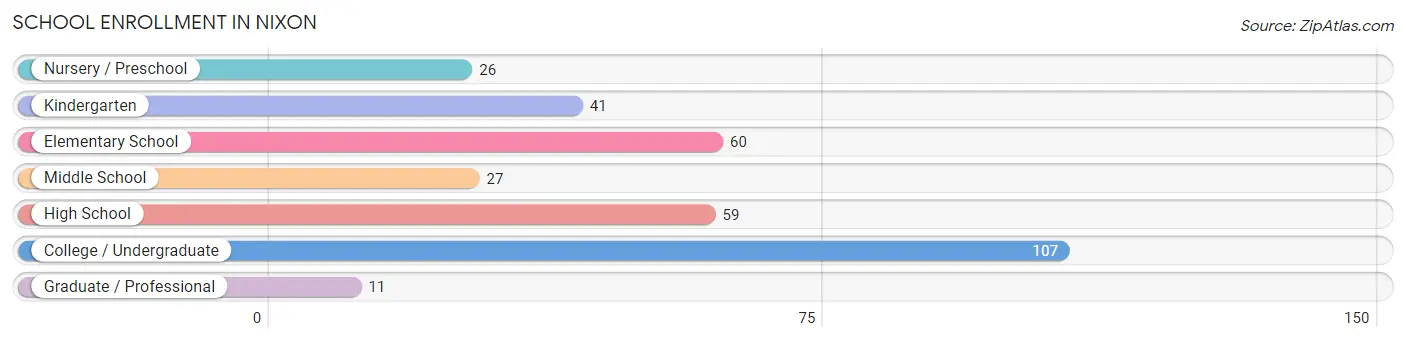
| School Level | # Students | % Students |
| Nursery / Preschool | 26 | 7.9% |
| Kindergarten | 41 | 12.4% |
| Elementary School | 60 | 18.1% |
| Middle School | 27 | 8.2% |
| High School | 59 | 17.8% |
| College / Undergraduate | 107 | 32.3% |
| Graduate / Professional | 11 | 3.3% |
| Total | 331 | 100.0% |
School Enrollment by Age by Funding Source in Nixon
Out of a total of 331 students who are enrolled in schools in Nixon, 75 (22.7%) attend a private institution, while the remaining 256 (77.3%) are enrolled in public schools. The age group of 25 to 34 year olds has the highest likelihood of being enrolled in private schools, with 19 (100.0% in the age bracket) enrolled. Conversely, the age group of 3 to 4 year olds has the lowest likelihood of being enrolled in a private school, with 26 (100.0% in the age bracket) attending a public institution.
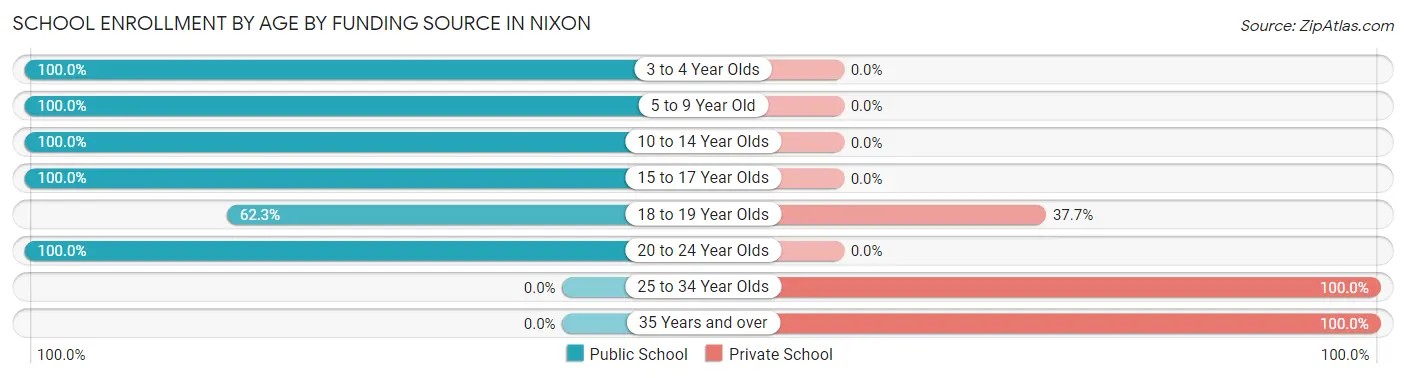
| Age Bracket | Public School | Private School |
| 3 to 4 Year Olds | 26 (100.0%) | 0 (0.0%) |
| 5 to 9 Year Old | 101 (100.0%) | 0 (0.0%) |
| 10 to 14 Year Olds | 27 (100.0%) | 0 (0.0%) |
| 15 to 17 Year Olds | 33 (100.0%) | 0 (0.0%) |
| 18 to 19 Year Olds | 43 (62.3%) | 26 (37.7%) |
| 20 to 24 Year Olds | 26 (100.0%) | 0 (0.0%) |
| 25 to 34 Year Olds | 0 (0.0%) | 19 (100.0%) |
| 35 Years and over | 0 (0.0%) | 30 (100.0%) |
| Total | 256 (77.3%) | 75 (22.7%) |
Educational Attainment by Field of Study in Nixon
Business (173 | 29.6%), science & technology (76 | 13.0%), computers & mathematics (56 | 9.6%), bio, nature & agricultural (56 | 9.6%), and education (46 | 7.9%) are the most common fields of study among 585 individuals in Nixon who have obtained a bachelor's degree or higher.
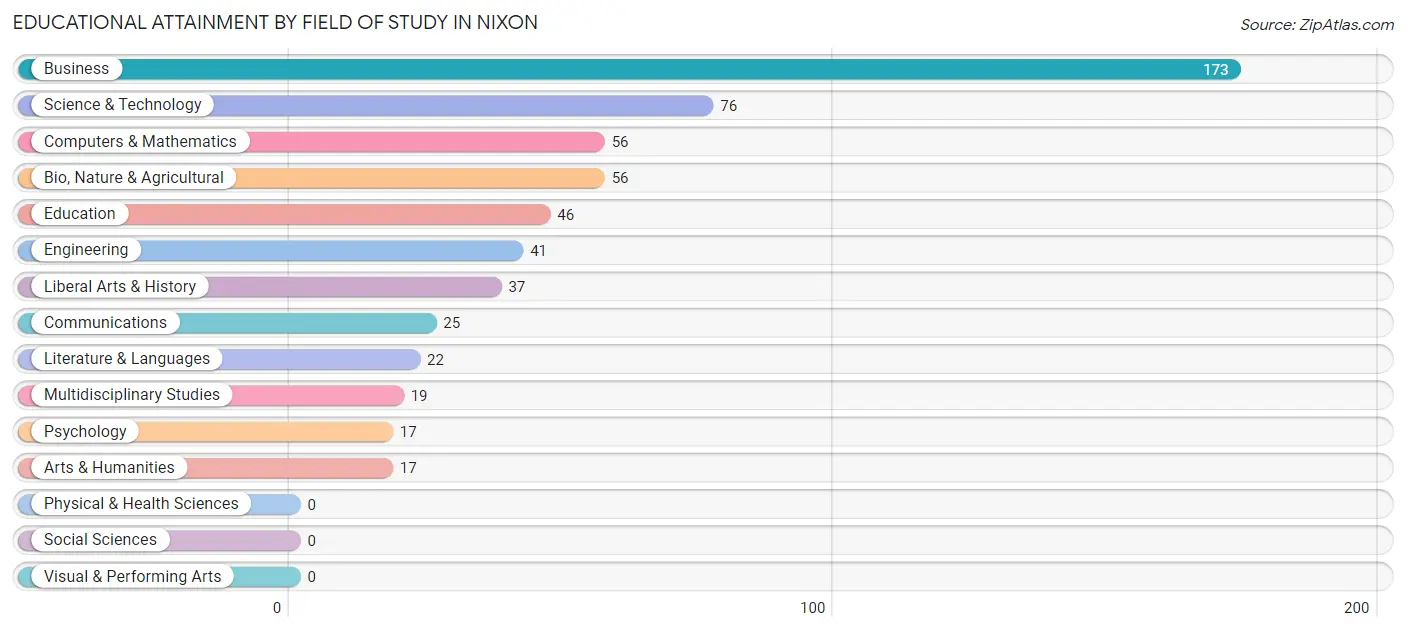
| Field of Study | # Graduates | % Graduates |
| Computers & Mathematics | 56 | 9.6% |
| Bio, Nature & Agricultural | 56 | 9.6% |
| Physical & Health Sciences | 0 | 0.0% |
| Psychology | 17 | 2.9% |
| Social Sciences | 0 | 0.0% |
| Engineering | 41 | 7.0% |
| Multidisciplinary Studies | 19 | 3.3% |
| Science & Technology | 76 | 13.0% |
| Business | 173 | 29.6% |
| Education | 46 | 7.9% |
| Literature & Languages | 22 | 3.8% |
| Liberal Arts & History | 37 | 6.3% |
| Visual & Performing Arts | 0 | 0.0% |
| Communications | 25 | 4.3% |
| Arts & Humanities | 17 | 2.9% |
| Total | 585 | 100.0% |
Transportation & Commute in Nixon
Vehicle Availability by Sex in Nixon
The most prevalent vehicle ownership categories in Nixon are males with 2 vehicles (189, accounting for 35.4%) and females with 2 vehicles (156, making up 64.1%).
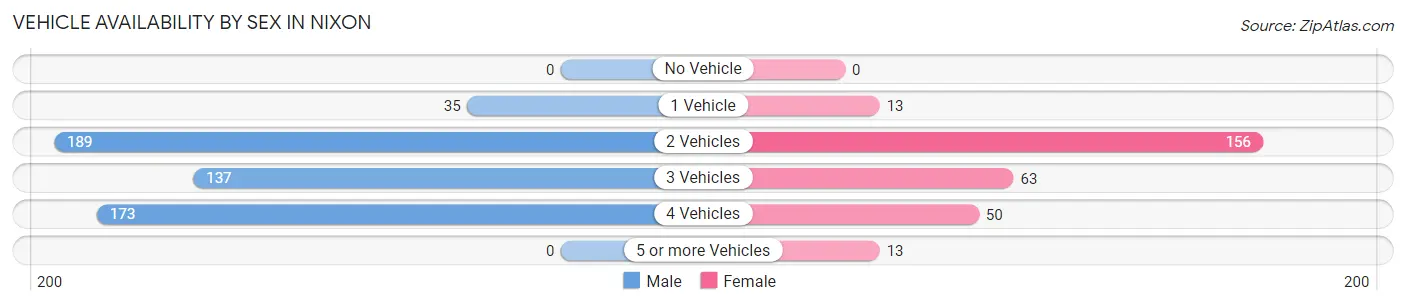
| Vehicles Available | Male | Female |
| No Vehicle | 0 (0.0%) | 0 (0.0%) |
| 1 Vehicle | 35 (6.6%) | 13 (4.4%) |
| 2 Vehicles | 189 (35.4%) | 156 (52.9%) |
| 3 Vehicles | 137 (25.7%) | 63 (21.4%) |
| 4 Vehicles | 173 (32.4%) | 50 (17.0%) |
| 5 or more Vehicles | 0 (0.0%) | 13 (4.4%) |
| Total | 534 (100.0%) | 295 (100.0%) |
Commute Time in Nixon
The most frequently occuring commute durations in Nixon are 15 to 19 minutes (168 commuters, 25.1%), 5 to 9 minutes (167 commuters, 25.0%), and 30 to 34 minutes (78 commuters, 11.7%).
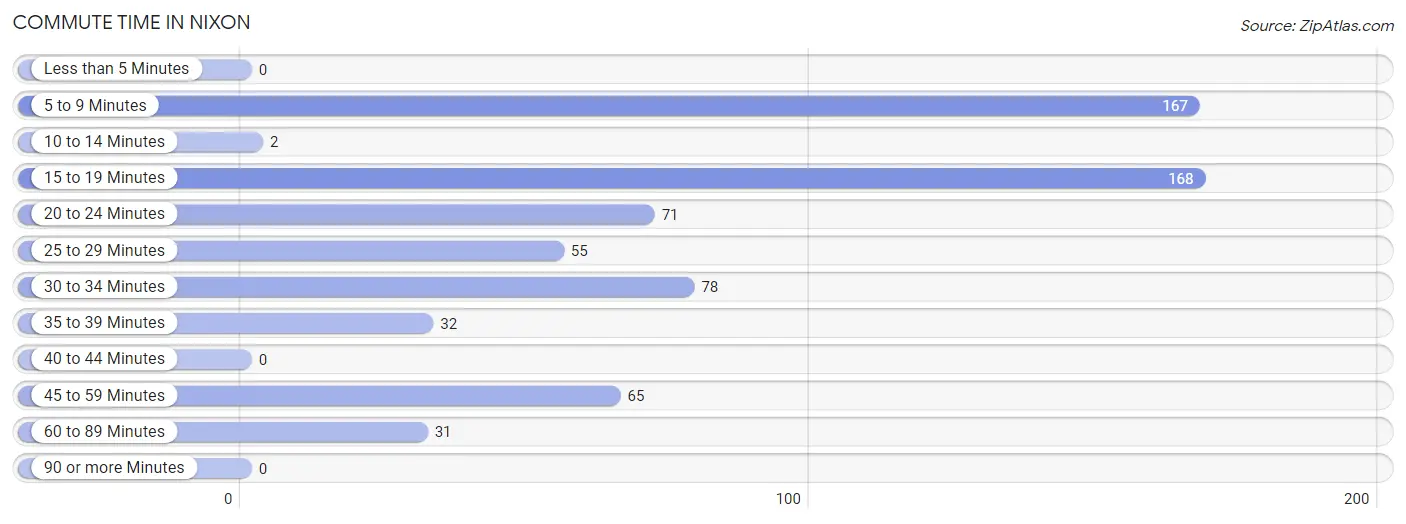
| Commute Time | # Commuters | % Commuters |
| Less than 5 Minutes | 0 | 0.0% |
| 5 to 9 Minutes | 167 | 25.0% |
| 10 to 14 Minutes | 2 | 0.3% |
| 15 to 19 Minutes | 168 | 25.1% |
| 20 to 24 Minutes | 71 | 10.6% |
| 25 to 29 Minutes | 55 | 8.2% |
| 30 to 34 Minutes | 78 | 11.7% |
| 35 to 39 Minutes | 32 | 4.8% |
| 40 to 44 Minutes | 0 | 0.0% |
| 45 to 59 Minutes | 65 | 9.7% |
| 60 to 89 Minutes | 31 | 4.6% |
| 90 or more Minutes | 0 | 0.0% |
Commute Time by Sex in Nixon
The most common commute times in Nixon are 5 to 9 minutes (118 commuters, 25.5%) for males and 20 to 24 minutes (57 commuters, 27.5%) for females.
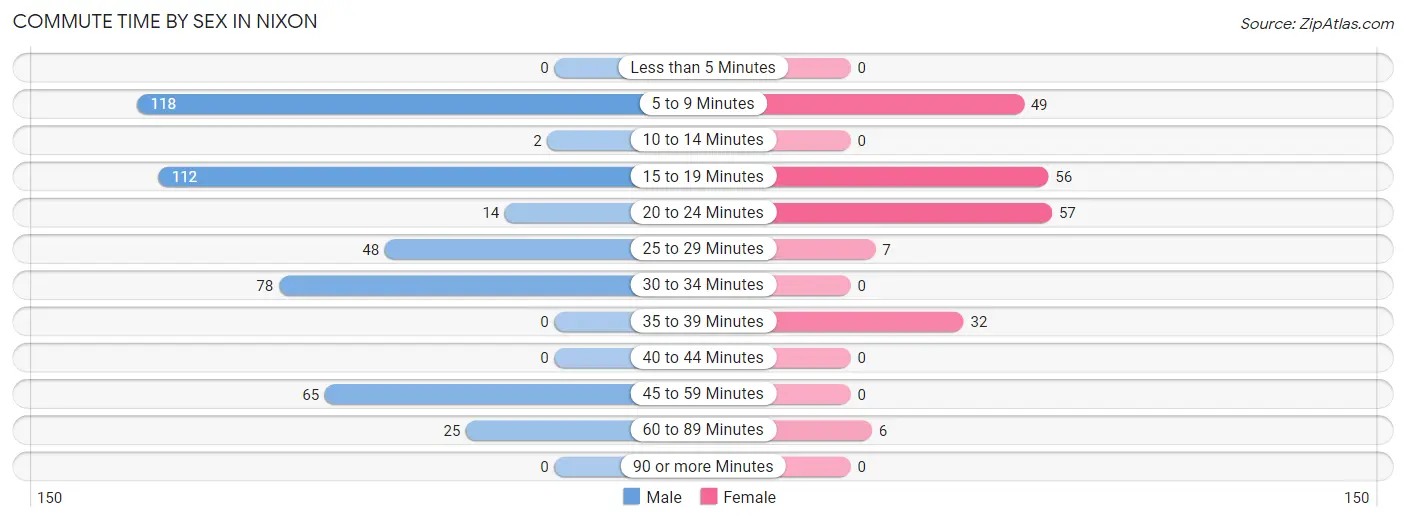
| Commute Time | Male | Female |
| Less than 5 Minutes | 0 (0.0%) | 0 (0.0%) |
| 5 to 9 Minutes | 118 (25.5%) | 49 (23.7%) |
| 10 to 14 Minutes | 2 (0.4%) | 0 (0.0%) |
| 15 to 19 Minutes | 112 (24.2%) | 56 (27.1%) |
| 20 to 24 Minutes | 14 (3.0%) | 57 (27.5%) |
| 25 to 29 Minutes | 48 (10.4%) | 7 (3.4%) |
| 30 to 34 Minutes | 78 (16.9%) | 0 (0.0%) |
| 35 to 39 Minutes | 0 (0.0%) | 32 (15.5%) |
| 40 to 44 Minutes | 0 (0.0%) | 0 (0.0%) |
| 45 to 59 Minutes | 65 (14.1%) | 0 (0.0%) |
| 60 to 89 Minutes | 25 (5.4%) | 6 (2.9%) |
| 90 or more Minutes | 0 (0.0%) | 0 (0.0%) |
Time of Departure to Work by Sex in Nixon
The most frequent times of departure to work in Nixon are 7:30 AM to 7:59 AM (95, 20.6%) for males and 8:30 AM to 8:59 AM (51, 24.6%) for females.
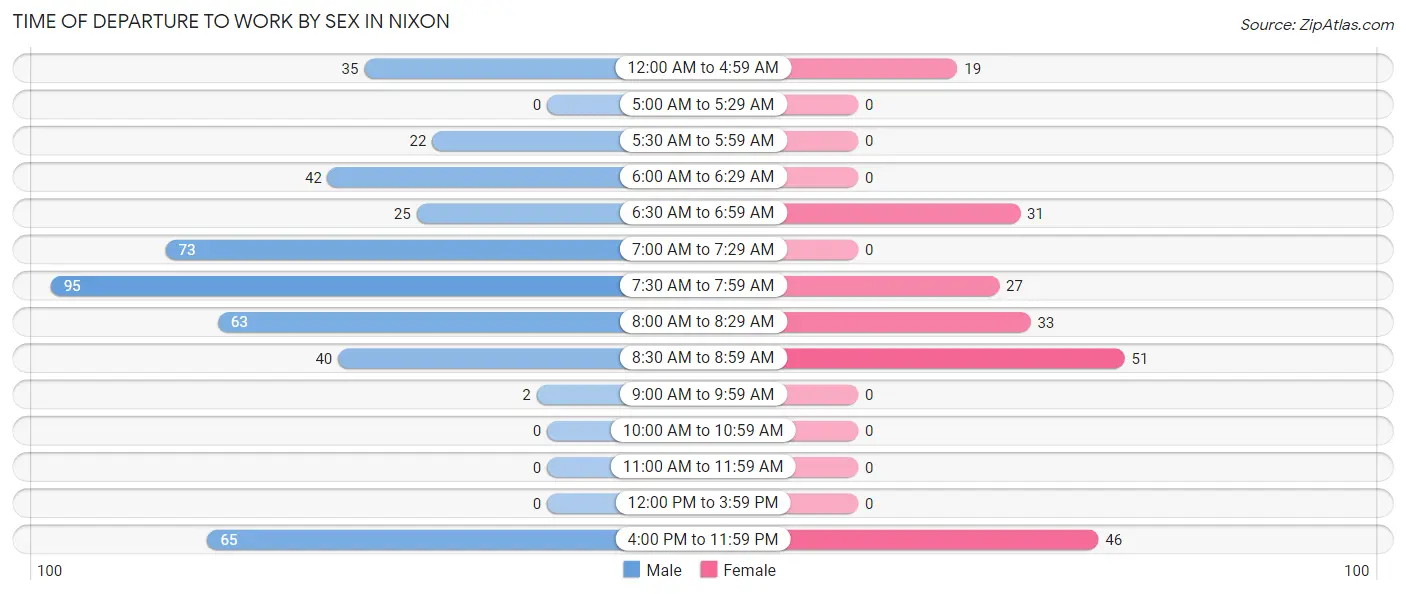
| Time of Departure | Male | Female |
| 12:00 AM to 4:59 AM | 35 (7.6%) | 19 (9.2%) |
| 5:00 AM to 5:29 AM | 0 (0.0%) | 0 (0.0%) |
| 5:30 AM to 5:59 AM | 22 (4.8%) | 0 (0.0%) |
| 6:00 AM to 6:29 AM | 42 (9.1%) | 0 (0.0%) |
| 6:30 AM to 6:59 AM | 25 (5.4%) | 31 (15.0%) |
| 7:00 AM to 7:29 AM | 73 (15.8%) | 0 (0.0%) |
| 7:30 AM to 7:59 AM | 95 (20.6%) | 27 (13.0%) |
| 8:00 AM to 8:29 AM | 63 (13.6%) | 33 (15.9%) |
| 8:30 AM to 8:59 AM | 40 (8.7%) | 51 (24.6%) |
| 9:00 AM to 9:59 AM | 2 (0.4%) | 0 (0.0%) |
| 10:00 AM to 10:59 AM | 0 (0.0%) | 0 (0.0%) |
| 11:00 AM to 11:59 AM | 0 (0.0%) | 0 (0.0%) |
| 12:00 PM to 3:59 PM | 0 (0.0%) | 0 (0.0%) |
| 4:00 PM to 11:59 PM | 65 (14.1%) | 46 (22.2%) |
| Total | 462 (100.0%) | 207 (100.0%) |
Housing Occupancy in Nixon
Occupancy by Ownership in Nixon
Of the total 540 dwellings in Nixon, owner-occupied units account for 520 (96.3%), while renter-occupied units make up 20 (3.7%).
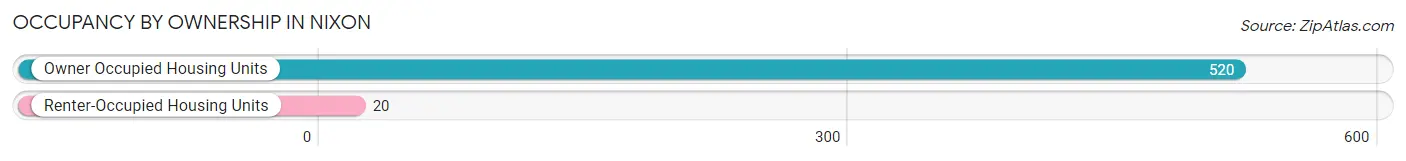
| Occupancy | # Housing Units | % Housing Units |
| Owner Occupied Housing Units | 520 | 96.3% |
| Renter-Occupied Housing Units | 20 | 3.7% |
| Total Occupied Housing Units | 540 | 100.0% |
Occupancy by Household Size in Nixon
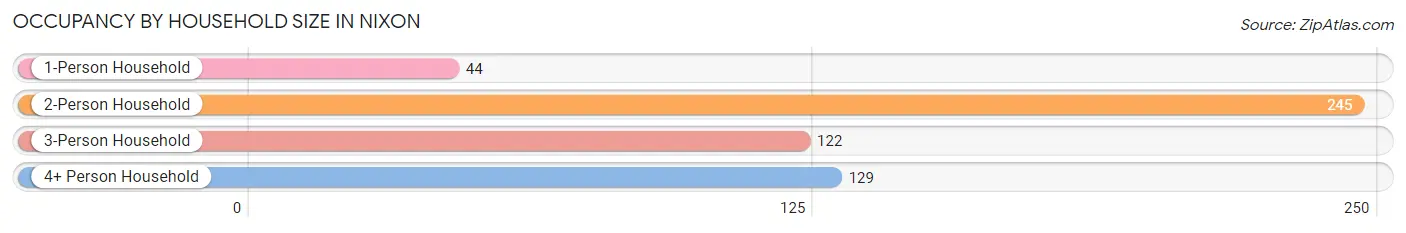
| Household Size | # Housing Units | % Housing Units |
| 1-Person Household | 44 | 8.2% |
| 2-Person Household | 245 | 45.4% |
| 3-Person Household | 122 | 22.6% |
| 4+ Person Household | 129 | 23.9% |
| Total Housing Units | 540 | 100.0% |
Occupancy by Ownership by Household Size in Nixon
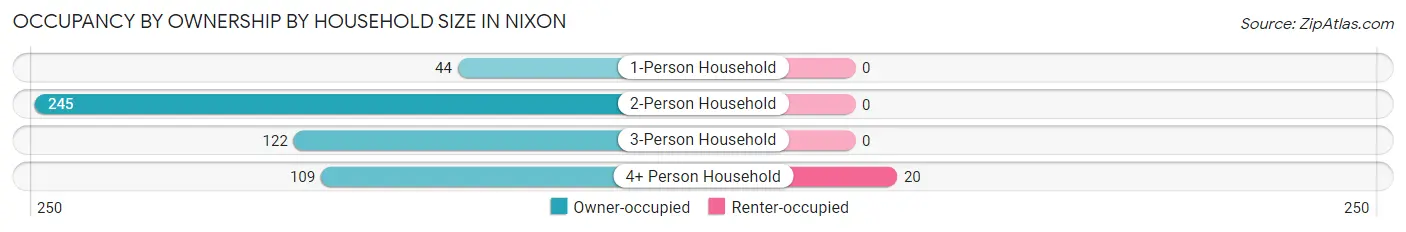
| Household Size | Owner-occupied | Renter-occupied |
| 1-Person Household | 44 (100.0%) | 0 (0.0%) |
| 2-Person Household | 245 (100.0%) | 0 (0.0%) |
| 3-Person Household | 122 (100.0%) | 0 (0.0%) |
| 4+ Person Household | 109 (84.5%) | 20 (15.5%) |
| Total Housing Units | 520 (96.3%) | 20 (3.7%) |
Occupancy by Educational Attainment in Nixon
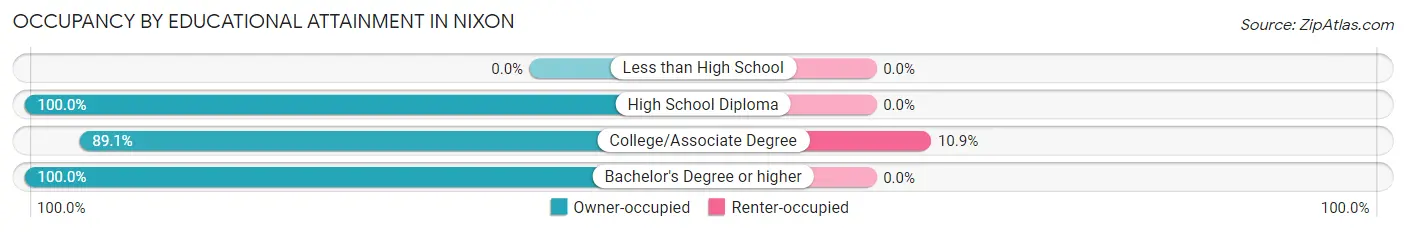
| Household Size | Owner-occupied | Renter-occupied |
| Less than High School | 0 (0.0%) | 0 (0.0%) |
| High School Diploma | 106 (100.0%) | 0 (0.0%) |
| College/Associate Degree | 164 (89.1%) | 20 (10.9%) |
| Bachelor's Degree or higher | 250 (100.0%) | 0 (0.0%) |
Occupancy by Age of Householder in Nixon
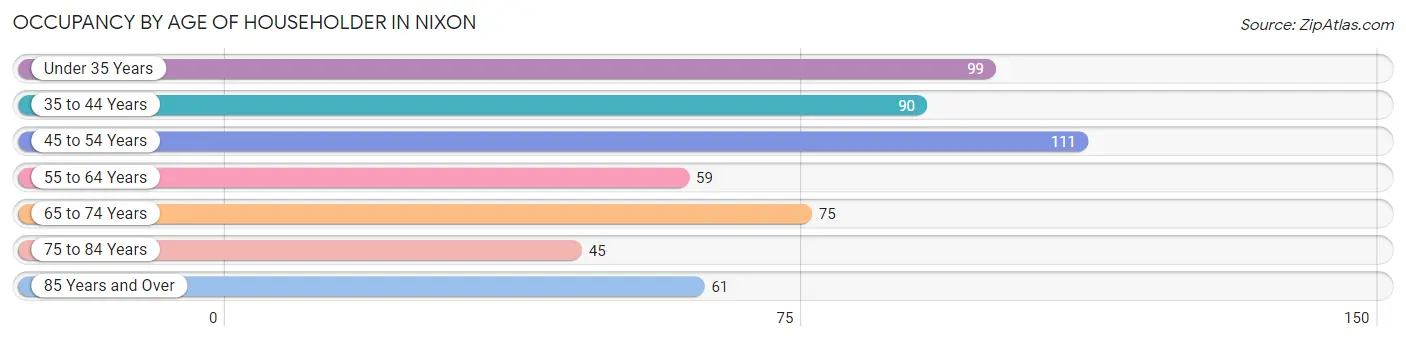
| Age Bracket | # Households | % Households |
| Under 35 Years | 99 | 18.3% |
| 35 to 44 Years | 90 | 16.7% |
| 45 to 54 Years | 111 | 20.6% |
| 55 to 64 Years | 59 | 10.9% |
| 65 to 74 Years | 75 | 13.9% |
| 75 to 84 Years | 45 | 8.3% |
| 85 Years and Over | 61 | 11.3% |
| Total | 540 | 100.0% |
Housing Finances in Nixon
Median Income by Occupancy in Nixon
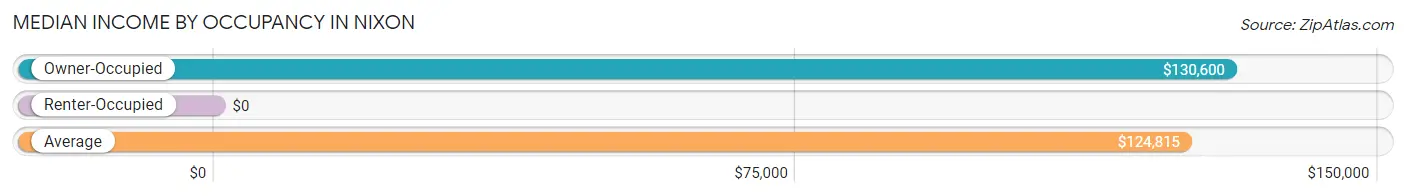
| Occupancy Type | # Households | Median Income |
| Owner-Occupied | 520 (96.3%) | $130,600 |
| Renter-Occupied | 20 (3.7%) | $0 |
| Average | 540 (100.0%) | $124,815 |
Occupancy by Householder Income Bracket in Nixon
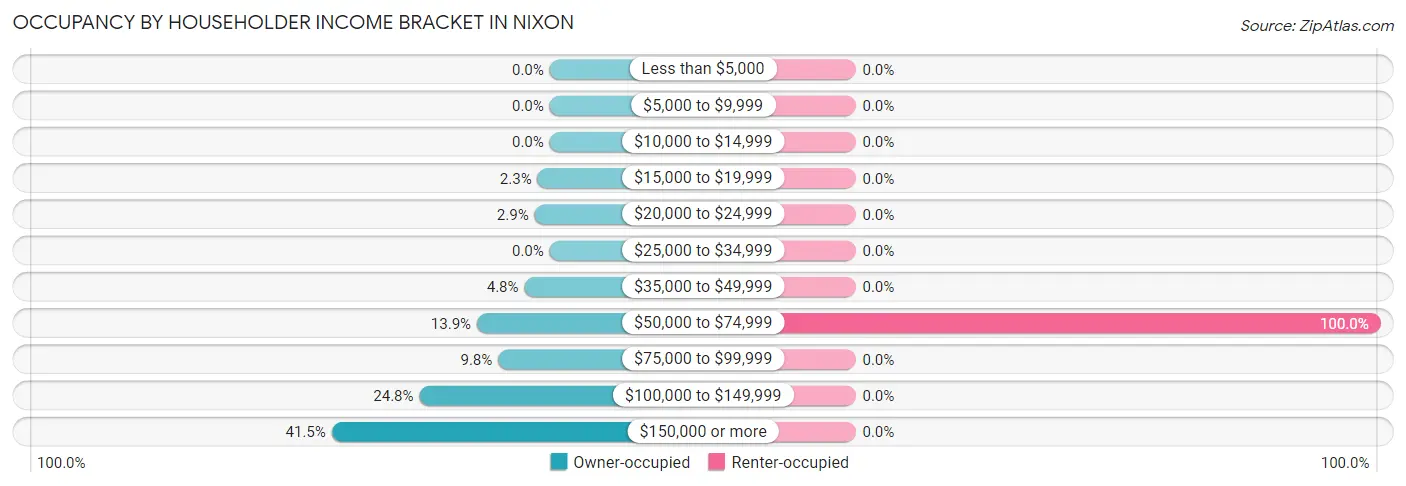
| Income Bracket | Owner-occupied | Renter-occupied |
| Less than $5,000 | 0 (0.0%) | 0 (0.0%) |
| $5,000 to $9,999 | 0 (0.0%) | 0 (0.0%) |
| $10,000 to $14,999 | 0 (0.0%) | 0 (0.0%) |
| $15,000 to $19,999 | 12 (2.3%) | 0 (0.0%) |
| $20,000 to $24,999 | 15 (2.9%) | 0 (0.0%) |
| $25,000 to $34,999 | 0 (0.0%) | 0 (0.0%) |
| $35,000 to $49,999 | 25 (4.8%) | 0 (0.0%) |
| $50,000 to $74,999 | 72 (13.9%) | 20 (100.0%) |
| $75,000 to $99,999 | 51 (9.8%) | 0 (0.0%) |
| $100,000 to $149,999 | 129 (24.8%) | 0 (0.0%) |
| $150,000 or more | 216 (41.5%) | 0 (0.0%) |
| Total | 520 (100.0%) | 20 (100.0%) |
Monthly Housing Cost Tiers in Nixon
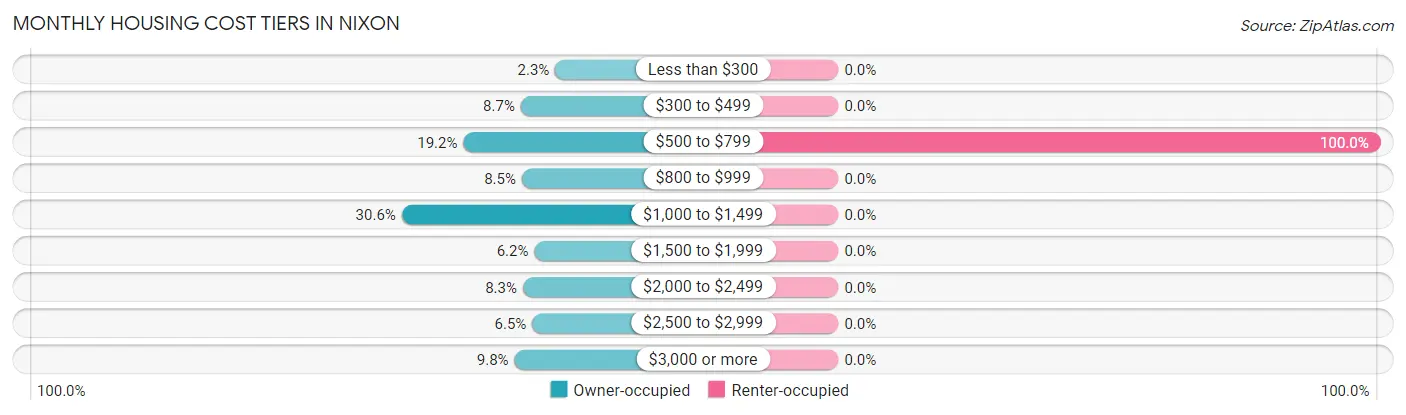
| Monthly Cost | Owner-occupied | Renter-occupied |
| Less than $300 | 12 (2.3%) | 0 (0.0%) |
| $300 to $499 | 45 (8.6%) | 0 (0.0%) |
| $500 to $799 | 100 (19.2%) | 20 (100.0%) |
| $800 to $999 | 44 (8.5%) | 0 (0.0%) |
| $1,000 to $1,499 | 159 (30.6%) | 0 (0.0%) |
| $1,500 to $1,999 | 32 (6.1%) | 0 (0.0%) |
| $2,000 to $2,499 | 43 (8.3%) | 0 (0.0%) |
| $2,500 to $2,999 | 34 (6.5%) | 0 (0.0%) |
| $3,000 or more | 51 (9.8%) | 0 (0.0%) |
| Total | 520 (100.0%) | 20 (100.0%) |
Physical Housing Characteristics in Nixon
Housing Structures in Nixon
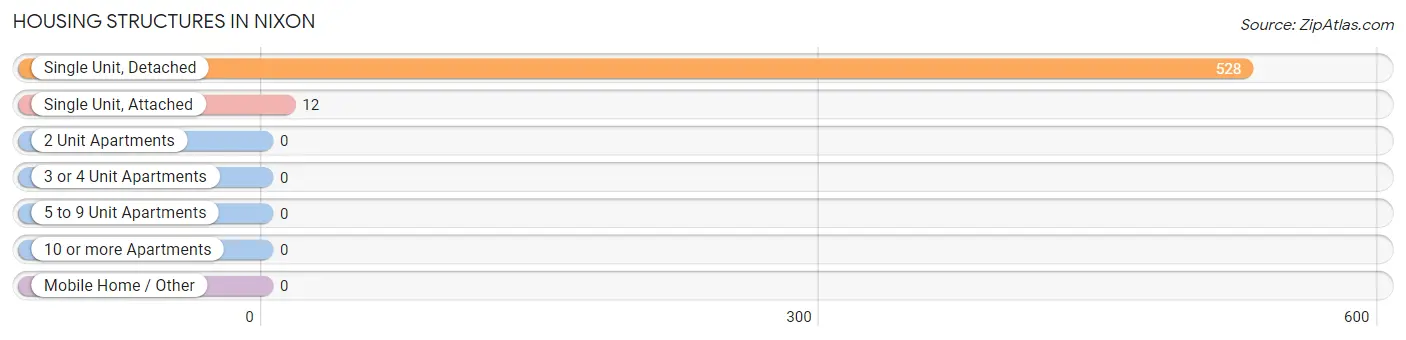
| Structure Type | # Housing Units | % Housing Units |
| Single Unit, Detached | 528 | 97.8% |
| Single Unit, Attached | 12 | 2.2% |
| 2 Unit Apartments | 0 | 0.0% |
| 3 or 4 Unit Apartments | 0 | 0.0% |
| 5 to 9 Unit Apartments | 0 | 0.0% |
| 10 or more Apartments | 0 | 0.0% |
| Mobile Home / Other | 0 | 0.0% |
| Total | 540 | 100.0% |
Housing Structures by Occupancy in Nixon
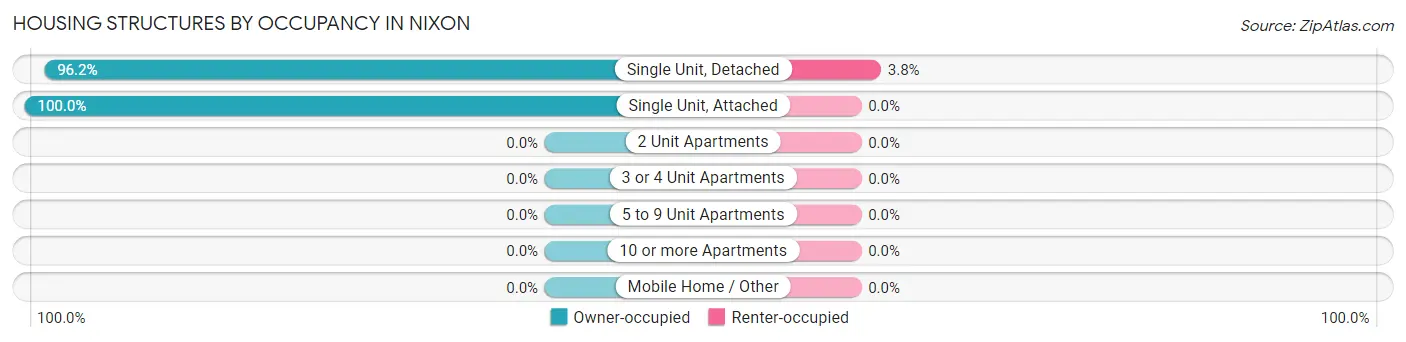
| Structure Type | Owner-occupied | Renter-occupied |
| Single Unit, Detached | 508 (96.2%) | 20 (3.8%) |
| Single Unit, Attached | 12 (100.0%) | 0 (0.0%) |
| 2 Unit Apartments | 0 (0.0%) | 0 (0.0%) |
| 3 or 4 Unit Apartments | 0 (0.0%) | 0 (0.0%) |
| 5 to 9 Unit Apartments | 0 (0.0%) | 0 (0.0%) |
| 10 or more Apartments | 0 (0.0%) | 0 (0.0%) |
| Mobile Home / Other | 0 (0.0%) | 0 (0.0%) |
| Total | 520 (96.3%) | 20 (3.7%) |
Housing Structures by Number of Rooms in Nixon
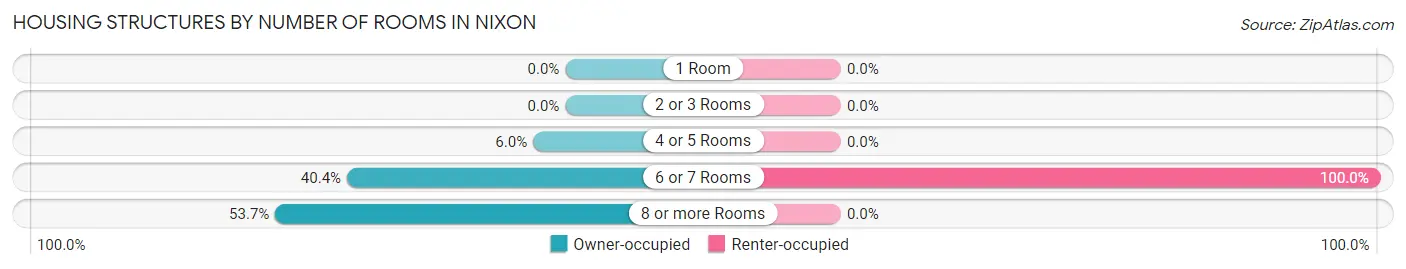
| Number of Rooms | Owner-occupied | Renter-occupied |
| 1 Room | 0 (0.0%) | 0 (0.0%) |
| 2 or 3 Rooms | 0 (0.0%) | 0 (0.0%) |
| 4 or 5 Rooms | 31 (6.0%) | 0 (0.0%) |
| 6 or 7 Rooms | 210 (40.4%) | 20 (100.0%) |
| 8 or more Rooms | 279 (53.6%) | 0 (0.0%) |
| Total | 520 (100.0%) | 20 (100.0%) |
Housing Structure by Heating Type in Nixon
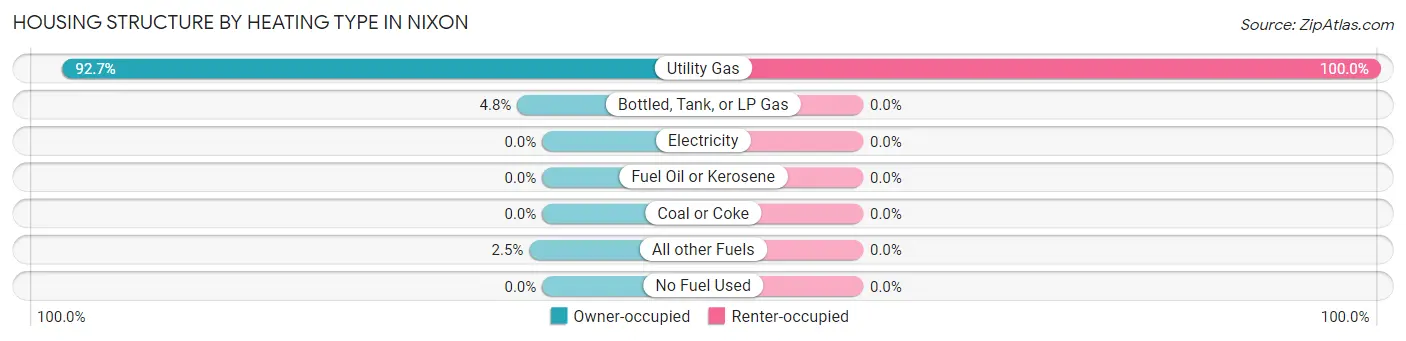
| Heating Type | Owner-occupied | Renter-occupied |
| Utility Gas | 482 (92.7%) | 20 (100.0%) |
| Bottled, Tank, or LP Gas | 25 (4.8%) | 0 (0.0%) |
| Electricity | 0 (0.0%) | 0 (0.0%) |
| Fuel Oil or Kerosene | 0 (0.0%) | 0 (0.0%) |
| Coal or Coke | 0 (0.0%) | 0 (0.0%) |
| All other Fuels | 13 (2.5%) | 0 (0.0%) |
| No Fuel Used | 0 (0.0%) | 0 (0.0%) |
| Total | 520 (100.0%) | 20 (100.0%) |
Household Vehicle Usage in Nixon
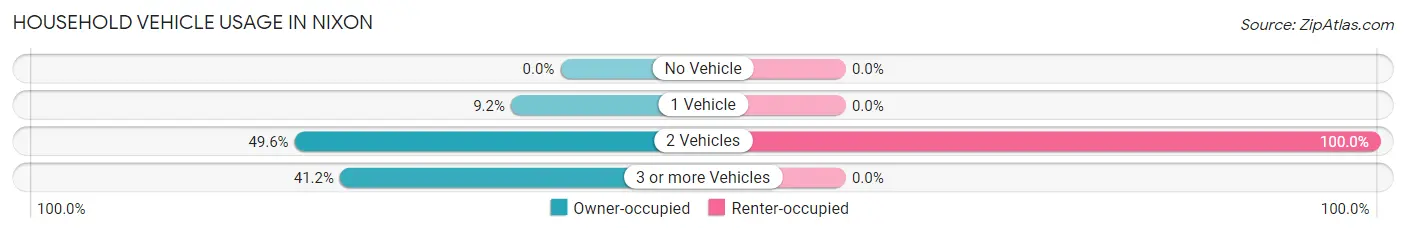
| Vehicles per Household | Owner-occupied | Renter-occupied |
| No Vehicle | 0 (0.0%) | 0 (0.0%) |
| 1 Vehicle | 48 (9.2%) | 0 (0.0%) |
| 2 Vehicles | 258 (49.6%) | 20 (100.0%) |
| 3 or more Vehicles | 214 (41.1%) | 0 (0.0%) |
| Total | 520 (100.0%) | 20 (100.0%) |
Real Estate & Mortgages in Nixon
Real Estate and Mortgage Overview in Nixon
| Characteristic | Without Mortgage | With Mortgage |
| Housing Units | 201 | 319 |
| Median Property Value | $226,500 | $287,500 |
| Median Household Income | $166,306 | $77 |
| Monthly Housing Costs | $584 | $51 |
| Real Estate Taxes | $3,650 | $0 |
Property Value by Mortgage Status in Nixon
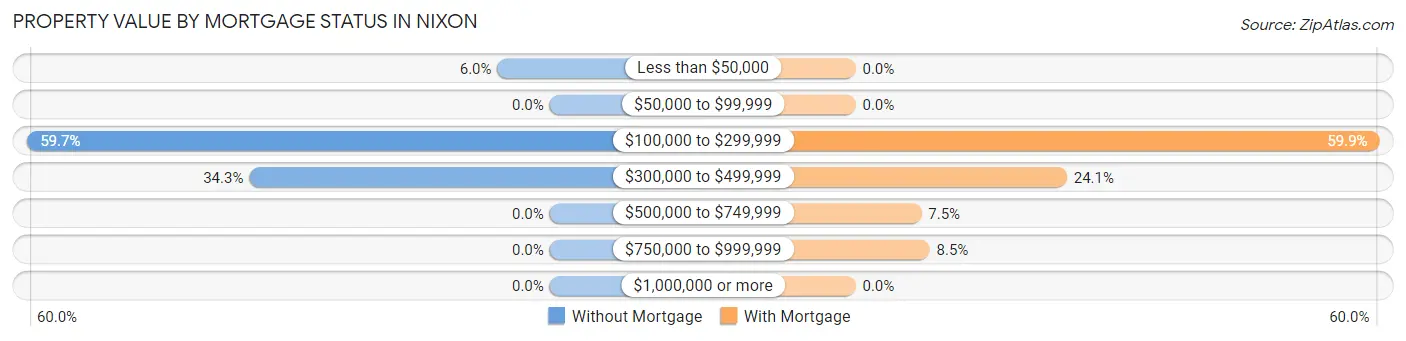
| Property Value | Without Mortgage | With Mortgage |
| Less than $50,000 | 12 (6.0%) | 0 (0.0%) |
| $50,000 to $99,999 | 0 (0.0%) | 0 (0.0%) |
| $100,000 to $299,999 | 120 (59.7%) | 191 (59.9%) |
| $300,000 to $499,999 | 69 (34.3%) | 77 (24.1%) |
| $500,000 to $749,999 | 0 (0.0%) | 24 (7.5%) |
| $750,000 to $999,999 | 0 (0.0%) | 27 (8.5%) |
| $1,000,000 or more | 0 (0.0%) | 0 (0.0%) |
| Total | 201 (100.0%) | 319 (100.0%) |
Household Income by Mortgage Status in Nixon
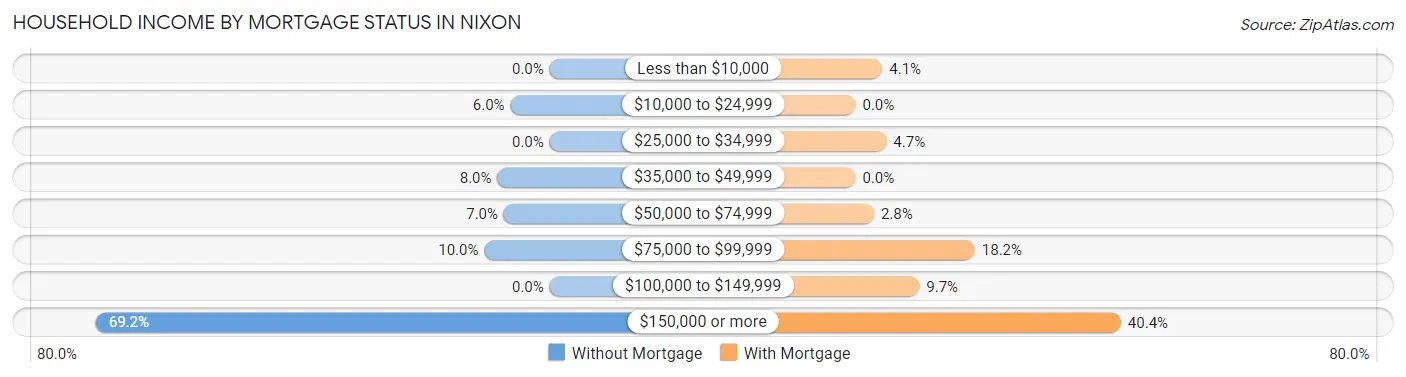
| Household Income | Without Mortgage | With Mortgage |
| Less than $10,000 | 0 (0.0%) | 13 (4.1%) |
| $10,000 to $24,999 | 12 (6.0%) | 0 (0.0%) |
| $25,000 to $34,999 | 0 (0.0%) | 15 (4.7%) |
| $35,000 to $49,999 | 16 (8.0%) | 0 (0.0%) |
| $50,000 to $74,999 | 14 (7.0%) | 9 (2.8%) |
| $75,000 to $99,999 | 20 (10.0%) | 58 (18.2%) |
| $100,000 to $149,999 | 0 (0.0%) | 31 (9.7%) |
| $150,000 or more | 139 (69.2%) | 129 (40.4%) |
| Total | 201 (100.0%) | 319 (100.0%) |
Property Value to Household Income Ratio in Nixon
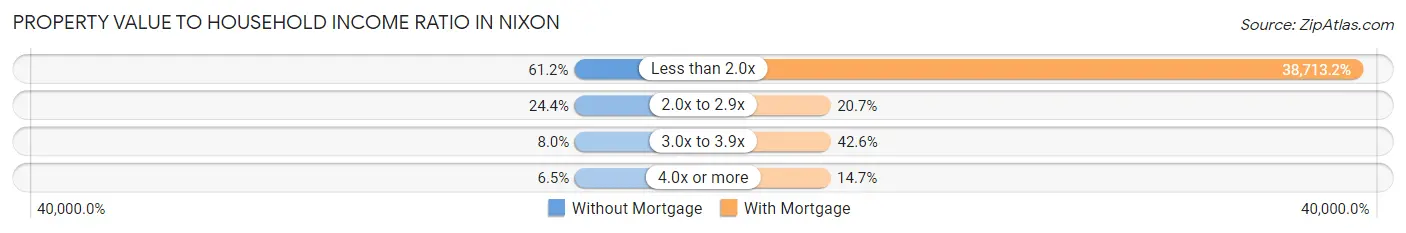
| Value-to-Income Ratio | Without Mortgage | With Mortgage |
| Less than 2.0x | 123 (61.2%) | 123,495 (38,713.2%) |
| 2.0x to 2.9x | 49 (24.4%) | 66 (20.7%) |
| 3.0x to 3.9x | 16 (8.0%) | 136 (42.6%) |
| 4.0x or more | 13 (6.5%) | 47 (14.7%) |
| Total | 201 (100.0%) | 319 (100.0%) |
Real Estate Taxes by Mortgage Status in Nixon
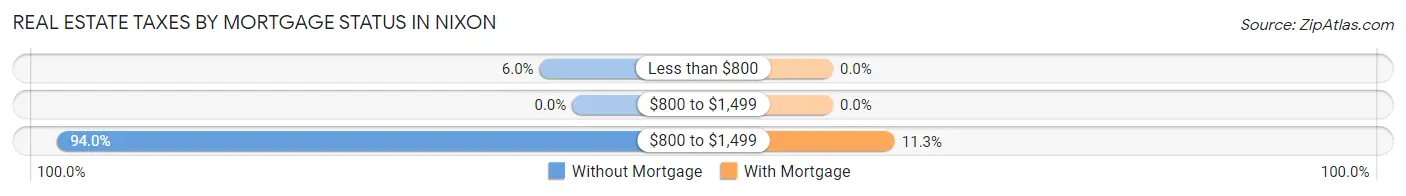
| Property Taxes | Without Mortgage | With Mortgage |
| Less than $800 | 12 (6.0%) | 0 (0.0%) |
| $800 to $1,499 | 0 (0.0%) | 0 (0.0%) |
| $800 to $1,499 | 189 (94.0%) | 36 (11.3%) |
| Total | 201 (100.0%) | 319 (100.0%) |
Health & Disability in Nixon
Health Insurance Coverage by Age in Nixon
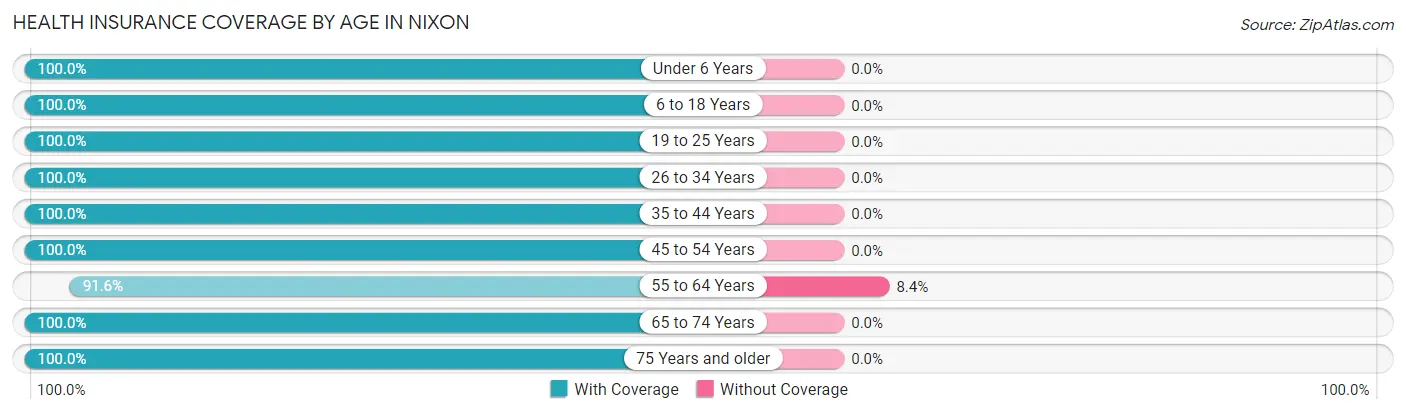
| Age Bracket | With Coverage | Without Coverage |
| Under 6 Years | 137 (100.0%) | 0 (0.0%) |
| 6 to 18 Years | 187 (100.0%) | 0 (0.0%) |
| 19 to 25 Years | 69 (100.0%) | 0 (0.0%) |
| 26 to 34 Years | 145 (100.0%) | 0 (0.0%) |
| 35 to 44 Years | 198 (100.0%) | 0 (0.0%) |
| 45 to 54 Years | 228 (100.0%) | 0 (0.0%) |
| 55 to 64 Years | 163 (91.6%) | 15 (8.4%) |
| 65 to 74 Years | 128 (100.0%) | 0 (0.0%) |
| 75 Years and older | 213 (100.0%) | 0 (0.0%) |
| Total | 1,468 (99.0%) | 15 (1.0%) |
Health Insurance Coverage by Citizenship Status in Nixon
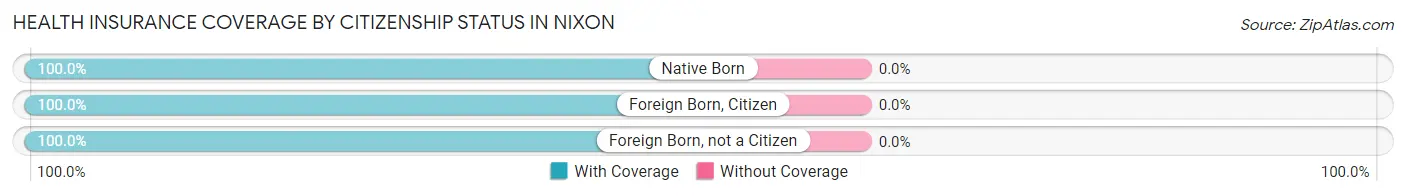
| Citizenship Status | With Coverage | Without Coverage |
| Native Born | 137 (100.0%) | 0 (0.0%) |
| Foreign Born, Citizen | 187 (100.0%) | 0 (0.0%) |
| Foreign Born, not a Citizen | 69 (100.0%) | 0 (0.0%) |
Health Insurance Coverage by Household Income in Nixon
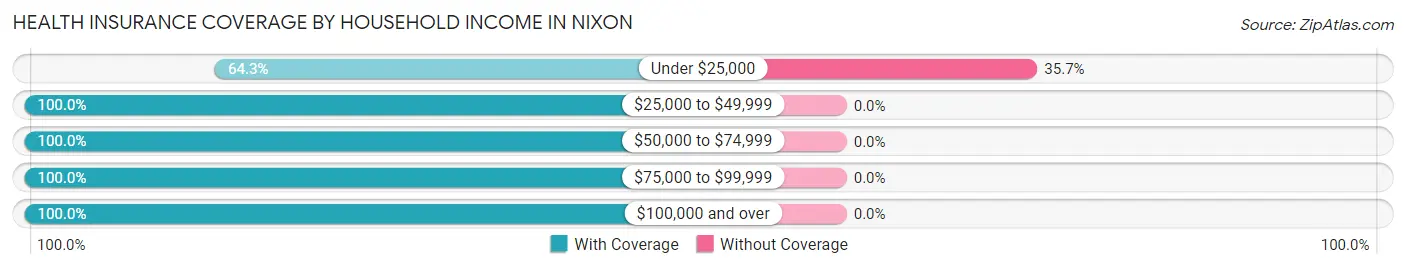
| Household Income | With Coverage | Without Coverage |
| Under $25,000 | 27 (64.3%) | 15 (35.7%) |
| $25,000 to $49,999 | 41 (100.0%) | 0 (0.0%) |
| $50,000 to $74,999 | 215 (100.0%) | 0 (0.0%) |
| $75,000 to $99,999 | 103 (100.0%) | 0 (0.0%) |
| $100,000 and over | 1,076 (100.0%) | 0 (0.0%) |
Public vs Private Health Insurance Coverage by Age in Nixon
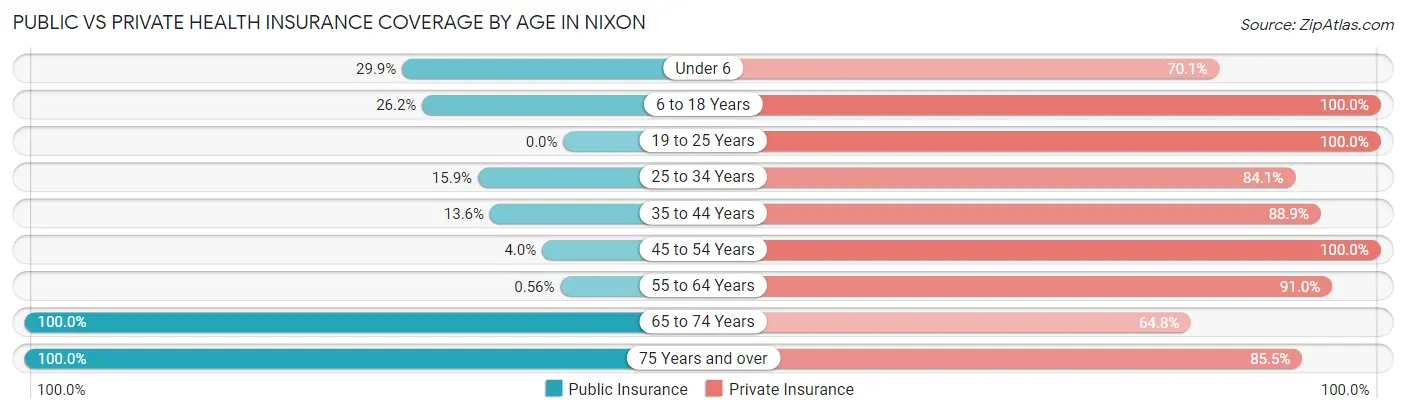
| Age Bracket | Public Insurance | Private Insurance |
| Under 6 | 41 (29.9%) | 96 (70.1%) |
| 6 to 18 Years | 49 (26.2%) | 187 (100.0%) |
| 19 to 25 Years | 0 (0.0%) | 69 (100.0%) |
| 25 to 34 Years | 23 (15.9%) | 122 (84.1%) |
| 35 to 44 Years | 27 (13.6%) | 176 (88.9%) |
| 45 to 54 Years | 9 (4.0%) | 228 (100.0%) |
| 55 to 64 Years | 1 (0.6%) | 162 (91.0%) |
| 65 to 74 Years | 128 (100.0%) | 83 (64.8%) |
| 75 Years and over | 213 (100.0%) | 182 (85.5%) |
| Total | 491 (33.1%) | 1,305 (88.0%) |
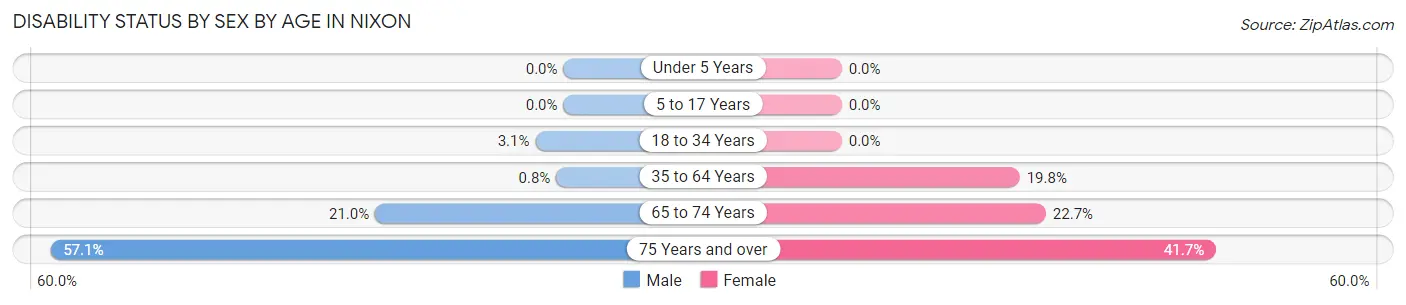
Disability Status by Sex by Age in Nixon
| Age Bracket | Male | Female |
| Under 5 Years | 0 (0.0%) | 0 (0.0%) |
| 5 to 17 Years | 0 (0.0%) | 0 (0.0%) |
| 18 to 34 Years | 3 (3.1%) | 0 (0.0%) |
| 35 to 64 Years | 3 (0.8%) | 45 (19.8%) |
| 65 to 74 Years | 13 (21.0%) | 15 (22.7%) |
| 75 Years and over | 60 (57.1%) | 45 (41.7%) |
Disability Class by Sex by Age in Nixon
Disability Class: Hearing Difficulty
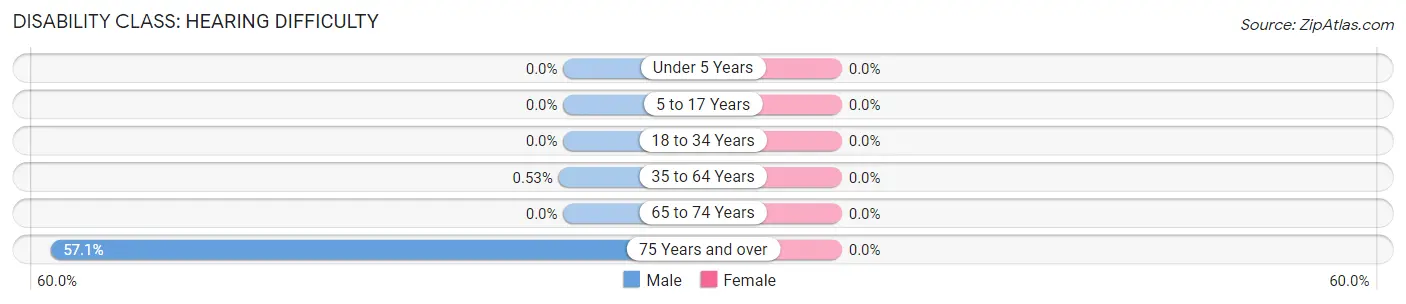
| Age Bracket | Male | Female |
| Under 5 Years | 0 (0.0%) | 0 (0.0%) |
| 5 to 17 Years | 0 (0.0%) | 0 (0.0%) |
| 18 to 34 Years | 0 (0.0%) | 0 (0.0%) |
| 35 to 64 Years | 2 (0.5%) | 0 (0.0%) |
| 65 to 74 Years | 0 (0.0%) | 0 (0.0%) |
| 75 Years and over | 60 (57.1%) | 0 (0.0%) |
Disability Class: Vision Difficulty
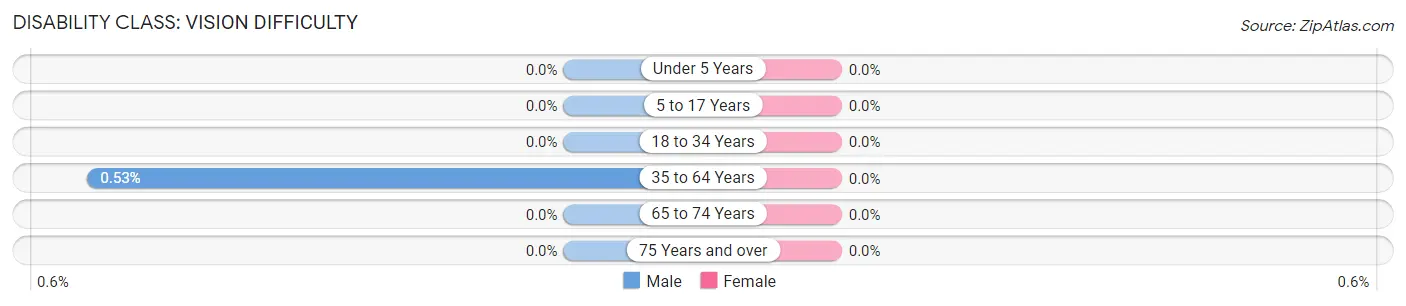
| Age Bracket | Male | Female |
| Under 5 Years | 0 (0.0%) | 0 (0.0%) |
| 5 to 17 Years | 0 (0.0%) | 0 (0.0%) |
| 18 to 34 Years | 0 (0.0%) | 0 (0.0%) |
| 35 to 64 Years | 2 (0.5%) | 0 (0.0%) |
| 65 to 74 Years | 0 (0.0%) | 0 (0.0%) |
| 75 Years and over | 0 (0.0%) | 0 (0.0%) |
Disability Class: Cognitive Difficulty
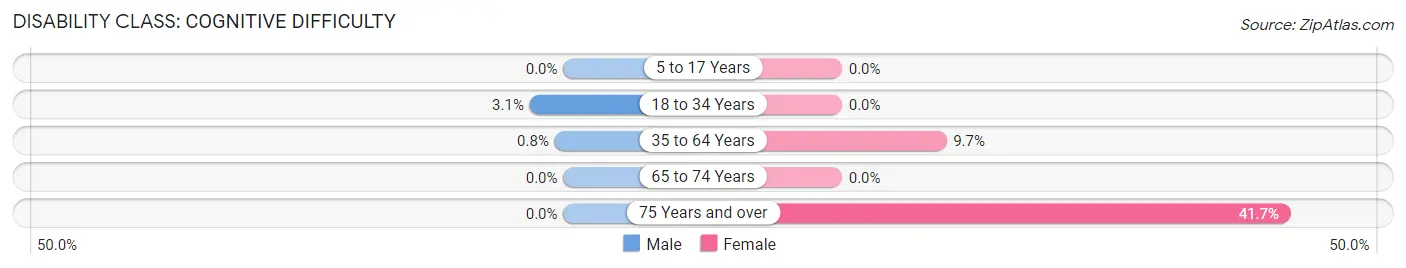
| Age Bracket | Male | Female |
| 5 to 17 Years | 0 (0.0%) | 0 (0.0%) |
| 18 to 34 Years | 3 (3.1%) | 0 (0.0%) |
| 35 to 64 Years | 3 (0.8%) | 22 (9.7%) |
| 65 to 74 Years | 0 (0.0%) | 0 (0.0%) |
| 75 Years and over | 0 (0.0%) | 45 (41.7%) |
Disability Class: Ambulatory Difficulty
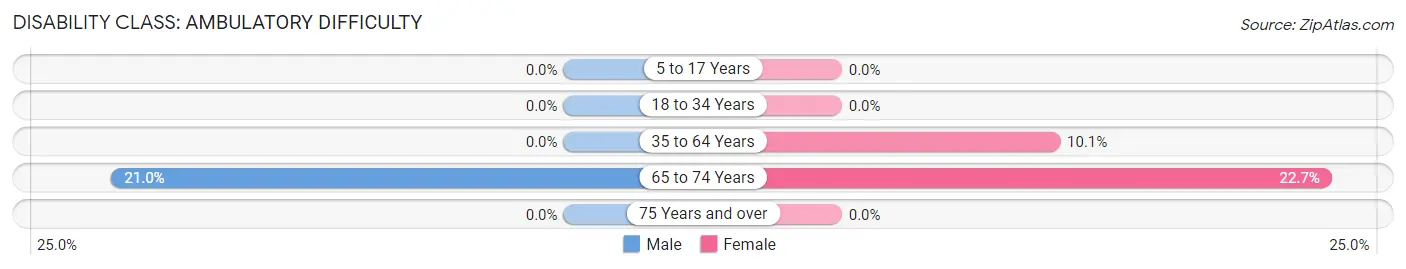
| Age Bracket | Male | Female |
| 5 to 17 Years | 0 (0.0%) | 0 (0.0%) |
| 18 to 34 Years | 0 (0.0%) | 0 (0.0%) |
| 35 to 64 Years | 0 (0.0%) | 23 (10.1%) |
| 65 to 74 Years | 13 (21.0%) | 15 (22.7%) |
| 75 Years and over | 0 (0.0%) | 0 (0.0%) |
Disability Class: Self-Care Difficulty
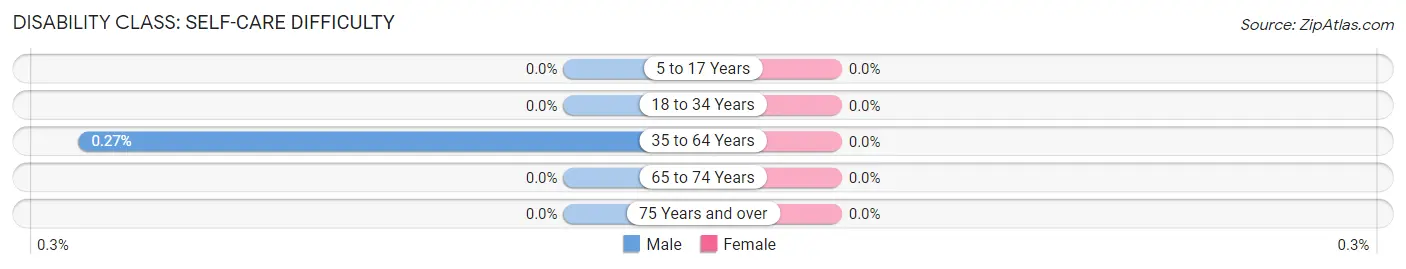
| Age Bracket | Male | Female |
| 5 to 17 Years | 0 (0.0%) | 0 (0.0%) |
| 18 to 34 Years | 0 (0.0%) | 0 (0.0%) |
| 35 to 64 Years | 1 (0.3%) | 0 (0.0%) |
| 65 to 74 Years | 0 (0.0%) | 0 (0.0%) |
| 75 Years and over | 0 (0.0%) | 0 (0.0%) |
Technology Access in Nixon
Computing Device Access in Nixon
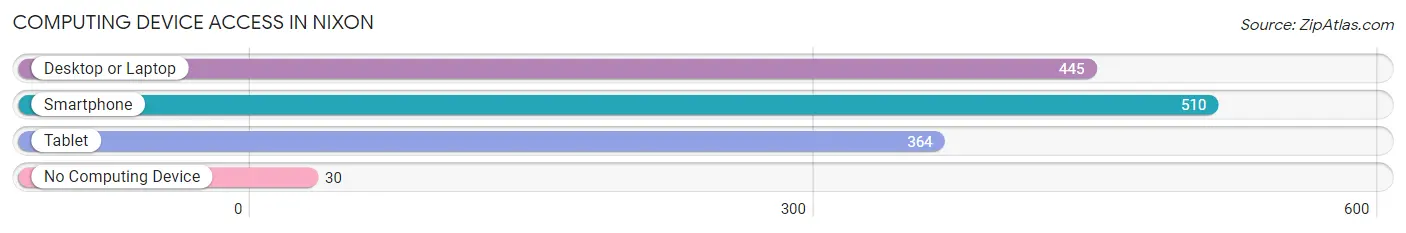
| Device Type | # Households | % Households |
| Desktop or Laptop | 445 | 82.4% |
| Smartphone | 510 | 94.4% |
| Tablet | 364 | 67.4% |
| No Computing Device | 30 | 5.6% |
| Total | 540 | 100.0% |
Internet Access in Nixon
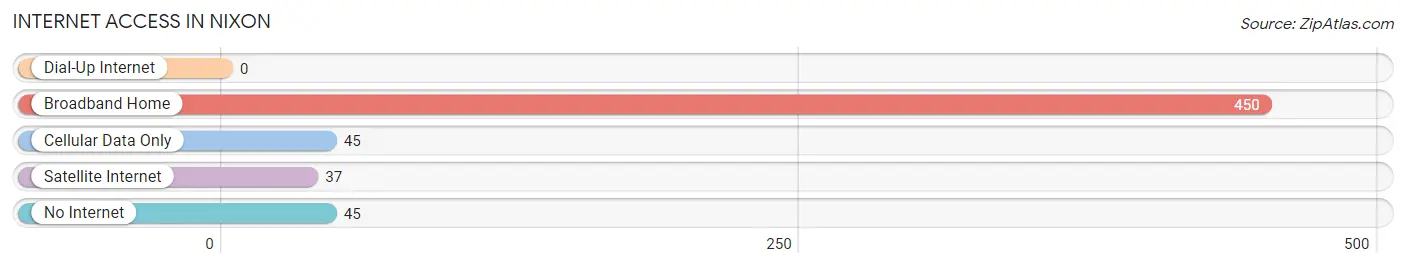
| Internet Type | # Households | % Households |
| Dial-Up Internet | 0 | 0.0% |
| Broadband Home | 450 | 83.3% |
| Cellular Data Only | 45 | 8.3% |
| Satellite Internet | 37 | 6.9% |
| No Internet | 45 | 8.3% |
| Total | 540 | 100.0% |
Nixon Summary
Nixon is a borough located in Schuylkill County, Pennsylvania. It is situated in the southern part of the state, approximately two miles south of the city of Pottsville. The population of Nixon was 1,845 as of the 2010 census.
History
Nixon was founded in 1845 by John Nixon, a local landowner. The town was originally known as Nixonville, but the name was changed to Nixon in 1876. The town was incorporated in 1887.
Nixon was a coal mining town in the late 19th and early 20th centuries. The town was home to several coal mines, including the Nixon Colliery, which operated from 1887 to 1923. The town was also home to the Nixon Iron Works, which operated from 1887 to 1902.
Geography
Nixon is located at 40°45'25"N 76°10'45"W (40.7569, -76.1792). It is situated in the southern part of Schuylkill County, approximately two miles south of the city of Pottsville.
The borough has a total area of 0.6 square miles, all of which is land. The town is located in the Appalachian Mountains and is surrounded by hills and mountains.
Economy
Nixon's economy is largely based on agriculture and tourism. The town is home to several farms, including the Nixon Dairy Farm, which produces milk, cheese, and other dairy products.
The town is also home to several tourist attractions, including the Nixon Iron Works Museum, which showcases the history of the town's iron industry. The town is also home to the Nixon Historical Society, which offers tours of the town's historic sites.
Demographics
As of the 2010 census, the population of Nixon was 1,845. The racial makeup of the town was 97.3% White, 0.7% African American, 0.2% Native American, 0.2% Asian, 0.2% from other races, and 1.6% from two or more races. Hispanic or Latino of any race were 0.9% of the population.
The median household income in Nixon was $41,250, and the median family income was $50,000. The per capita income for the town was $20,945. About 11.2% of families and 14.2% of the population were below the poverty line, including 18.2% of those under age 18 and 8.3% of those age 65 or over.
Common Questions
What is Per Capita Income in Nixon?
Per Capita income in Nixon is $58,026.
What is the Median Family Income in Nixon?
Median Family Income in Nixon is $150,223.
What is the Median Household income in Nixon?
Median Household Income in Nixon is $124,815.
What is Inequality or Gini Index in Nixon?
Inequality or Gini Index in Nixon is 0.40.
What is the Total Population of Nixon?
Total Population of Nixon is 1,483.
What is the Total Male Population of Nixon?
Total Male Population of Nixon is 692.
What is the Total Female Population of Nixon?
Total Female Population of Nixon is 791.
What is the Ratio of Males per 100 Females in Nixon?
There are 87.48 Males per 100 Females in Nixon.
What is the Ratio of Females per 100 Males in Nixon?
There are 114.31 Females per 100 Males in Nixon.
What is the Median Population Age in Nixon?
Median Population Age in Nixon is 45.7 Years.
What is the Average Family Size in Nixon
Average Family Size in Nixon is 3.1 People.
What is the Average Household Size in Nixon
Average Household Size in Nixon is 2.7 People.
How Large is the Labor Force in Nixon?
There are 868 People in the Labor Forcein in Nixon.
What is the Percentage of People in the Labor Force in Nixon?
71.3% of People are in the Labor Force in Nixon.
What is the Unemployment Rate in Nixon?
Unemployment Rate in Nixon is 2.8%.