Enlow, PA Map & Demographics
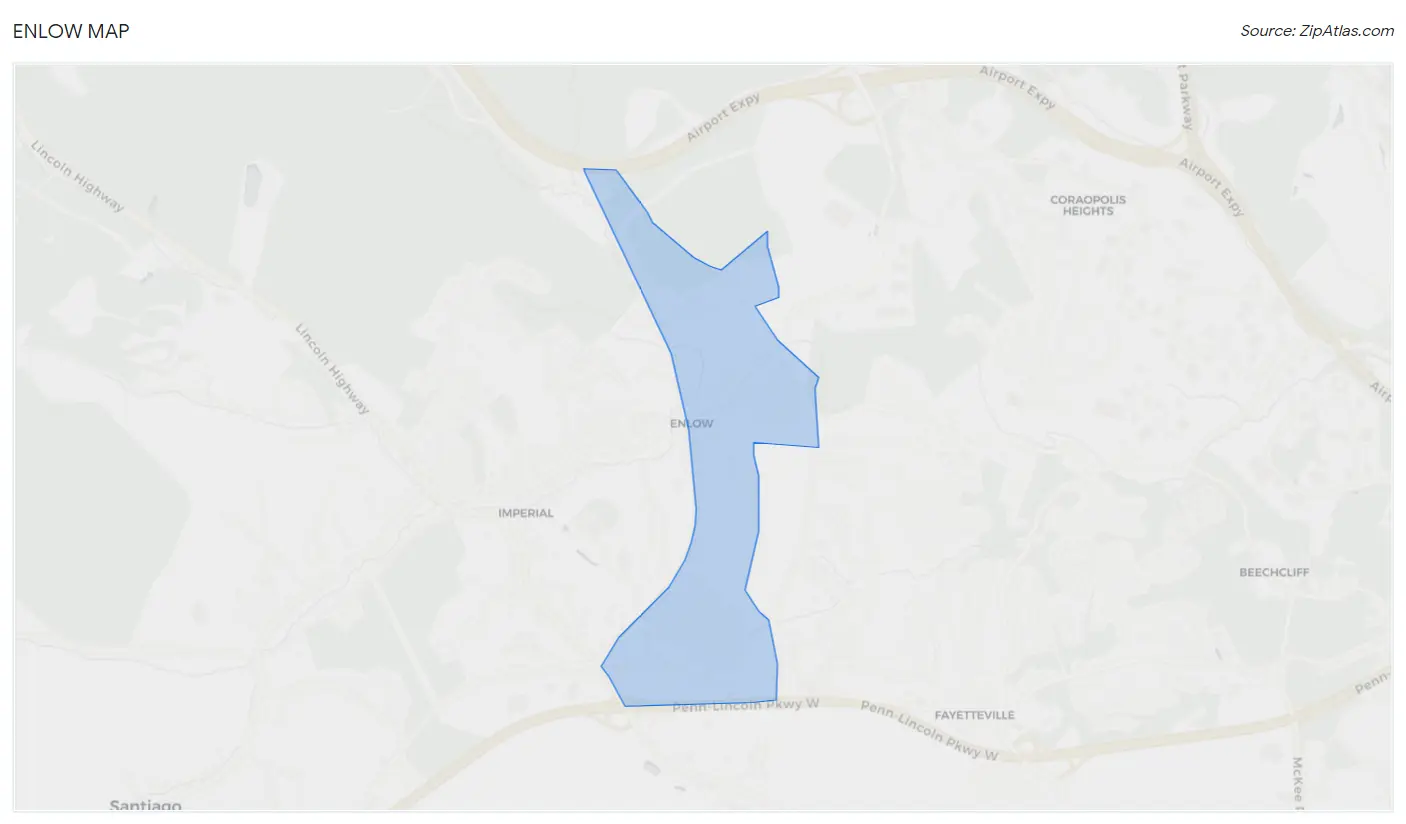
Enlow Map
Enlow Overview
$50,570
PER CAPITA INCOME
$105,750
AVG FAMILY INCOME
$125,852
AVG HOUSEHOLD INCOME
0.34
INEQUALITY / GINI INDEX
1,205
TOTAL POPULATION
469
MALE POPULATION
736
FEMALE POPULATION
63.72
MALES / 100 FEMALES
156.93
FEMALES / 100 MALES
41.9
MEDIAN AGE
3.1
AVG FAMILY SIZE
2.9
AVG HOUSEHOLD SIZE
651
LABOR FORCE [ PEOPLE ]
70.1%
PERCENT IN LABOR FORCE
Income in Enlow
Income Overview in Enlow
Per Capita Income in Enlow is $50,570, while median incomes of families and households are $105,750 and $125,852 respectively.
| Characteristic | Number | Measure |
| Per Capita Income | 1,205 | $50,570 |
| Median Family Income | 338 | $105,750 |
| Mean Family Income | 338 | $154,663 |
| Median Household Income | 417 | $125,852 |
| Mean Household Income | 417 | $144,937 |
| Income Deficit | 338 | $0 |
| Wage / Income Gap (%) | 1,205 | 0.00% |
| Wage / Income Gap ($) | 1,205 | 100.00¢ per $1 |
| Gini / Inequality Index | 1,205 | 0.34 |
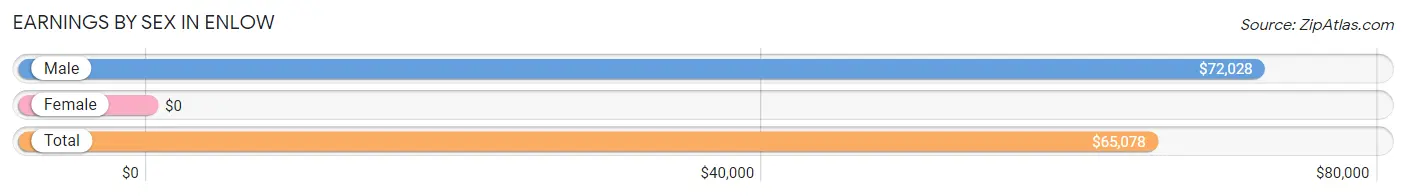
Earnings by Sex in Enlow
| Sex | Number | Average Earnings |
| Male | 343 (51.7%) | $72,028 |
| Female | 320 (48.3%) | $0 |
| Total | 663 (100.0%) | $65,078 |
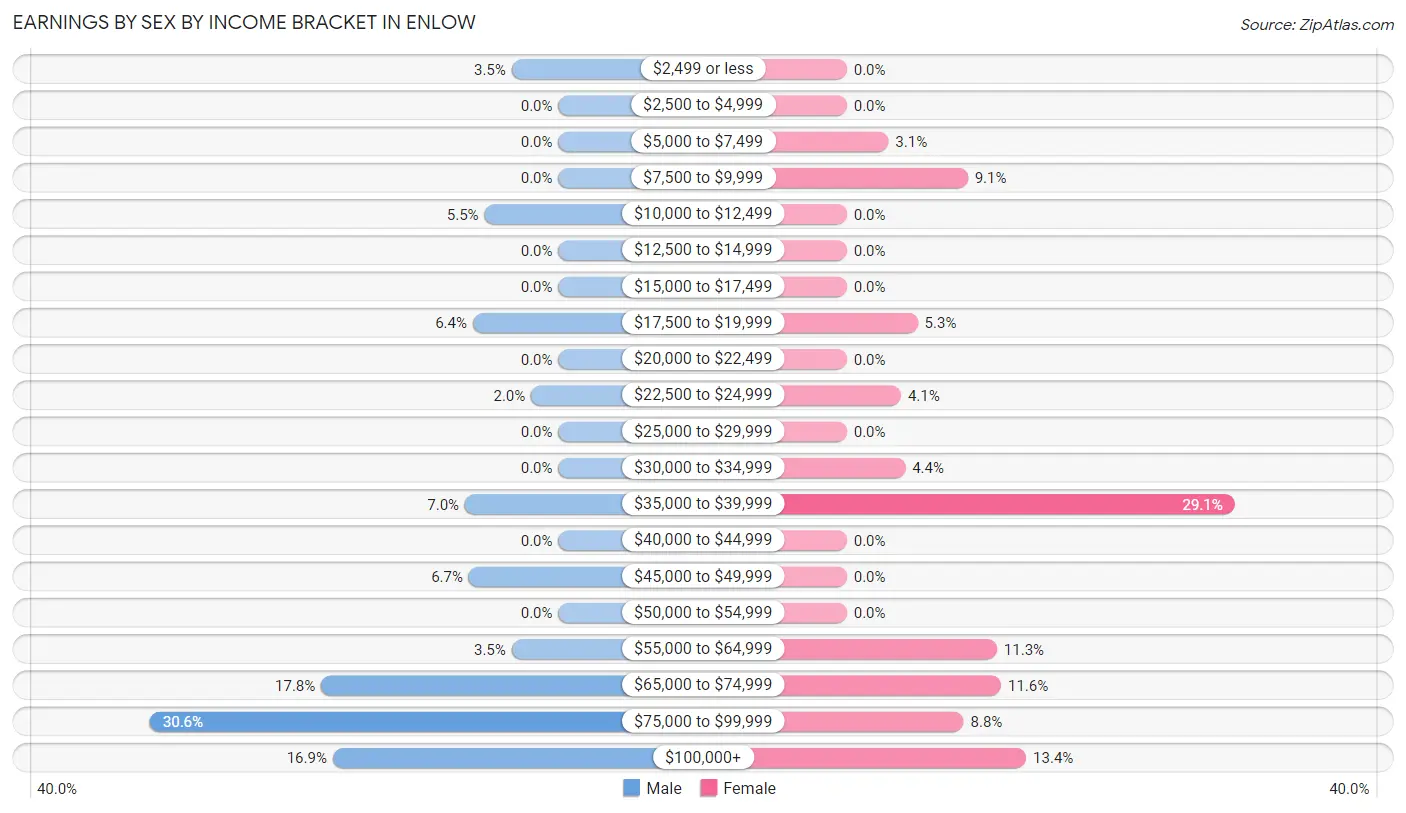
Earnings by Sex by Income Bracket in Enlow
The most common earnings brackets in Enlow are $75,000 to $99,999 for men (105 | 30.6%) and $35,000 to $39,999 for women (93 | 29.1%).
| Income | Male | Female |
| $2,499 or less | 12 (3.5%) | 0 (0.0%) |
| $2,500 to $4,999 | 0 (0.0%) | 0 (0.0%) |
| $5,000 to $7,499 | 0 (0.0%) | 10 (3.1%) |
| $7,500 to $9,999 | 0 (0.0%) | 29 (9.1%) |
| $10,000 to $12,499 | 19 (5.5%) | 0 (0.0%) |
| $12,500 to $14,999 | 0 (0.0%) | 0 (0.0%) |
| $15,000 to $17,499 | 0 (0.0%) | 0 (0.0%) |
| $17,500 to $19,999 | 22 (6.4%) | 17 (5.3%) |
| $20,000 to $22,499 | 0 (0.0%) | 0 (0.0%) |
| $22,500 to $24,999 | 7 (2.0%) | 13 (4.1%) |
| $25,000 to $29,999 | 0 (0.0%) | 0 (0.0%) |
| $30,000 to $34,999 | 0 (0.0%) | 14 (4.4%) |
| $35,000 to $39,999 | 24 (7.0%) | 93 (29.1%) |
| $40,000 to $44,999 | 0 (0.0%) | 0 (0.0%) |
| $45,000 to $49,999 | 23 (6.7%) | 0 (0.0%) |
| $50,000 to $54,999 | 0 (0.0%) | 0 (0.0%) |
| $55,000 to $64,999 | 12 (3.5%) | 36 (11.3%) |
| $65,000 to $74,999 | 61 (17.8%) | 37 (11.6%) |
| $75,000 to $99,999 | 105 (30.6%) | 28 (8.7%) |
| $100,000+ | 58 (16.9%) | 43 (13.4%) |
| Total | 343 (100.0%) | 320 (100.0%) |
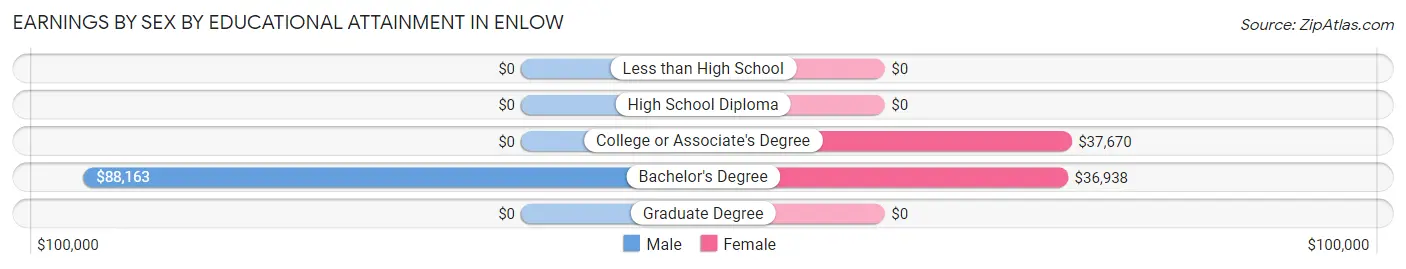
Earnings by Sex by Educational Attainment in Enlow
| Educational Attainment | Male Income | Female Income |
| Less than High School | - | - |
| High School Diploma | - | - |
| College or Associate's Degree | - | - |
| Bachelor's Degree | $88,163 | $36,938 |
| Graduate Degree | - | - |
| Total | $87,908 | $0 |
Family Income in Enlow
Family Income Brackets in Enlow
According to the Enlow family income data, there are 119 families falling into the $75,000 to $99,999 income range, which is the most common income bracket and makes up 35.2% of all families.
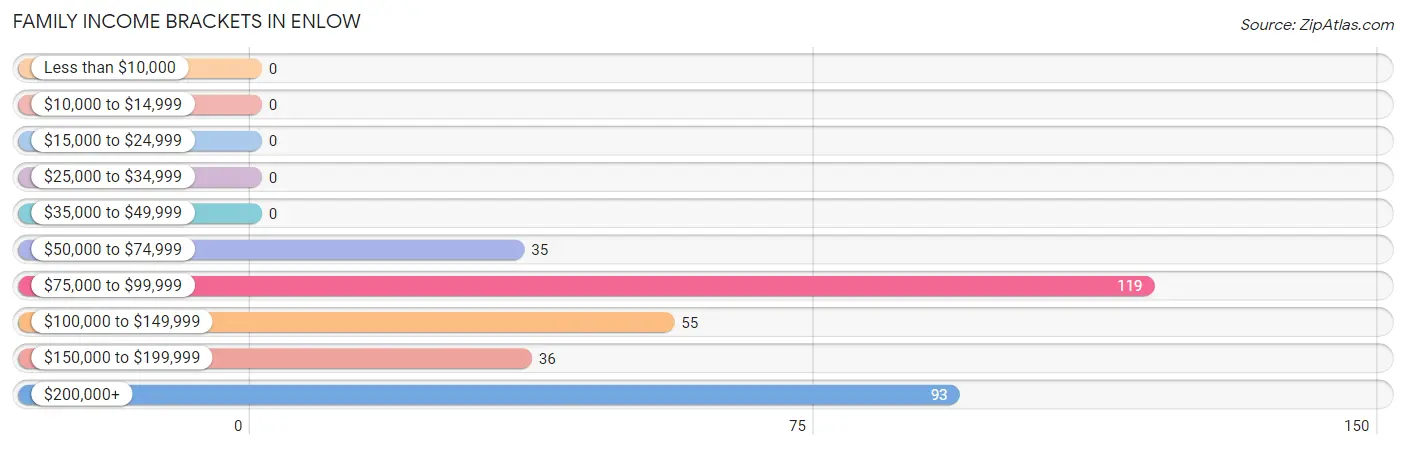
| Income Bracket | # Families | % Families |
| Less than $10,000 | 0 | 0.0% |
| $10,000 to $14,999 | 0 | 0.0% |
| $15,000 to $24,999 | 0 | 0.0% |
| $25,000 to $34,999 | 0 | 0.0% |
| $35,000 to $49,999 | 0 | 0.0% |
| $50,000 to $74,999 | 35 | 10.4% |
| $75,000 to $99,999 | 119 | 35.2% |
| $100,000 to $149,999 | 55 | 16.3% |
| $150,000 to $199,999 | 36 | 10.7% |
| $200,000+ | 93 | 27.5% |
Family Income by Famaliy Size in Enlow
4-person families (89 | 26.3%) account for the highest median family income in Enlow with $250,001 per family, while 4-person families (89 | 26.3%) have the highest median income of $62,500 per family member.
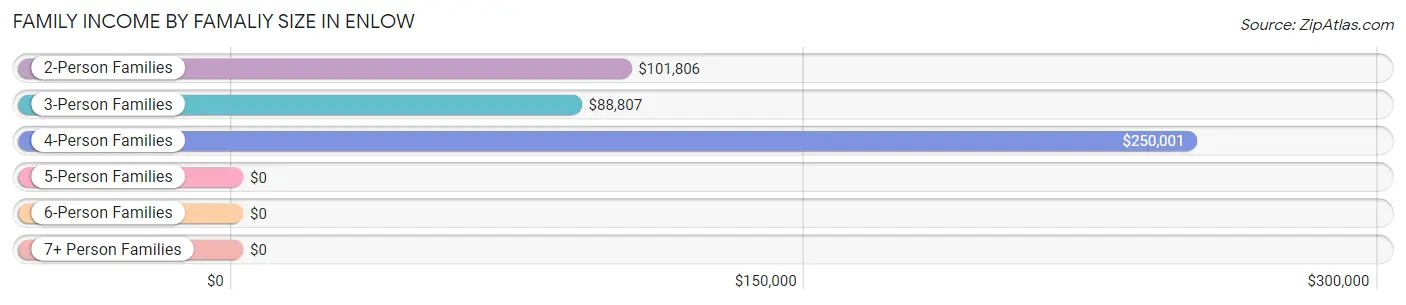
| Income Bracket | # Families | Median Income |
| 2-Person Families | 123 (36.4%) | $101,806 |
| 3-Person Families | 115 (34.0%) | $88,807 |
| 4-Person Families | 89 (26.3%) | $250,001 |
| 5-Person Families | 11 (3.3%) | $0 |
| 6-Person Families | 0 (0.0%) | $0 |
| 7+ Person Families | 0 (0.0%) | $0 |
| Total | 338 (100.0%) | $105,750 |
Family Income by Number of Earners in Enlow
The median family income in Enlow is $105,750, with families comprising 3+ earners (77) having the highest median family income of $250,001, while families with 1 earner (147) have the lowest median family income of $88,958, accounting for 22.8% and 43.5% of families, respectively.
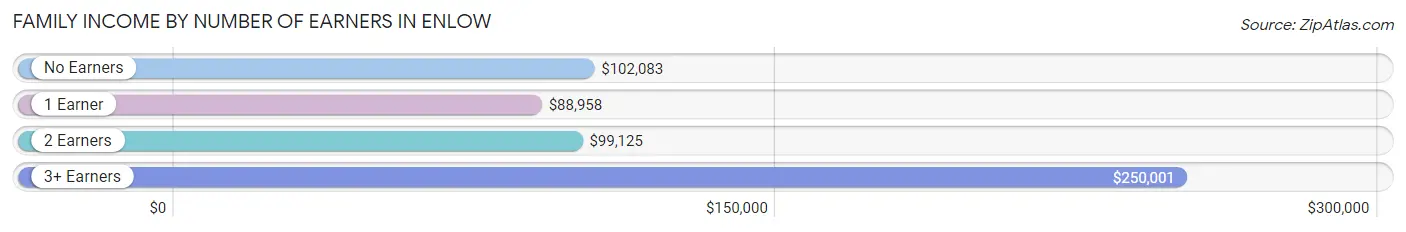
| Number of Earners | # Families | Median Income |
| No Earners | 43 (12.7%) | $102,083 |
| 1 Earner | 147 (43.5%) | $88,958 |
| 2 Earners | 71 (21.0%) | $99,125 |
| 3+ Earners | 77 (22.8%) | $250,001 |
| Total | 338 (100.0%) | $105,750 |
Household Income in Enlow
Household Income Brackets in Enlow
With 155 households falling in the category, the $100,000 to $149,999 income range is the most frequent in Enlow, accounting for 37.2% of all households.
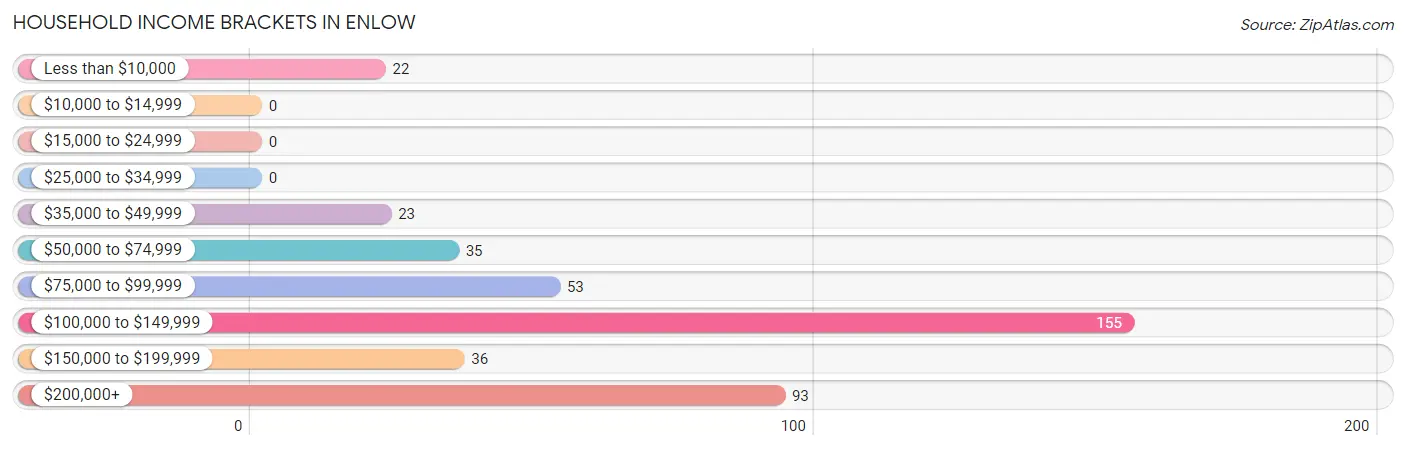
| Income Bracket | # Households | % Households |
| Less than $10,000 | 22 | 5.3% |
| $10,000 to $14,999 | 0 | 0.0% |
| $15,000 to $24,999 | 0 | 0.0% |
| $25,000 to $34,999 | 0 | 0.0% |
| $35,000 to $49,999 | 23 | 5.5% |
| $50,000 to $74,999 | 35 | 8.4% |
| $75,000 to $99,999 | 53 | 12.7% |
| $100,000 to $149,999 | 155 | 37.2% |
| $150,000 to $199,999 | 36 | 8.6% |
| $200,000+ | 93 | 22.3% |
Household Income by Householder Age in Enlow
The median household income in Enlow is $125,852, with the highest median household income of $133,313 found in the 45 to 64 years age bracket for the primary householder. A total of 131 households (31.4%) fall into this category.
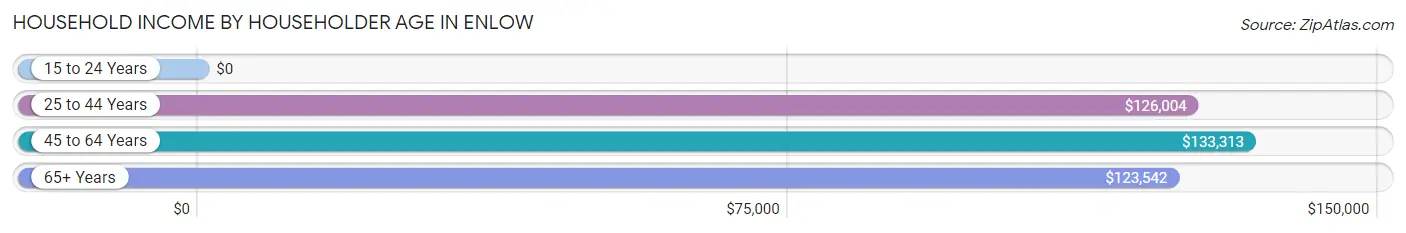
| Income Bracket | # Households | Median Income |
| 15 to 24 Years | 0 (0.0%) | $0 |
| 25 to 44 Years | 143 (34.3%) | $126,004 |
| 45 to 64 Years | 131 (31.4%) | $133,313 |
| 65+ Years | 143 (34.3%) | $123,542 |
| Total | 417 (100.0%) | $125,852 |
Poverty in Enlow
Income Below Poverty by Sex and Age in Enlow
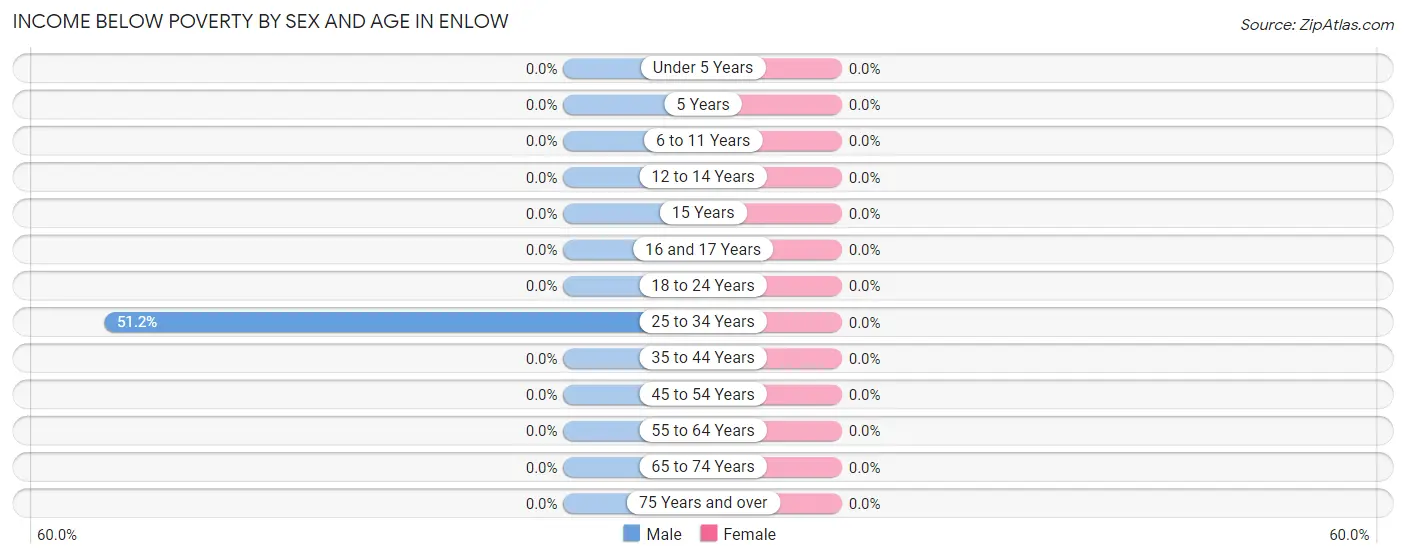
| Age Bracket | Male | Female |
| Under 5 Years | 0 (0.0%) | 0 (0.0%) |
| 5 Years | 0 (0.0%) | 0 (0.0%) |
| 6 to 11 Years | 0 (0.0%) | 0 (0.0%) |
| 12 to 14 Years | 0 (0.0%) | 0 (0.0%) |
| 15 Years | 0 (0.0%) | 0 (0.0%) |
| 16 and 17 Years | 0 (0.0%) | 0 (0.0%) |
| 18 to 24 Years | 0 (0.0%) | 0 (0.0%) |
| 25 to 34 Years | 22 (51.2%) | 0 (0.0%) |
| 35 to 44 Years | 0 (0.0%) | 0 (0.0%) |
| 45 to 54 Years | 0 (0.0%) | 0 (0.0%) |
| 55 to 64 Years | 0 (0.0%) | 0 (0.0%) |
| 65 to 74 Years | 0 (0.0%) | 0 (0.0%) |
| 75 Years and over | 0 (0.0%) | 0 (0.0%) |
| Total | 22 (4.7%) | 0 (0.0%) |
Income Above Poverty by Sex and Age in Enlow
According to the poverty statistics in Enlow, males aged 6 to 11 years and females aged under 5 years are the age groups that are most secure financially, with 100.0% of males and 100.0% of females in these age groups living above the poverty line.
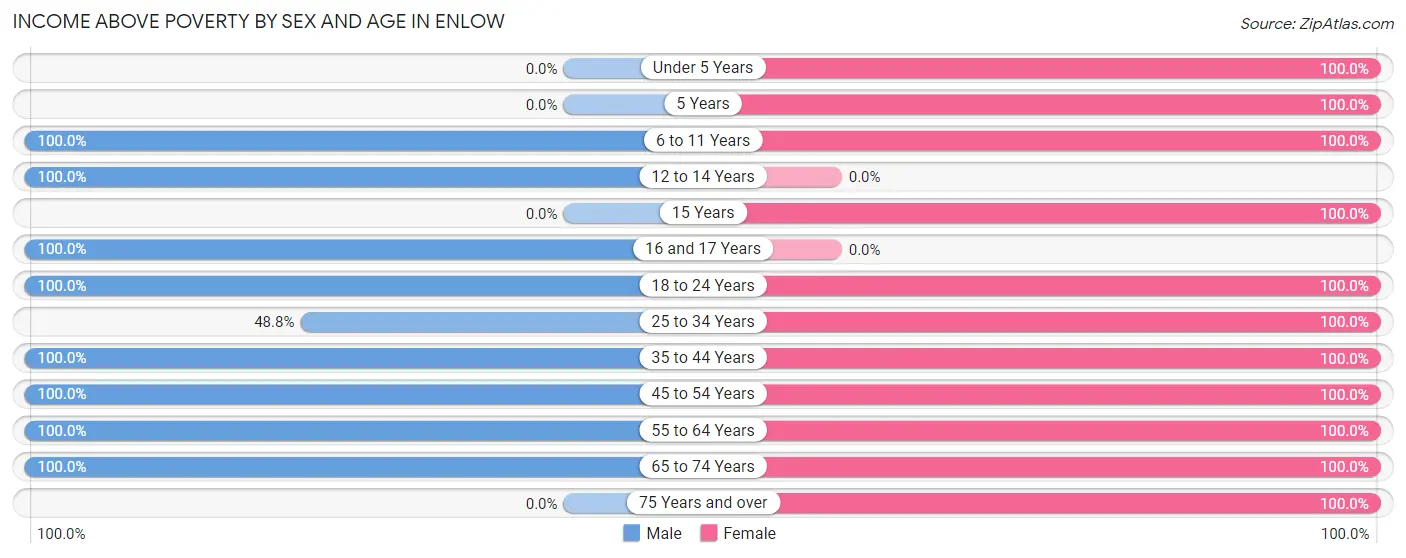
| Age Bracket | Male | Female |
| Under 5 Years | 0 (0.0%) | 40 (100.0%) |
| 5 Years | 0 (0.0%) | 8 (100.0%) |
| 6 to 11 Years | 29 (100.0%) | 147 (100.0%) |
| 12 to 14 Years | 32 (100.0%) | 0 (0.0%) |
| 15 Years | 0 (0.0%) | 20 (100.0%) |
| 16 and 17 Years | 18 (100.0%) | 0 (0.0%) |
| 18 to 24 Years | 29 (100.0%) | 10 (100.0%) |
| 25 to 34 Years | 21 (48.8%) | 155 (100.0%) |
| 35 to 44 Years | 84 (100.0%) | 14 (100.0%) |
| 45 to 54 Years | 104 (100.0%) | 67 (100.0%) |
| 55 to 64 Years | 36 (100.0%) | 140 (100.0%) |
| 65 to 74 Years | 94 (100.0%) | 34 (100.0%) |
| 75 Years and over | 0 (0.0%) | 101 (100.0%) |
| Total | 447 (95.3%) | 736 (100.0%) |
Income Below Poverty Among Married-Couple Families in Enlow
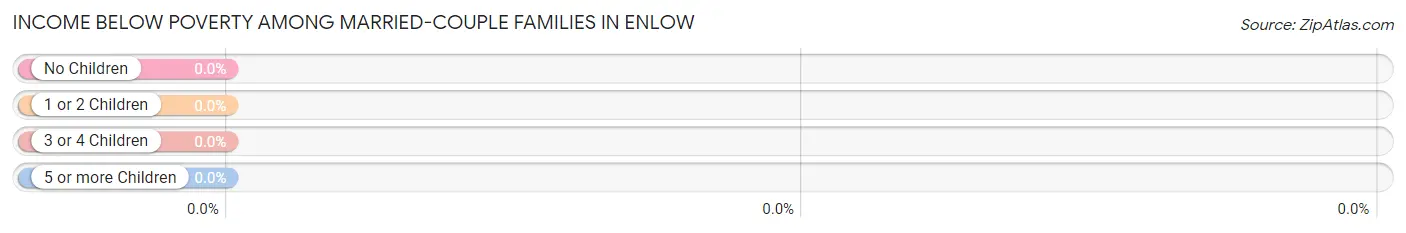
| Children | Above Poverty | Below Poverty |
| No Children | 146 (100.0%) | 0 (0.0%) |
| 1 or 2 Children | 55 (100.0%) | 0 (0.0%) |
| 3 or 4 Children | 0 (0.0%) | 0 (0.0%) |
| 5 or more Children | 0 (0.0%) | 0 (0.0%) |
| Total | 201 (100.0%) | 0 (0.0%) |
Income Below Poverty Among Single-Parent Households in Enlow
| Children | Single Father | Single Mother |
| No Children | 0 (0.0%) | 0 (0.0%) |
| 1 or 2 Children | 0 (0.0%) | 0 (0.0%) |
| 3 or 4 Children | 0 (0.0%) | 0 (0.0%) |
| 5 or more Children | 0 (0.0%) | 0 (0.0%) |
| Total | 0 (0.0%) | 0 (0.0%) |
Income Below Poverty Among Married-Couple vs Single-Parent Households in Enlow
| Children | Married-Couple Families | Single-Parent Households |
| No Children | 0 (0.0%) | 0 (0.0%) |
| 1 or 2 Children | 0 (0.0%) | 0 (0.0%) |
| 3 or 4 Children | 0 (0.0%) | 0 (0.0%) |
| 5 or more Children | 0 (0.0%) | 0 (0.0%) |
| Total | 0 (0.0%) | 0 (0.0%) |
Race in Enlow
The most populous races in Enlow are White / Caucasian (891 | 73.9%), Asian (224 | 18.6%), and Two or more Races (90 | 7.5%).
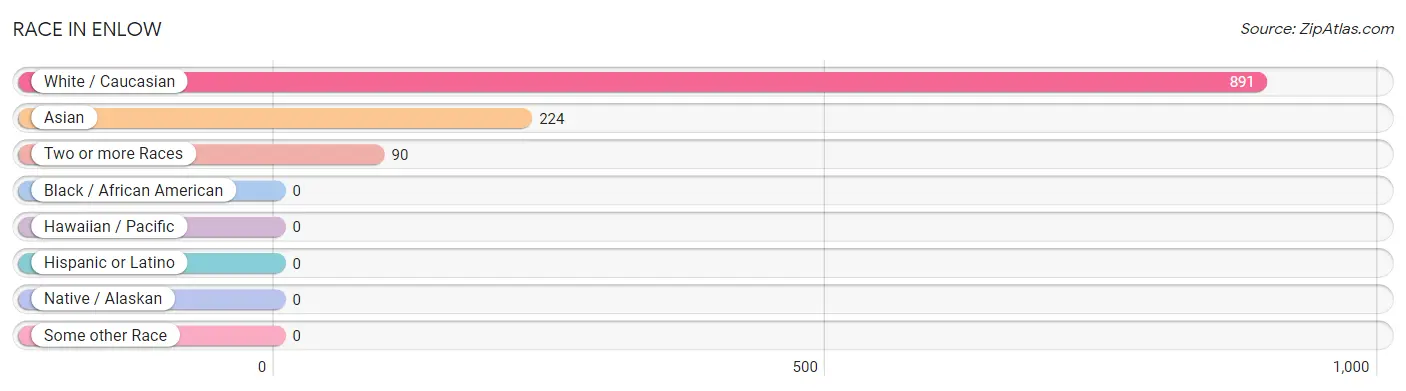
| Race | # Population | % Population |
| Asian | 224 | 18.6% |
| Black / African American | 0 | 0.0% |
| Hawaiian / Pacific | 0 | 0.0% |
| Hispanic or Latino | 0 | 0.0% |
| Native / Alaskan | 0 | 0.0% |
| White / Caucasian | 891 | 73.9% |
| Two or more Races | 90 | 7.5% |
| Some other Race | 0 | 0.0% |
| Total | 1,205 | 100.0% |
Ancestry in Enlow
The most populous ancestries reported in Enlow are Thai (198 | 16.4%), Italian (174 | 14.4%), English (132 | 11.0%), Irish (107 | 8.9%), and German (72 | 6.0%), together accounting for 56.7% of all Enlow residents.
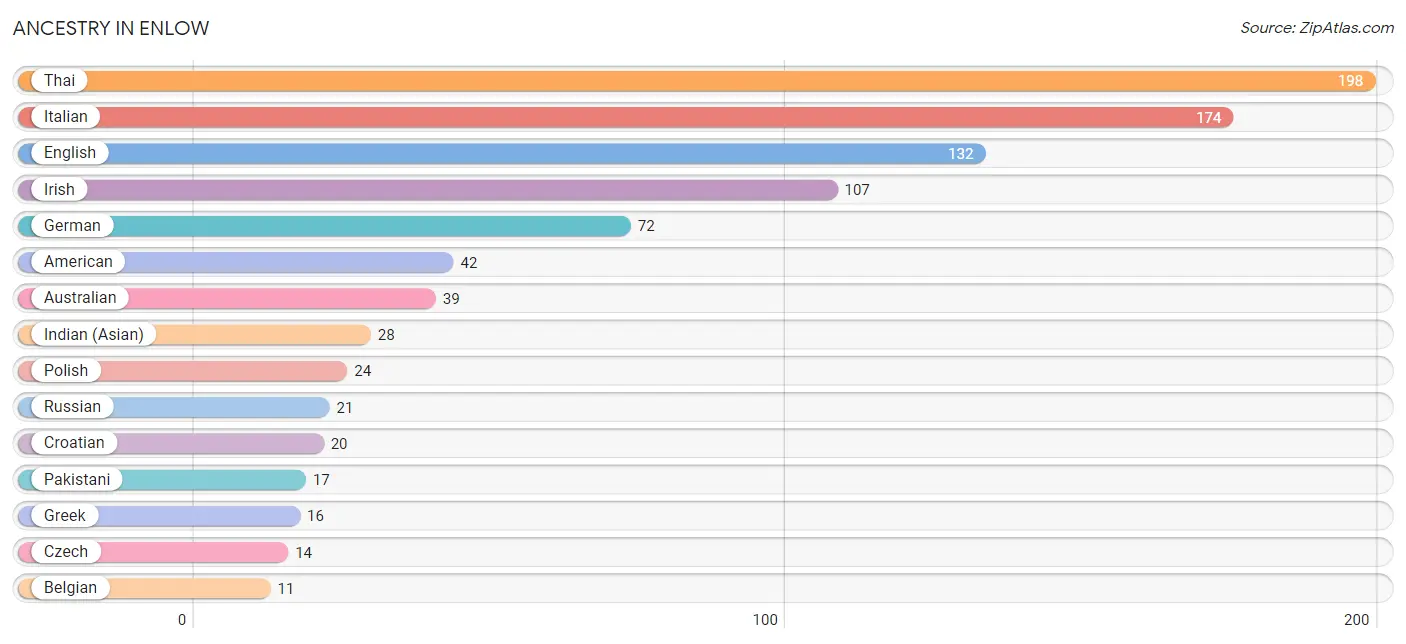
| Ancestry | # Population | % Population |
| American | 42 | 3.5% |
| Australian | 39 | 3.2% |
| Belgian | 11 | 0.9% |
| Croatian | 20 | 1.7% |
| Czech | 14 | 1.2% |
| English | 132 | 11.0% |
| German | 72 | 6.0% |
| Greek | 16 | 1.3% |
| Indian (Asian) | 28 | 2.3% |
| Irish | 107 | 8.9% |
| Italian | 174 | 14.4% |
| Pakistani | 17 | 1.4% |
| Polish | 24 | 2.0% |
| Russian | 21 | 1.7% |
| Thai | 198 | 16.4% | View All 15 Rows |
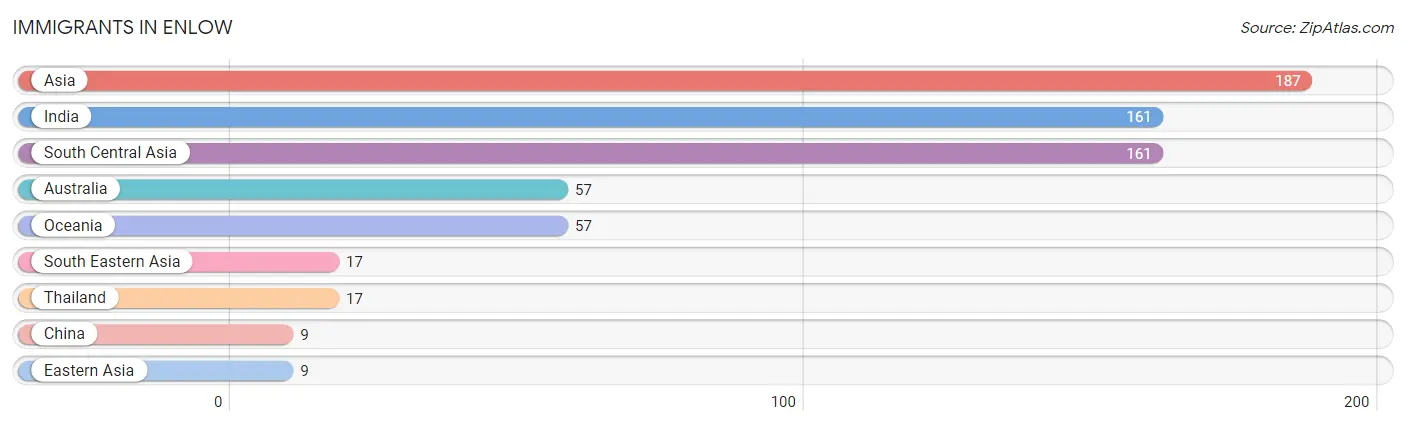
Immigrants in Enlow
The most numerous immigrant groups reported in Enlow came from Asia (187 | 15.5%), India (161 | 13.4%), South Central Asia (161 | 13.4%), Australia (57 | 4.7%), and Oceania (57 | 4.7%), together accounting for 51.7% of all Enlow residents.
| Immigration Origin | # Population | % Population |
| Asia | 187 | 15.5% |
| Australia | 57 | 4.7% |
| China | 9 | 0.7% |
| Eastern Asia | 9 | 0.7% |
| India | 161 | 13.4% |
| Oceania | 57 | 4.7% |
| South Central Asia | 161 | 13.4% |
| South Eastern Asia | 17 | 1.4% |
| Thailand | 17 | 1.4% | View All 9 Rows |
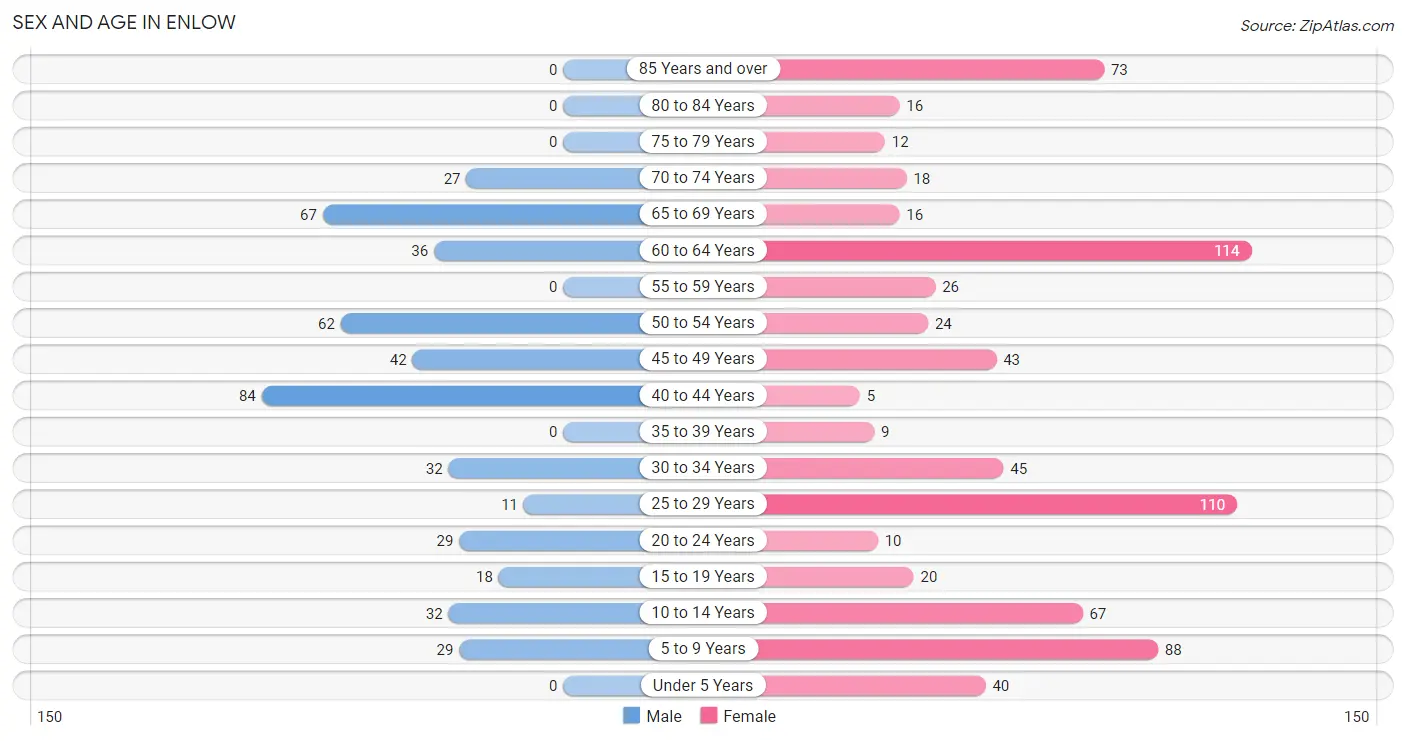
Sex and Age in Enlow
Sex and Age in Enlow
The most populous age groups in Enlow are 40 to 44 Years (84 | 17.9%) for men and 60 to 64 Years (114 | 15.5%) for women.
| Age Bracket | Male | Female |
| Under 5 Years | 0 (0.0%) | 40 (5.4%) |
| 5 to 9 Years | 29 (6.2%) | 88 (12.0%) |
| 10 to 14 Years | 32 (6.8%) | 67 (9.1%) |
| 15 to 19 Years | 18 (3.8%) | 20 (2.7%) |
| 20 to 24 Years | 29 (6.2%) | 10 (1.4%) |
| 25 to 29 Years | 11 (2.4%) | 110 (14.9%) |
| 30 to 34 Years | 32 (6.8%) | 45 (6.1%) |
| 35 to 39 Years | 0 (0.0%) | 9 (1.2%) |
| 40 to 44 Years | 84 (17.9%) | 5 (0.7%) |
| 45 to 49 Years | 42 (9.0%) | 43 (5.8%) |
| 50 to 54 Years | 62 (13.2%) | 24 (3.3%) |
| 55 to 59 Years | 0 (0.0%) | 26 (3.5%) |
| 60 to 64 Years | 36 (7.7%) | 114 (15.5%) |
| 65 to 69 Years | 67 (14.3%) | 16 (2.2%) |
| 70 to 74 Years | 27 (5.8%) | 18 (2.5%) |
| 75 to 79 Years | 0 (0.0%) | 12 (1.6%) |
| 80 to 84 Years | 0 (0.0%) | 16 (2.2%) |
| 85 Years and over | 0 (0.0%) | 73 (9.9%) |
| Total | 469 (100.0%) | 736 (100.0%) |
Families and Households in Enlow
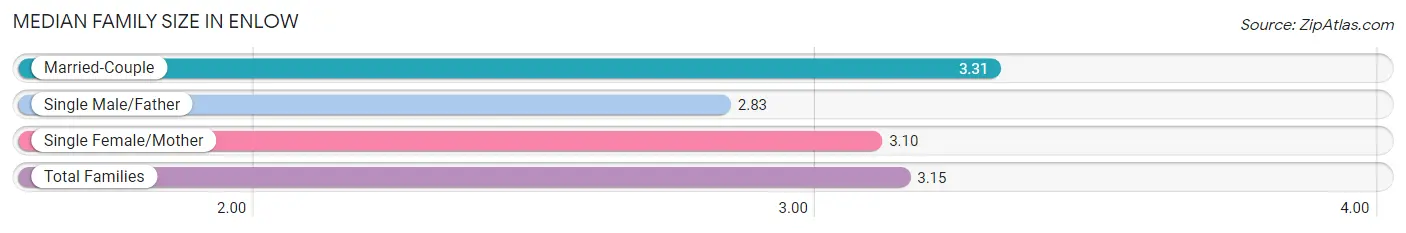
Median Family Size in Enlow
The median family size in Enlow is 3.15 persons per family, with married-couple families (201 | 59.5%) accounting for the largest median family size of 3.31 persons per family. On the other hand, single male/father families (86 | 25.4%) represent the smallest median family size with 2.83 persons per family.
| Family Type | # Families | Family Size |
| Married-Couple | 201 (59.5%) | 3.31 |
| Single Male/Father | 86 (25.4%) | 2.83 |
| Single Female/Mother | 51 (15.1%) | 3.10 |
| Total Families | 338 (100.0%) | 3.15 |
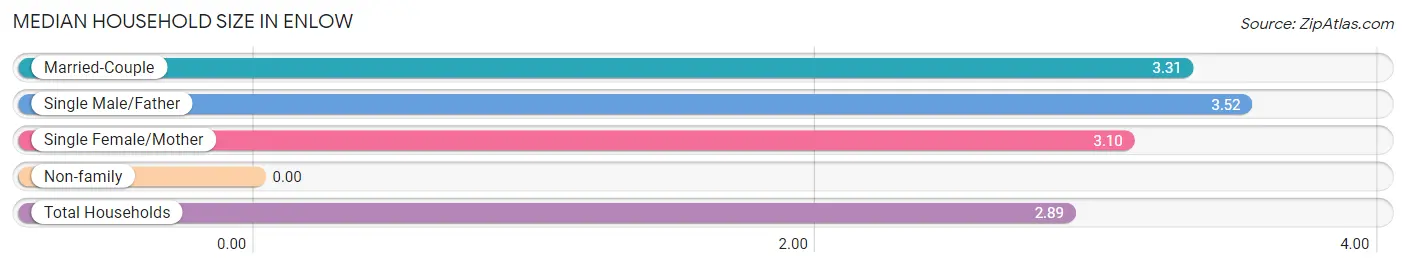
Median Household Size in Enlow
| Household Type | # Households | Household Size |
| Married-Couple | 201 (48.2%) | 3.31 |
| Single Male/Father | 86 (20.6%) | 3.52 |
| Single Female/Mother | 51 (12.2%) | 3.10 |
| Non-family | 79 (18.9%) | - |
| Total Households | 417 (100.0%) | 2.89 |
Household Size by Marriage Status in Enlow
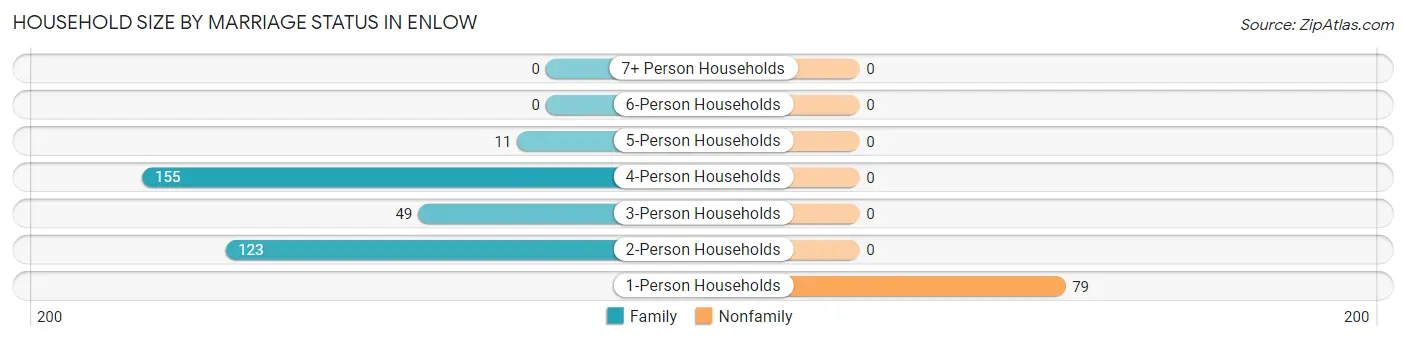
Out of a total of 417 households in Enlow, 338 (81.1%) are family households, while 79 (18.9%) are nonfamily households. The most numerous type of family households are 4-person households, comprising 155, and the most common type of nonfamily households are 1-person households, comprising 79.
| Household Size | Family Households | Nonfamily Households |
| 1-Person Households | - | 79 (18.9%) |
| 2-Person Households | 123 (29.5%) | 0 (0.0%) |
| 3-Person Households | 49 (11.7%) | 0 (0.0%) |
| 4-Person Households | 155 (37.2%) | 0 (0.0%) |
| 5-Person Households | 11 (2.6%) | 0 (0.0%) |
| 6-Person Households | 0 (0.0%) | 0 (0.0%) |
| 7+ Person Households | 0 (0.0%) | 0 (0.0%) |
| Total | 338 (81.1%) | 79 (18.9%) |
Female Fertility in Enlow
Fertility by Age in Enlow
| Age Bracket | Women with Births | Births / 1,000 Women |
| 15 to 19 years | 0 (0.0%) | 0.0 |
| 20 to 34 years | 0 (0.0%) | 0.0 |
| 35 to 50 years | 0 (0.0%) | 0.0 |
| Total | 0 (0.0%) | 0.0 |
Fertility by Age by Marriage Status in Enlow
| Age Bracket | Married | Unmarried |
| 15 to 19 years | 0 (0.0%) | 0 (0.0%) |
| 20 to 34 years | 0 (0.0%) | 0 (0.0%) |
| 35 to 50 years | 0 (0.0%) | 0 (0.0%) |
| Total | 0 (0.0%) | 0 (0.0%) |
Fertility by Education in Enlow
| Educational Attainment | Women with Births | Births / 1,000 Women |
| Less than High School | 0 (0.0%) | 0.0 |
| High School Diploma | 0 (0.0%) | 0.0 |
| College or Associate's Degree | 0 (0.0%) | 0.0 |
| Bachelor's Degree | 0 (0.0%) | 0.0 |
| Graduate Degree | 0 (0.0%) | 0.0 |
| Total | 0 (0.0%) | 0.0 |
Fertility by Education by Marriage Status in Enlow
| Educational Attainment | Married | Unmarried |
| Less than High School | 0 (0.0%) | 0 (0.0%) |
| High School Diploma | 0 (0.0%) | 0 (0.0%) |
| College or Associate's Degree | 0 (0.0%) | 0 (0.0%) |
| Bachelor's Degree | 0 (0.0%) | 0 (0.0%) |
| Graduate Degree | 0 (0.0%) | 0 (0.0%) |
| Total | 0 (0.0%) | 0 (0.0%) |
Employment Characteristics in Enlow
Employment by Class of Employer in Enlow
Among the 608 employed individuals in Enlow, private company employees (498 | 81.9%), not-for-profit organizations (67 | 11.0%), and self-employed (not incorporated) (16 | 2.6%) make up the most common classes of employment.
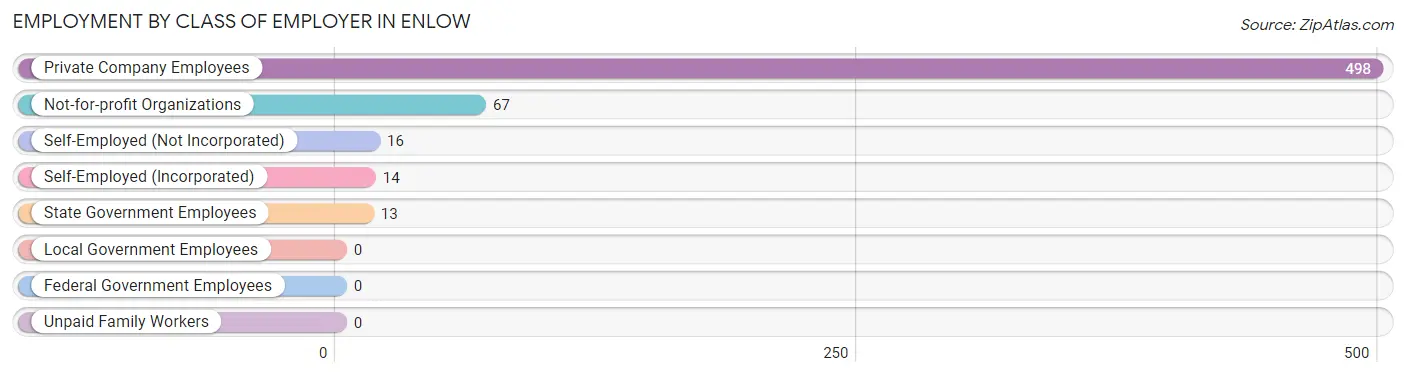
| Employer Class | # Employees | % Employees |
| Private Company Employees | 498 | 81.9% |
| Self-Employed (Incorporated) | 14 | 2.3% |
| Self-Employed (Not Incorporated) | 16 | 2.6% |
| Not-for-profit Organizations | 67 | 11.0% |
| Local Government Employees | 0 | 0.0% |
| State Government Employees | 13 | 2.1% |
| Federal Government Employees | 0 | 0.0% |
| Unpaid Family Workers | 0 | 0.0% |
| Total | 608 | 100.0% |
Employment Status by Age in Enlow
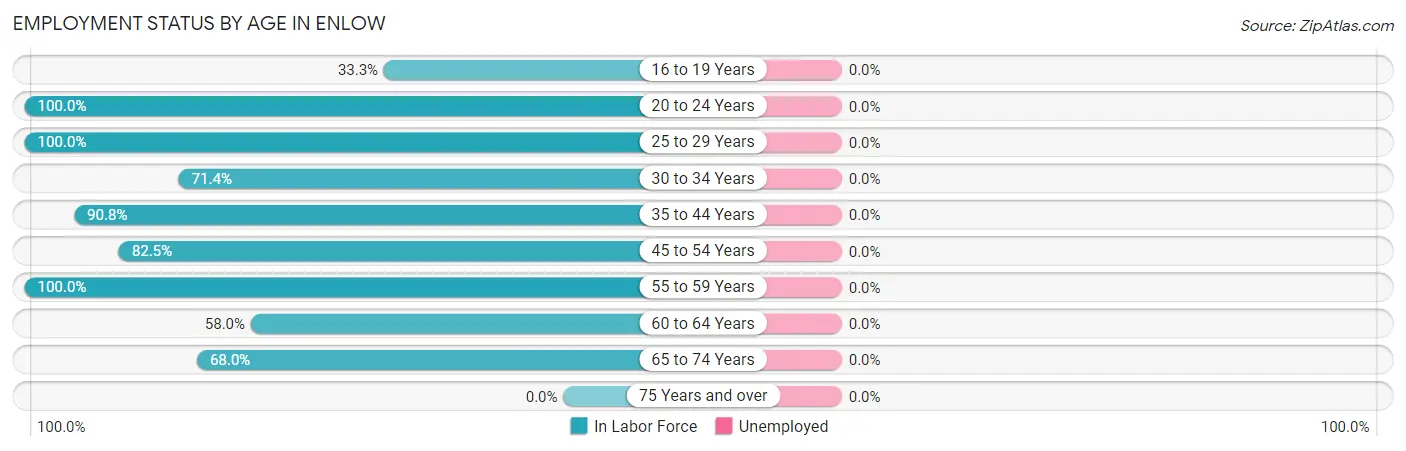
| Age Bracket | In Labor Force | Unemployed |
| 16 to 19 Years | 6 (33.3%) | 0 (0.0%) |
| 20 to 24 Years | 39 (100.0%) | 0 (0.0%) |
| 25 to 29 Years | 121 (100.0%) | 0 (0.0%) |
| 30 to 34 Years | 55 (71.4%) | 0 (0.0%) |
| 35 to 44 Years | 89 (90.8%) | 0 (0.0%) |
| 45 to 54 Years | 141 (82.5%) | 0 (0.0%) |
| 55 to 59 Years | 26 (100.0%) | 0 (0.0%) |
| 60 to 64 Years | 87 (58.0%) | 0 (0.0%) |
| 65 to 74 Years | 87 (68.0%) | 0 (0.0%) |
| 75 Years and over | 0 (0.0%) | 0 (0.0%) |
| Total | 651 (70.1%) | 0 (0.0%) |
Employment Status by Educational Attainment in Enlow
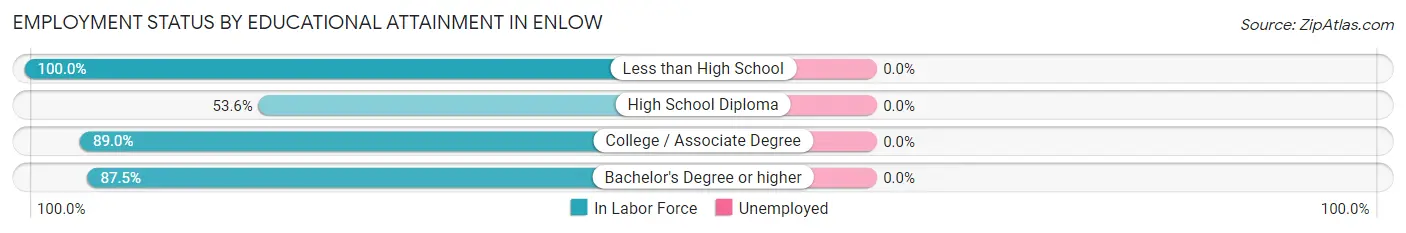
| Educational Attainment | In Labor Force | Unemployed |
| Less than High School | 16 (100.0%) | 0 (0.0%) |
| High School Diploma | 75 (53.6%) | 0 (0.0%) |
| College / Associate Degree | 105 (89.0%) | 0 (0.0%) |
| Bachelor's Degree or higher | 323 (87.5%) | 0 (0.0%) |
| Total | 519 (80.7%) | 0 (0.0%) |
Employment Occupations by Sex in Enlow
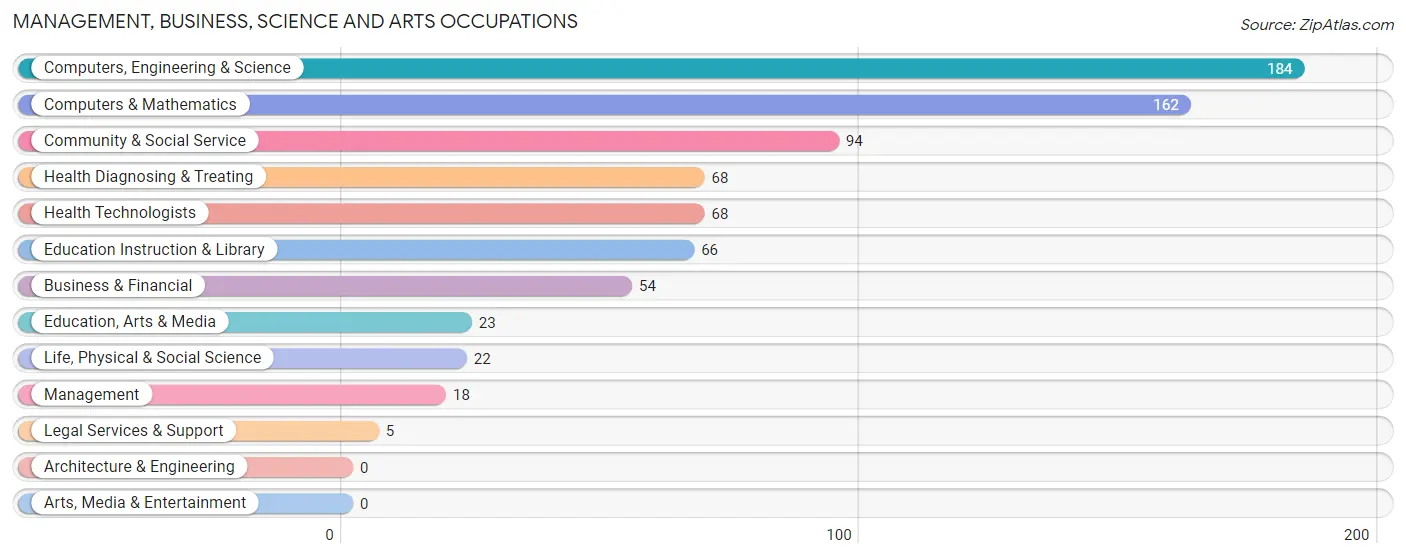
Management, Business, Science and Arts Occupations
The most common Management, Business, Science and Arts occupations in Enlow are Computers, Engineering & Science (184 | 28.3%), Computers & Mathematics (162 | 24.9%), Community & Social Service (94 | 14.4%), Health Diagnosing & Treating (68 | 10.4%), and Health Technologists (68 | 10.4%).
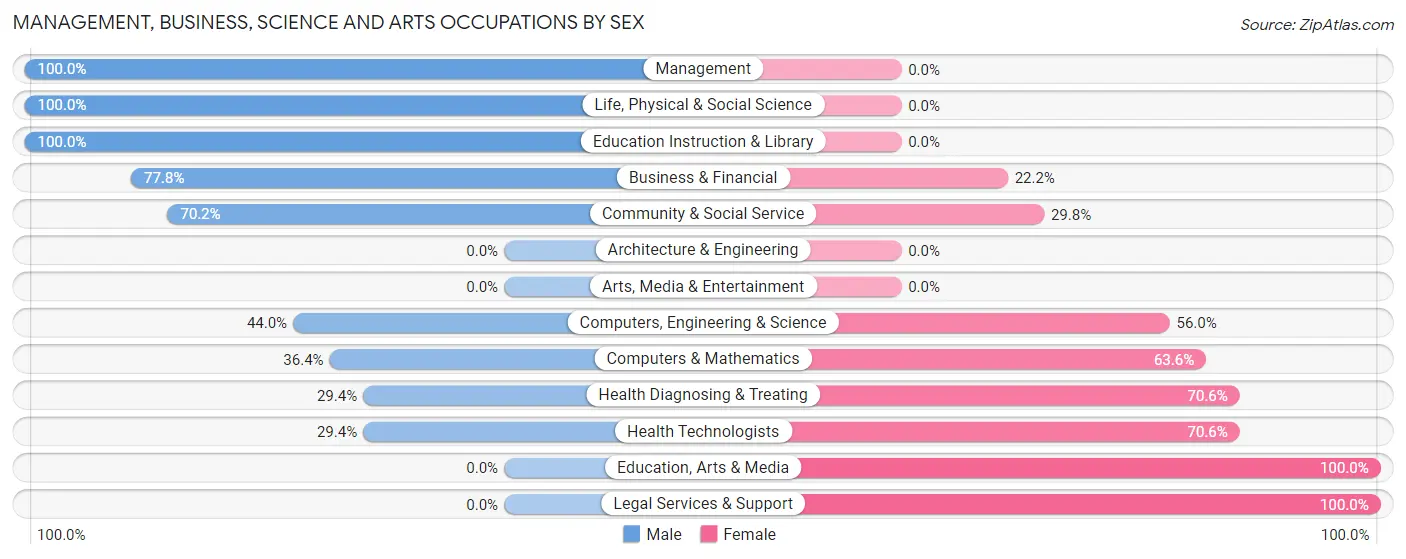
Management, Business, Science and Arts Occupations by Sex
Within the Management, Business, Science and Arts occupations in Enlow, the most male-oriented occupations are Management (100.0%), Life, Physical & Social Science (100.0%), and Education Instruction & Library (100.0%), while the most female-oriented occupations are Education, Arts & Media (100.0%), Legal Services & Support (100.0%), and Health Diagnosing & Treating (70.6%).
| Occupation | Male | Female |
| Management | 18 (100.0%) | 0 (0.0%) |
| Business & Financial | 42 (77.8%) | 12 (22.2%) |
| Computers, Engineering & Science | 81 (44.0%) | 103 (56.0%) |
| Computers & Mathematics | 59 (36.4%) | 103 (63.6%) |
| Architecture & Engineering | 0 (0.0%) | 0 (0.0%) |
| Life, Physical & Social Science | 22 (100.0%) | 0 (0.0%) |
| Community & Social Service | 66 (70.2%) | 28 (29.8%) |
| Education, Arts & Media | 0 (0.0%) | 23 (100.0%) |
| Legal Services & Support | 0 (0.0%) | 5 (100.0%) |
| Education Instruction & Library | 66 (100.0%) | 0 (0.0%) |
| Arts, Media & Entertainment | 0 (0.0%) | 0 (0.0%) |
| Health Diagnosing & Treating | 20 (29.4%) | 48 (70.6%) |
| Health Technologists | 20 (29.4%) | 48 (70.6%) |
| Total (Category) | 227 (54.3%) | 191 (45.7%) |
| Total (Overall) | 331 (50.8%) | 320 (49.2%) |
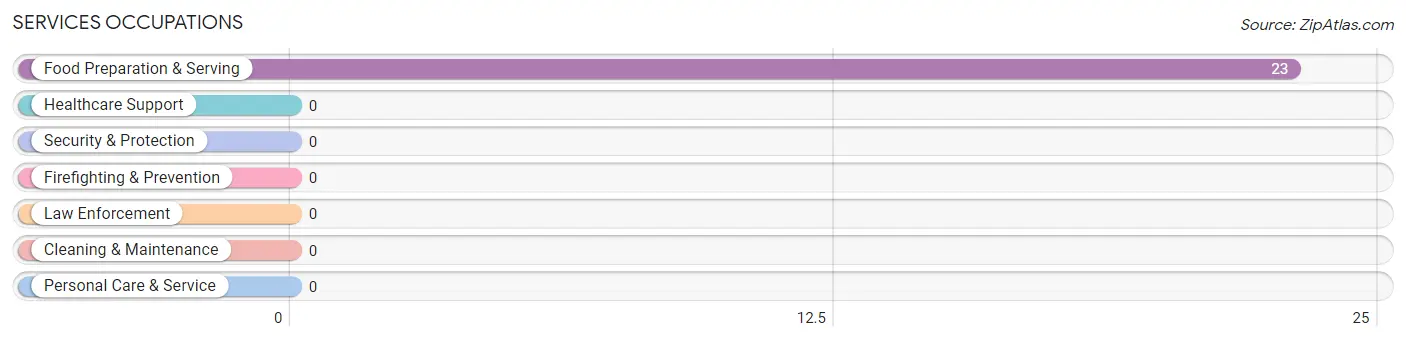
Services Occupations
The most common Services occupations in Enlow are , and Food Preparation & Serving (23 | 3.5%).
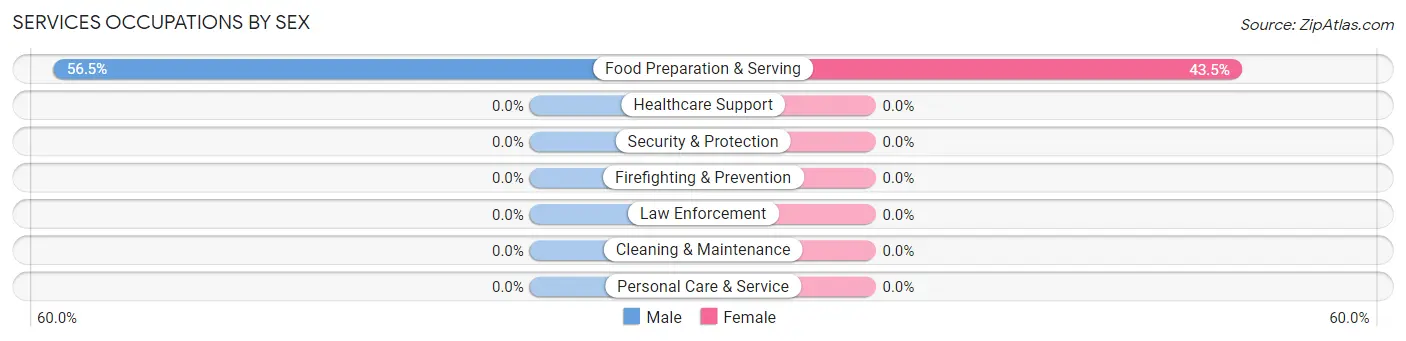
Services Occupations by Sex
| Occupation | Male | Female |
| Healthcare Support | 0 (0.0%) | 0 (0.0%) |
| Security & Protection | 0 (0.0%) | 0 (0.0%) |
| Firefighting & Prevention | 0 (0.0%) | 0 (0.0%) |
| Law Enforcement | 0 (0.0%) | 0 (0.0%) |
| Food Preparation & Serving | 13 (56.5%) | 10 (43.5%) |
| Cleaning & Maintenance | 0 (0.0%) | 0 (0.0%) |
| Personal Care & Service | 0 (0.0%) | 0 (0.0%) |
| Total (Category) | 13 (56.5%) | 10 (43.5%) |
| Total (Overall) | 331 (50.8%) | 320 (49.2%) |
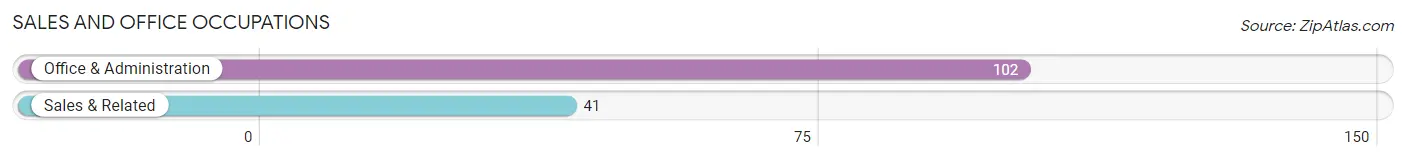
Sales and Office Occupations
The most common Sales and Office occupations in Enlow are Office & Administration (102 | 15.7%), and Sales & Related (41 | 6.3%).
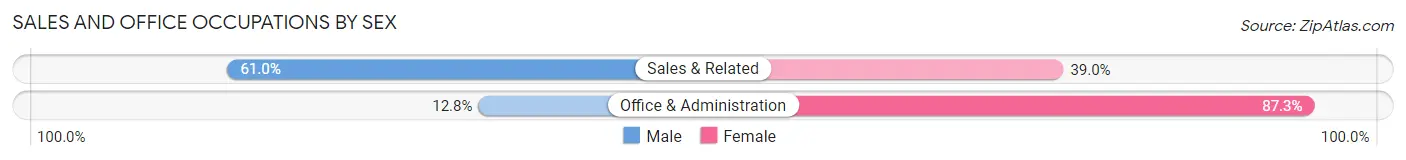
Sales and Office Occupations by Sex
| Occupation | Male | Female |
| Sales & Related | 25 (61.0%) | 16 (39.0%) |
| Office & Administration | 13 (12.8%) | 89 (87.3%) |
| Total (Category) | 38 (26.6%) | 105 (73.4%) |
| Total (Overall) | 331 (50.8%) | 320 (49.2%) |
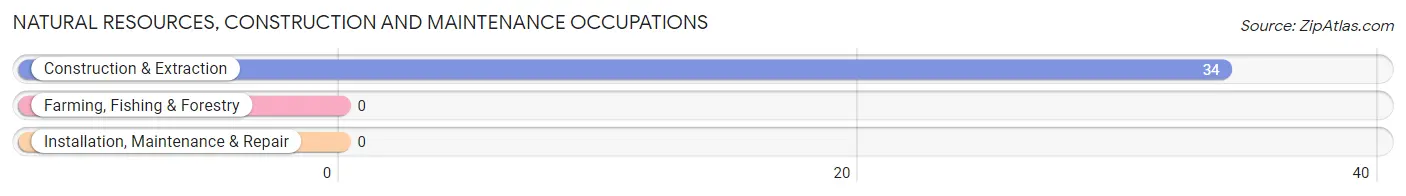
Natural Resources, Construction and Maintenance Occupations
The most common Natural Resources, Construction and Maintenance occupations in Enlow are , and Construction & Extraction (34 | 5.2%).
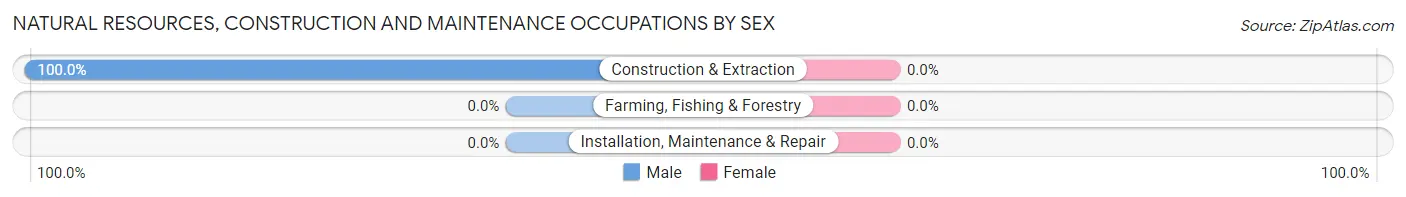
Natural Resources, Construction and Maintenance Occupations by Sex
| Occupation | Male | Female |
| Farming, Fishing & Forestry | 0 (0.0%) | 0 (0.0%) |
| Construction & Extraction | 34 (100.0%) | 0 (0.0%) |
| Installation, Maintenance & Repair | 0 (0.0%) | 0 (0.0%) |
| Total (Category) | 34 (100.0%) | 0 (0.0%) |
| Total (Overall) | 331 (50.8%) | 320 (49.2%) |
Production, Transportation and Moving Occupations
The most common Production, Transportation and Moving occupations in Enlow are Transportation (19 | 2.9%), and Material Moving (14 | 2.1%).
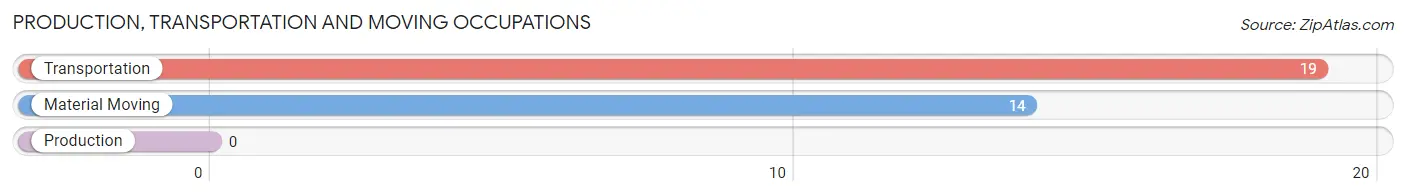
Production, Transportation and Moving Occupations by Sex
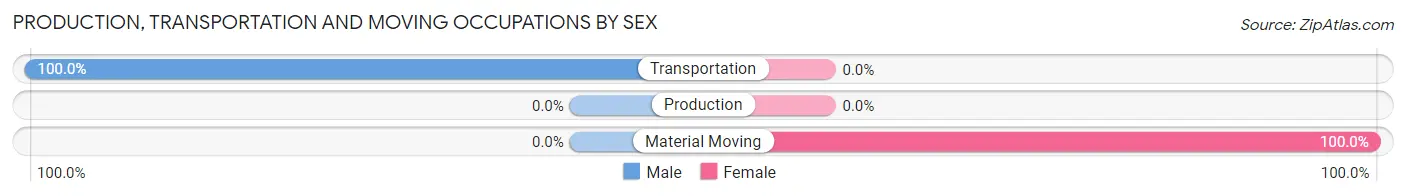
| Occupation | Male | Female |
| Production | 0 (0.0%) | 0 (0.0%) |
| Transportation | 19 (100.0%) | 0 (0.0%) |
| Material Moving | 0 (0.0%) | 14 (100.0%) |
| Total (Category) | 19 (57.6%) | 14 (42.4%) |
| Total (Overall) | 331 (50.8%) | 320 (49.2%) |
Employment Industries by Sex in Enlow
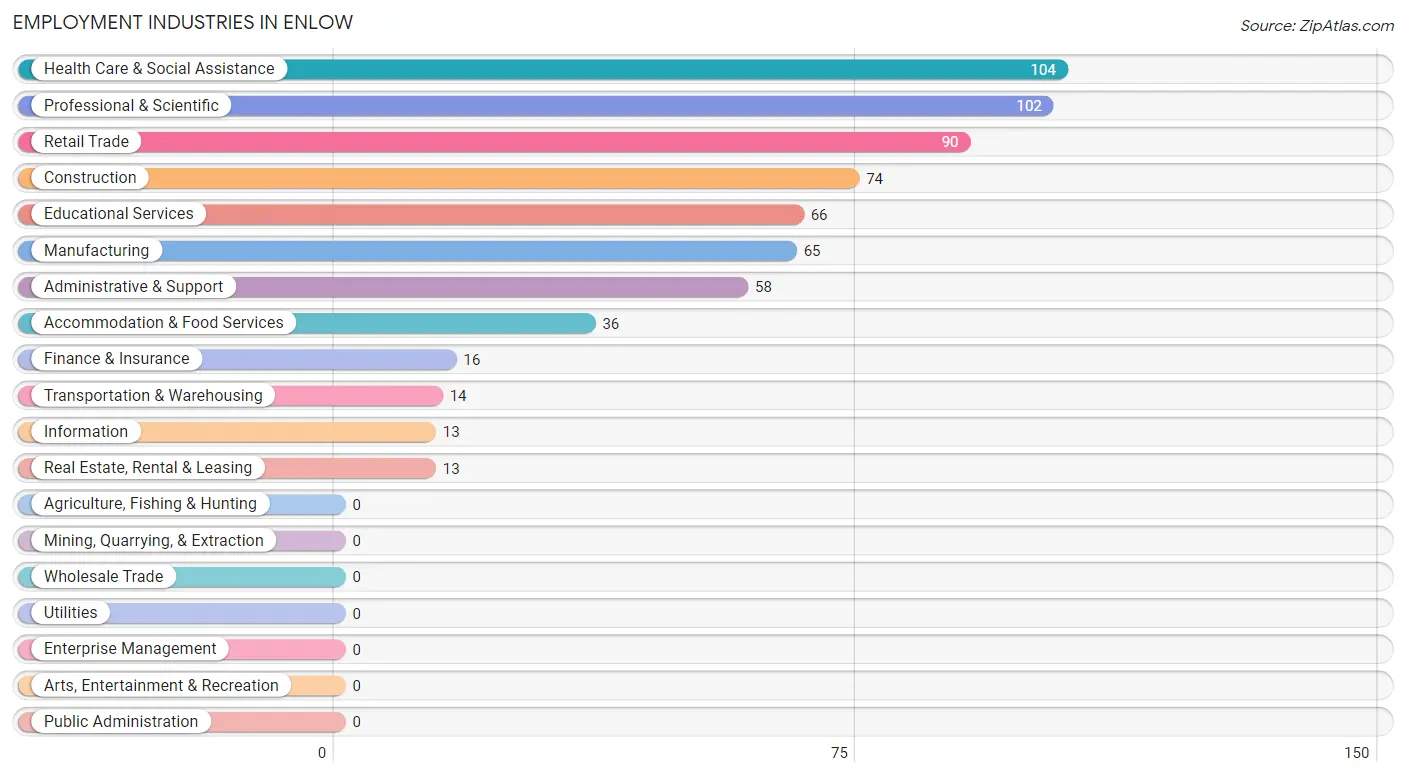
Employment Industries in Enlow
The major employment industries in Enlow include Health Care & Social Assistance (104 | 16.0%), Professional & Scientific (102 | 15.7%), Retail Trade (90 | 13.8%), Construction (74 | 11.4%), and Educational Services (66 | 10.1%).
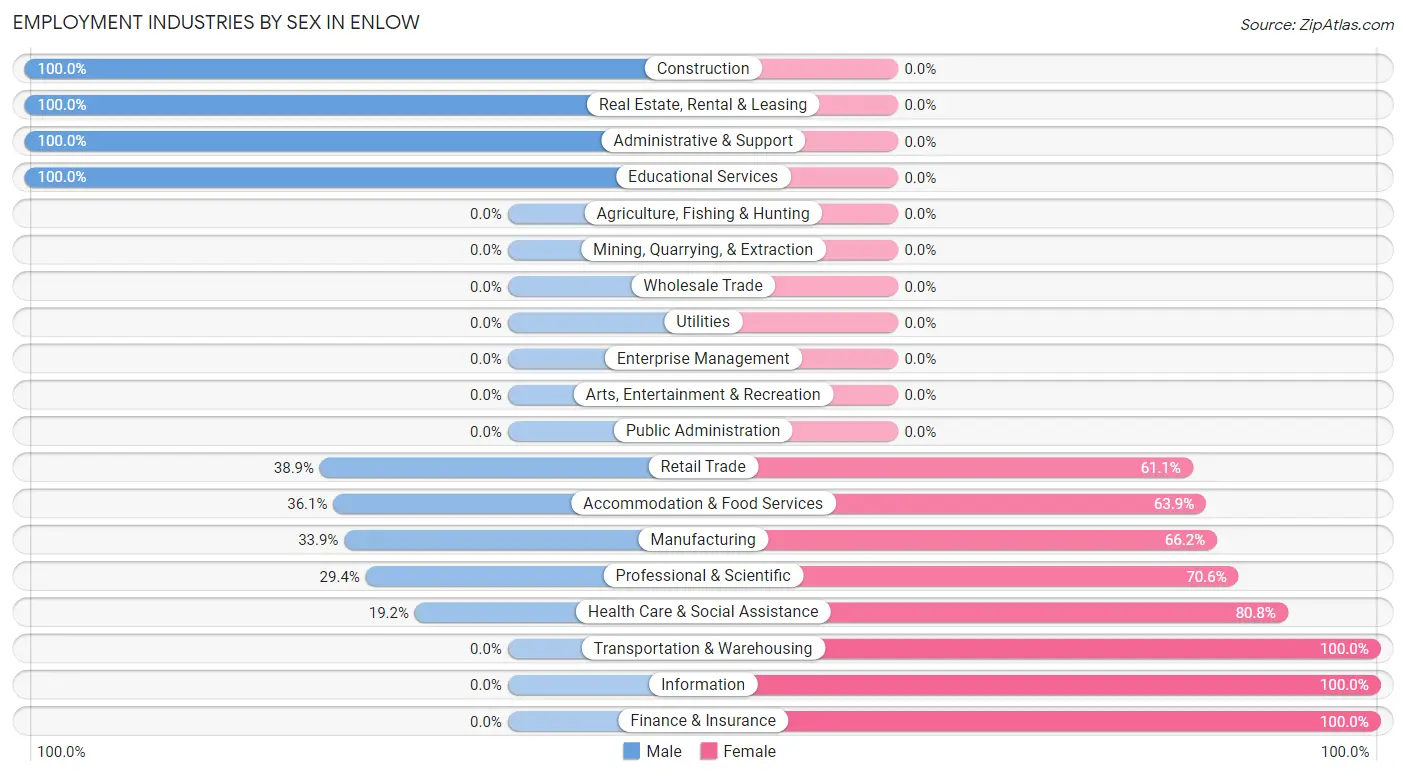
Employment Industries by Sex in Enlow
The Enlow industries that see more men than women are Construction (100.0%), Real Estate, Rental & Leasing (100.0%), and Administrative & Support (100.0%), whereas the industries that tend to have a higher number of women are Transportation & Warehousing (100.0%), Information (100.0%), and Finance & Insurance (100.0%).
| Industry | Male | Female |
| Agriculture, Fishing & Hunting | 0 (0.0%) | 0 (0.0%) |
| Mining, Quarrying, & Extraction | 0 (0.0%) | 0 (0.0%) |
| Construction | 74 (100.0%) | 0 (0.0%) |
| Manufacturing | 22 (33.9%) | 43 (66.1%) |
| Wholesale Trade | 0 (0.0%) | 0 (0.0%) |
| Retail Trade | 35 (38.9%) | 55 (61.1%) |
| Transportation & Warehousing | 0 (0.0%) | 14 (100.0%) |
| Utilities | 0 (0.0%) | 0 (0.0%) |
| Information | 0 (0.0%) | 13 (100.0%) |
| Finance & Insurance | 0 (0.0%) | 16 (100.0%) |
| Real Estate, Rental & Leasing | 13 (100.0%) | 0 (0.0%) |
| Professional & Scientific | 30 (29.4%) | 72 (70.6%) |
| Enterprise Management | 0 (0.0%) | 0 (0.0%) |
| Administrative & Support | 58 (100.0%) | 0 (0.0%) |
| Educational Services | 66 (100.0%) | 0 (0.0%) |
| Health Care & Social Assistance | 20 (19.2%) | 84 (80.8%) |
| Arts, Entertainment & Recreation | 0 (0.0%) | 0 (0.0%) |
| Accommodation & Food Services | 13 (36.1%) | 23 (63.9%) |
| Public Administration | 0 (0.0%) | 0 (0.0%) |
| Total | 331 (50.8%) | 320 (49.2%) |
Education in Enlow
School Enrollment in Enlow
The most common levels of schooling among the 277 students in Enlow are elementary school (109 | 39.4%), middle school (86 | 31.0%), and high school (51 | 18.4%).
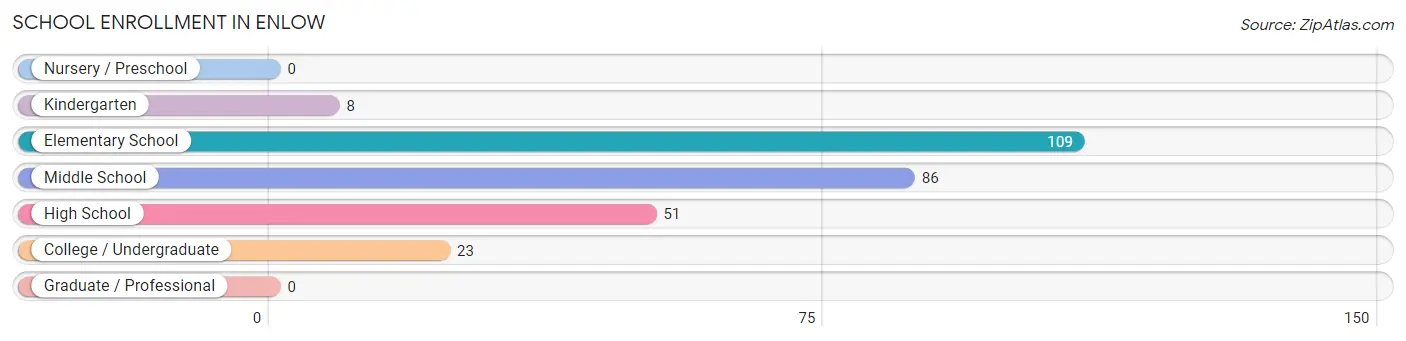
| School Level | # Students | % Students |
| Nursery / Preschool | 0 | 0.0% |
| Kindergarten | 8 | 2.9% |
| Elementary School | 109 | 39.4% |
| Middle School | 86 | 31.0% |
| High School | 51 | 18.4% |
| College / Undergraduate | 23 | 8.3% |
| Graduate / Professional | 0 | 0.0% |
| Total | 277 | 100.0% |
School Enrollment by Age by Funding Source in Enlow
Out of a total of 277 students who are enrolled in schools in Enlow, 23 (8.3%) attend a private institution, while the remaining 254 (91.7%) are enrolled in public schools. The age group of 20 to 24 year olds has the highest likelihood of being enrolled in private schools, with 10 (100.0% in the age bracket) enrolled. Conversely, the age group of 5 to 9 year old has the lowest likelihood of being enrolled in a private school, with 117 (100.0% in the age bracket) attending a public institution.
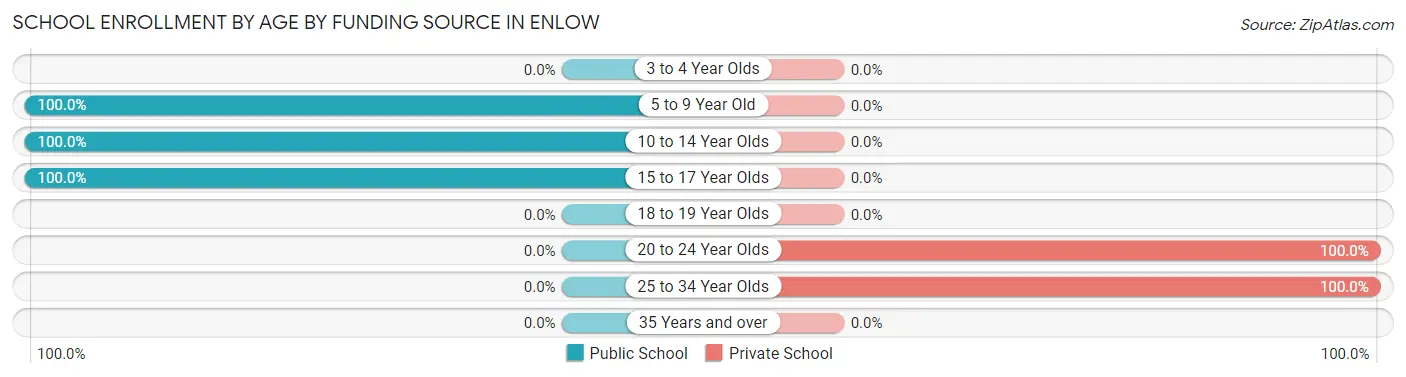
| Age Bracket | Public School | Private School |
| 3 to 4 Year Olds | 0 (0.0%) | 0 (0.0%) |
| 5 to 9 Year Old | 117 (100.0%) | 0 (0.0%) |
| 10 to 14 Year Olds | 99 (100.0%) | 0 (0.0%) |
| 15 to 17 Year Olds | 38 (100.0%) | 0 (0.0%) |
| 18 to 19 Year Olds | 0 (0.0%) | 0 (0.0%) |
| 20 to 24 Year Olds | 0 (0.0%) | 10 (100.0%) |
| 25 to 34 Year Olds | 0 (0.0%) | 13 (100.0%) |
| 35 Years and over | 0 (0.0%) | 0 (0.0%) |
| Total | 254 (91.7%) | 23 (8.3%) |
Educational Attainment by Field of Study in Enlow
Business (139 | 28.4%), engineering (116 | 23.7%), bio, nature & agricultural (60 | 12.2%), education (60 | 12.2%), and science & technology (49 | 10.0%) are the most common fields of study among 490 individuals in Enlow who have obtained a bachelor's degree or higher.
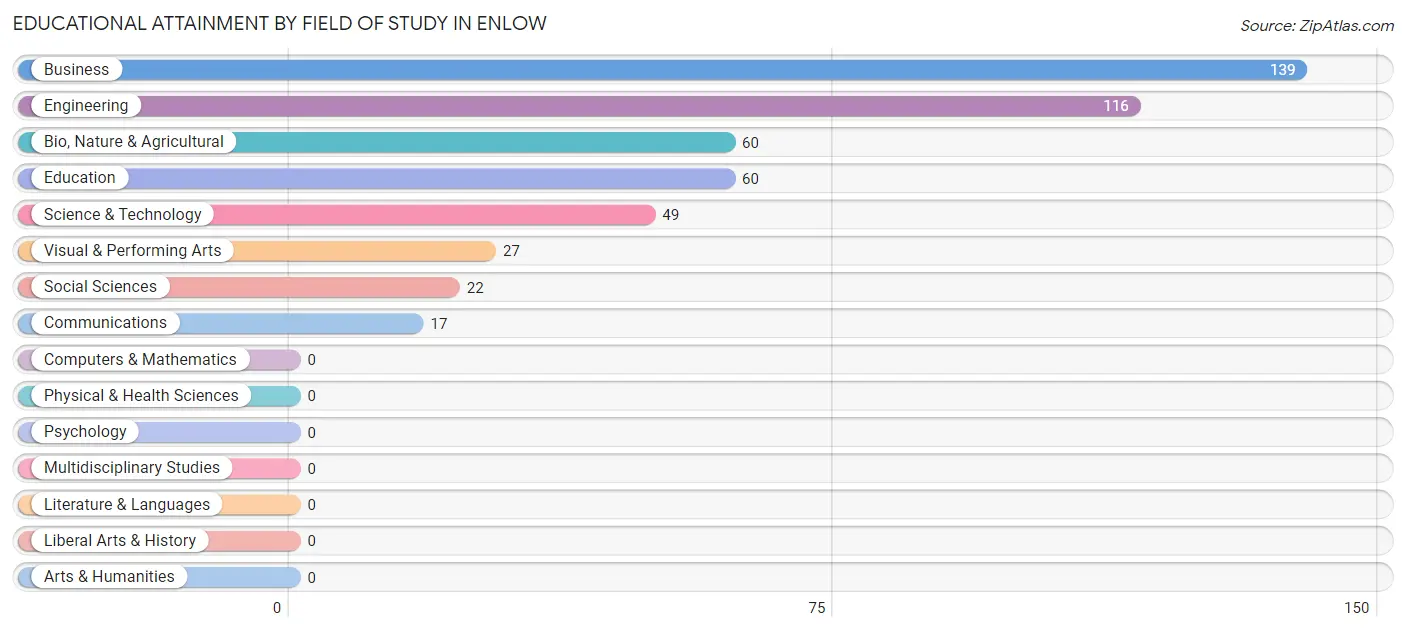
| Field of Study | # Graduates | % Graduates |
| Computers & Mathematics | 0 | 0.0% |
| Bio, Nature & Agricultural | 60 | 12.2% |
| Physical & Health Sciences | 0 | 0.0% |
| Psychology | 0 | 0.0% |
| Social Sciences | 22 | 4.5% |
| Engineering | 116 | 23.7% |
| Multidisciplinary Studies | 0 | 0.0% |
| Science & Technology | 49 | 10.0% |
| Business | 139 | 28.4% |
| Education | 60 | 12.2% |
| Literature & Languages | 0 | 0.0% |
| Liberal Arts & History | 0 | 0.0% |
| Visual & Performing Arts | 27 | 5.5% |
| Communications | 17 | 3.5% |
| Arts & Humanities | 0 | 0.0% |
| Total | 490 | 100.0% |
Transportation & Commute in Enlow
Vehicle Availability by Sex in Enlow
The most prevalent vehicle ownership categories in Enlow are males with 2 vehicles (237, accounting for 71.6%) and females with 2 vehicles (166, making up 85.6%).
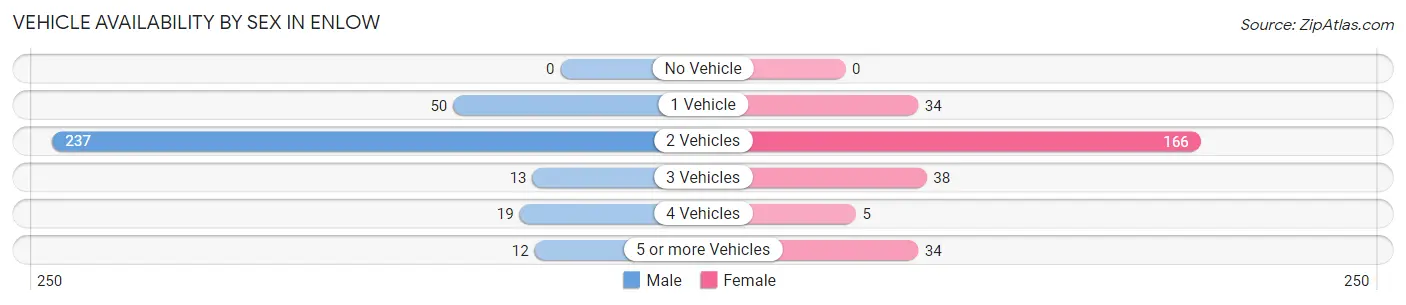
| Vehicles Available | Male | Female |
| No Vehicle | 0 (0.0%) | 0 (0.0%) |
| 1 Vehicle | 50 (15.1%) | 34 (12.3%) |
| 2 Vehicles | 237 (71.6%) | 166 (59.9%) |
| 3 Vehicles | 13 (3.9%) | 38 (13.7%) |
| 4 Vehicles | 19 (5.7%) | 5 (1.8%) |
| 5 or more Vehicles | 12 (3.6%) | 34 (12.3%) |
| Total | 331 (100.0%) | 277 (100.0%) |
Commute Time in Enlow
The most frequently occuring commute durations in Enlow are 30 to 34 minutes (108 commuters, 27.3%), 35 to 39 minutes (74 commuters, 18.7%), and 20 to 24 minutes (73 commuters, 18.5%).
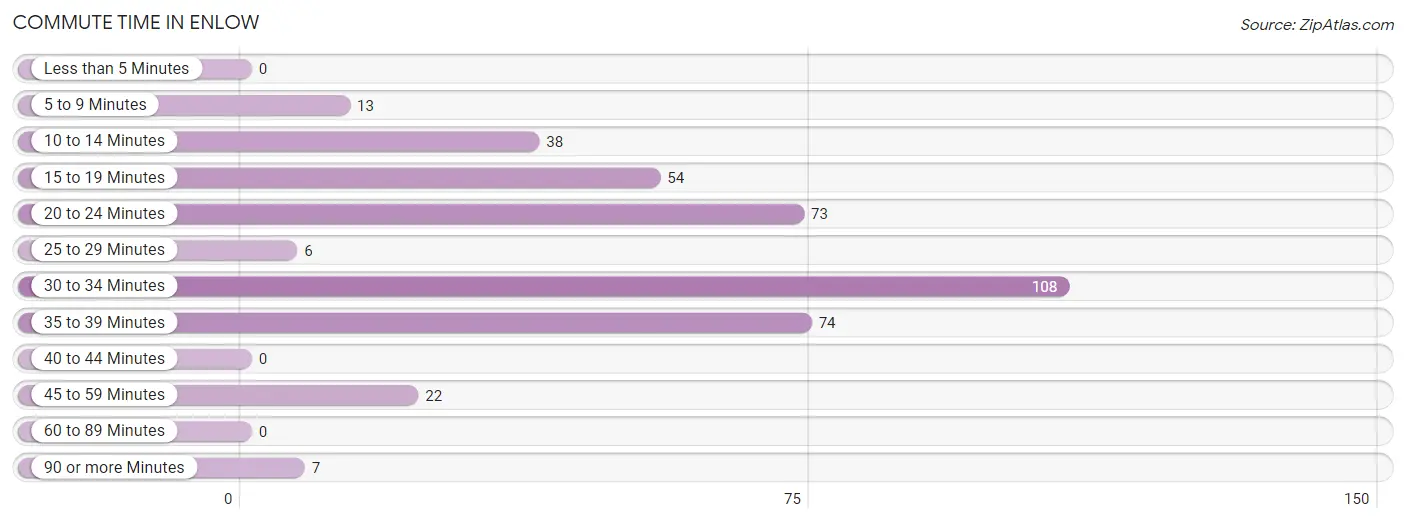
| Commute Time | # Commuters | % Commuters |
| Less than 5 Minutes | 0 | 0.0% |
| 5 to 9 Minutes | 13 | 3.3% |
| 10 to 14 Minutes | 38 | 9.6% |
| 15 to 19 Minutes | 54 | 13.7% |
| 20 to 24 Minutes | 73 | 18.5% |
| 25 to 29 Minutes | 6 | 1.5% |
| 30 to 34 Minutes | 108 | 27.3% |
| 35 to 39 Minutes | 74 | 18.7% |
| 40 to 44 Minutes | 0 | 0.0% |
| 45 to 59 Minutes | 22 | 5.6% |
| 60 to 89 Minutes | 0 | 0.0% |
| 90 or more Minutes | 7 | 1.8% |
Commute Time by Sex in Enlow
The most common commute times in Enlow are 20 to 24 minutes (73 commuters, 31.3%) for males and 30 to 34 minutes (50 commuters, 30.9%) for females.
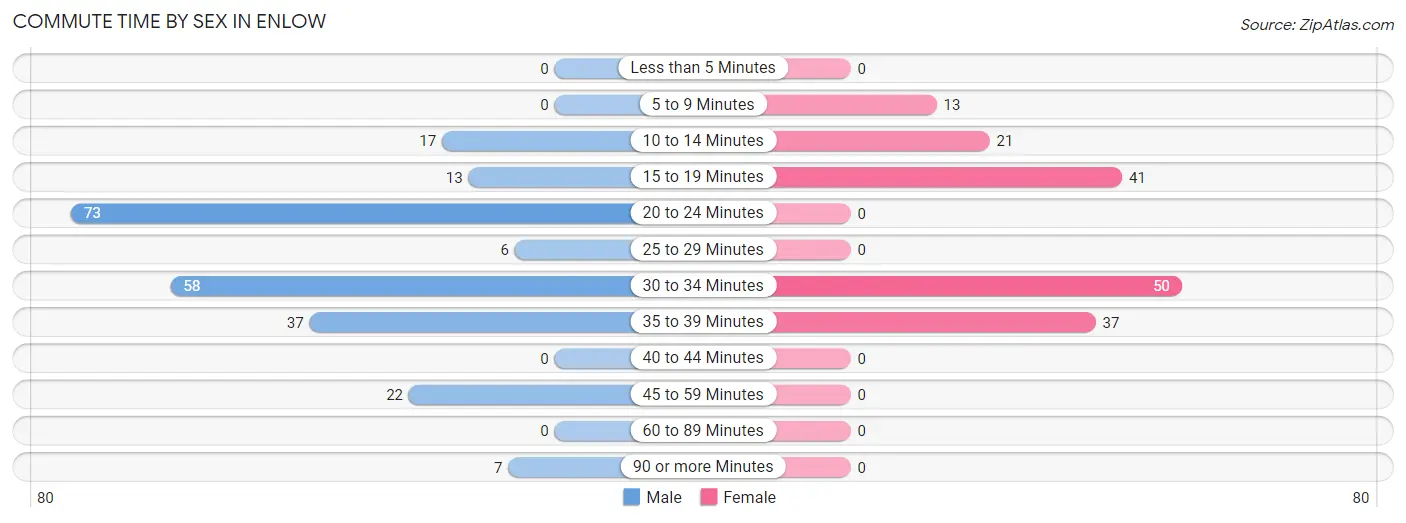
| Commute Time | Male | Female |
| Less than 5 Minutes | 0 (0.0%) | 0 (0.0%) |
| 5 to 9 Minutes | 0 (0.0%) | 13 (8.0%) |
| 10 to 14 Minutes | 17 (7.3%) | 21 (13.0%) |
| 15 to 19 Minutes | 13 (5.6%) | 41 (25.3%) |
| 20 to 24 Minutes | 73 (31.3%) | 0 (0.0%) |
| 25 to 29 Minutes | 6 (2.6%) | 0 (0.0%) |
| 30 to 34 Minutes | 58 (24.9%) | 50 (30.9%) |
| 35 to 39 Minutes | 37 (15.9%) | 37 (22.8%) |
| 40 to 44 Minutes | 0 (0.0%) | 0 (0.0%) |
| 45 to 59 Minutes | 22 (9.4%) | 0 (0.0%) |
| 60 to 89 Minutes | 0 (0.0%) | 0 (0.0%) |
| 90 or more Minutes | 7 (3.0%) | 0 (0.0%) |
Time of Departure to Work by Sex in Enlow
The most frequent times of departure to work in Enlow are 6:00 AM to 6:29 AM (82, 35.2%) for males and 8:30 AM to 8:59 AM (46, 28.4%) for females.
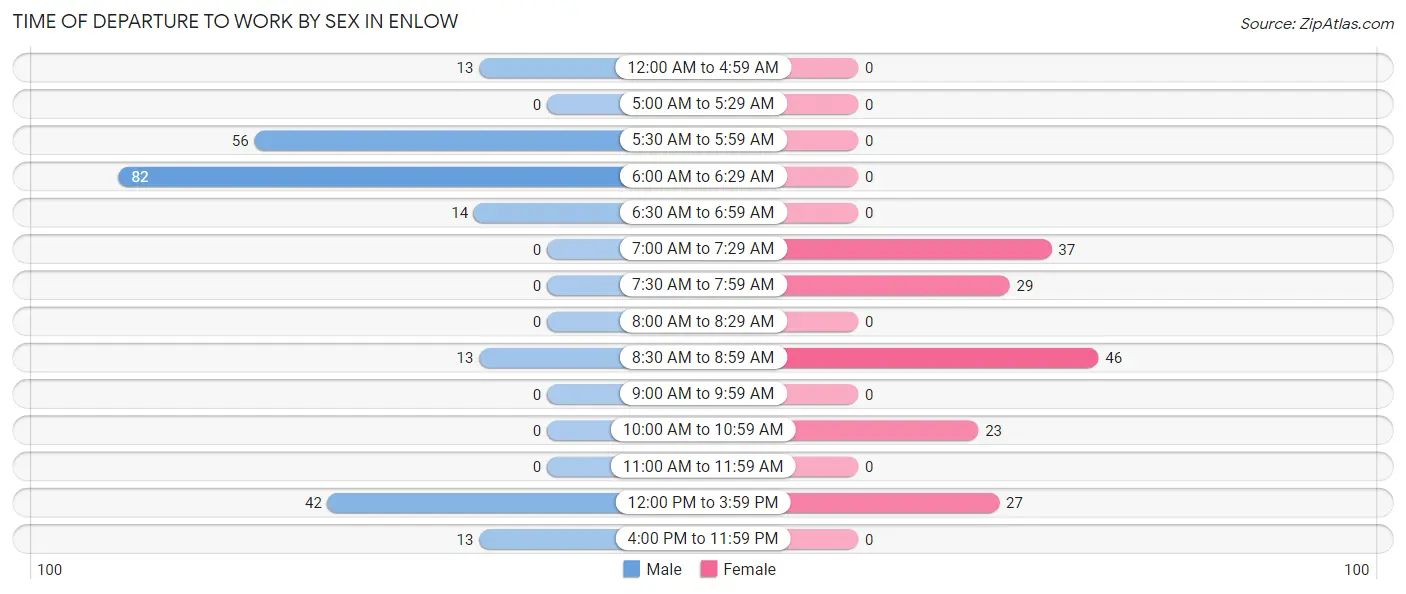
| Time of Departure | Male | Female |
| 12:00 AM to 4:59 AM | 13 (5.6%) | 0 (0.0%) |
| 5:00 AM to 5:29 AM | 0 (0.0%) | 0 (0.0%) |
| 5:30 AM to 5:59 AM | 56 (24.0%) | 0 (0.0%) |
| 6:00 AM to 6:29 AM | 82 (35.2%) | 0 (0.0%) |
| 6:30 AM to 6:59 AM | 14 (6.0%) | 0 (0.0%) |
| 7:00 AM to 7:29 AM | 0 (0.0%) | 37 (22.8%) |
| 7:30 AM to 7:59 AM | 0 (0.0%) | 29 (17.9%) |
| 8:00 AM to 8:29 AM | 0 (0.0%) | 0 (0.0%) |
| 8:30 AM to 8:59 AM | 13 (5.6%) | 46 (28.4%) |
| 9:00 AM to 9:59 AM | 0 (0.0%) | 0 (0.0%) |
| 10:00 AM to 10:59 AM | 0 (0.0%) | 23 (14.2%) |
| 11:00 AM to 11:59 AM | 0 (0.0%) | 0 (0.0%) |
| 12:00 PM to 3:59 PM | 42 (18.0%) | 27 (16.7%) |
| 4:00 PM to 11:59 PM | 13 (5.6%) | 0 (0.0%) |
| Total | 233 (100.0%) | 162 (100.0%) |
Housing Occupancy in Enlow
Occupancy by Ownership in Enlow
Of the total 417 dwellings in Enlow, owner-occupied units account for 399 (95.7%), while renter-occupied units make up 18 (4.3%).
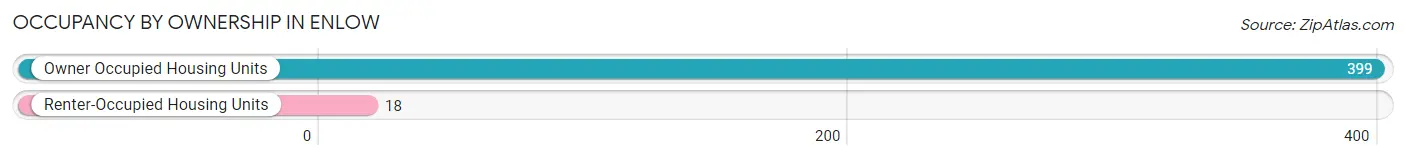
| Occupancy | # Housing Units | % Housing Units |
| Owner Occupied Housing Units | 399 | 95.7% |
| Renter-Occupied Housing Units | 18 | 4.3% |
| Total Occupied Housing Units | 417 | 100.0% |
Occupancy by Household Size in Enlow
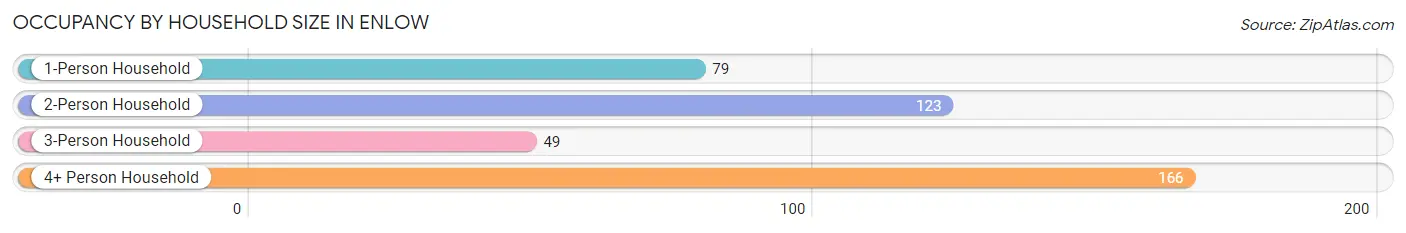
| Household Size | # Housing Units | % Housing Units |
| 1-Person Household | 79 | 18.9% |
| 2-Person Household | 123 | 29.5% |
| 3-Person Household | 49 | 11.7% |
| 4+ Person Household | 166 | 39.8% |
| Total Housing Units | 417 | 100.0% |
Occupancy by Ownership by Household Size in Enlow
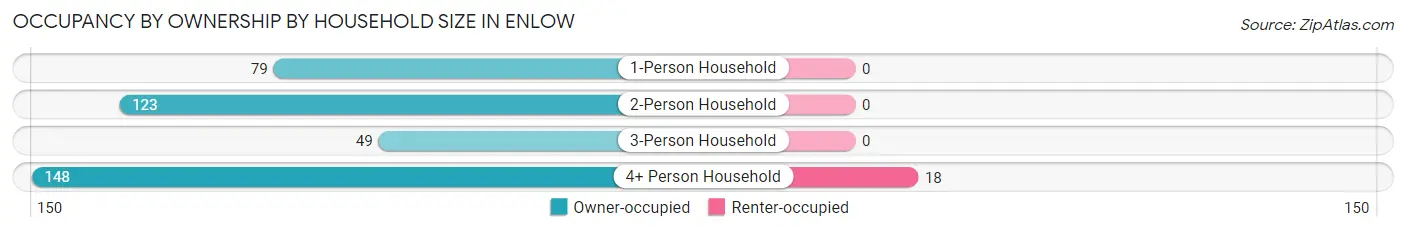
| Household Size | Owner-occupied | Renter-occupied |
| 1-Person Household | 79 (100.0%) | 0 (0.0%) |
| 2-Person Household | 123 (100.0%) | 0 (0.0%) |
| 3-Person Household | 49 (100.0%) | 0 (0.0%) |
| 4+ Person Household | 148 (89.2%) | 18 (10.8%) |
| Total Housing Units | 399 (95.7%) | 18 (4.3%) |
Occupancy by Educational Attainment in Enlow
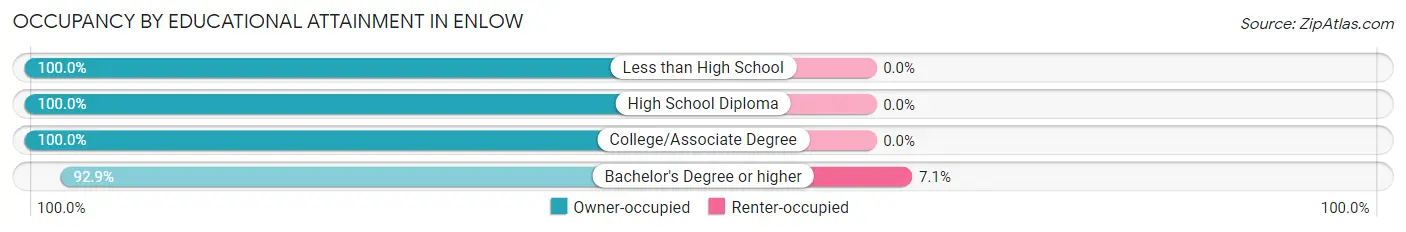
| Household Size | Owner-occupied | Renter-occupied |
| Less than High School | 16 (100.0%) | 0 (0.0%) |
| High School Diploma | 89 (100.0%) | 0 (0.0%) |
| College/Associate Degree | 60 (100.0%) | 0 (0.0%) |
| Bachelor's Degree or higher | 234 (92.9%) | 18 (7.1%) |
Occupancy by Age of Householder in Enlow
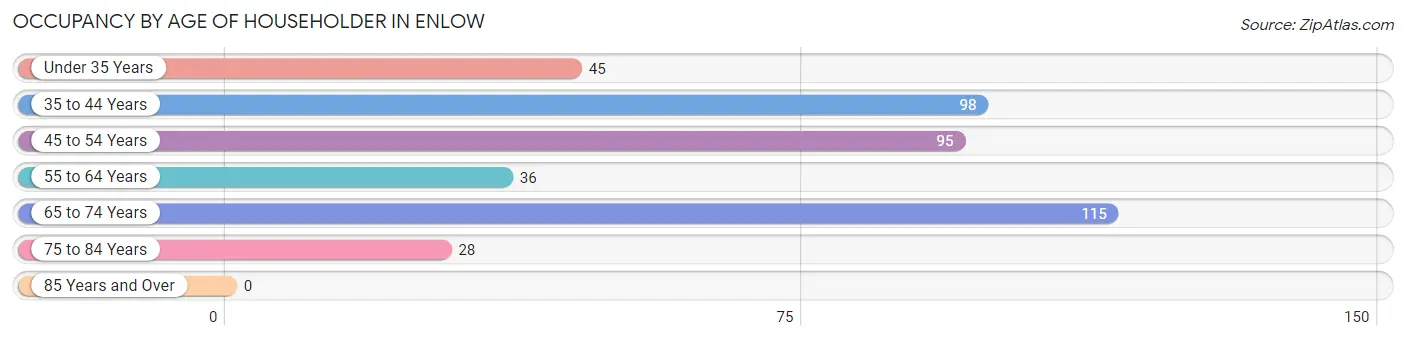
| Age Bracket | # Households | % Households |
| Under 35 Years | 45 | 10.8% |
| 35 to 44 Years | 98 | 23.5% |
| 45 to 54 Years | 95 | 22.8% |
| 55 to 64 Years | 36 | 8.6% |
| 65 to 74 Years | 115 | 27.6% |
| 75 to 84 Years | 28 | 6.7% |
| 85 Years and Over | 0 | 0.0% |
| Total | 417 | 100.0% |
Housing Finances in Enlow
Median Income by Occupancy in Enlow
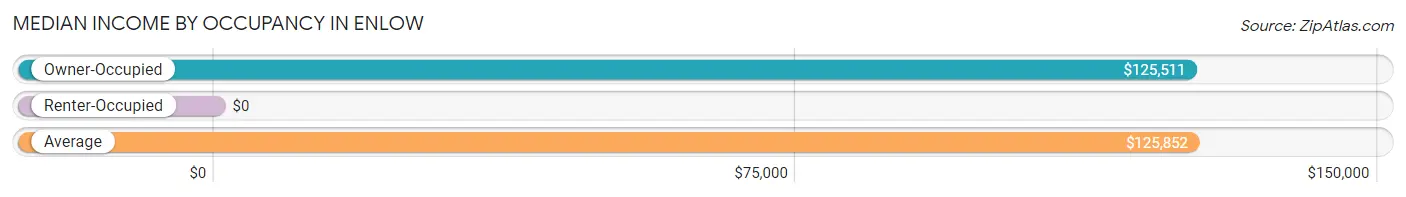
| Occupancy Type | # Households | Median Income |
| Owner-Occupied | 399 (95.7%) | $125,511 |
| Renter-Occupied | 18 (4.3%) | $0 |
| Average | 417 (100.0%) | $125,852 |
Occupancy by Householder Income Bracket in Enlow
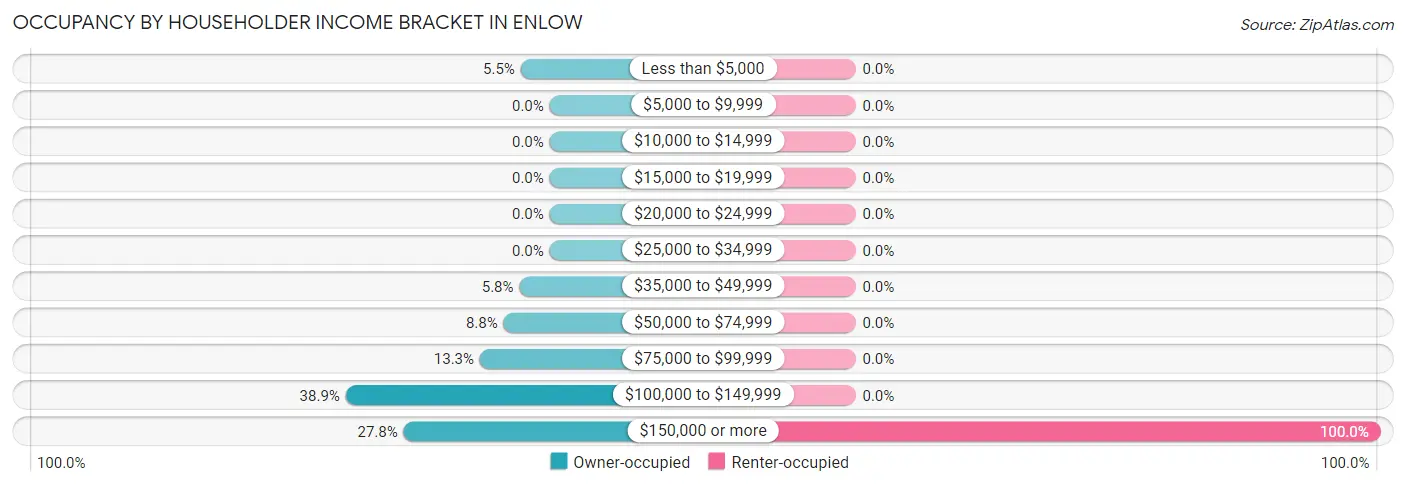
| Income Bracket | Owner-occupied | Renter-occupied |
| Less than $5,000 | 22 (5.5%) | 0 (0.0%) |
| $5,000 to $9,999 | 0 (0.0%) | 0 (0.0%) |
| $10,000 to $14,999 | 0 (0.0%) | 0 (0.0%) |
| $15,000 to $19,999 | 0 (0.0%) | 0 (0.0%) |
| $20,000 to $24,999 | 0 (0.0%) | 0 (0.0%) |
| $25,000 to $34,999 | 0 (0.0%) | 0 (0.0%) |
| $35,000 to $49,999 | 23 (5.8%) | 0 (0.0%) |
| $50,000 to $74,999 | 35 (8.8%) | 0 (0.0%) |
| $75,000 to $99,999 | 53 (13.3%) | 0 (0.0%) |
| $100,000 to $149,999 | 155 (38.9%) | 0 (0.0%) |
| $150,000 or more | 111 (27.8%) | 18 (100.0%) |
| Total | 399 (100.0%) | 18 (100.0%) |
Monthly Housing Cost Tiers in Enlow
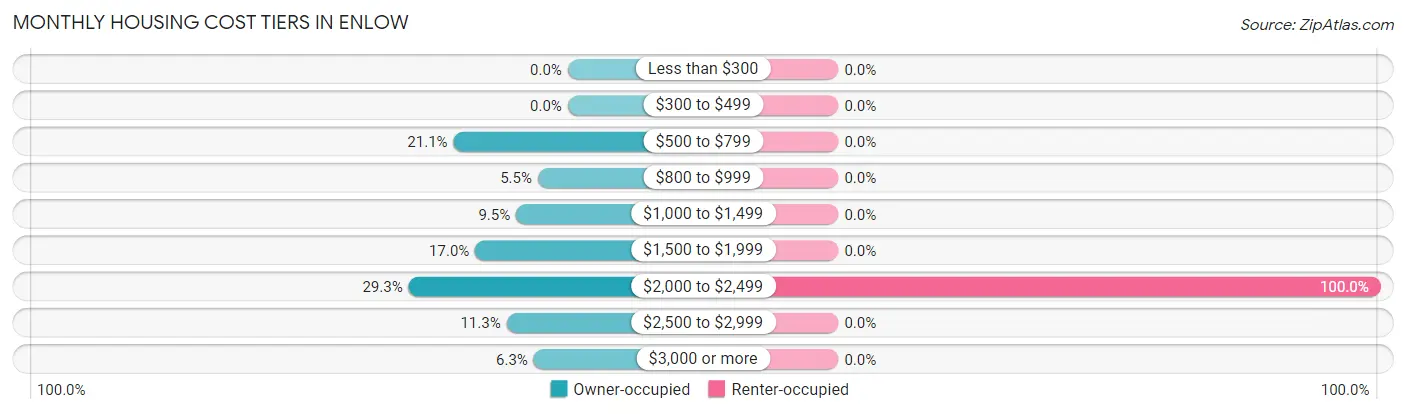
| Monthly Cost | Owner-occupied | Renter-occupied |
| Less than $300 | 0 (0.0%) | 0 (0.0%) |
| $300 to $499 | 0 (0.0%) | 0 (0.0%) |
| $500 to $799 | 84 (21.0%) | 0 (0.0%) |
| $800 to $999 | 22 (5.5%) | 0 (0.0%) |
| $1,000 to $1,499 | 38 (9.5%) | 0 (0.0%) |
| $1,500 to $1,999 | 68 (17.0%) | 0 (0.0%) |
| $2,000 to $2,499 | 117 (29.3%) | 18 (100.0%) |
| $2,500 to $2,999 | 45 (11.3%) | 0 (0.0%) |
| $3,000 or more | 25 (6.3%) | 0 (0.0%) |
| Total | 399 (100.0%) | 18 (100.0%) |
Physical Housing Characteristics in Enlow
Housing Structures in Enlow
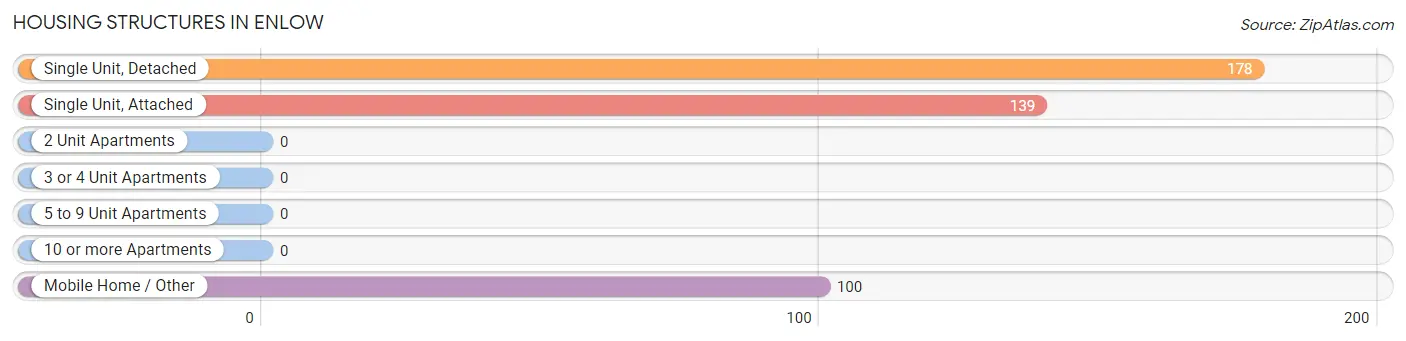
| Structure Type | # Housing Units | % Housing Units |
| Single Unit, Detached | 178 | 42.7% |
| Single Unit, Attached | 139 | 33.3% |
| 2 Unit Apartments | 0 | 0.0% |
| 3 or 4 Unit Apartments | 0 | 0.0% |
| 5 to 9 Unit Apartments | 0 | 0.0% |
| 10 or more Apartments | 0 | 0.0% |
| Mobile Home / Other | 100 | 24.0% |
| Total | 417 | 100.0% |
Housing Structures by Occupancy in Enlow
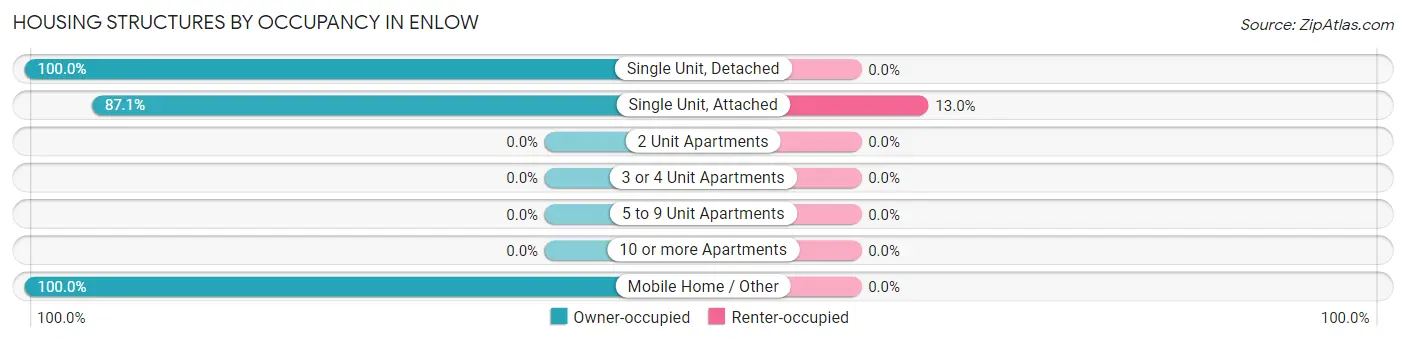
| Structure Type | Owner-occupied | Renter-occupied |
| Single Unit, Detached | 178 (100.0%) | 0 (0.0%) |
| Single Unit, Attached | 121 (87.1%) | 18 (13.0%) |
| 2 Unit Apartments | 0 (0.0%) | 0 (0.0%) |
| 3 or 4 Unit Apartments | 0 (0.0%) | 0 (0.0%) |
| 5 to 9 Unit Apartments | 0 (0.0%) | 0 (0.0%) |
| 10 or more Apartments | 0 (0.0%) | 0 (0.0%) |
| Mobile Home / Other | 100 (100.0%) | 0 (0.0%) |
| Total | 399 (95.7%) | 18 (4.3%) |
Housing Structures by Number of Rooms in Enlow
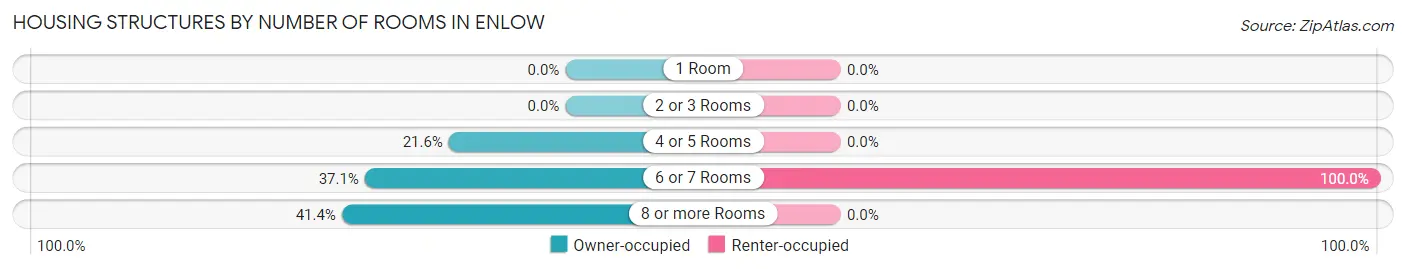
| Number of Rooms | Owner-occupied | Renter-occupied |
| 1 Room | 0 (0.0%) | 0 (0.0%) |
| 2 or 3 Rooms | 0 (0.0%) | 0 (0.0%) |
| 4 or 5 Rooms | 86 (21.5%) | 0 (0.0%) |
| 6 or 7 Rooms | 148 (37.1%) | 18 (100.0%) |
| 8 or more Rooms | 165 (41.3%) | 0 (0.0%) |
| Total | 399 (100.0%) | 18 (100.0%) |
Housing Structure by Heating Type in Enlow
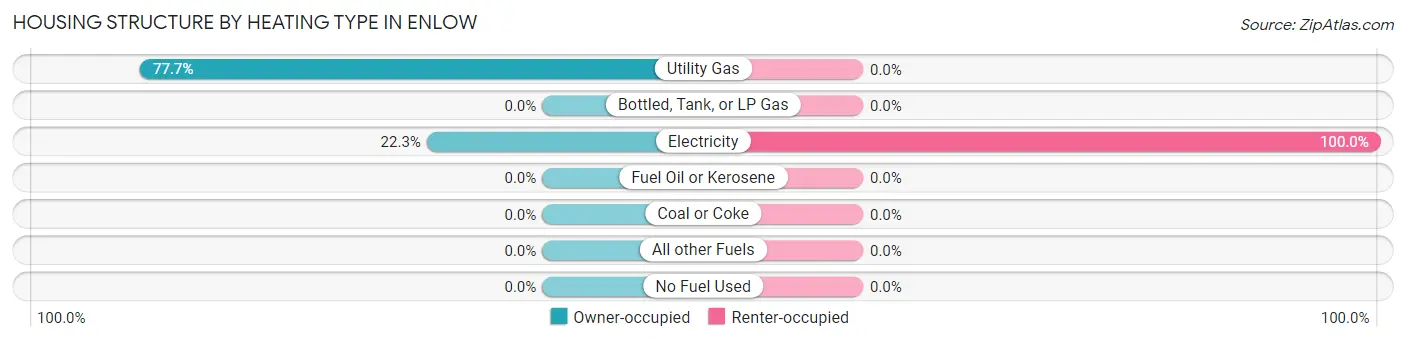
| Heating Type | Owner-occupied | Renter-occupied |
| Utility Gas | 310 (77.7%) | 0 (0.0%) |
| Bottled, Tank, or LP Gas | 0 (0.0%) | 0 (0.0%) |
| Electricity | 89 (22.3%) | 18 (100.0%) |
| Fuel Oil or Kerosene | 0 (0.0%) | 0 (0.0%) |
| Coal or Coke | 0 (0.0%) | 0 (0.0%) |
| All other Fuels | 0 (0.0%) | 0 (0.0%) |
| No Fuel Used | 0 (0.0%) | 0 (0.0%) |
| Total | 399 (100.0%) | 18 (100.0%) |
Household Vehicle Usage in Enlow
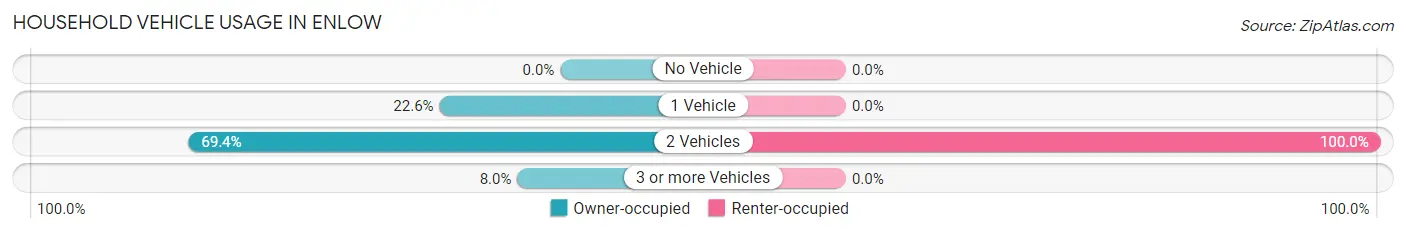
| Vehicles per Household | Owner-occupied | Renter-occupied |
| No Vehicle | 0 (0.0%) | 0 (0.0%) |
| 1 Vehicle | 90 (22.6%) | 0 (0.0%) |
| 2 Vehicles | 277 (69.4%) | 18 (100.0%) |
| 3 or more Vehicles | 32 (8.0%) | 0 (0.0%) |
| Total | 399 (100.0%) | 18 (100.0%) |
Real Estate & Mortgages in Enlow
Real Estate and Mortgage Overview in Enlow
| Characteristic | Without Mortgage | With Mortgage |
| Housing Units | 87 | 312 |
| Median Property Value | - | - |
| Median Household Income | - | - |
| Monthly Housing Costs | $752 | $25 |
| Real Estate Taxes | - | - |
Property Value by Mortgage Status in Enlow
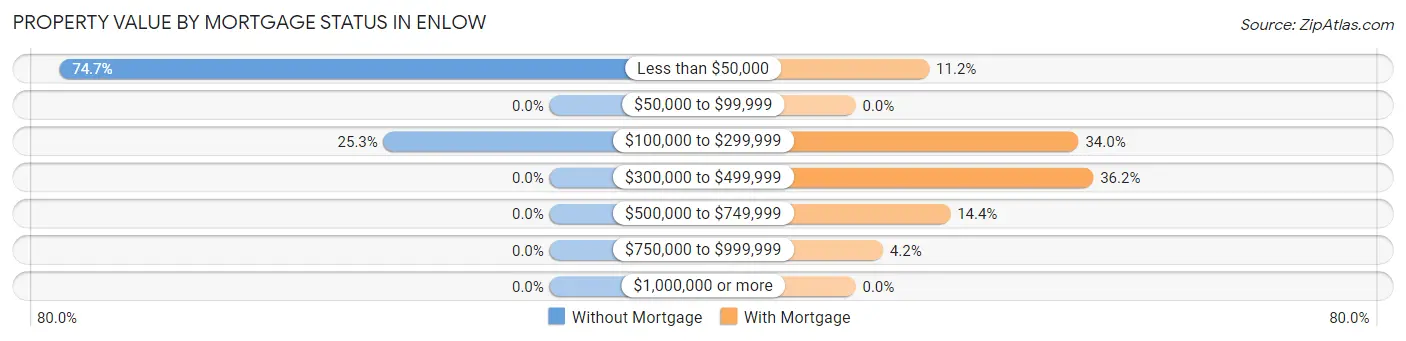
| Property Value | Without Mortgage | With Mortgage |
| Less than $50,000 | 65 (74.7%) | 35 (11.2%) |
| $50,000 to $99,999 | 0 (0.0%) | 0 (0.0%) |
| $100,000 to $299,999 | 22 (25.3%) | 106 (34.0%) |
| $300,000 to $499,999 | 0 (0.0%) | 113 (36.2%) |
| $500,000 to $749,999 | 0 (0.0%) | 45 (14.4%) |
| $750,000 to $999,999 | 0 (0.0%) | 13 (4.2%) |
| $1,000,000 or more | 0 (0.0%) | 0 (0.0%) |
| Total | 87 (100.0%) | 312 (100.0%) |
Household Income by Mortgage Status in Enlow
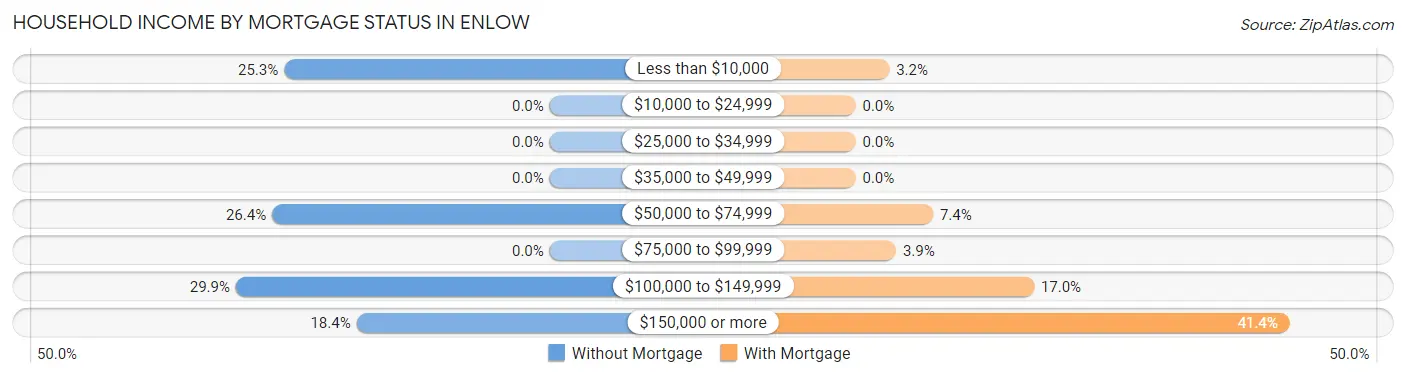
| Household Income | Without Mortgage | With Mortgage |
| Less than $10,000 | 22 (25.3%) | 10 (3.2%) |
| $10,000 to $24,999 | 0 (0.0%) | 0 (0.0%) |
| $25,000 to $34,999 | 0 (0.0%) | 0 (0.0%) |
| $35,000 to $49,999 | 0 (0.0%) | 0 (0.0%) |
| $50,000 to $74,999 | 23 (26.4%) | 23 (7.4%) |
| $75,000 to $99,999 | 0 (0.0%) | 12 (3.8%) |
| $100,000 to $149,999 | 26 (29.9%) | 53 (17.0%) |
| $150,000 or more | 16 (18.4%) | 129 (41.3%) |
| Total | 87 (100.0%) | 312 (100.0%) |
Property Value to Household Income Ratio in Enlow
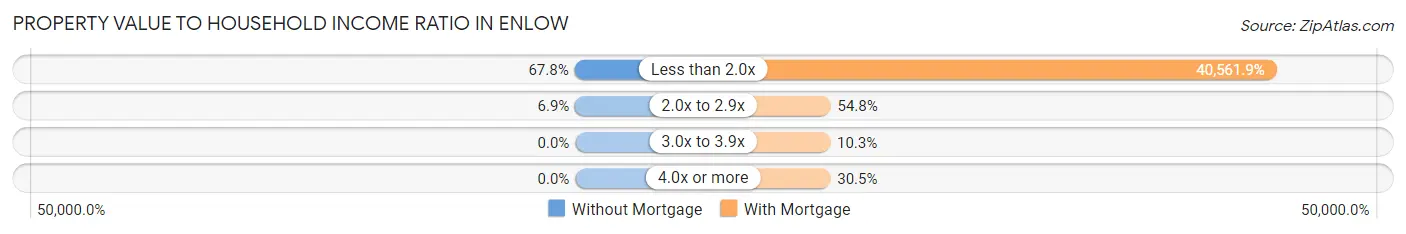
| Value-to-Income Ratio | Without Mortgage | With Mortgage |
| Less than 2.0x | 59 (67.8%) | 126,553 (40,561.9%) |
| 2.0x to 2.9x | 6 (6.9%) | 171 (54.8%) |
| 3.0x to 3.9x | 0 (0.0%) | 32 (10.3%) |
| 4.0x or more | 0 (0.0%) | 95 (30.4%) |
| Total | 87 (100.0%) | 312 (100.0%) |
Real Estate Taxes by Mortgage Status in Enlow
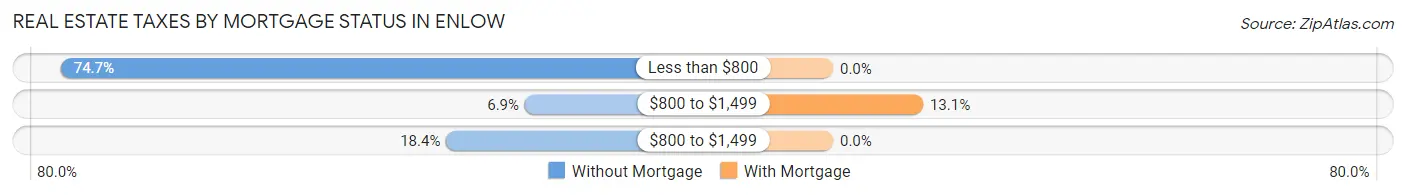
| Property Taxes | Without Mortgage | With Mortgage |
| Less than $800 | 65 (74.7%) | 0 (0.0%) |
| $800 to $1,499 | 6 (6.9%) | 41 (13.1%) |
| $800 to $1,499 | 16 (18.4%) | 0 (0.0%) |
| Total | 87 (100.0%) | 312 (100.0%) |
Health & Disability in Enlow
Health Insurance Coverage by Age in Enlow
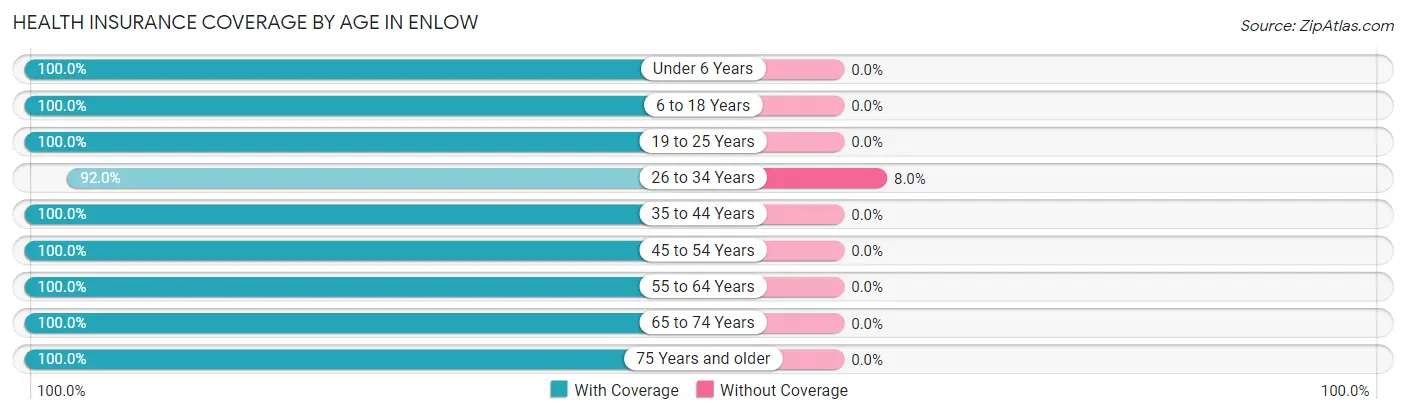
| Age Bracket | With Coverage | Without Coverage |
| Under 6 Years | 48 (100.0%) | 0 (0.0%) |
| 6 to 18 Years | 246 (100.0%) | 0 (0.0%) |
| 19 to 25 Years | 99 (100.0%) | 0 (0.0%) |
| 26 to 34 Years | 127 (92.0%) | 11 (8.0%) |
| 35 to 44 Years | 98 (100.0%) | 0 (0.0%) |
| 45 to 54 Years | 171 (100.0%) | 0 (0.0%) |
| 55 to 64 Years | 176 (100.0%) | 0 (0.0%) |
| 65 to 74 Years | 128 (100.0%) | 0 (0.0%) |
| 75 Years and older | 101 (100.0%) | 0 (0.0%) |
| Total | 1,194 (99.1%) | 11 (0.9%) |
Health Insurance Coverage by Citizenship Status in Enlow
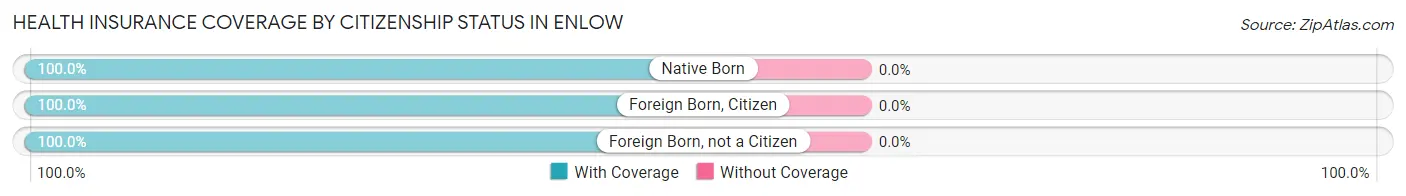
| Citizenship Status | With Coverage | Without Coverage |
| Native Born | 48 (100.0%) | 0 (0.0%) |
| Foreign Born, Citizen | 246 (100.0%) | 0 (0.0%) |
| Foreign Born, not a Citizen | 99 (100.0%) | 0 (0.0%) |
Health Insurance Coverage by Household Income in Enlow
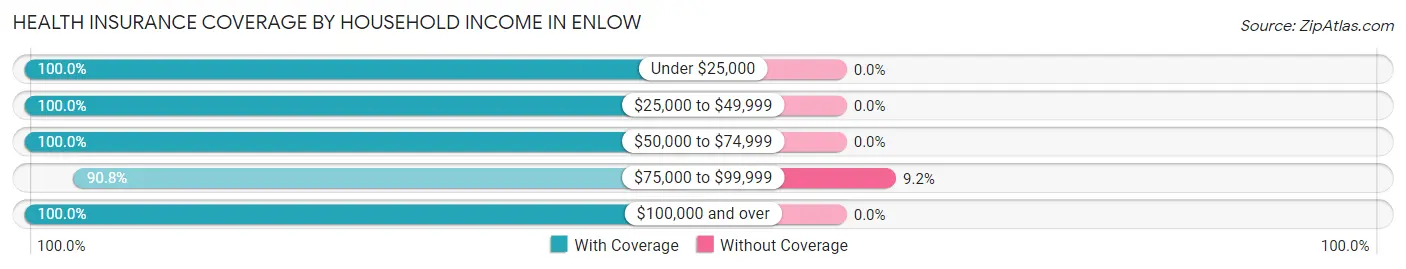
| Household Income | With Coverage | Without Coverage |
| Under $25,000 | 22 (100.0%) | 0 (0.0%) |
| $25,000 to $49,999 | 23 (100.0%) | 0 (0.0%) |
| $50,000 to $74,999 | 107 (100.0%) | 0 (0.0%) |
| $75,000 to $99,999 | 108 (90.8%) | 11 (9.2%) |
| $100,000 and over | 934 (100.0%) | 0 (0.0%) |
Public vs Private Health Insurance Coverage by Age in Enlow
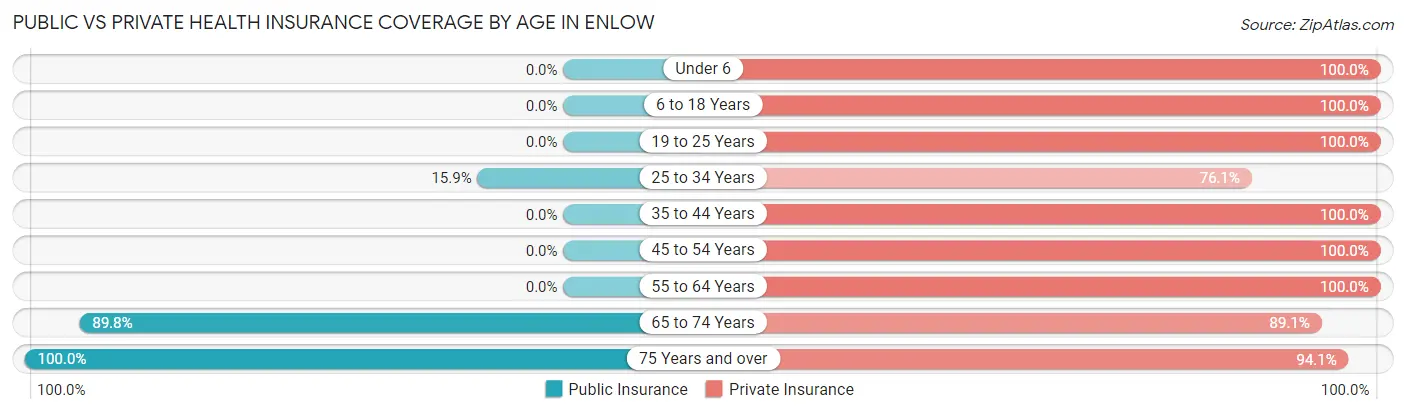
| Age Bracket | Public Insurance | Private Insurance |
| Under 6 | 0 (0.0%) | 48 (100.0%) |
| 6 to 18 Years | 0 (0.0%) | 246 (100.0%) |
| 19 to 25 Years | 0 (0.0%) | 99 (100.0%) |
| 25 to 34 Years | 22 (15.9%) | 105 (76.1%) |
| 35 to 44 Years | 0 (0.0%) | 98 (100.0%) |
| 45 to 54 Years | 0 (0.0%) | 171 (100.0%) |
| 55 to 64 Years | 0 (0.0%) | 176 (100.0%) |
| 65 to 74 Years | 115 (89.8%) | 114 (89.1%) |
| 75 Years and over | 101 (100.0%) | 95 (94.1%) |
| Total | 238 (19.8%) | 1,152 (95.6%) |
Disability Status by Sex by Age in Enlow
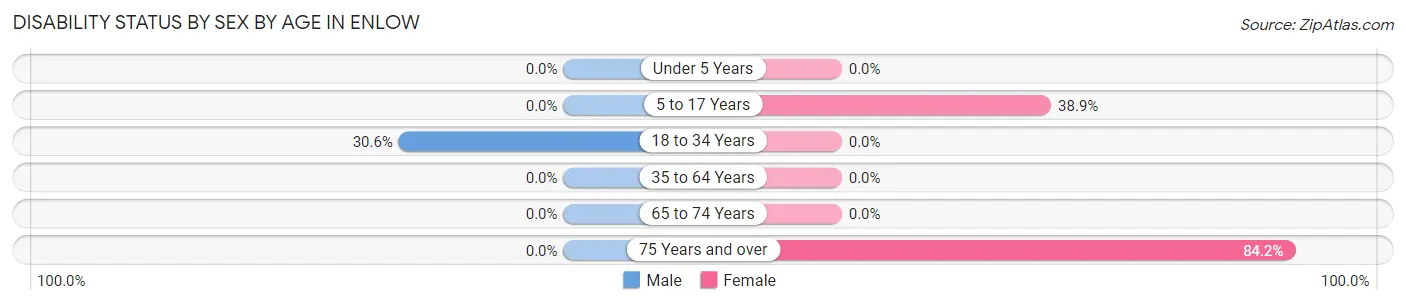
| Age Bracket | Male | Female |
| Under 5 Years | 0 (0.0%) | 0 (0.0%) |
| 5 to 17 Years | 0 (0.0%) | 68 (38.9%) |
| 18 to 34 Years | 22 (30.6%) | 0 (0.0%) |
| 35 to 64 Years | 0 (0.0%) | 0 (0.0%) |
| 65 to 74 Years | 0 (0.0%) | 0 (0.0%) |
| 75 Years and over | 0 (0.0%) | 85 (84.2%) |
Disability Class by Sex by Age in Enlow
Disability Class: Hearing Difficulty
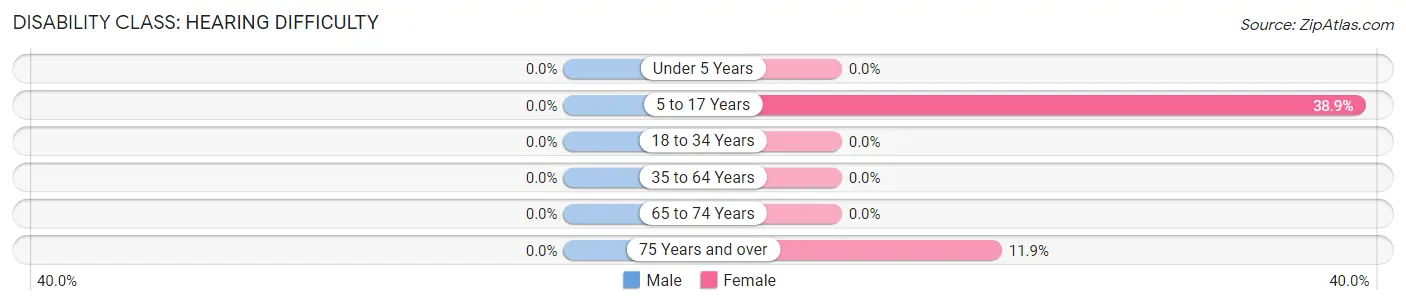
| Age Bracket | Male | Female |
| Under 5 Years | 0 (0.0%) | 0 (0.0%) |
| 5 to 17 Years | 0 (0.0%) | 68 (38.9%) |
| 18 to 34 Years | 0 (0.0%) | 0 (0.0%) |
| 35 to 64 Years | 0 (0.0%) | 0 (0.0%) |
| 65 to 74 Years | 0 (0.0%) | 0 (0.0%) |
| 75 Years and over | 0 (0.0%) | 12 (11.9%) |
Disability Class: Vision Difficulty
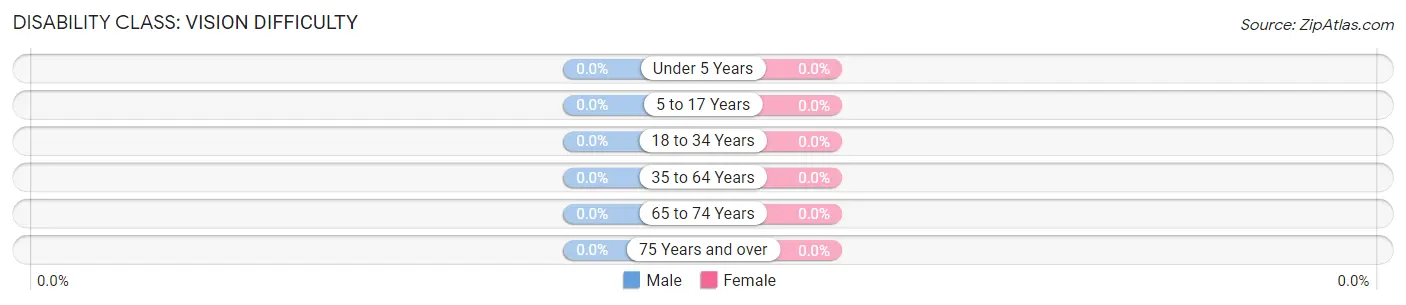
| Age Bracket | Male | Female |
| Under 5 Years | 0 (0.0%) | 0 (0.0%) |
| 5 to 17 Years | 0 (0.0%) | 0 (0.0%) |
| 18 to 34 Years | 0 (0.0%) | 0 (0.0%) |
| 35 to 64 Years | 0 (0.0%) | 0 (0.0%) |
| 65 to 74 Years | 0 (0.0%) | 0 (0.0%) |
| 75 Years and over | 0 (0.0%) | 0 (0.0%) |
Disability Class: Cognitive Difficulty
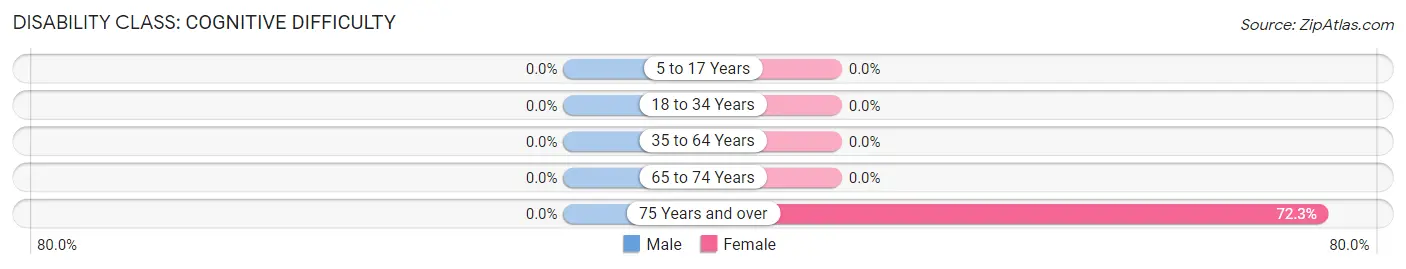
| Age Bracket | Male | Female |
| 5 to 17 Years | 0 (0.0%) | 0 (0.0%) |
| 18 to 34 Years | 0 (0.0%) | 0 (0.0%) |
| 35 to 64 Years | 0 (0.0%) | 0 (0.0%) |
| 65 to 74 Years | 0 (0.0%) | 0 (0.0%) |
| 75 Years and over | 0 (0.0%) | 73 (72.3%) |
Disability Class: Ambulatory Difficulty
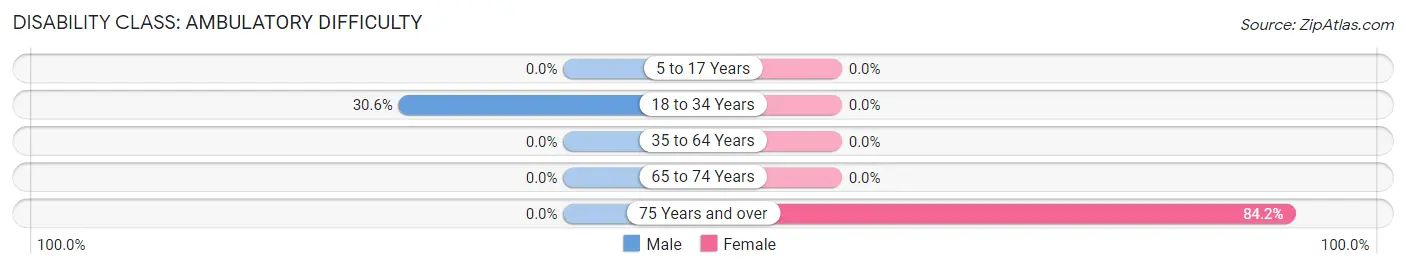
| Age Bracket | Male | Female |
| 5 to 17 Years | 0 (0.0%) | 0 (0.0%) |
| 18 to 34 Years | 22 (30.6%) | 0 (0.0%) |
| 35 to 64 Years | 0 (0.0%) | 0 (0.0%) |
| 65 to 74 Years | 0 (0.0%) | 0 (0.0%) |
| 75 Years and over | 0 (0.0%) | 85 (84.2%) |
Disability Class: Self-Care Difficulty
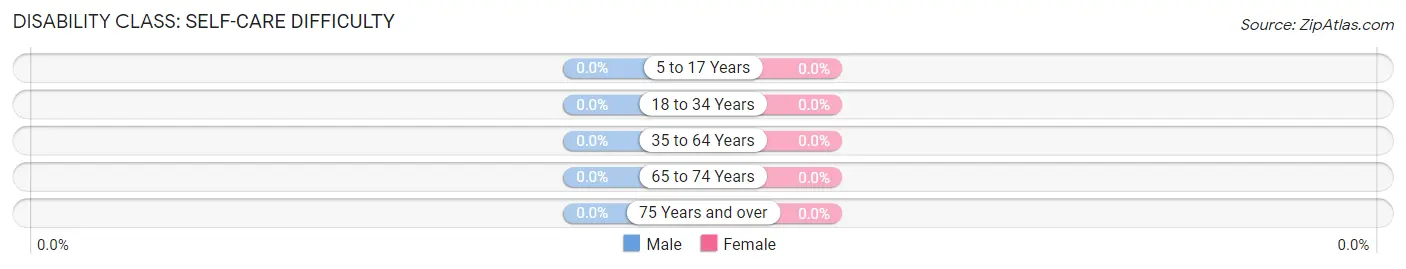
| Age Bracket | Male | Female |
| 5 to 17 Years | 0 (0.0%) | 0 (0.0%) |
| 18 to 34 Years | 0 (0.0%) | 0 (0.0%) |
| 35 to 64 Years | 0 (0.0%) | 0 (0.0%) |
| 65 to 74 Years | 0 (0.0%) | 0 (0.0%) |
| 75 Years and over | 0 (0.0%) | 0 (0.0%) |
Technology Access in Enlow
Computing Device Access in Enlow
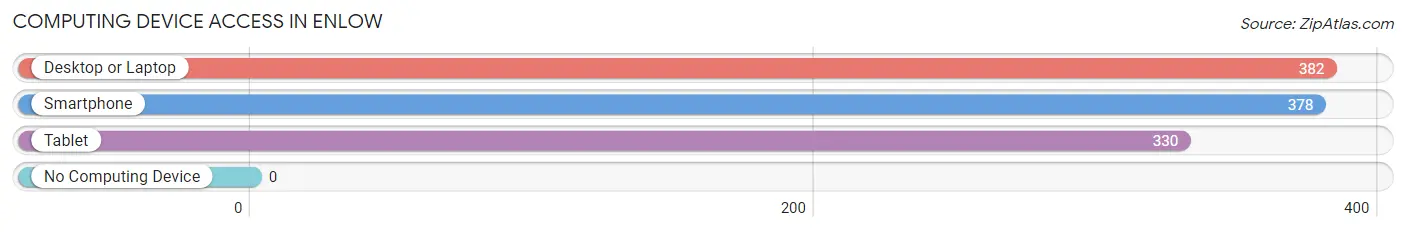
| Device Type | # Households | % Households |
| Desktop or Laptop | 382 | 91.6% |
| Smartphone | 378 | 90.6% |
| Tablet | 330 | 79.1% |
| No Computing Device | 0 | 0.0% |
| Total | 417 | 100.0% |
Internet Access in Enlow
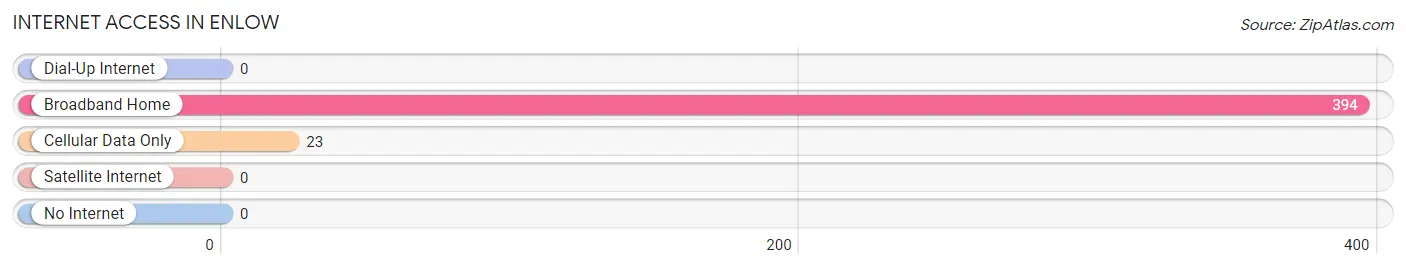
| Internet Type | # Households | % Households |
| Dial-Up Internet | 0 | 0.0% |
| Broadband Home | 394 | 94.5% |
| Cellular Data Only | 23 | 5.5% |
| Satellite Internet | 0 | 0.0% |
| No Internet | 0 | 0.0% |
| Total | 417 | 100.0% |
Enlow Summary
Enlow is a small borough located in Fayette County, Pennsylvania. It is situated in the southwestern corner of the state, approximately 40 miles south of Pittsburgh. The borough is bordered by the townships of Franklin, German, and Nicholson. As of the 2010 census, the population of Enlow was 545.
History
Enlow was founded in 1872 by a group of coal miners from the nearby town of German. The miners had been working in the coal mines of the area and wanted to establish a community of their own. The town was named after the Enlow family, who had owned the land on which the town was built.
The first post office in Enlow was established in 1873. The town grew slowly over the years, and by the early 1900s, it had become a thriving coal mining community. The coal industry provided employment for many of the town's residents, and the town's population peaked at around 1,000 in the 1920s.
The coal industry began to decline in the 1930s, and the population of Enlow began to decline as well. By the 1950s, the population had dropped to around 500. The town has remained relatively stable since then, and the population has remained around 500 ever since.
Geography
Enlow is located in southwestern Pennsylvania, approximately 40 miles south of Pittsburgh. The borough is situated in the foothills of the Allegheny Mountains, and is surrounded by the townships of Franklin, German, and Nicholson. The borough is located on the banks of the Youghiogheny River, and is home to several small creeks and streams.
The terrain of Enlow is mostly hilly, with some flat areas. The borough is located in a temperate climate zone, and experiences four distinct seasons. Summers are generally warm and humid, while winters are cold and snowy.
Economy
The economy of Enlow is largely based on agriculture and tourism. The town is home to several small farms, which produce a variety of crops, including corn, soybeans, and hay. The town is also home to several small businesses, including a few restaurants, a grocery store, and a few small shops.
The town is also a popular tourist destination, due to its proximity to the Youghiogheny River. The river is popular for fishing, canoeing, and kayaking, and the town is home to several campgrounds and recreational areas.
Demographics
As of the 2010 census, the population of Enlow was 545. The racial makeup of the town was 97.3% White, 0.7% African American, 0.2% Native American, 0.2% Asian, and 1.6% from other races. The median household income was $37,500, and the median family income was $41,250. The per capita income was $17,818.
The town is home to a large number of families, with the majority of households consisting of married couples. The town is also home to a large number of elderly residents, with nearly 20% of the population over the age of 65. The town is served by the Fayette County School District, and is home to one elementary school.
Common Questions
What is Per Capita Income in Enlow?
Per Capita income in Enlow is $50,570.
What is the Median Family Income in Enlow?
Median Family Income in Enlow is $105,750.
What is the Median Household income in Enlow?
Median Household Income in Enlow is $125,852.
What is Inequality or Gini Index in Enlow?
Inequality or Gini Index in Enlow is 0.34.
What is the Total Population of Enlow?
Total Population of Enlow is 1,205.
What is the Total Male Population of Enlow?
Total Male Population of Enlow is 469.
What is the Total Female Population of Enlow?
Total Female Population of Enlow is 736.
What is the Ratio of Males per 100 Females in Enlow?
There are 63.72 Males per 100 Females in Enlow.
What is the Ratio of Females per 100 Males in Enlow?
There are 156.93 Females per 100 Males in Enlow.
What is the Median Population Age in Enlow?
Median Population Age in Enlow is 41.9 Years.
What is the Average Family Size in Enlow
Average Family Size in Enlow is 3.1 People.
What is the Average Household Size in Enlow
Average Household Size in Enlow is 2.9 People.
How Large is the Labor Force in Enlow?
There are 651 People in the Labor Forcein in Enlow.
What is the Percentage of People in the Labor Force in Enlow?
70.1% of People are in the Labor Force in Enlow.