King Of Prussia, PA Map & Demographics
King Of Prussia Map
King Of Prussia Overview
$58,203
PER CAPITA INCOME
$125,308
AVG FAMILY INCOME
$107,139
AVG HOUSEHOLD INCOME
37.9%
WAGE / INCOME GAP [ % ]
62.1¢/ $1
WAGE / INCOME GAP [ $ ]
$14,236
FAMILY INCOME DEFICIT
0.40
INEQUALITY / GINI INDEX
24,423
TOTAL POPULATION
12,233
MALE POPULATION
12,190
FEMALE POPULATION
100.35
MALES / 100 FEMALES
99.65
FEMALES / 100 MALES
36.6
MEDIAN AGE
3.0
AVG FAMILY SIZE
2.2
AVG HOUSEHOLD SIZE
15,141
LABOR FORCE [ PEOPLE ]
73.0%
PERCENT IN LABOR FORCE
5.4%
UNEMPLOYMENT RATE
King Of Prussia Zip Codes
Income in King Of Prussia
Income Overview in King Of Prussia
Per Capita Income in King Of Prussia is $58,203, while median incomes of families and households are $125,308 and $107,139 respectively.
| Characteristic | Number | Measure |
| Per Capita Income | 24,423 | $58,203 |
| Median Family Income | 6,173 | $125,308 |
| Mean Family Income | 6,173 | $144,618 |
| Median Household Income | 11,164 | $107,139 |
| Mean Household Income | 11,164 | $125,892 |
| Income Deficit | 6,173 | $14,236 |
| Wage / Income Gap (%) | 24,423 | 37.86% |
| Wage / Income Gap ($) | 24,423 | 62.14¢ per $1 |
| Gini / Inequality Index | 24,423 | 0.40 |
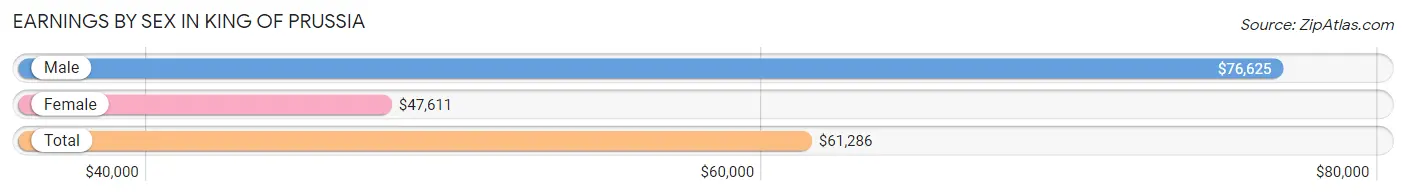
Earnings by Sex in King Of Prussia
Average Earnings in King Of Prussia are $61,286, $76,625 for men and $47,611 for women, a difference of 37.9%.
| Sex | Number | Average Earnings |
| Male | 8,519 (54.9%) | $76,625 |
| Female | 7,003 (45.1%) | $47,611 |
| Total | 15,522 (100.0%) | $61,286 |
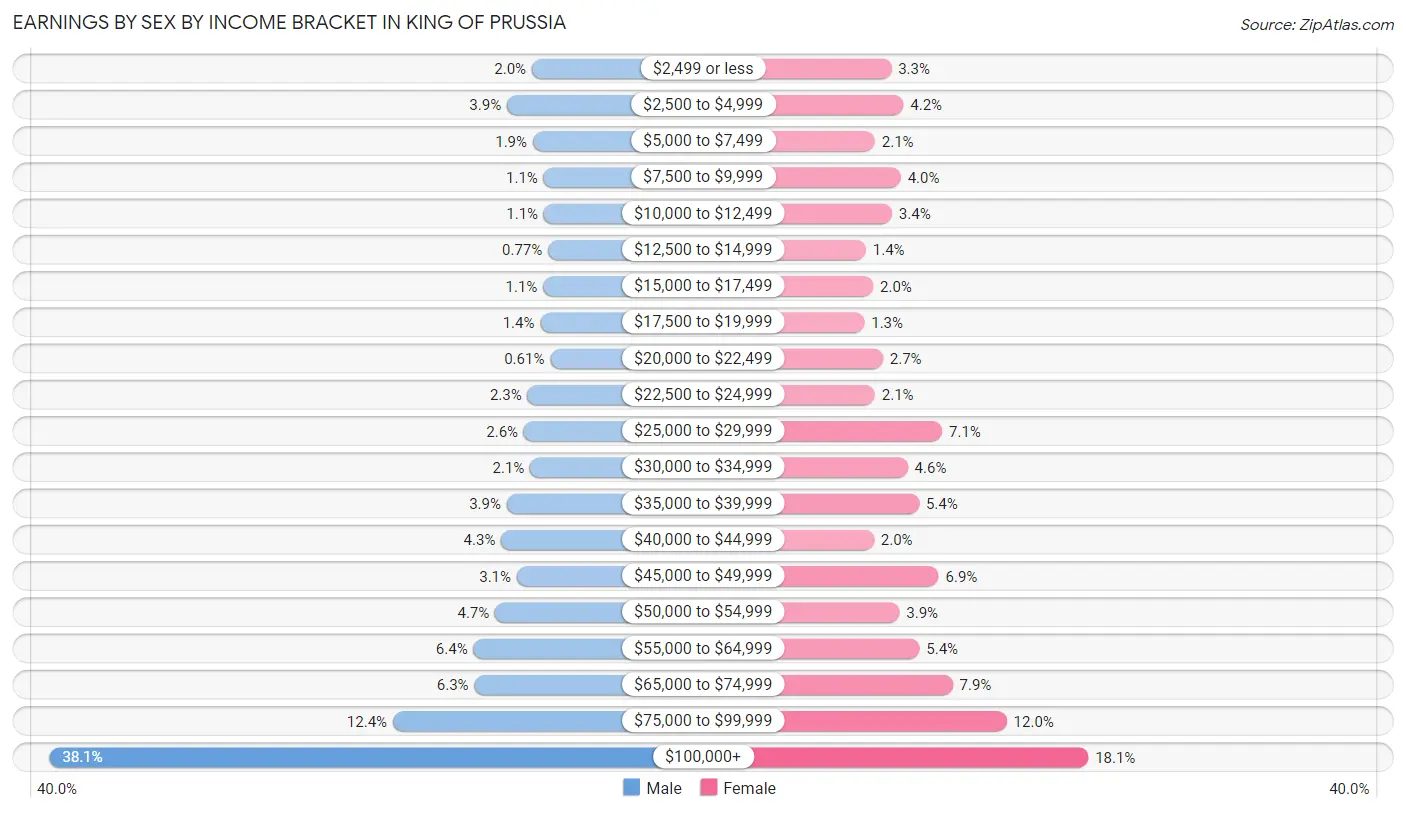
Earnings by Sex by Income Bracket in King Of Prussia
The most common earnings brackets in King Of Prussia are $100,000+ for men (3,249 | 38.1%) and $100,000+ for women (1,267 | 18.1%).
| Income | Male | Female |
| $2,499 or less | 169 (2.0%) | 233 (3.3%) |
| $2,500 to $4,999 | 328 (3.8%) | 297 (4.2%) |
| $5,000 to $7,499 | 163 (1.9%) | 147 (2.1%) |
| $7,500 to $9,999 | 94 (1.1%) | 283 (4.0%) |
| $10,000 to $12,499 | 92 (1.1%) | 237 (3.4%) |
| $12,500 to $14,999 | 66 (0.8%) | 100 (1.4%) |
| $15,000 to $17,499 | 97 (1.1%) | 138 (2.0%) |
| $17,500 to $19,999 | 115 (1.3%) | 92 (1.3%) |
| $20,000 to $22,499 | 52 (0.6%) | 189 (2.7%) |
| $22,500 to $24,999 | 197 (2.3%) | 147 (2.1%) |
| $25,000 to $29,999 | 220 (2.6%) | 500 (7.1%) |
| $30,000 to $34,999 | 180 (2.1%) | 319 (4.6%) |
| $35,000 to $39,999 | 329 (3.9%) | 379 (5.4%) |
| $40,000 to $44,999 | 365 (4.3%) | 142 (2.0%) |
| $45,000 to $49,999 | 265 (3.1%) | 482 (6.9%) |
| $50,000 to $54,999 | 404 (4.7%) | 276 (3.9%) |
| $55,000 to $64,999 | 542 (6.4%) | 381 (5.4%) |
| $65,000 to $74,999 | 536 (6.3%) | 555 (7.9%) |
| $75,000 to $99,999 | 1,056 (12.4%) | 839 (12.0%) |
| $100,000+ | 3,249 (38.1%) | 1,267 (18.1%) |
| Total | 8,519 (100.0%) | 7,003 (100.0%) |
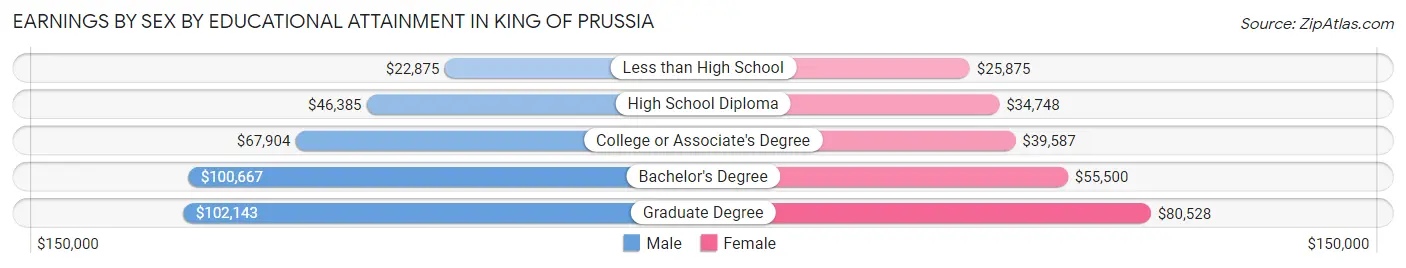
Earnings by Sex by Educational Attainment in King Of Prussia
Average earnings in King Of Prussia are $85,491 for men and $51,918 for women, a difference of 39.3%. Men with an educational attainment of graduate degree enjoy the highest average annual earnings of $102,143, while those with less than high school education earn the least with $22,875. Women with an educational attainment of graduate degree earn the most with the average annual earnings of $80,528, while those with less than high school education have the smallest earnings of $25,875.
| Educational Attainment | Male Income | Female Income |
| Less than High School | $22,875 | $25,875 |
| High School Diploma | $46,385 | $34,748 |
| College or Associate's Degree | $67,904 | $39,587 |
| Bachelor's Degree | $100,667 | $55,500 |
| Graduate Degree | $102,143 | $80,528 |
| Total | $85,491 | $51,918 |
Family Income in King Of Prussia
Family Income Brackets in King Of Prussia
According to the King Of Prussia family income data, there are 1,969 families falling into the $100,000 to $149,999 income range, which is the most common income bracket and makes up 31.9% of all families. Conversely, the $10,000 to $14,999 income bracket is the least frequent group with only 31 families (0.5%) belonging to this category.
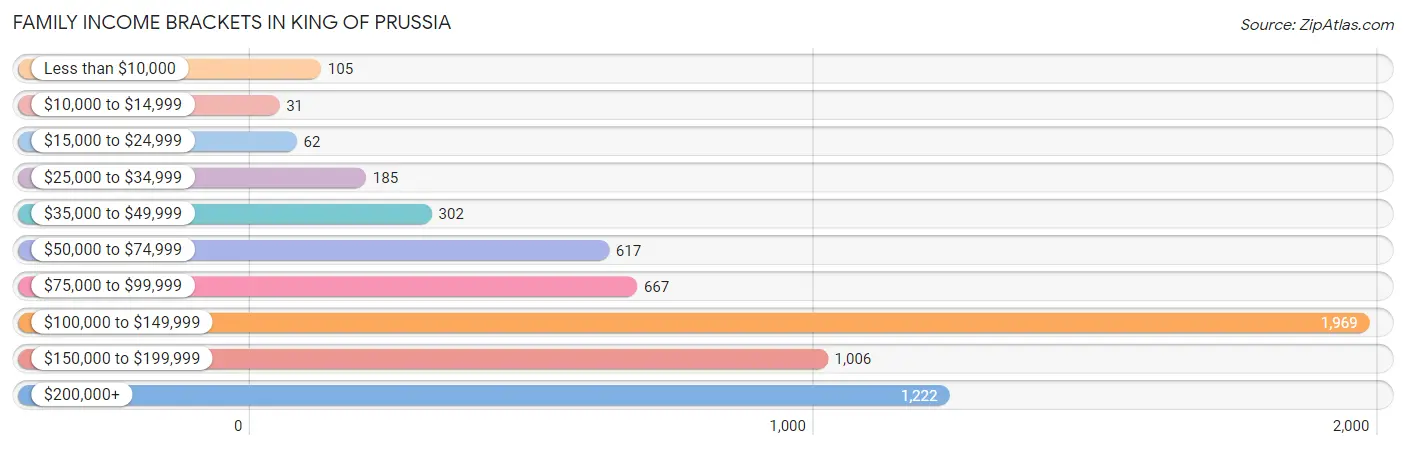
| Income Bracket | # Families | % Families |
| Less than $10,000 | 105 | 1.7% |
| $10,000 to $14,999 | 31 | 0.5% |
| $15,000 to $24,999 | 62 | 1.0% |
| $25,000 to $34,999 | 185 | 3.0% |
| $35,000 to $49,999 | 302 | 4.9% |
| $50,000 to $74,999 | 617 | 10.0% |
| $75,000 to $99,999 | 667 | 10.8% |
| $100,000 to $149,999 | 1,969 | 31.9% |
| $150,000 to $199,999 | 1,006 | 16.3% |
| $200,000+ | 1,222 | 19.8% |
Family Income by Famaliy Size in King Of Prussia
6-person families (78 | 1.3%) account for the highest median family income in King Of Prussia with $250,001 per family, while 2-person families (2,936 | 47.6%) have the highest median income of $60,288 per family member.
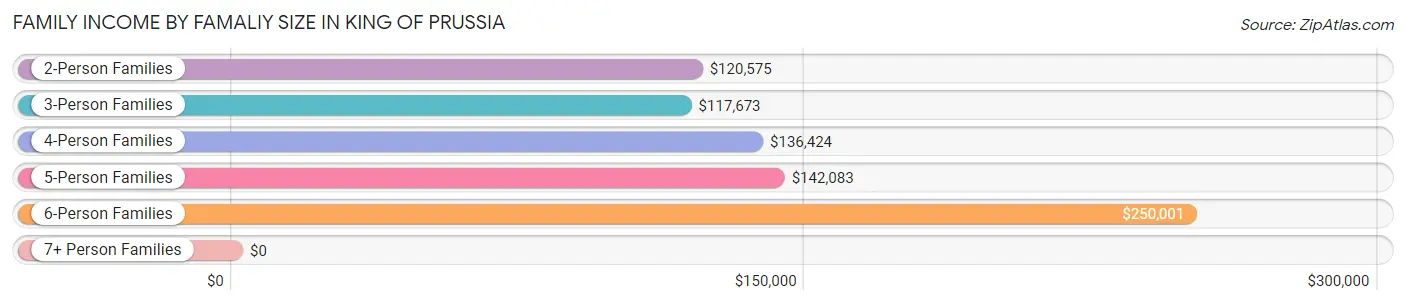
| Income Bracket | # Families | Median Income |
| 2-Person Families | 2,936 (47.6%) | $120,575 |
| 3-Person Families | 1,723 (27.9%) | $117,673 |
| 4-Person Families | 1,003 (16.3%) | $136,424 |
| 5-Person Families | 403 (6.5%) | $142,083 |
| 6-Person Families | 78 (1.3%) | $250,001 |
| 7+ Person Families | 30 (0.5%) | $0 |
| Total | 6,173 (100.0%) | $125,308 |
Family Income by Number of Earners in King Of Prussia
The median family income in King Of Prussia is $125,308, with families comprising 3+ earners (745) having the highest median family income of $168,028, while families with no earners (746) have the lowest median family income of $63,553, accounting for 12.1% and 12.1% of families, respectively.
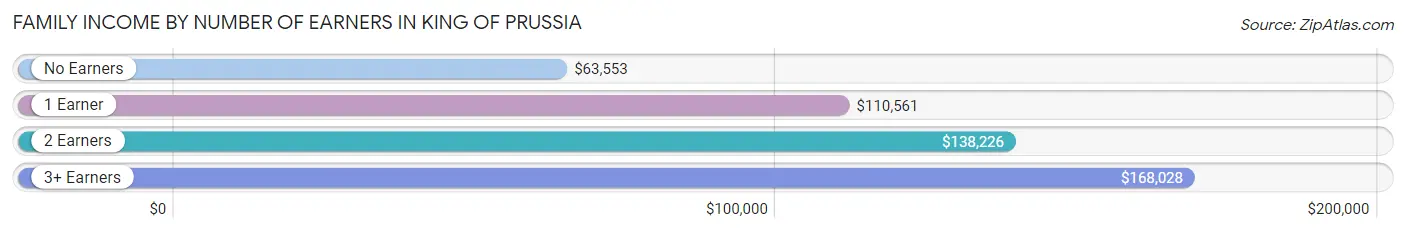
| Number of Earners | # Families | Median Income |
| No Earners | 746 (12.1%) | $63,553 |
| 1 Earner | 1,714 (27.8%) | $110,561 |
| 2 Earners | 2,968 (48.1%) | $138,226 |
| 3+ Earners | 745 (12.1%) | $168,028 |
| Total | 6,173 (100.0%) | $125,308 |
Household Income in King Of Prussia
Household Income Brackets in King Of Prussia
With 2,802 households falling in the category, the $100,000 to $149,999 income range is the most frequent in King Of Prussia, accounting for 25.1% of all households. In contrast, only 123 households (1.1%) fall into the $10,000 to $14,999 income bracket, making it the least populous group.
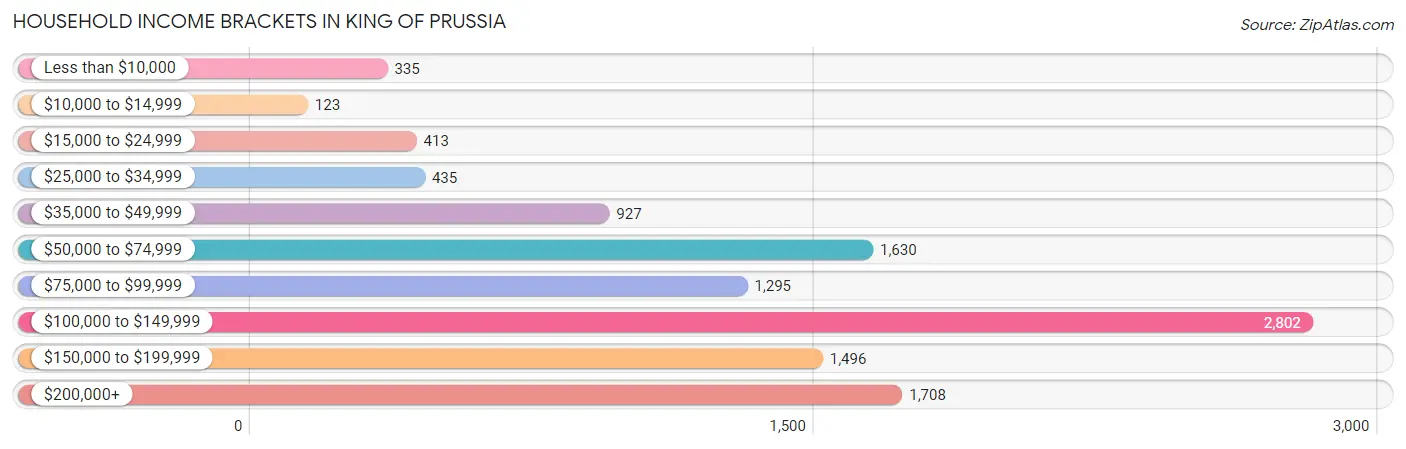
| Income Bracket | # Households | % Households |
| Less than $10,000 | 335 | 3.0% |
| $10,000 to $14,999 | 123 | 1.1% |
| $15,000 to $24,999 | 413 | 3.7% |
| $25,000 to $34,999 | 435 | 3.9% |
| $35,000 to $49,999 | 927 | 8.3% |
| $50,000 to $74,999 | 1,630 | 14.6% |
| $75,000 to $99,999 | 1,295 | 11.6% |
| $100,000 to $149,999 | 2,802 | 25.1% |
| $150,000 to $199,999 | 1,496 | 13.4% |
| $200,000+ | 1,708 | 15.3% |
Household Income by Householder Age in King Of Prussia
The median household income in King Of Prussia is $107,139, with the highest median household income of $130,429 found in the 45 to 64 years age bracket for the primary householder. A total of 3,264 households (29.2%) fall into this category. Meanwhile, the 15 to 24 years age bracket for the primary householder has the lowest median household income of $49,464, with 514 households (4.6%) in this group.
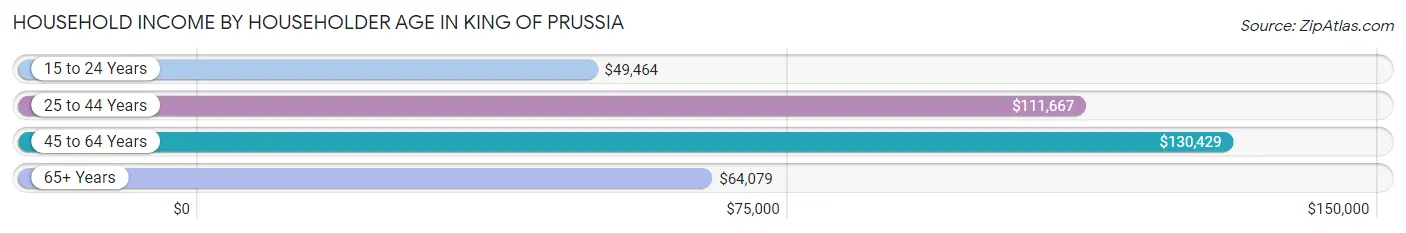
| Income Bracket | # Households | Median Income |
| 15 to 24 Years | 514 (4.6%) | $49,464 |
| 25 to 44 Years | 4,790 (42.9%) | $111,667 |
| 45 to 64 Years | 3,264 (29.2%) | $130,429 |
| 65+ Years | 2,596 (23.3%) | $64,079 |
| Total | 11,164 (100.0%) | $107,139 |
Poverty in King Of Prussia
Income Below Poverty by Sex and Age in King Of Prussia
With 3.5% poverty level for males and 4.2% for females among the residents of King Of Prussia, 15 year old males and 75 year old and over females are the most vulnerable to poverty, with 40 males (28.0%) and 108 females (9.2%) in their respective age groups living below the poverty level.
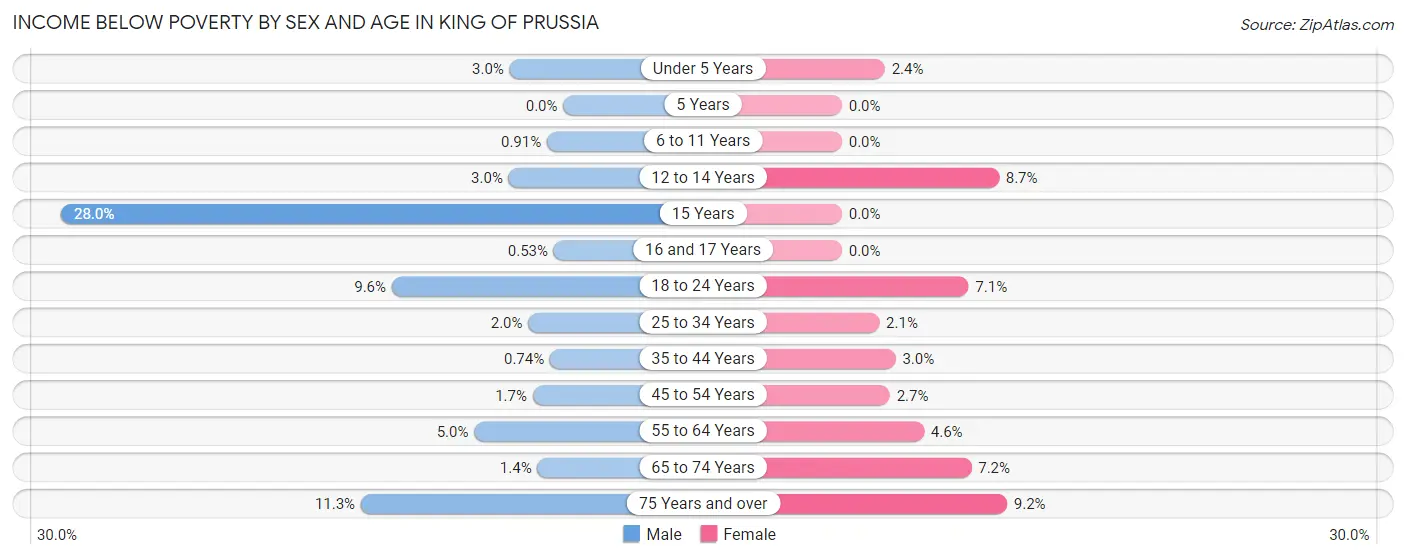
| Age Bracket | Male | Female |
| Under 5 Years | 22 (3.0%) | 20 (2.4%) |
| 5 Years | 0 (0.0%) | 0 (0.0%) |
| 6 to 11 Years | 6 (0.9%) | 0 (0.0%) |
| 12 to 14 Years | 8 (3.0%) | 25 (8.7%) |
| 15 Years | 40 (28.0%) | 0 (0.0%) |
| 16 and 17 Years | 1 (0.5%) | 0 (0.0%) |
| 18 to 24 Years | 96 (9.6%) | 55 (7.0%) |
| 25 to 34 Years | 59 (1.9%) | 57 (2.1%) |
| 35 to 44 Years | 12 (0.7%) | 40 (3.0%) |
| 45 to 54 Years | 26 (1.7%) | 35 (2.7%) |
| 55 to 64 Years | 63 (5.0%) | 71 (4.6%) |
| 65 to 74 Years | 12 (1.4%) | 93 (7.2%) |
| 75 Years and over | 88 (11.3%) | 108 (9.2%) |
| Total | 433 (3.5%) | 504 (4.2%) |
Income Above Poverty by Sex and Age in King Of Prussia
According to the poverty statistics in King Of Prussia, males aged 5 years and females aged 5 years are the age groups that are most secure financially, with 100.0% of males and 100.0% of females in these age groups living above the poverty line.
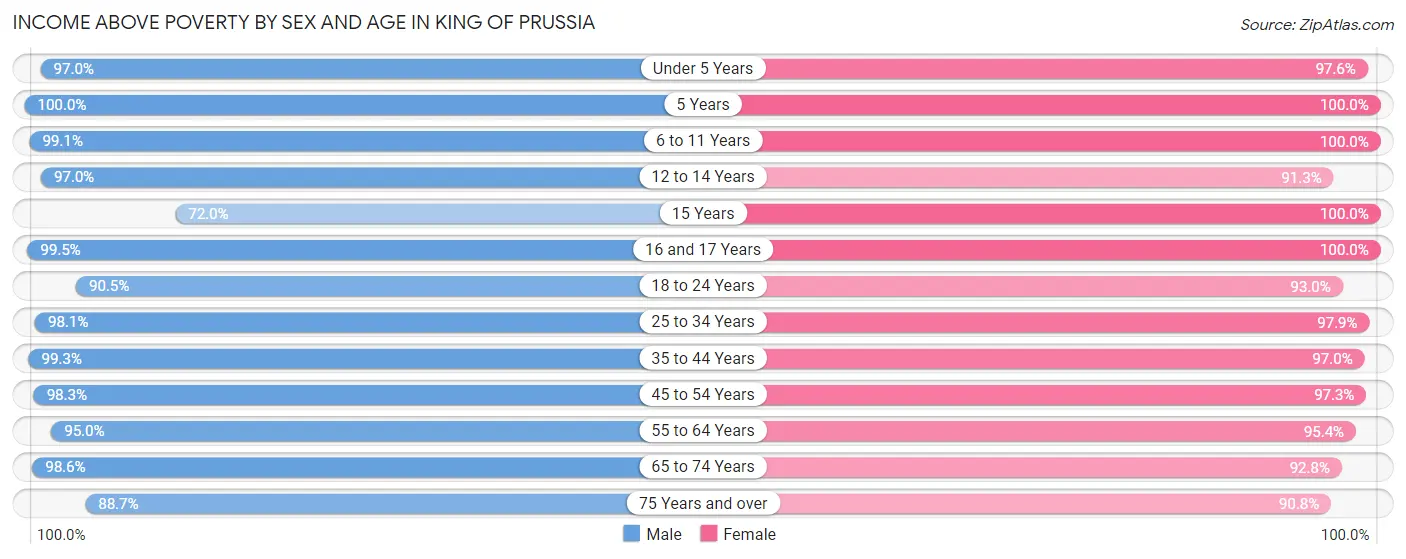
| Age Bracket | Male | Female |
| Under 5 Years | 714 (97.0%) | 816 (97.6%) |
| 5 Years | 132 (100.0%) | 105 (100.0%) |
| 6 to 11 Years | 651 (99.1%) | 386 (100.0%) |
| 12 to 14 Years | 255 (97.0%) | 261 (91.3%) |
| 15 Years | 103 (72.0%) | 132 (100.0%) |
| 16 and 17 Years | 188 (99.5%) | 158 (100.0%) |
| 18 to 24 Years | 909 (90.4%) | 725 (92.9%) |
| 25 to 34 Years | 2,971 (98.1%) | 2,686 (97.9%) |
| 35 to 44 Years | 1,605 (99.3%) | 1,299 (97.0%) |
| 45 to 54 Years | 1,505 (98.3%) | 1,277 (97.3%) |
| 55 to 64 Years | 1,206 (95.0%) | 1,481 (95.4%) |
| 65 to 74 Years | 824 (98.6%) | 1,196 (92.8%) |
| 75 Years and over | 693 (88.7%) | 1,067 (90.8%) |
| Total | 11,756 (96.5%) | 11,589 (95.8%) |
Income Below Poverty Among Married-Couple Families in King Of Prussia
The poverty statistics for married-couple families in King Of Prussia show that 2.8% or 144 of the total 5,214 families live below the poverty line. Families with no children have the highest poverty rate of 2.9%, comprising of 88 families. On the other hand, families with 3 or 4 children have the lowest poverty rate of 0.0%, which includes 0 families.
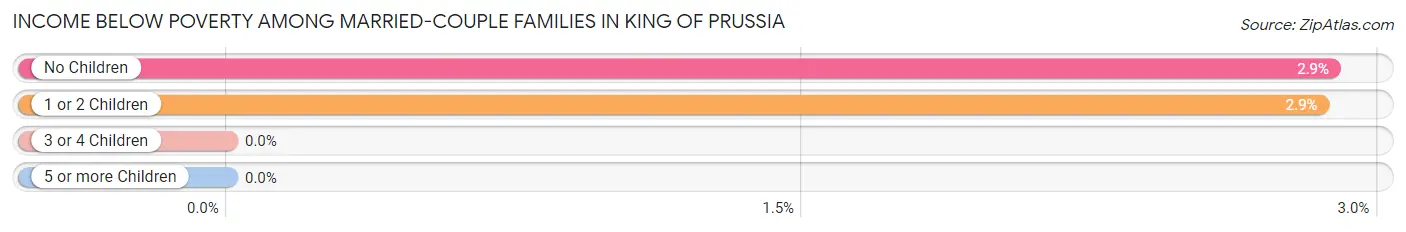
| Children | Above Poverty | Below Poverty |
| No Children | 2,964 (97.1%) | 88 (2.9%) |
| 1 or 2 Children | 1,909 (97.2%) | 56 (2.9%) |
| 3 or 4 Children | 167 (100.0%) | 0 (0.0%) |
| 5 or more Children | 30 (100.0%) | 0 (0.0%) |
| Total | 5,070 (97.2%) | 144 (2.8%) |
Income Below Poverty Among Single-Parent Households in King Of Prussia
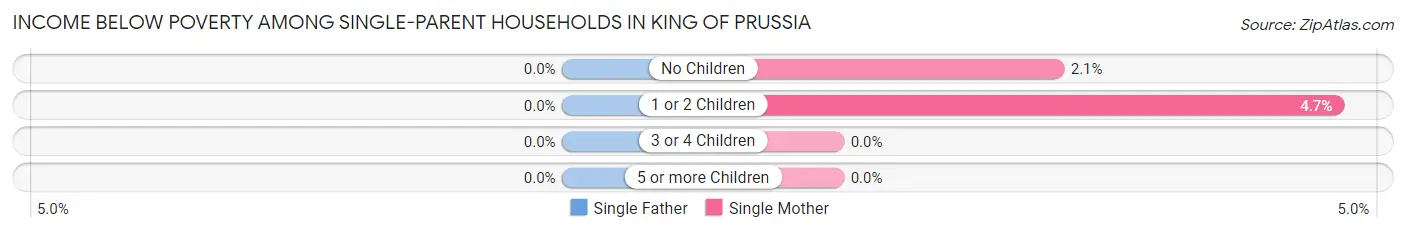
| Children | Single Father | Single Mother |
| No Children | 0 (0.0%) | 8 (2.1%) |
| 1 or 2 Children | 0 (0.0%) | 17 (4.7%) |
| 3 or 4 Children | 0 (0.0%) | 0 (0.0%) |
| 5 or more Children | 0 (0.0%) | 0 (0.0%) |
| Total | 0 (0.0%) | 25 (3.3%) |
Income Below Poverty Among Married-Couple vs Single-Parent Households in King Of Prussia
The poverty data for King Of Prussia shows that 144 of the married-couple family households (2.8%) and 25 of the single-parent households (2.6%) are living below the poverty level. Within the married-couple family households, those with no children have the highest poverty rate, with 88 households (2.9%) falling below the poverty line. Among the single-parent households, those with 1 or 2 children have the highest poverty rate, with 17 household (4.1%) living below poverty.
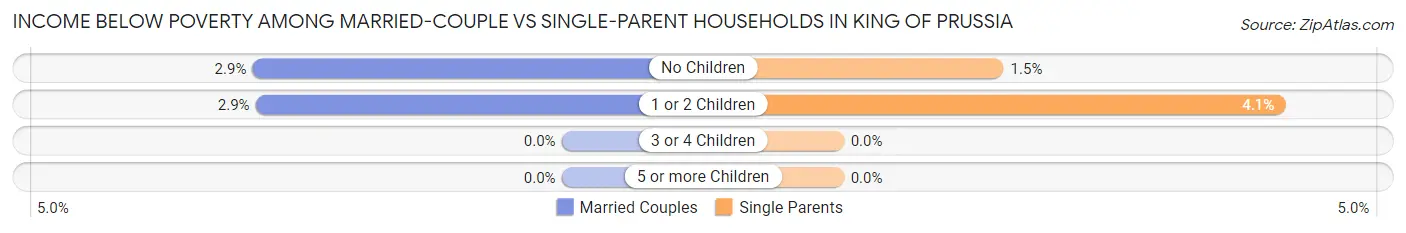
| Children | Married-Couple Families | Single-Parent Households |
| No Children | 88 (2.9%) | 8 (1.5%) |
| 1 or 2 Children | 56 (2.9%) | 17 (4.1%) |
| 3 or 4 Children | 0 (0.0%) | 0 (0.0%) |
| 5 or more Children | 0 (0.0%) | 0 (0.0%) |
| Total | 144 (2.8%) | 25 (2.6%) |
Race in King Of Prussia
The most populous races in King Of Prussia are White / Caucasian (15,111 | 61.9%), Asian (5,731 | 23.5%), and Black / African American (2,100 | 8.6%).
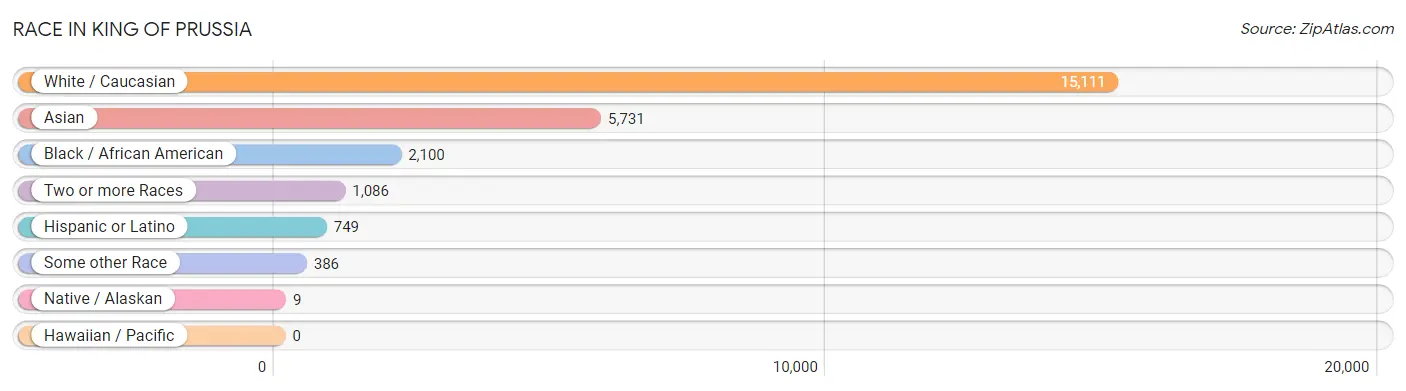
| Race | # Population | % Population |
| Asian | 5,731 | 23.5% |
| Black / African American | 2,100 | 8.6% |
| Hawaiian / Pacific | 0 | 0.0% |
| Hispanic or Latino | 749 | 3.1% |
| Native / Alaskan | 9 | 0.0% |
| White / Caucasian | 15,111 | 61.9% |
| Two or more Races | 1,086 | 4.4% |
| Some other Race | 386 | 1.6% |
| Total | 24,423 | 100.0% |
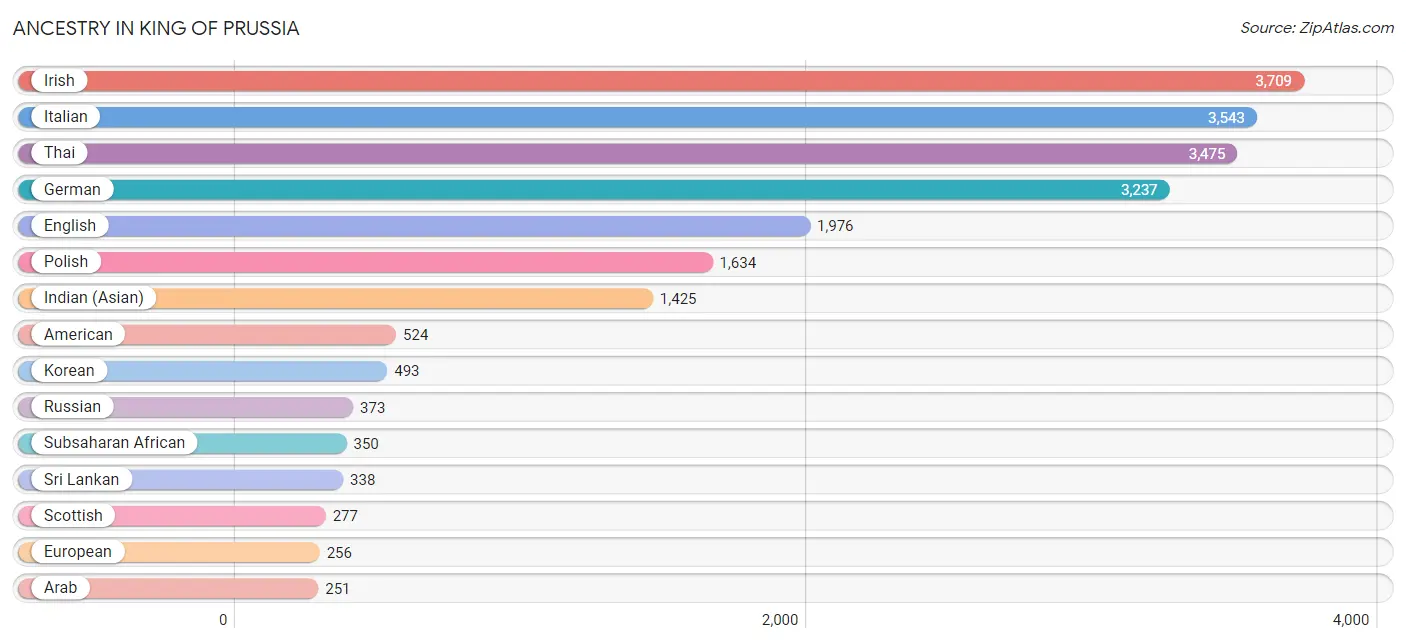
Ancestry in King Of Prussia
The most populous ancestries reported in King Of Prussia are Irish (3,709 | 15.2%), Italian (3,543 | 14.5%), Thai (3,475 | 14.2%), German (3,237 | 13.3%), and English (1,976 | 8.1%), together accounting for 65.3% of all King Of Prussia residents.
| Ancestry | # Population | % Population |
| African | 203 | 0.8% |
| American | 524 | 2.1% |
| Arab | 251 | 1.0% |
| Armenian | 81 | 0.3% |
| Austrian | 136 | 0.6% |
| Bahamian | 33 | 0.1% |
| Barbadian | 10 | 0.0% |
| Belgian | 25 | 0.1% |
| Bhutanese | 113 | 0.5% |
| Brazilian | 70 | 0.3% |
| British | 133 | 0.5% |
| Bulgarian | 24 | 0.1% |
| Burmese | 201 | 0.8% |
| Cambodian | 14 | 0.1% |
| Canadian | 34 | 0.1% |
| Central American | 74 | 0.3% |
| Central American Indian | 28 | 0.1% |
| Cherokee | 71 | 0.3% |
| Chilean | 5 | 0.0% |
| Chippewa | 9 | 0.0% |
| Choctaw | 16 | 0.1% |
| Colombian | 30 | 0.1% |
| Croatian | 32 | 0.1% |
| Cuban | 39 | 0.2% |
| Czech | 94 | 0.4% |
| Czechoslovakian | 20 | 0.1% |
| Danish | 107 | 0.4% |
| Dominican | 53 | 0.2% |
| Dutch | 100 | 0.4% |
| Dutch West Indian | 15 | 0.1% |
| Eastern European | 109 | 0.4% |
| Ecuadorian | 42 | 0.2% |
| Egyptian | 45 | 0.2% |
| English | 1,976 | 8.1% |
| Ethiopian | 76 | 0.3% |
| European | 256 | 1.1% |
| Filipino | 37 | 0.2% |
| Finnish | 36 | 0.2% |
| French | 176 | 0.7% |
| French Canadian | 43 | 0.2% |
| German | 3,237 | 13.3% |
| Ghanaian | 38 | 0.2% |
| Greek | 174 | 0.7% |
| Guamanian / Chamorro | 46 | 0.2% |
| Guatemalan | 34 | 0.1% |
| Haitian | 45 | 0.2% |
| Honduran | 40 | 0.2% |
| Hungarian | 117 | 0.5% |
| Indian (Asian) | 1,425 | 5.8% |
| Iranian | 97 | 0.4% |
| Irish | 3,709 | 15.2% |
| Israeli | 65 | 0.3% |
| Italian | 3,543 | 14.5% |
| Jamaican | 213 | 0.9% |
| Japanese | 89 | 0.4% |
| Kenyan | 17 | 0.1% |
| Korean | 493 | 2.0% |
| Latvian | 17 | 0.1% |
| Lebanese | 68 | 0.3% |
| Liberian | 16 | 0.1% |
| Lithuanian | 144 | 0.6% |
| Mexican | 208 | 0.9% |
| Moroccan | 15 | 0.1% |
| Native Hawaiian | 69 | 0.3% |
| Nigerian | 10 | 0.0% |
| Northern European | 18 | 0.1% |
| Norwegian | 176 | 0.7% |
| Pennsylvania German | 20 | 0.1% |
| Peruvian | 31 | 0.1% |
| Polish | 1,634 | 6.7% |
| Portuguese | 108 | 0.4% |
| Puerto Rican | 102 | 0.4% |
| Romanian | 82 | 0.3% |
| Russian | 373 | 1.5% |
| Scotch-Irish | 127 | 0.5% |
| Scottish | 277 | 1.1% |
| Slavic | 25 | 0.1% |
| Slovak | 78 | 0.3% |
| South American | 123 | 0.5% |
| Spaniard | 34 | 0.1% |
| Spanish | 61 | 0.3% |
| Sri Lankan | 338 | 1.4% |
| Subsaharan African | 350 | 1.4% |
| Swedish | 122 | 0.5% |
| Swiss | 37 | 0.2% |
| Syrian | 53 | 0.2% |
| Thai | 3,475 | 14.2% |
| Trinidadian and Tobagonian | 15 | 0.1% |
| Turkish | 46 | 0.2% |
| Ukrainian | 201 | 0.8% |
| Uruguayan | 15 | 0.1% |
| Welsh | 112 | 0.5% | View All 92 Rows |
Immigrants in King Of Prussia
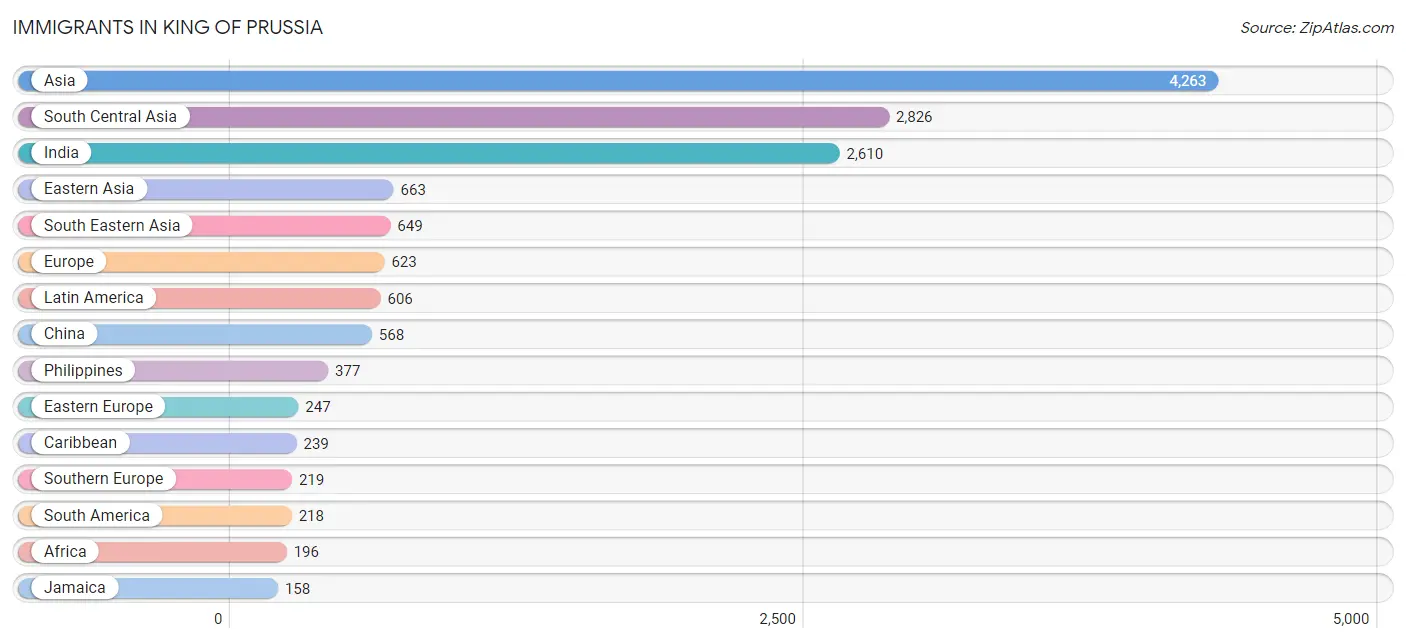
The most numerous immigrant groups reported in King Of Prussia came from Asia (4,263 | 17.4%), South Central Asia (2,826 | 11.6%), India (2,610 | 10.7%), Eastern Asia (663 | 2.7%), and South Eastern Asia (649 | 2.7%), together accounting for 45.1% of all King Of Prussia residents.
| Immigration Origin | # Population | % Population |
| Africa | 196 | 0.8% |
| Armenia | 12 | 0.1% |
| Asia | 4,263 | 17.4% |
| Bahamas | 17 | 0.1% |
| Belarus | 35 | 0.1% |
| Bolivia | 2 | 0.0% |
| Brazil | 57 | 0.2% |
| Bulgaria | 12 | 0.1% |
| Cambodia | 82 | 0.3% |
| Canada | 21 | 0.1% |
| Caribbean | 239 | 1.0% |
| Central America | 149 | 0.6% |
| Chile | 41 | 0.2% |
| China | 568 | 2.3% |
| Colombia | 30 | 0.1% |
| Cuba | 6 | 0.0% |
| Czechoslovakia | 6 | 0.0% |
| Denmark | 13 | 0.1% |
| Dominican Republic | 22 | 0.1% |
| Eastern Africa | 33 | 0.1% |
| Eastern Asia | 663 | 2.7% |
| Eastern Europe | 247 | 1.0% |
| Ecuador | 42 | 0.2% |
| Egypt | 7 | 0.0% |
| England | 12 | 0.1% |
| Europe | 623 | 2.5% |
| France | 53 | 0.2% |
| Germany | 4 | 0.0% |
| Ghana | 7 | 0.0% |
| Greece | 60 | 0.3% |
| Guatemala | 34 | 0.1% |
| Haiti | 21 | 0.1% |
| Honduras | 38 | 0.2% |
| Hong Kong | 6 | 0.0% |
| India | 2,610 | 10.7% |
| Indonesia | 9 | 0.0% |
| Iran | 89 | 0.4% |
| Israel | 32 | 0.1% |
| Italy | 73 | 0.3% |
| Jamaica | 158 | 0.6% |
| Japan | 9 | 0.0% |
| Kenya | 33 | 0.1% |
| Korea | 86 | 0.4% |
| Latin America | 606 | 2.5% |
| Lebanon | 31 | 0.1% |
| Lithuania | 25 | 0.1% |
| Mexico | 52 | 0.2% |
| Moldova | 11 | 0.1% |
| Morocco | 5 | 0.0% |
| Nepal | 95 | 0.4% |
| Northern Africa | 42 | 0.2% |
| Northern Europe | 89 | 0.4% |
| Pakistan | 32 | 0.1% |
| Panama | 25 | 0.1% |
| Peru | 31 | 0.1% |
| Philippines | 377 | 1.5% |
| Poland | 58 | 0.2% |
| Portugal | 51 | 0.2% |
| Russia | 74 | 0.3% |
| South America | 218 | 0.9% |
| South Central Asia | 2,826 | 11.6% |
| South Eastern Asia | 649 | 2.7% |
| Southern Europe | 219 | 0.9% |
| Spain | 15 | 0.1% |
| Sweden | 17 | 0.1% |
| Syria | 18 | 0.1% |
| Taiwan | 90 | 0.4% |
| Trinidad and Tobago | 15 | 0.1% |
| Turkey | 24 | 0.1% |
| Ukraine | 26 | 0.1% |
| Uruguay | 15 | 0.1% |
| Vietnam | 157 | 0.6% |
| Western Africa | 7 | 0.0% |
| Western Asia | 117 | 0.5% |
| Western Europe | 57 | 0.2% | View All 75 Rows |
Sex and Age in King Of Prussia
Sex and Age in King Of Prussia
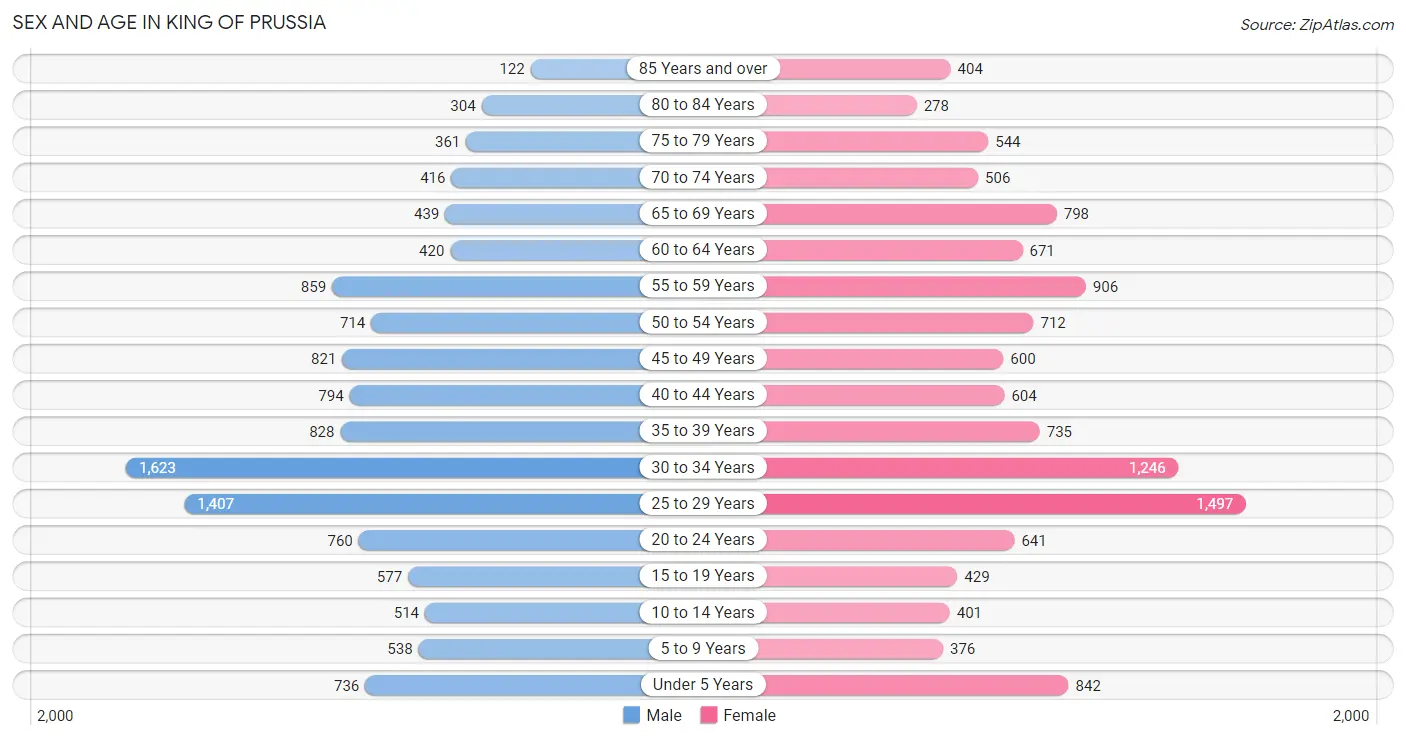
The most populous age groups in King Of Prussia are 30 to 34 Years (1,623 | 13.3%) for men and 25 to 29 Years (1,497 | 12.3%) for women.
| Age Bracket | Male | Female |
| Under 5 Years | 736 (6.0%) | 842 (6.9%) |
| 5 to 9 Years | 538 (4.4%) | 376 (3.1%) |
| 10 to 14 Years | 514 (4.2%) | 401 (3.3%) |
| 15 to 19 Years | 577 (4.7%) | 429 (3.5%) |
| 20 to 24 Years | 760 (6.2%) | 641 (5.3%) |
| 25 to 29 Years | 1,407 (11.5%) | 1,497 (12.3%) |
| 30 to 34 Years | 1,623 (13.3%) | 1,246 (10.2%) |
| 35 to 39 Years | 828 (6.8%) | 735 (6.0%) |
| 40 to 44 Years | 794 (6.5%) | 604 (5.0%) |
| 45 to 49 Years | 821 (6.7%) | 600 (4.9%) |
| 50 to 54 Years | 714 (5.8%) | 712 (5.8%) |
| 55 to 59 Years | 859 (7.0%) | 906 (7.4%) |
| 60 to 64 Years | 420 (3.4%) | 671 (5.5%) |
| 65 to 69 Years | 439 (3.6%) | 798 (6.6%) |
| 70 to 74 Years | 416 (3.4%) | 506 (4.2%) |
| 75 to 79 Years | 361 (2.9%) | 544 (4.5%) |
| 80 to 84 Years | 304 (2.5%) | 278 (2.3%) |
| 85 Years and over | 122 (1.0%) | 404 (3.3%) |
| Total | 12,233 (100.0%) | 12,190 (100.0%) |
Families and Households in King Of Prussia
Median Family Size in King Of Prussia
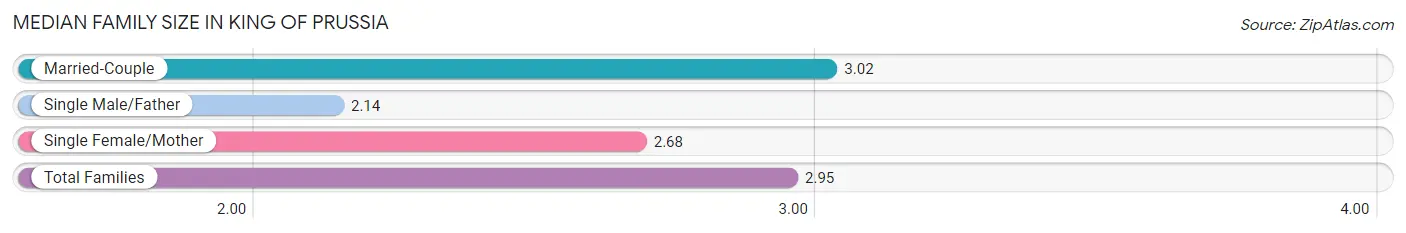
The median family size in King Of Prussia is 2.95 persons per family, with married-couple families (5,214 | 84.5%) accounting for the largest median family size of 3.02 persons per family. On the other hand, single male/father families (194 | 3.1%) represent the smallest median family size with 2.14 persons per family.
| Family Type | # Families | Family Size |
| Married-Couple | 5,214 (84.5%) | 3.02 |
| Single Male/Father | 194 (3.1%) | 2.14 |
| Single Female/Mother | 765 (12.4%) | 2.68 |
| Total Families | 6,173 (100.0%) | 2.95 |
Median Household Size in King Of Prussia
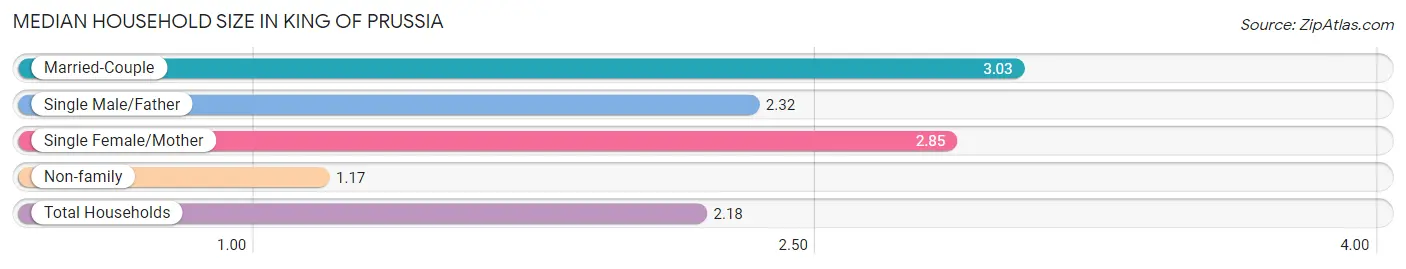
The median household size in King Of Prussia is 2.18 persons per household, with married-couple households (5,214 | 46.7%) accounting for the largest median household size of 3.03 persons per household. non-family households (4,991 | 44.7%) represent the smallest median household size with 1.17 persons per household.
| Household Type | # Households | Household Size |
| Married-Couple | 5,214 (46.7%) | 3.03 |
| Single Male/Father | 194 (1.7%) | 2.32 |
| Single Female/Mother | 765 (6.9%) | 2.85 |
| Non-family | 4,991 (44.7%) | 1.17 |
| Total Households | 11,164 (100.0%) | 2.18 |
Household Size by Marriage Status in King Of Prussia
Out of a total of 11,164 households in King Of Prussia, 6,173 (55.3%) are family households, while 4,991 (44.7%) are nonfamily households. The most numerous type of family households are 2-person households, comprising 2,839, and the most common type of nonfamily households are 1-person households, comprising 4,167.
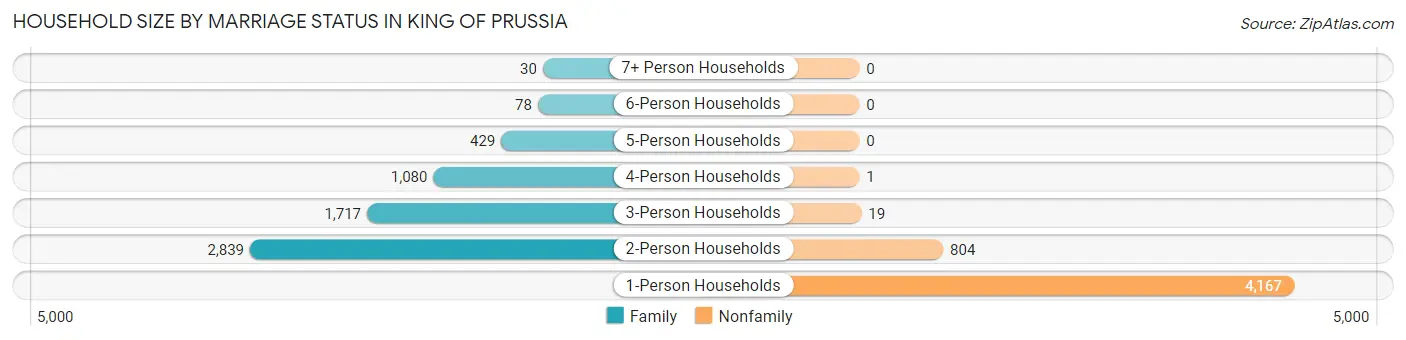
| Household Size | Family Households | Nonfamily Households |
| 1-Person Households | - | 4,167 (37.3%) |
| 2-Person Households | 2,839 (25.4%) | 804 (7.2%) |
| 3-Person Households | 1,717 (15.4%) | 19 (0.2%) |
| 4-Person Households | 1,080 (9.7%) | 1 (0.0%) |
| 5-Person Households | 429 (3.8%) | 0 (0.0%) |
| 6-Person Households | 78 (0.7%) | 0 (0.0%) |
| 7+ Person Households | 30 (0.3%) | 0 (0.0%) |
| Total | 6,173 (55.3%) | 4,991 (44.7%) |
Female Fertility in King Of Prussia
Fertility by Age in King Of Prussia
Average fertility rate in King Of Prussia is 76.0 births per 1,000 women. Women in the age bracket of 20 to 34 years have the highest fertility rate with 113.0 births per 1,000 women. Women in the age bracket of 20 to 34 years acount for 86.1% of all women with births.
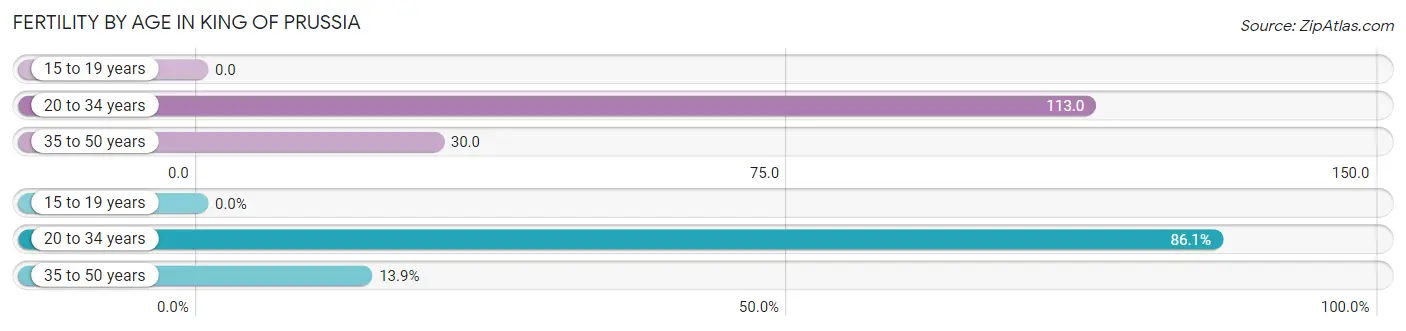
| Age Bracket | Women with Births | Births / 1,000 Women |
| 15 to 19 years | 0 (0.0%) | 0.0 |
| 20 to 34 years | 383 (86.1%) | 113.0 |
| 35 to 50 years | 62 (13.9%) | 30.0 |
| Total | 445 (100.0%) | 76.0 |
Fertility by Age by Marriage Status in King Of Prussia
97.3% of women with births (445) in King Of Prussia are married. The highest percentage of unmarried women with births falls into 35 to 50 years age bracket with 19.4% of them unmarried at the time of birth, while the lowest percentage of unmarried women with births belong to 20 to 34 years age bracket with 0.0% of them unmarried.
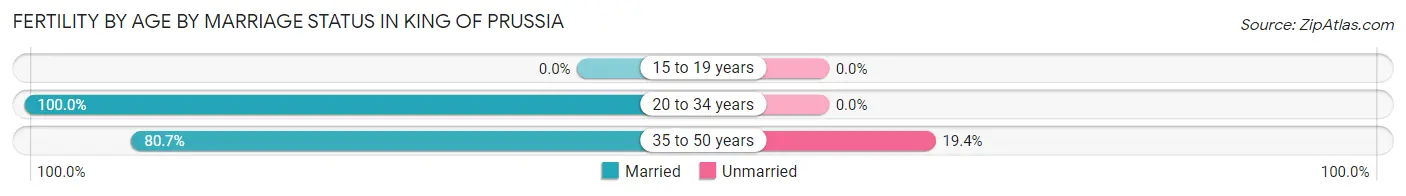
| Age Bracket | Married | Unmarried |
| 15 to 19 years | 0 (0.0%) | 0 (0.0%) |
| 20 to 34 years | 383 (100.0%) | 0 (0.0%) |
| 35 to 50 years | 50 (80.6%) | 12 (19.4%) |
| Total | 433 (97.3%) | 12 (2.7%) |
Fertility by Education in King Of Prussia
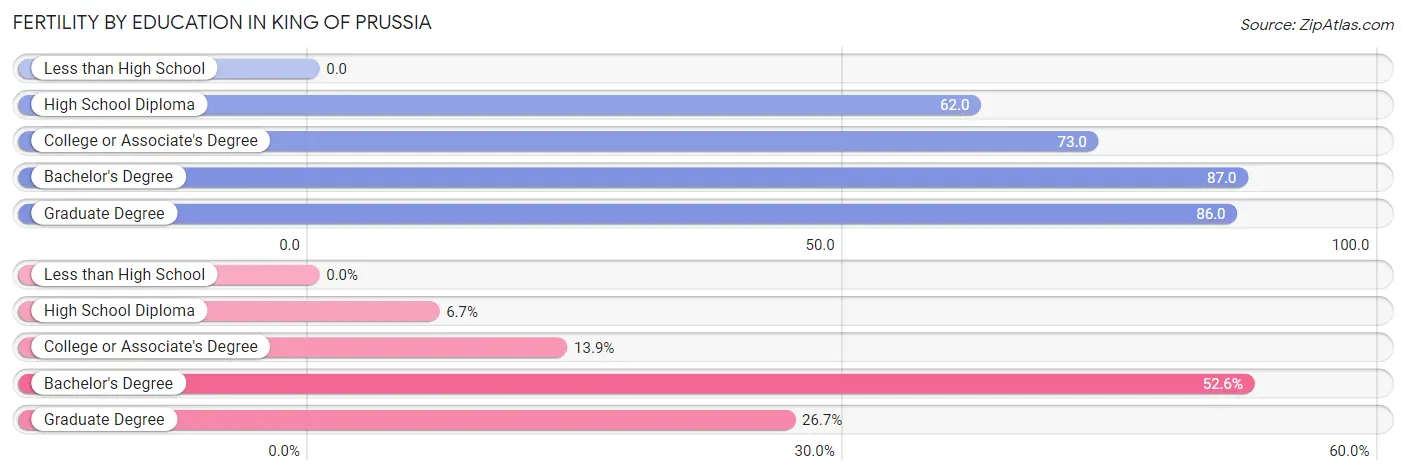
| Educational Attainment | Women with Births | Births / 1,000 Women |
| Less than High School | 0 (0.0%) | 0.0 |
| High School Diploma | 30 (6.7%) | 62.0 |
| College or Associate's Degree | 62 (13.9%) | 73.0 |
| Bachelor's Degree | 234 (52.6%) | 87.0 |
| Graduate Degree | 119 (26.7%) | 86.0 |
| Total | 445 (100.0%) | 76.0 |
Fertility by Education by Marriage Status in King Of Prussia
2.7% of women with births in King Of Prussia are unmarried. Women with the educational attainment of high school diploma are most likely to be married with 100.0% of them married at childbirth, while women with the educational attainment of bachelor's degree are least likely to be married with 5.1% of them unmarried at childbirth.
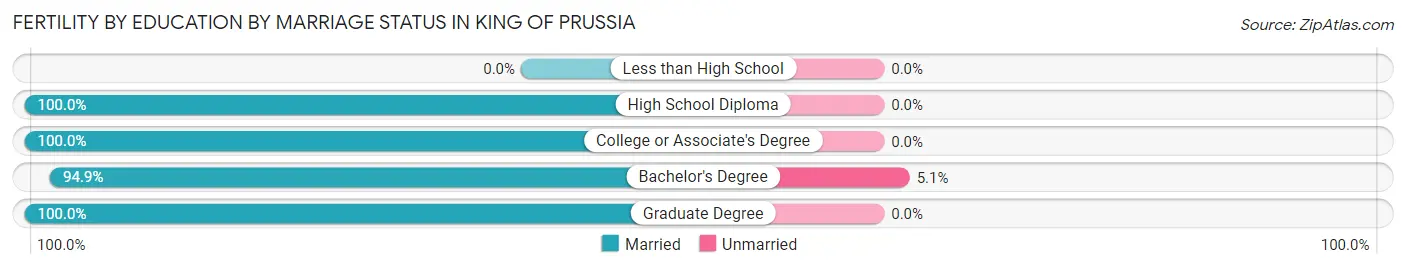
| Educational Attainment | Married | Unmarried |
| Less than High School | 0 (0.0%) | 0 (0.0%) |
| High School Diploma | 30 (100.0%) | 0 (0.0%) |
| College or Associate's Degree | 62 (100.0%) | 0 (0.0%) |
| Bachelor's Degree | 222 (94.9%) | 12 (5.1%) |
| Graduate Degree | 119 (100.0%) | 0 (0.0%) |
| Total | 433 (97.3%) | 12 (2.7%) |
Employment Characteristics in King Of Prussia
Employment by Class of Employer in King Of Prussia
Among the 14,139 employed individuals in King Of Prussia, private company employees (10,265 | 72.6%), not-for-profit organizations (2,084 | 14.7%), and local government employees (528 | 3.7%) make up the most common classes of employment.
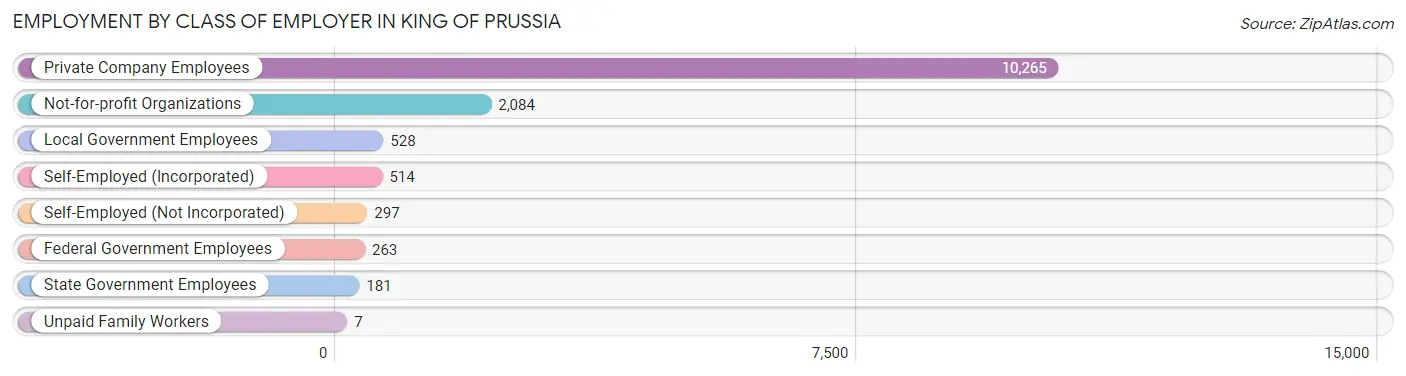
| Employer Class | # Employees | % Employees |
| Private Company Employees | 10,265 | 72.6% |
| Self-Employed (Incorporated) | 514 | 3.6% |
| Self-Employed (Not Incorporated) | 297 | 2.1% |
| Not-for-profit Organizations | 2,084 | 14.7% |
| Local Government Employees | 528 | 3.7% |
| State Government Employees | 181 | 1.3% |
| Federal Government Employees | 263 | 1.9% |
| Unpaid Family Workers | 7 | 0.1% |
| Total | 14,139 | 100.0% |
Employment Status by Age in King Of Prussia
According to the labor force statistics for King Of Prussia, out of the total population over 16 years of age (20,741), 73.0% or 15,141 individuals are in the labor force, with 5.4% or 818 of them unemployed. The age group with the highest labor force participation rate is 45 to 54 years, with 92.3% or 2,628 individuals in the labor force. Within the labor force, the 55 to 59 years age range has the highest percentage of unemployed individuals, with 21.9% or 350 of them being unemployed.
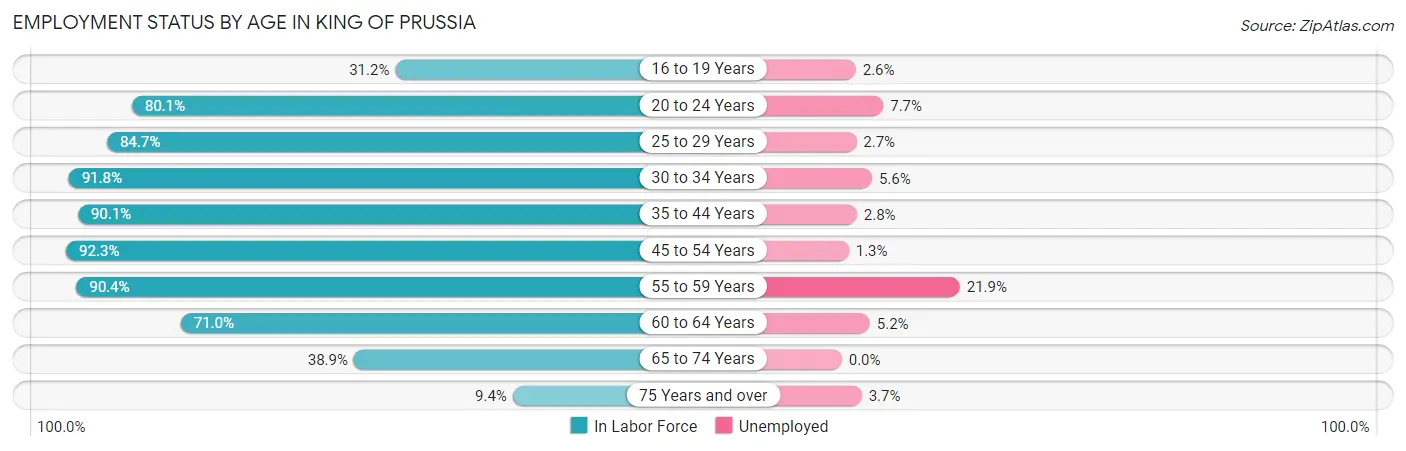
| Age Bracket | In Labor Force | Unemployed |
| 16 to 19 Years | 228 (31.2%) | 6 (2.6%) |
| 20 to 24 Years | 1,122 (80.1%) | 86 (7.7%) |
| 25 to 29 Years | 2,460 (84.7%) | 66 (2.7%) |
| 30 to 34 Years | 2,634 (91.8%) | 148 (5.6%) |
| 35 to 44 Years | 2,668 (90.1%) | 75 (2.8%) |
| 45 to 54 Years | 2,628 (92.3%) | 34 (1.3%) |
| 55 to 59 Years | 1,596 (90.4%) | 350 (21.9%) |
| 60 to 64 Years | 775 (71.0%) | 40 (5.2%) |
| 65 to 74 Years | 840 (38.9%) | 0 (0.0%) |
| 75 Years and over | 189 (9.4%) | 7 (3.7%) |
| Total | 15,141 (73.0%) | 818 (5.4%) |
Employment Status by Educational Attainment in King Of Prussia
According to labor force statistics for King Of Prussia, 88.4% of individuals (12,762) out of the total population between 25 and 64 years of age (14,437) are in the labor force, with 5.6% or 715 of them being unemployed. The group with the highest labor force participation rate are those with the educational attainment of bachelor's degree or higher, with 89.8% or 9,191 individuals in the labor force. Within the labor force, individuals with college / associate degree education have the highest percentage of unemployment, with 12.8% or 256 of them being unemployed.
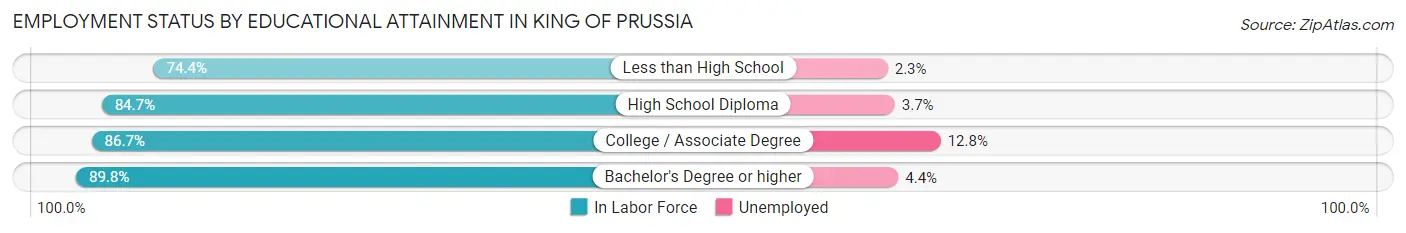
| Educational Attainment | In Labor Force | Unemployed |
| Less than High School | 258 (74.4%) | 8 (2.3%) |
| High School Diploma | 1,309 (84.7%) | 57 (3.7%) |
| College / Associate Degree | 2,003 (86.7%) | 296 (12.8%) |
| Bachelor's Degree or higher | 9,191 (89.8%) | 450 (4.4%) |
| Total | 12,762 (88.4%) | 808 (5.6%) |
Employment Occupations by Sex in King Of Prussia
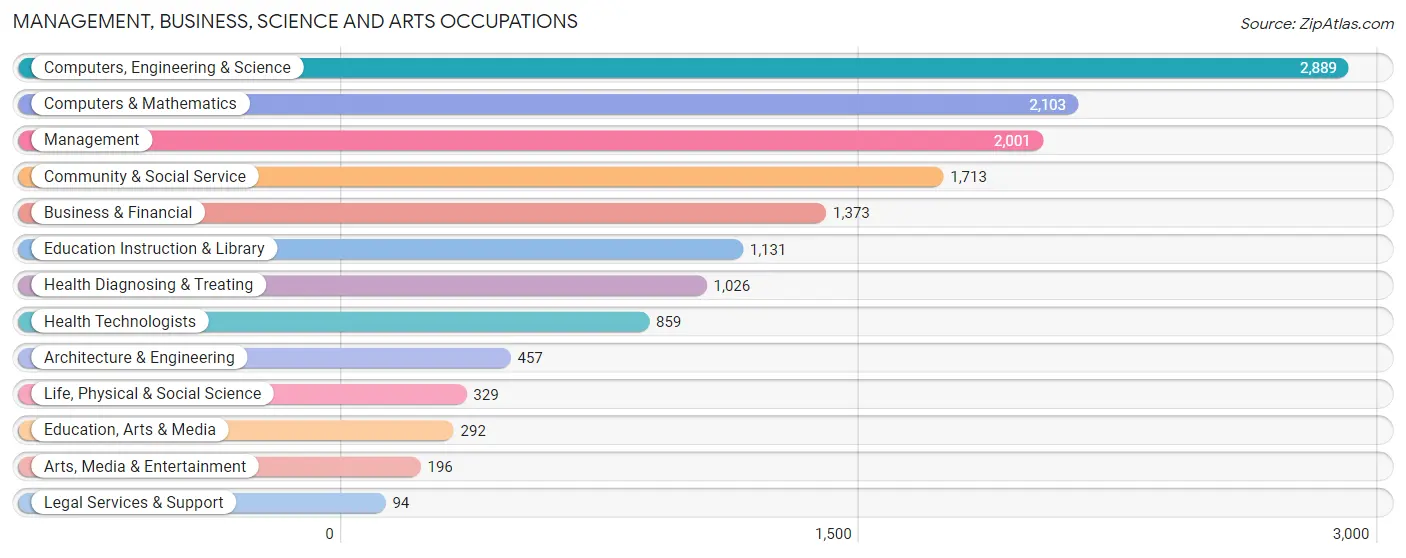
Management, Business, Science and Arts Occupations
The most common Management, Business, Science and Arts occupations in King Of Prussia are Computers, Engineering & Science (2,889 | 20.3%), Computers & Mathematics (2,103 | 14.7%), Management (2,001 | 14.0%), Community & Social Service (1,713 | 12.0%), and Business & Financial (1,373 | 9.6%).
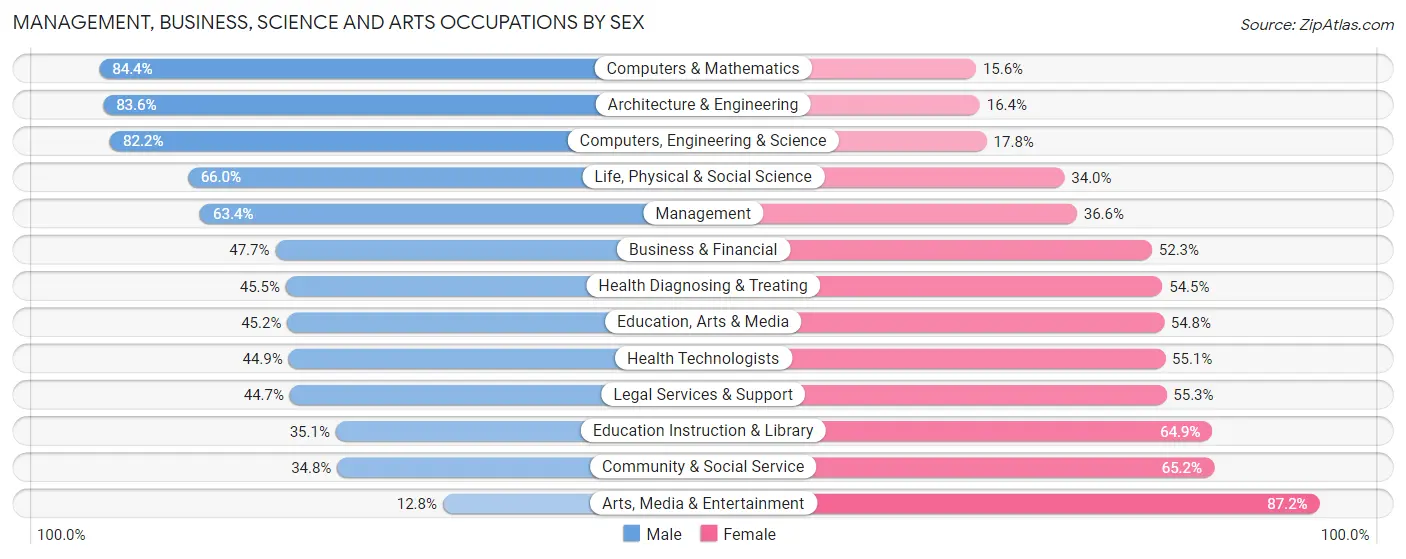
Management, Business, Science and Arts Occupations by Sex
Within the Management, Business, Science and Arts occupations in King Of Prussia, the most male-oriented occupations are Computers & Mathematics (84.4%), Architecture & Engineering (83.6%), and Computers, Engineering & Science (82.2%), while the most female-oriented occupations are Arts, Media & Entertainment (87.2%), Community & Social Service (65.2%), and Education Instruction & Library (64.9%).
| Occupation | Male | Female |
| Management | 1,268 (63.4%) | 733 (36.6%) |
| Business & Financial | 655 (47.7%) | 718 (52.3%) |
| Computers, Engineering & Science | 2,374 (82.2%) | 515 (17.8%) |
| Computers & Mathematics | 1,775 (84.4%) | 328 (15.6%) |
| Architecture & Engineering | 382 (83.6%) | 75 (16.4%) |
| Life, Physical & Social Science | 217 (66.0%) | 112 (34.0%) |
| Community & Social Service | 596 (34.8%) | 1,117 (65.2%) |
| Education, Arts & Media | 132 (45.2%) | 160 (54.8%) |
| Legal Services & Support | 42 (44.7%) | 52 (55.3%) |
| Education Instruction & Library | 397 (35.1%) | 734 (64.9%) |
| Arts, Media & Entertainment | 25 (12.8%) | 171 (87.2%) |
| Health Diagnosing & Treating | 467 (45.5%) | 559 (54.5%) |
| Health Technologists | 386 (44.9%) | 473 (55.1%) |
| Total (Category) | 5,360 (59.5%) | 3,642 (40.5%) |
| Total (Overall) | 7,886 (55.3%) | 6,374 (44.7%) |
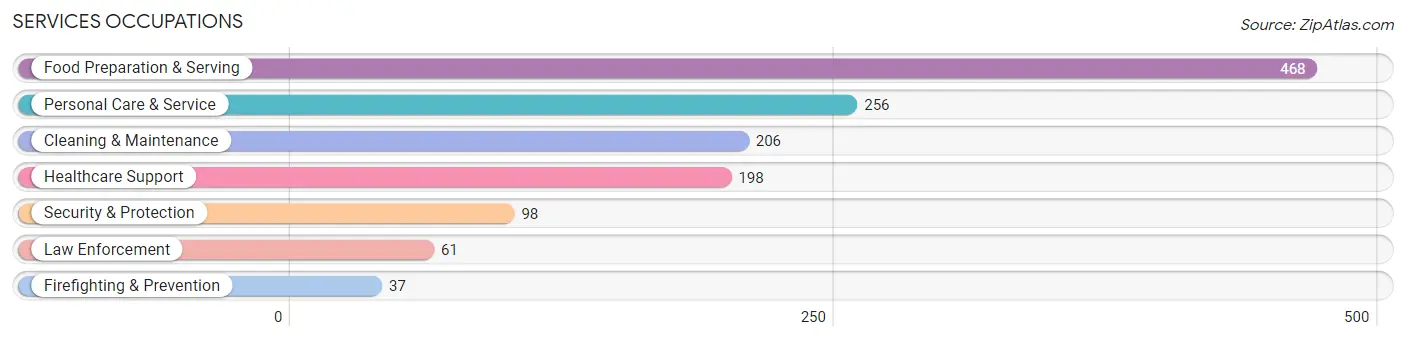
Services Occupations
The most common Services occupations in King Of Prussia are Food Preparation & Serving (468 | 3.3%), Personal Care & Service (256 | 1.8%), Cleaning & Maintenance (206 | 1.4%), Healthcare Support (198 | 1.4%), and Security & Protection (98 | 0.7%).
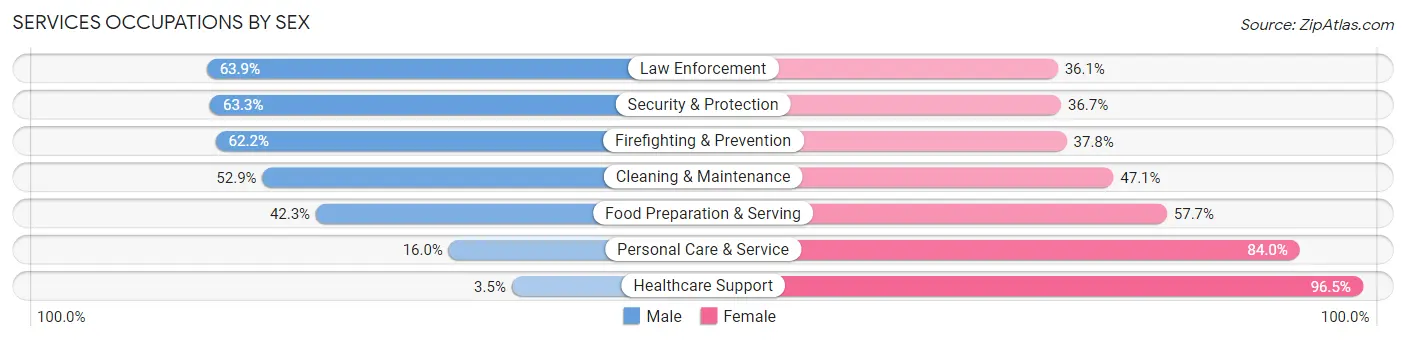
Services Occupations by Sex
Within the Services occupations in King Of Prussia, the most male-oriented occupations are Law Enforcement (63.9%), Security & Protection (63.3%), and Firefighting & Prevention (62.2%), while the most female-oriented occupations are Healthcare Support (96.5%), Personal Care & Service (84.0%), and Food Preparation & Serving (57.7%).
| Occupation | Male | Female |
| Healthcare Support | 7 (3.5%) | 191 (96.5%) |
| Security & Protection | 62 (63.3%) | 36 (36.7%) |
| Firefighting & Prevention | 23 (62.2%) | 14 (37.8%) |
| Law Enforcement | 39 (63.9%) | 22 (36.1%) |
| Food Preparation & Serving | 198 (42.3%) | 270 (57.7%) |
| Cleaning & Maintenance | 109 (52.9%) | 97 (47.1%) |
| Personal Care & Service | 41 (16.0%) | 215 (84.0%) |
| Total (Category) | 417 (34.0%) | 809 (66.0%) |
| Total (Overall) | 7,886 (55.3%) | 6,374 (44.7%) |
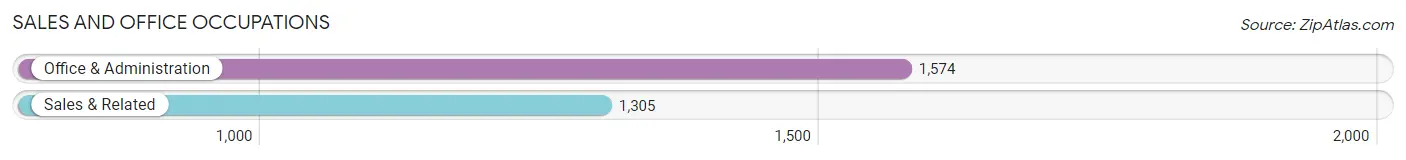
Sales and Office Occupations
The most common Sales and Office occupations in King Of Prussia are Office & Administration (1,574 | 11.0%), and Sales & Related (1,305 | 9.1%).
Sales and Office Occupations by Sex
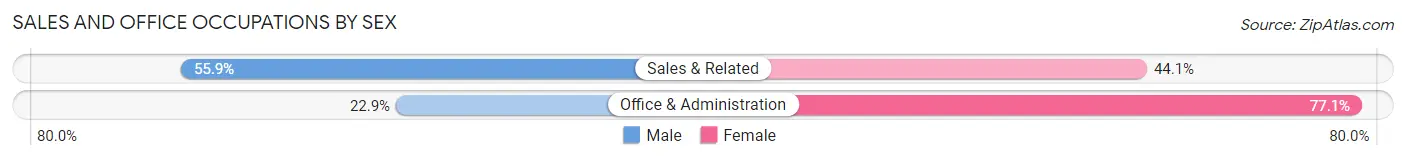
| Occupation | Male | Female |
| Sales & Related | 730 (55.9%) | 575 (44.1%) |
| Office & Administration | 360 (22.9%) | 1,214 (77.1%) |
| Total (Category) | 1,090 (37.9%) | 1,789 (62.1%) |
| Total (Overall) | 7,886 (55.3%) | 6,374 (44.7%) |
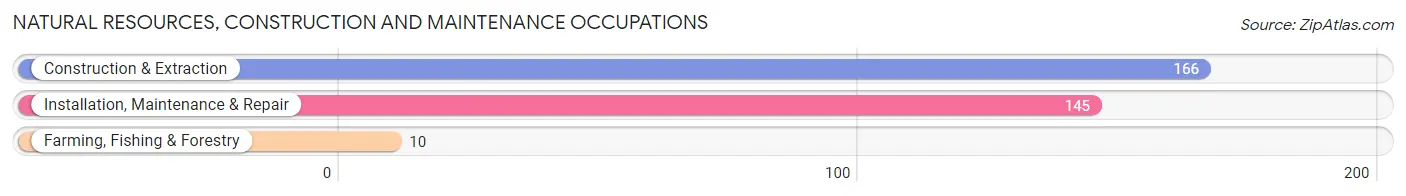
Natural Resources, Construction and Maintenance Occupations
The most common Natural Resources, Construction and Maintenance occupations in King Of Prussia are Construction & Extraction (166 | 1.2%), Installation, Maintenance & Repair (145 | 1.0%), and Farming, Fishing & Forestry (10 | 0.1%).
Natural Resources, Construction and Maintenance Occupations by Sex
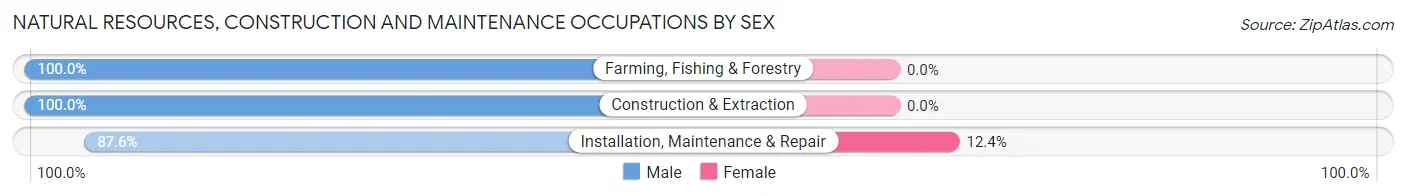
| Occupation | Male | Female |
| Farming, Fishing & Forestry | 10 (100.0%) | 0 (0.0%) |
| Construction & Extraction | 166 (100.0%) | 0 (0.0%) |
| Installation, Maintenance & Repair | 127 (87.6%) | 18 (12.4%) |
| Total (Category) | 303 (94.4%) | 18 (5.6%) |
| Total (Overall) | 7,886 (55.3%) | 6,374 (44.7%) |
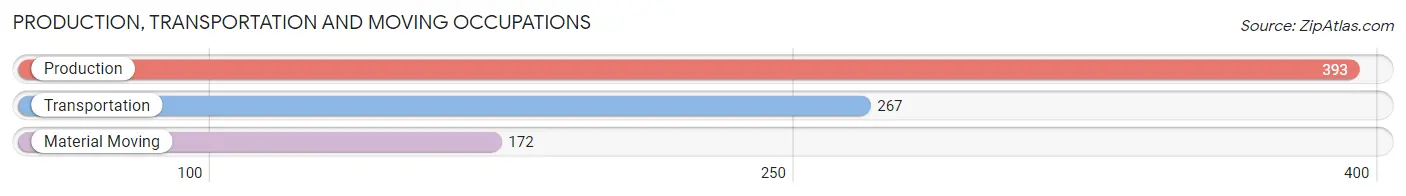
Production, Transportation and Moving Occupations
The most common Production, Transportation and Moving occupations in King Of Prussia are Production (393 | 2.8%), Transportation (267 | 1.9%), and Material Moving (172 | 1.2%).
Production, Transportation and Moving Occupations by Sex
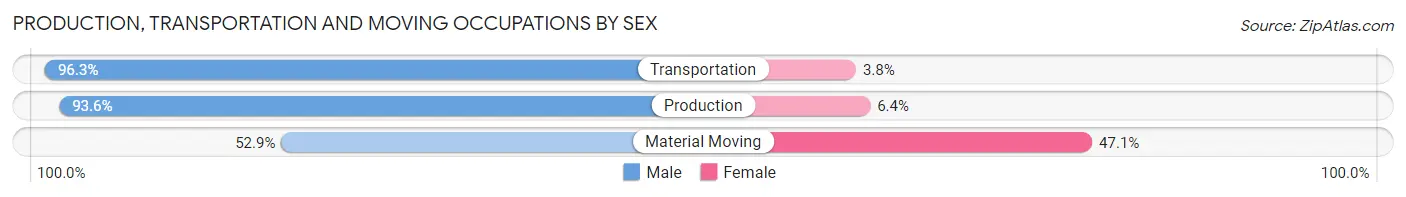
| Occupation | Male | Female |
| Production | 368 (93.6%) | 25 (6.4%) |
| Transportation | 257 (96.3%) | 10 (3.7%) |
| Material Moving | 91 (52.9%) | 81 (47.1%) |
| Total (Category) | 716 (86.1%) | 116 (13.9%) |
| Total (Overall) | 7,886 (55.3%) | 6,374 (44.7%) |
Employment Industries by Sex in King Of Prussia
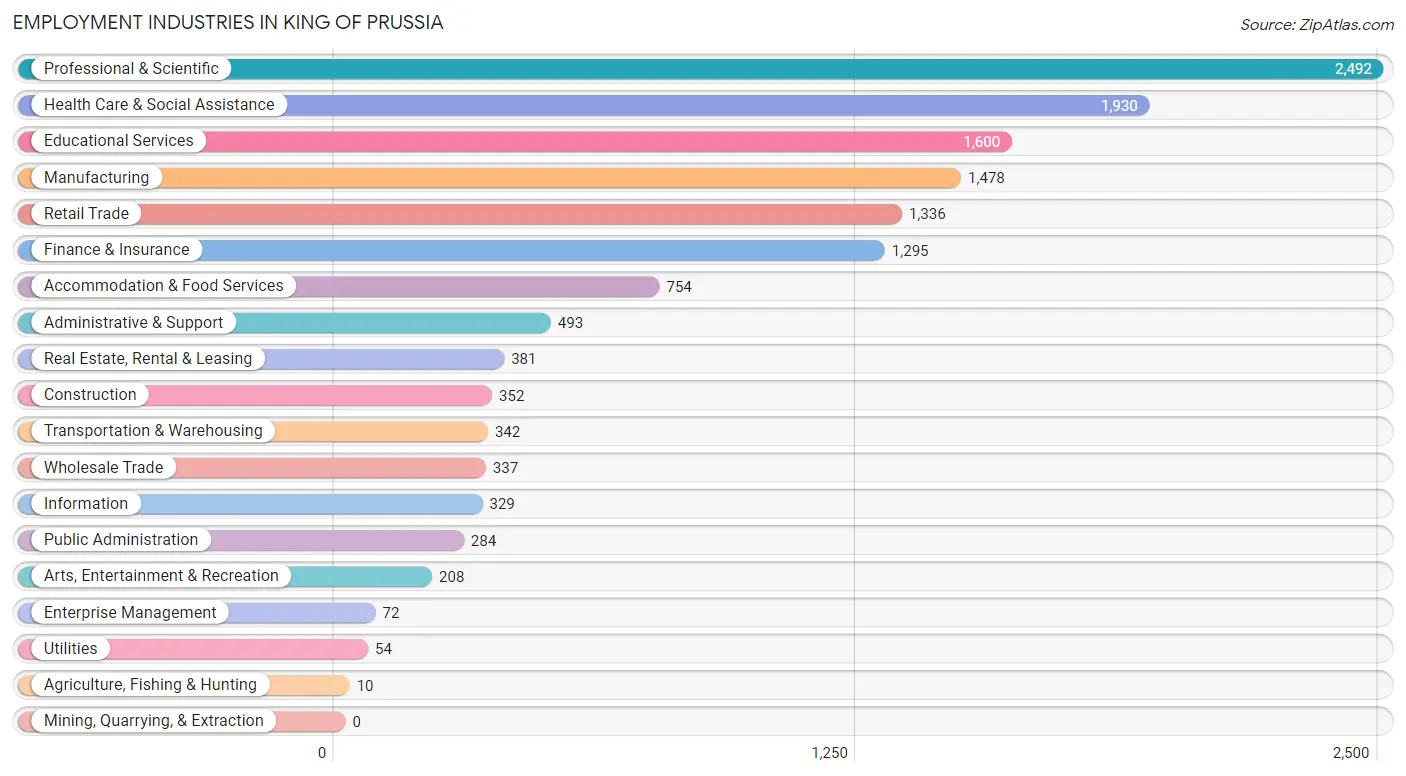
Employment Industries in King Of Prussia
The major employment industries in King Of Prussia include Professional & Scientific (2,492 | 17.5%), Health Care & Social Assistance (1,930 | 13.5%), Educational Services (1,600 | 11.2%), Manufacturing (1,478 | 10.4%), and Retail Trade (1,336 | 9.4%).
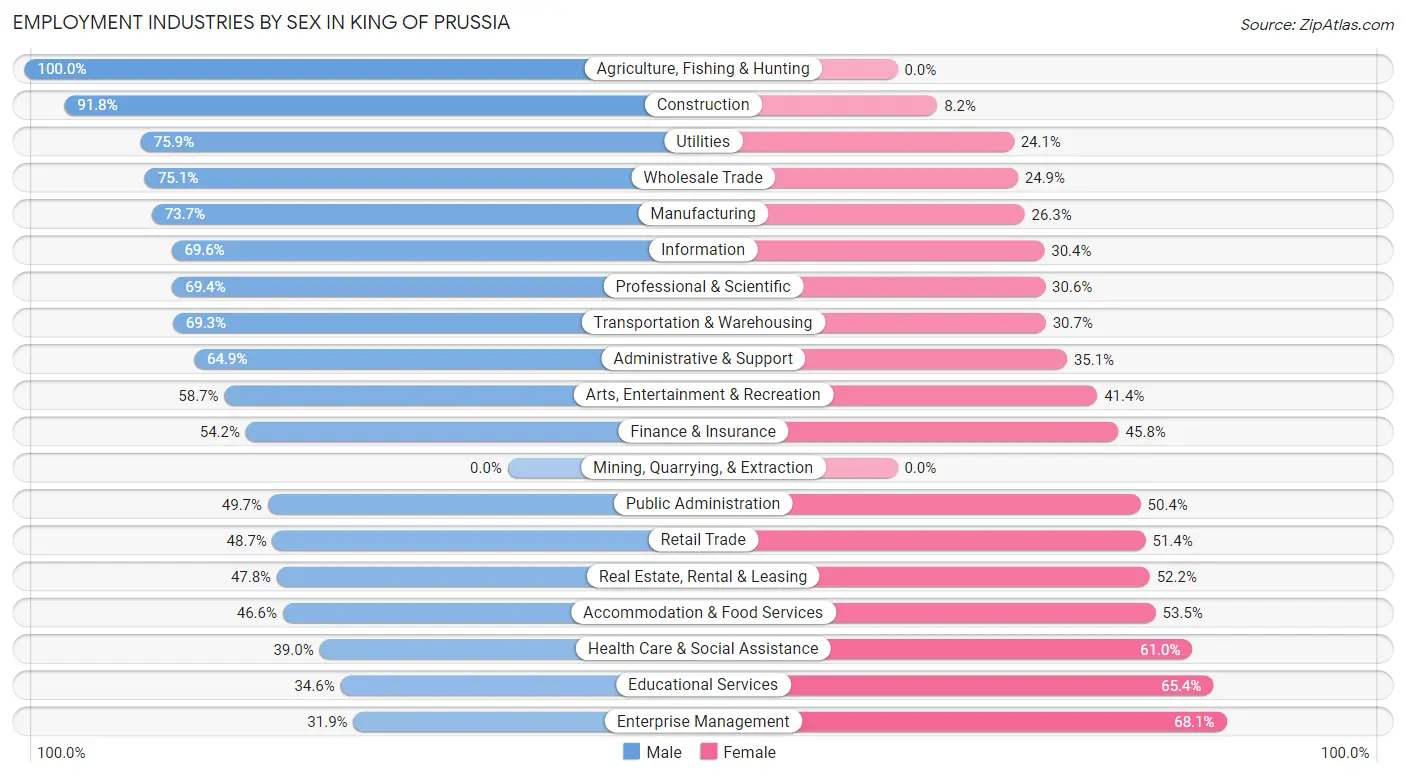
Employment Industries by Sex in King Of Prussia
The King Of Prussia industries that see more men than women are Agriculture, Fishing & Hunting (100.0%), Construction (91.8%), and Utilities (75.9%), whereas the industries that tend to have a higher number of women are Enterprise Management (68.1%), Educational Services (65.4%), and Health Care & Social Assistance (61.0%).
| Industry | Male | Female |
| Agriculture, Fishing & Hunting | 10 (100.0%) | 0 (0.0%) |
| Mining, Quarrying, & Extraction | 0 (0.0%) | 0 (0.0%) |
| Construction | 323 (91.8%) | 29 (8.2%) |
| Manufacturing | 1,089 (73.7%) | 389 (26.3%) |
| Wholesale Trade | 253 (75.1%) | 84 (24.9%) |
| Retail Trade | 650 (48.6%) | 686 (51.3%) |
| Transportation & Warehousing | 237 (69.3%) | 105 (30.7%) |
| Utilities | 41 (75.9%) | 13 (24.1%) |
| Information | 229 (69.6%) | 100 (30.4%) |
| Finance & Insurance | 702 (54.2%) | 593 (45.8%) |
| Real Estate, Rental & Leasing | 182 (47.8%) | 199 (52.2%) |
| Professional & Scientific | 1,730 (69.4%) | 762 (30.6%) |
| Enterprise Management | 23 (31.9%) | 49 (68.1%) |
| Administrative & Support | 320 (64.9%) | 173 (35.1%) |
| Educational Services | 554 (34.6%) | 1,046 (65.4%) |
| Health Care & Social Assistance | 752 (39.0%) | 1,178 (61.0%) |
| Arts, Entertainment & Recreation | 122 (58.7%) | 86 (41.3%) |
| Accommodation & Food Services | 351 (46.6%) | 403 (53.4%) |
| Public Administration | 141 (49.6%) | 143 (50.3%) |
| Total | 7,886 (55.3%) | 6,374 (44.7%) |
Education in King Of Prussia
School Enrollment in King Of Prussia
The most common levels of schooling among the 4,418 students in King Of Prussia are high school (901 | 20.4%), graduate / professional (842 | 19.1%), and college / undergraduate (708 | 16.0%).
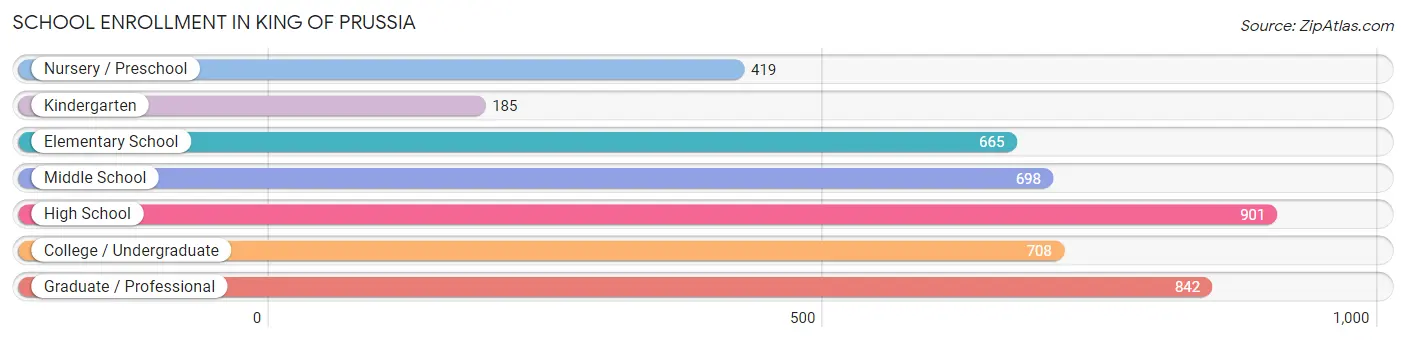
| School Level | # Students | % Students |
| Nursery / Preschool | 419 | 9.5% |
| Kindergarten | 185 | 4.2% |
| Elementary School | 665 | 15.0% |
| Middle School | 698 | 15.8% |
| High School | 901 | 20.4% |
| College / Undergraduate | 708 | 16.0% |
| Graduate / Professional | 842 | 19.1% |
| Total | 4,418 | 100.0% |
School Enrollment by Age by Funding Source in King Of Prussia
Out of a total of 4,418 students who are enrolled in schools in King Of Prussia, 1,515 (34.3%) attend a private institution, while the remaining 2,903 (65.7%) are enrolled in public schools. The age group of 3 to 4 year olds has the highest likelihood of being enrolled in private schools, with 282 (81.0% in the age bracket) enrolled. Conversely, the age group of 15 to 17 year olds has the lowest likelihood of being enrolled in a private school, with 573 (92.1% in the age bracket) attending a public institution.
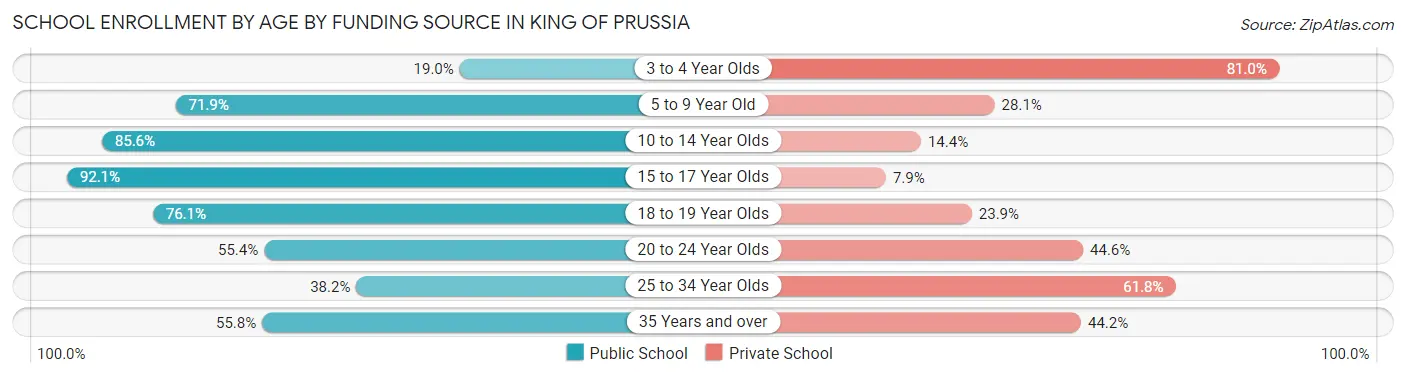
| Age Bracket | Public School | Private School |
| 3 to 4 Year Olds | 66 (19.0%) | 282 (81.0%) |
| 5 to 9 Year Old | 611 (71.9%) | 239 (28.1%) |
| 10 to 14 Year Olds | 731 (85.6%) | 123 (14.4%) |
| 15 to 17 Year Olds | 573 (92.1%) | 49 (7.9%) |
| 18 to 19 Year Olds | 255 (76.1%) | 80 (23.9%) |
| 20 to 24 Year Olds | 272 (55.4%) | 219 (44.6%) |
| 25 to 34 Year Olds | 255 (38.2%) | 412 (61.8%) |
| 35 Years and over | 140 (55.8%) | 111 (44.2%) |
| Total | 2,903 (65.7%) | 1,515 (34.3%) |
Educational Attainment by Field of Study in King Of Prussia
Business (2,714 | 20.7%), engineering (1,292 | 9.9%), science & technology (1,245 | 9.5%), computers & mathematics (1,092 | 8.3%), and education (968 | 7.4%) are the most common fields of study among 13,117 individuals in King Of Prussia who have obtained a bachelor's degree or higher.
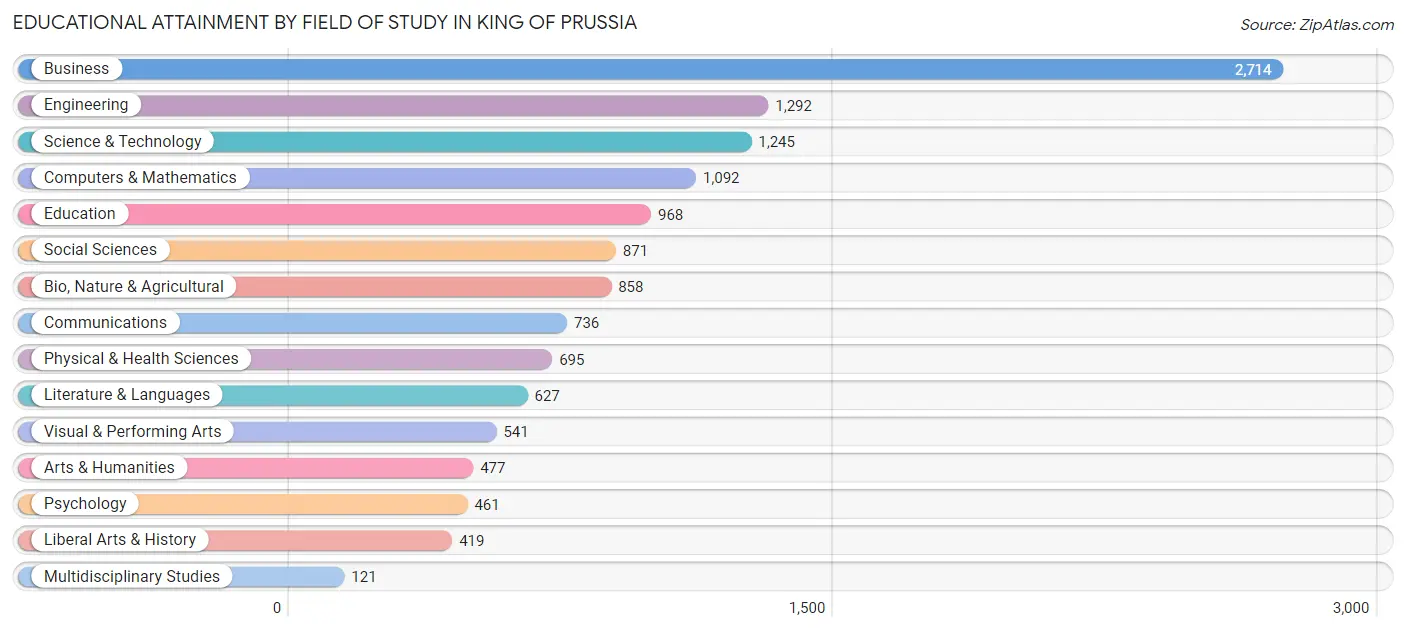
| Field of Study | # Graduates | % Graduates |
| Computers & Mathematics | 1,092 | 8.3% |
| Bio, Nature & Agricultural | 858 | 6.5% |
| Physical & Health Sciences | 695 | 5.3% |
| Psychology | 461 | 3.5% |
| Social Sciences | 871 | 6.6% |
| Engineering | 1,292 | 9.9% |
| Multidisciplinary Studies | 121 | 0.9% |
| Science & Technology | 1,245 | 9.5% |
| Business | 2,714 | 20.7% |
| Education | 968 | 7.4% |
| Literature & Languages | 627 | 4.8% |
| Liberal Arts & History | 419 | 3.2% |
| Visual & Performing Arts | 541 | 4.1% |
| Communications | 736 | 5.6% |
| Arts & Humanities | 477 | 3.6% |
| Total | 13,117 | 100.0% |
Transportation & Commute in King Of Prussia
Vehicle Availability by Sex in King Of Prussia
The most prevalent vehicle ownership categories in King Of Prussia are males with 2 vehicles (3,736, accounting for 47.4%) and females with 2 vehicles (3,012, making up 59.7%).
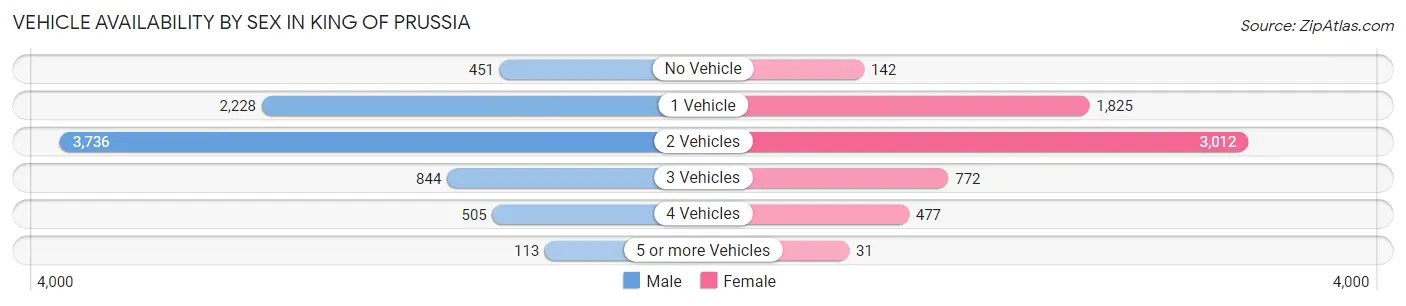
| Vehicles Available | Male | Female |
| No Vehicle | 451 (5.7%) | 142 (2.3%) |
| 1 Vehicle | 2,228 (28.3%) | 1,825 (29.2%) |
| 2 Vehicles | 3,736 (47.4%) | 3,012 (48.1%) |
| 3 Vehicles | 844 (10.7%) | 772 (12.3%) |
| 4 Vehicles | 505 (6.4%) | 477 (7.6%) |
| 5 or more Vehicles | 113 (1.4%) | 31 (0.5%) |
| Total | 7,877 (100.0%) | 6,259 (100.0%) |
Commute Time in King Of Prussia
The most frequently occuring commute durations in King Of Prussia are 10 to 14 minutes (1,657 commuters, 15.7%), 15 to 19 minutes (1,647 commuters, 15.6%), and 20 to 24 minutes (1,500 commuters, 14.2%).
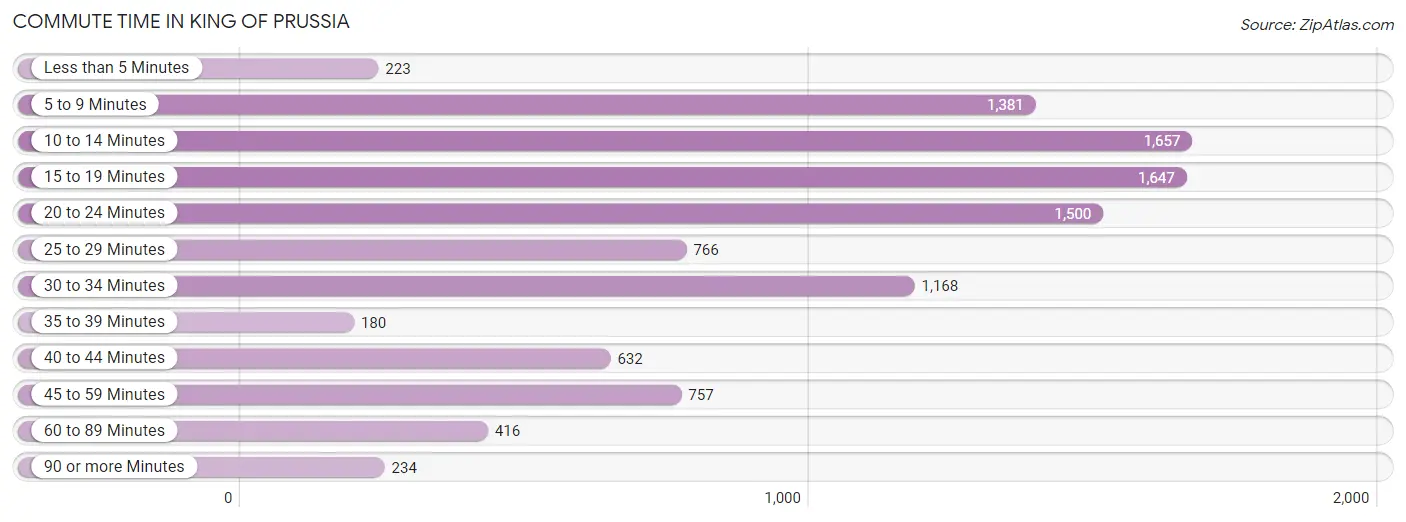
| Commute Time | # Commuters | % Commuters |
| Less than 5 Minutes | 223 | 2.1% |
| 5 to 9 Minutes | 1,381 | 13.1% |
| 10 to 14 Minutes | 1,657 | 15.7% |
| 15 to 19 Minutes | 1,647 | 15.6% |
| 20 to 24 Minutes | 1,500 | 14.2% |
| 25 to 29 Minutes | 766 | 7.2% |
| 30 to 34 Minutes | 1,168 | 11.1% |
| 35 to 39 Minutes | 180 | 1.7% |
| 40 to 44 Minutes | 632 | 6.0% |
| 45 to 59 Minutes | 757 | 7.2% |
| 60 to 89 Minutes | 416 | 3.9% |
| 90 or more Minutes | 234 | 2.2% |
Commute Time by Sex in King Of Prussia
The most common commute times in King Of Prussia are 10 to 14 minutes (1,065 commuters, 17.9%) for males and 15 to 19 minutes (815 commuters, 17.6%) for females.
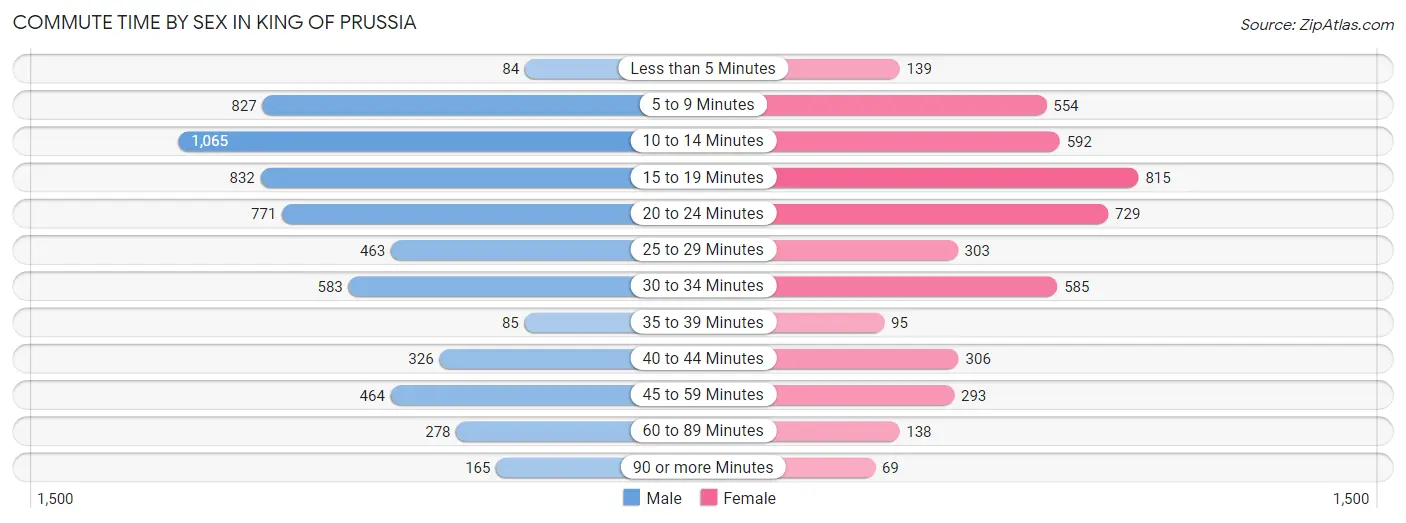
| Commute Time | Male | Female |
| Less than 5 Minutes | 84 (1.4%) | 139 (3.0%) |
| 5 to 9 Minutes | 827 (13.9%) | 554 (12.0%) |
| 10 to 14 Minutes | 1,065 (17.9%) | 592 (12.8%) |
| 15 to 19 Minutes | 832 (14.0%) | 815 (17.6%) |
| 20 to 24 Minutes | 771 (13.0%) | 729 (15.8%) |
| 25 to 29 Minutes | 463 (7.8%) | 303 (6.6%) |
| 30 to 34 Minutes | 583 (9.8%) | 585 (12.7%) |
| 35 to 39 Minutes | 85 (1.4%) | 95 (2.1%) |
| 40 to 44 Minutes | 326 (5.5%) | 306 (6.6%) |
| 45 to 59 Minutes | 464 (7.8%) | 293 (6.3%) |
| 60 to 89 Minutes | 278 (4.7%) | 138 (3.0%) |
| 90 or more Minutes | 165 (2.8%) | 69 (1.5%) |
Time of Departure to Work by Sex in King Of Prussia
The most frequent times of departure to work in King Of Prussia are 8:00 AM to 8:29 AM (1,137, 19.1%) for males and 8:00 AM to 8:29 AM (762, 16.5%) for females.
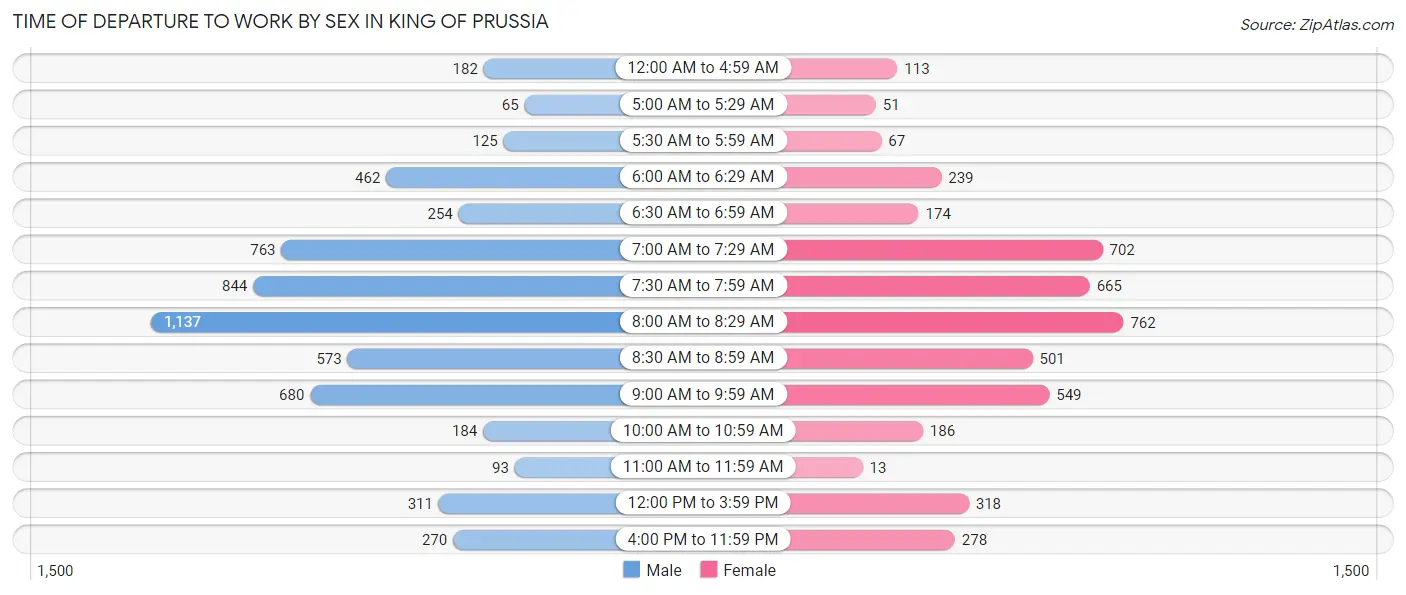
| Time of Departure | Male | Female |
| 12:00 AM to 4:59 AM | 182 (3.1%) | 113 (2.5%) |
| 5:00 AM to 5:29 AM | 65 (1.1%) | 51 (1.1%) |
| 5:30 AM to 5:59 AM | 125 (2.1%) | 67 (1.5%) |
| 6:00 AM to 6:29 AM | 462 (7.8%) | 239 (5.2%) |
| 6:30 AM to 6:59 AM | 254 (4.3%) | 174 (3.8%) |
| 7:00 AM to 7:29 AM | 763 (12.8%) | 702 (15.2%) |
| 7:30 AM to 7:59 AM | 844 (14.2%) | 665 (14.4%) |
| 8:00 AM to 8:29 AM | 1,137 (19.1%) | 762 (16.5%) |
| 8:30 AM to 8:59 AM | 573 (9.6%) | 501 (10.8%) |
| 9:00 AM to 9:59 AM | 680 (11.4%) | 549 (11.9%) |
| 10:00 AM to 10:59 AM | 184 (3.1%) | 186 (4.0%) |
| 11:00 AM to 11:59 AM | 93 (1.6%) | 13 (0.3%) |
| 12:00 PM to 3:59 PM | 311 (5.2%) | 318 (6.9%) |
| 4:00 PM to 11:59 PM | 270 (4.5%) | 278 (6.0%) |
| Total | 5,943 (100.0%) | 4,618 (100.0%) |
Housing Occupancy in King Of Prussia
Occupancy by Ownership in King Of Prussia
Of the total 11,164 dwellings in King Of Prussia, owner-occupied units account for 5,508 (49.3%), while renter-occupied units make up 5,656 (50.7%).
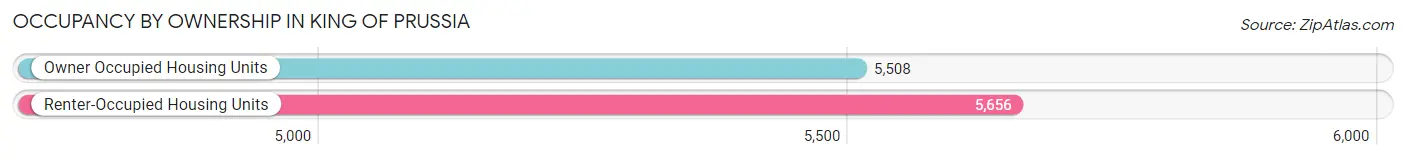
| Occupancy | # Housing Units | % Housing Units |
| Owner Occupied Housing Units | 5,508 | 49.3% |
| Renter-Occupied Housing Units | 5,656 | 50.7% |
| Total Occupied Housing Units | 11,164 | 100.0% |
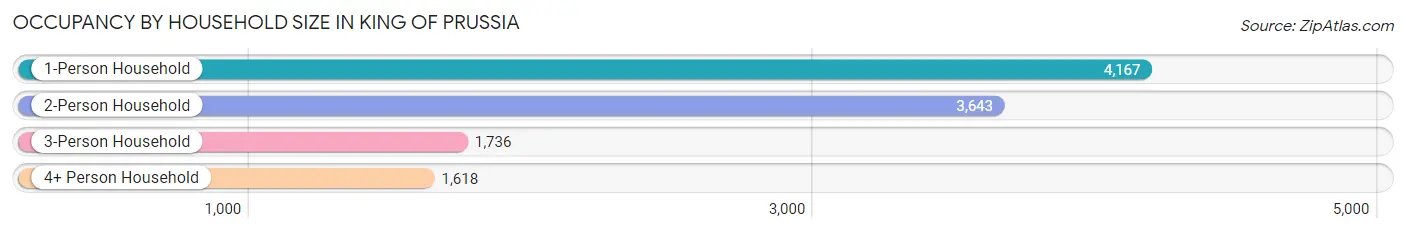
Occupancy by Household Size in King Of Prussia
| Household Size | # Housing Units | % Housing Units |
| 1-Person Household | 4,167 | 37.3% |
| 2-Person Household | 3,643 | 32.6% |
| 3-Person Household | 1,736 | 15.5% |
| 4+ Person Household | 1,618 | 14.5% |
| Total Housing Units | 11,164 | 100.0% |
Occupancy by Ownership by Household Size in King Of Prussia
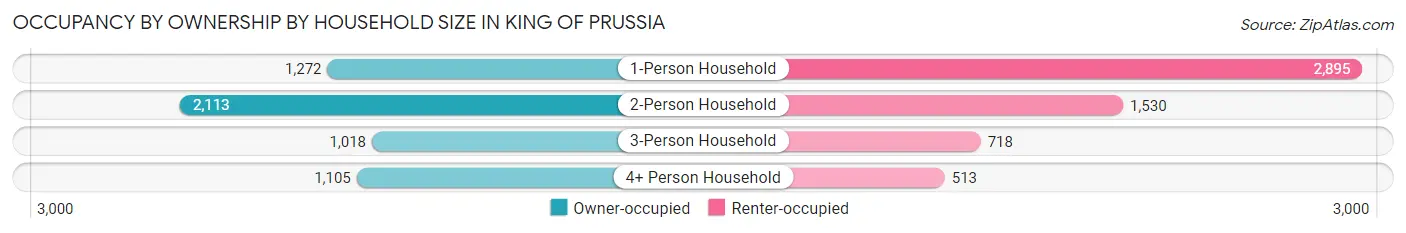
| Household Size | Owner-occupied | Renter-occupied |
| 1-Person Household | 1,272 (30.5%) | 2,895 (69.5%) |
| 2-Person Household | 2,113 (58.0%) | 1,530 (42.0%) |
| 3-Person Household | 1,018 (58.6%) | 718 (41.4%) |
| 4+ Person Household | 1,105 (68.3%) | 513 (31.7%) |
| Total Housing Units | 5,508 (49.3%) | 5,656 (50.7%) |
Occupancy by Educational Attainment in King Of Prussia
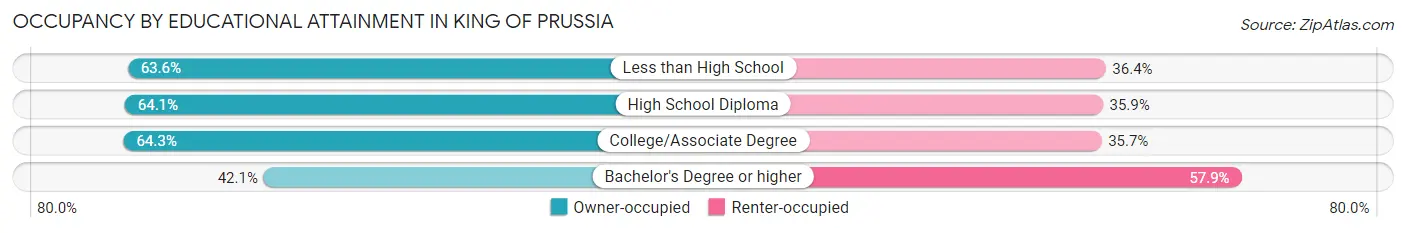
| Household Size | Owner-occupied | Renter-occupied |
| Less than High School | 175 (63.6%) | 100 (36.4%) |
| High School Diploma | 846 (64.1%) | 474 (35.9%) |
| College/Associate Degree | 1,335 (64.3%) | 741 (35.7%) |
| Bachelor's Degree or higher | 3,152 (42.1%) | 4,341 (57.9%) |
Occupancy by Age of Householder in King Of Prussia
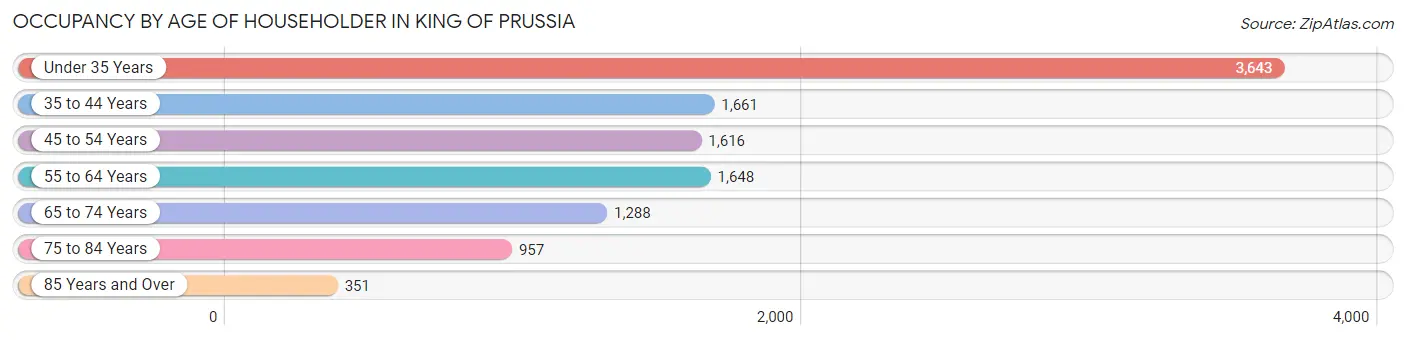
| Age Bracket | # Households | % Households |
| Under 35 Years | 3,643 | 32.6% |
| 35 to 44 Years | 1,661 | 14.9% |
| 45 to 54 Years | 1,616 | 14.5% |
| 55 to 64 Years | 1,648 | 14.8% |
| 65 to 74 Years | 1,288 | 11.5% |
| 75 to 84 Years | 957 | 8.6% |
| 85 Years and Over | 351 | 3.1% |
| Total | 11,164 | 100.0% |
Housing Finances in King Of Prussia
Median Income by Occupancy in King Of Prussia
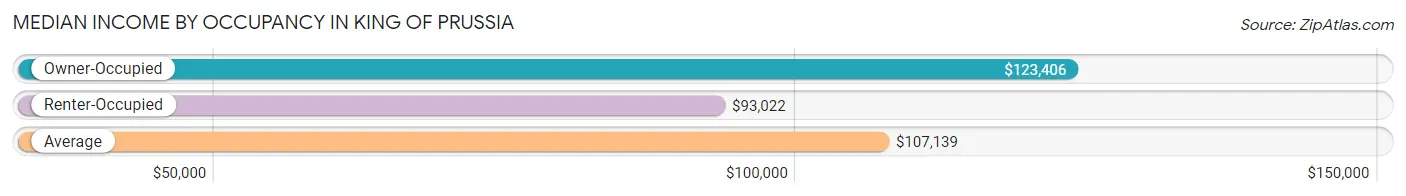
| Occupancy Type | # Households | Median Income |
| Owner-Occupied | 5,508 (49.3%) | $123,406 |
| Renter-Occupied | 5,656 (50.7%) | $93,022 |
| Average | 11,164 (100.0%) | $107,139 |
Occupancy by Householder Income Bracket in King Of Prussia
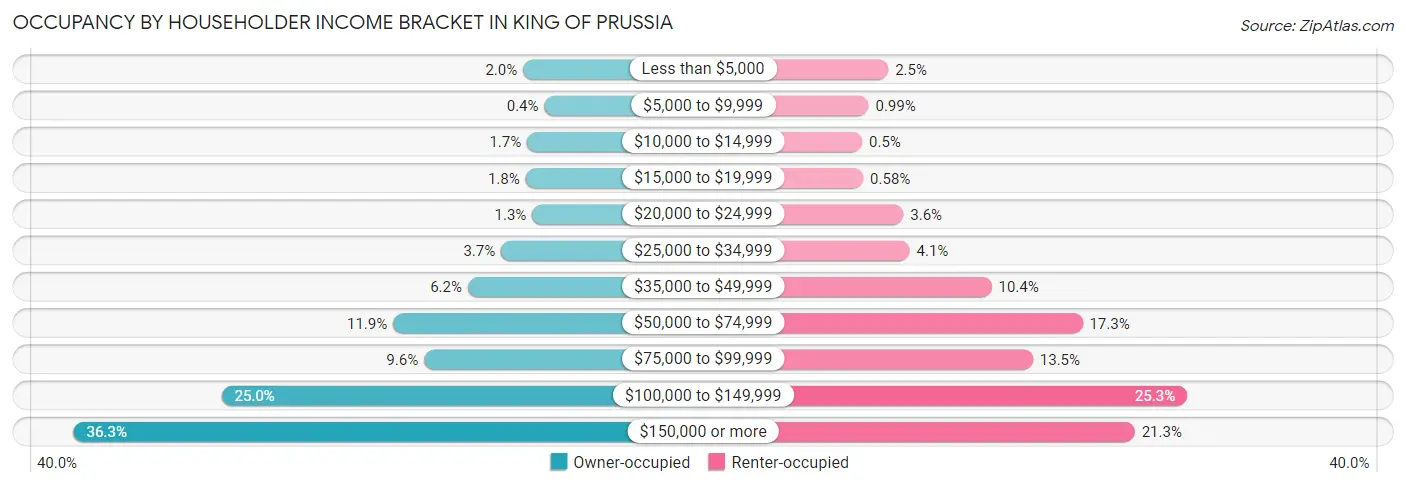
| Income Bracket | Owner-occupied | Renter-occupied |
| Less than $5,000 | 111 (2.0%) | 141 (2.5%) |
| $5,000 to $9,999 | 22 (0.4%) | 56 (1.0%) |
| $10,000 to $14,999 | 95 (1.7%) | 28 (0.5%) |
| $15,000 to $19,999 | 101 (1.8%) | 33 (0.6%) |
| $20,000 to $24,999 | 73 (1.3%) | 206 (3.6%) |
| $25,000 to $34,999 | 204 (3.7%) | 233 (4.1%) |
| $35,000 to $49,999 | 343 (6.2%) | 586 (10.4%) |
| $50,000 to $74,999 | 657 (11.9%) | 978 (17.3%) |
| $75,000 to $99,999 | 527 (9.6%) | 764 (13.5%) |
| $100,000 to $149,999 | 1,377 (25.0%) | 1,428 (25.3%) |
| $150,000 or more | 1,998 (36.3%) | 1,203 (21.3%) |
| Total | 5,508 (100.0%) | 5,656 (100.0%) |
Monthly Housing Cost Tiers in King Of Prussia
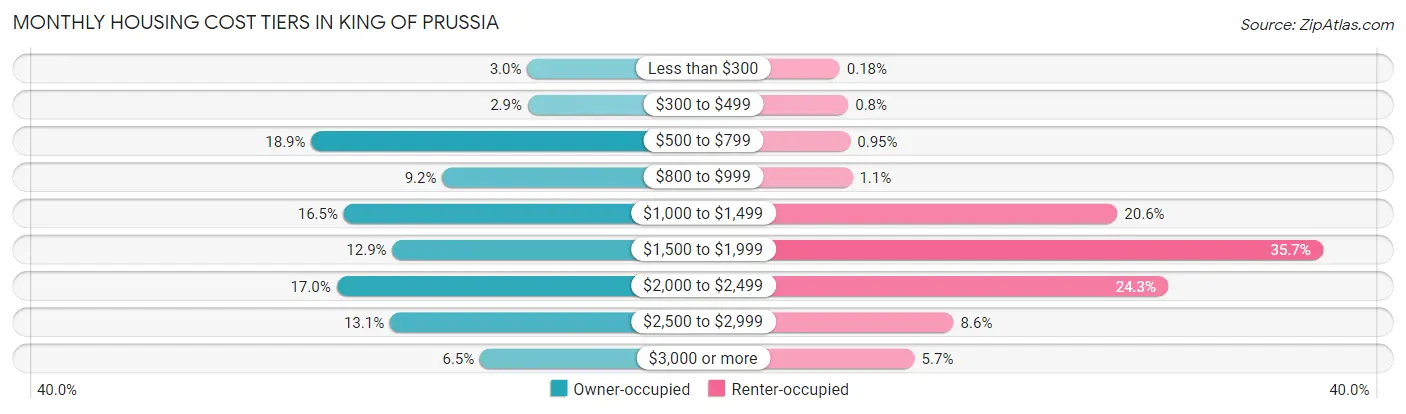
| Monthly Cost | Owner-occupied | Renter-occupied |
| Less than $300 | 164 (3.0%) | 10 (0.2%) |
| $300 to $499 | 162 (2.9%) | 45 (0.8%) |
| $500 to $799 | 1,040 (18.9%) | 54 (0.9%) |
| $800 to $999 | 509 (9.2%) | 63 (1.1%) |
| $1,000 to $1,499 | 908 (16.5%) | 1,166 (20.6%) |
| $1,500 to $1,999 | 711 (12.9%) | 2,021 (35.7%) |
| $2,000 to $2,499 | 938 (17.0%) | 1,376 (24.3%) |
| $2,500 to $2,999 | 721 (13.1%) | 484 (8.6%) |
| $3,000 or more | 355 (6.5%) | 322 (5.7%) |
| Total | 5,508 (100.0%) | 5,656 (100.0%) |
Physical Housing Characteristics in King Of Prussia
Housing Structures in King Of Prussia
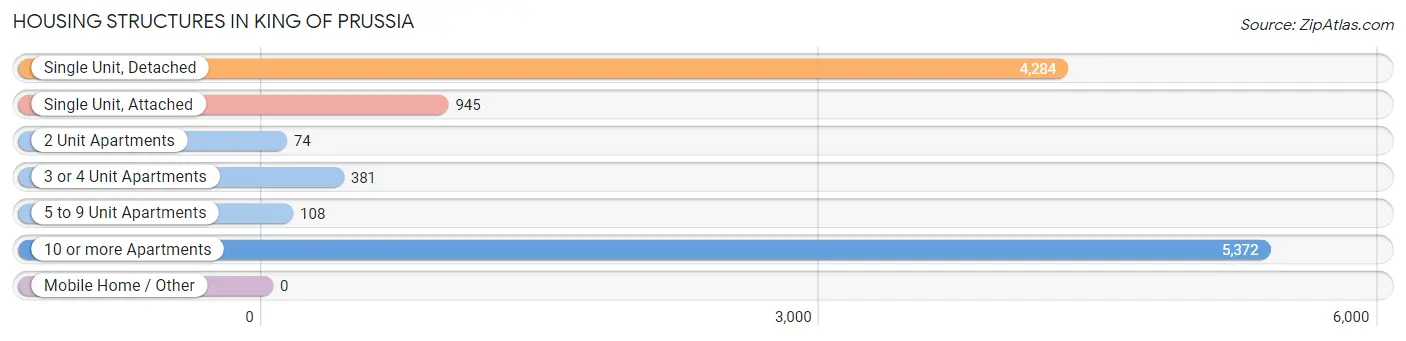
| Structure Type | # Housing Units | % Housing Units |
| Single Unit, Detached | 4,284 | 38.4% |
| Single Unit, Attached | 945 | 8.5% |
| 2 Unit Apartments | 74 | 0.7% |
| 3 or 4 Unit Apartments | 381 | 3.4% |
| 5 to 9 Unit Apartments | 108 | 1.0% |
| 10 or more Apartments | 5,372 | 48.1% |
| Mobile Home / Other | 0 | 0.0% |
| Total | 11,164 | 100.0% |
Housing Structures by Occupancy in King Of Prussia
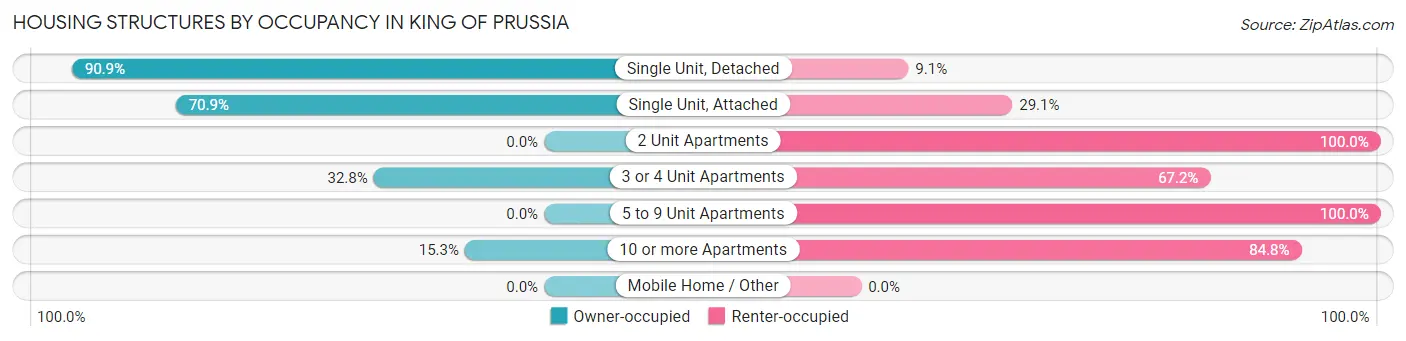
| Structure Type | Owner-occupied | Renter-occupied |
| Single Unit, Detached | 3,894 (90.9%) | 390 (9.1%) |
| Single Unit, Attached | 670 (70.9%) | 275 (29.1%) |
| 2 Unit Apartments | 0 (0.0%) | 74 (100.0%) |
| 3 or 4 Unit Apartments | 125 (32.8%) | 256 (67.2%) |
| 5 to 9 Unit Apartments | 0 (0.0%) | 108 (100.0%) |
| 10 or more Apartments | 819 (15.2%) | 4,553 (84.8%) |
| Mobile Home / Other | 0 (0.0%) | 0 (0.0%) |
| Total | 5,508 (49.3%) | 5,656 (50.7%) |
Housing Structures by Number of Rooms in King Of Prussia
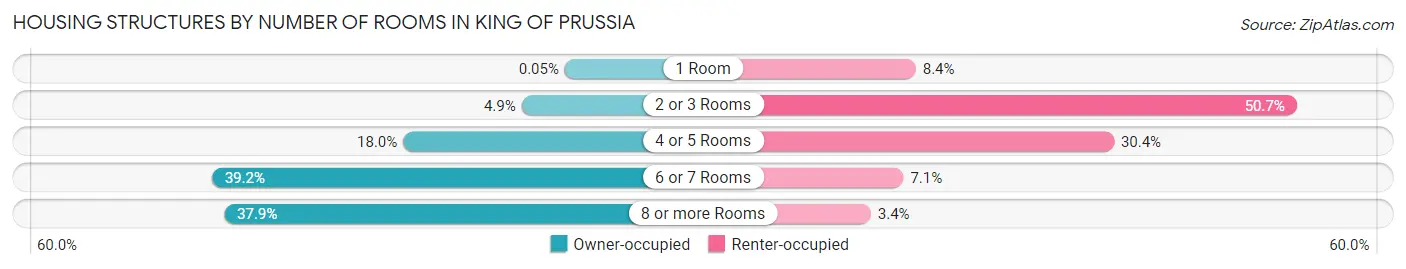
| Number of Rooms | Owner-occupied | Renter-occupied |
| 1 Room | 3 (0.1%) | 476 (8.4%) |
| 2 or 3 Rooms | 267 (4.9%) | 2,867 (50.7%) |
| 4 or 5 Rooms | 991 (18.0%) | 1,720 (30.4%) |
| 6 or 7 Rooms | 2,161 (39.2%) | 399 (7.0%) |
| 8 or more Rooms | 2,086 (37.9%) | 194 (3.4%) |
| Total | 5,508 (100.0%) | 5,656 (100.0%) |
Housing Structure by Heating Type in King Of Prussia
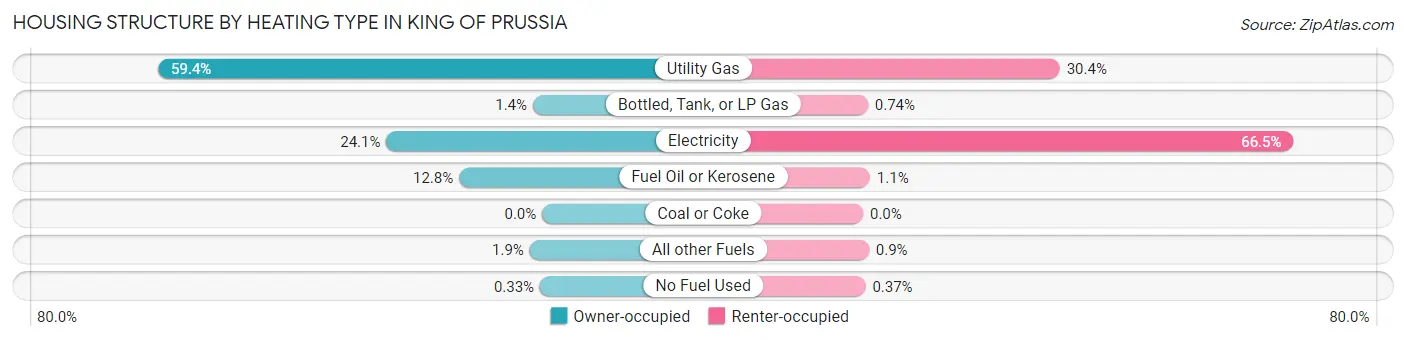
| Heating Type | Owner-occupied | Renter-occupied |
| Utility Gas | 3,271 (59.4%) | 1,720 (30.4%) |
| Bottled, Tank, or LP Gas | 79 (1.4%) | 42 (0.7%) |
| Electricity | 1,327 (24.1%) | 3,762 (66.5%) |
| Fuel Oil or Kerosene | 707 (12.8%) | 60 (1.1%) |
| Coal or Coke | 0 (0.0%) | 0 (0.0%) |
| All other Fuels | 106 (1.9%) | 51 (0.9%) |
| No Fuel Used | 18 (0.3%) | 21 (0.4%) |
| Total | 5,508 (100.0%) | 5,656 (100.0%) |
Household Vehicle Usage in King Of Prussia
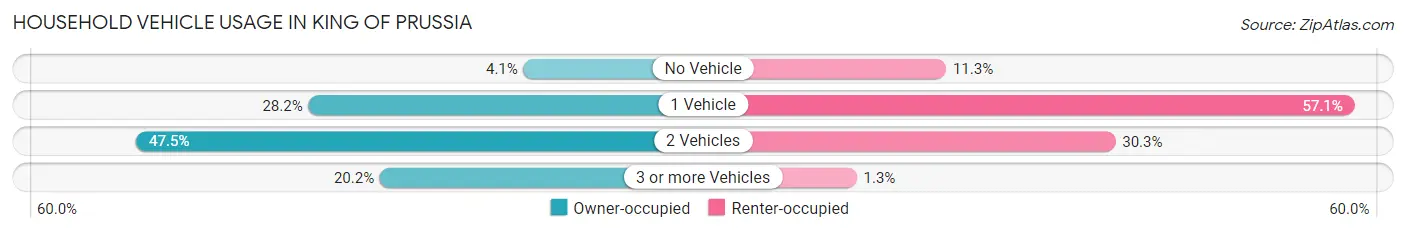
| Vehicles per Household | Owner-occupied | Renter-occupied |
| No Vehicle | 226 (4.1%) | 640 (11.3%) |
| 1 Vehicle | 1,553 (28.2%) | 3,229 (57.1%) |
| 2 Vehicles | 2,617 (47.5%) | 1,713 (30.3%) |
| 3 or more Vehicles | 1,112 (20.2%) | 74 (1.3%) |
| Total | 5,508 (100.0%) | 5,656 (100.0%) |
Real Estate & Mortgages in King Of Prussia
Real Estate and Mortgage Overview in King Of Prussia
| Characteristic | Without Mortgage | With Mortgage |
| Housing Units | 2,260 | 3,248 |
| Median Property Value | $362,800 | $382,200 |
| Median Household Income | $81,987 | $1,420 |
| Monthly Housing Costs | $756 | $355 |
| Real Estate Taxes | $3,656 | $22 |
Property Value by Mortgage Status in King Of Prussia
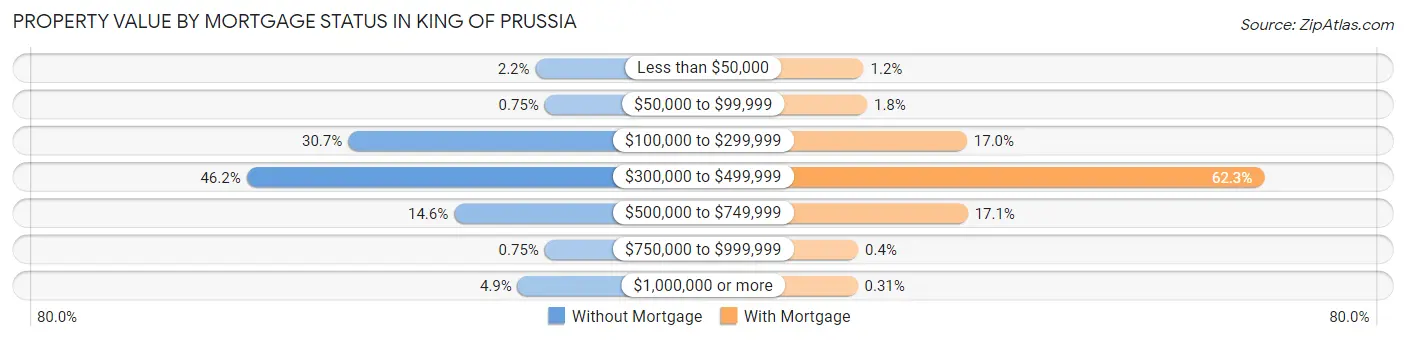
| Property Value | Without Mortgage | With Mortgage |
| Less than $50,000 | 49 (2.2%) | 40 (1.2%) |
| $50,000 to $99,999 | 17 (0.7%) | 57 (1.8%) |
| $100,000 to $299,999 | 694 (30.7%) | 551 (17.0%) |
| $300,000 to $499,999 | 1,044 (46.2%) | 2,022 (62.3%) |
| $500,000 to $749,999 | 329 (14.6%) | 555 (17.1%) |
| $750,000 to $999,999 | 17 (0.7%) | 13 (0.4%) |
| $1,000,000 or more | 110 (4.9%) | 10 (0.3%) |
| Total | 2,260 (100.0%) | 3,248 (100.0%) |
Household Income by Mortgage Status in King Of Prussia
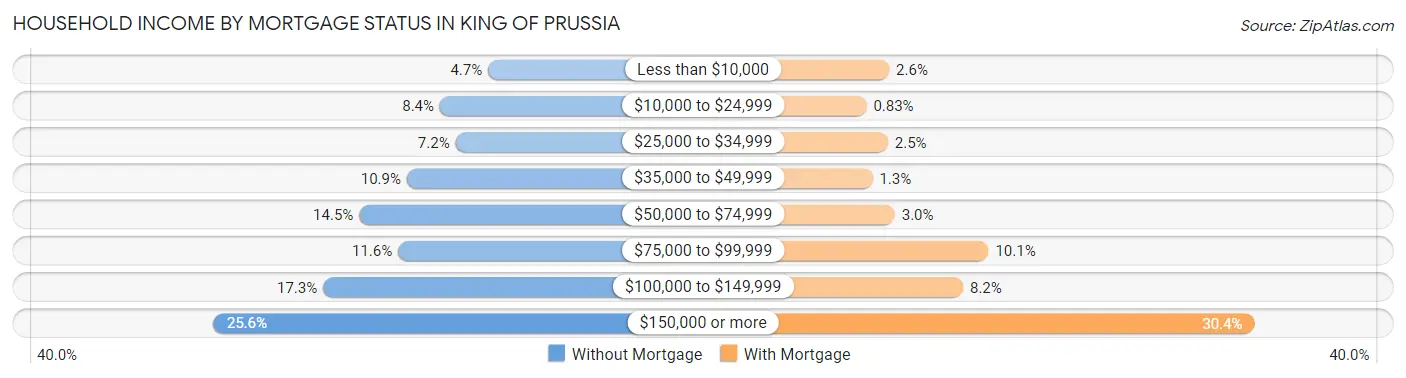
| Household Income | Without Mortgage | With Mortgage |
| Less than $10,000 | 106 (4.7%) | 83 (2.6%) |
| $10,000 to $24,999 | 189 (8.4%) | 27 (0.8%) |
| $25,000 to $34,999 | 162 (7.2%) | 80 (2.5%) |
| $35,000 to $49,999 | 246 (10.9%) | 42 (1.3%) |
| $50,000 to $74,999 | 328 (14.5%) | 97 (3.0%) |
| $75,000 to $99,999 | 261 (11.6%) | 329 (10.1%) |
| $100,000 to $149,999 | 390 (17.3%) | 266 (8.2%) |
| $150,000 or more | 578 (25.6%) | 987 (30.4%) |
| Total | 2,260 (100.0%) | 3,248 (100.0%) |
Property Value to Household Income Ratio in King Of Prussia
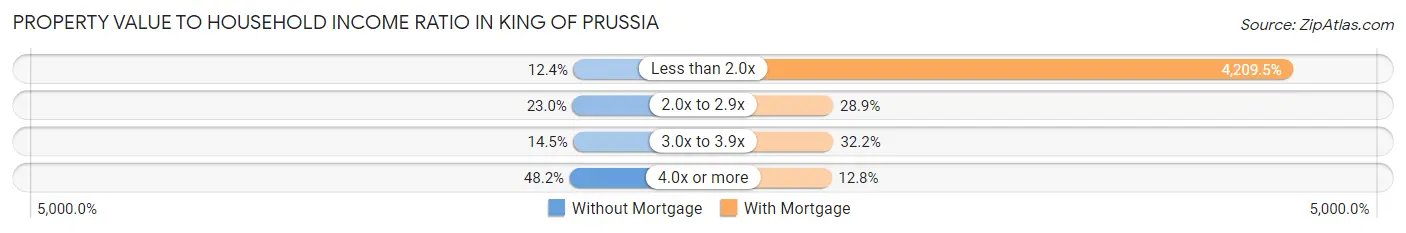
| Value-to-Income Ratio | Without Mortgage | With Mortgage |
| Less than 2.0x | 281 (12.4%) | 136,726 (4,209.5%) |
| 2.0x to 2.9x | 520 (23.0%) | 940 (28.9%) |
| 3.0x to 3.9x | 327 (14.5%) | 1,047 (32.2%) |
| 4.0x or more | 1,089 (48.2%) | 416 (12.8%) |
| Total | 2,260 (100.0%) | 3,248 (100.0%) |
Real Estate Taxes by Mortgage Status in King Of Prussia
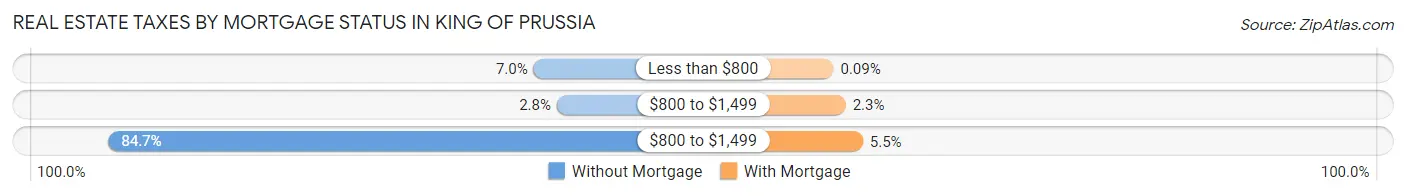
| Property Taxes | Without Mortgage | With Mortgage |
| Less than $800 | 159 (7.0%) | 3 (0.1%) |
| $800 to $1,499 | 63 (2.8%) | 75 (2.3%) |
| $800 to $1,499 | 1,914 (84.7%) | 177 (5.4%) |
| Total | 2,260 (100.0%) | 3,248 (100.0%) |
Health & Disability in King Of Prussia
Health Insurance Coverage by Age in King Of Prussia
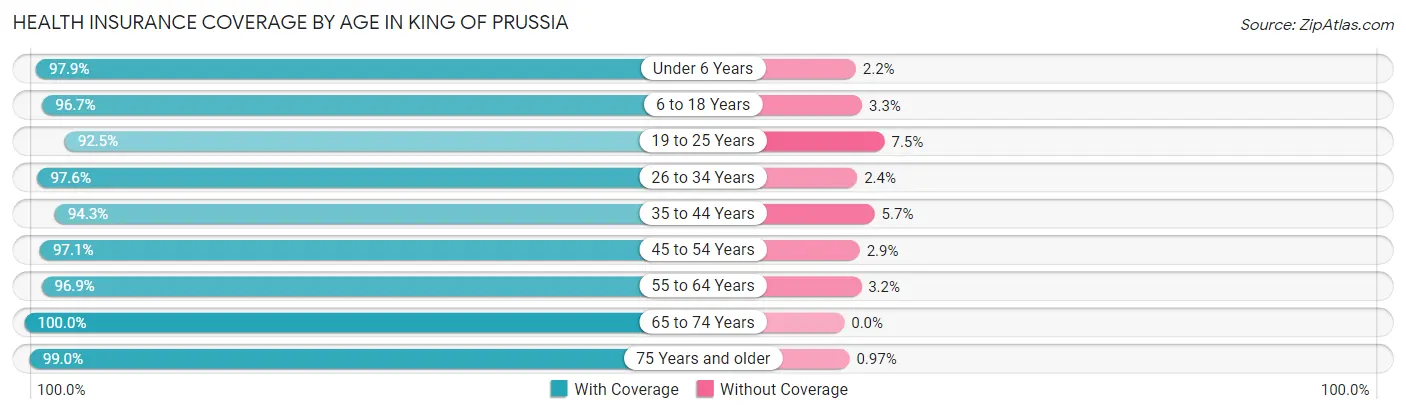
| Age Bracket | With Coverage | Without Coverage |
| Under 6 Years | 1,776 (97.9%) | 39 (2.1%) |
| 6 to 18 Years | 2,472 (96.7%) | 85 (3.3%) |
| 19 to 25 Years | 1,701 (92.5%) | 138 (7.5%) |
| 26 to 34 Years | 5,186 (97.6%) | 128 (2.4%) |
| 35 to 44 Years | 2,781 (94.3%) | 167 (5.7%) |
| 45 to 54 Years | 2,761 (97.1%) | 82 (2.9%) |
| 55 to 64 Years | 2,732 (96.9%) | 89 (3.2%) |
| 65 to 74 Years | 2,125 (100.0%) | 0 (0.0%) |
| 75 Years and older | 1,937 (99.0%) | 19 (1.0%) |
| Total | 23,471 (96.9%) | 747 (3.1%) |
Health Insurance Coverage by Citizenship Status in King Of Prussia
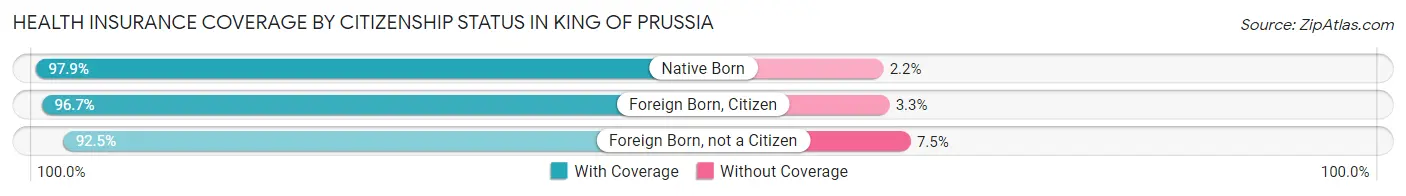
| Citizenship Status | With Coverage | Without Coverage |
| Native Born | 1,776 (97.9%) | 39 (2.1%) |
| Foreign Born, Citizen | 2,472 (96.7%) | 85 (3.3%) |
| Foreign Born, not a Citizen | 1,701 (92.5%) | 138 (7.5%) |
Health Insurance Coverage by Household Income in King Of Prussia
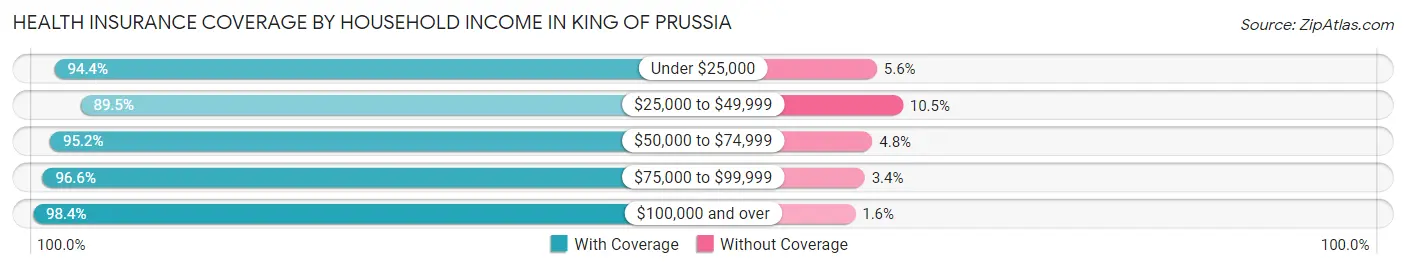
| Household Income | With Coverage | Without Coverage |
| Under $25,000 | 1,157 (94.4%) | 69 (5.6%) |
| $25,000 to $49,999 | 1,766 (89.5%) | 207 (10.5%) |
| $50,000 to $74,999 | 2,610 (95.2%) | 131 (4.8%) |
| $75,000 to $99,999 | 2,672 (96.6%) | 93 (3.4%) |
| $100,000 and over | 15,260 (98.4%) | 247 (1.6%) |
Public vs Private Health Insurance Coverage by Age in King Of Prussia
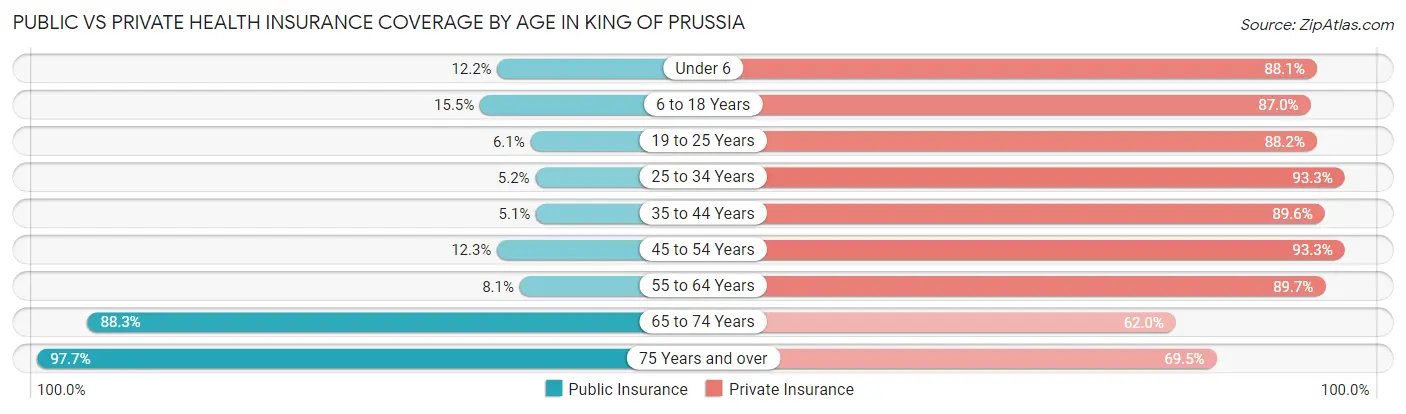
| Age Bracket | Public Insurance | Private Insurance |
| Under 6 | 222 (12.2%) | 1,599 (88.1%) |
| 6 to 18 Years | 395 (15.4%) | 2,224 (87.0%) |
| 19 to 25 Years | 112 (6.1%) | 1,621 (88.1%) |
| 25 to 34 Years | 275 (5.2%) | 4,959 (93.3%) |
| 35 to 44 Years | 149 (5.1%) | 2,641 (89.6%) |
| 45 to 54 Years | 349 (12.3%) | 2,653 (93.3%) |
| 55 to 64 Years | 228 (8.1%) | 2,531 (89.7%) |
| 65 to 74 Years | 1,877 (88.3%) | 1,317 (62.0%) |
| 75 Years and over | 1,910 (97.7%) | 1,360 (69.5%) |
| Total | 5,517 (22.8%) | 20,905 (86.3%) |
Disability Status by Sex by Age in King Of Prussia
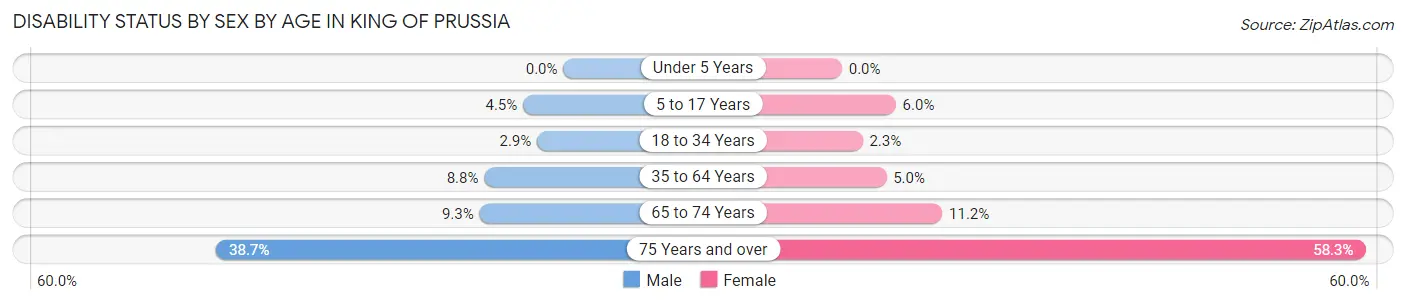
| Age Bracket | Male | Female |
| Under 5 Years | 0 (0.0%) | 0 (0.0%) |
| 5 to 17 Years | 62 (4.5%) | 64 (6.0%) |
| 18 to 34 Years | 116 (2.9%) | 81 (2.3%) |
| 35 to 64 Years | 388 (8.8%) | 208 (5.0%) |
| 65 to 74 Years | 78 (9.3%) | 144 (11.2%) |
| 75 Years and over | 302 (38.7%) | 685 (58.3%) |
Disability Class by Sex by Age in King Of Prussia
Disability Class: Hearing Difficulty
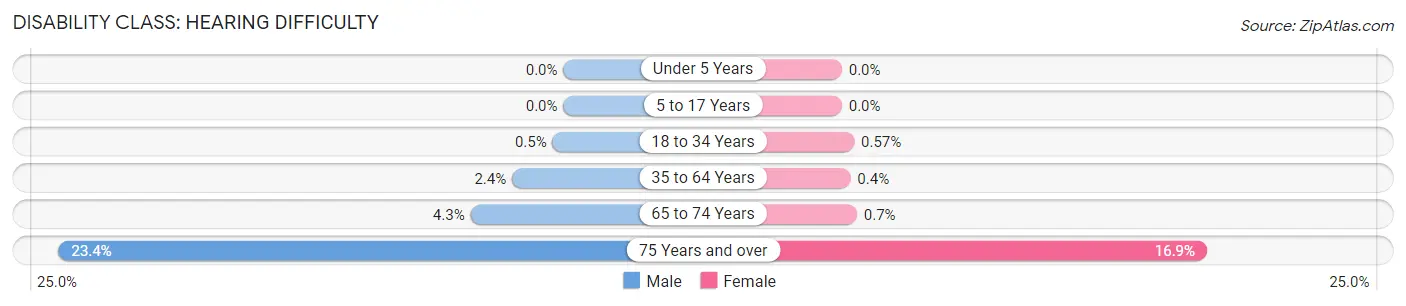
| Age Bracket | Male | Female |
| Under 5 Years | 0 (0.0%) | 0 (0.0%) |
| 5 to 17 Years | 0 (0.0%) | 0 (0.0%) |
| 18 to 34 Years | 20 (0.5%) | 20 (0.6%) |
| 35 to 64 Years | 105 (2.4%) | 17 (0.4%) |
| 65 to 74 Years | 36 (4.3%) | 9 (0.7%) |
| 75 Years and over | 183 (23.4%) | 199 (16.9%) |
Disability Class: Vision Difficulty
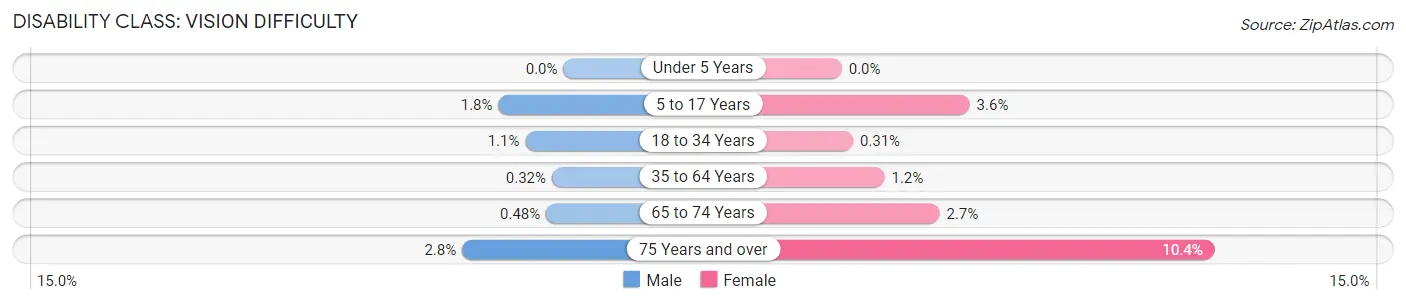
| Age Bracket | Male | Female |
| Under 5 Years | 0 (0.0%) | 0 (0.0%) |
| 5 to 17 Years | 25 (1.8%) | 38 (3.6%) |
| 18 to 34 Years | 42 (1.1%) | 11 (0.3%) |
| 35 to 64 Years | 14 (0.3%) | 50 (1.2%) |
| 65 to 74 Years | 4 (0.5%) | 35 (2.7%) |
| 75 Years and over | 22 (2.8%) | 122 (10.4%) |
Disability Class: Cognitive Difficulty
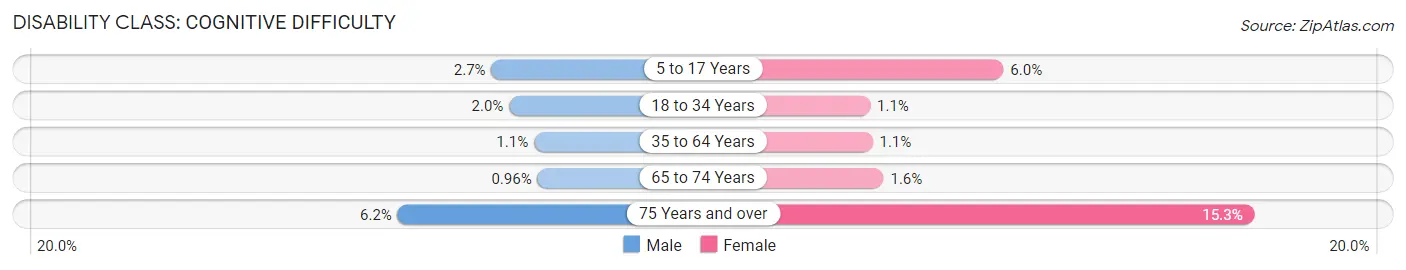
| Age Bracket | Male | Female |
| 5 to 17 Years | 37 (2.7%) | 64 (6.0%) |
| 18 to 34 Years | 80 (2.0%) | 37 (1.1%) |
| 35 to 64 Years | 48 (1.1%) | 48 (1.1%) |
| 65 to 74 Years | 8 (1.0%) | 20 (1.5%) |
| 75 Years and over | 48 (6.1%) | 180 (15.3%) |
Disability Class: Ambulatory Difficulty
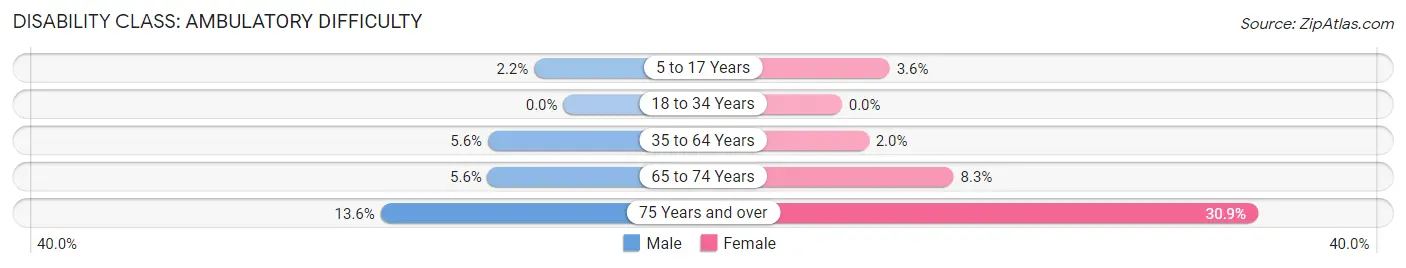
| Age Bracket | Male | Female |
| 5 to 17 Years | 30 (2.2%) | 38 (3.6%) |
| 18 to 34 Years | 0 (0.0%) | 0 (0.0%) |
| 35 to 64 Years | 247 (5.6%) | 84 (2.0%) |
| 65 to 74 Years | 47 (5.6%) | 107 (8.3%) |
| 75 Years and over | 106 (13.6%) | 363 (30.9%) |
Disability Class: Self-Care Difficulty
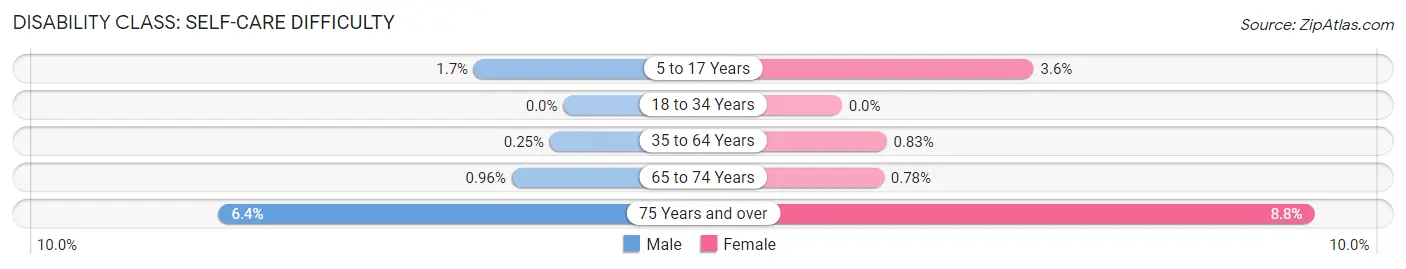
| Age Bracket | Male | Female |
| 5 to 17 Years | 23 (1.7%) | 38 (3.6%) |
| 18 to 34 Years | 0 (0.0%) | 0 (0.0%) |
| 35 to 64 Years | 11 (0.3%) | 35 (0.8%) |
| 65 to 74 Years | 8 (1.0%) | 10 (0.8%) |
| 75 Years and over | 50 (6.4%) | 103 (8.8%) |
Technology Access in King Of Prussia
Computing Device Access in King Of Prussia
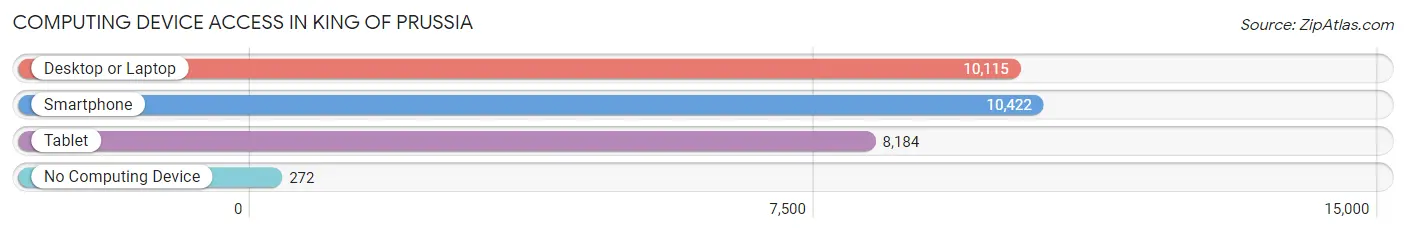
| Device Type | # Households | % Households |
| Desktop or Laptop | 10,115 | 90.6% |
| Smartphone | 10,422 | 93.3% |
| Tablet | 8,184 | 73.3% |
| No Computing Device | 272 | 2.4% |
| Total | 11,164 | 100.0% |
Internet Access in King Of Prussia
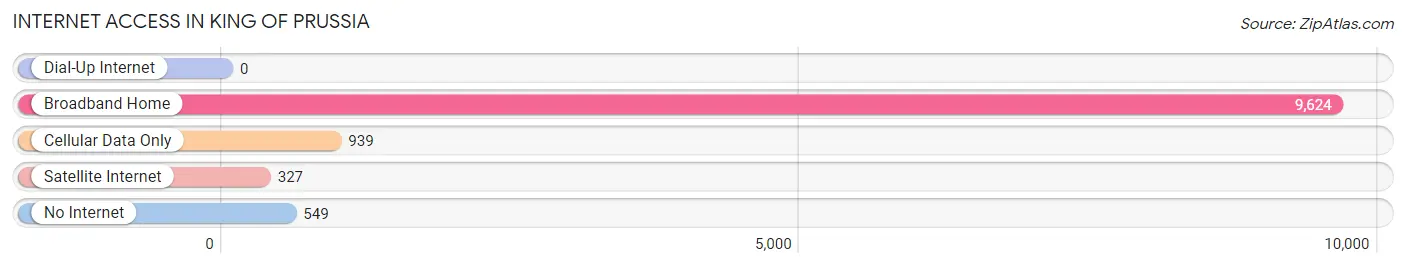
| Internet Type | # Households | % Households |
| Dial-Up Internet | 0 | 0.0% |
| Broadband Home | 9,624 | 86.2% |
| Cellular Data Only | 939 | 8.4% |
| Satellite Internet | 327 | 2.9% |
| No Internet | 549 | 4.9% |
| Total | 11,164 | 100.0% |
King Of Prussia Summary
King of Prussia is a census-designated place (CDP) located in Upper Merion Township, Montgomery County, Pennsylvania, United States. It is located 19 miles (31 km) northwest of Philadelphia and forms part of the Philadelphia metropolitan area. As of the 2010 census, its population was 19,936. The CDP is named after the historic King of Prussia Inn, which was named after King Frederick II of Prussia.
History
The area that is now King of Prussia was originally inhabited by the Lenape Indians. The first European settlers arrived in the area in the late 17th century. The area was originally part of the Welsh Tract, a large tract of land granted to Welsh Quakers by William Penn in 1681. The area was originally known as “King of Prussia Town”, named after the inn of the same name. The inn was named after King Frederick II of Prussia, who visited the area in 1777.
The area was part of the original Montgomery County, which was created in 1784. In 1790, the area was split off into Upper Merion Township. The area continued to grow throughout the 19th century, and by the early 20th century, the area had become a popular summer resort destination.
Geography
King of Prussia is located at 40°6′2″N 75°22′59″W (40.1006, -75.3832). According to the United States Census Bureau, the CDP has a total area of 8.2 square miles (21.2 km2), of which 8.1 square miles (21.0 km2) is land and 0.1 square miles (0.2 km2) (1.17%) is water.
Economy
King of Prussia is home to the King of Prussia Mall, the largest shopping mall in the United States in terms of leasable space. The mall is home to over 400 stores and restaurants, and is a major economic driver for the area. Other major employers in the area include the Valley Forge Casino Resort, the Valley Forge Convention Center, and the Valley Forge National Historical Park.
Demographics
As of the 2010 census, there were 19,936 people, 8,072 households, and 5,072 families residing in the CDP. The population density was 2,459.3 people per square mile (949.7/km2). There were 8,072 housing units at an average density of 990.2 per square mile (382.2/km2). The racial makeup of the CDP was 79.2% White, 8.2% African American, 0.1% Native American, 9.7% Asian, 0.1% Pacific Islander, 1.2% from other races, and 1.6% from two or more races. Hispanic or Latino of any race were 3.7% of the population.
There were 8,072 households, out of which 28.2% had children under the age of 18 living with them, 51.2% were married couples living together, 9.7% had a female householder with no husband present, and 35.2% were non-families. 28.7% of all households were made up of individuals, and 10.2% had someone living alone who was 65 years of age or older. The average household size was 2.44 and the average family size was 3.06.
In the CDP, the population was spread out, with 22.2% under the age of 18, 6.7% from 18 to 24, 30.2% from 25 to 44, 25.2% from 45 to 64, and 15.7% who were 65 years of age or older. The median age was 40 years. For every 100 females, there were 92.2 males. For every 100 females age 18 and over, there were 88.7 males.
The median income for a household in the CDP was $68,890, and the median income for a family was $86,945. Males had a median income of $60,945 versus $45,818 for females. The per capita income for the CDP was $37,890. About 2.2% of families and 3.7% of the population were below the poverty line, including 4.2% of those under age 18 and 4.2% of those age 65 or over.
Common Questions
What is Per Capita Income in King Of Prussia?
Per Capita income in King Of Prussia is $58,203.
What is the Median Family Income in King Of Prussia?
Median Family Income in King Of Prussia is $125,308.
What is the Median Household income in King Of Prussia?
Median Household Income in King Of Prussia is $107,139.
What is Income or Wage Gap in King Of Prussia?
Income or Wage Gap in King Of Prussia is 37.9%.
Women in King Of Prussia earn 62.1 cents for every dollar earned by a man.
What is Family Income Deficit in King Of Prussia?
Family Income Deficit in King Of Prussia is $14,236.
Families that are below poverty line in King Of Prussia earn $14,236 less on average than the poverty threshold level.
What is Inequality or Gini Index in King Of Prussia?
Inequality or Gini Index in King Of Prussia is 0.40.
What is the Total Population of King Of Prussia?
Total Population of King Of Prussia is 24,423.
What is the Total Male Population of King Of Prussia?
Total Male Population of King Of Prussia is 12,233.
What is the Total Female Population of King Of Prussia?
Total Female Population of King Of Prussia is 12,190.
What is the Ratio of Males per 100 Females in King Of Prussia?
There are 100.35 Males per 100 Females in King Of Prussia.
What is the Ratio of Females per 100 Males in King Of Prussia?
There are 99.65 Females per 100 Males in King Of Prussia.
What is the Median Population Age in King Of Prussia?
Median Population Age in King Of Prussia is 36.6 Years.
What is the Average Family Size in King Of Prussia
Average Family Size in King Of Prussia is 3.0 People.
What is the Average Household Size in King Of Prussia
Average Household Size in King Of Prussia is 2.2 People.
How Large is the Labor Force in King Of Prussia?
There are 15,141 People in the Labor Forcein in King Of Prussia.
What is the Percentage of People in the Labor Force in King Of Prussia?
73.0% of People are in the Labor Force in King Of Prussia.
What is the Unemployment Rate in King Of Prussia?
Unemployment Rate in King Of Prussia is 5.4%.