North Wales borough, PA Map & Demographics
North Wales borough Overview
$50,093
PER CAPITA INCOME
$136,000
AVG FAMILY INCOME
$113,375
AVG HOUSEHOLD INCOME
54.4%
WAGE / INCOME GAP [ % ]
45.6¢/ $1
WAGE / INCOME GAP [ $ ]
0.39
INEQUALITY / GINI INDEX
3,415
TOTAL POPULATION
1,548
MALE POPULATION
1,867
FEMALE POPULATION
82.91
MALES / 100 FEMALES
120.61
FEMALES / 100 MALES
37.2
MEDIAN AGE
2.9
AVG FAMILY SIZE
2.3
AVG HOUSEHOLD SIZE
2,078
LABOR FORCE [ PEOPLE ]
75.0%
PERCENT IN LABOR FORCE
2.7%
UNEMPLOYMENT RATE
Income in North Wales borough
Income Overview in North Wales borough
Per Capita Income in North Wales borough is $50,093, while median incomes of families and households are $136,000 and $113,375 respectively.
| Characteristic | Number | Measure |
| Per Capita Income | 3,415 | $50,093 |
| Median Family Income | 886 | $136,000 |
| Mean Family Income | 886 | $138,120 |
| Median Household Income | 1,464 | $113,375 |
| Mean Household Income | 1,464 | $115,943 |
| Income Deficit | 886 | $0 |
| Wage / Income Gap (%) | 3,415 | 54.44% |
| Wage / Income Gap ($) | 3,415 | 45.56¢ per $1 |
| Gini / Inequality Index | 3,415 | 0.39 |
Earnings by Sex in North Wales borough
Average Earnings in North Wales borough are $53,681, $76,348 for men and $34,784 for women, a difference of 54.4%.
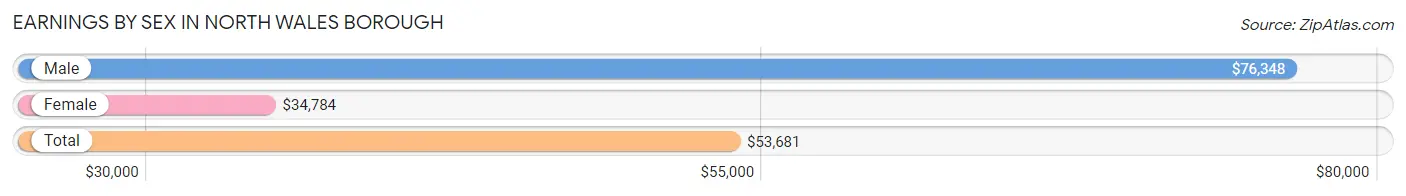
| Sex | Number | Average Earnings |
| Male | 1,073 (50.1%) | $76,348 |
| Female | 1,069 (49.9%) | $34,784 |
| Total | 2,142 (100.0%) | $53,681 |
Earnings by Sex by Income Bracket in North Wales borough
The most common earnings brackets in North Wales borough are $100,000+ for men (295 | 27.5%) and $100,000+ for women (161 | 15.1%).
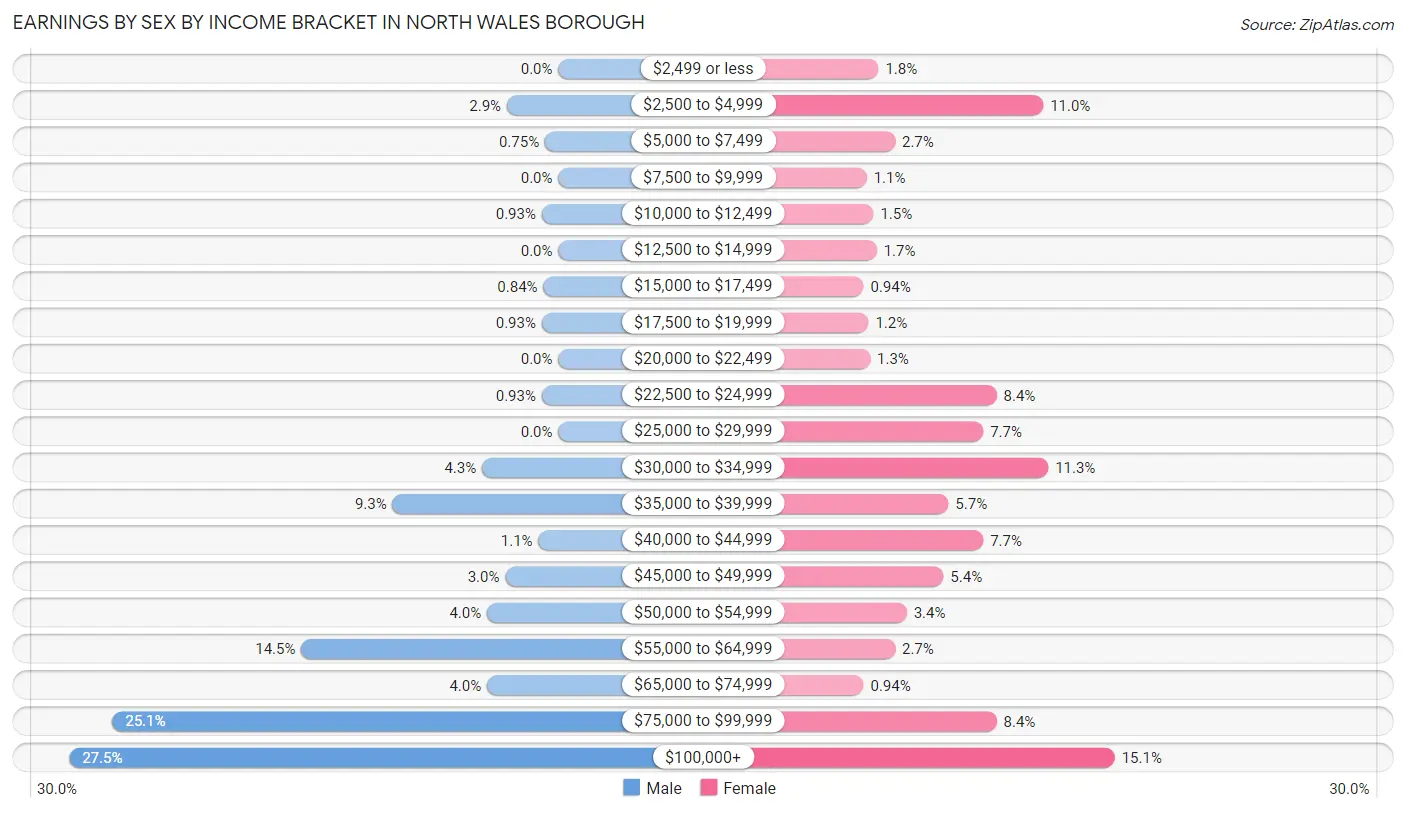
| Income | Male | Female |
| $2,499 or less | 0 (0.0%) | 19 (1.8%) |
| $2,500 to $4,999 | 31 (2.9%) | 118 (11.0%) |
| $5,000 to $7,499 | 8 (0.7%) | 29 (2.7%) |
| $7,500 to $9,999 | 0 (0.0%) | 12 (1.1%) |
| $10,000 to $12,499 | 10 (0.9%) | 16 (1.5%) |
| $12,500 to $14,999 | 0 (0.0%) | 18 (1.7%) |
| $15,000 to $17,499 | 9 (0.8%) | 10 (0.9%) |
| $17,500 to $19,999 | 10 (0.9%) | 13 (1.2%) |
| $20,000 to $22,499 | 0 (0.0%) | 14 (1.3%) |
| $22,500 to $24,999 | 10 (0.9%) | 90 (8.4%) |
| $25,000 to $29,999 | 0 (0.0%) | 82 (7.7%) |
| $30,000 to $34,999 | 46 (4.3%) | 121 (11.3%) |
| $35,000 to $39,999 | 100 (9.3%) | 61 (5.7%) |
| $40,000 to $44,999 | 12 (1.1%) | 82 (7.7%) |
| $45,000 to $49,999 | 32 (3.0%) | 58 (5.4%) |
| $50,000 to $54,999 | 43 (4.0%) | 36 (3.4%) |
| $55,000 to $64,999 | 155 (14.4%) | 29 (2.7%) |
| $65,000 to $74,999 | 43 (4.0%) | 10 (0.9%) |
| $75,000 to $99,999 | 269 (25.1%) | 90 (8.4%) |
| $100,000+ | 295 (27.5%) | 161 (15.1%) |
| Total | 1,073 (100.0%) | 1,069 (100.0%) |
Earnings by Sex by Educational Attainment in North Wales borough
Average earnings in North Wales borough are $77,639 for men and $41,172 for women, a difference of 47.0%. Men with an educational attainment of graduate degree enjoy the highest average annual earnings of $139,125, while those with college or associate's degree education earn the least with $45,833. Women with an educational attainment of graduate degree earn the most with the average annual earnings of $101,711, while those with college or associate's degree education have the smallest earnings of $26,700.
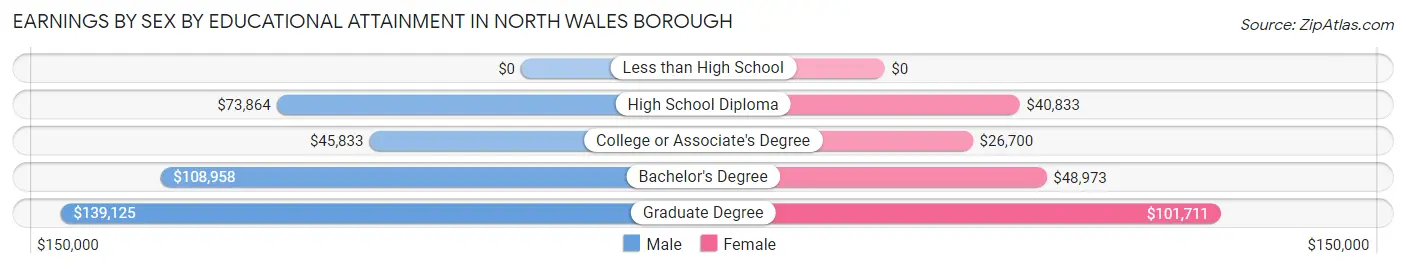
| Educational Attainment | Male Income | Female Income |
| Less than High School | - | - |
| High School Diploma | $73,864 | $40,833 |
| College or Associate's Degree | $45,833 | $26,700 |
| Bachelor's Degree | $108,958 | $48,973 |
| Graduate Degree | $139,125 | $101,711 |
| Total | $77,639 | $41,172 |
Family Income in North Wales borough
Family Income Brackets in North Wales borough
According to the North Wales borough family income data, there are 277 families falling into the $100,000 to $149,999 income range, which is the most common income bracket and makes up 31.3% of all families. Conversely, the less than $10,000 income bracket is the least frequent group with only 9 families (1.0%) belonging to this category.
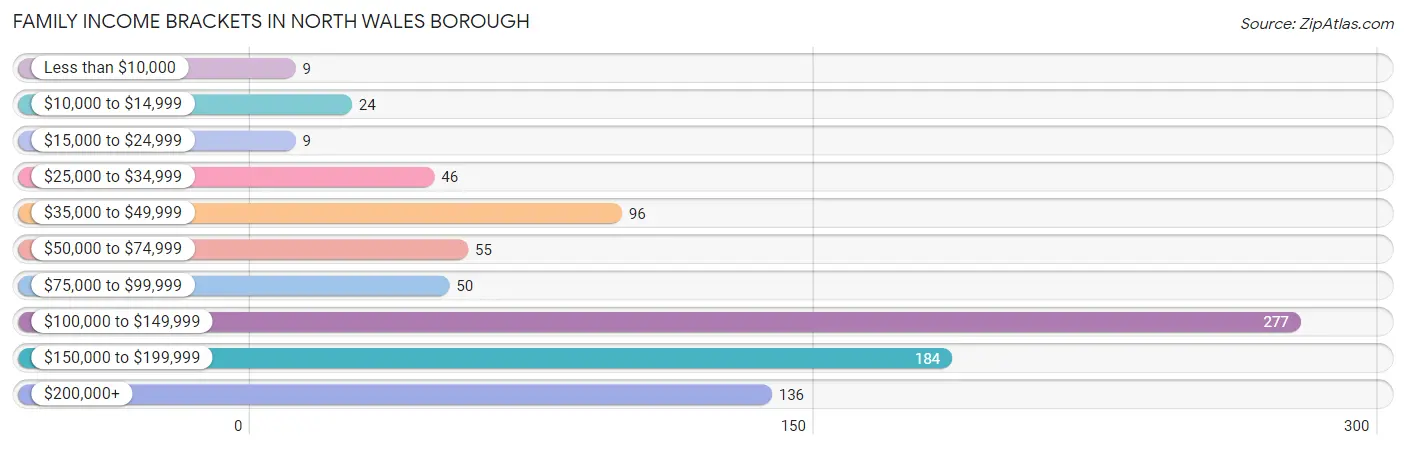
| Income Bracket | # Families | % Families |
| Less than $10,000 | 9 | 1.0% |
| $10,000 to $14,999 | 24 | 2.7% |
| $15,000 to $24,999 | 9 | 1.0% |
| $25,000 to $34,999 | 46 | 5.2% |
| $35,000 to $49,999 | 96 | 10.8% |
| $50,000 to $74,999 | 55 | 6.2% |
| $75,000 to $99,999 | 50 | 5.6% |
| $100,000 to $149,999 | 277 | 31.3% |
| $150,000 to $199,999 | 184 | 20.8% |
| $200,000+ | 136 | 15.3% |
Family Income by Famaliy Size in North Wales borough
5-person families (42 | 4.7%) account for the highest median family income in North Wales borough with $250,001 per family, while 2-person families (403 | 45.5%) have the highest median income of $56,080 per family member.
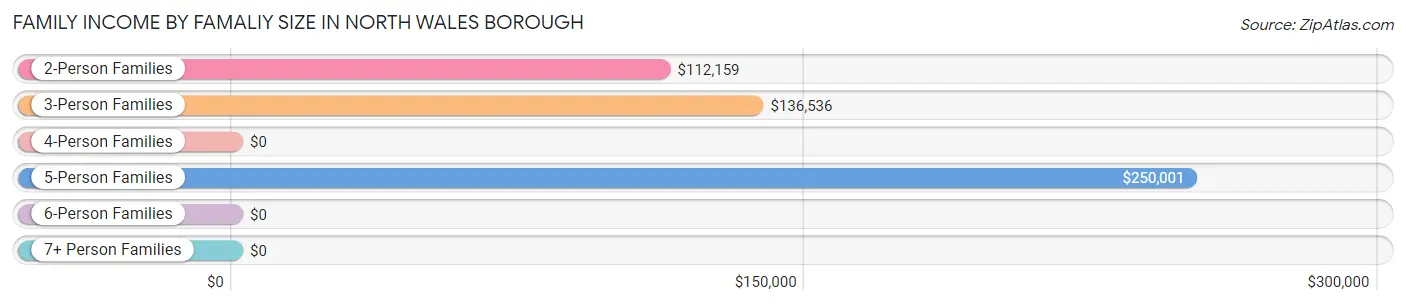
| Income Bracket | # Families | Median Income |
| 2-Person Families | 403 (45.5%) | $112,159 |
| 3-Person Families | 300 (33.9%) | $136,536 |
| 4-Person Families | 95 (10.7%) | $0 |
| 5-Person Families | 42 (4.7%) | $250,001 |
| 6-Person Families | 46 (5.2%) | $0 |
| 7+ Person Families | 0 (0.0%) | $0 |
| Total | 886 (100.0%) | $136,000 |
Family Income by Number of Earners in North Wales borough
The median family income in North Wales borough is $136,000, with families comprising 2 earners (534) having the highest median family income of $143,365, while families with 1 earner (207) have the lowest median family income of $45,375, accounting for 60.3% and 23.4% of families, respectively.
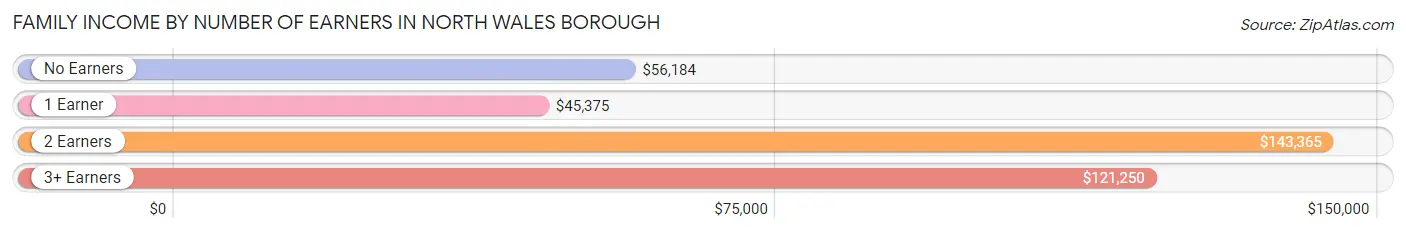
| Number of Earners | # Families | Median Income |
| No Earners | 70 (7.9%) | $56,184 |
| 1 Earner | 207 (23.4%) | $45,375 |
| 2 Earners | 534 (60.3%) | $143,365 |
| 3+ Earners | 75 (8.5%) | $121,250 |
| Total | 886 (100.0%) | $136,000 |
Household Income in North Wales borough
Household Income Brackets in North Wales borough
With 429 households falling in the category, the $100,000 to $149,999 income range is the most frequent in North Wales borough, accounting for 29.3% of all households. In contrast, only 18 households (1.2%) fall into the $10,000 to $14,999 income bracket, making it the least populous group.
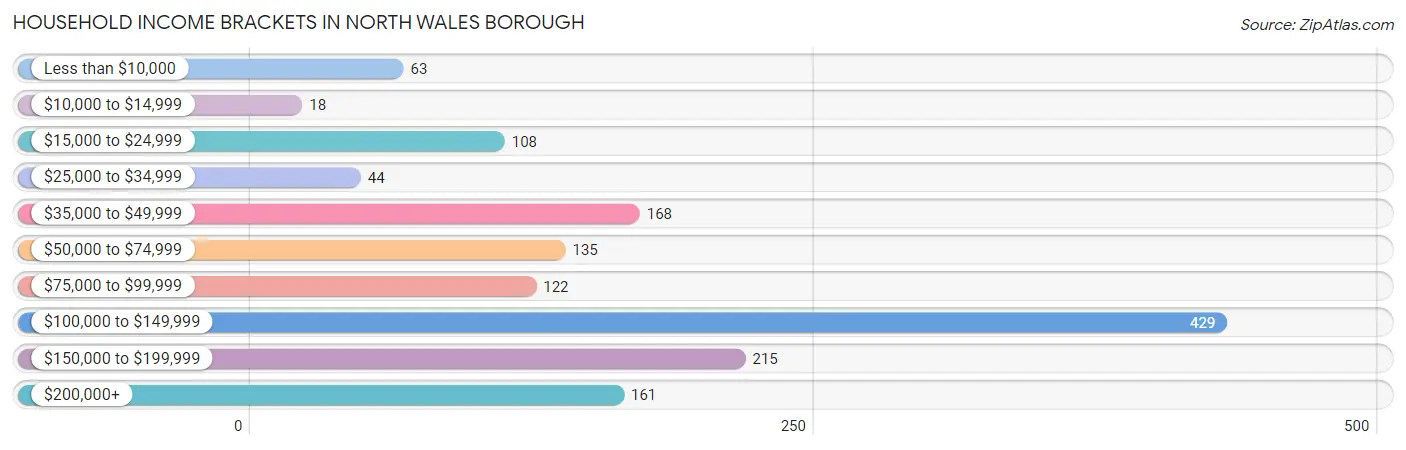
| Income Bracket | # Households | % Households |
| Less than $10,000 | 63 | 4.3% |
| $10,000 to $14,999 | 18 | 1.2% |
| $15,000 to $24,999 | 108 | 7.4% |
| $25,000 to $34,999 | 44 | 3.0% |
| $35,000 to $49,999 | 168 | 11.5% |
| $50,000 to $74,999 | 135 | 9.2% |
| $75,000 to $99,999 | 122 | 8.3% |
| $100,000 to $149,999 | 429 | 29.3% |
| $150,000 to $199,999 | 215 | 14.7% |
| $200,000+ | 161 | 11.0% |
Household Income by Householder Age in North Wales borough
The median household income in North Wales borough is $113,375, with the highest median household income of $143,798 found in the 45 to 64 years age bracket for the primary householder. A total of 449 households (30.7%) fall into this category. Meanwhile, the 15 to 24 years age bracket for the primary householder has the lowest median household income of $0, with 46 households (3.1%) in this group.
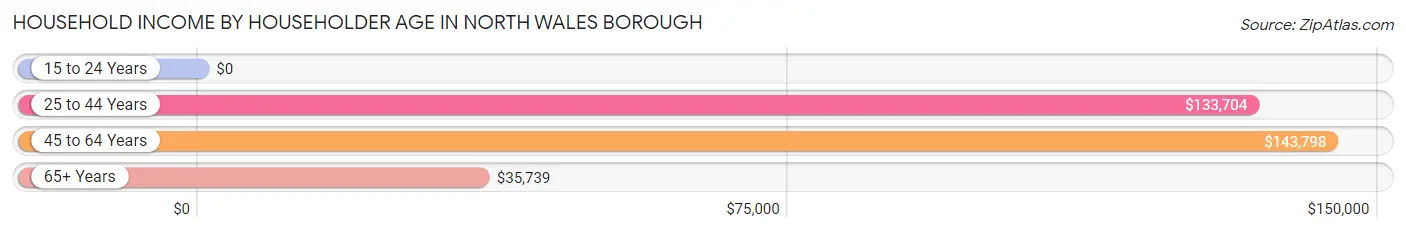
| Income Bracket | # Households | Median Income |
| 15 to 24 Years | 46 (3.1%) | $0 |
| 25 to 44 Years | 642 (43.9%) | $133,704 |
| 45 to 64 Years | 449 (30.7%) | $143,798 |
| 65+ Years | 327 (22.3%) | $35,739 |
| Total | 1,464 (100.0%) | $113,375 |
Poverty in North Wales borough
Income Below Poverty by Sex and Age in North Wales borough
With 4.8% poverty level for males and 5.9% for females among the residents of North Wales borough, under 5 year old males and 18 to 24 year old females are the most vulnerable to poverty, with 24 males (24.7%) and 46 females (24.7%) in their respective age groups living below the poverty level.
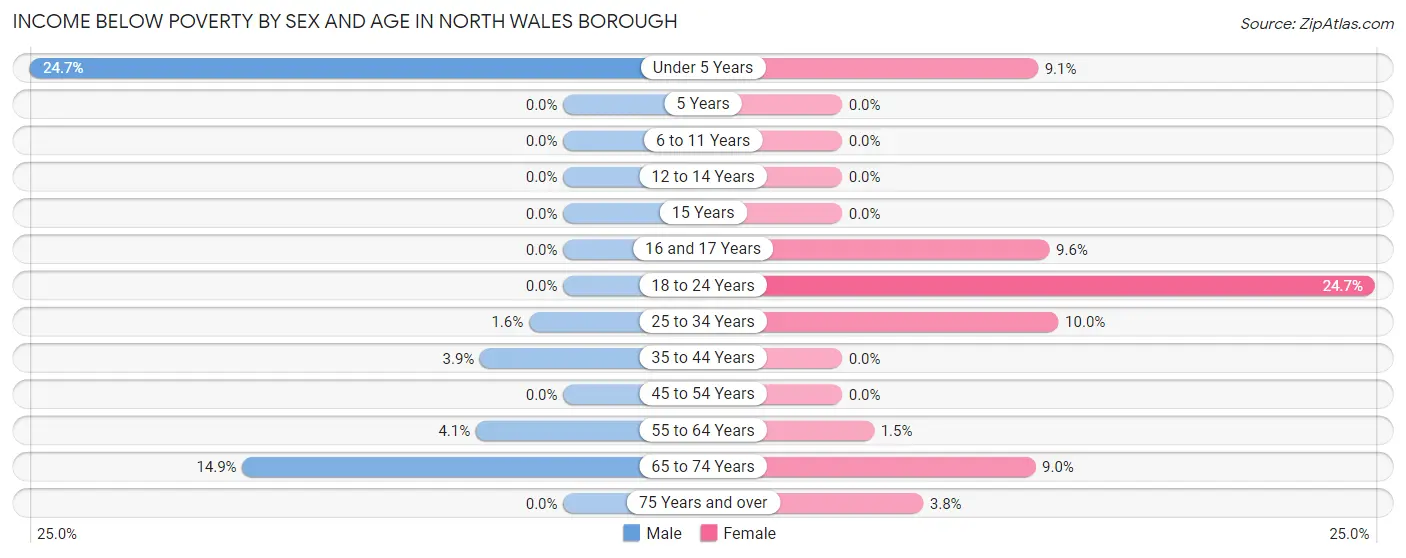
| Age Bracket | Male | Female |
| Under 5 Years | 24 (24.7%) | 11 (9.1%) |
| 5 Years | 0 (0.0%) | 0 (0.0%) |
| 6 to 11 Years | 0 (0.0%) | 0 (0.0%) |
| 12 to 14 Years | 0 (0.0%) | 0 (0.0%) |
| 15 Years | 0 (0.0%) | 0 (0.0%) |
| 16 and 17 Years | 0 (0.0%) | 10 (9.6%) |
| 18 to 24 Years | 0 (0.0%) | 46 (24.7%) |
| 25 to 34 Years | 6 (1.6%) | 25 (10.0%) |
| 35 to 44 Years | 10 (3.9%) | 0 (0.0%) |
| 45 to 54 Years | 0 (0.0%) | 0 (0.0%) |
| 55 to 64 Years | 6 (4.1%) | 3 (1.5%) |
| 65 to 74 Years | 28 (14.9%) | 7 (9.0%) |
| 75 Years and over | 0 (0.0%) | 8 (3.8%) |
| Total | 74 (4.8%) | 110 (5.9%) |
Income Above Poverty by Sex and Age in North Wales borough
According to the poverty statistics in North Wales borough, males aged 5 years and females aged 6 to 11 years are the age groups that are most secure financially, with 100.0% of males and 100.0% of females in these age groups living above the poverty line.
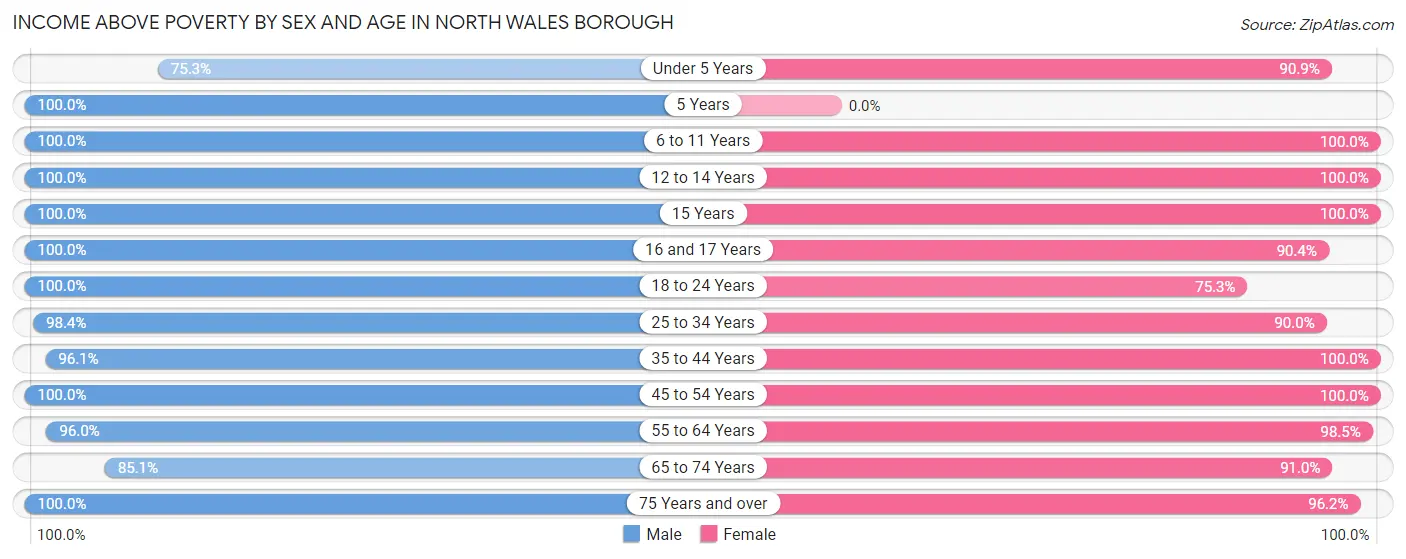
| Age Bracket | Male | Female |
| Under 5 Years | 73 (75.3%) | 110 (90.9%) |
| 5 Years | 19 (100.0%) | 0 (0.0%) |
| 6 to 11 Years | 73 (100.0%) | 123 (100.0%) |
| 12 to 14 Years | 72 (100.0%) | 53 (100.0%) |
| 15 Years | 12 (100.0%) | 74 (100.0%) |
| 16 and 17 Years | 41 (100.0%) | 94 (90.4%) |
| 18 to 24 Years | 17 (100.0%) | 140 (75.3%) |
| 25 to 34 Years | 372 (98.4%) | 224 (90.0%) |
| 35 to 44 Years | 249 (96.1%) | 220 (100.0%) |
| 45 to 54 Years | 193 (100.0%) | 243 (100.0%) |
| 55 to 64 Years | 142 (96.0%) | 200 (98.5%) |
| 65 to 74 Years | 160 (85.1%) | 71 (91.0%) |
| 75 Years and over | 51 (100.0%) | 205 (96.2%) |
| Total | 1,474 (95.2%) | 1,757 (94.1%) |
Income Below Poverty Among Married-Couple Families in North Wales borough
The poverty statistics for married-couple families in North Wales borough show that 1.3% or 8 of the total 628 families live below the poverty line. Families with no children have the highest poverty rate of 2.5%, comprising of 8 families. On the other hand, families with 1 or 2 children have the lowest poverty rate of 0.0%, which includes 0 families.
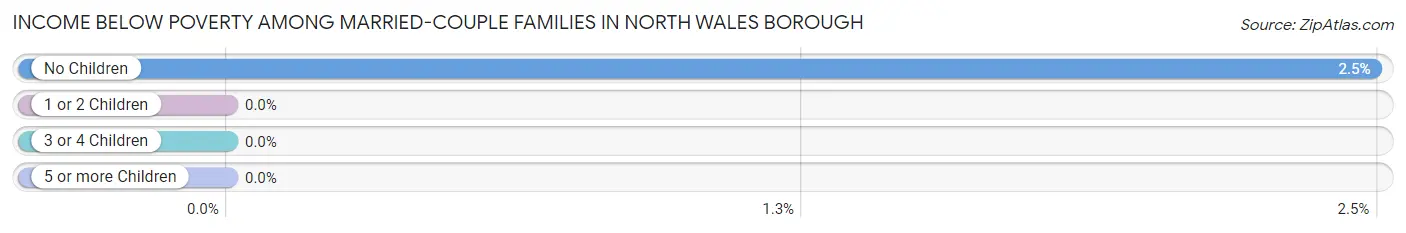
| Children | Above Poverty | Below Poverty |
| No Children | 313 (97.5%) | 8 (2.5%) |
| 1 or 2 Children | 228 (100.0%) | 0 (0.0%) |
| 3 or 4 Children | 79 (100.0%) | 0 (0.0%) |
| 5 or more Children | 0 (0.0%) | 0 (0.0%) |
| Total | 620 (98.7%) | 8 (1.3%) |
Income Below Poverty Among Single-Parent Households in North Wales borough
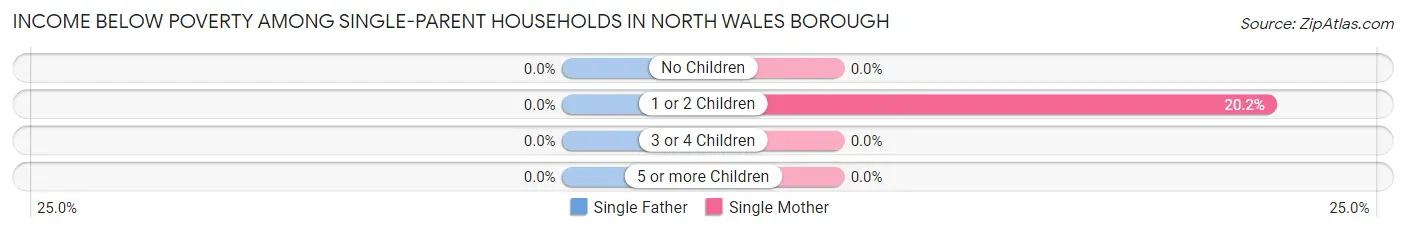
| Children | Single Father | Single Mother |
| No Children | 0 (0.0%) | 0 (0.0%) |
| 1 or 2 Children | 0 (0.0%) | 25 (20.2%) |
| 3 or 4 Children | 0 (0.0%) | 0 (0.0%) |
| 5 or more Children | 0 (0.0%) | 0 (0.0%) |
| Total | 0 (0.0%) | 25 (15.9%) |
Income Below Poverty Among Married-Couple vs Single-Parent Households in North Wales borough
The poverty data for North Wales borough shows that 8 of the married-couple family households (1.3%) and 25 of the single-parent households (9.7%) are living below the poverty level. Within the married-couple family households, those with no children have the highest poverty rate, with 8 households (2.5%) falling below the poverty line. Among the single-parent households, those with 1 or 2 children have the highest poverty rate, with 25 household (18.7%) living below poverty.
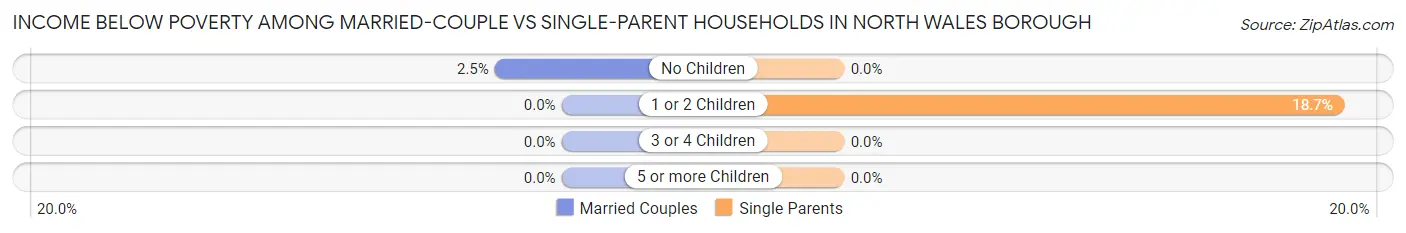
| Children | Married-Couple Families | Single-Parent Households |
| No Children | 8 (2.5%) | 0 (0.0%) |
| 1 or 2 Children | 0 (0.0%) | 25 (18.7%) |
| 3 or 4 Children | 0 (0.0%) | 0 (0.0%) |
| 5 or more Children | 0 (0.0%) | 0 (0.0%) |
| Total | 8 (1.3%) | 25 (9.7%) |
Race in North Wales borough
The most populous races in North Wales borough are White / Caucasian (2,889 | 84.6%), Two or more Races (284 | 8.3%), and Hispanic or Latino (178 | 5.2%).
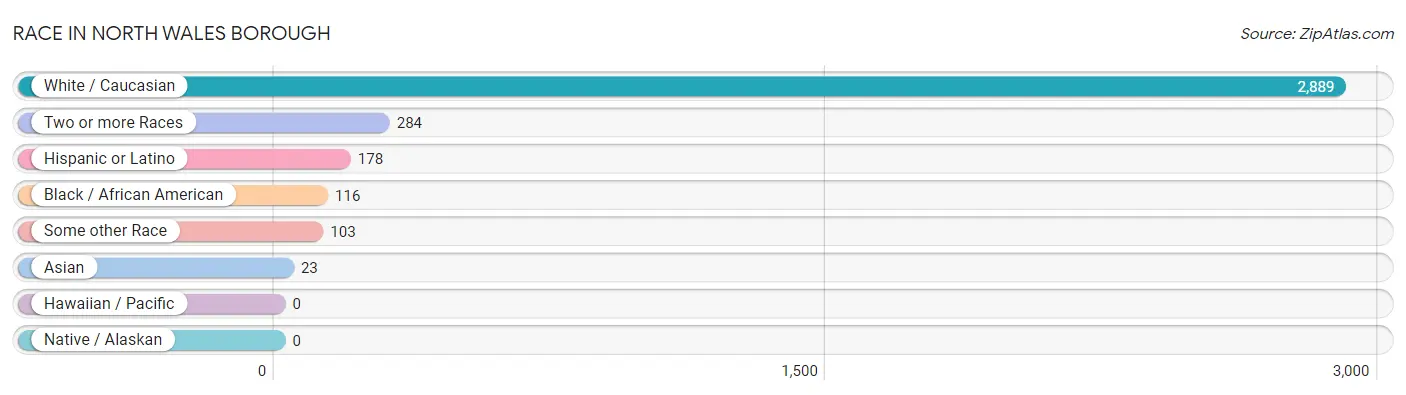
| Race | # Population | % Population |
| Asian | 23 | 0.7% |
| Black / African American | 116 | 3.4% |
| Hawaiian / Pacific | 0 | 0.0% |
| Hispanic or Latino | 178 | 5.2% |
| Native / Alaskan | 0 | 0.0% |
| White / Caucasian | 2,889 | 84.6% |
| Two or more Races | 284 | 8.3% |
| Some other Race | 103 | 3.0% |
| Total | 3,415 | 100.0% |
Ancestry in North Wales borough
The most populous ancestries reported in North Wales borough are Irish (1,127 | 33.0%), Italian (744 | 21.8%), German (667 | 19.5%), English (570 | 16.7%), and American (289 | 8.5%), together accounting for 99.5% of all North Wales borough residents.
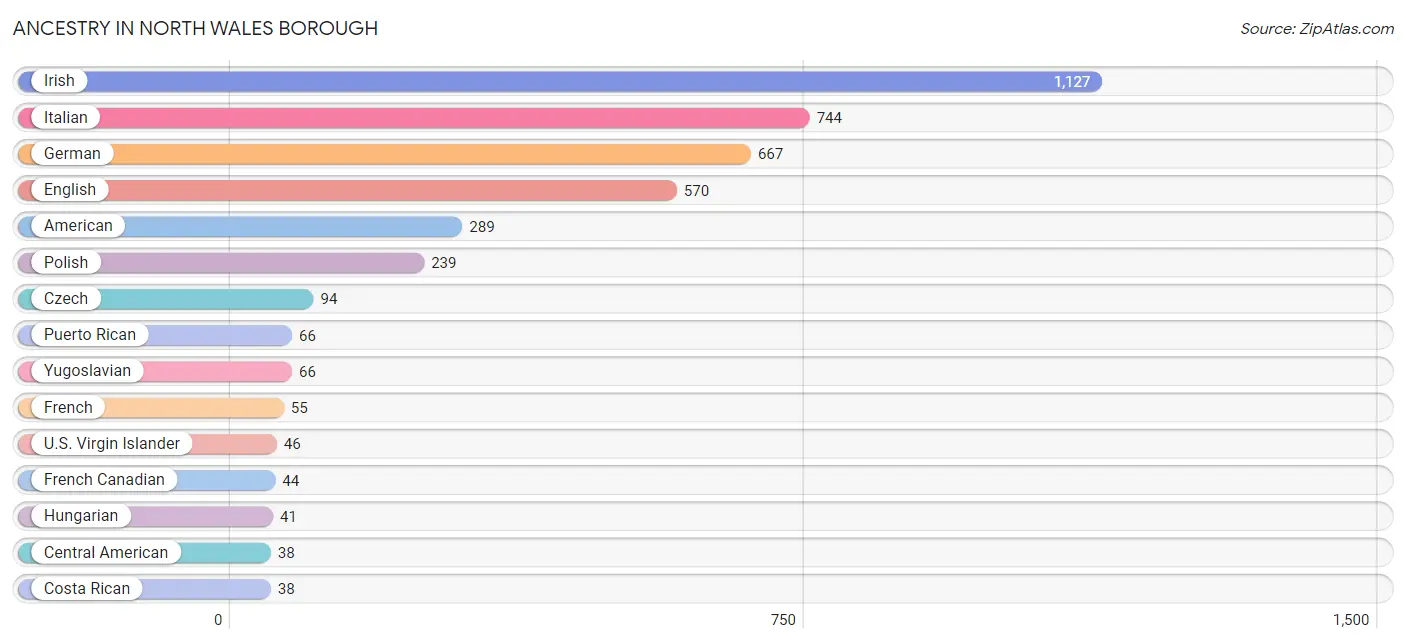
| Ancestry | # Population | % Population |
| American | 289 | 8.5% |
| Austrian | 12 | 0.4% |
| British | 30 | 0.9% |
| Central American | 38 | 1.1% |
| Costa Rican | 38 | 1.1% |
| Cuban | 34 | 1.0% |
| Czech | 94 | 2.8% |
| Dutch | 8 | 0.2% |
| Eastern European | 13 | 0.4% |
| English | 570 | 16.7% |
| European | 11 | 0.3% |
| French | 55 | 1.6% |
| French Canadian | 44 | 1.3% |
| German | 667 | 19.5% |
| Hungarian | 41 | 1.2% |
| Indian (Asian) | 23 | 0.7% |
| Irish | 1,127 | 33.0% |
| Iroquois | 17 | 0.5% |
| Italian | 744 | 21.8% |
| Latvian | 8 | 0.2% |
| Lithuanian | 17 | 0.5% |
| Mexican | 24 | 0.7% |
| Northern European | 9 | 0.3% |
| Norwegian | 17 | 0.5% |
| Pennsylvania German | 8 | 0.2% |
| Polish | 239 | 7.0% |
| Puerto Rican | 66 | 1.9% |
| Scottish | 31 | 0.9% |
| U.S. Virgin Islander | 46 | 1.3% |
| Ukrainian | 9 | 0.3% |
| Welsh | 28 | 0.8% |
| Yugoslavian | 66 | 1.9% | View All 32 Rows |
Immigrants in North Wales borough
The most numerous immigrant groups reported in North Wales borough came from Central America (38 | 1.1%), Costa Rica (38 | 1.1%), Latin America (38 | 1.1%), Europe (28 | 0.8%), and Asia (23 | 0.7%), together accounting for 4.8% of all North Wales borough residents.
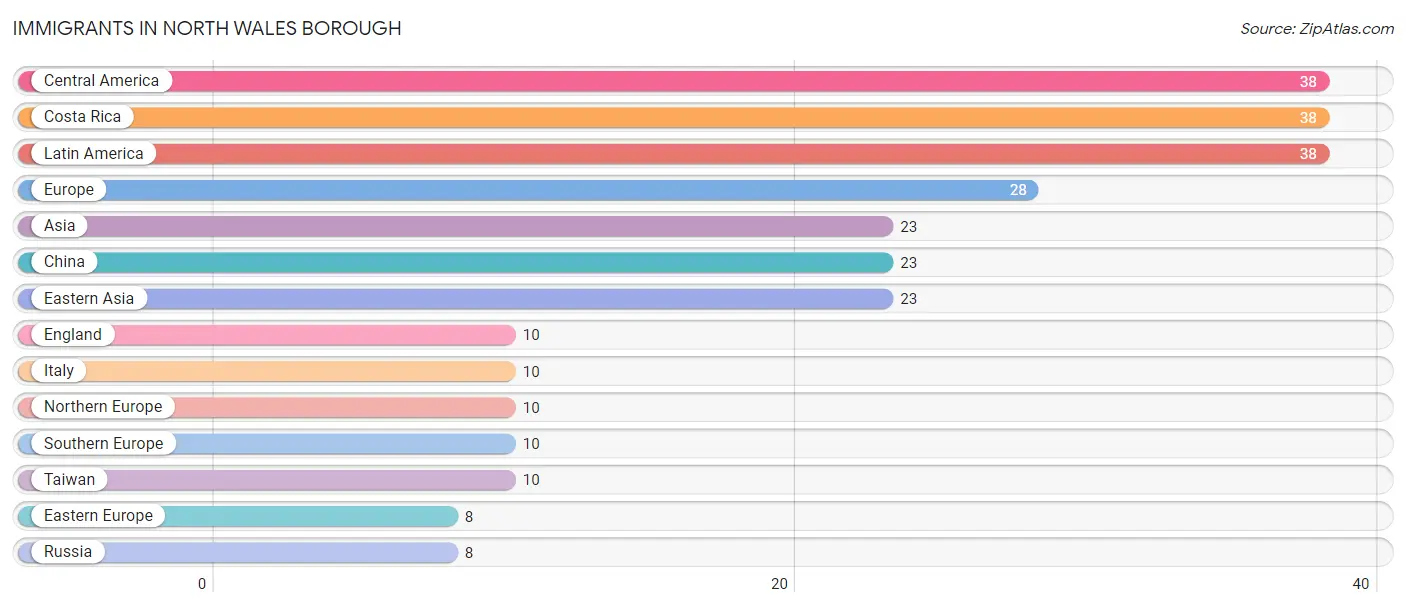
| Immigration Origin | # Population | % Population |
| Asia | 23 | 0.7% |
| Central America | 38 | 1.1% |
| China | 23 | 0.7% |
| Costa Rica | 38 | 1.1% |
| Eastern Asia | 23 | 0.7% |
| Eastern Europe | 8 | 0.2% |
| England | 10 | 0.3% |
| Europe | 28 | 0.8% |
| Italy | 10 | 0.3% |
| Latin America | 38 | 1.1% |
| Northern Europe | 10 | 0.3% |
| Russia | 8 | 0.2% |
| Southern Europe | 10 | 0.3% |
| Taiwan | 10 | 0.3% | View All 14 Rows |
Sex and Age in North Wales borough
Sex and Age in North Wales borough
The most populous age groups in North Wales borough are 25 to 29 Years (262 | 16.9%) for men and 30 to 34 Years (197 | 10.5%) for women.
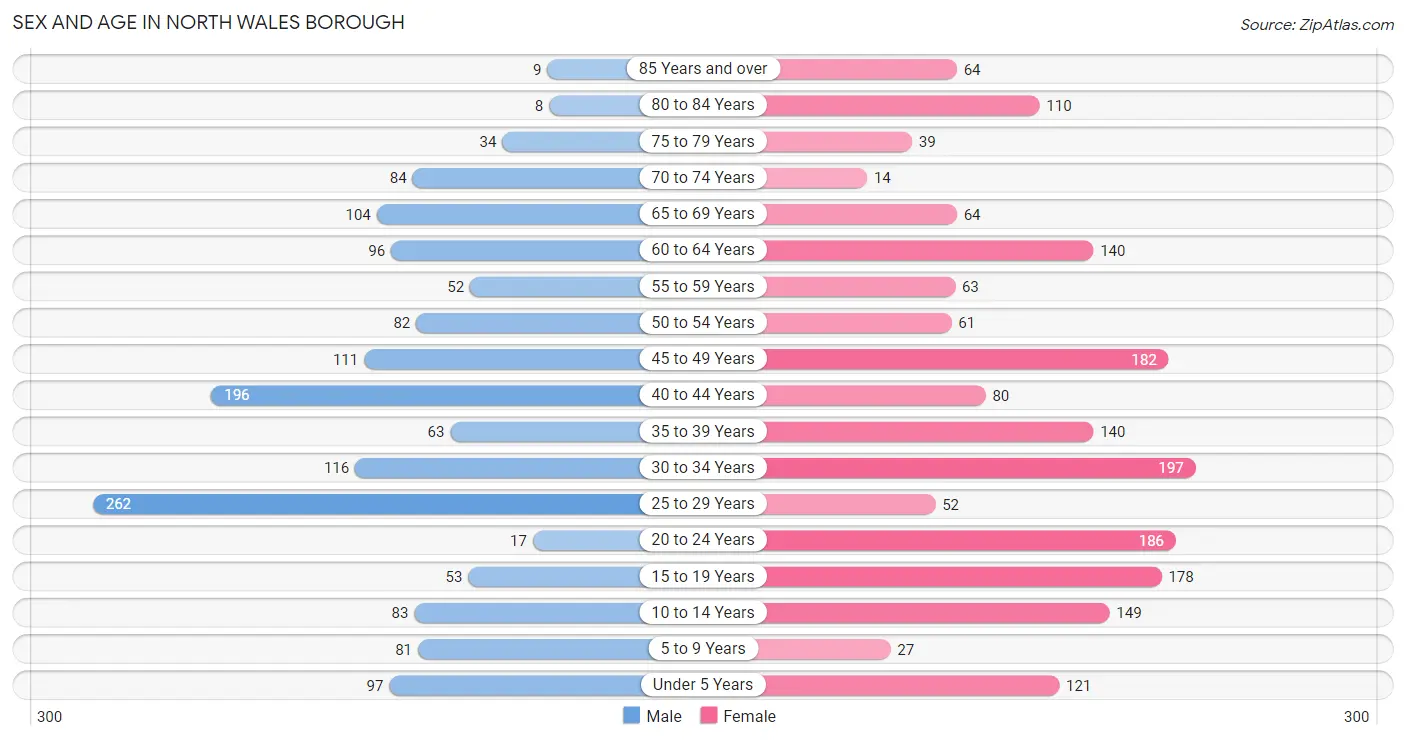
| Age Bracket | Male | Female |
| Under 5 Years | 97 (6.3%) | 121 (6.5%) |
| 5 to 9 Years | 81 (5.2%) | 27 (1.5%) |
| 10 to 14 Years | 83 (5.4%) | 149 (8.0%) |
| 15 to 19 Years | 53 (3.4%) | 178 (9.5%) |
| 20 to 24 Years | 17 (1.1%) | 186 (10.0%) |
| 25 to 29 Years | 262 (16.9%) | 52 (2.8%) |
| 30 to 34 Years | 116 (7.5%) | 197 (10.5%) |
| 35 to 39 Years | 63 (4.1%) | 140 (7.5%) |
| 40 to 44 Years | 196 (12.7%) | 80 (4.3%) |
| 45 to 49 Years | 111 (7.2%) | 182 (9.8%) |
| 50 to 54 Years | 82 (5.3%) | 61 (3.3%) |
| 55 to 59 Years | 52 (3.4%) | 63 (3.4%) |
| 60 to 64 Years | 96 (6.2%) | 140 (7.5%) |
| 65 to 69 Years | 104 (6.7%) | 64 (3.4%) |
| 70 to 74 Years | 84 (5.4%) | 14 (0.7%) |
| 75 to 79 Years | 34 (2.2%) | 39 (2.1%) |
| 80 to 84 Years | 8 (0.5%) | 110 (5.9%) |
| 85 Years and over | 9 (0.6%) | 64 (3.4%) |
| Total | 1,548 (100.0%) | 1,867 (100.0%) |
Families and Households in North Wales borough
Median Family Size in North Wales borough
The median family size in North Wales borough is 2.85 persons per family, with married-couple families (628 | 70.9%) accounting for the largest median family size of 2.95 persons per family. On the other hand, single female/mother families (157 | 17.7%) represent the smallest median family size with 2.58 persons per family.
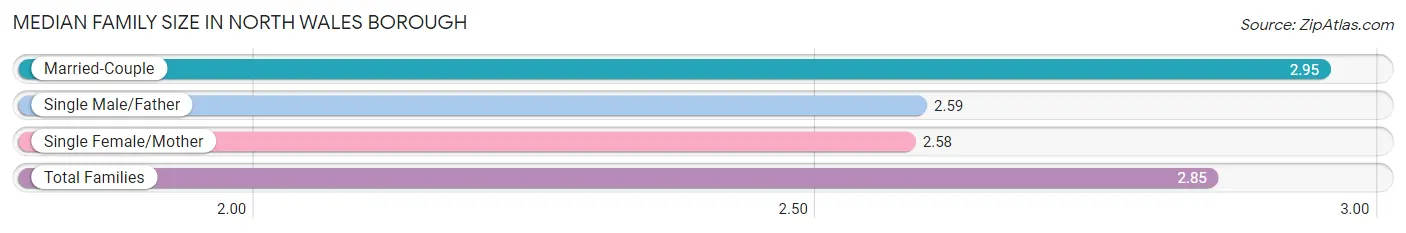
| Family Type | # Families | Family Size |
| Married-Couple | 628 (70.9%) | 2.95 |
| Single Male/Father | 101 (11.4%) | 2.59 |
| Single Female/Mother | 157 (17.7%) | 2.58 |
| Total Families | 886 (100.0%) | 2.85 |
Median Household Size in North Wales borough
The median household size in North Wales borough is 2.29 persons per household, with married-couple households (628 | 42.9%) accounting for the largest median household size of 2.95 persons per household. non-family households (578 | 39.5%) represent the smallest median household size with 1.35 persons per household.
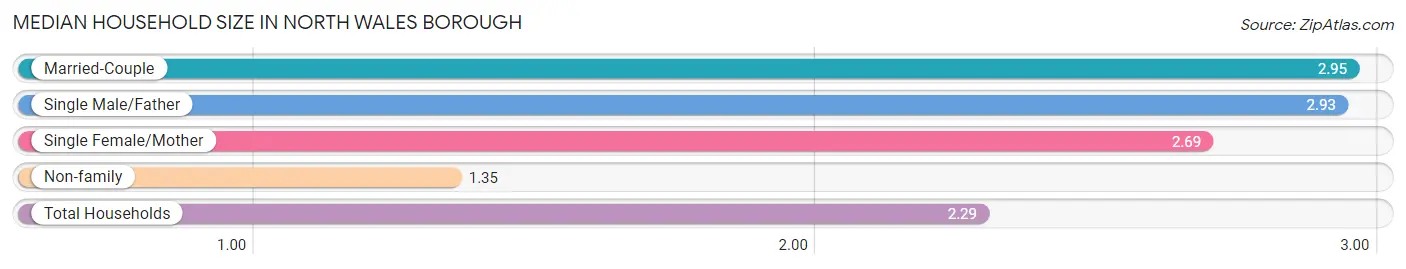
| Household Type | # Households | Household Size |
| Married-Couple | 628 (42.9%) | 2.95 |
| Single Male/Father | 101 (6.9%) | 2.93 |
| Single Female/Mother | 157 (10.7%) | 2.69 |
| Non-family | 578 (39.5%) | 1.35 |
| Total Households | 1,464 (100.0%) | 2.29 |
Household Size by Marriage Status in North Wales borough
Out of a total of 1,464 households in North Wales borough, 886 (60.5%) are family households, while 578 (39.5%) are nonfamily households. The most numerous type of family households are 2-person households, comprising 387, and the most common type of nonfamily households are 1-person households, comprising 377.
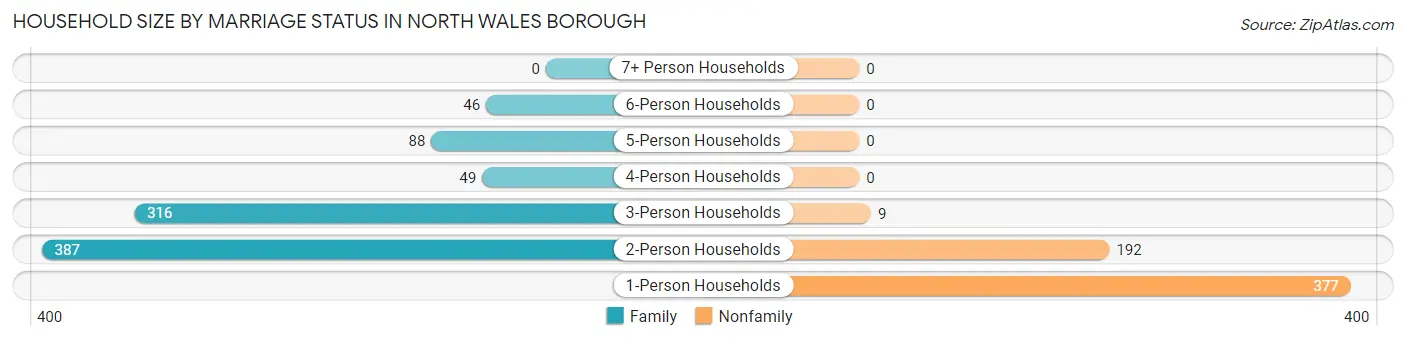
| Household Size | Family Households | Nonfamily Households |
| 1-Person Households | - | 377 (25.8%) |
| 2-Person Households | 387 (26.4%) | 192 (13.1%) |
| 3-Person Households | 316 (21.6%) | 9 (0.6%) |
| 4-Person Households | 49 (3.4%) | 0 (0.0%) |
| 5-Person Households | 88 (6.0%) | 0 (0.0%) |
| 6-Person Households | 46 (3.1%) | 0 (0.0%) |
| 7+ Person Households | 0 (0.0%) | 0 (0.0%) |
| Total | 886 (60.5%) | 578 (39.5%) |
Female Fertility in North Wales borough
Fertility by Age in North Wales borough
Average fertility rate in North Wales borough is 9.0 births per 1,000 women. Women in the age bracket of 35 to 50 years have the highest fertility rate with 21.0 births per 1,000 women. Women in the age bracket of 35 to 50 years acount for 100.0% of all women with births.
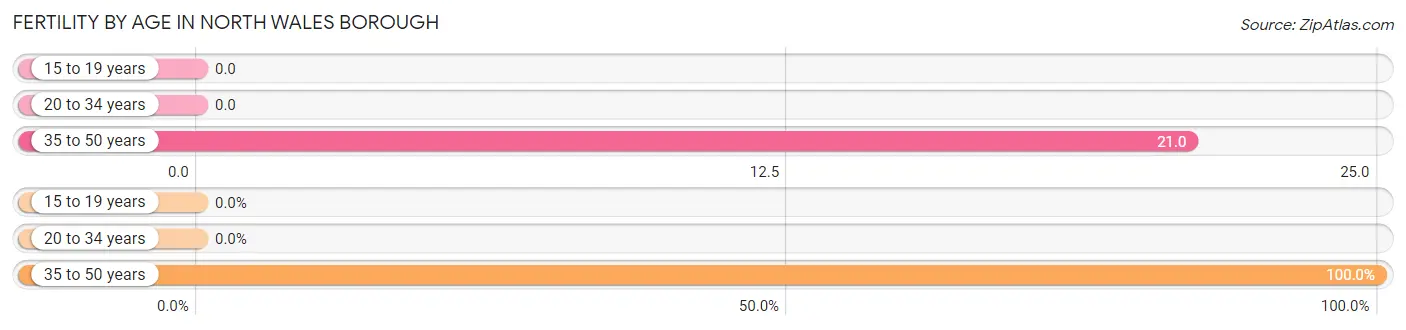
| Age Bracket | Women with Births | Births / 1,000 Women |
| 15 to 19 years | 0 (0.0%) | 0.0 |
| 20 to 34 years | 0 (0.0%) | 0.0 |
| 35 to 50 years | 9 (100.0%) | 21.0 |
| Total | 9 (100.0%) | 9.0 |
Fertility by Age by Marriage Status in North Wales borough
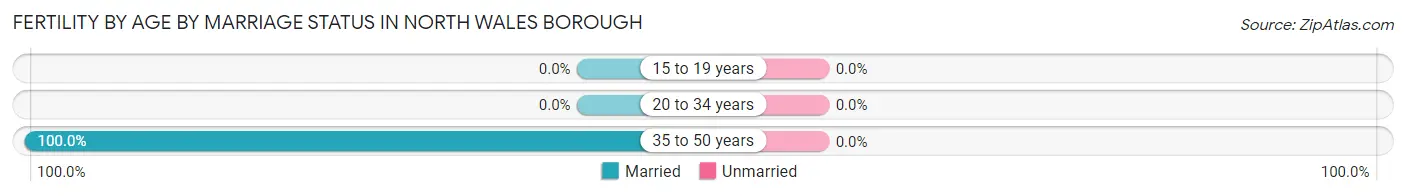
| Age Bracket | Married | Unmarried |
| 15 to 19 years | 0 (0.0%) | 0 (0.0%) |
| 20 to 34 years | 0 (0.0%) | 0 (0.0%) |
| 35 to 50 years | 9 (100.0%) | 0 (0.0%) |
| Total | 9 (100.0%) | 0 (0.0%) |
Fertility by Education in North Wales borough
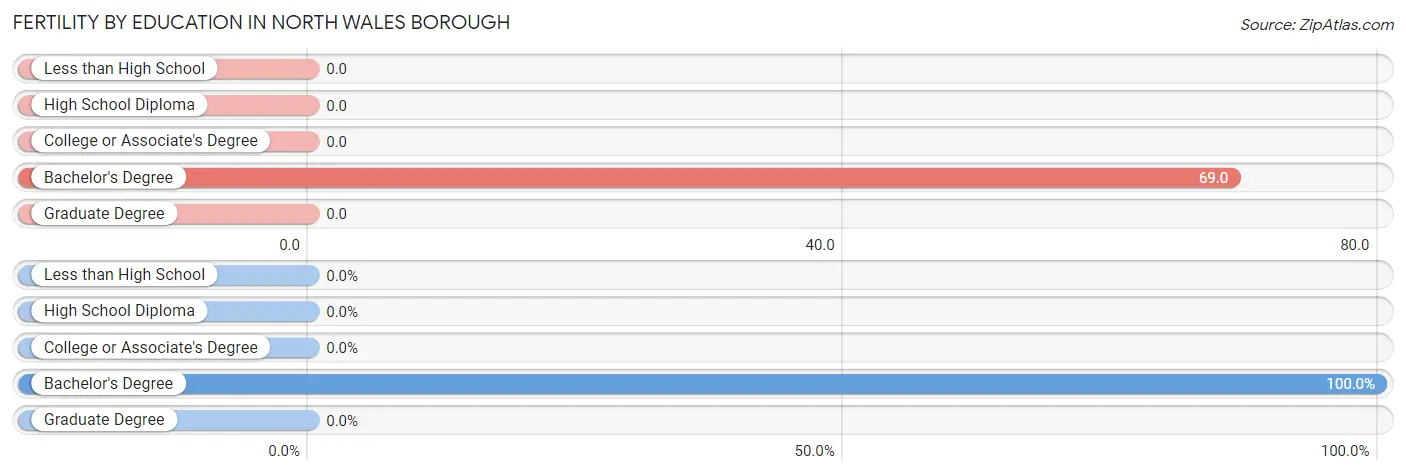
| Educational Attainment | Women with Births | Births / 1,000 Women |
| Less than High School | 0 (0.0%) | 0.0 |
| High School Diploma | 0 (0.0%) | 0.0 |
| College or Associate's Degree | 0 (0.0%) | 0.0 |
| Bachelor's Degree | 9 (100.0%) | 69.0 |
| Graduate Degree | 0 (0.0%) | 0.0 |
| Total | 9 (100.0%) | 9.0 |
Fertility by Education by Marriage Status in North Wales borough
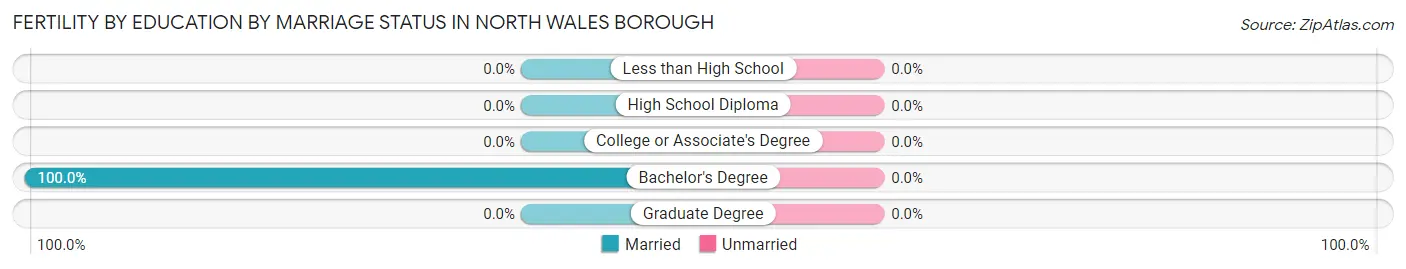
| Educational Attainment | Married | Unmarried |
| Less than High School | 0 (0.0%) | 0 (0.0%) |
| High School Diploma | 0 (0.0%) | 0 (0.0%) |
| College or Associate's Degree | 0 (0.0%) | 0 (0.0%) |
| Bachelor's Degree | 9 (100.0%) | 0 (0.0%) |
| Graduate Degree | 0 (0.0%) | 0 (0.0%) |
| Total | 9 (100.0%) | 0 (0.0%) |
Employment Characteristics in North Wales borough
Employment by Class of Employer in North Wales borough
Among the 2,010 employed individuals in North Wales borough, private company employees (1,457 | 72.5%), not-for-profit organizations (282 | 14.0%), and self-employed (not incorporated) (108 | 5.4%) make up the most common classes of employment.
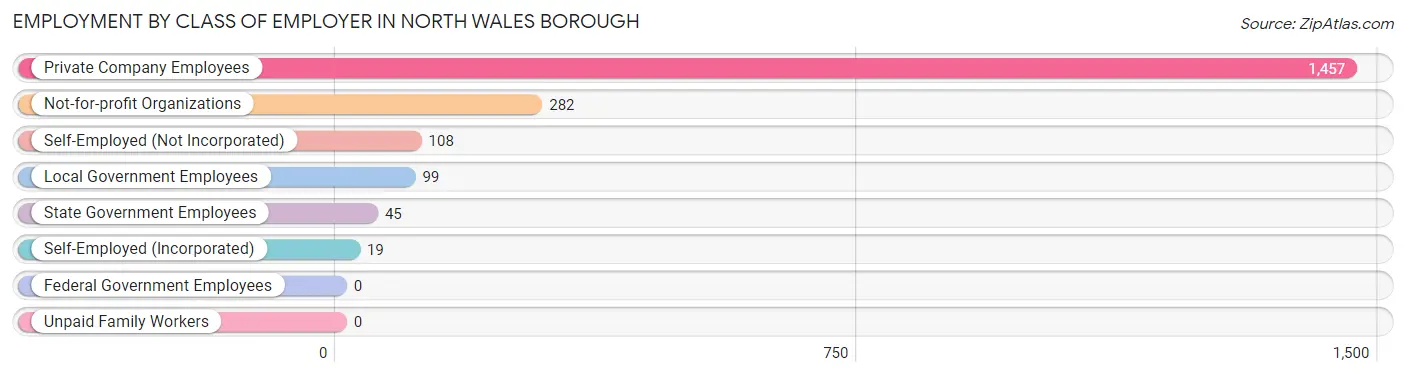
| Employer Class | # Employees | % Employees |
| Private Company Employees | 1,457 | 72.5% |
| Self-Employed (Incorporated) | 19 | 0.9% |
| Self-Employed (Not Incorporated) | 108 | 5.4% |
| Not-for-profit Organizations | 282 | 14.0% |
| Local Government Employees | 99 | 4.9% |
| State Government Employees | 45 | 2.2% |
| Federal Government Employees | 0 | 0.0% |
| Unpaid Family Workers | 0 | 0.0% |
| Total | 2,010 | 100.0% |
Employment Status by Age in North Wales borough
According to the labor force statistics for North Wales borough, out of the total population over 16 years of age (2,771), 75.0% or 2,078 individuals are in the labor force, with 2.7% or 56 of them unemployed. The age group with the highest labor force participation rate is 20 to 24 years, with 100.0% or 203 individuals in the labor force. Within the labor force, the 16 to 19 years age range has the highest percentage of unemployed individuals, with 52.3% or 34 of them being unemployed.
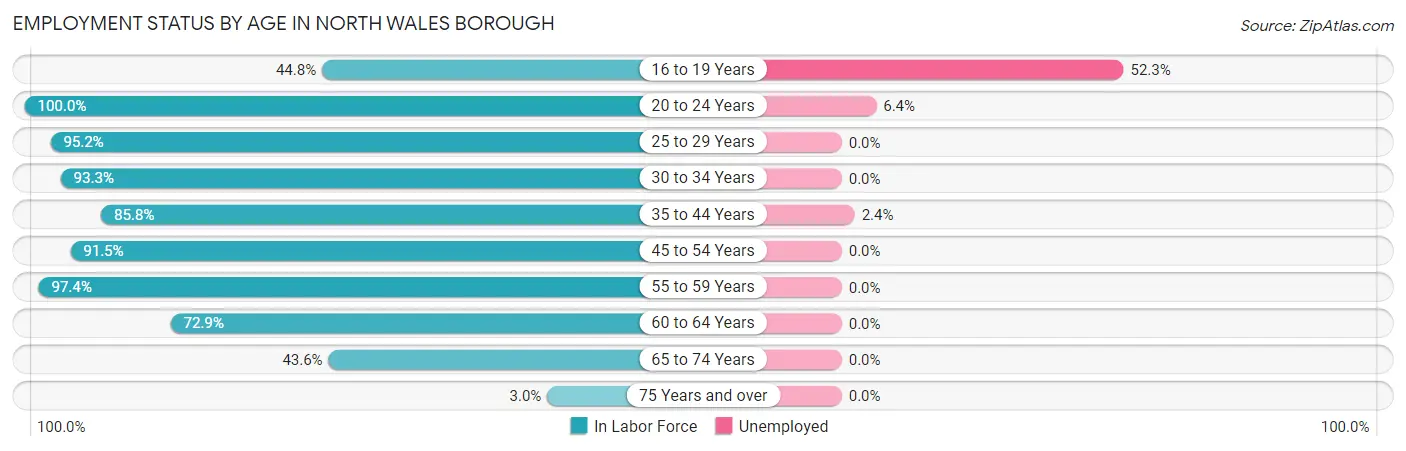
| Age Bracket | In Labor Force | Unemployed |
| 16 to 19 Years | 65 (44.8%) | 34 (52.3%) |
| 20 to 24 Years | 203 (100.0%) | 13 (6.4%) |
| 25 to 29 Years | 299 (95.2%) | 0 (0.0%) |
| 30 to 34 Years | 292 (93.3%) | 0 (0.0%) |
| 35 to 44 Years | 411 (85.8%) | 10 (2.4%) |
| 45 to 54 Years | 399 (91.5%) | 0 (0.0%) |
| 55 to 59 Years | 112 (97.4%) | 0 (0.0%) |
| 60 to 64 Years | 172 (72.9%) | 0 (0.0%) |
| 65 to 74 Years | 116 (43.6%) | 0 (0.0%) |
| 75 Years and over | 8 (3.0%) | 0 (0.0%) |
| Total | 2,078 (75.0%) | 56 (2.7%) |
Employment Status by Educational Attainment in North Wales borough
According to labor force statistics for North Wales borough, 89.0% of individuals (1,685) out of the total population between 25 and 64 years of age (1,893) are in the labor force, with 0.6% or 10 of them being unemployed. The group with the highest labor force participation rate are those with the educational attainment of high school diploma, with 100.0% or 318 individuals in the labor force. Within the labor force, individuals with high school diploma education have the highest percentage of unemployment, with 3.1% or 10 of them being unemployed.
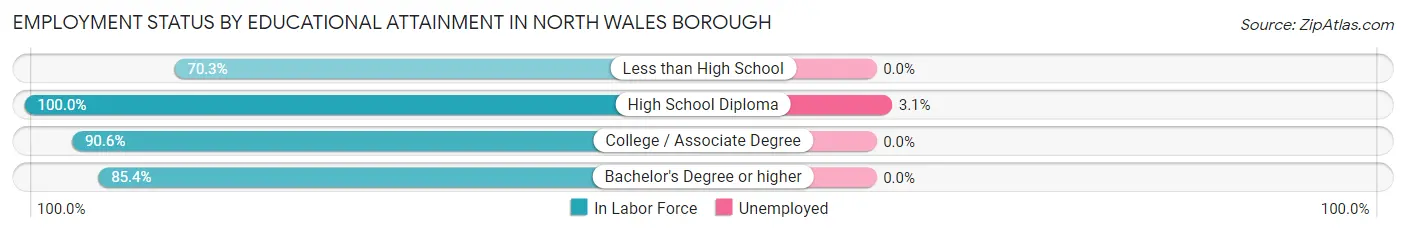
| Educational Attainment | In Labor Force | Unemployed |
| Less than High School | 45 (70.3%) | 0 (0.0%) |
| High School Diploma | 318 (100.0%) | 10 (3.1%) |
| College / Associate Degree | 550 (90.6%) | 0 (0.0%) |
| Bachelor's Degree or higher | 772 (85.4%) | 0 (0.0%) |
| Total | 1,685 (89.0%) | 11 (0.6%) |
Employment Occupations by Sex in North Wales borough
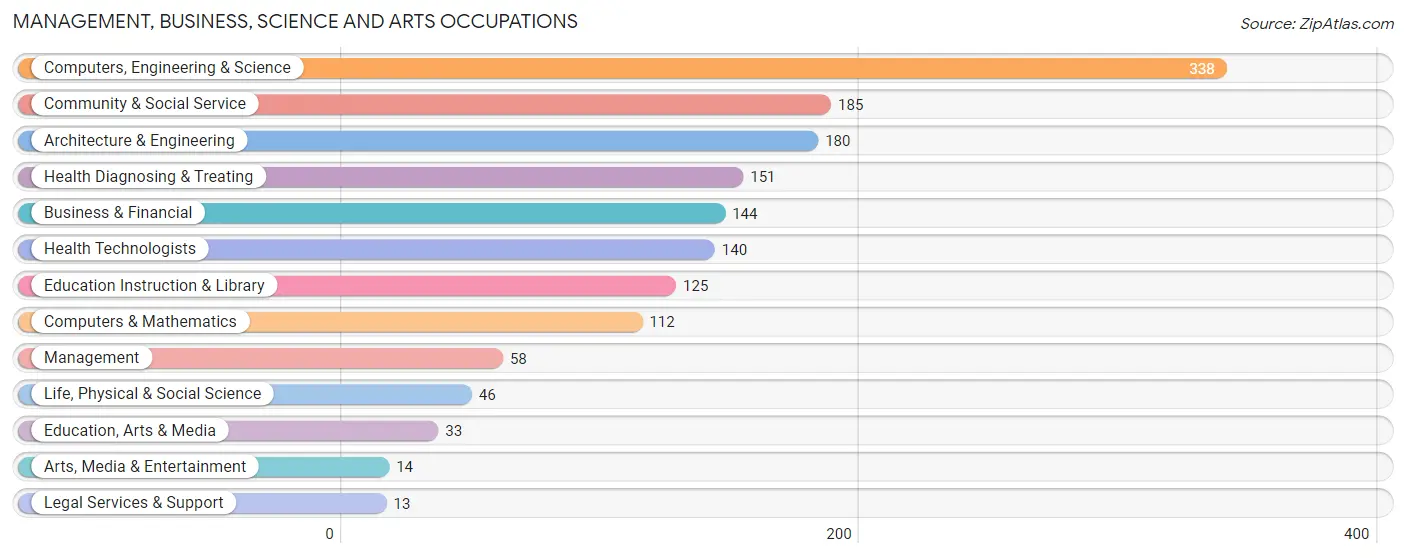
Management, Business, Science and Arts Occupations
The most common Management, Business, Science and Arts occupations in North Wales borough are Computers, Engineering & Science (338 | 16.7%), Community & Social Service (185 | 9.2%), Architecture & Engineering (180 | 8.9%), Health Diagnosing & Treating (151 | 7.5%), and Business & Financial (144 | 7.1%).
Management, Business, Science and Arts Occupations by Sex
Within the Management, Business, Science and Arts occupations in North Wales borough, the most male-oriented occupations are Architecture & Engineering (94.4%), Management (82.8%), and Computers, Engineering & Science (78.7%), while the most female-oriented occupations are Education, Arts & Media (100.0%), Legal Services & Support (100.0%), and Arts, Media & Entertainment (100.0%).
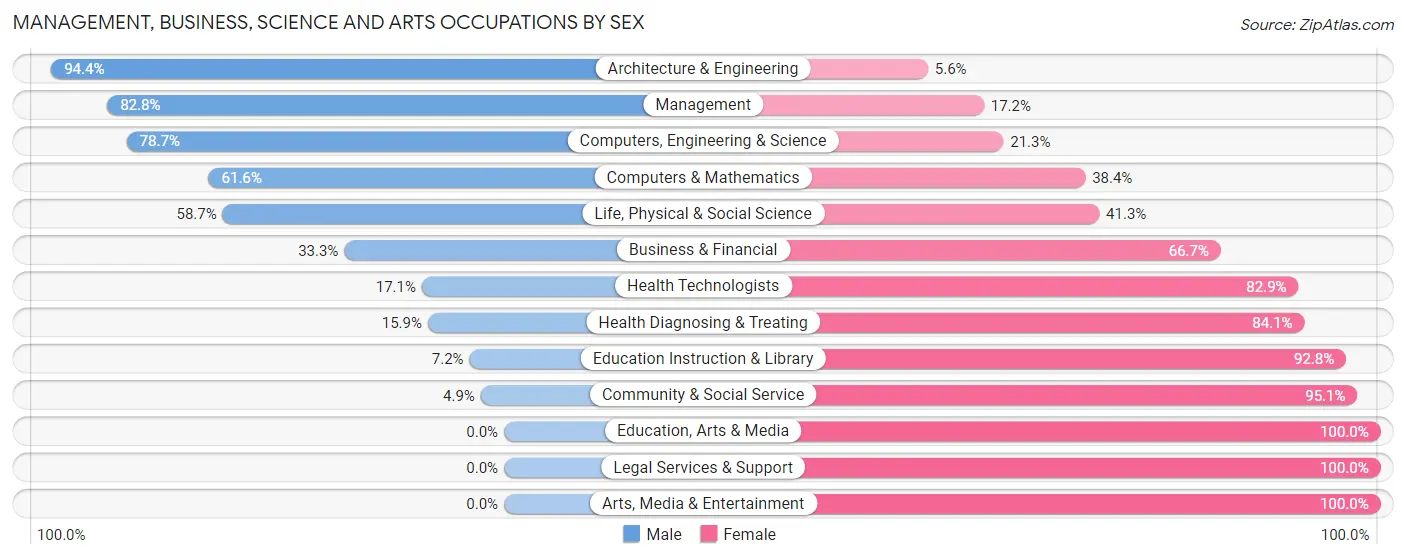
| Occupation | Male | Female |
| Management | 48 (82.8%) | 10 (17.2%) |
| Business & Financial | 48 (33.3%) | 96 (66.7%) |
| Computers, Engineering & Science | 266 (78.7%) | 72 (21.3%) |
| Computers & Mathematics | 69 (61.6%) | 43 (38.4%) |
| Architecture & Engineering | 170 (94.4%) | 10 (5.6%) |
| Life, Physical & Social Science | 27 (58.7%) | 19 (41.3%) |
| Community & Social Service | 9 (4.9%) | 176 (95.1%) |
| Education, Arts & Media | 0 (0.0%) | 33 (100.0%) |
| Legal Services & Support | 0 (0.0%) | 13 (100.0%) |
| Education Instruction & Library | 9 (7.2%) | 116 (92.8%) |
| Arts, Media & Entertainment | 0 (0.0%) | 14 (100.0%) |
| Health Diagnosing & Treating | 24 (15.9%) | 127 (84.1%) |
| Health Technologists | 24 (17.1%) | 116 (82.9%) |
| Total (Category) | 395 (45.1%) | 481 (54.9%) |
| Total (Overall) | 1,050 (52.0%) | 970 (48.0%) |
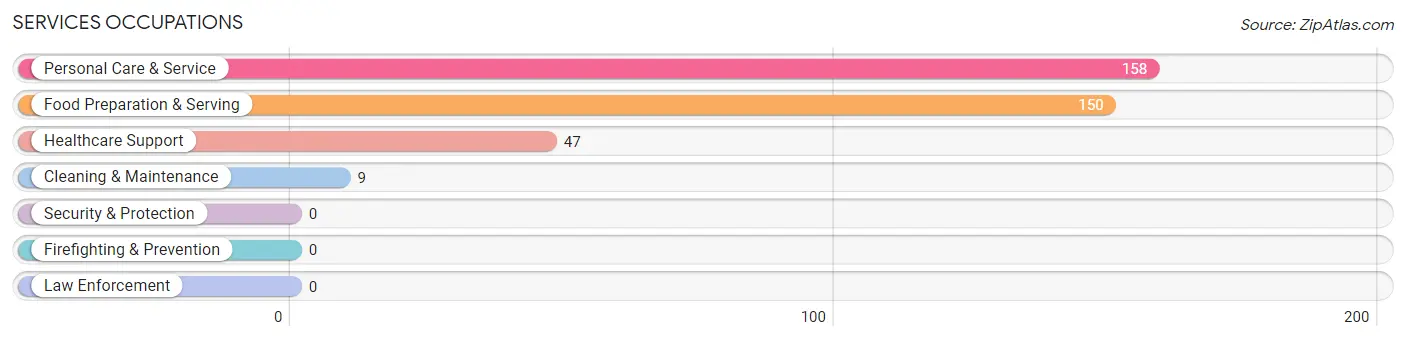
Services Occupations
The most common Services occupations in North Wales borough are Personal Care & Service (158 | 7.8%), Food Preparation & Serving (150 | 7.4%), Healthcare Support (47 | 2.3%), and Cleaning & Maintenance (9 | 0.4%).
Services Occupations by Sex
Within the Services occupations in North Wales borough, the most male-oriented occupations are Healthcare Support (78.7%), Food Preparation & Serving (64.0%), and Personal Care & Service (6.3%), while the most female-oriented occupations are Cleaning & Maintenance (100.0%), Personal Care & Service (93.7%), and Food Preparation & Serving (36.0%).
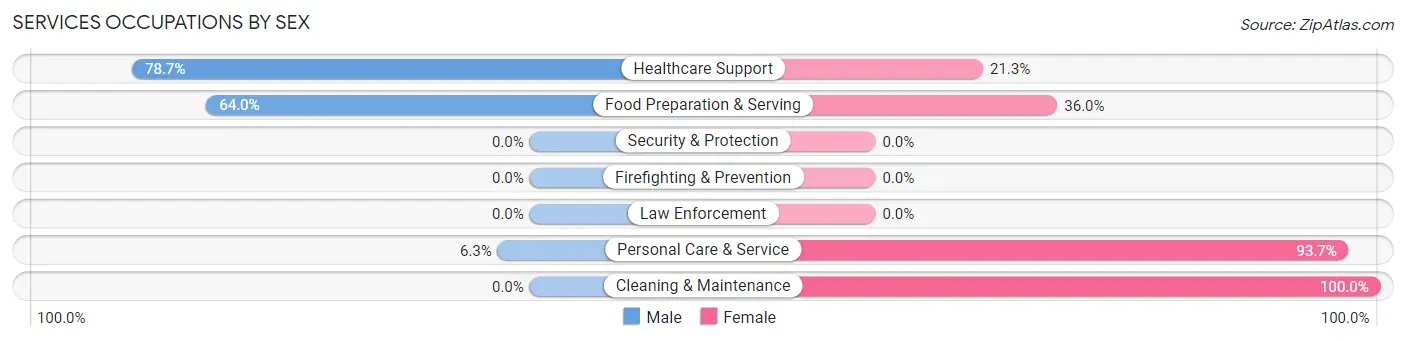
| Occupation | Male | Female |
| Healthcare Support | 37 (78.7%) | 10 (21.3%) |
| Security & Protection | 0 (0.0%) | 0 (0.0%) |
| Firefighting & Prevention | 0 (0.0%) | 0 (0.0%) |
| Law Enforcement | 0 (0.0%) | 0 (0.0%) |
| Food Preparation & Serving | 96 (64.0%) | 54 (36.0%) |
| Cleaning & Maintenance | 0 (0.0%) | 9 (100.0%) |
| Personal Care & Service | 10 (6.3%) | 148 (93.7%) |
| Total (Category) | 143 (39.3%) | 221 (60.7%) |
| Total (Overall) | 1,050 (52.0%) | 970 (48.0%) |
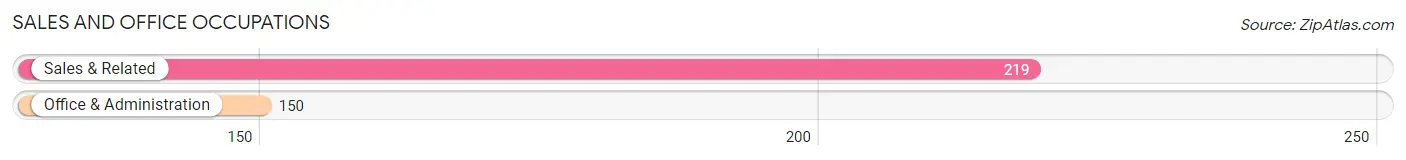
Sales and Office Occupations
The most common Sales and Office occupations in North Wales borough are Sales & Related (219 | 10.8%), and Office & Administration (150 | 7.4%).
Sales and Office Occupations by Sex
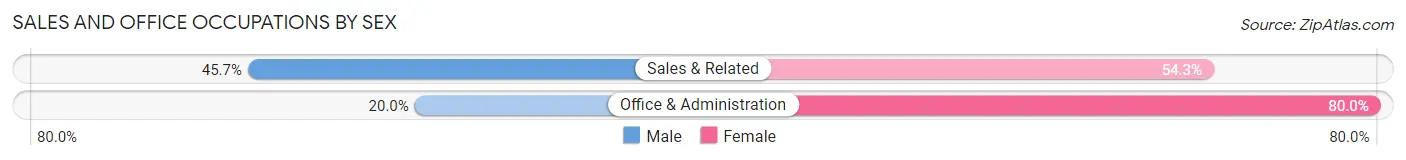
| Occupation | Male | Female |
| Sales & Related | 100 (45.7%) | 119 (54.3%) |
| Office & Administration | 30 (20.0%) | 120 (80.0%) |
| Total (Category) | 130 (35.2%) | 239 (64.8%) |
| Total (Overall) | 1,050 (52.0%) | 970 (48.0%) |
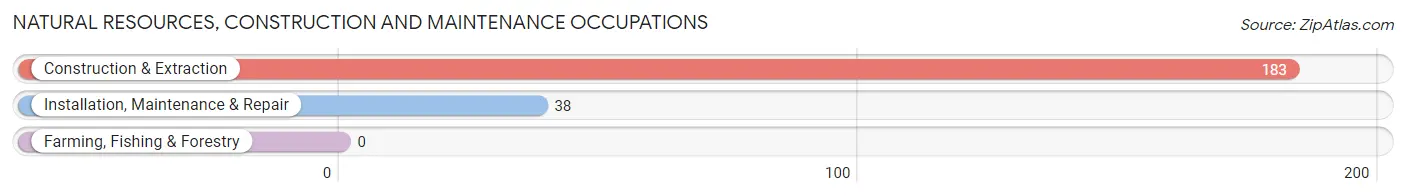
Natural Resources, Construction and Maintenance Occupations
The most common Natural Resources, Construction and Maintenance occupations in North Wales borough are Construction & Extraction (183 | 9.1%), and Installation, Maintenance & Repair (38 | 1.9%).
Natural Resources, Construction and Maintenance Occupations by Sex
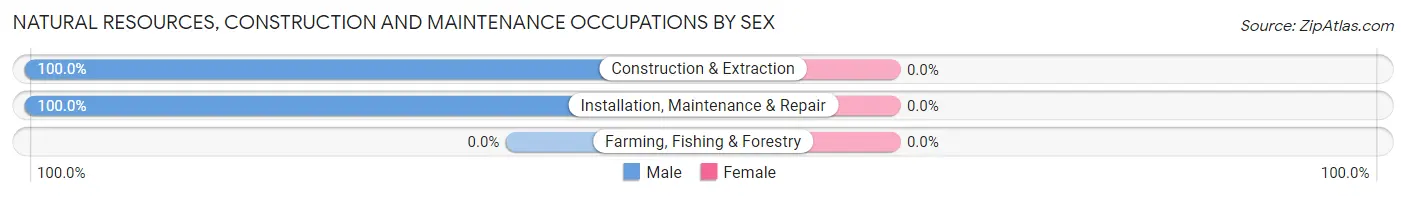
| Occupation | Male | Female |
| Farming, Fishing & Forestry | 0 (0.0%) | 0 (0.0%) |
| Construction & Extraction | 183 (100.0%) | 0 (0.0%) |
| Installation, Maintenance & Repair | 38 (100.0%) | 0 (0.0%) |
| Total (Category) | 221 (100.0%) | 0 (0.0%) |
| Total (Overall) | 1,050 (52.0%) | 970 (48.0%) |
Production, Transportation and Moving Occupations
The most common Production, Transportation and Moving occupations in North Wales borough are Transportation (126 | 6.2%), Production (39 | 1.9%), and Material Moving (25 | 1.2%).
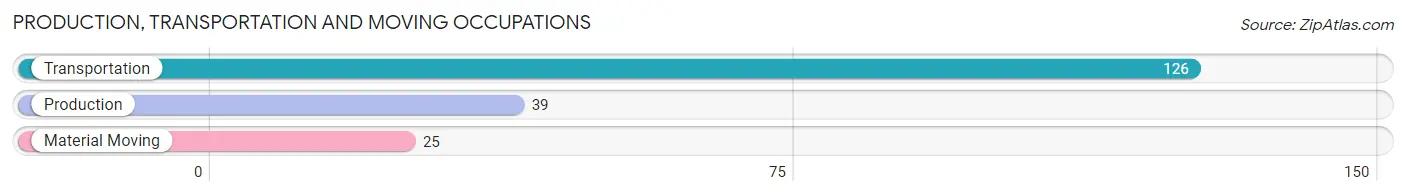
Production, Transportation and Moving Occupations by Sex
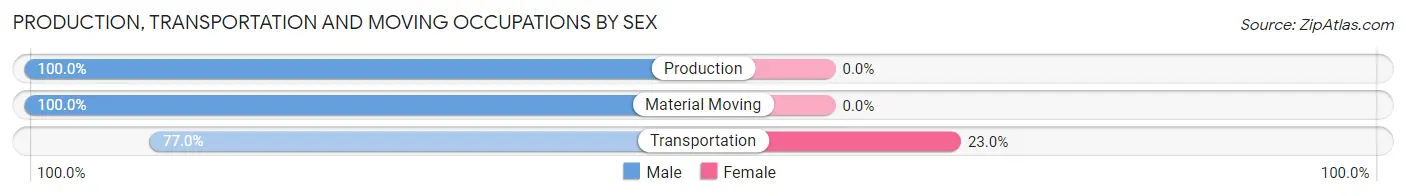
| Occupation | Male | Female |
| Production | 39 (100.0%) | 0 (0.0%) |
| Transportation | 97 (77.0%) | 29 (23.0%) |
| Material Moving | 25 (100.0%) | 0 (0.0%) |
| Total (Category) | 161 (84.7%) | 29 (15.3%) |
| Total (Overall) | 1,050 (52.0%) | 970 (48.0%) |
Employment Industries by Sex in North Wales borough
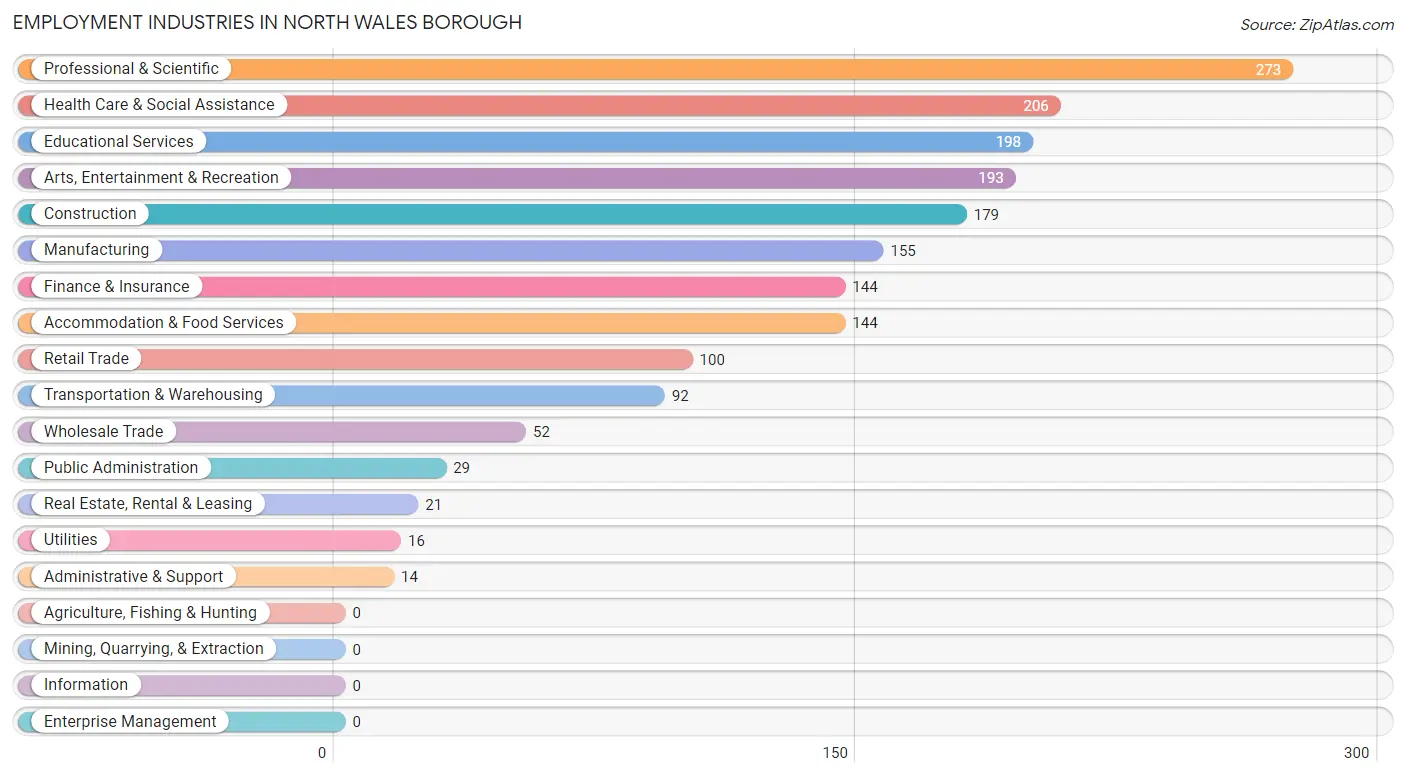
Employment Industries in North Wales borough
The major employment industries in North Wales borough include Professional & Scientific (273 | 13.5%), Health Care & Social Assistance (206 | 10.2%), Educational Services (198 | 9.8%), Arts, Entertainment & Recreation (193 | 9.6%), and Construction (179 | 8.9%).
Employment Industries by Sex in North Wales borough
The North Wales borough industries that see more men than women are Construction (100.0%), Wholesale Trade (82.7%), and Retail Trade (80.0%), whereas the industries that tend to have a higher number of women are Utilities (100.0%), Real Estate, Rental & Leasing (100.0%), and Administrative & Support (100.0%).
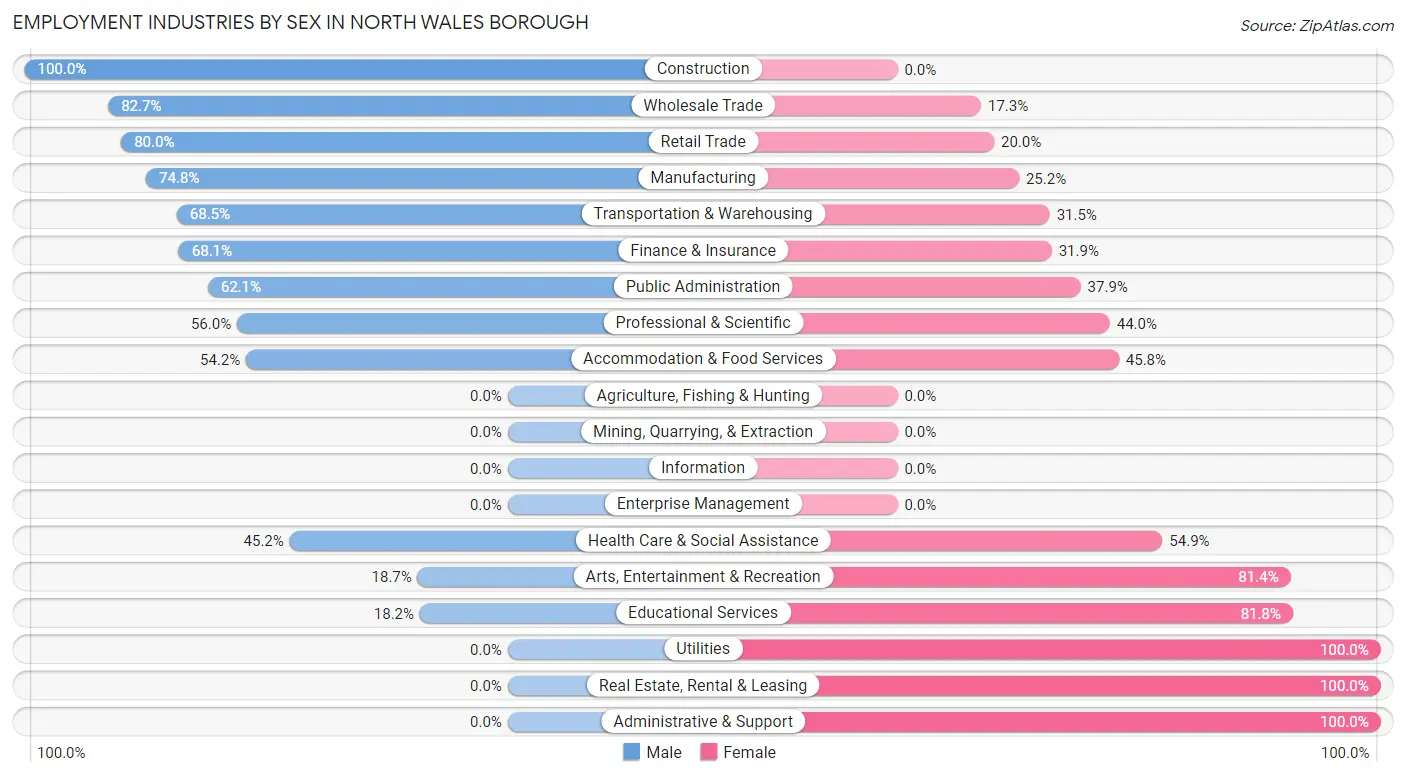
| Industry | Male | Female |
| Agriculture, Fishing & Hunting | 0 (0.0%) | 0 (0.0%) |
| Mining, Quarrying, & Extraction | 0 (0.0%) | 0 (0.0%) |
| Construction | 179 (100.0%) | 0 (0.0%) |
| Manufacturing | 116 (74.8%) | 39 (25.2%) |
| Wholesale Trade | 43 (82.7%) | 9 (17.3%) |
| Retail Trade | 80 (80.0%) | 20 (20.0%) |
| Transportation & Warehousing | 63 (68.5%) | 29 (31.5%) |
| Utilities | 0 (0.0%) | 16 (100.0%) |
| Information | 0 (0.0%) | 0 (0.0%) |
| Finance & Insurance | 98 (68.1%) | 46 (31.9%) |
| Real Estate, Rental & Leasing | 0 (0.0%) | 21 (100.0%) |
| Professional & Scientific | 153 (56.0%) | 120 (44.0%) |
| Enterprise Management | 0 (0.0%) | 0 (0.0%) |
| Administrative & Support | 0 (0.0%) | 14 (100.0%) |
| Educational Services | 36 (18.2%) | 162 (81.8%) |
| Health Care & Social Assistance | 93 (45.2%) | 113 (54.8%) |
| Arts, Entertainment & Recreation | 36 (18.6%) | 157 (81.4%) |
| Accommodation & Food Services | 78 (54.2%) | 66 (45.8%) |
| Public Administration | 18 (62.1%) | 11 (37.9%) |
| Total | 1,050 (52.0%) | 970 (48.0%) |
Education in North Wales borough
School Enrollment in North Wales borough
The most common levels of schooling among the 686 students in North Wales borough are middle school (244 | 35.6%), high school (239 | 34.8%), and college / undergraduate (80 | 11.7%).
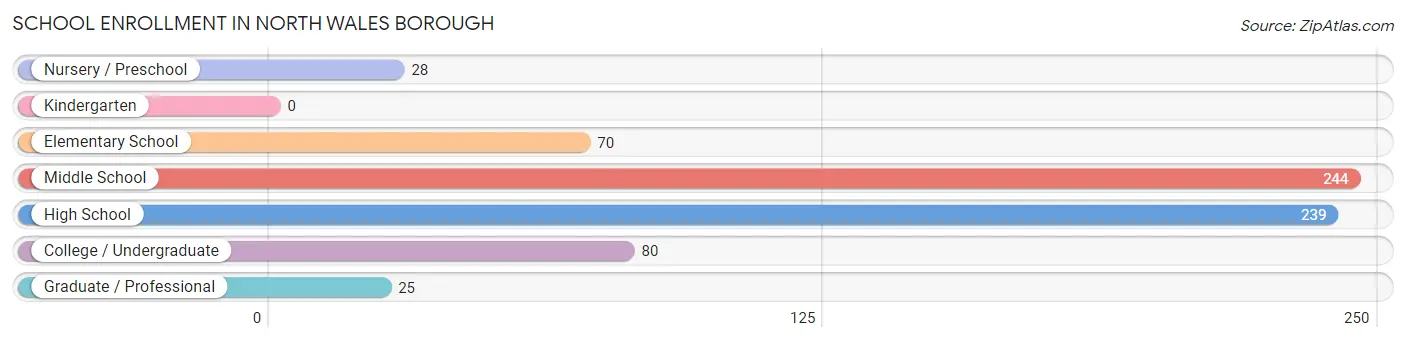
| School Level | # Students | % Students |
| Nursery / Preschool | 28 | 4.1% |
| Kindergarten | 0 | 0.0% |
| Elementary School | 70 | 10.2% |
| Middle School | 244 | 35.6% |
| High School | 239 | 34.8% |
| College / Undergraduate | 80 | 11.7% |
| Graduate / Professional | 25 | 3.6% |
| Total | 686 | 100.0% |
School Enrollment by Age by Funding Source in North Wales borough
Out of a total of 686 students who are enrolled in schools in North Wales borough, 121 (17.6%) attend a private institution, while the remaining 565 (82.4%) are enrolled in public schools. The age group of 3 to 4 year olds has the highest likelihood of being enrolled in private schools, with 19 (100.0% in the age bracket) enrolled. Conversely, the age group of 10 to 14 year olds has the lowest likelihood of being enrolled in a private school, with 232 (100.0% in the age bracket) attending a public institution.
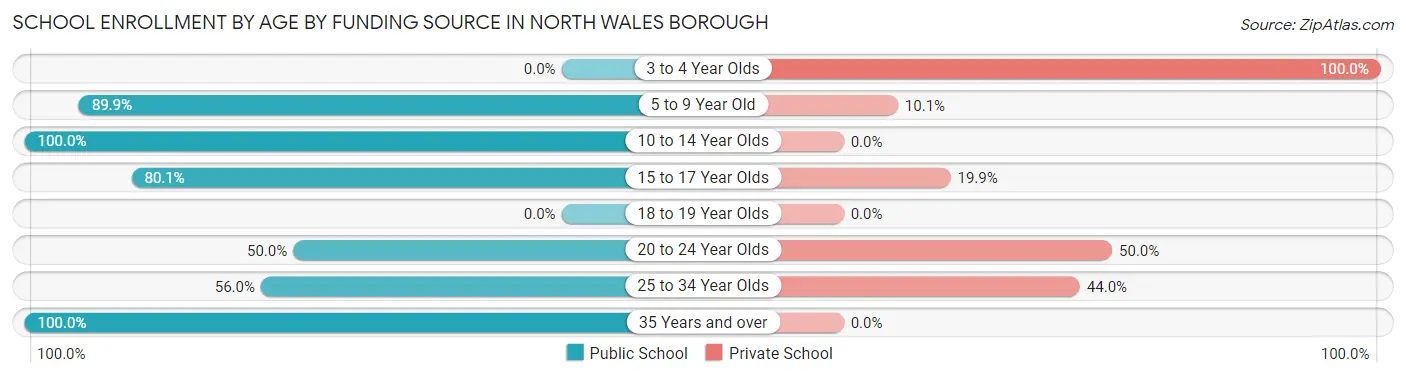
| Age Bracket | Public School | Private School |
| 3 to 4 Year Olds | 0 (0.0%) | 19 (100.0%) |
| 5 to 9 Year Old | 89 (89.9%) | 10 (10.1%) |
| 10 to 14 Year Olds | 232 (100.0%) | 0 (0.0%) |
| 15 to 17 Year Olds | 185 (80.1%) | 46 (19.9%) |
| 18 to 19 Year Olds | 0 (0.0%) | 0 (0.0%) |
| 20 to 24 Year Olds | 35 (50.0%) | 35 (50.0%) |
| 25 to 34 Year Olds | 14 (56.0%) | 11 (44.0%) |
| 35 Years and over | 10 (100.0%) | 0 (0.0%) |
| Total | 565 (82.4%) | 121 (17.6%) |
Educational Attainment by Field of Study in North Wales borough
Business (279 | 24.2%), engineering (197 | 17.1%), science & technology (132 | 11.5%), bio, nature & agricultural (78 | 6.8%), and education (78 | 6.8%) are the most common fields of study among 1,152 individuals in North Wales borough who have obtained a bachelor's degree or higher.
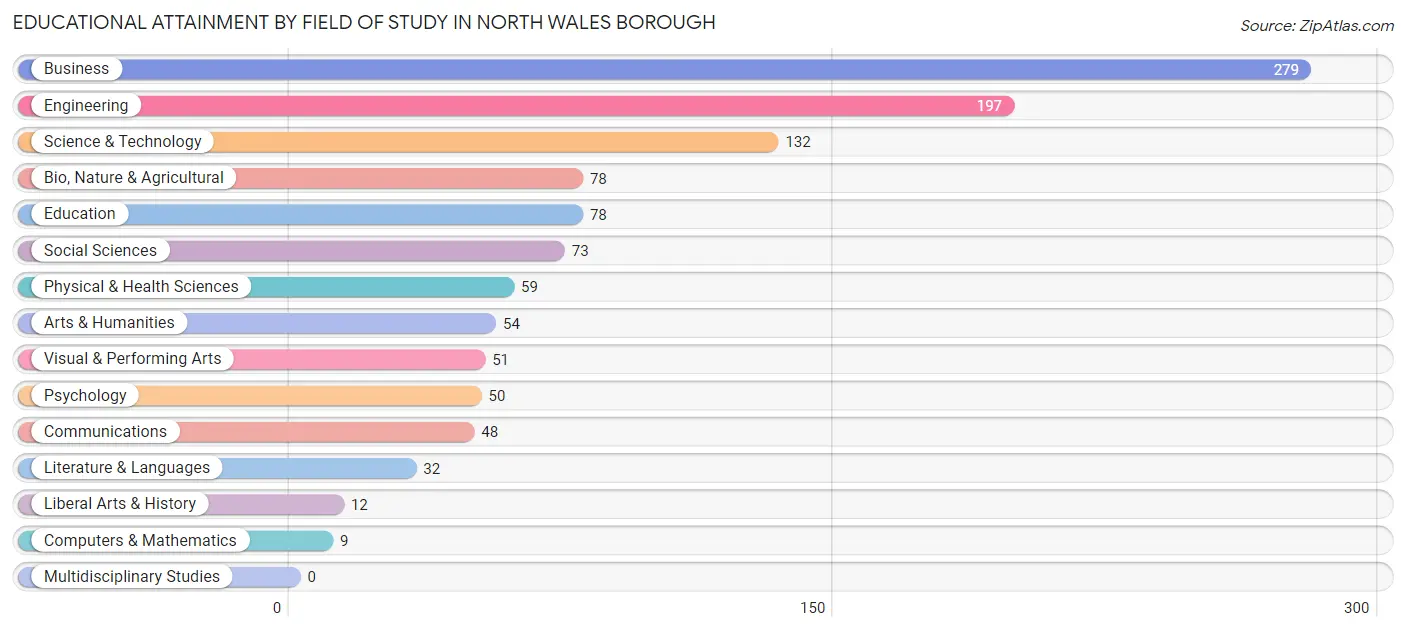
| Field of Study | # Graduates | % Graduates |
| Computers & Mathematics | 9 | 0.8% |
| Bio, Nature & Agricultural | 78 | 6.8% |
| Physical & Health Sciences | 59 | 5.1% |
| Psychology | 50 | 4.3% |
| Social Sciences | 73 | 6.3% |
| Engineering | 197 | 17.1% |
| Multidisciplinary Studies | 0 | 0.0% |
| Science & Technology | 132 | 11.5% |
| Business | 279 | 24.2% |
| Education | 78 | 6.8% |
| Literature & Languages | 32 | 2.8% |
| Liberal Arts & History | 12 | 1.0% |
| Visual & Performing Arts | 51 | 4.4% |
| Communications | 48 | 4.2% |
| Arts & Humanities | 54 | 4.7% |
| Total | 1,152 | 100.0% |
Transportation & Commute in North Wales borough
Vehicle Availability by Sex in North Wales borough
The most prevalent vehicle ownership categories in North Wales borough are males with 2 vehicles (508, accounting for 48.8%) and females with 2 vehicles (550, making up 52.4%).
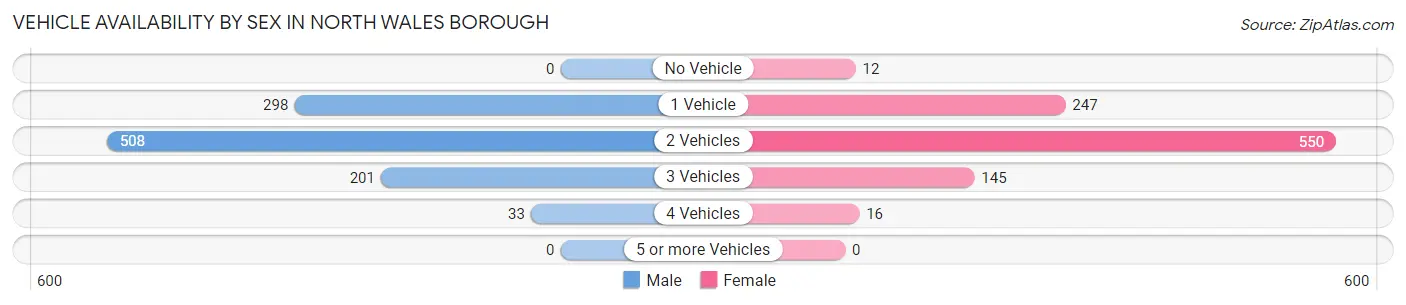
| Vehicles Available | Male | Female |
| No Vehicle | 0 (0.0%) | 12 (1.2%) |
| 1 Vehicle | 298 (28.6%) | 247 (25.5%) |
| 2 Vehicles | 508 (48.8%) | 550 (56.7%) |
| 3 Vehicles | 201 (19.3%) | 145 (14.9%) |
| 4 Vehicles | 33 (3.2%) | 16 (1.7%) |
| 5 or more Vehicles | 0 (0.0%) | 0 (0.0%) |
| Total | 1,040 (100.0%) | 970 (100.0%) |
Commute Time in North Wales borough
The most frequently occuring commute durations in North Wales borough are 20 to 24 minutes (256 commuters, 13.9%), 15 to 19 minutes (226 commuters, 12.3%), and 45 to 59 minutes (223 commuters, 12.1%).
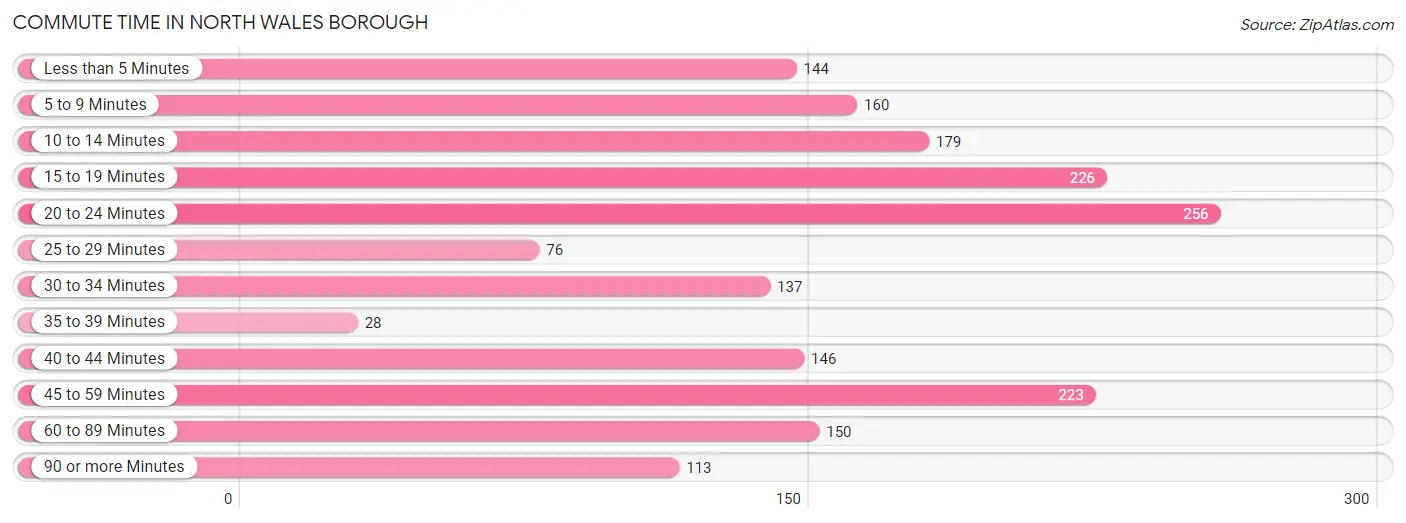
| Commute Time | # Commuters | % Commuters |
| Less than 5 Minutes | 144 | 7.8% |
| 5 to 9 Minutes | 160 | 8.7% |
| 10 to 14 Minutes | 179 | 9.7% |
| 15 to 19 Minutes | 226 | 12.3% |
| 20 to 24 Minutes | 256 | 13.9% |
| 25 to 29 Minutes | 76 | 4.1% |
| 30 to 34 Minutes | 137 | 7.4% |
| 35 to 39 Minutes | 28 | 1.5% |
| 40 to 44 Minutes | 146 | 7.9% |
| 45 to 59 Minutes | 223 | 12.1% |
| 60 to 89 Minutes | 150 | 8.2% |
| 90 or more Minutes | 113 | 6.1% |
Commute Time by Sex in North Wales borough
The most common commute times in North Wales borough are 10 to 14 minutes (124 commuters, 12.9%) for males and 20 to 24 minutes (196 commuters, 22.3%) for females.
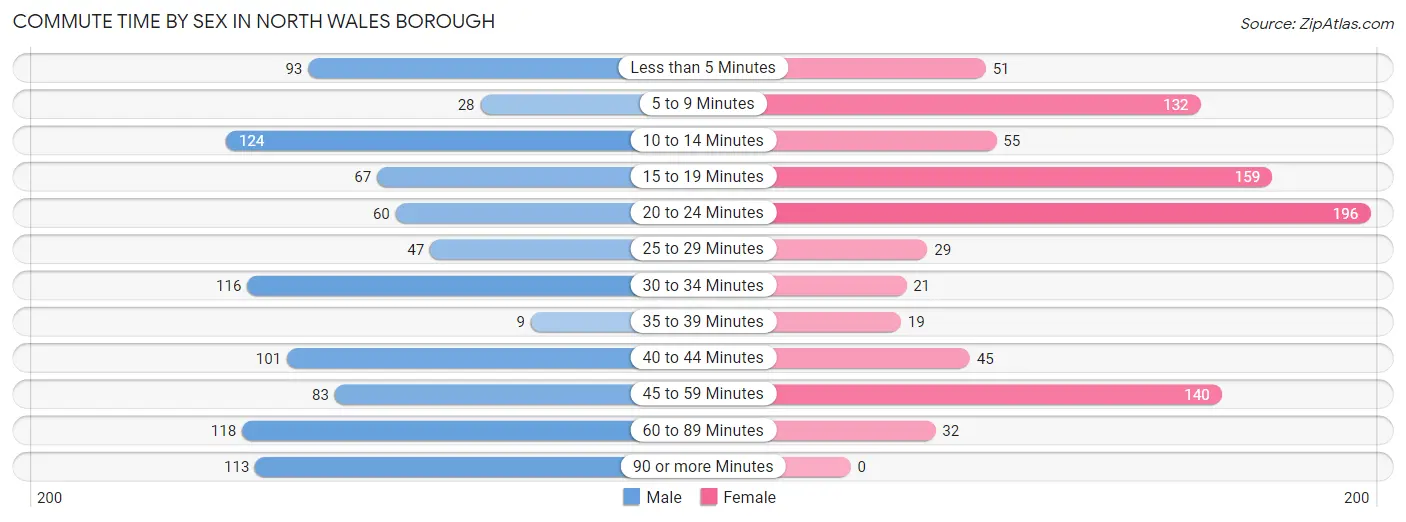
| Commute Time | Male | Female |
| Less than 5 Minutes | 93 (9.7%) | 51 (5.8%) |
| 5 to 9 Minutes | 28 (2.9%) | 132 (15.0%) |
| 10 to 14 Minutes | 124 (12.9%) | 55 (6.3%) |
| 15 to 19 Minutes | 67 (7.0%) | 159 (18.1%) |
| 20 to 24 Minutes | 60 (6.3%) | 196 (22.3%) |
| 25 to 29 Minutes | 47 (4.9%) | 29 (3.3%) |
| 30 to 34 Minutes | 116 (12.1%) | 21 (2.4%) |
| 35 to 39 Minutes | 9 (0.9%) | 19 (2.2%) |
| 40 to 44 Minutes | 101 (10.5%) | 45 (5.1%) |
| 45 to 59 Minutes | 83 (8.6%) | 140 (15.9%) |
| 60 to 89 Minutes | 118 (12.3%) | 32 (3.6%) |
| 90 or more Minutes | 113 (11.8%) | 0 (0.0%) |
Time of Departure to Work by Sex in North Wales borough
The most frequent times of departure to work in North Wales borough are 6:00 AM to 6:29 AM (265, 27.6%) for males and 7:00 AM to 7:29 AM (369, 42.0%) for females.
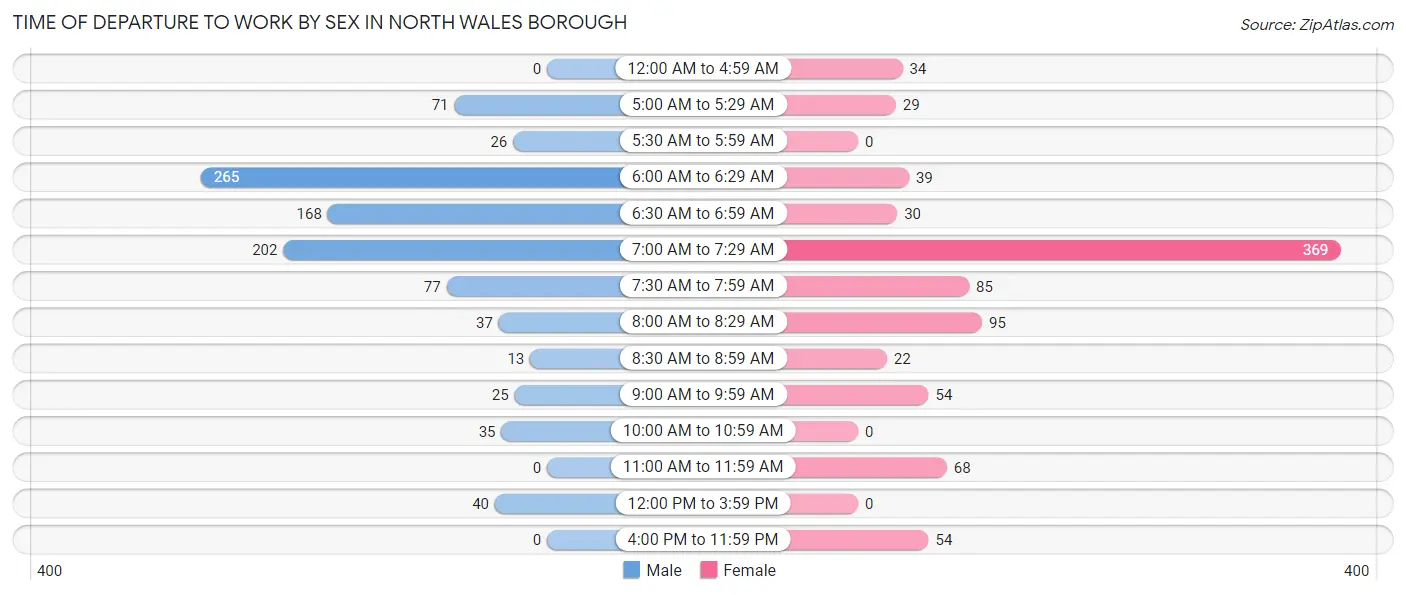
| Time of Departure | Male | Female |
| 12:00 AM to 4:59 AM | 0 (0.0%) | 34 (3.9%) |
| 5:00 AM to 5:29 AM | 71 (7.4%) | 29 (3.3%) |
| 5:30 AM to 5:59 AM | 26 (2.7%) | 0 (0.0%) |
| 6:00 AM to 6:29 AM | 265 (27.6%) | 39 (4.4%) |
| 6:30 AM to 6:59 AM | 168 (17.5%) | 30 (3.4%) |
| 7:00 AM to 7:29 AM | 202 (21.1%) | 369 (42.0%) |
| 7:30 AM to 7:59 AM | 77 (8.0%) | 85 (9.7%) |
| 8:00 AM to 8:29 AM | 37 (3.9%) | 95 (10.8%) |
| 8:30 AM to 8:59 AM | 13 (1.4%) | 22 (2.5%) |
| 9:00 AM to 9:59 AM | 25 (2.6%) | 54 (6.1%) |
| 10:00 AM to 10:59 AM | 35 (3.6%) | 0 (0.0%) |
| 11:00 AM to 11:59 AM | 0 (0.0%) | 68 (7.7%) |
| 12:00 PM to 3:59 PM | 40 (4.2%) | 0 (0.0%) |
| 4:00 PM to 11:59 PM | 0 (0.0%) | 54 (6.1%) |
| Total | 959 (100.0%) | 879 (100.0%) |
Housing Occupancy in North Wales borough
Occupancy by Ownership in North Wales borough
Of the total 1,464 dwellings in North Wales borough, owner-occupied units account for 1,069 (73.0%), while renter-occupied units make up 395 (27.0%).
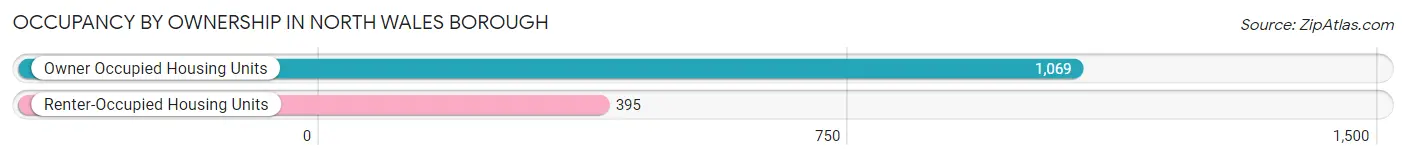
| Occupancy | # Housing Units | % Housing Units |
| Owner Occupied Housing Units | 1,069 | 73.0% |
| Renter-Occupied Housing Units | 395 | 27.0% |
| Total Occupied Housing Units | 1,464 | 100.0% |
Occupancy by Household Size in North Wales borough
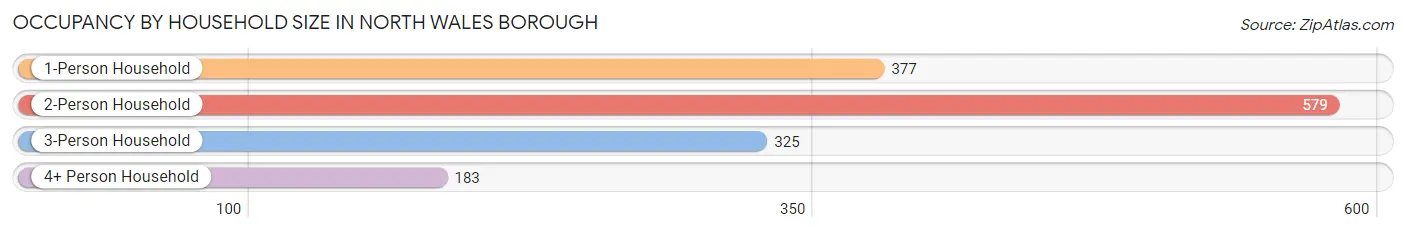
| Household Size | # Housing Units | % Housing Units |
| 1-Person Household | 377 | 25.8% |
| 2-Person Household | 579 | 39.6% |
| 3-Person Household | 325 | 22.2% |
| 4+ Person Household | 183 | 12.5% |
| Total Housing Units | 1,464 | 100.0% |
Occupancy by Ownership by Household Size in North Wales borough
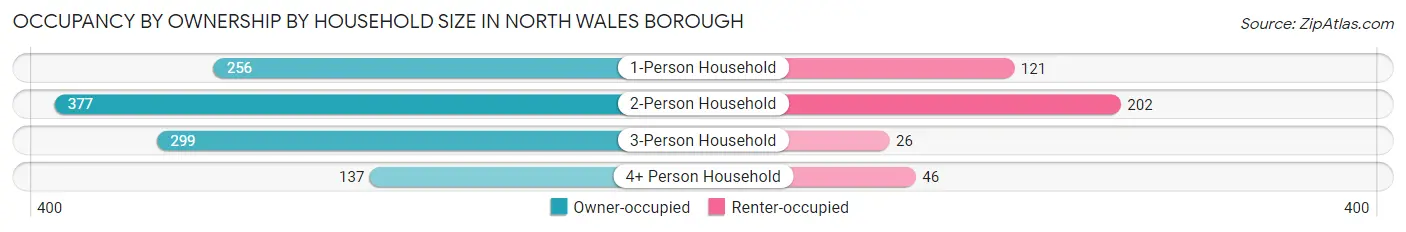
| Household Size | Owner-occupied | Renter-occupied |
| 1-Person Household | 256 (67.9%) | 121 (32.1%) |
| 2-Person Household | 377 (65.1%) | 202 (34.9%) |
| 3-Person Household | 299 (92.0%) | 26 (8.0%) |
| 4+ Person Household | 137 (74.9%) | 46 (25.1%) |
| Total Housing Units | 1,069 (73.0%) | 395 (27.0%) |
Occupancy by Educational Attainment in North Wales borough
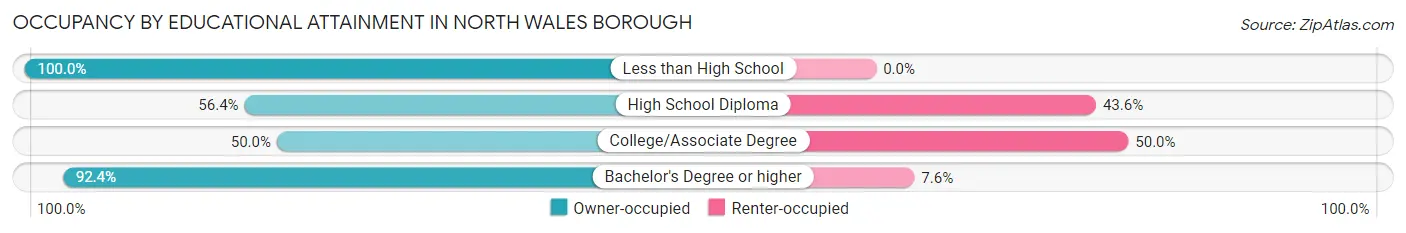
| Household Size | Owner-occupied | Renter-occupied |
| Less than High School | 63 (100.0%) | 0 (0.0%) |
| High School Diploma | 224 (56.4%) | 173 (43.6%) |
| College/Associate Degree | 172 (50.0%) | 172 (50.0%) |
| Bachelor's Degree or higher | 610 (92.4%) | 50 (7.6%) |
Occupancy by Age of Householder in North Wales borough
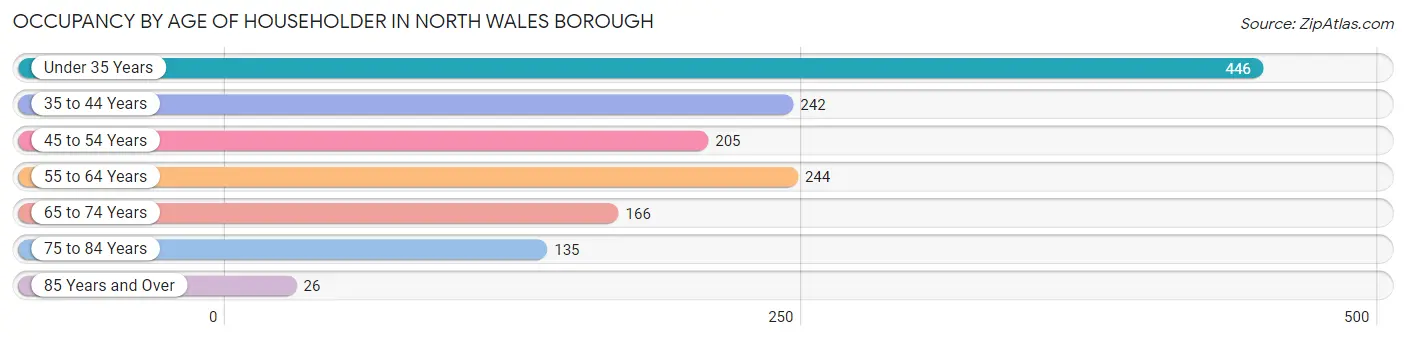
| Age Bracket | # Households | % Households |
| Under 35 Years | 446 | 30.5% |
| 35 to 44 Years | 242 | 16.5% |
| 45 to 54 Years | 205 | 14.0% |
| 55 to 64 Years | 244 | 16.7% |
| 65 to 74 Years | 166 | 11.3% |
| 75 to 84 Years | 135 | 9.2% |
| 85 Years and Over | 26 | 1.8% |
| Total | 1,464 | 100.0% |
Housing Finances in North Wales borough
Median Income by Occupancy in North Wales borough
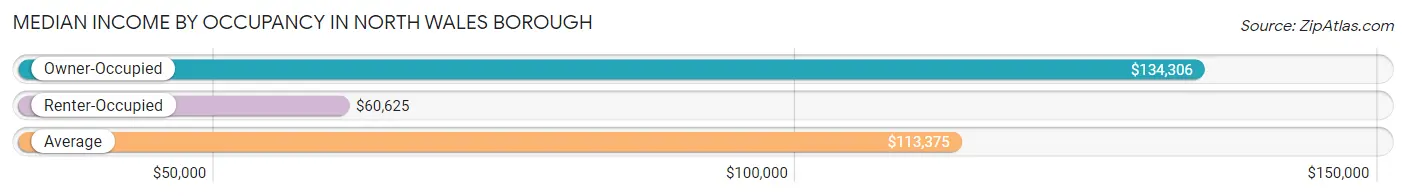
| Occupancy Type | # Households | Median Income |
| Owner-Occupied | 1,069 (73.0%) | $134,306 |
| Renter-Occupied | 395 (27.0%) | $60,625 |
| Average | 1,464 (100.0%) | $113,375 |
Occupancy by Householder Income Bracket in North Wales borough
| Income Bracket | Owner-occupied | Renter-occupied |
| Less than $5,000 | 0 (0.0%) | 55 (13.9%) |
| $5,000 to $9,999 | 8 (0.7%) | 0 (0.0%) |
| $10,000 to $14,999 | 8 (0.7%) | 10 (2.5%) |
| $15,000 to $19,999 | 0 (0.0%) | 0 (0.0%) |
| $20,000 to $24,999 | 109 (10.2%) | 0 (0.0%) |
| $25,000 to $34,999 | 32 (3.0%) | 12 (3.0%) |
| $35,000 to $49,999 | 76 (7.1%) | 93 (23.5%) |
| $50,000 to $74,999 | 72 (6.7%) | 62 (15.7%) |
| $75,000 to $99,999 | 63 (5.9%) | 59 (14.9%) |
| $100,000 to $149,999 | 325 (30.4%) | 104 (26.3%) |
| $150,000 or more | 376 (35.2%) | 0 (0.0%) |
| Total | 1,069 (100.0%) | 395 (100.0%) |
Monthly Housing Cost Tiers in North Wales borough
| Monthly Cost | Owner-occupied | Renter-occupied |
| Less than $300 | 0 (0.0%) | 0 (0.0%) |
| $300 to $499 | 54 (5.1%) | 0 (0.0%) |
| $500 to $799 | 100 (9.3%) | 46 (11.7%) |
| $800 to $999 | 177 (16.6%) | 26 (6.6%) |
| $1,000 to $1,499 | 179 (16.7%) | 275 (69.6%) |
| $1,500 to $1,999 | 201 (18.8%) | 10 (2.5%) |
| $2,000 to $2,499 | 138 (12.9%) | 9 (2.3%) |
| $2,500 to $2,999 | 143 (13.4%) | 0 (0.0%) |
| $3,000 or more | 77 (7.2%) | 0 (0.0%) |
| Total | 1,069 (100.0%) | 395 (100.0%) |
Physical Housing Characteristics in North Wales borough
Housing Structures in North Wales borough
| Structure Type | # Housing Units | % Housing Units |
| Single Unit, Detached | 794 | 54.2% |
| Single Unit, Attached | 346 | 23.6% |
| 2 Unit Apartments | 131 | 8.9% |
| 3 or 4 Unit Apartments | 94 | 6.4% |
| 5 to 9 Unit Apartments | 90 | 6.1% |
| 10 or more Apartments | 9 | 0.6% |
| Mobile Home / Other | 0 | 0.0% |
| Total | 1,464 | 100.0% |
Housing Structures by Occupancy in North Wales borough
| Structure Type | Owner-occupied | Renter-occupied |
| Single Unit, Detached | 752 (94.7%) | 42 (5.3%) |
| Single Unit, Attached | 291 (84.1%) | 55 (15.9%) |
| 2 Unit Apartments | 17 (13.0%) | 114 (87.0%) |
| 3 or 4 Unit Apartments | 0 (0.0%) | 94 (100.0%) |
| 5 to 9 Unit Apartments | 0 (0.0%) | 90 (100.0%) |
| 10 or more Apartments | 9 (100.0%) | 0 (0.0%) |
| Mobile Home / Other | 0 (0.0%) | 0 (0.0%) |
| Total | 1,069 (73.0%) | 395 (27.0%) |
Housing Structures by Number of Rooms in North Wales borough
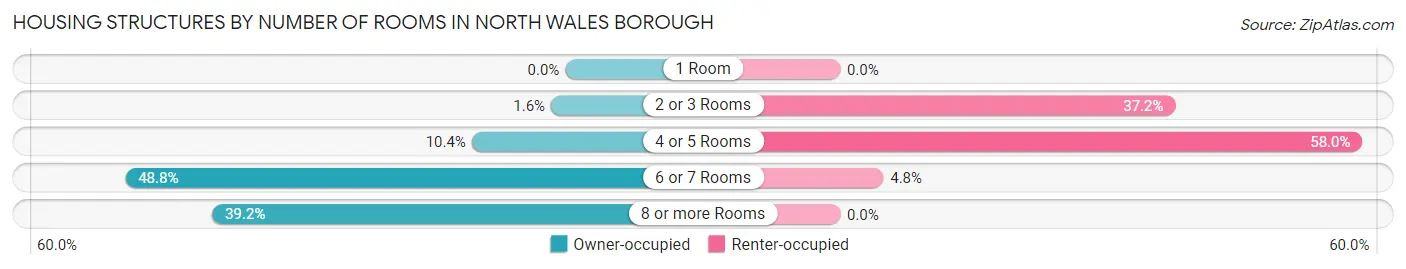
| Number of Rooms | Owner-occupied | Renter-occupied |
| 1 Room | 0 (0.0%) | 0 (0.0%) |
| 2 or 3 Rooms | 17 (1.6%) | 147 (37.2%) |
| 4 or 5 Rooms | 111 (10.4%) | 229 (58.0%) |
| 6 or 7 Rooms | 522 (48.8%) | 19 (4.8%) |
| 8 or more Rooms | 419 (39.2%) | 0 (0.0%) |
| Total | 1,069 (100.0%) | 395 (100.0%) |
Housing Structure by Heating Type in North Wales borough
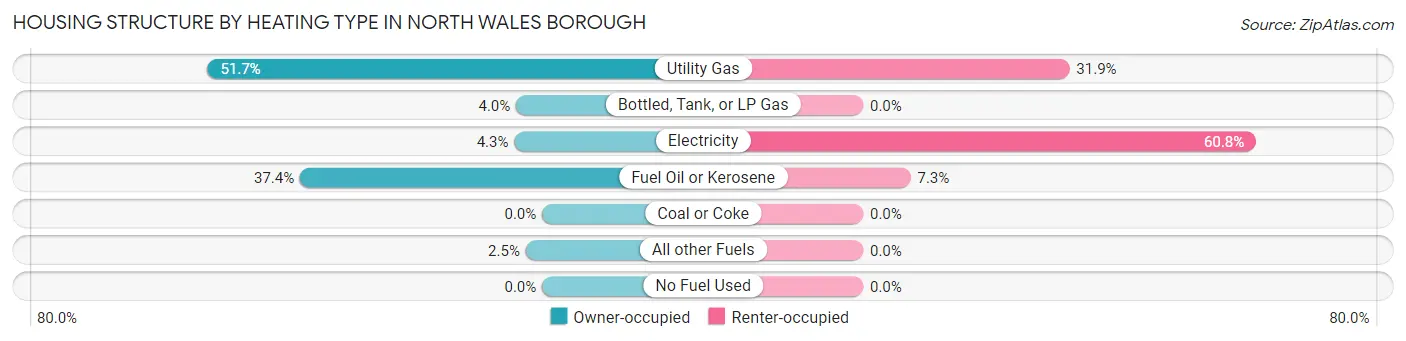
| Heating Type | Owner-occupied | Renter-occupied |
| Utility Gas | 553 (51.7%) | 126 (31.9%) |
| Bottled, Tank, or LP Gas | 43 (4.0%) | 0 (0.0%) |
| Electricity | 46 (4.3%) | 240 (60.8%) |
| Fuel Oil or Kerosene | 400 (37.4%) | 29 (7.3%) |
| Coal or Coke | 0 (0.0%) | 0 (0.0%) |
| All other Fuels | 27 (2.5%) | 0 (0.0%) |
| No Fuel Used | 0 (0.0%) | 0 (0.0%) |
| Total | 1,069 (100.0%) | 395 (100.0%) |
Household Vehicle Usage in North Wales borough
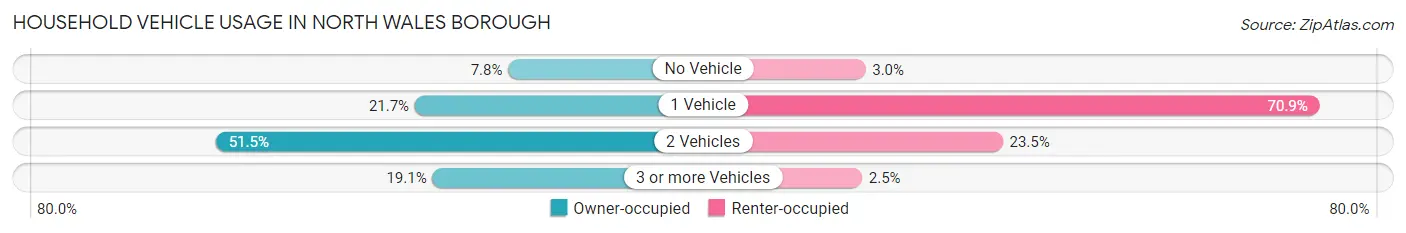
| Vehicles per Household | Owner-occupied | Renter-occupied |
| No Vehicle | 83 (7.8%) | 12 (3.0%) |
| 1 Vehicle | 232 (21.7%) | 280 (70.9%) |
| 2 Vehicles | 550 (51.4%) | 93 (23.5%) |
| 3 or more Vehicles | 204 (19.1%) | 10 (2.5%) |
| Total | 1,069 (100.0%) | 395 (100.0%) |
Real Estate & Mortgages in North Wales borough
Real Estate and Mortgage Overview in North Wales borough
| Characteristic | Without Mortgage | With Mortgage |
| Housing Units | 355 | 714 |
| Median Property Value | $375,500 | $336,400 |
| Median Household Income | - | - |
| Monthly Housing Costs | $824 | $66 |
| Real Estate Taxes | $4,276 | $0 |
Property Value by Mortgage Status in North Wales borough
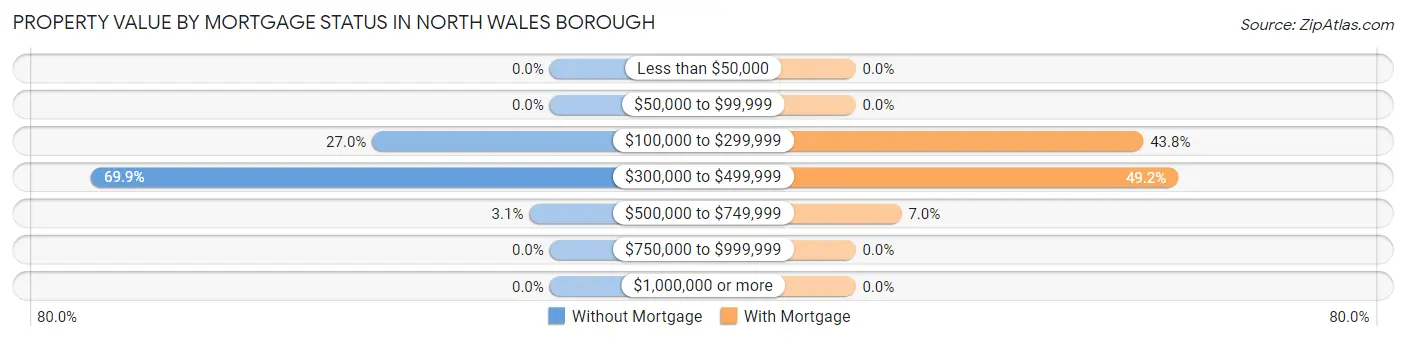
| Property Value | Without Mortgage | With Mortgage |
| Less than $50,000 | 0 (0.0%) | 0 (0.0%) |
| $50,000 to $99,999 | 0 (0.0%) | 0 (0.0%) |
| $100,000 to $299,999 | 96 (27.0%) | 313 (43.8%) |
| $300,000 to $499,999 | 248 (69.9%) | 351 (49.2%) |
| $500,000 to $749,999 | 11 (3.1%) | 50 (7.0%) |
| $750,000 to $999,999 | 0 (0.0%) | 0 (0.0%) |
| $1,000,000 or more | 0 (0.0%) | 0 (0.0%) |
| Total | 355 (100.0%) | 714 (100.0%) |
Household Income by Mortgage Status in North Wales borough
| Household Income | Without Mortgage | With Mortgage |
| Less than $10,000 | 0 (0.0%) | 10 (1.4%) |
| $10,000 to $24,999 | 117 (33.0%) | 8 (1.1%) |
| $25,000 to $34,999 | 10 (2.8%) | 0 (0.0%) |
| $35,000 to $49,999 | 8 (2.2%) | 22 (3.1%) |
| $50,000 to $74,999 | 46 (13.0%) | 68 (9.5%) |
| $75,000 to $99,999 | 22 (6.2%) | 26 (3.6%) |
| $100,000 to $149,999 | 46 (13.0%) | 41 (5.7%) |
| $150,000 or more | 106 (29.9%) | 279 (39.1%) |
| Total | 355 (100.0%) | 714 (100.0%) |
Property Value to Household Income Ratio in North Wales borough
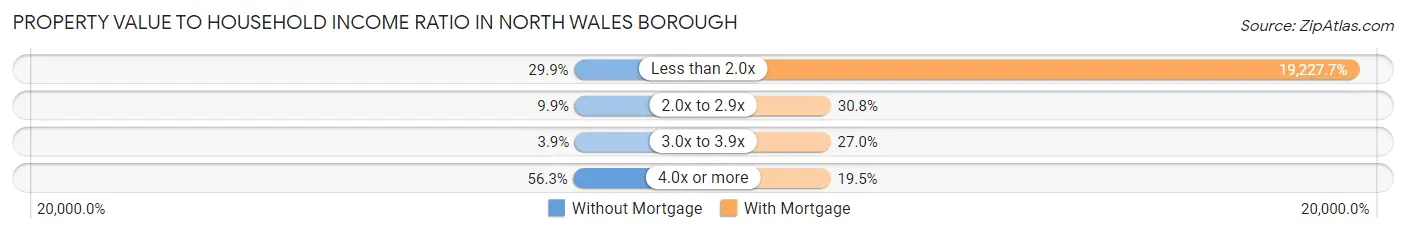
| Value-to-Income Ratio | Without Mortgage | With Mortgage |
| Less than 2.0x | 106 (29.9%) | 137,286 (19,227.7%) |
| 2.0x to 2.9x | 35 (9.9%) | 220 (30.8%) |
| 3.0x to 3.9x | 14 (3.9%) | 193 (27.0%) |
| 4.0x or more | 200 (56.3%) | 139 (19.5%) |
| Total | 355 (100.0%) | 714 (100.0%) |
Real Estate Taxes by Mortgage Status in North Wales borough
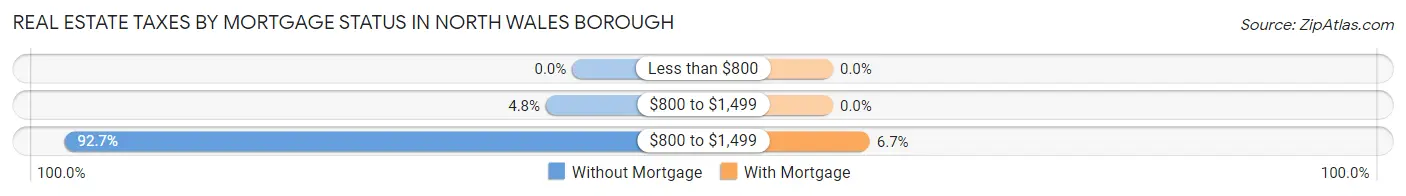
| Property Taxes | Without Mortgage | With Mortgage |
| Less than $800 | 0 (0.0%) | 0 (0.0%) |
| $800 to $1,499 | 17 (4.8%) | 0 (0.0%) |
| $800 to $1,499 | 329 (92.7%) | 48 (6.7%) |
| Total | 355 (100.0%) | 714 (100.0%) |
Health & Disability in North Wales borough
Health Insurance Coverage by Age in North Wales borough
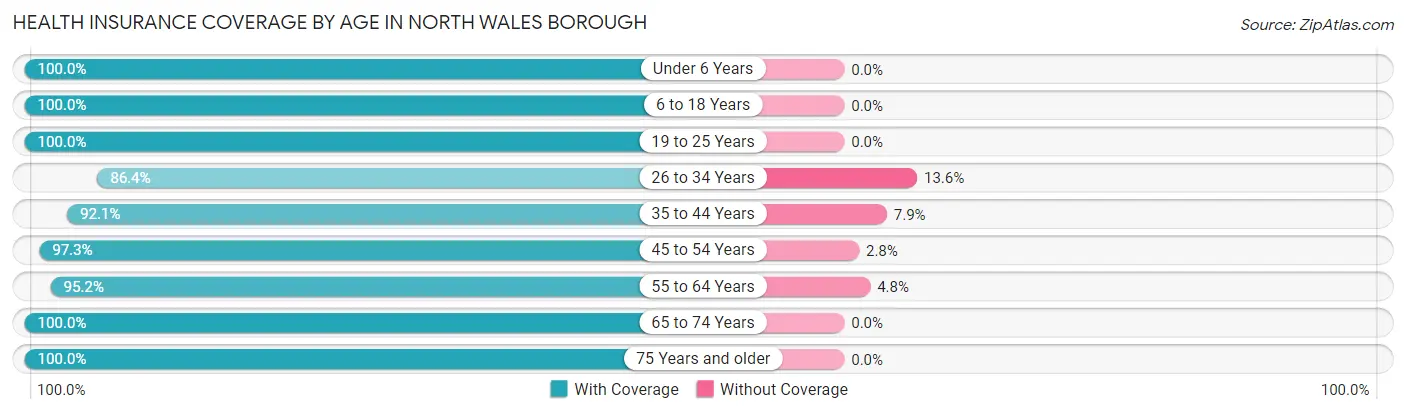
| Age Bracket | With Coverage | Without Coverage |
| Under 6 Years | 237 (100.0%) | 0 (0.0%) |
| 6 to 18 Years | 552 (100.0%) | 0 (0.0%) |
| 19 to 25 Years | 240 (100.0%) | 0 (0.0%) |
| 26 to 34 Years | 510 (86.4%) | 80 (13.6%) |
| 35 to 44 Years | 441 (92.1%) | 38 (7.9%) |
| 45 to 54 Years | 424 (97.3%) | 12 (2.8%) |
| 55 to 64 Years | 334 (95.2%) | 17 (4.8%) |
| 65 to 74 Years | 266 (100.0%) | 0 (0.0%) |
| 75 Years and older | 264 (100.0%) | 0 (0.0%) |
| Total | 3,268 (95.7%) | 147 (4.3%) |
Health Insurance Coverage by Citizenship Status in North Wales borough
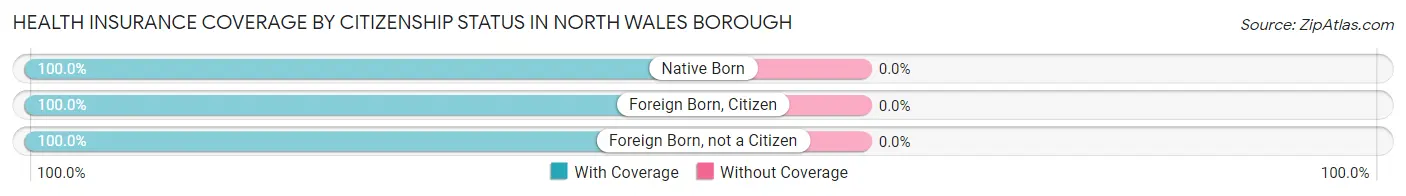
| Citizenship Status | With Coverage | Without Coverage |
| Native Born | 237 (100.0%) | 0 (0.0%) |
| Foreign Born, Citizen | 552 (100.0%) | 0 (0.0%) |
| Foreign Born, not a Citizen | 240 (100.0%) | 0 (0.0%) |
Health Insurance Coverage by Household Income in North Wales borough
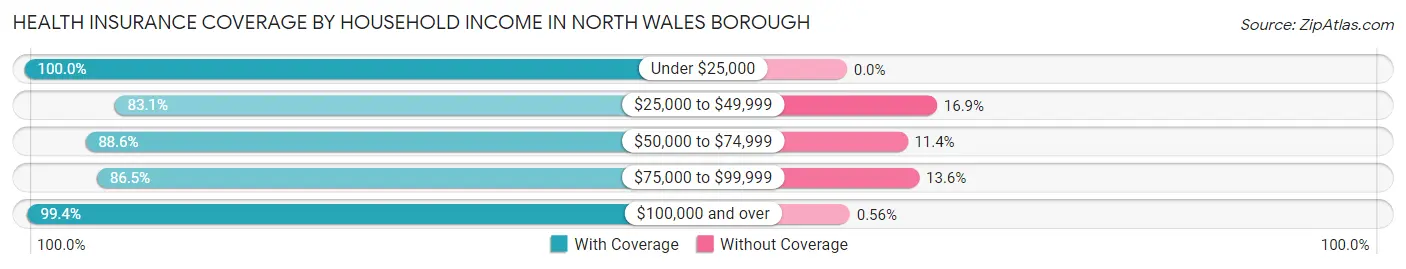
| Household Income | With Coverage | Without Coverage |
| Under $25,000 | 216 (100.0%) | 0 (0.0%) |
| $25,000 to $49,999 | 271 (83.1%) | 55 (16.9%) |
| $50,000 to $74,999 | 359 (88.6%) | 46 (11.4%) |
| $75,000 to $99,999 | 217 (86.5%) | 34 (13.6%) |
| $100,000 and over | 2,143 (99.4%) | 12 (0.6%) |
Public vs Private Health Insurance Coverage by Age in North Wales borough
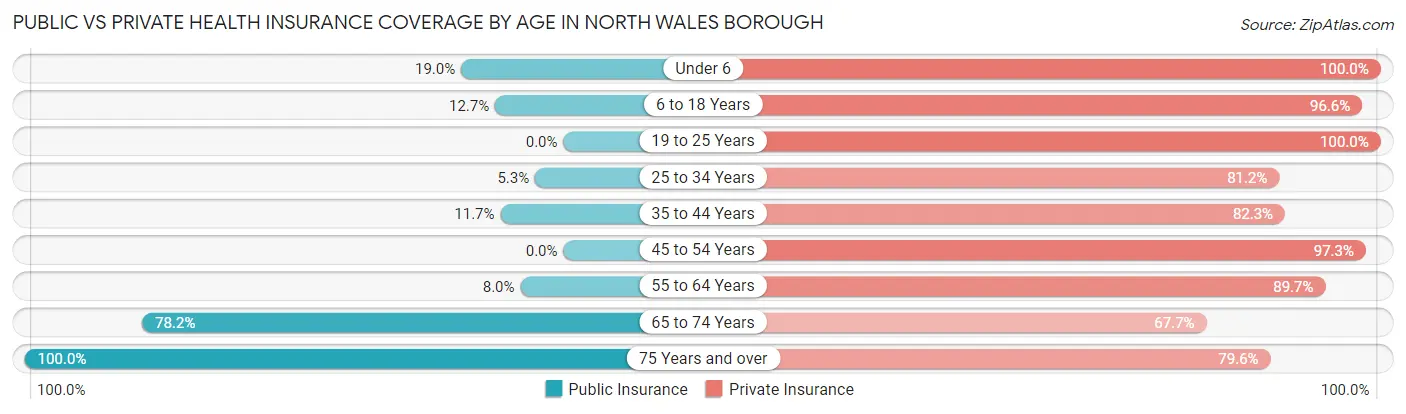
| Age Bracket | Public Insurance | Private Insurance |
| Under 6 | 45 (19.0%) | 237 (100.0%) |
| 6 to 18 Years | 70 (12.7%) | 533 (96.6%) |
| 19 to 25 Years | 0 (0.0%) | 240 (100.0%) |
| 25 to 34 Years | 31 (5.2%) | 479 (81.2%) |
| 35 to 44 Years | 56 (11.7%) | 394 (82.3%) |
| 45 to 54 Years | 0 (0.0%) | 424 (97.3%) |
| 55 to 64 Years | 28 (8.0%) | 315 (89.7%) |
| 65 to 74 Years | 208 (78.2%) | 180 (67.7%) |
| 75 Years and over | 264 (100.0%) | 210 (79.5%) |
| Total | 702 (20.6%) | 3,012 (88.2%) |
Disability Status by Sex by Age in North Wales borough
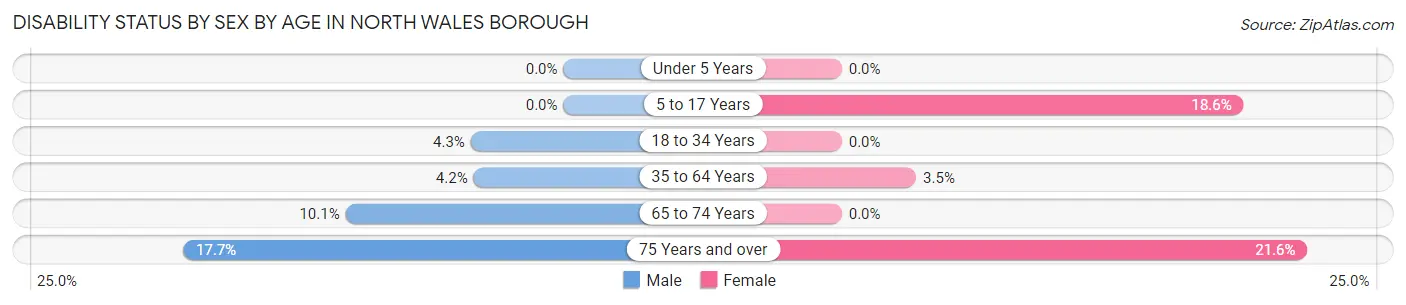
| Age Bracket | Male | Female |
| Under 5 Years | 0 (0.0%) | 0 (0.0%) |
| 5 to 17 Years | 0 (0.0%) | 66 (18.6%) |
| 18 to 34 Years | 17 (4.3%) | 0 (0.0%) |
| 35 to 64 Years | 25 (4.2%) | 23 (3.5%) |
| 65 to 74 Years | 19 (10.1%) | 0 (0.0%) |
| 75 Years and over | 9 (17.6%) | 46 (21.6%) |
Disability Class by Sex by Age in North Wales borough
Disability Class: Hearing Difficulty
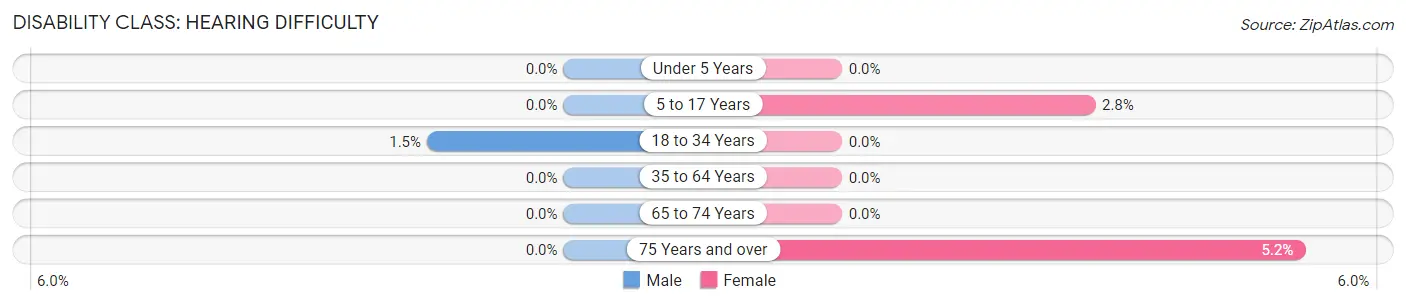
| Age Bracket | Male | Female |
| Under 5 Years | 0 (0.0%) | 0 (0.0%) |
| 5 to 17 Years | 0 (0.0%) | 10 (2.8%) |
| 18 to 34 Years | 6 (1.5%) | 0 (0.0%) |
| 35 to 64 Years | 0 (0.0%) | 0 (0.0%) |
| 65 to 74 Years | 0 (0.0%) | 0 (0.0%) |
| 75 Years and over | 0 (0.0%) | 11 (5.2%) |
Disability Class: Vision Difficulty
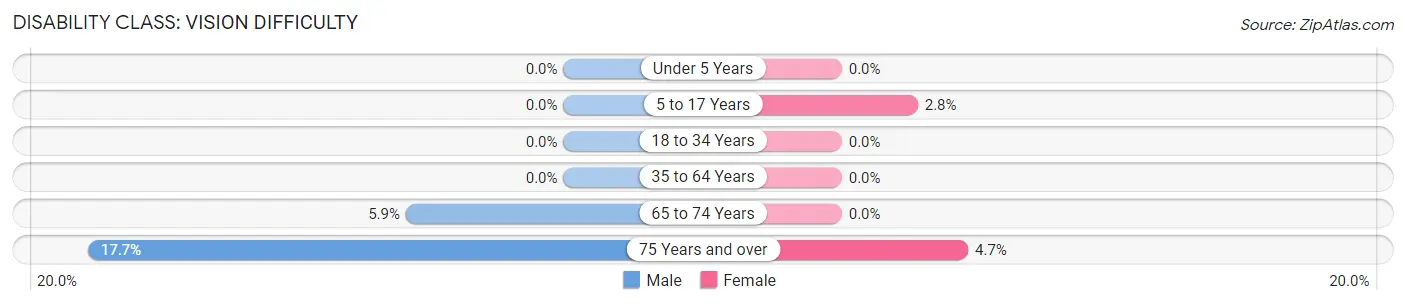
| Age Bracket | Male | Female |
| Under 5 Years | 0 (0.0%) | 0 (0.0%) |
| 5 to 17 Years | 0 (0.0%) | 10 (2.8%) |
| 18 to 34 Years | 0 (0.0%) | 0 (0.0%) |
| 35 to 64 Years | 0 (0.0%) | 0 (0.0%) |
| 65 to 74 Years | 11 (5.9%) | 0 (0.0%) |
| 75 Years and over | 9 (17.6%) | 10 (4.7%) |
Disability Class: Cognitive Difficulty
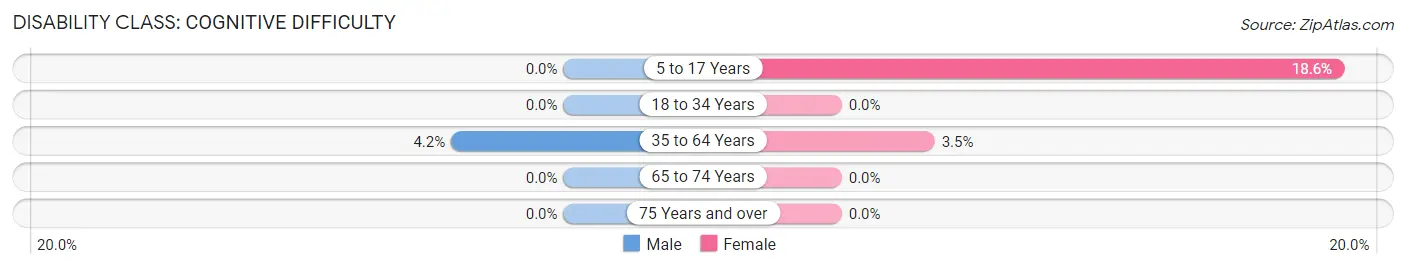
| Age Bracket | Male | Female |
| 5 to 17 Years | 0 (0.0%) | 66 (18.6%) |
| 18 to 34 Years | 0 (0.0%) | 0 (0.0%) |
| 35 to 64 Years | 25 (4.2%) | 23 (3.5%) |
| 65 to 74 Years | 0 (0.0%) | 0 (0.0%) |
| 75 Years and over | 0 (0.0%) | 0 (0.0%) |
Disability Class: Ambulatory Difficulty
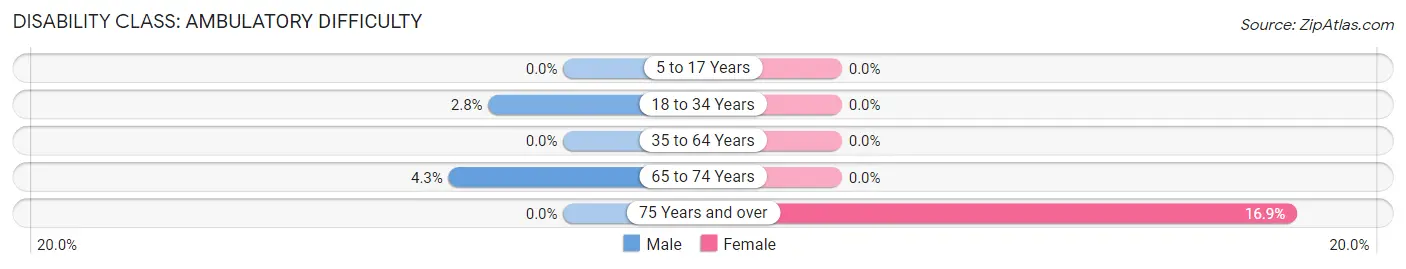
| Age Bracket | Male | Female |
| 5 to 17 Years | 0 (0.0%) | 0 (0.0%) |
| 18 to 34 Years | 11 (2.8%) | 0 (0.0%) |
| 35 to 64 Years | 0 (0.0%) | 0 (0.0%) |
| 65 to 74 Years | 8 (4.3%) | 0 (0.0%) |
| 75 Years and over | 0 (0.0%) | 36 (16.9%) |
Disability Class: Self-Care Difficulty
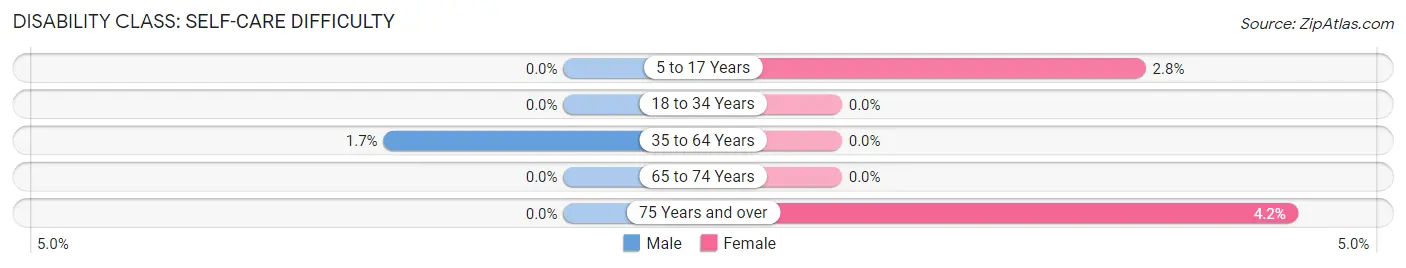
| Age Bracket | Male | Female |
| 5 to 17 Years | 0 (0.0%) | 10 (2.8%) |
| 18 to 34 Years | 0 (0.0%) | 0 (0.0%) |
| 35 to 64 Years | 10 (1.7%) | 0 (0.0%) |
| 65 to 74 Years | 0 (0.0%) | 0 (0.0%) |
| 75 Years and over | 0 (0.0%) | 9 (4.2%) |
Technology Access in North Wales borough
Computing Device Access in North Wales borough
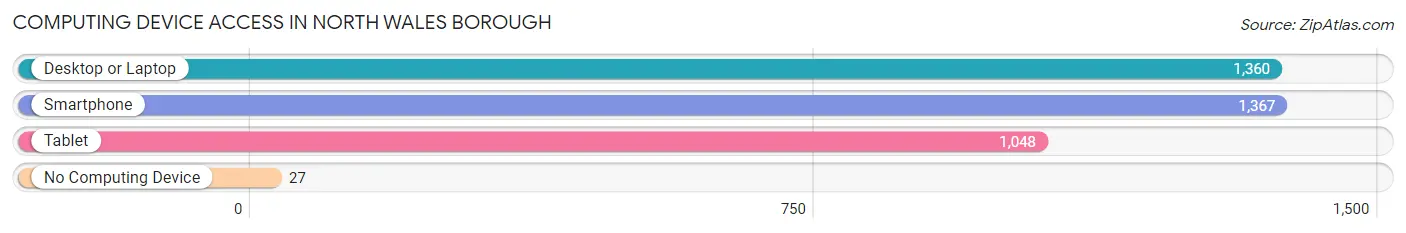
| Device Type | # Households | % Households |
| Desktop or Laptop | 1,360 | 92.9% |
| Smartphone | 1,367 | 93.4% |
| Tablet | 1,048 | 71.6% |
| No Computing Device | 27 | 1.8% |
| Total | 1,464 | 100.0% |
Internet Access in North Wales borough
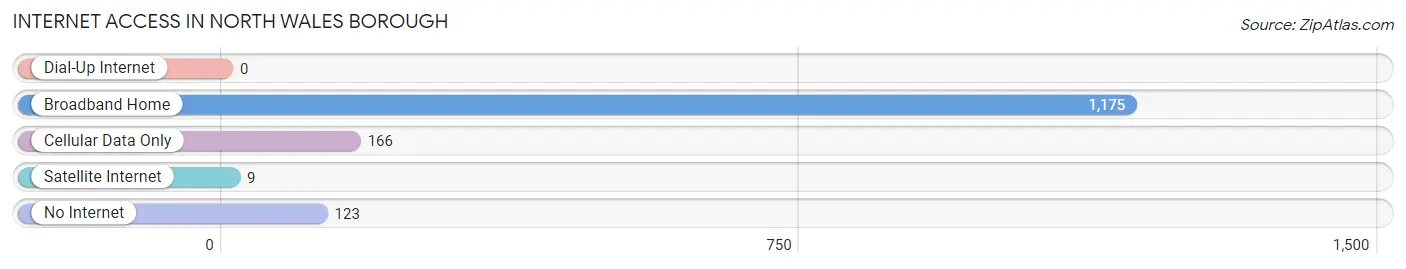
| Internet Type | # Households | % Households |
| Dial-Up Internet | 0 | 0.0% |
| Broadband Home | 1,175 | 80.3% |
| Cellular Data Only | 166 | 11.3% |
| Satellite Internet | 9 | 0.6% |
| No Internet | 123 | 8.4% |
| Total | 1,464 | 100.0% |
North Wales borough Summary
North Wales Borough is a borough located in Montgomery County, Pennsylvania, United States. The population was 3,229 at the 2010 census. It is part of the North Penn Valley region that is centered around the borough of Lansdale.
History
North Wales Borough was founded in 1869 by a group of Welsh immigrants who had settled in the area. The borough was named after the Welsh city of North Wales. The first settlers were farmers who grew wheat, corn, and oats. The first industry in the area was a grist mill, which was built in 1871. The mill was powered by a water wheel and was used to grind grain into flour.
The first post office in North Wales was established in 1872. The first school was built in 1875 and the first church was built in 1877. The first newspaper, the North Wales Herald, was established in 1878.
In the late 19th century, the borough became a popular summer resort destination for wealthy Philadelphians. The area was known for its natural beauty and its proximity to the city. Hotels, boarding houses, and cottages were built to accommodate the influx of visitors.
In the early 20th century, the borough began to develop into a residential community. The population grew steadily and by the 1950s, the borough had become a bedroom community for Philadelphia.
Geography
North Wales Borough is located at 40°13'17" North, 75°17'45" West (40.2214, -75.2958). According to the United States Census Bureau, the borough has a total area of 0.7 square miles (1.8 km2), all of it land.
The borough is located in the North Penn Valley region of Montgomery County. It is bordered by the boroughs of Lansdale to the north, Hatfield to the east, and Upper Gwynedd to the south. The borough is also bordered by Towamencin Township to the west.
Economy
North Wales Borough is primarily a residential community. The borough does not have any major industries or businesses. The majority of the borough's residents are employed in the nearby cities of Philadelphia and Lansdale.
Demographics
As of the census of 2010, there were 3,229 people, 1,323 households, and 890 families residing in the borough. The population density was 4,619.3 people per square mile (1,785.2/km2). There were 1,383 housing units at an average density of 1,967.3 per square mile (759.7/km2). The racial makeup of the borough was 92.2% White, 2.2% African American, 0.2% Native American, 2.7% Asian, 0.7% from other races, and 2.0% from two or more races. Hispanic or Latino of any race were 3.2% of the population.
There were 1,323 households, out of which 28.2% had children under the age of 18 living with them, 51.2% were married couples living together, 10.2% had a female householder with no husband present, and 33.7% were non-families. 28.2% of all households were made up of individuals, and 11.2% had someone living alone who was 65 years of age or older. The average household size was 2.43 and the average family size was 3.00.
In the borough the population was spread out, with 22.2% under the age of 18, 6.2% from 18 to 24, 28.2% from 25 to 44, 27.2% from 45 to 64, and 16.2% who were 65 years of age or older. The median age was 40 years. For every 100 females, there were 93.2 males. For every 100 females age 18 and over, there were 90.2 males.
The median income for a household in the borough was $60,938, and the median income for a family was $71,917. Males had a median income of $50,000 versus $37,500 for females. The per capita income for the borough was $30,945. About 2.7% of families and 4.2% of the population were below the poverty line, including 4.2% of those under age 18 and 4.2% of those age 65 or over.
Common Questions
What is Per Capita Income in North Wales borough?
Per Capita income in North Wales borough is $50,093.
What is the Median Family Income in North Wales borough?
Median Family Income in North Wales borough is $136,000.
What is the Median Household income in North Wales borough?
Median Household Income in North Wales borough is $113,375.
What is Income or Wage Gap in North Wales borough?
Income or Wage Gap in North Wales borough is 54.4%.
Women in North Wales borough earn 45.6 cents for every dollar earned by a man.
What is Inequality or Gini Index in North Wales borough?
Inequality or Gini Index in North Wales borough is 0.39.
What is the Total Population of North Wales borough?
Total Population of North Wales borough is 3,415.
What is the Total Male Population of North Wales borough?
Total Male Population of North Wales borough is 1,548.
What is the Total Female Population of North Wales borough?
Total Female Population of North Wales borough is 1,867.
What is the Ratio of Males per 100 Females in North Wales borough?
There are 82.91 Males per 100 Females in North Wales borough.
What is the Ratio of Females per 100 Males in North Wales borough?
There are 120.61 Females per 100 Males in North Wales borough.
What is the Median Population Age in North Wales borough?
Median Population Age in North Wales borough is 37.2 Years.
What is the Average Family Size in North Wales borough
Average Family Size in North Wales borough is 2.9 People.
What is the Average Household Size in North Wales borough
Average Household Size in North Wales borough is 2.3 People.
How Large is the Labor Force in North Wales borough?
There are 2,078 People in the Labor Forcein in North Wales borough.
What is the Percentage of People in the Labor Force in North Wales borough?
75.0% of People are in the Labor Force in North Wales borough.
What is the Unemployment Rate in North Wales borough?
Unemployment Rate in North Wales borough is 2.7%.