Edgewood borough, PA Map & Demographics
Edgewood borough Overview
$63,603
PER CAPITA INCOME
$129,167
AVG FAMILY INCOME
$92,750
AVG HOUSEHOLD INCOME
37.3%
WAGE / INCOME GAP [ % ]
62.7¢/ $1
WAGE / INCOME GAP [ $ ]
0.43
INEQUALITY / GINI INDEX
3,104
TOTAL POPULATION
1,355
MALE POPULATION
1,749
FEMALE POPULATION
77.47
MALES / 100 FEMALES
129.08
FEMALES / 100 MALES
37.6
MEDIAN AGE
2.7
AVG FAMILY SIZE
2.0
AVG HOUSEHOLD SIZE
2,223
LABOR FORCE [ PEOPLE ]
83.7%
PERCENT IN LABOR FORCE
3.9%
UNEMPLOYMENT RATE
Income in Edgewood borough
Income Overview in Edgewood borough
Per Capita Income in Edgewood borough is $63,603, while median incomes of families and households are $129,167 and $92,750 respectively.
| Characteristic | Number | Measure |
| Per Capita Income | 3,104 | $63,603 |
| Median Family Income | 760 | $129,167 |
| Mean Family Income | 760 | $169,353 |
| Median Household Income | 1,559 | $92,750 |
| Mean Household Income | 1,559 | $125,831 |
| Income Deficit | 760 | $0 |
| Wage / Income Gap (%) | 3,104 | 37.34% |
| Wage / Income Gap ($) | 3,104 | 62.66¢ per $1 |
| Gini / Inequality Index | 3,104 | 0.43 |
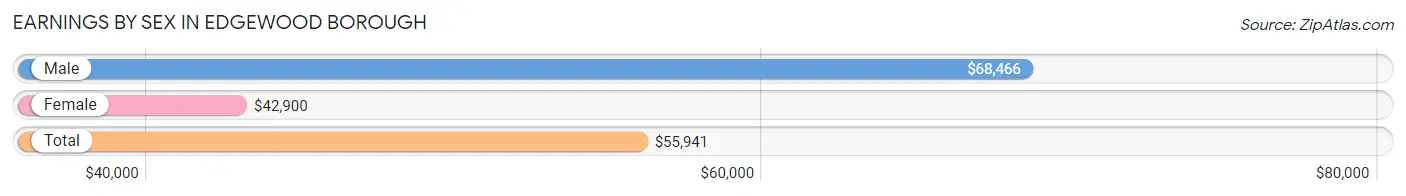
Earnings by Sex in Edgewood borough
Average Earnings in Edgewood borough are $55,941, $68,466 for men and $42,900 for women, a difference of 37.3%.
| Sex | Number | Average Earnings |
| Male | 975 (43.6%) | $68,466 |
| Female | 1,262 (56.4%) | $42,900 |
| Total | 2,237 (100.0%) | $55,941 |
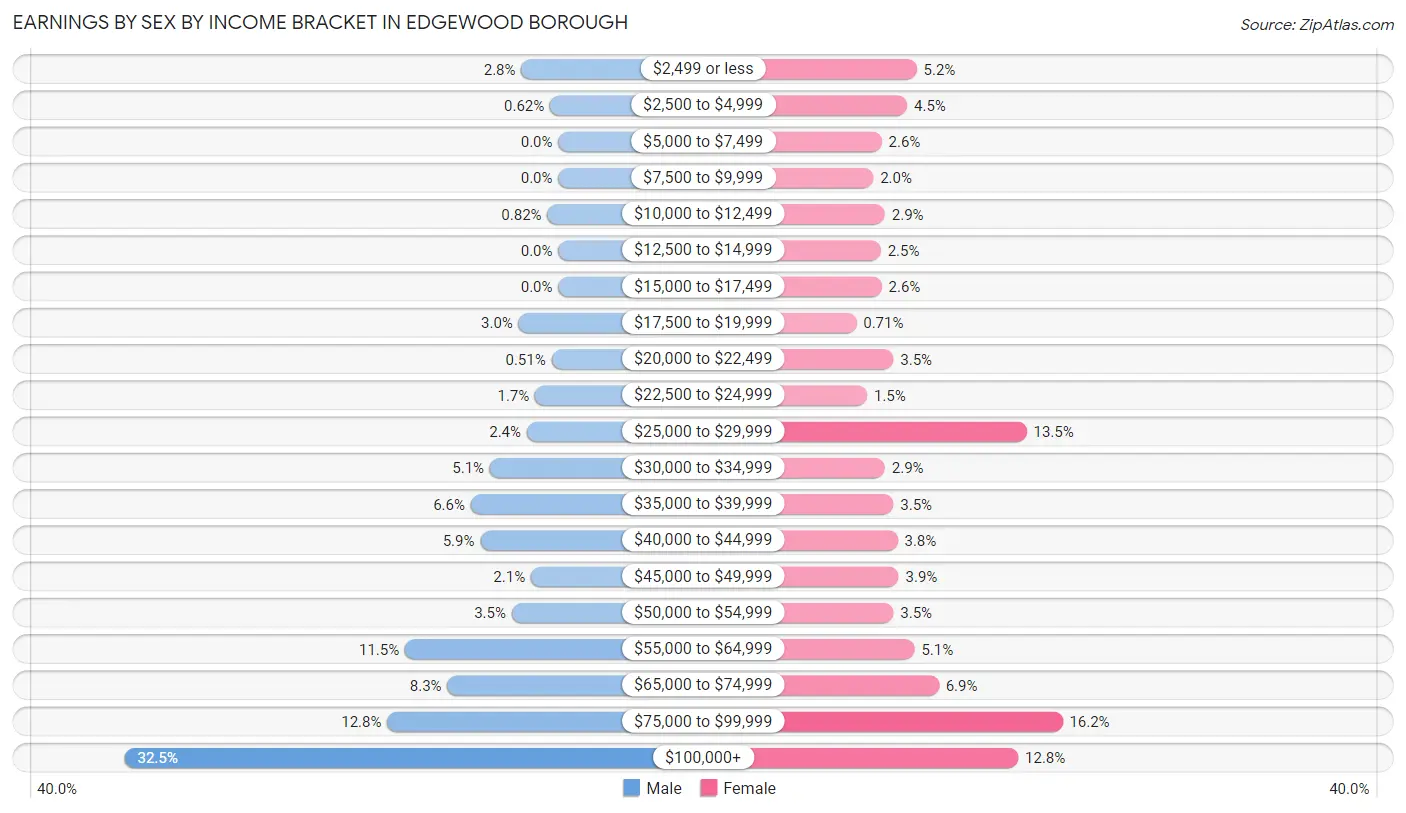
Earnings by Sex by Income Bracket in Edgewood borough
The most common earnings brackets in Edgewood borough are $100,000+ for men (317 | 32.5%) and $75,000 to $99,999 for women (204 | 16.2%).
| Income | Male | Female |
| $2,499 or less | 27 (2.8%) | 66 (5.2%) |
| $2,500 to $4,999 | 6 (0.6%) | 57 (4.5%) |
| $5,000 to $7,499 | 0 (0.0%) | 33 (2.6%) |
| $7,500 to $9,999 | 0 (0.0%) | 25 (2.0%) |
| $10,000 to $12,499 | 8 (0.8%) | 36 (2.9%) |
| $12,500 to $14,999 | 0 (0.0%) | 32 (2.5%) |
| $15,000 to $17,499 | 0 (0.0%) | 33 (2.6%) |
| $17,500 to $19,999 | 29 (3.0%) | 9 (0.7%) |
| $20,000 to $22,499 | 5 (0.5%) | 44 (3.5%) |
| $22,500 to $24,999 | 17 (1.7%) | 19 (1.5%) |
| $25,000 to $29,999 | 23 (2.4%) | 170 (13.5%) |
| $30,000 to $34,999 | 50 (5.1%) | 36 (2.9%) |
| $35,000 to $39,999 | 64 (6.6%) | 44 (3.5%) |
| $40,000 to $44,999 | 57 (5.9%) | 48 (3.8%) |
| $45,000 to $49,999 | 20 (2.1%) | 49 (3.9%) |
| $50,000 to $54,999 | 34 (3.5%) | 44 (3.5%) |
| $55,000 to $64,999 | 112 (11.5%) | 64 (5.1%) |
| $65,000 to $74,999 | 81 (8.3%) | 87 (6.9%) |
| $75,000 to $99,999 | 125 (12.8%) | 204 (16.2%) |
| $100,000+ | 317 (32.5%) | 162 (12.8%) |
| Total | 975 (100.0%) | 1,262 (100.0%) |
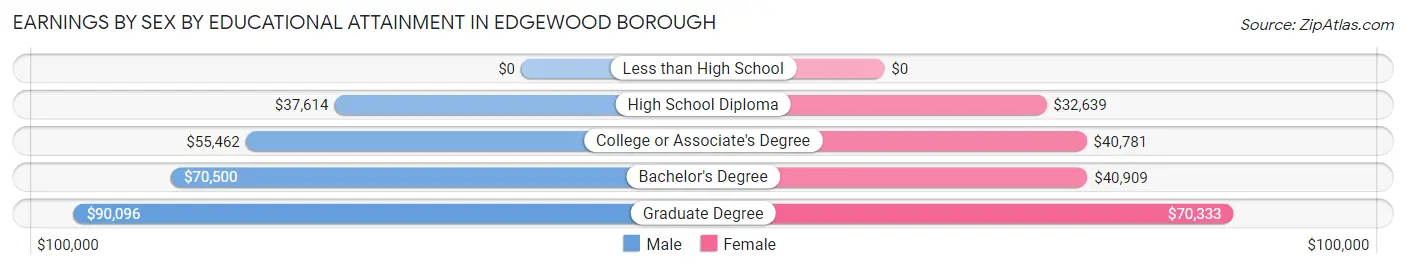
Earnings by Sex by Educational Attainment in Edgewood borough
Average earnings in Edgewood borough are $69,432 for men and $50,313 for women, a difference of 27.5%. Men with an educational attainment of graduate degree enjoy the highest average annual earnings of $90,096, while those with high school diploma education earn the least with $37,614. Women with an educational attainment of graduate degree earn the most with the average annual earnings of $70,333, while those with high school diploma education have the smallest earnings of $32,639.
| Educational Attainment | Male Income | Female Income |
| Less than High School | - | - |
| High School Diploma | $37,614 | $32,639 |
| College or Associate's Degree | $55,462 | $40,781 |
| Bachelor's Degree | $70,500 | $40,909 |
| Graduate Degree | $90,096 | $70,333 |
| Total | $69,432 | $50,313 |
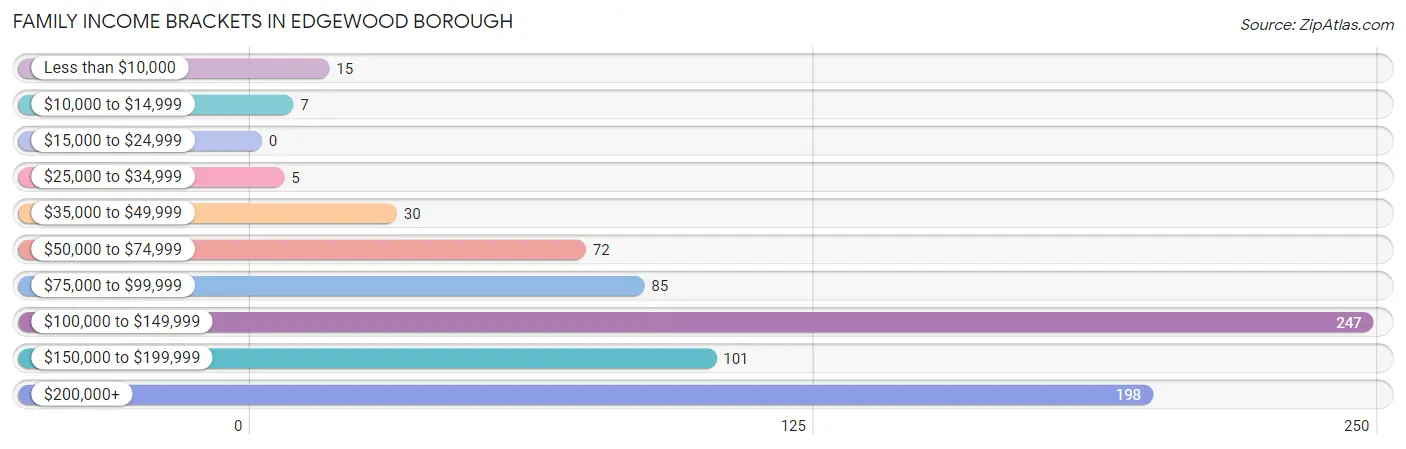
Family Income in Edgewood borough
Family Income Brackets in Edgewood borough
According to the Edgewood borough family income data, there are 247 families falling into the $100,000 to $149,999 income range, which is the most common income bracket and makes up 32.5% of all families.
| Income Bracket | # Families | % Families |
| Less than $10,000 | 15 | 2.0% |
| $10,000 to $14,999 | 7 | 0.9% |
| $15,000 to $24,999 | 0 | 0.0% |
| $25,000 to $34,999 | 5 | 0.7% |
| $35,000 to $49,999 | 30 | 3.9% |
| $50,000 to $74,999 | 72 | 9.5% |
| $75,000 to $99,999 | 85 | 11.2% |
| $100,000 to $149,999 | 247 | 32.5% |
| $150,000 to $199,999 | 101 | 13.3% |
| $200,000+ | 198 | 26.1% |
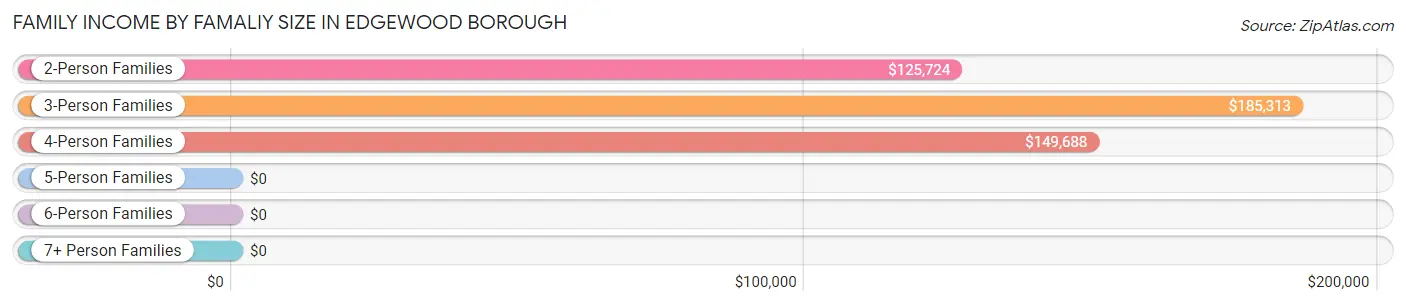
Family Income by Famaliy Size in Edgewood borough
3-person families (105 | 13.8%) account for the highest median family income in Edgewood borough with $185,313 per family, while 2-person families (485 | 63.8%) have the highest median income of $62,862 per family member.
| Income Bracket | # Families | Median Income |
| 2-Person Families | 485 (63.8%) | $125,724 |
| 3-Person Families | 105 (13.8%) | $185,313 |
| 4-Person Families | 141 (18.5%) | $149,688 |
| 5-Person Families | 29 (3.8%) | $0 |
| 6-Person Families | 0 (0.0%) | $0 |
| 7+ Person Families | 0 (0.0%) | $0 |
| Total | 760 (100.0%) | $129,167 |
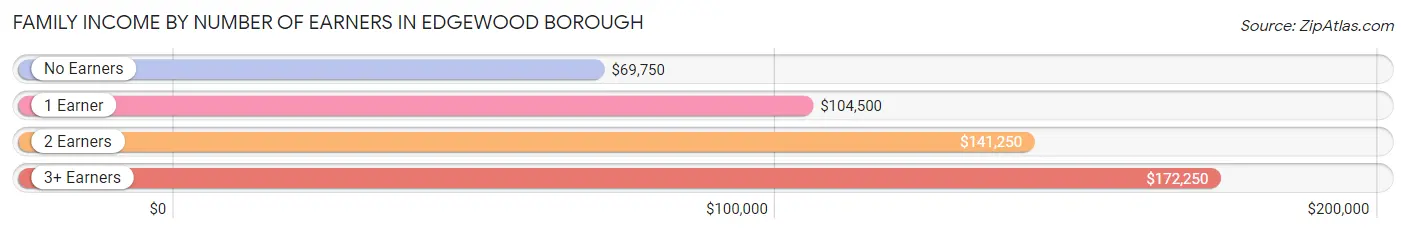
Family Income by Number of Earners in Edgewood borough
The median family income in Edgewood borough is $129,167, with families comprising 3+ earners (65) having the highest median family income of $172,250, while families with no earners (43) have the lowest median family income of $69,750, accounting for 8.6% and 5.7% of families, respectively.
| Number of Earners | # Families | Median Income |
| No Earners | 43 (5.7%) | $69,750 |
| 1 Earner | 166 (21.8%) | $104,500 |
| 2 Earners | 486 (63.9%) | $141,250 |
| 3+ Earners | 65 (8.6%) | $172,250 |
| Total | 760 (100.0%) | $129,167 |
Household Income in Edgewood borough
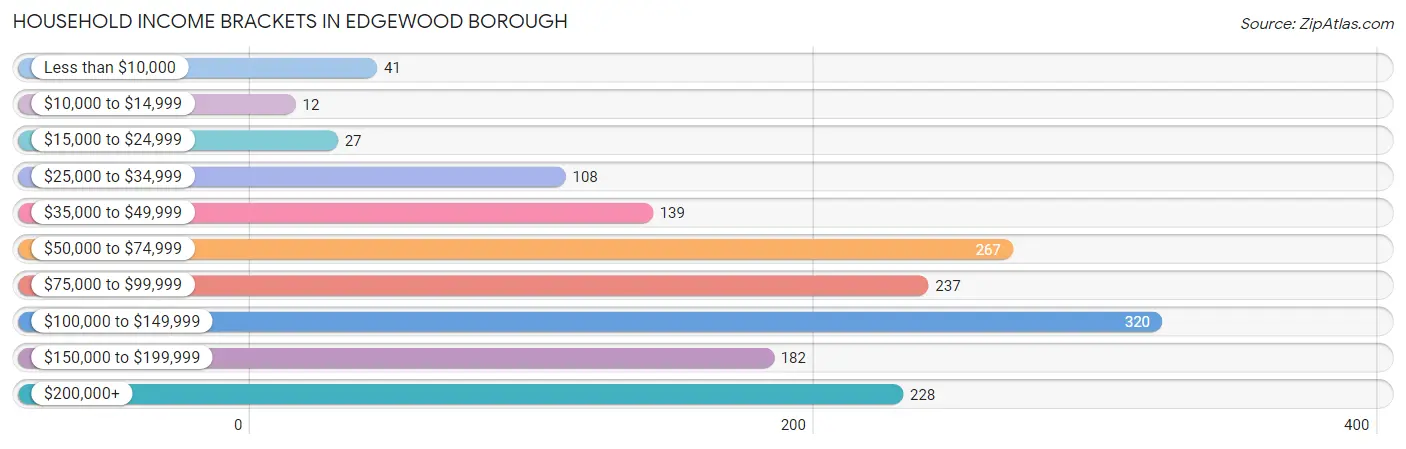
Household Income Brackets in Edgewood borough
With 320 households falling in the category, the $100,000 to $149,999 income range is the most frequent in Edgewood borough, accounting for 20.5% of all households. In contrast, only 12 households (0.8%) fall into the $10,000 to $14,999 income bracket, making it the least populous group.
| Income Bracket | # Households | % Households |
| Less than $10,000 | 41 | 2.6% |
| $10,000 to $14,999 | 12 | 0.8% |
| $15,000 to $24,999 | 27 | 1.7% |
| $25,000 to $34,999 | 108 | 6.9% |
| $35,000 to $49,999 | 139 | 8.9% |
| $50,000 to $74,999 | 267 | 17.1% |
| $75,000 to $99,999 | 237 | 15.2% |
| $100,000 to $149,999 | 320 | 20.5% |
| $150,000 to $199,999 | 182 | 11.7% |
| $200,000+ | 228 | 14.6% |
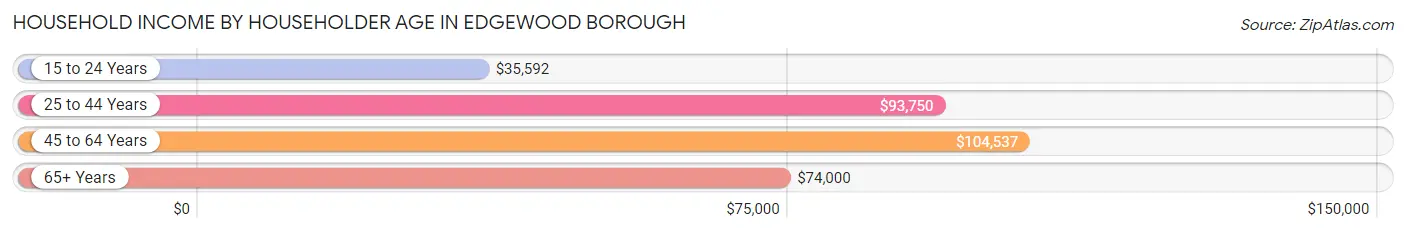
Household Income by Householder Age in Edgewood borough
The median household income in Edgewood borough is $92,750, with the highest median household income of $104,537 found in the 45 to 64 years age bracket for the primary householder. A total of 490 households (31.4%) fall into this category. Meanwhile, the 15 to 24 years age bracket for the primary householder has the lowest median household income of $35,592, with 61 households (3.9%) in this group.
| Income Bracket | # Households | Median Income |
| 15 to 24 Years | 61 (3.9%) | $35,592 |
| 25 to 44 Years | 688 (44.1%) | $93,750 |
| 45 to 64 Years | 490 (31.4%) | $104,537 |
| 65+ Years | 320 (20.5%) | $74,000 |
| Total | 1,559 (100.0%) | $92,750 |
Poverty in Edgewood borough
Income Below Poverty by Sex and Age in Edgewood borough
With 4.5% poverty level for males and 5.7% for females among the residents of Edgewood borough, under 5 year old males and under 5 year old females are the most vulnerable to poverty, with 29 males (29.6%) and 12 females (22.2%) in their respective age groups living below the poverty level.
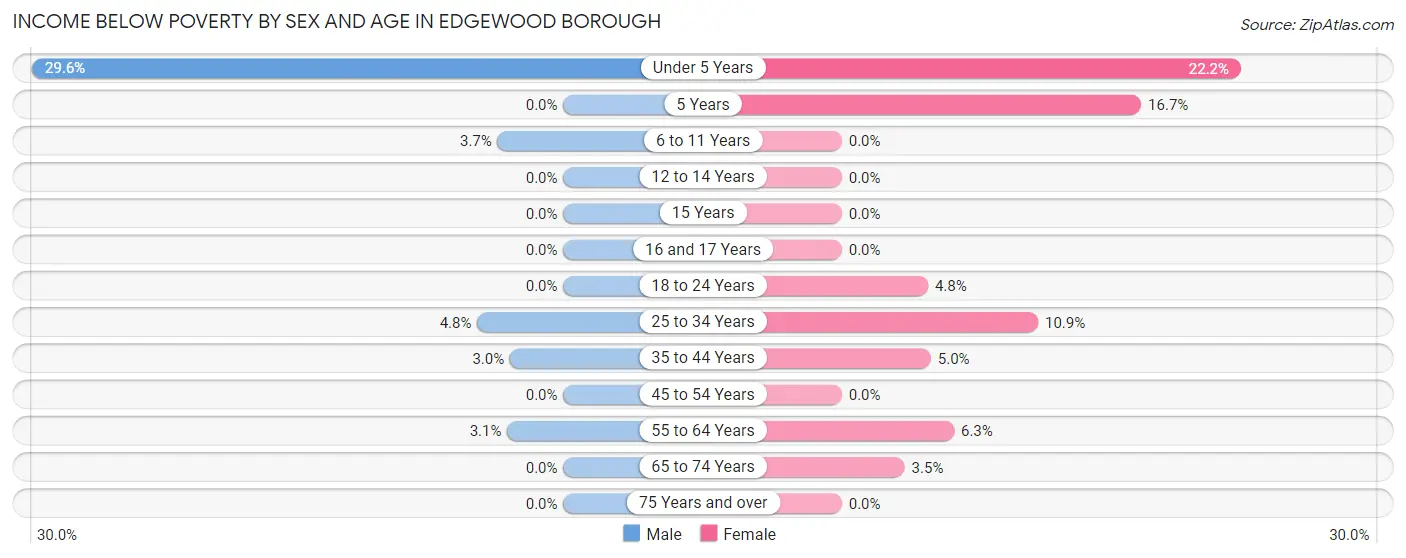
| Age Bracket | Male | Female |
| Under 5 Years | 29 (29.6%) | 12 (22.2%) |
| 5 Years | 0 (0.0%) | 3 (16.7%) |
| 6 to 11 Years | 3 (3.7%) | 0 (0.0%) |
| 12 to 14 Years | 0 (0.0%) | 0 (0.0%) |
| 15 Years | 0 (0.0%) | 0 (0.0%) |
| 16 and 17 Years | 0 (0.0%) | 0 (0.0%) |
| 18 to 24 Years | 0 (0.0%) | 6 (4.8%) |
| 25 to 34 Years | 16 (4.8%) | 48 (10.9%) |
| 35 to 44 Years | 7 (3.0%) | 12 (5.0%) |
| 45 to 54 Years | 0 (0.0%) | 0 (0.0%) |
| 55 to 64 Years | 5 (3.1%) | 14 (6.2%) |
| 65 to 74 Years | 0 (0.0%) | 5 (3.5%) |
| 75 Years and over | 0 (0.0%) | 0 (0.0%) |
| Total | 60 (4.5%) | 100 (5.7%) |
Income Above Poverty by Sex and Age in Edgewood borough
According to the poverty statistics in Edgewood borough, males aged 12 to 14 years and females aged 6 to 11 years are the age groups that are most secure financially, with 100.0% of males and 100.0% of females in these age groups living above the poverty line.
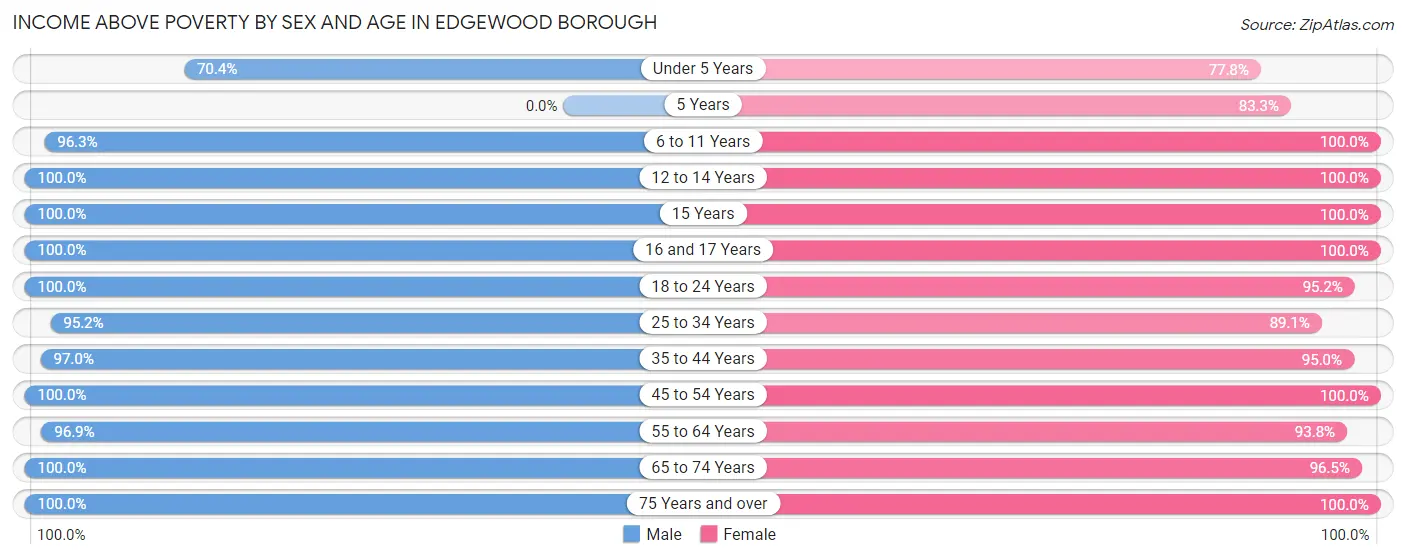
| Age Bracket | Male | Female |
| Under 5 Years | 69 (70.4%) | 42 (77.8%) |
| 5 Years | 0 (0.0%) | 15 (83.3%) |
| 6 to 11 Years | 79 (96.3%) | 117 (100.0%) |
| 12 to 14 Years | 11 (100.0%) | 28 (100.0%) |
| 15 Years | 17 (100.0%) | 11 (100.0%) |
| 16 and 17 Years | 11 (100.0%) | 40 (100.0%) |
| 18 to 24 Years | 6 (100.0%) | 119 (95.2%) |
| 25 to 34 Years | 318 (95.2%) | 391 (89.1%) |
| 35 to 44 Years | 229 (97.0%) | 230 (95.0%) |
| 45 to 54 Years | 196 (100.0%) | 222 (100.0%) |
| 55 to 64 Years | 155 (96.9%) | 210 (93.8%) |
| 65 to 74 Years | 141 (100.0%) | 138 (96.5%) |
| 75 Years and over | 51 (100.0%) | 86 (100.0%) |
| Total | 1,283 (95.5%) | 1,649 (94.3%) |
Income Below Poverty Among Married-Couple Families in Edgewood borough
The poverty statistics for married-couple families in Edgewood borough show that 2.2% or 15 of the total 676 families live below the poverty line. Families with 3 or 4 children have the highest poverty rate of 37.9%, comprising of 11 families. On the other hand, families with no children have the lowest poverty rate of 0.0%, which includes 0 families.
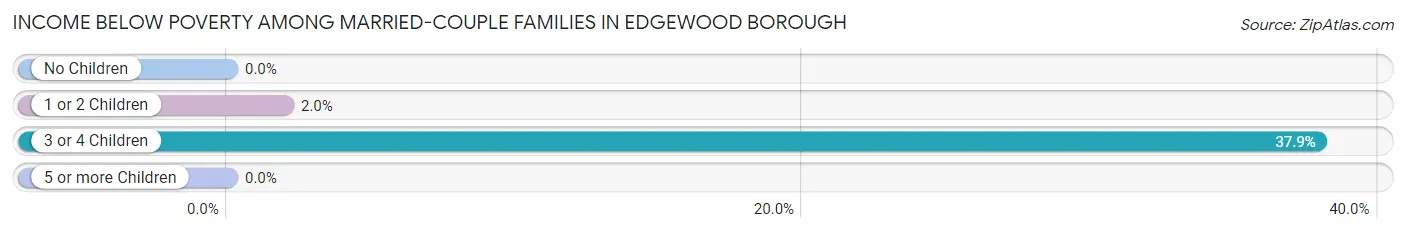
| Children | Above Poverty | Below Poverty |
| No Children | 442 (100.0%) | 0 (0.0%) |
| 1 or 2 Children | 201 (98.1%) | 4 (1.9%) |
| 3 or 4 Children | 18 (62.1%) | 11 (37.9%) |
| 5 or more Children | 0 (0.0%) | 0 (0.0%) |
| Total | 661 (97.8%) | 15 (2.2%) |
Income Below Poverty Among Single-Parent Households in Edgewood borough
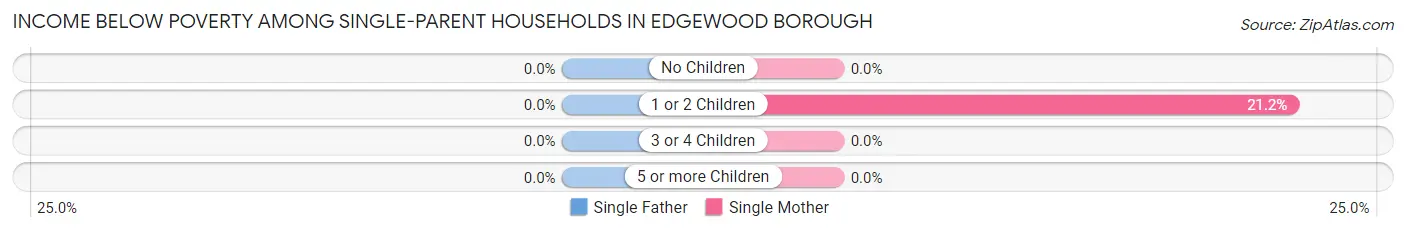
| Children | Single Father | Single Mother |
| No Children | 0 (0.0%) | 0 (0.0%) |
| 1 or 2 Children | 0 (0.0%) | 7 (21.2%) |
| 3 or 4 Children | 0 (0.0%) | 0 (0.0%) |
| 5 or more Children | 0 (0.0%) | 0 (0.0%) |
| Total | 0 (0.0%) | 7 (9.6%) |
Income Below Poverty Among Married-Couple vs Single-Parent Households in Edgewood borough
The poverty data for Edgewood borough shows that 15 of the married-couple family households (2.2%) and 7 of the single-parent households (8.3%) are living below the poverty level. Within the married-couple family households, those with 3 or 4 children have the highest poverty rate, with 11 households (37.9%) falling below the poverty line. Among the single-parent households, those with 1 or 2 children have the highest poverty rate, with 7 household (16.7%) living below poverty.
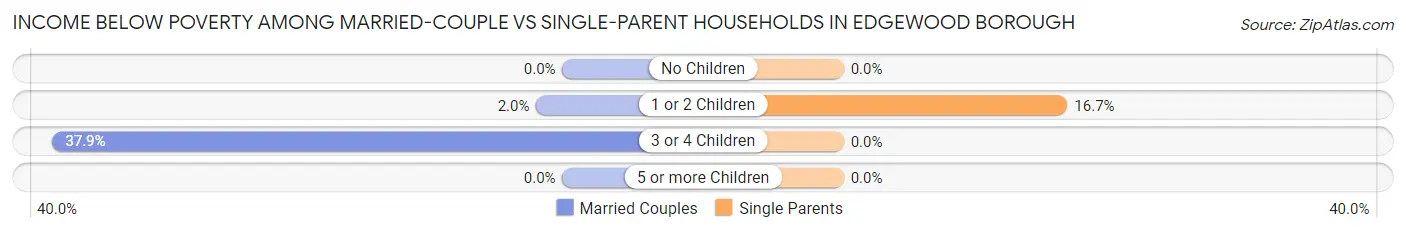
| Children | Married-Couple Families | Single-Parent Households |
| No Children | 0 (0.0%) | 0 (0.0%) |
| 1 or 2 Children | 4 (1.9%) | 7 (16.7%) |
| 3 or 4 Children | 11 (37.9%) | 0 (0.0%) |
| 5 or more Children | 0 (0.0%) | 0 (0.0%) |
| Total | 15 (2.2%) | 7 (8.3%) |
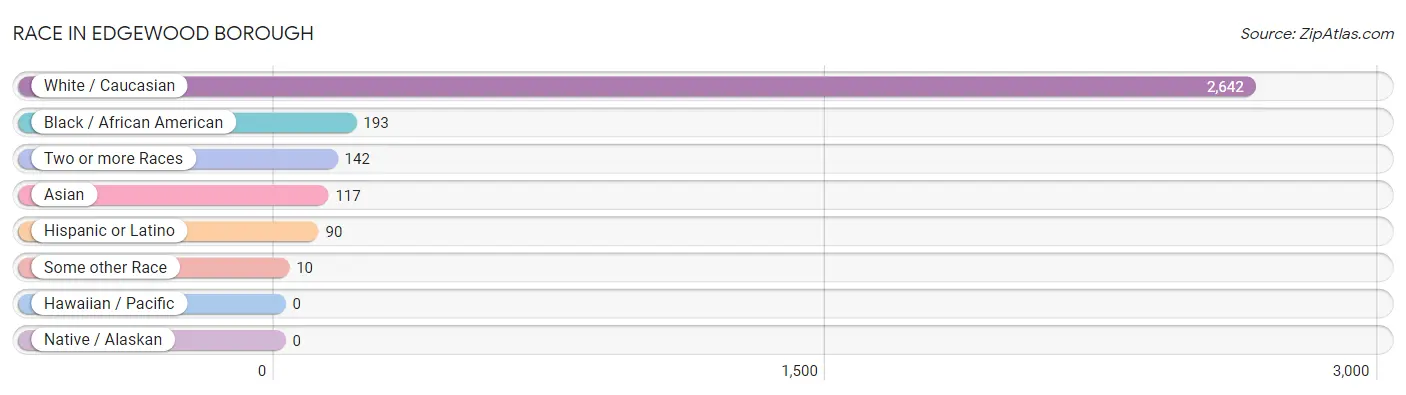
Race in Edgewood borough
The most populous races in Edgewood borough are White / Caucasian (2,642 | 85.1%), Black / African American (193 | 6.2%), and Two or more Races (142 | 4.6%).
| Race | # Population | % Population |
| Asian | 117 | 3.8% |
| Black / African American | 193 | 6.2% |
| Hawaiian / Pacific | 0 | 0.0% |
| Hispanic or Latino | 90 | 2.9% |
| Native / Alaskan | 0 | 0.0% |
| White / Caucasian | 2,642 | 85.1% |
| Two or more Races | 142 | 4.6% |
| Some other Race | 10 | 0.3% |
| Total | 3,104 | 100.0% |
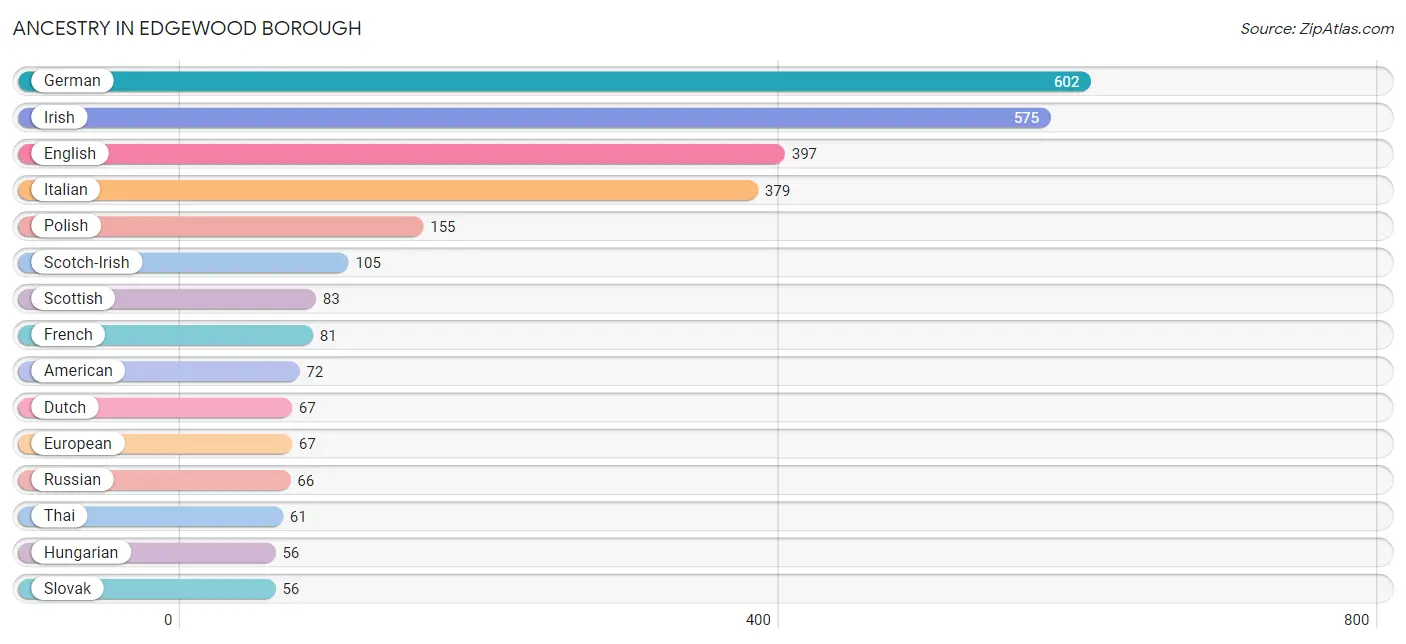
Ancestry in Edgewood borough
The most populous ancestries reported in Edgewood borough are German (602 | 19.4%), Irish (575 | 18.5%), English (397 | 12.8%), Italian (379 | 12.2%), and Polish (155 | 5.0%), together accounting for 67.9% of all Edgewood borough residents.
| Ancestry | # Population | % Population |
| Afghan | 9 | 0.3% |
| American | 72 | 2.3% |
| Arab | 16 | 0.5% |
| Armenian | 6 | 0.2% |
| Austrian | 29 | 0.9% |
| Bangladeshi | 9 | 0.3% |
| Belgian | 7 | 0.2% |
| Bhutanese | 16 | 0.5% |
| British | 33 | 1.1% |
| Bulgarian | 4 | 0.1% |
| Burmese | 19 | 0.6% |
| Cambodian | 13 | 0.4% |
| Canadian | 18 | 0.6% |
| Croatian | 10 | 0.3% |
| Czech | 24 | 0.8% |
| Czechoslovakian | 5 | 0.2% |
| Dutch | 67 | 2.2% |
| Eastern European | 14 | 0.4% |
| Ecuadorian | 6 | 0.2% |
| English | 397 | 12.8% |
| Ethiopian | 6 | 0.2% |
| European | 67 | 2.2% |
| Finnish | 14 | 0.4% |
| French | 81 | 2.6% |
| French Canadian | 16 | 0.5% |
| German | 602 | 19.4% |
| Greek | 19 | 0.6% |
| Haitian | 9 | 0.3% |
| Hungarian | 56 | 1.8% |
| Indian (Asian) | 4 | 0.1% |
| Iranian | 18 | 0.6% |
| Irish | 575 | 18.5% |
| Italian | 379 | 12.2% |
| Lebanese | 16 | 0.5% |
| Lithuanian | 27 | 0.9% |
| Mexican | 43 | 1.4% |
| Mexican American Indian | 6 | 0.2% |
| Nigerian | 10 | 0.3% |
| Norwegian | 43 | 1.4% |
| Pakistani | 6 | 0.2% |
| Polish | 155 | 5.0% |
| Portuguese | 8 | 0.3% |
| Puerto Rican | 9 | 0.3% |
| Romanian | 7 | 0.2% |
| Russian | 66 | 2.1% |
| Scandinavian | 11 | 0.4% |
| Scotch-Irish | 105 | 3.4% |
| Scottish | 83 | 2.7% |
| Serbian | 26 | 0.8% |
| Slavic | 2 | 0.1% |
| Slovak | 56 | 1.8% |
| Slovene | 5 | 0.2% |
| South American | 6 | 0.2% |
| Spaniard | 6 | 0.2% |
| Spanish | 26 | 0.8% |
| Subsaharan African | 16 | 0.5% |
| Swedish | 40 | 1.3% |
| Swiss | 24 | 0.8% |
| Thai | 61 | 2.0% |
| Ukrainian | 25 | 0.8% |
| Welsh | 36 | 1.2% | View All 61 Rows |
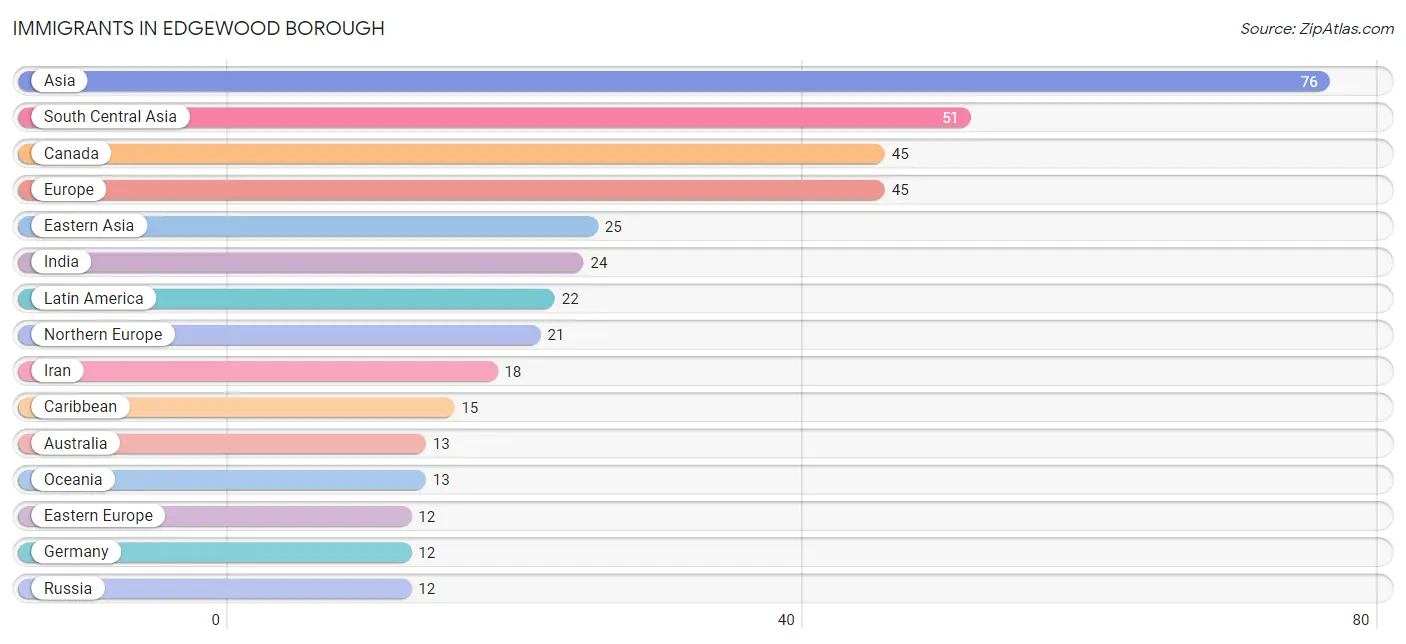
Immigrants in Edgewood borough
The most numerous immigrant groups reported in Edgewood borough came from Asia (76 | 2.5%), South Central Asia (51 | 1.6%), Canada (45 | 1.5%), Europe (45 | 1.5%), and Eastern Asia (25 | 0.8%), together accounting for 7.8% of all Edgewood borough residents.
| Immigration Origin | # Population | % Population |
| Afghanistan | 4 | 0.1% |
| Asia | 76 | 2.5% |
| Australia | 13 | 0.4% |
| Canada | 45 | 1.5% |
| Caribbean | 15 | 0.5% |
| Central America | 7 | 0.2% |
| China | 10 | 0.3% |
| Eastern Asia | 25 | 0.8% |
| Eastern Europe | 12 | 0.4% |
| England | 6 | 0.2% |
| Europe | 45 | 1.5% |
| Germany | 12 | 0.4% |
| Haiti | 9 | 0.3% |
| India | 24 | 0.8% |
| Iran | 18 | 0.6% |
| Ireland | 5 | 0.2% |
| Korea | 8 | 0.3% |
| Latin America | 22 | 0.7% |
| Mexico | 7 | 0.2% |
| Northern Europe | 21 | 0.7% |
| Oceania | 13 | 0.4% |
| Russia | 12 | 0.4% |
| South Central Asia | 51 | 1.6% |
| Uzbekistan | 5 | 0.2% |
| Western Europe | 12 | 0.4% | View All 25 Rows |
Sex and Age in Edgewood borough
Sex and Age in Edgewood borough
The most populous age groups in Edgewood borough are 25 to 29 Years (174 | 12.8%) for men and 30 to 34 Years (255 | 14.6%) for women.
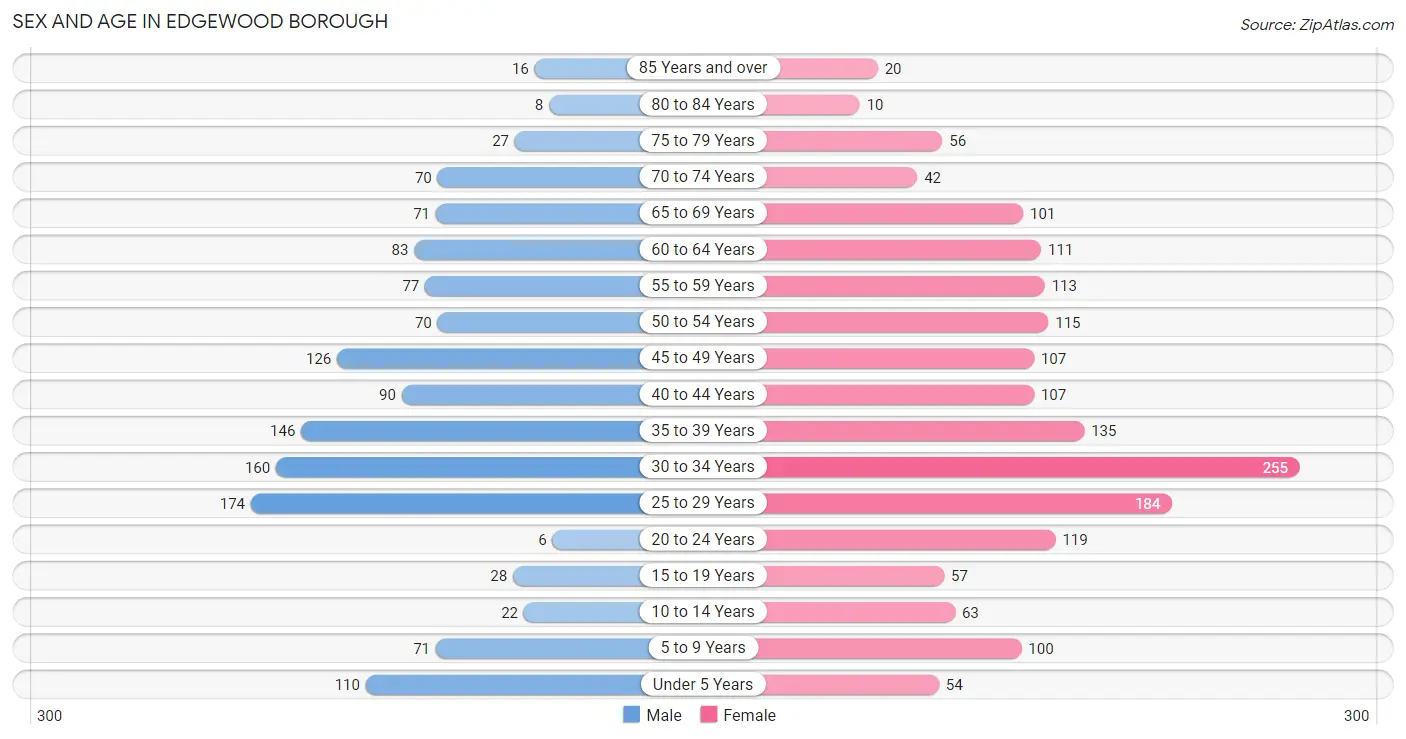
| Age Bracket | Male | Female |
| Under 5 Years | 110 (8.1%) | 54 (3.1%) |
| 5 to 9 Years | 71 (5.2%) | 100 (5.7%) |
| 10 to 14 Years | 22 (1.6%) | 63 (3.6%) |
| 15 to 19 Years | 28 (2.1%) | 57 (3.3%) |
| 20 to 24 Years | 6 (0.4%) | 119 (6.8%) |
| 25 to 29 Years | 174 (12.8%) | 184 (10.5%) |
| 30 to 34 Years | 160 (11.8%) | 255 (14.6%) |
| 35 to 39 Years | 146 (10.8%) | 135 (7.7%) |
| 40 to 44 Years | 90 (6.6%) | 107 (6.1%) |
| 45 to 49 Years | 126 (9.3%) | 107 (6.1%) |
| 50 to 54 Years | 70 (5.2%) | 115 (6.6%) |
| 55 to 59 Years | 77 (5.7%) | 113 (6.5%) |
| 60 to 64 Years | 83 (6.1%) | 111 (6.4%) |
| 65 to 69 Years | 71 (5.2%) | 101 (5.8%) |
| 70 to 74 Years | 70 (5.2%) | 42 (2.4%) |
| 75 to 79 Years | 27 (2.0%) | 56 (3.2%) |
| 80 to 84 Years | 8 (0.6%) | 10 (0.6%) |
| 85 Years and over | 16 (1.2%) | 20 (1.1%) |
| Total | 1,355 (100.0%) | 1,749 (100.0%) |
Families and Households in Edgewood borough
Median Family Size in Edgewood borough
The median family size in Edgewood borough is 2.72 persons per family, with married-couple families (676 | 88.9%) accounting for the largest median family size of 2.76 persons per family. On the other hand, single female/mother families (73 | 9.6%) represent the smallest median family size with 2.33 persons per family.
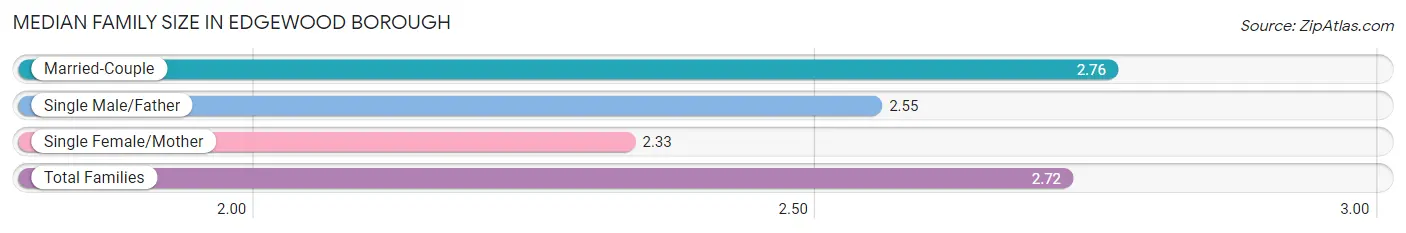
| Family Type | # Families | Family Size |
| Married-Couple | 676 (88.9%) | 2.76 |
| Single Male/Father | 11 (1.5%) | 2.55 |
| Single Female/Mother | 73 (9.6%) | 2.33 |
| Total Families | 760 (100.0%) | 2.72 |
Median Household Size in Edgewood borough
The median household size in Edgewood borough is 1.99 persons per household, with single male/father households (11 | 0.7%) accounting for the largest median household size of 2.91 persons per household. non-family households (799 | 51.2%) represent the smallest median household size with 1.24 persons per household.
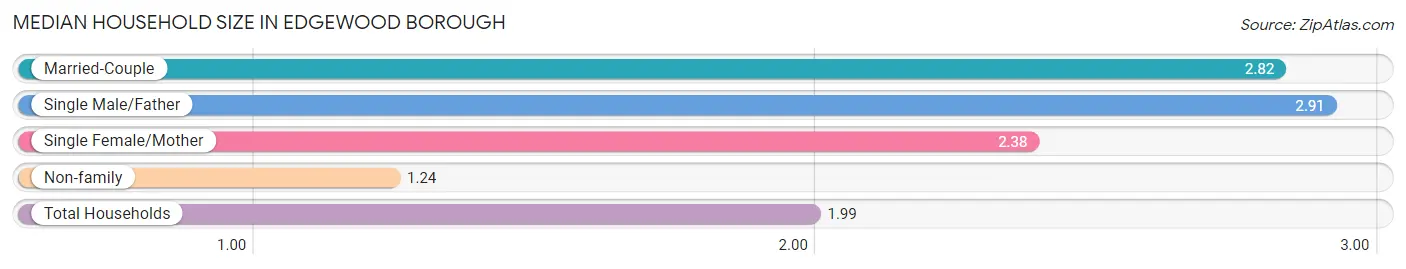
| Household Type | # Households | Household Size |
| Married-Couple | 676 (43.4%) | 2.82 |
| Single Male/Father | 11 (0.7%) | 2.91 |
| Single Female/Mother | 73 (4.7%) | 2.38 |
| Non-family | 799 (51.2%) | 1.24 |
| Total Households | 1,559 (100.0%) | 1.99 |
Household Size by Marriage Status in Edgewood borough
Out of a total of 1,559 households in Edgewood borough, 760 (48.7%) are family households, while 799 (51.2%) are nonfamily households. The most numerous type of family households are 2-person households, comprising 477, and the most common type of nonfamily households are 1-person households, comprising 598.
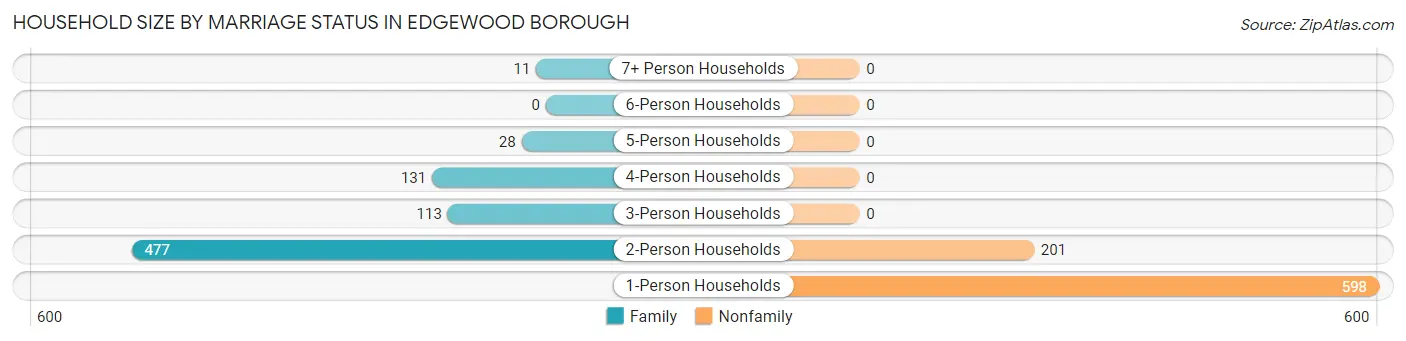
| Household Size | Family Households | Nonfamily Households |
| 1-Person Households | - | 598 (38.4%) |
| 2-Person Households | 477 (30.6%) | 201 (12.9%) |
| 3-Person Households | 113 (7.2%) | 0 (0.0%) |
| 4-Person Households | 131 (8.4%) | 0 (0.0%) |
| 5-Person Households | 28 (1.8%) | 0 (0.0%) |
| 6-Person Households | 0 (0.0%) | 0 (0.0%) |
| 7+ Person Households | 11 (0.7%) | 0 (0.0%) |
| Total | 760 (48.7%) | 799 (51.2%) |
Female Fertility in Edgewood borough
Fertility by Age in Edgewood borough
Average fertility rate in Edgewood borough is 27.0 births per 1,000 women. Women in the age bracket of 35 to 50 years have the highest fertility rate with 40.0 births per 1,000 women. Women in the age bracket of 35 to 50 years acount for 53.8% of all women with births.
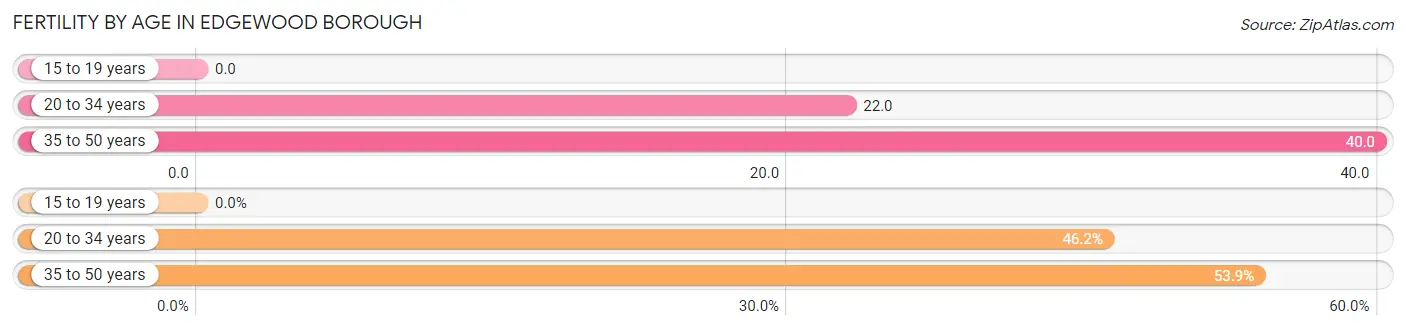
| Age Bracket | Women with Births | Births / 1,000 Women |
| 15 to 19 years | 0 (0.0%) | 0.0 |
| 20 to 34 years | 12 (46.2%) | 22.0 |
| 35 to 50 years | 14 (53.8%) | 40.0 |
| Total | 26 (100.0%) | 27.0 |
Fertility by Age by Marriage Status in Edgewood borough
84.6% of women with births (26) in Edgewood borough are married. The highest percentage of unmarried women with births falls into 20 to 34 years age bracket with 33.3% of them unmarried at the time of birth, while the lowest percentage of unmarried women with births belong to 35 to 50 years age bracket with 0.0% of them unmarried.
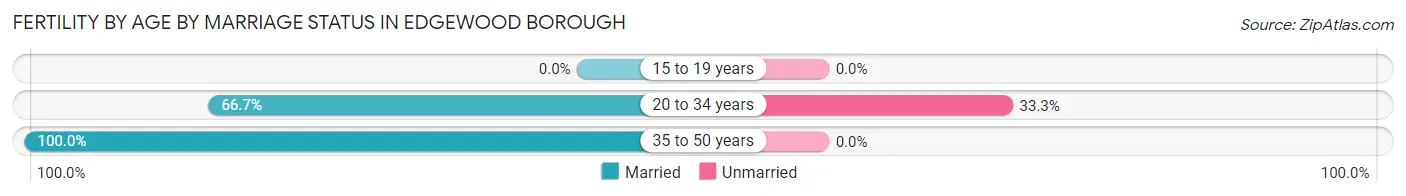
| Age Bracket | Married | Unmarried |
| 15 to 19 years | 0 (0.0%) | 0 (0.0%) |
| 20 to 34 years | 8 (66.7%) | 4 (33.3%) |
| 35 to 50 years | 14 (100.0%) | 0 (0.0%) |
| Total | 22 (84.6%) | 4 (15.4%) |
Fertility by Education in Edgewood borough
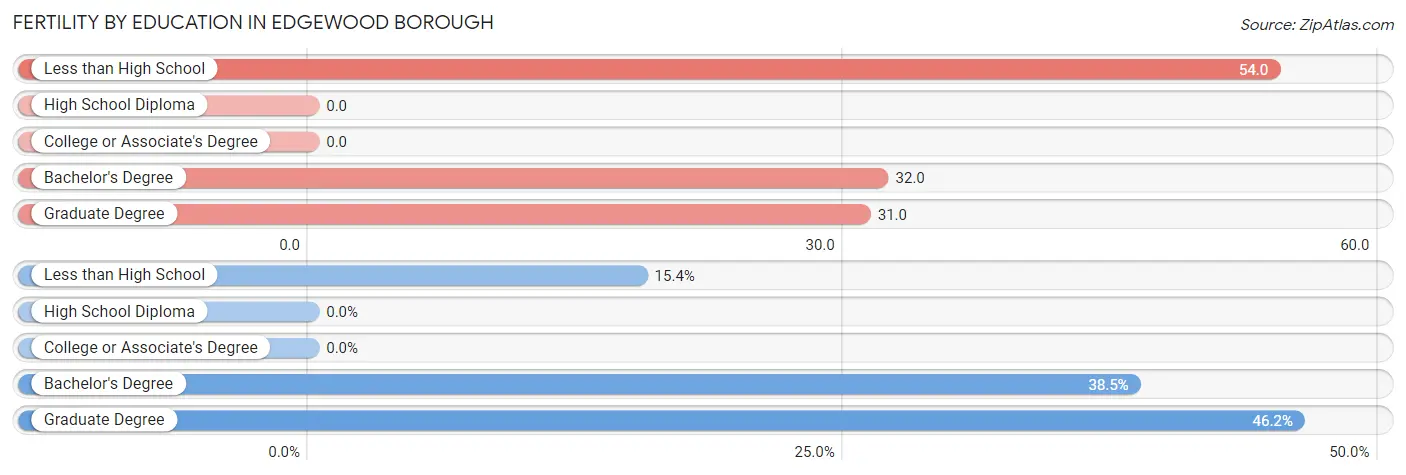
| Educational Attainment | Women with Births | Births / 1,000 Women |
| Less than High School | 4 (15.4%) | 54.0 |
| High School Diploma | 0 (0.0%) | 0.0 |
| College or Associate's Degree | 0 (0.0%) | 0.0 |
| Bachelor's Degree | 10 (38.5%) | 32.0 |
| Graduate Degree | 12 (46.2%) | 31.0 |
| Total | 26 (100.0%) | 27.0 |
Fertility by Education by Marriage Status in Edgewood borough
15.4% of women with births in Edgewood borough are unmarried. Women with the educational attainment of bachelor's degree are most likely to be married with 100.0% of them married at childbirth, while women with the educational attainment of less than high school are least likely to be married with 100.0% of them unmarried at childbirth.
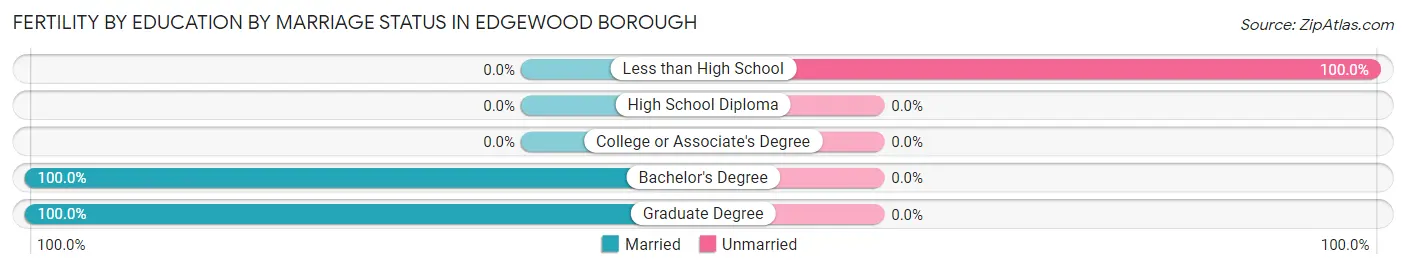
| Educational Attainment | Married | Unmarried |
| Less than High School | 0 (0.0%) | 4 (100.0%) |
| High School Diploma | 0 (0.0%) | 0 (0.0%) |
| College or Associate's Degree | 0 (0.0%) | 0 (0.0%) |
| Bachelor's Degree | 10 (100.0%) | 0 (0.0%) |
| Graduate Degree | 12 (100.0%) | 0 (0.0%) |
| Total | 22 (84.6%) | 4 (15.4%) |
Employment Characteristics in Edgewood borough
Employment by Class of Employer in Edgewood borough
Among the 2,117 employed individuals in Edgewood borough, private company employees (1,008 | 47.6%), not-for-profit organizations (674 | 31.8%), and local government employees (148 | 7.0%) make up the most common classes of employment.
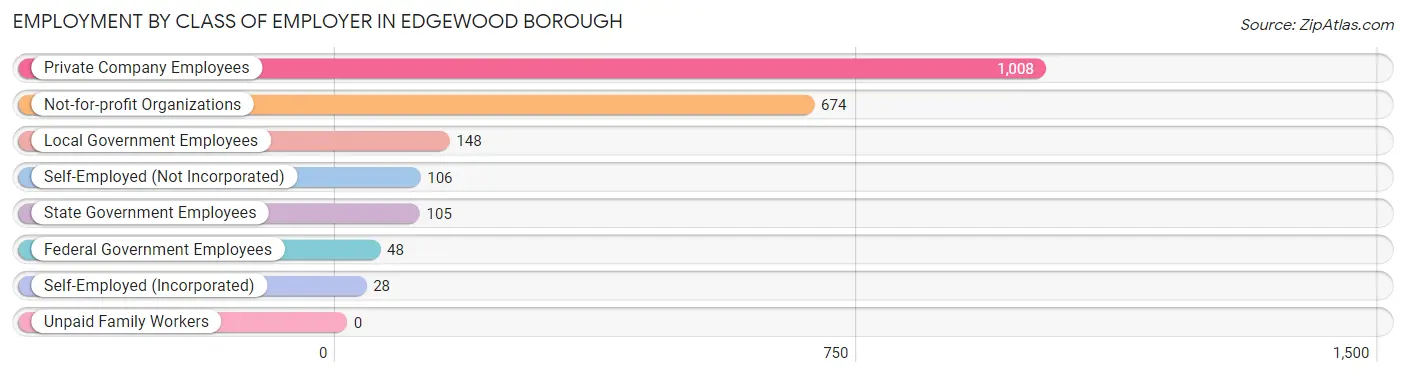
| Employer Class | # Employees | % Employees |
| Private Company Employees | 1,008 | 47.6% |
| Self-Employed (Incorporated) | 28 | 1.3% |
| Self-Employed (Not Incorporated) | 106 | 5.0% |
| Not-for-profit Organizations | 674 | 31.8% |
| Local Government Employees | 148 | 7.0% |
| State Government Employees | 105 | 5.0% |
| Federal Government Employees | 48 | 2.3% |
| Unpaid Family Workers | 0 | 0.0% |
| Total | 2,117 | 100.0% |
Employment Status by Age in Edgewood borough
According to the labor force statistics for Edgewood borough, out of the total population over 16 years of age (2,656), 83.7% or 2,223 individuals are in the labor force, with 3.9% or 87 of them unemployed. The age group with the highest labor force participation rate is 35 to 44 years, with 95.8% or 458 individuals in the labor force. Within the labor force, the 16 to 19 years age range has the highest percentage of unemployed individuals, with 41.2% or 14 of them being unemployed.
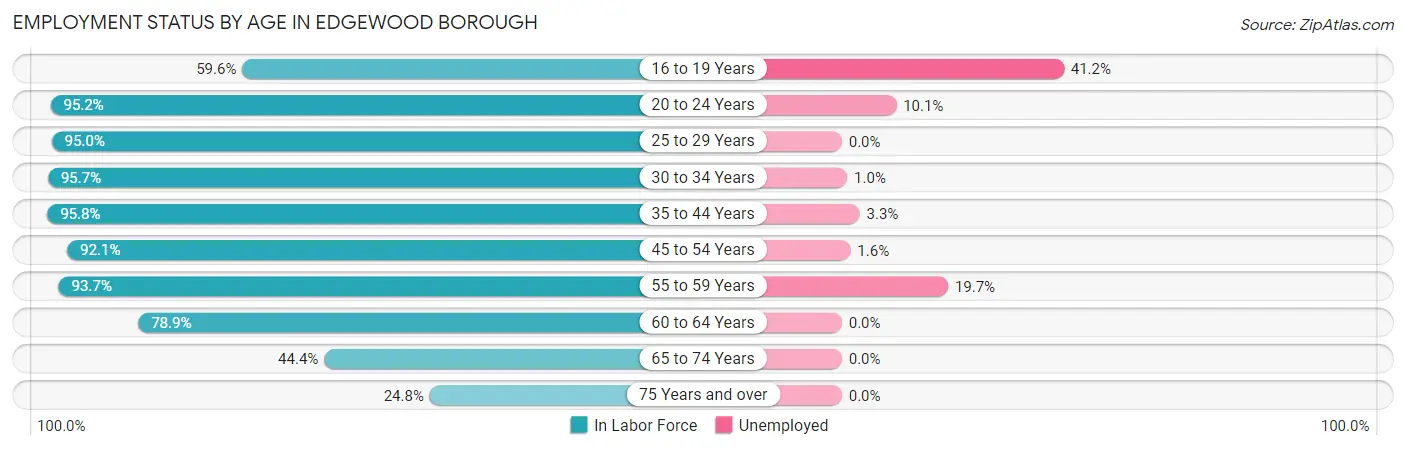
| Age Bracket | In Labor Force | Unemployed |
| 16 to 19 Years | 34 (59.6%) | 14 (41.2%) |
| 20 to 24 Years | 119 (95.2%) | 12 (10.1%) |
| 25 to 29 Years | 340 (95.0%) | 0 (0.0%) |
| 30 to 34 Years | 397 (95.7%) | 4 (1.0%) |
| 35 to 44 Years | 458 (95.8%) | 15 (3.3%) |
| 45 to 54 Years | 385 (92.1%) | 6 (1.6%) |
| 55 to 59 Years | 178 (93.7%) | 35 (19.7%) |
| 60 to 64 Years | 153 (78.9%) | 0 (0.0%) |
| 65 to 74 Years | 126 (44.4%) | 0 (0.0%) |
| 75 Years and over | 34 (24.8%) | 0 (0.0%) |
| Total | 2,223 (83.7%) | 87 (3.9%) |
Employment Status by Educational Attainment in Edgewood borough
According to labor force statistics for Edgewood borough, 93.1% of individuals (1,911) out of the total population between 25 and 64 years of age (2,053) are in the labor force, with 3.1% or 59 of them being unemployed. The group with the highest labor force participation rate are those with the educational attainment of bachelor's degree or higher, with 95.4% or 1,437 individuals in the labor force. Within the labor force, individuals with high school diploma education have the highest percentage of unemployment, with 12.8% or 12 of them being unemployed.
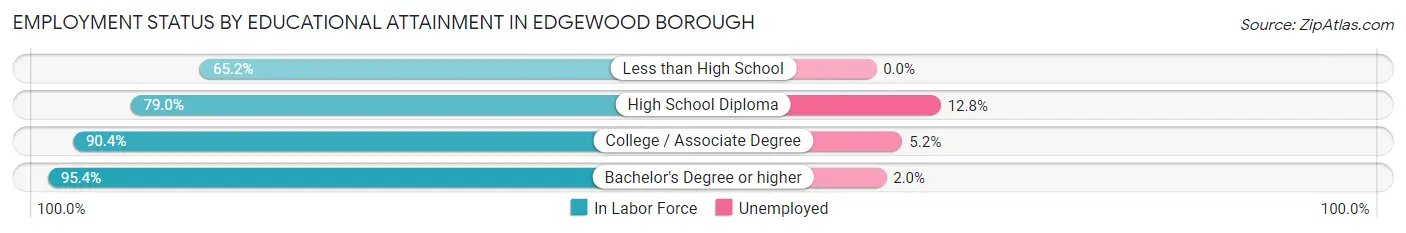
| Educational Attainment | In Labor Force | Unemployed |
| Less than High School | 15 (65.2%) | 0 (0.0%) |
| High School Diploma | 94 (79.0%) | 15 (12.8%) |
| College / Associate Degree | 366 (90.4%) | 21 (5.2%) |
| Bachelor's Degree or higher | 1,437 (95.4%) | 30 (2.0%) |
| Total | 1,911 (93.1%) | 64 (3.1%) |
Employment Occupations by Sex in Edgewood borough
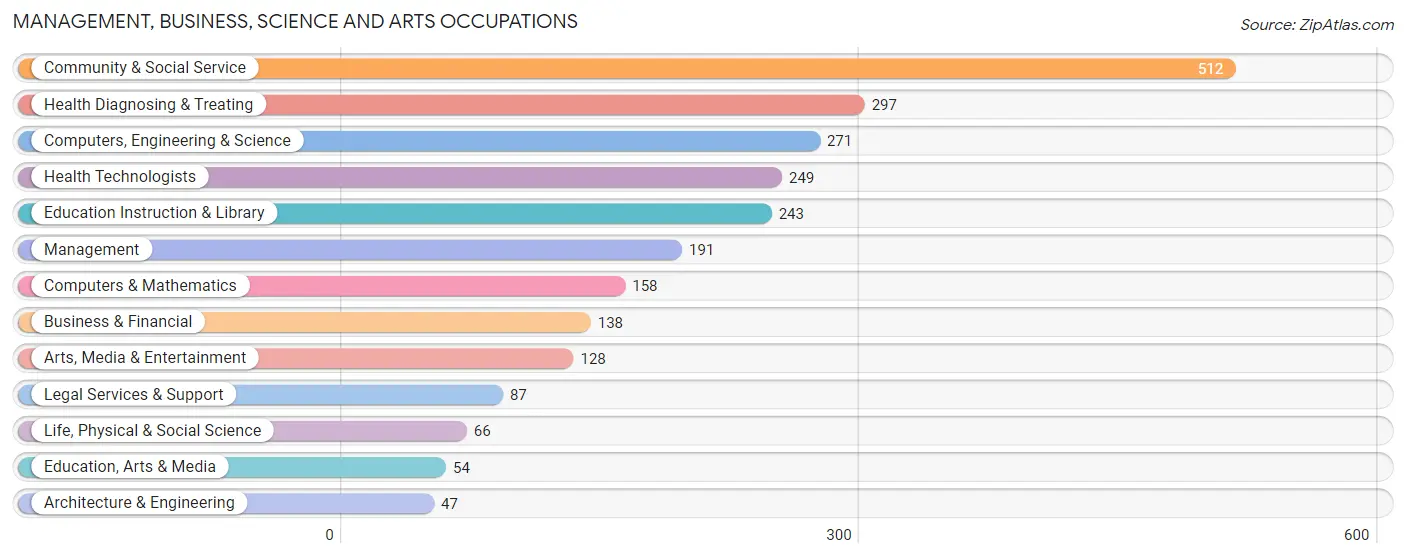
Management, Business, Science and Arts Occupations
The most common Management, Business, Science and Arts occupations in Edgewood borough are Community & Social Service (512 | 23.9%), Health Diagnosing & Treating (297 | 13.9%), Computers, Engineering & Science (271 | 12.7%), Health Technologists (249 | 11.7%), and Education Instruction & Library (243 | 11.4%).
Management, Business, Science and Arts Occupations by Sex
Within the Management, Business, Science and Arts occupations in Edgewood borough, the most male-oriented occupations are Computers & Mathematics (82.9%), Computers, Engineering & Science (73.1%), and Architecture & Engineering (72.3%), while the most female-oriented occupations are Health Diagnosing & Treating (77.8%), Health Technologists (73.5%), and Education Instruction & Library (65.8%).
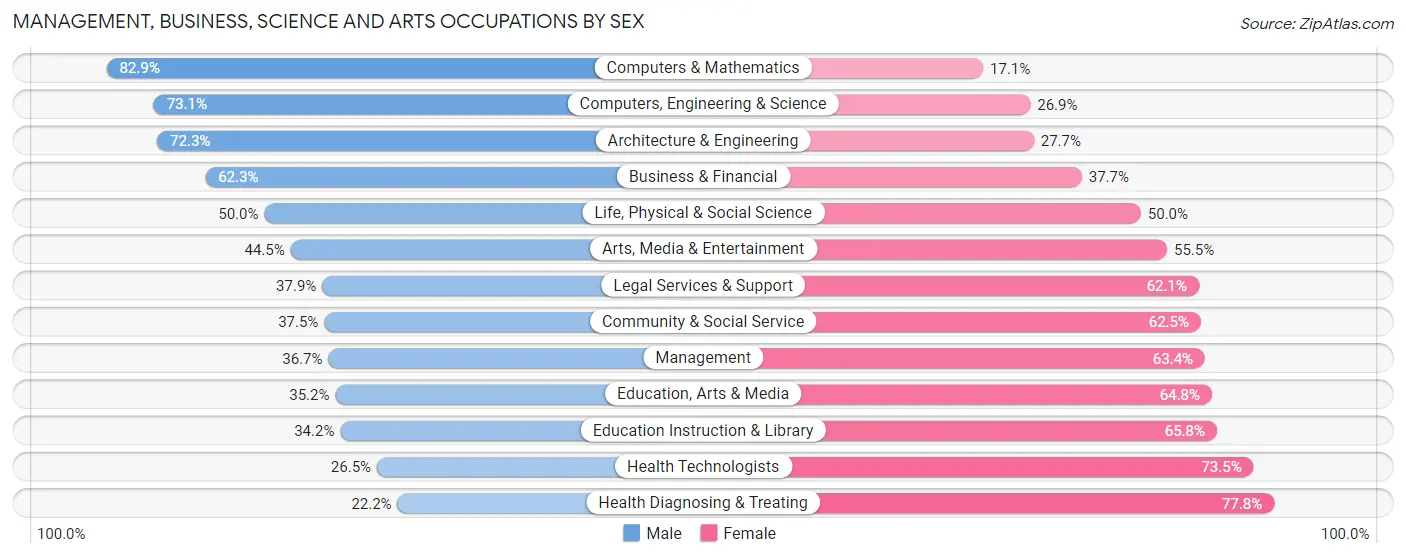
| Occupation | Male | Female |
| Management | 70 (36.6%) | 121 (63.3%) |
| Business & Financial | 86 (62.3%) | 52 (37.7%) |
| Computers, Engineering & Science | 198 (73.1%) | 73 (26.9%) |
| Computers & Mathematics | 131 (82.9%) | 27 (17.1%) |
| Architecture & Engineering | 34 (72.3%) | 13 (27.7%) |
| Life, Physical & Social Science | 33 (50.0%) | 33 (50.0%) |
| Community & Social Service | 192 (37.5%) | 320 (62.5%) |
| Education, Arts & Media | 19 (35.2%) | 35 (64.8%) |
| Legal Services & Support | 33 (37.9%) | 54 (62.1%) |
| Education Instruction & Library | 83 (34.2%) | 160 (65.8%) |
| Arts, Media & Entertainment | 57 (44.5%) | 71 (55.5%) |
| Health Diagnosing & Treating | 66 (22.2%) | 231 (77.8%) |
| Health Technologists | 66 (26.5%) | 183 (73.5%) |
| Total (Category) | 612 (43.4%) | 797 (56.6%) |
| Total (Overall) | 942 (44.1%) | 1,196 (55.9%) |
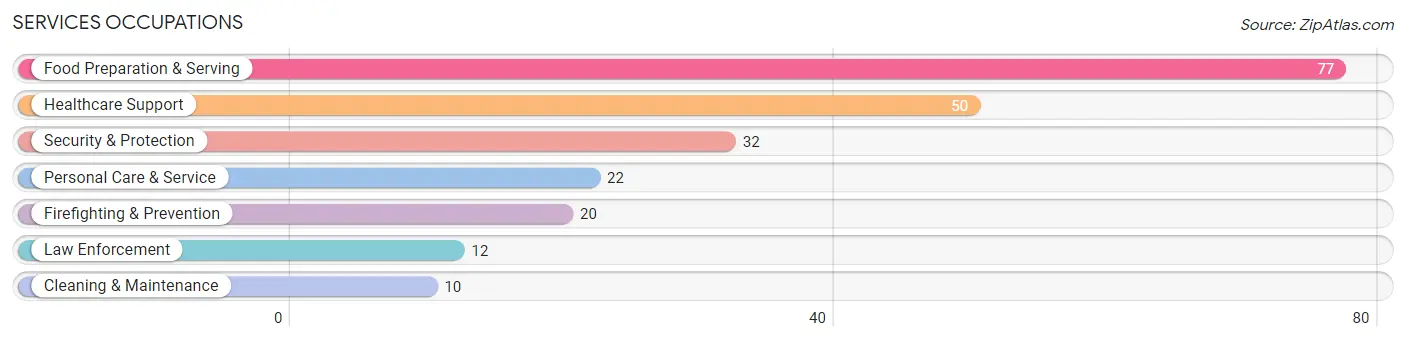
Services Occupations
The most common Services occupations in Edgewood borough are Food Preparation & Serving (77 | 3.6%), Healthcare Support (50 | 2.3%), Security & Protection (32 | 1.5%), Personal Care & Service (22 | 1.0%), and Firefighting & Prevention (20 | 0.9%).
Services Occupations by Sex
Within the Services occupations in Edgewood borough, the most male-oriented occupations are Law Enforcement (75.0%), Food Preparation & Serving (39.0%), and Security & Protection (28.1%), while the most female-oriented occupations are Healthcare Support (100.0%), Firefighting & Prevention (100.0%), and Cleaning & Maintenance (100.0%).
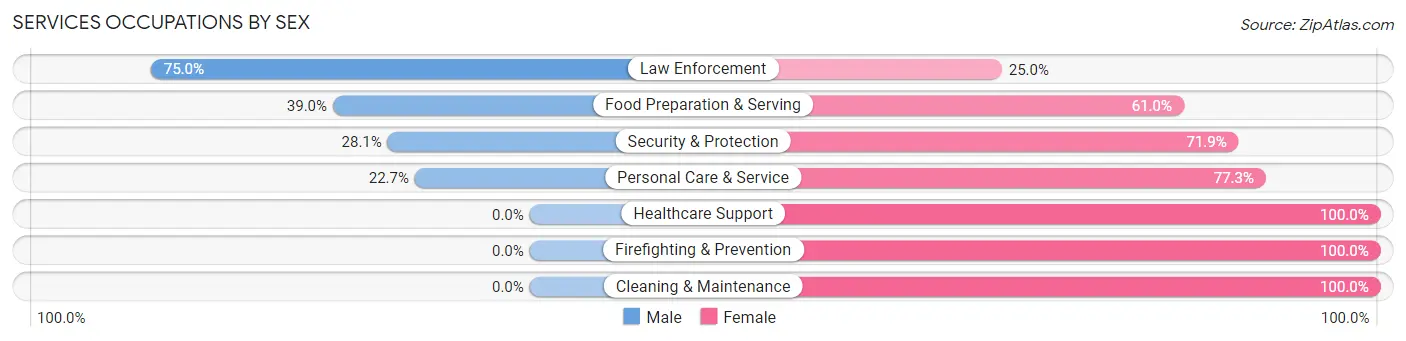
| Occupation | Male | Female |
| Healthcare Support | 0 (0.0%) | 50 (100.0%) |
| Security & Protection | 9 (28.1%) | 23 (71.9%) |
| Firefighting & Prevention | 0 (0.0%) | 20 (100.0%) |
| Law Enforcement | 9 (75.0%) | 3 (25.0%) |
| Food Preparation & Serving | 30 (39.0%) | 47 (61.0%) |
| Cleaning & Maintenance | 0 (0.0%) | 10 (100.0%) |
| Personal Care & Service | 5 (22.7%) | 17 (77.3%) |
| Total (Category) | 44 (23.0%) | 147 (77.0%) |
| Total (Overall) | 942 (44.1%) | 1,196 (55.9%) |
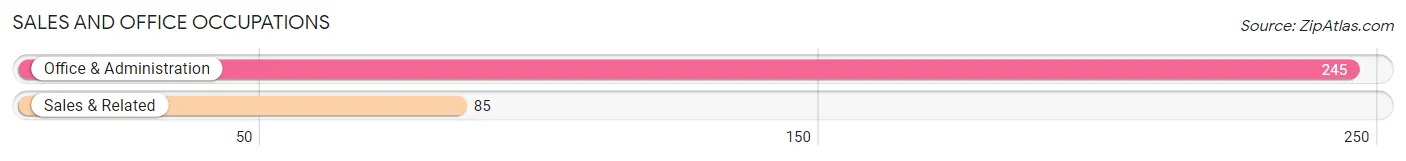
Sales and Office Occupations
The most common Sales and Office occupations in Edgewood borough are Office & Administration (245 | 11.5%), and Sales & Related (85 | 4.0%).
Sales and Office Occupations by Sex
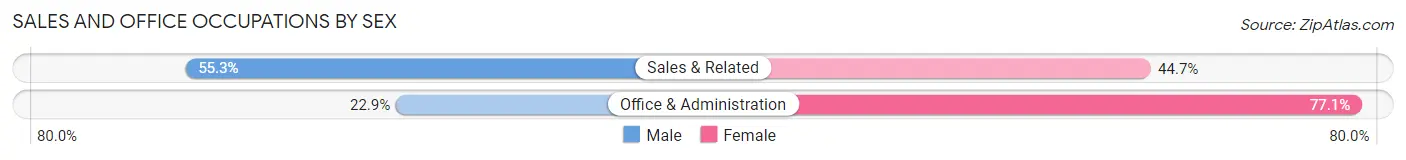
| Occupation | Male | Female |
| Sales & Related | 47 (55.3%) | 38 (44.7%) |
| Office & Administration | 56 (22.9%) | 189 (77.1%) |
| Total (Category) | 103 (31.2%) | 227 (68.8%) |
| Total (Overall) | 942 (44.1%) | 1,196 (55.9%) |
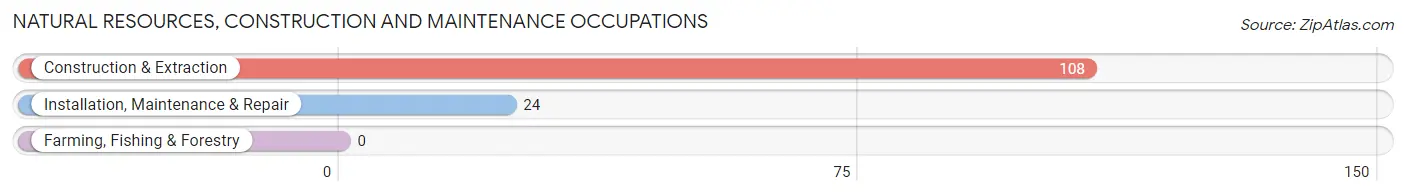
Natural Resources, Construction and Maintenance Occupations
The most common Natural Resources, Construction and Maintenance occupations in Edgewood borough are Construction & Extraction (108 | 5.1%), and Installation, Maintenance & Repair (24 | 1.1%).
Natural Resources, Construction and Maintenance Occupations by Sex
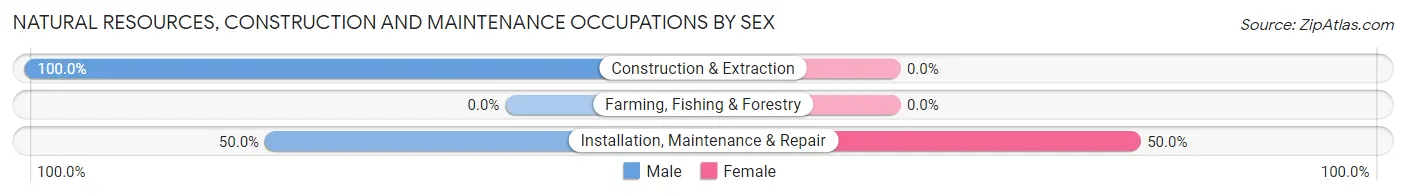
| Occupation | Male | Female |
| Farming, Fishing & Forestry | 0 (0.0%) | 0 (0.0%) |
| Construction & Extraction | 108 (100.0%) | 0 (0.0%) |
| Installation, Maintenance & Repair | 12 (50.0%) | 12 (50.0%) |
| Total (Category) | 120 (90.9%) | 12 (9.1%) |
| Total (Overall) | 942 (44.1%) | 1,196 (55.9%) |
Production, Transportation and Moving Occupations
The most common Production, Transportation and Moving occupations in Edgewood borough are Production (39 | 1.8%), Material Moving (21 | 1.0%), and Transportation (16 | 0.7%).
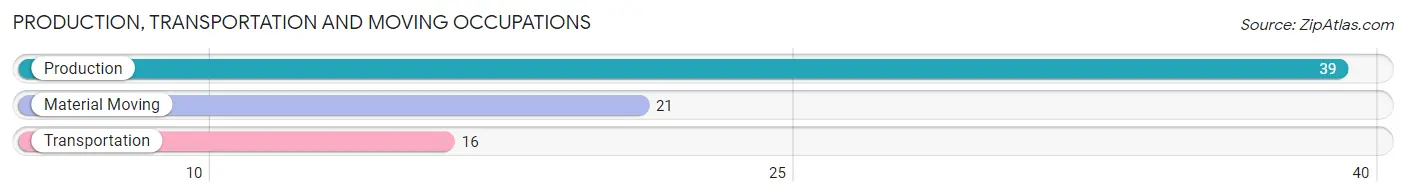
Production, Transportation and Moving Occupations by Sex
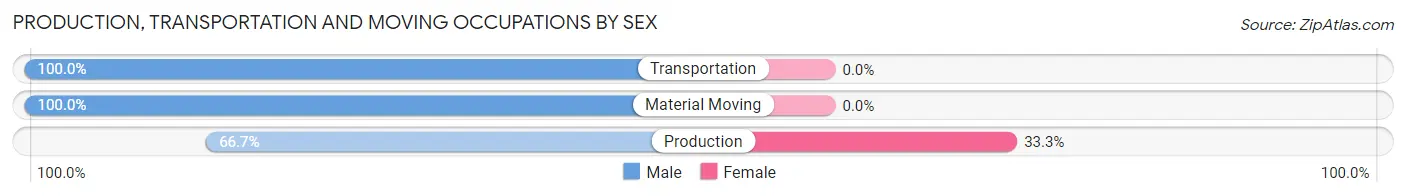
| Occupation | Male | Female |
| Production | 26 (66.7%) | 13 (33.3%) |
| Transportation | 16 (100.0%) | 0 (0.0%) |
| Material Moving | 21 (100.0%) | 0 (0.0%) |
| Total (Category) | 63 (82.9%) | 13 (17.1%) |
| Total (Overall) | 942 (44.1%) | 1,196 (55.9%) |
Employment Industries by Sex in Edgewood borough
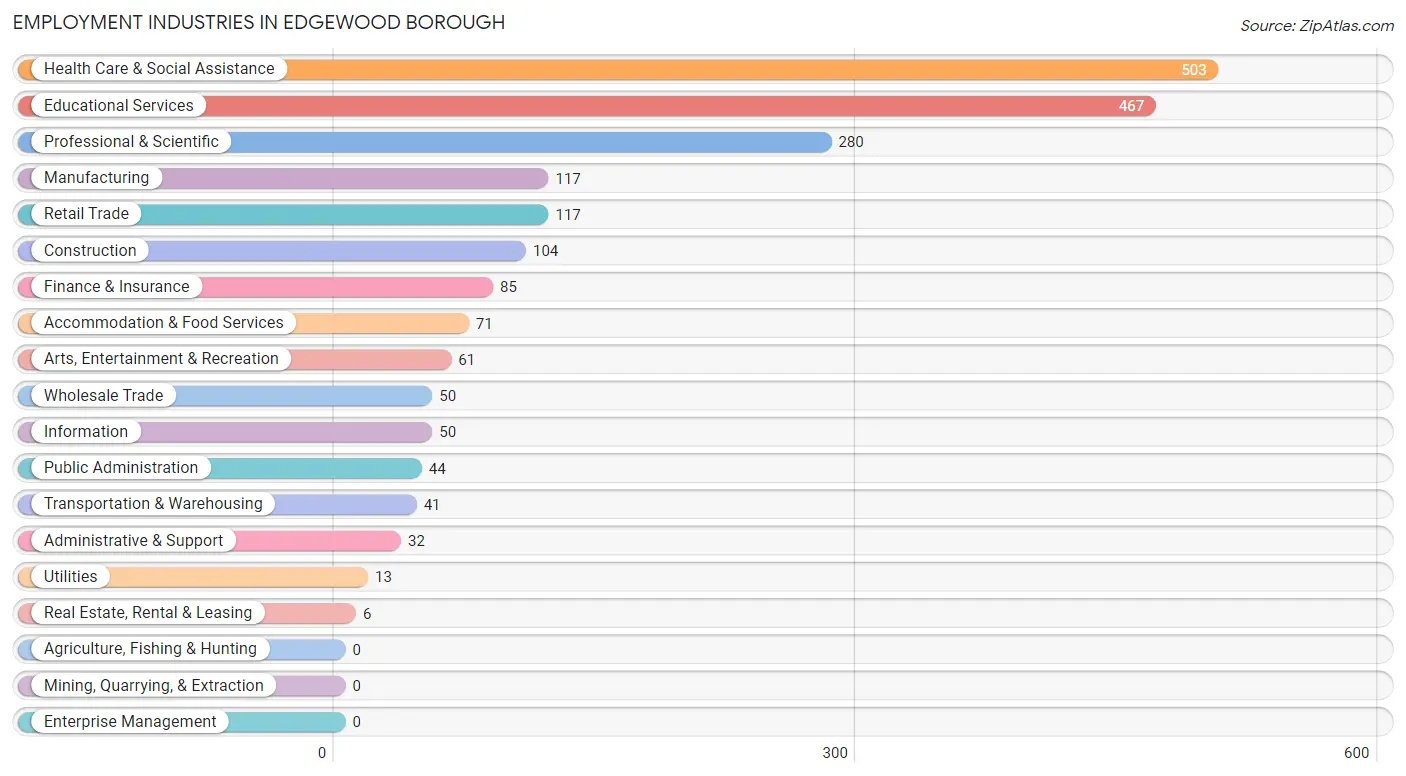
Employment Industries in Edgewood borough
The major employment industries in Edgewood borough include Health Care & Social Assistance (503 | 23.5%), Educational Services (467 | 21.8%), Professional & Scientific (280 | 13.1%), Manufacturing (117 | 5.5%), and Retail Trade (117 | 5.5%).
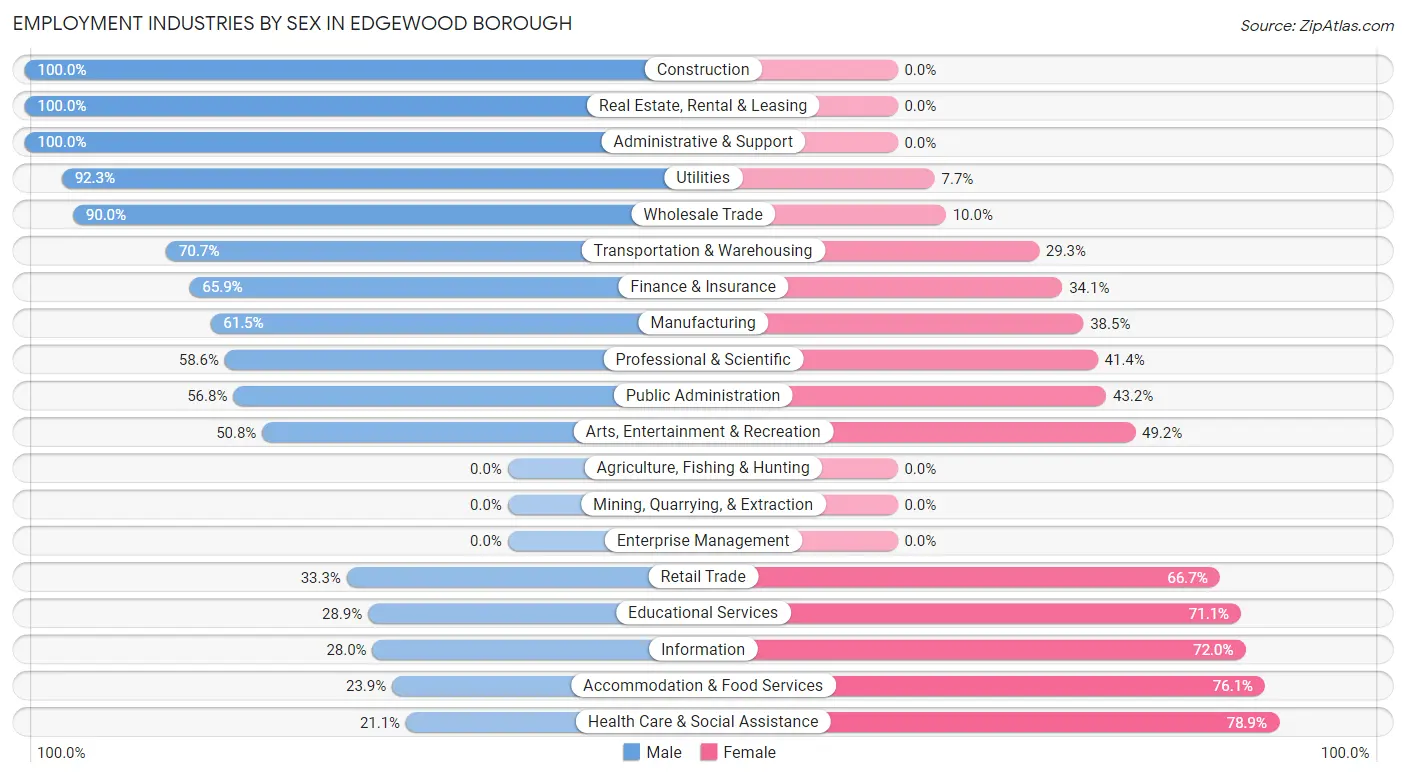
Employment Industries by Sex in Edgewood borough
The Edgewood borough industries that see more men than women are Construction (100.0%), Real Estate, Rental & Leasing (100.0%), and Administrative & Support (100.0%), whereas the industries that tend to have a higher number of women are Health Care & Social Assistance (78.9%), Accommodation & Food Services (76.1%), and Information (72.0%).
| Industry | Male | Female |
| Agriculture, Fishing & Hunting | 0 (0.0%) | 0 (0.0%) |
| Mining, Quarrying, & Extraction | 0 (0.0%) | 0 (0.0%) |
| Construction | 104 (100.0%) | 0 (0.0%) |
| Manufacturing | 72 (61.5%) | 45 (38.5%) |
| Wholesale Trade | 45 (90.0%) | 5 (10.0%) |
| Retail Trade | 39 (33.3%) | 78 (66.7%) |
| Transportation & Warehousing | 29 (70.7%) | 12 (29.3%) |
| Utilities | 12 (92.3%) | 1 (7.7%) |
| Information | 14 (28.0%) | 36 (72.0%) |
| Finance & Insurance | 56 (65.9%) | 29 (34.1%) |
| Real Estate, Rental & Leasing | 6 (100.0%) | 0 (0.0%) |
| Professional & Scientific | 164 (58.6%) | 116 (41.4%) |
| Enterprise Management | 0 (0.0%) | 0 (0.0%) |
| Administrative & Support | 32 (100.0%) | 0 (0.0%) |
| Educational Services | 135 (28.9%) | 332 (71.1%) |
| Health Care & Social Assistance | 106 (21.1%) | 397 (78.9%) |
| Arts, Entertainment & Recreation | 31 (50.8%) | 30 (49.2%) |
| Accommodation & Food Services | 17 (23.9%) | 54 (76.1%) |
| Public Administration | 25 (56.8%) | 19 (43.2%) |
| Total | 942 (44.1%) | 1,196 (55.9%) |
Education in Edgewood borough
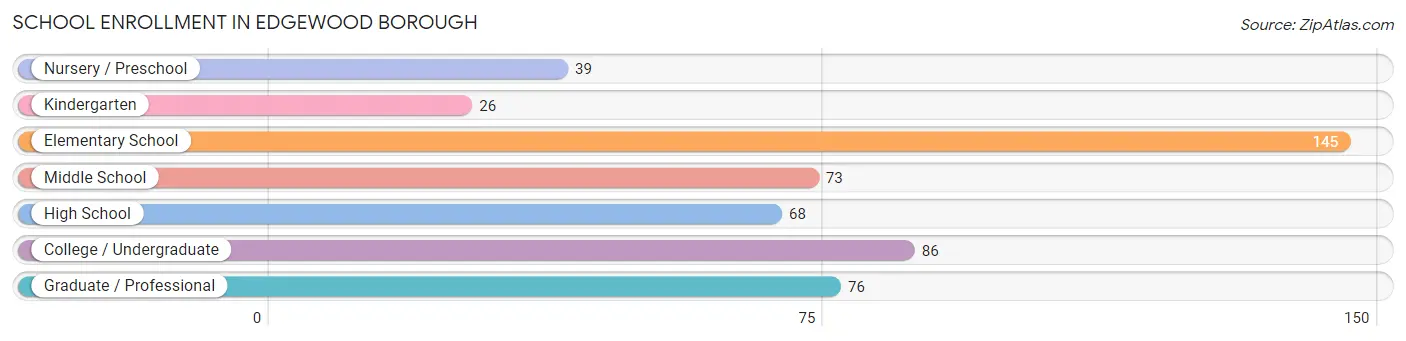
School Enrollment in Edgewood borough
The most common levels of schooling among the 513 students in Edgewood borough are elementary school (145 | 28.3%), college / undergraduate (86 | 16.8%), and graduate / professional (76 | 14.8%).
| School Level | # Students | % Students |
| Nursery / Preschool | 39 | 7.6% |
| Kindergarten | 26 | 5.1% |
| Elementary School | 145 | 28.3% |
| Middle School | 73 | 14.2% |
| High School | 68 | 13.3% |
| College / Undergraduate | 86 | 16.8% |
| Graduate / Professional | 76 | 14.8% |
| Total | 513 | 100.0% |
School Enrollment by Age by Funding Source in Edgewood borough
Out of a total of 513 students who are enrolled in schools in Edgewood borough, 248 (48.3%) attend a private institution, while the remaining 265 (51.7%) are enrolled in public schools. The age group of 18 to 19 year olds has the highest likelihood of being enrolled in private schools, with 6 (100.0% in the age bracket) enrolled. Conversely, the age group of 35 years and over has the lowest likelihood of being enrolled in a private school, with 26 (65.0% in the age bracket) attending a public institution.
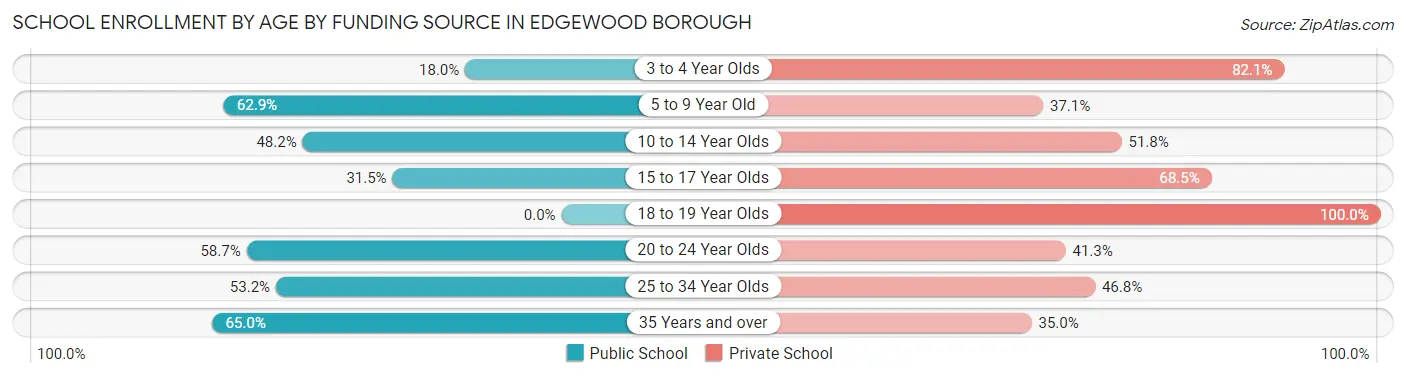
| Age Bracket | Public School | Private School |
| 3 to 4 Year Olds | 7 (17.9%) | 32 (82.1%) |
| 5 to 9 Year Old | 105 (62.9%) | 62 (37.1%) |
| 10 to 14 Year Olds | 41 (48.2%) | 44 (51.8%) |
| 15 to 17 Year Olds | 17 (31.5%) | 37 (68.5%) |
| 18 to 19 Year Olds | 0 (0.0%) | 6 (100.0%) |
| 20 to 24 Year Olds | 44 (58.7%) | 31 (41.3%) |
| 25 to 34 Year Olds | 25 (53.2%) | 22 (46.8%) |
| 35 Years and over | 26 (65.0%) | 14 (35.0%) |
| Total | 265 (51.7%) | 248 (48.3%) |
Educational Attainment by Field of Study in Edgewood borough
Business (188 | 9.3%), literature & languages (181 | 9.0%), bio, nature & agricultural (176 | 8.7%), social sciences (175 | 8.7%), and liberal arts & history (167 | 8.3%) are the most common fields of study among 2,012 individuals in Edgewood borough who have obtained a bachelor's degree or higher.
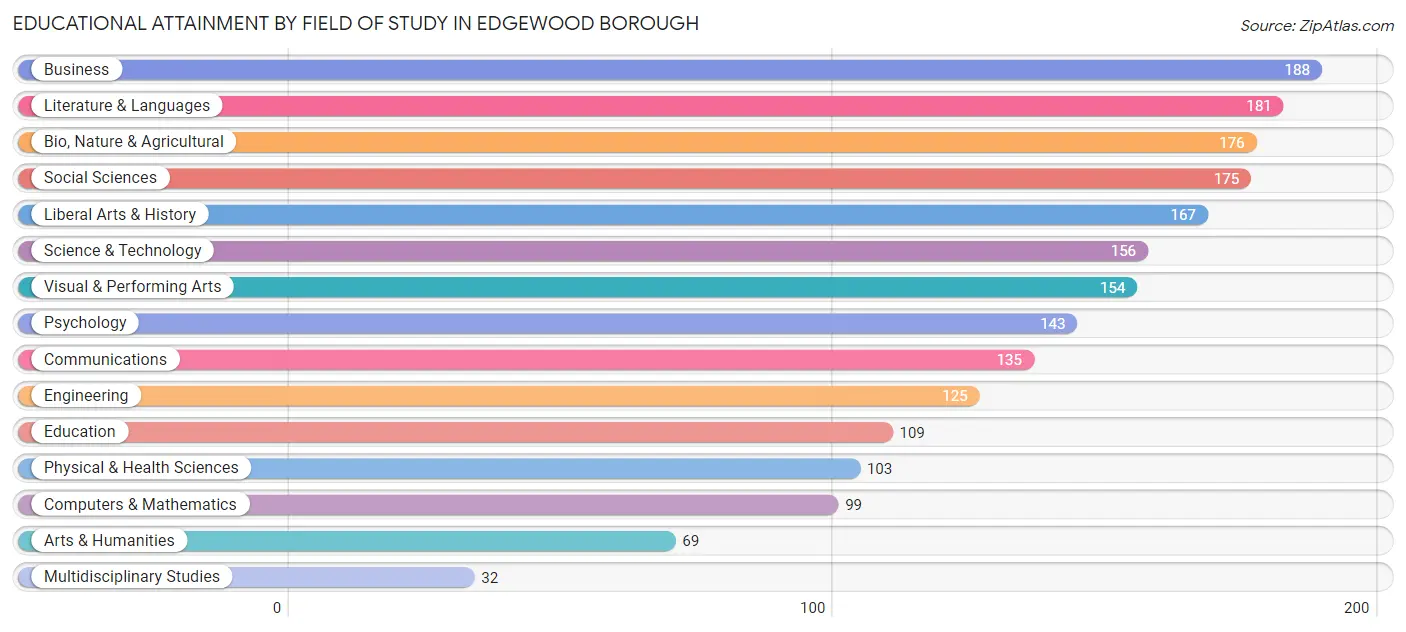
| Field of Study | # Graduates | % Graduates |
| Computers & Mathematics | 99 | 4.9% |
| Bio, Nature & Agricultural | 176 | 8.7% |
| Physical & Health Sciences | 103 | 5.1% |
| Psychology | 143 | 7.1% |
| Social Sciences | 175 | 8.7% |
| Engineering | 125 | 6.2% |
| Multidisciplinary Studies | 32 | 1.6% |
| Science & Technology | 156 | 7.7% |
| Business | 188 | 9.3% |
| Education | 109 | 5.4% |
| Literature & Languages | 181 | 9.0% |
| Liberal Arts & History | 167 | 8.3% |
| Visual & Performing Arts | 154 | 7.6% |
| Communications | 135 | 6.7% |
| Arts & Humanities | 69 | 3.4% |
| Total | 2,012 | 100.0% |
Transportation & Commute in Edgewood borough
Vehicle Availability by Sex in Edgewood borough
The most prevalent vehicle ownership categories in Edgewood borough are males with 2 vehicles (468, accounting for 49.9%) and females with 2 vehicles (485, making up 39.7%).
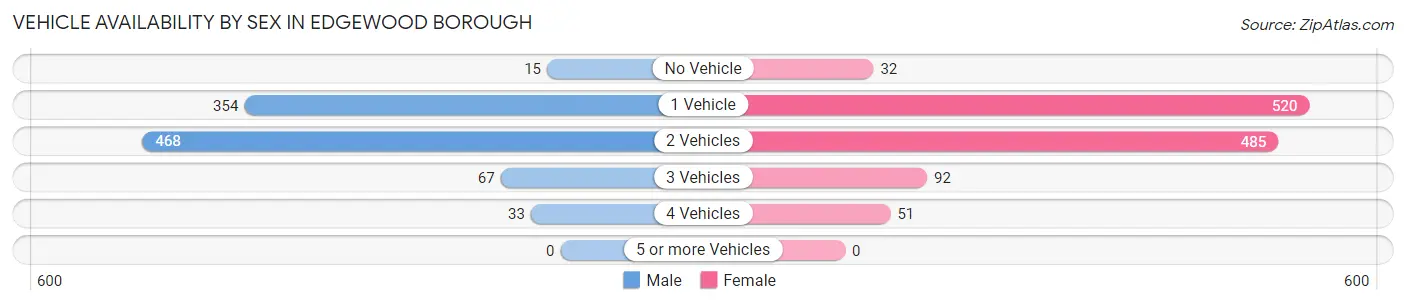
| Vehicles Available | Male | Female |
| No Vehicle | 15 (1.6%) | 32 (2.7%) |
| 1 Vehicle | 354 (37.8%) | 520 (44.1%) |
| 2 Vehicles | 468 (49.9%) | 485 (41.1%) |
| 3 Vehicles | 67 (7.1%) | 92 (7.8%) |
| 4 Vehicles | 33 (3.5%) | 51 (4.3%) |
| 5 or more Vehicles | 0 (0.0%) | 0 (0.0%) |
| Total | 937 (100.0%) | 1,180 (100.0%) |
Commute Time in Edgewood borough
The most frequently occuring commute durations in Edgewood borough are 30 to 34 minutes (335 commuters, 21.6%), 20 to 24 minutes (263 commuters, 16.9%), and 15 to 19 minutes (219 commuters, 14.1%).
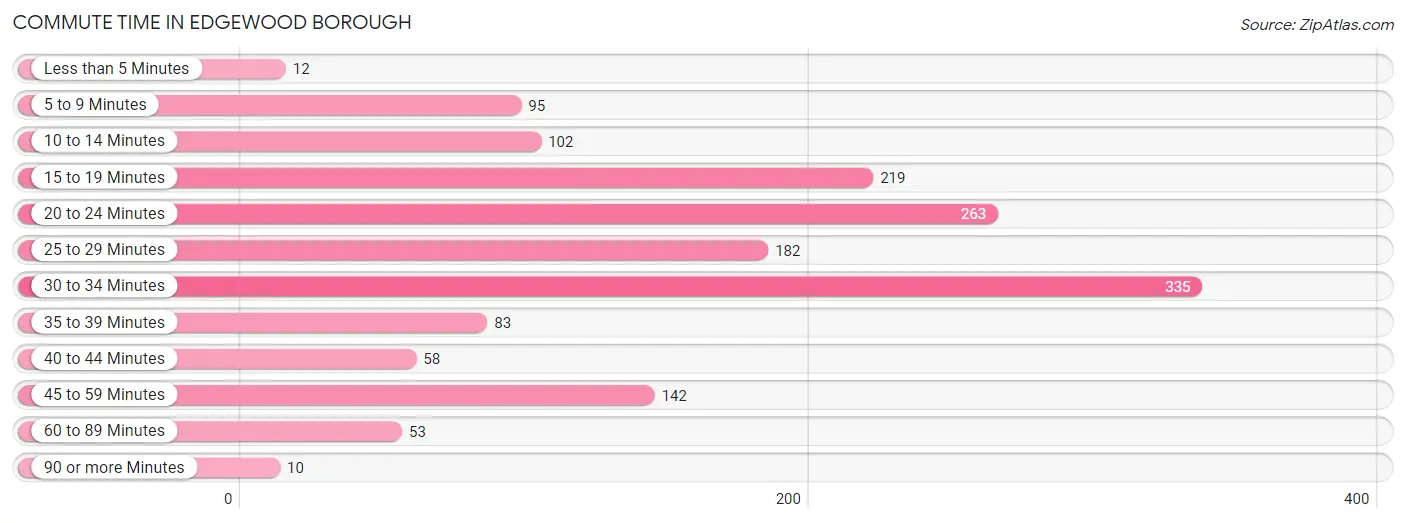
| Commute Time | # Commuters | % Commuters |
| Less than 5 Minutes | 12 | 0.8% |
| 5 to 9 Minutes | 95 | 6.1% |
| 10 to 14 Minutes | 102 | 6.6% |
| 15 to 19 Minutes | 219 | 14.1% |
| 20 to 24 Minutes | 263 | 16.9% |
| 25 to 29 Minutes | 182 | 11.7% |
| 30 to 34 Minutes | 335 | 21.6% |
| 35 to 39 Minutes | 83 | 5.3% |
| 40 to 44 Minutes | 58 | 3.7% |
| 45 to 59 Minutes | 142 | 9.1% |
| 60 to 89 Minutes | 53 | 3.4% |
| 90 or more Minutes | 10 | 0.6% |
Commute Time by Sex in Edgewood borough
The most common commute times in Edgewood borough are 30 to 34 minutes (194 commuters, 27.1%) for males and 20 to 24 minutes (176 commuters, 21.0%) for females.
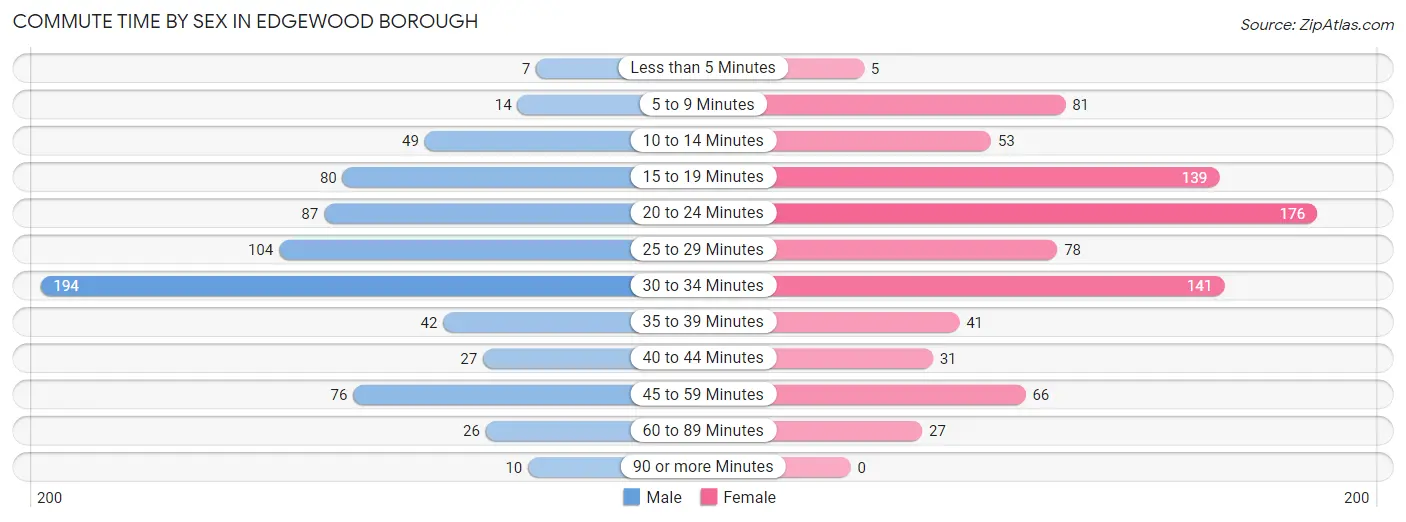
| Commute Time | Male | Female |
| Less than 5 Minutes | 7 (1.0%) | 5 (0.6%) |
| 5 to 9 Minutes | 14 (2.0%) | 81 (9.7%) |
| 10 to 14 Minutes | 49 (6.8%) | 53 (6.3%) |
| 15 to 19 Minutes | 80 (11.2%) | 139 (16.6%) |
| 20 to 24 Minutes | 87 (12.1%) | 176 (21.0%) |
| 25 to 29 Minutes | 104 (14.5%) | 78 (9.3%) |
| 30 to 34 Minutes | 194 (27.1%) | 141 (16.8%) |
| 35 to 39 Minutes | 42 (5.9%) | 41 (4.9%) |
| 40 to 44 Minutes | 27 (3.8%) | 31 (3.7%) |
| 45 to 59 Minutes | 76 (10.6%) | 66 (7.9%) |
| 60 to 89 Minutes | 26 (3.6%) | 27 (3.2%) |
| 90 or more Minutes | 10 (1.4%) | 0 (0.0%) |
Time of Departure to Work by Sex in Edgewood borough
The most frequent times of departure to work in Edgewood borough are 7:00 AM to 7:29 AM (112, 15.6%) for males and 7:00 AM to 7:29 AM (145, 17.3%) for females.
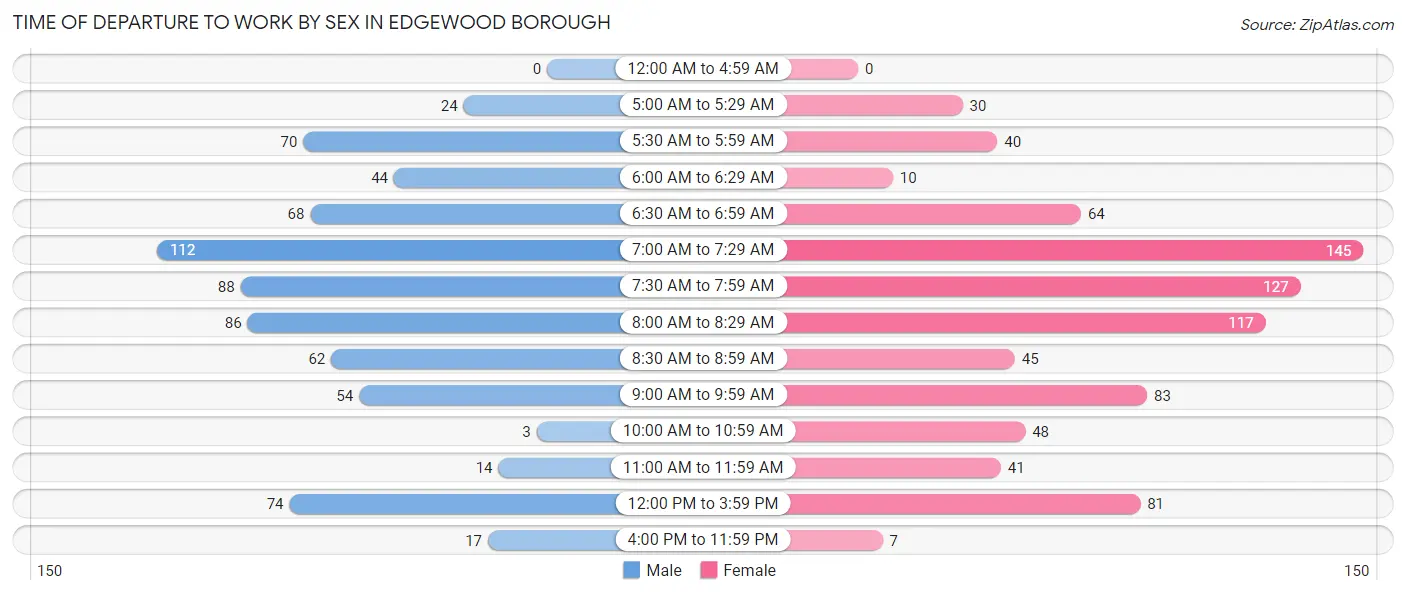
| Time of Departure | Male | Female |
| 12:00 AM to 4:59 AM | 0 (0.0%) | 0 (0.0%) |
| 5:00 AM to 5:29 AM | 24 (3.4%) | 30 (3.6%) |
| 5:30 AM to 5:59 AM | 70 (9.8%) | 40 (4.8%) |
| 6:00 AM to 6:29 AM | 44 (6.1%) | 10 (1.2%) |
| 6:30 AM to 6:59 AM | 68 (9.5%) | 64 (7.6%) |
| 7:00 AM to 7:29 AM | 112 (15.6%) | 145 (17.3%) |
| 7:30 AM to 7:59 AM | 88 (12.3%) | 127 (15.2%) |
| 8:00 AM to 8:29 AM | 86 (12.0%) | 117 (14.0%) |
| 8:30 AM to 8:59 AM | 62 (8.7%) | 45 (5.4%) |
| 9:00 AM to 9:59 AM | 54 (7.5%) | 83 (9.9%) |
| 10:00 AM to 10:59 AM | 3 (0.4%) | 48 (5.7%) |
| 11:00 AM to 11:59 AM | 14 (2.0%) | 41 (4.9%) |
| 12:00 PM to 3:59 PM | 74 (10.3%) | 81 (9.7%) |
| 4:00 PM to 11:59 PM | 17 (2.4%) | 7 (0.8%) |
| Total | 716 (100.0%) | 838 (100.0%) |
Housing Occupancy in Edgewood borough
Occupancy by Ownership in Edgewood borough
Of the total 1,559 dwellings in Edgewood borough, owner-occupied units account for 973 (62.4%), while renter-occupied units make up 586 (37.6%).
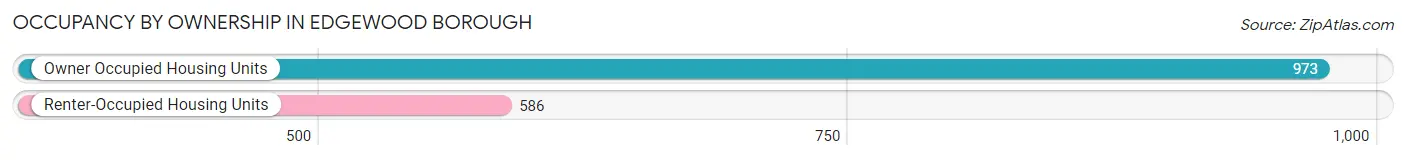
| Occupancy | # Housing Units | % Housing Units |
| Owner Occupied Housing Units | 973 | 62.4% |
| Renter-Occupied Housing Units | 586 | 37.6% |
| Total Occupied Housing Units | 1,559 | 100.0% |
Occupancy by Household Size in Edgewood borough
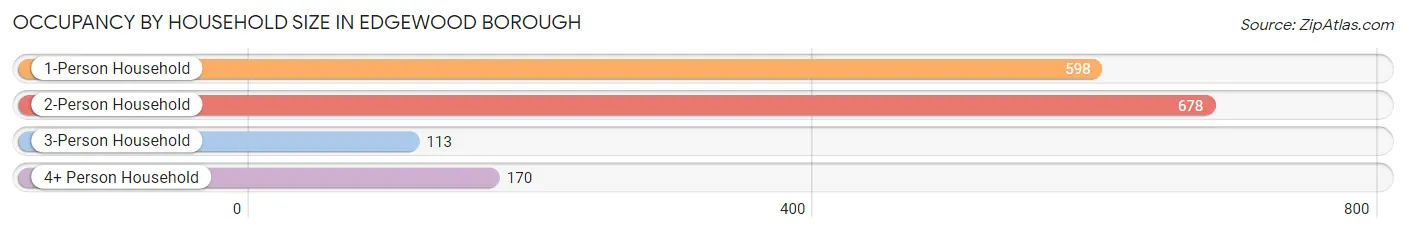
| Household Size | # Housing Units | % Housing Units |
| 1-Person Household | 598 | 38.4% |
| 2-Person Household | 678 | 43.5% |
| 3-Person Household | 113 | 7.2% |
| 4+ Person Household | 170 | 10.9% |
| Total Housing Units | 1,559 | 100.0% |
Occupancy by Ownership by Household Size in Edgewood borough
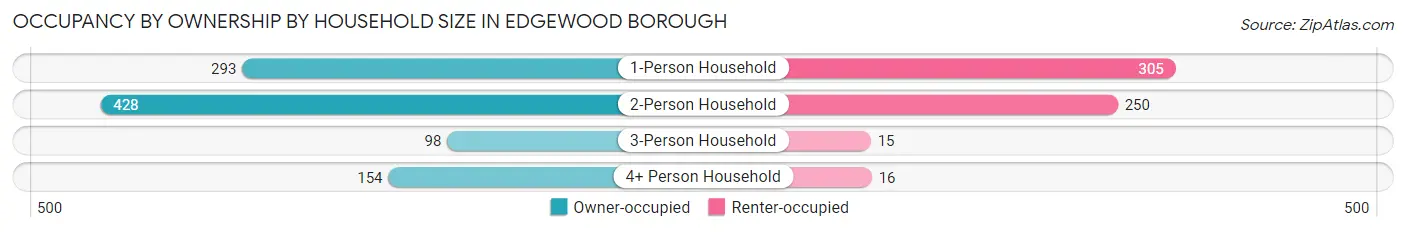
| Household Size | Owner-occupied | Renter-occupied |
| 1-Person Household | 293 (49.0%) | 305 (51.0%) |
| 2-Person Household | 428 (63.1%) | 250 (36.9%) |
| 3-Person Household | 98 (86.7%) | 15 (13.3%) |
| 4+ Person Household | 154 (90.6%) | 16 (9.4%) |
| Total Housing Units | 973 (62.4%) | 586 (37.6%) |
Occupancy by Educational Attainment in Edgewood borough
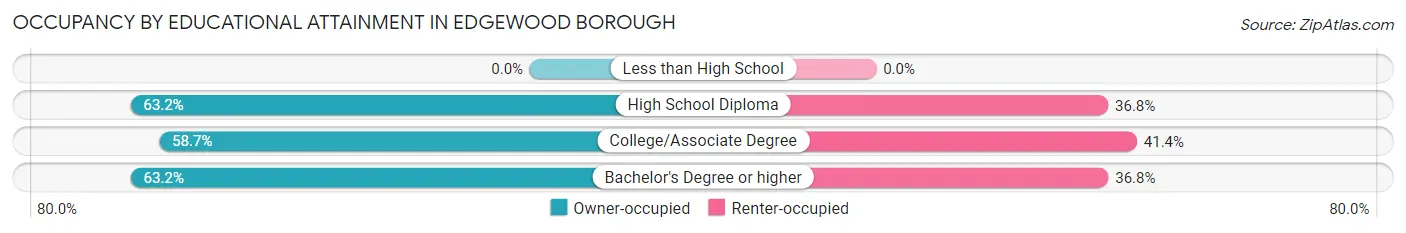
| Household Size | Owner-occupied | Renter-occupied |
| Less than High School | 0 (0.0%) | 0 (0.0%) |
| High School Diploma | 67 (63.2%) | 39 (36.8%) |
| College/Associate Degree | 156 (58.7%) | 110 (41.3%) |
| Bachelor's Degree or higher | 750 (63.2%) | 437 (36.8%) |
Occupancy by Age of Householder in Edgewood borough
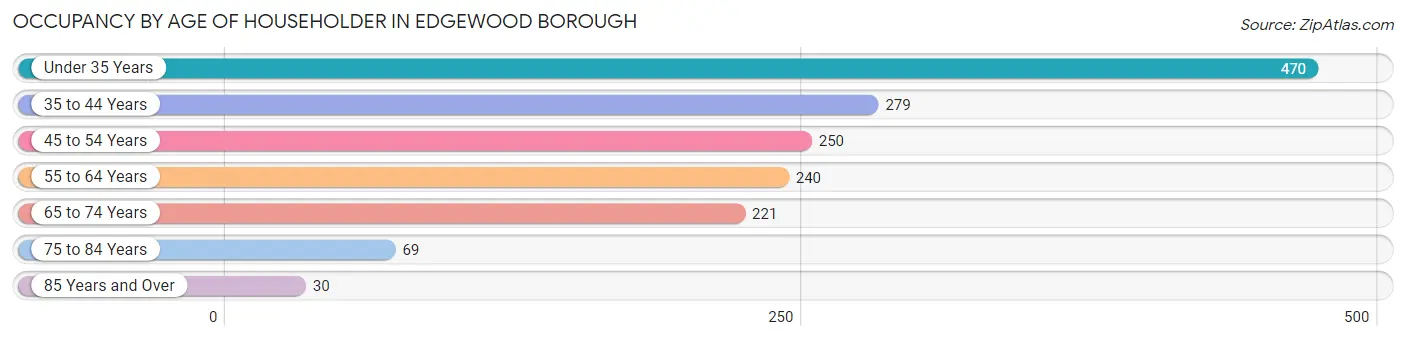
| Age Bracket | # Households | % Households |
| Under 35 Years | 470 | 30.1% |
| 35 to 44 Years | 279 | 17.9% |
| 45 to 54 Years | 250 | 16.0% |
| 55 to 64 Years | 240 | 15.4% |
| 65 to 74 Years | 221 | 14.2% |
| 75 to 84 Years | 69 | 4.4% |
| 85 Years and Over | 30 | 1.9% |
| Total | 1,559 | 100.0% |
Housing Finances in Edgewood borough
Median Income by Occupancy in Edgewood borough
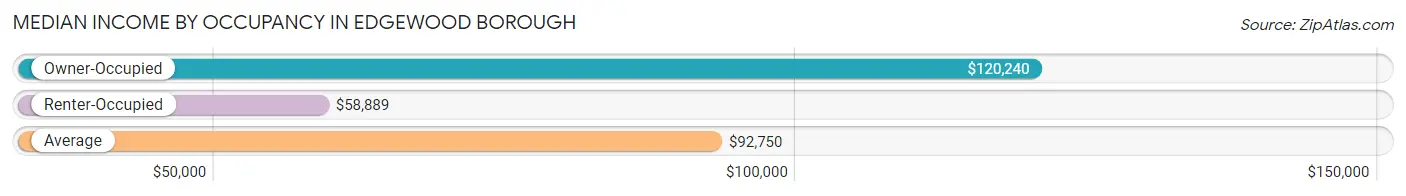
| Occupancy Type | # Households | Median Income |
| Owner-Occupied | 973 (62.4%) | $120,240 |
| Renter-Occupied | 586 (37.6%) | $58,889 |
| Average | 1,559 (100.0%) | $92,750 |
Occupancy by Householder Income Bracket in Edgewood borough
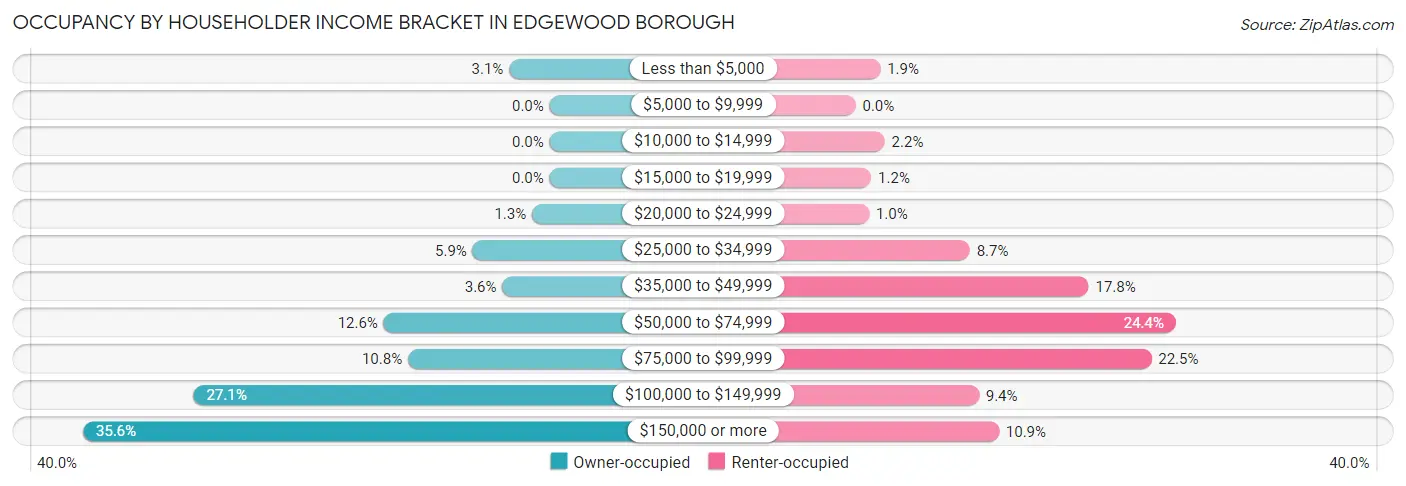
| Income Bracket | Owner-occupied | Renter-occupied |
| Less than $5,000 | 30 (3.1%) | 11 (1.9%) |
| $5,000 to $9,999 | 0 (0.0%) | 0 (0.0%) |
| $10,000 to $14,999 | 0 (0.0%) | 13 (2.2%) |
| $15,000 to $19,999 | 0 (0.0%) | 7 (1.2%) |
| $20,000 to $24,999 | 13 (1.3%) | 6 (1.0%) |
| $25,000 to $34,999 | 57 (5.9%) | 51 (8.7%) |
| $35,000 to $49,999 | 35 (3.6%) | 104 (17.7%) |
| $50,000 to $74,999 | 123 (12.6%) | 143 (24.4%) |
| $75,000 to $99,999 | 105 (10.8%) | 132 (22.5%) |
| $100,000 to $149,999 | 264 (27.1%) | 55 (9.4%) |
| $150,000 or more | 346 (35.6%) | 64 (10.9%) |
| Total | 973 (100.0%) | 586 (100.0%) |
Monthly Housing Cost Tiers in Edgewood borough
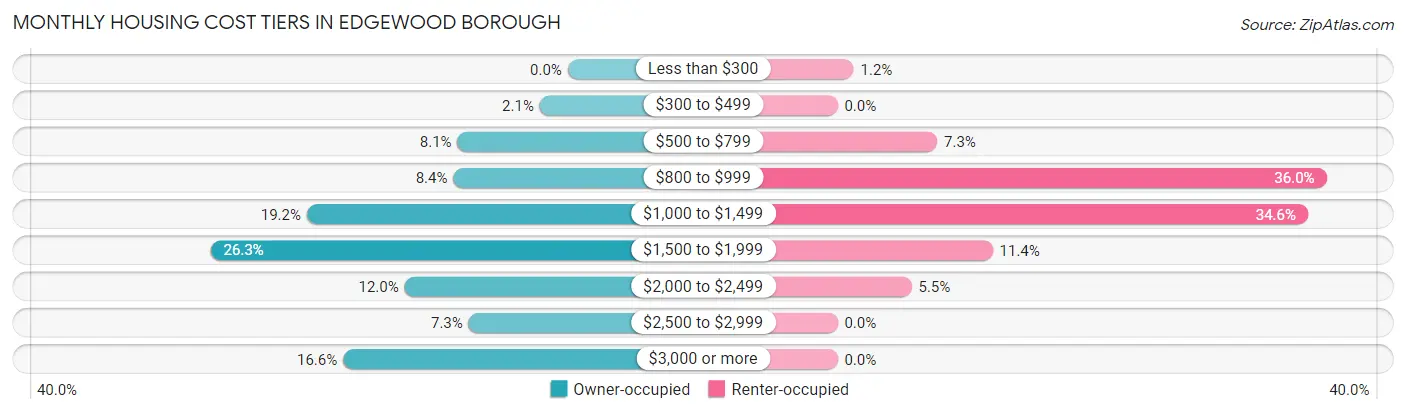
| Monthly Cost | Owner-occupied | Renter-occupied |
| Less than $300 | 0 (0.0%) | 7 (1.2%) |
| $300 to $499 | 20 (2.1%) | 0 (0.0%) |
| $500 to $799 | 79 (8.1%) | 43 (7.3%) |
| $800 to $999 | 82 (8.4%) | 211 (36.0%) |
| $1,000 to $1,499 | 187 (19.2%) | 203 (34.6%) |
| $1,500 to $1,999 | 256 (26.3%) | 67 (11.4%) |
| $2,000 to $2,499 | 117 (12.0%) | 32 (5.5%) |
| $2,500 to $2,999 | 71 (7.3%) | 0 (0.0%) |
| $3,000 or more | 161 (16.6%) | 0 (0.0%) |
| Total | 973 (100.0%) | 586 (100.0%) |
Physical Housing Characteristics in Edgewood borough
Housing Structures in Edgewood borough
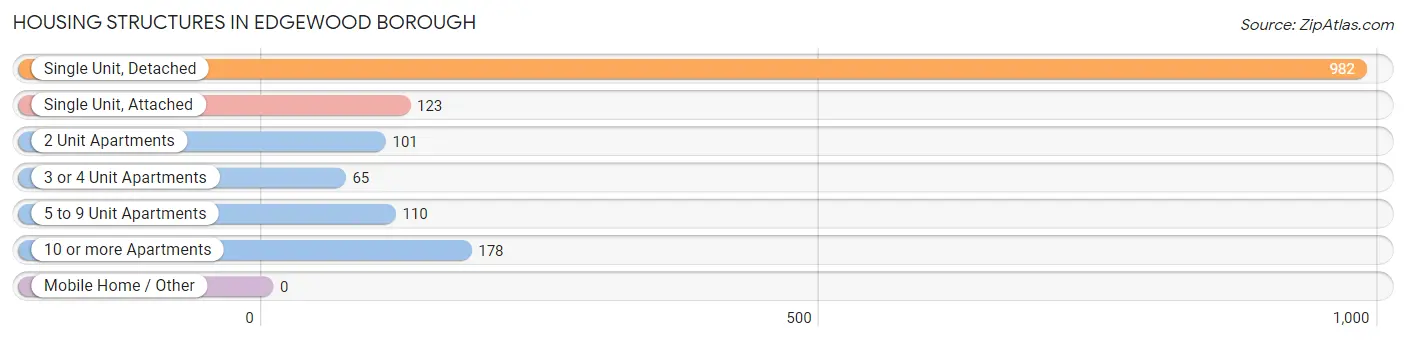
| Structure Type | # Housing Units | % Housing Units |
| Single Unit, Detached | 982 | 63.0% |
| Single Unit, Attached | 123 | 7.9% |
| 2 Unit Apartments | 101 | 6.5% |
| 3 or 4 Unit Apartments | 65 | 4.2% |
| 5 to 9 Unit Apartments | 110 | 7.1% |
| 10 or more Apartments | 178 | 11.4% |
| Mobile Home / Other | 0 | 0.0% |
| Total | 1,559 | 100.0% |
Housing Structures by Occupancy in Edgewood borough
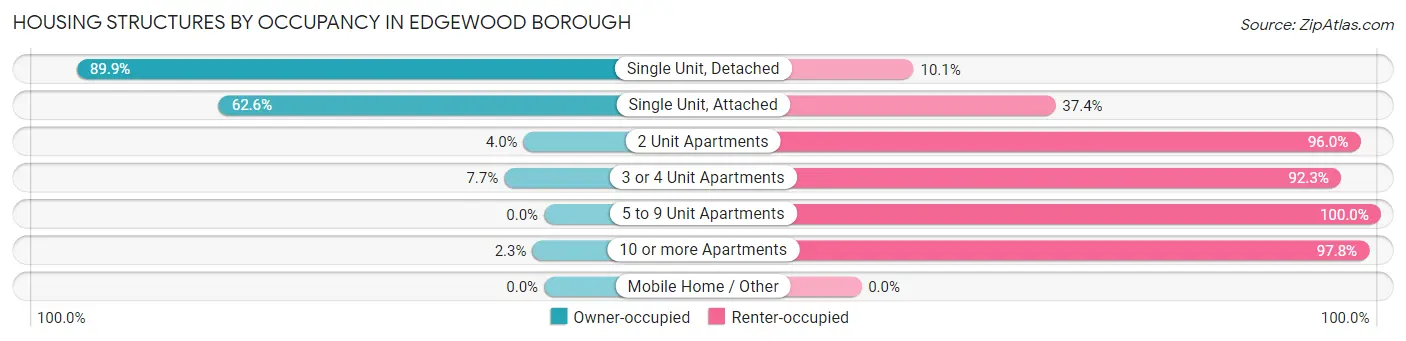
| Structure Type | Owner-occupied | Renter-occupied |
| Single Unit, Detached | 883 (89.9%) | 99 (10.1%) |
| Single Unit, Attached | 77 (62.6%) | 46 (37.4%) |
| 2 Unit Apartments | 4 (4.0%) | 97 (96.0%) |
| 3 or 4 Unit Apartments | 5 (7.7%) | 60 (92.3%) |
| 5 to 9 Unit Apartments | 0 (0.0%) | 110 (100.0%) |
| 10 or more Apartments | 4 (2.2%) | 174 (97.8%) |
| Mobile Home / Other | 0 (0.0%) | 0 (0.0%) |
| Total | 973 (62.4%) | 586 (37.6%) |
Housing Structures by Number of Rooms in Edgewood borough
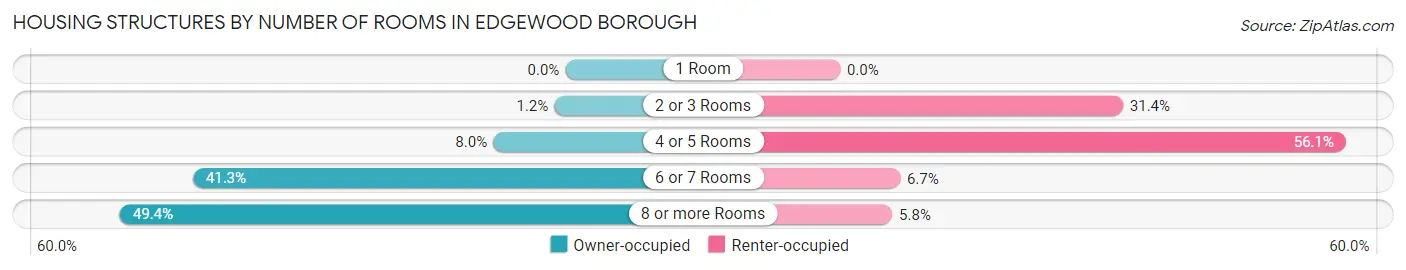
| Number of Rooms | Owner-occupied | Renter-occupied |
| 1 Room | 0 (0.0%) | 0 (0.0%) |
| 2 or 3 Rooms | 12 (1.2%) | 184 (31.4%) |
| 4 or 5 Rooms | 78 (8.0%) | 329 (56.1%) |
| 6 or 7 Rooms | 402 (41.3%) | 39 (6.7%) |
| 8 or more Rooms | 481 (49.4%) | 34 (5.8%) |
| Total | 973 (100.0%) | 586 (100.0%) |
Housing Structure by Heating Type in Edgewood borough
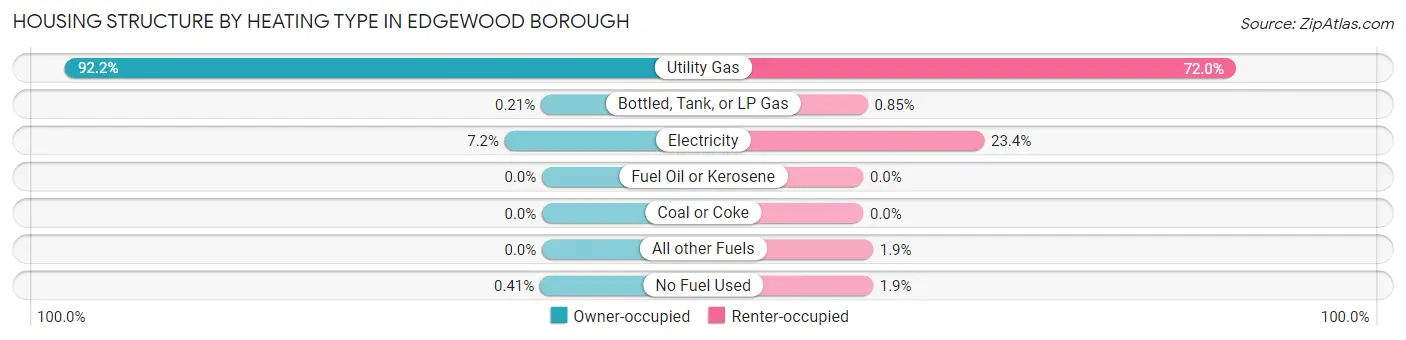
| Heating Type | Owner-occupied | Renter-occupied |
| Utility Gas | 897 (92.2%) | 422 (72.0%) |
| Bottled, Tank, or LP Gas | 2 (0.2%) | 5 (0.9%) |
| Electricity | 70 (7.2%) | 137 (23.4%) |
| Fuel Oil or Kerosene | 0 (0.0%) | 0 (0.0%) |
| Coal or Coke | 0 (0.0%) | 0 (0.0%) |
| All other Fuels | 0 (0.0%) | 11 (1.9%) |
| No Fuel Used | 4 (0.4%) | 11 (1.9%) |
| Total | 973 (100.0%) | 586 (100.0%) |
Household Vehicle Usage in Edgewood borough
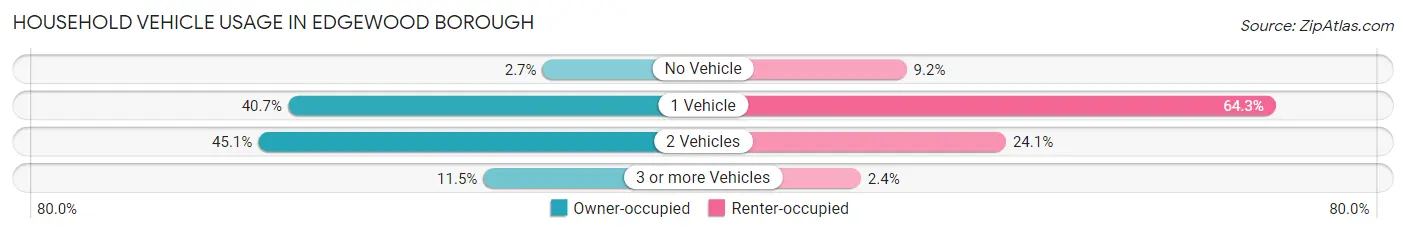
| Vehicles per Household | Owner-occupied | Renter-occupied |
| No Vehicle | 26 (2.7%) | 54 (9.2%) |
| 1 Vehicle | 396 (40.7%) | 377 (64.3%) |
| 2 Vehicles | 439 (45.1%) | 141 (24.1%) |
| 3 or more Vehicles | 112 (11.5%) | 14 (2.4%) |
| Total | 973 (100.0%) | 586 (100.0%) |
Real Estate & Mortgages in Edgewood borough
Real Estate and Mortgage Overview in Edgewood borough
| Characteristic | Without Mortgage | With Mortgage |
| Housing Units | 242 | 731 |
| Median Property Value | $288,000 | $299,700 |
| Median Household Income | $91,250 | $280 |
| Monthly Housing Costs | $927 | $161 |
| Real Estate Taxes | $5,802 | $4 |
Property Value by Mortgage Status in Edgewood borough
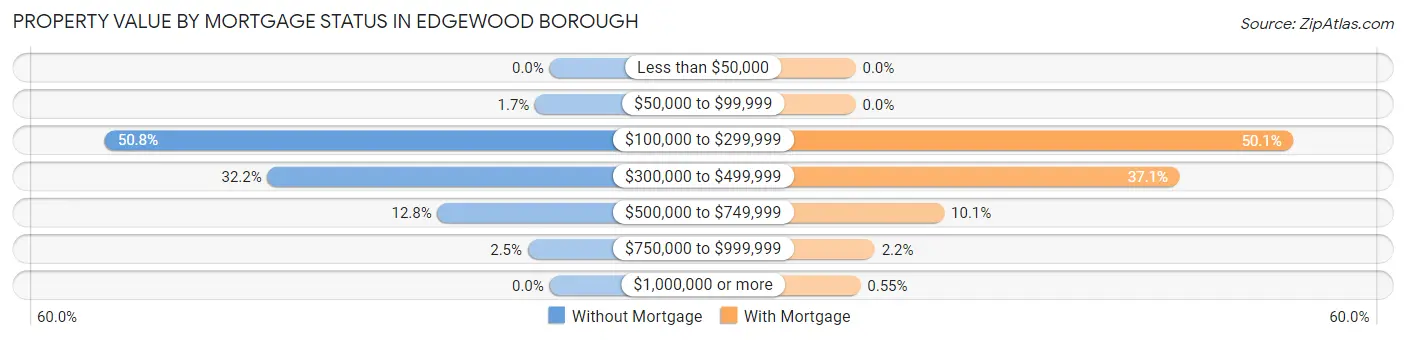
| Property Value | Without Mortgage | With Mortgage |
| Less than $50,000 | 0 (0.0%) | 0 (0.0%) |
| $50,000 to $99,999 | 4 (1.7%) | 0 (0.0%) |
| $100,000 to $299,999 | 123 (50.8%) | 366 (50.1%) |
| $300,000 to $499,999 | 78 (32.2%) | 271 (37.1%) |
| $500,000 to $749,999 | 31 (12.8%) | 74 (10.1%) |
| $750,000 to $999,999 | 6 (2.5%) | 16 (2.2%) |
| $1,000,000 or more | 0 (0.0%) | 4 (0.5%) |
| Total | 242 (100.0%) | 731 (100.0%) |
Household Income by Mortgage Status in Edgewood borough
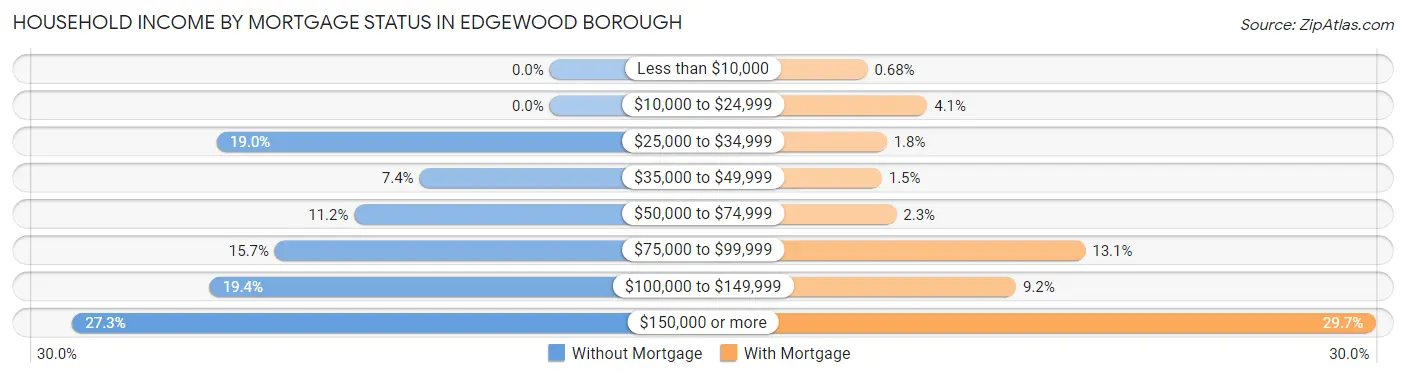
| Household Income | Without Mortgage | With Mortgage |
| Less than $10,000 | 0 (0.0%) | 5 (0.7%) |
| $10,000 to $24,999 | 0 (0.0%) | 30 (4.1%) |
| $25,000 to $34,999 | 46 (19.0%) | 13 (1.8%) |
| $35,000 to $49,999 | 18 (7.4%) | 11 (1.5%) |
| $50,000 to $74,999 | 27 (11.2%) | 17 (2.3%) |
| $75,000 to $99,999 | 38 (15.7%) | 96 (13.1%) |
| $100,000 to $149,999 | 47 (19.4%) | 67 (9.2%) |
| $150,000 or more | 66 (27.3%) | 217 (29.7%) |
| Total | 242 (100.0%) | 731 (100.0%) |
Property Value to Household Income Ratio in Edgewood borough
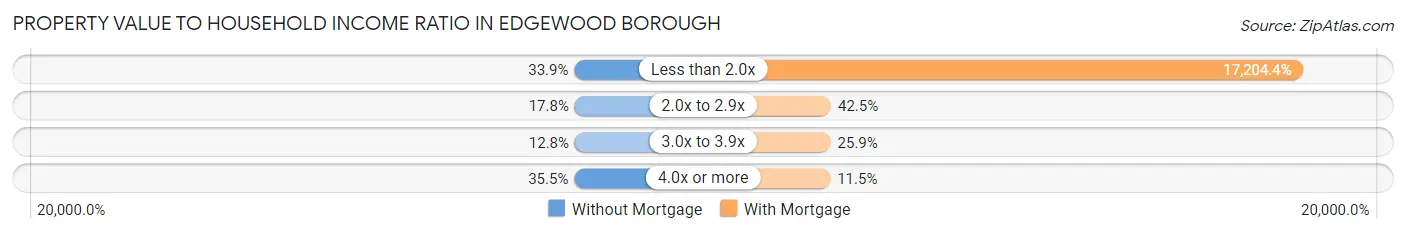
| Value-to-Income Ratio | Without Mortgage | With Mortgage |
| Less than 2.0x | 82 (33.9%) | 125,764 (17,204.4%) |
| 2.0x to 2.9x | 43 (17.8%) | 311 (42.5%) |
| 3.0x to 3.9x | 31 (12.8%) | 189 (25.9%) |
| 4.0x or more | 86 (35.5%) | 84 (11.5%) |
| Total | 242 (100.0%) | 731 (100.0%) |
Real Estate Taxes by Mortgage Status in Edgewood borough
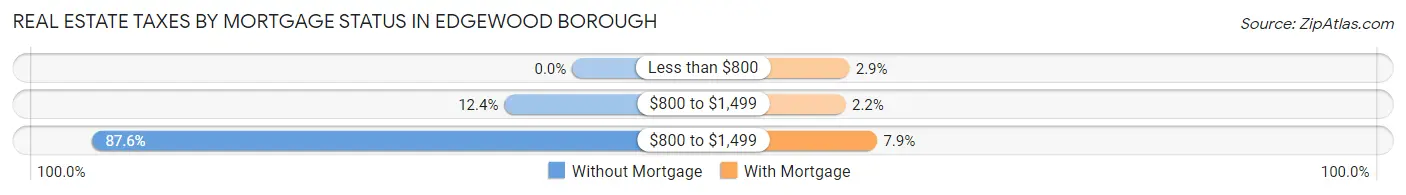
| Property Taxes | Without Mortgage | With Mortgage |
| Less than $800 | 0 (0.0%) | 21 (2.9%) |
| $800 to $1,499 | 30 (12.4%) | 16 (2.2%) |
| $800 to $1,499 | 212 (87.6%) | 58 (7.9%) |
| Total | 242 (100.0%) | 731 (100.0%) |
Health & Disability in Edgewood borough
Health Insurance Coverage by Age in Edgewood borough
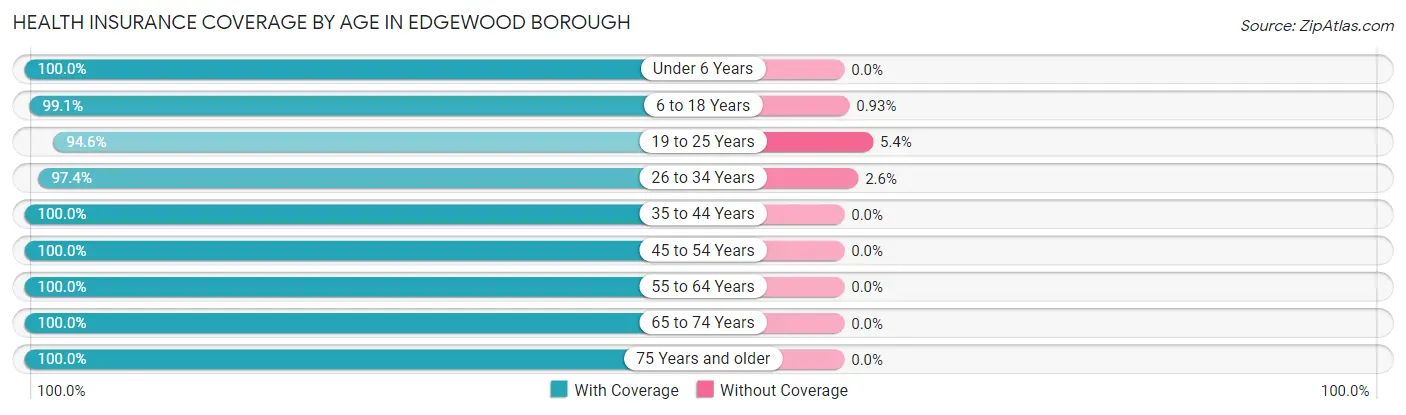
| Age Bracket | With Coverage | Without Coverage |
| Under 6 Years | 182 (100.0%) | 0 (0.0%) |
| 6 to 18 Years | 320 (99.1%) | 3 (0.9%) |
| 19 to 25 Years | 159 (94.6%) | 9 (5.4%) |
| 26 to 34 Years | 711 (97.4%) | 19 (2.6%) |
| 35 to 44 Years | 478 (100.0%) | 0 (0.0%) |
| 45 to 54 Years | 418 (100.0%) | 0 (0.0%) |
| 55 to 64 Years | 384 (100.0%) | 0 (0.0%) |
| 65 to 74 Years | 284 (100.0%) | 0 (0.0%) |
| 75 Years and older | 137 (100.0%) | 0 (0.0%) |
| Total | 3,073 (99.0%) | 31 (1.0%) |
Health Insurance Coverage by Citizenship Status in Edgewood borough
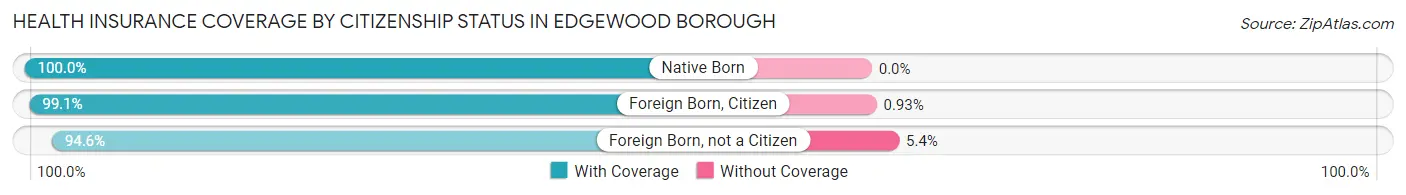
| Citizenship Status | With Coverage | Without Coverage |
| Native Born | 182 (100.0%) | 0 (0.0%) |
| Foreign Born, Citizen | 320 (99.1%) | 3 (0.9%) |
| Foreign Born, not a Citizen | 159 (94.6%) | 9 (5.4%) |
Health Insurance Coverage by Household Income in Edgewood borough
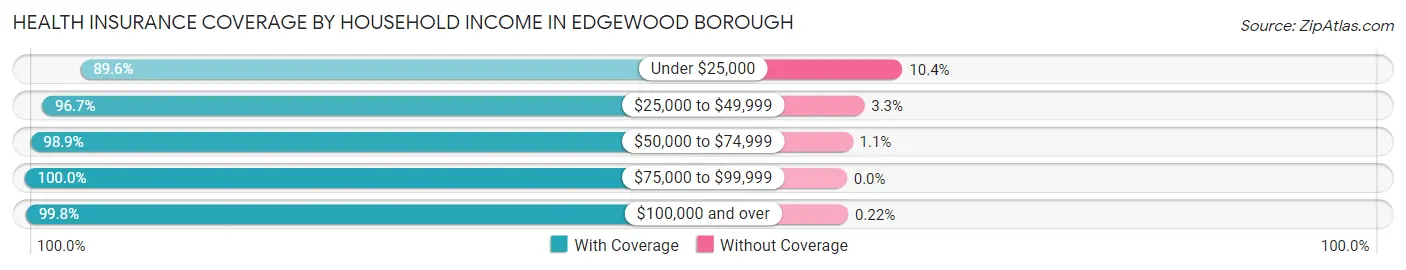
| Household Income | With Coverage | Without Coverage |
| Under $25,000 | 86 (89.6%) | 10 (10.4%) |
| $25,000 to $49,999 | 383 (96.7%) | 13 (3.3%) |
| $50,000 to $74,999 | 366 (98.9%) | 4 (1.1%) |
| $75,000 to $99,999 | 399 (100.0%) | 0 (0.0%) |
| $100,000 and over | 1,839 (99.8%) | 4 (0.2%) |
Public vs Private Health Insurance Coverage by Age in Edgewood borough
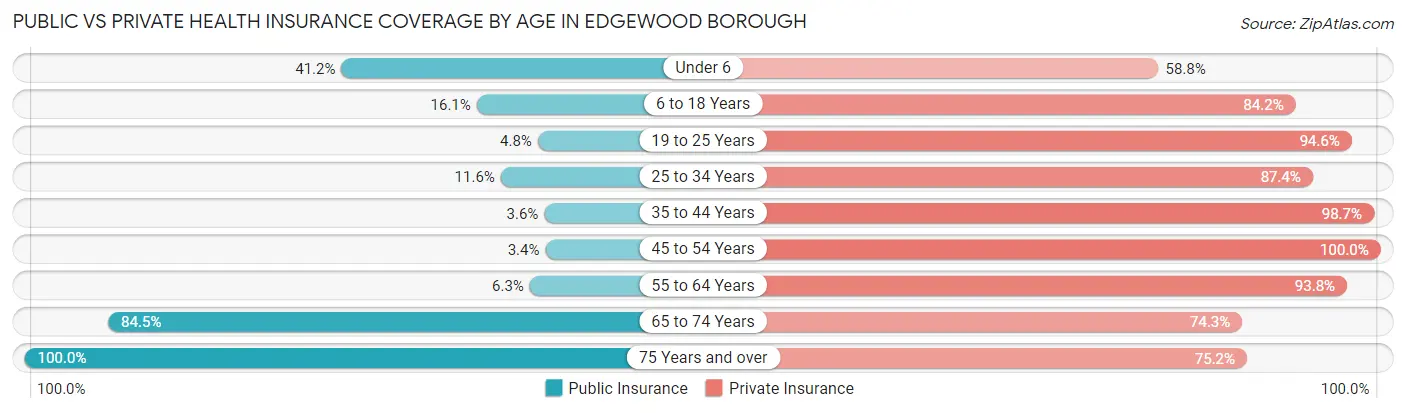
| Age Bracket | Public Insurance | Private Insurance |
| Under 6 | 75 (41.2%) | 107 (58.8%) |
| 6 to 18 Years | 52 (16.1%) | 272 (84.2%) |
| 19 to 25 Years | 8 (4.8%) | 159 (94.6%) |
| 25 to 34 Years | 85 (11.6%) | 638 (87.4%) |
| 35 to 44 Years | 17 (3.6%) | 472 (98.7%) |
| 45 to 54 Years | 14 (3.4%) | 418 (100.0%) |
| 55 to 64 Years | 24 (6.2%) | 360 (93.8%) |
| 65 to 74 Years | 240 (84.5%) | 211 (74.3%) |
| 75 Years and over | 137 (100.0%) | 103 (75.2%) |
| Total | 652 (21.0%) | 2,740 (88.3%) |
Disability Status by Sex by Age in Edgewood borough
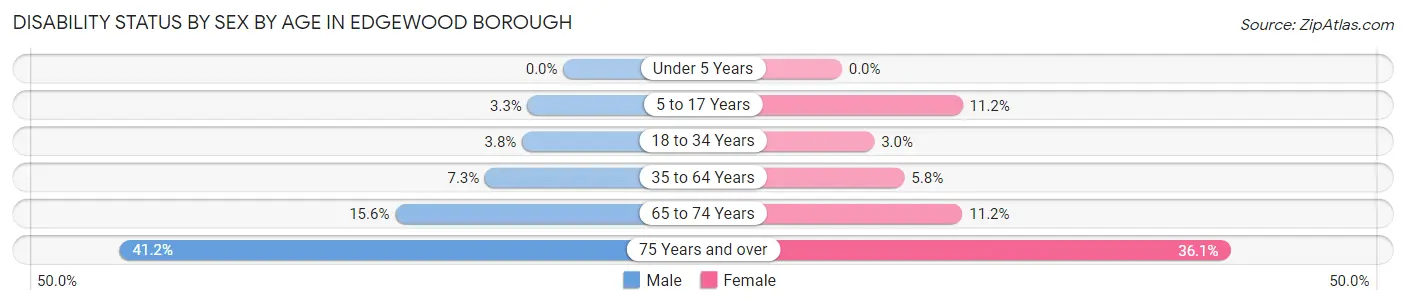
| Age Bracket | Male | Female |
| Under 5 Years | 0 (0.0%) | 0 (0.0%) |
| 5 to 17 Years | 4 (3.3%) | 24 (11.2%) |
| 18 to 34 Years | 13 (3.8%) | 17 (3.0%) |
| 35 to 64 Years | 43 (7.3%) | 40 (5.8%) |
| 65 to 74 Years | 22 (15.6%) | 16 (11.2%) |
| 75 Years and over | 21 (41.2%) | 31 (36.0%) |
Disability Class by Sex by Age in Edgewood borough
Disability Class: Hearing Difficulty
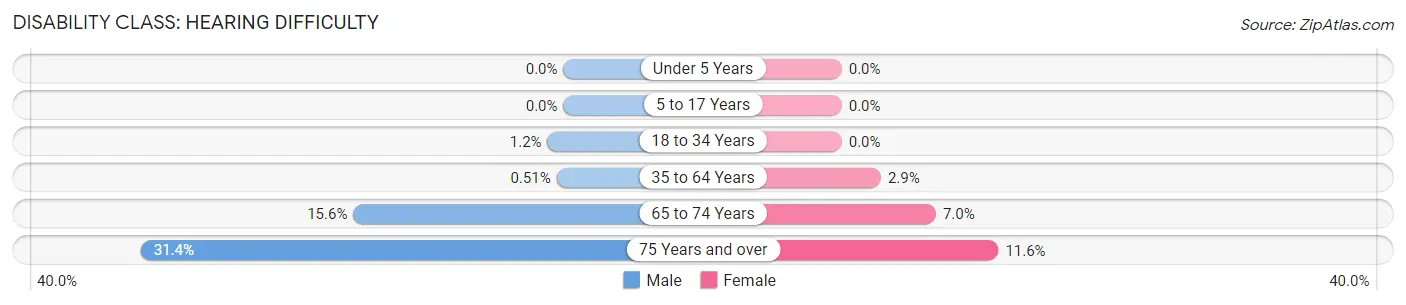
| Age Bracket | Male | Female |
| Under 5 Years | 0 (0.0%) | 0 (0.0%) |
| 5 to 17 Years | 0 (0.0%) | 0 (0.0%) |
| 18 to 34 Years | 4 (1.2%) | 0 (0.0%) |
| 35 to 64 Years | 3 (0.5%) | 20 (2.9%) |
| 65 to 74 Years | 22 (15.6%) | 10 (7.0%) |
| 75 Years and over | 16 (31.4%) | 10 (11.6%) |
Disability Class: Vision Difficulty
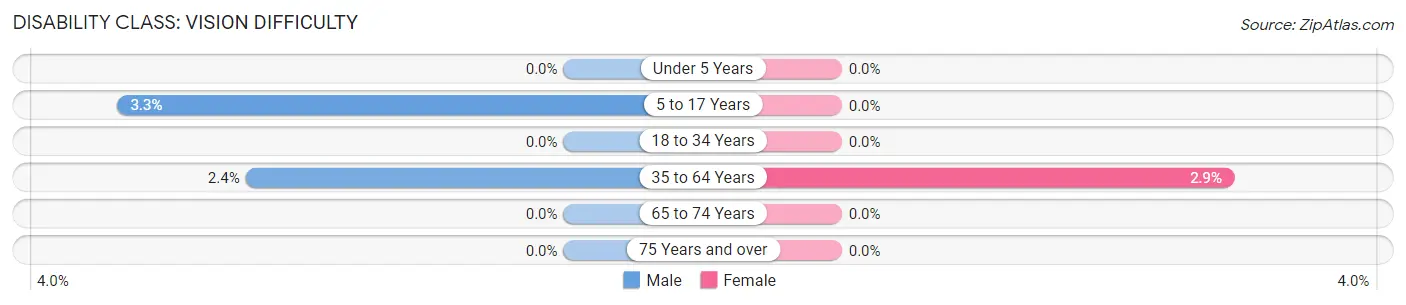
| Age Bracket | Male | Female |
| Under 5 Years | 0 (0.0%) | 0 (0.0%) |
| 5 to 17 Years | 4 (3.3%) | 0 (0.0%) |
| 18 to 34 Years | 0 (0.0%) | 0 (0.0%) |
| 35 to 64 Years | 14 (2.4%) | 20 (2.9%) |
| 65 to 74 Years | 0 (0.0%) | 0 (0.0%) |
| 75 Years and over | 0 (0.0%) | 0 (0.0%) |
Disability Class: Cognitive Difficulty
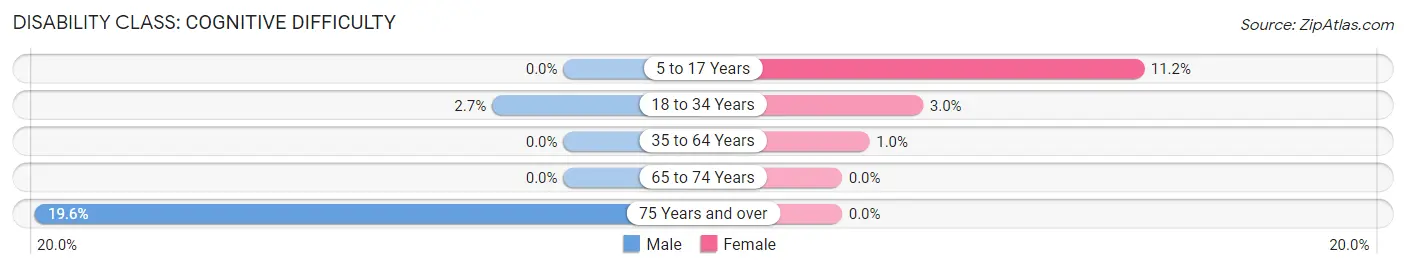
| Age Bracket | Male | Female |
| 5 to 17 Years | 0 (0.0%) | 24 (11.2%) |
| 18 to 34 Years | 9 (2.6%) | 17 (3.0%) |
| 35 to 64 Years | 0 (0.0%) | 7 (1.0%) |
| 65 to 74 Years | 0 (0.0%) | 0 (0.0%) |
| 75 Years and over | 10 (19.6%) | 0 (0.0%) |
Disability Class: Ambulatory Difficulty
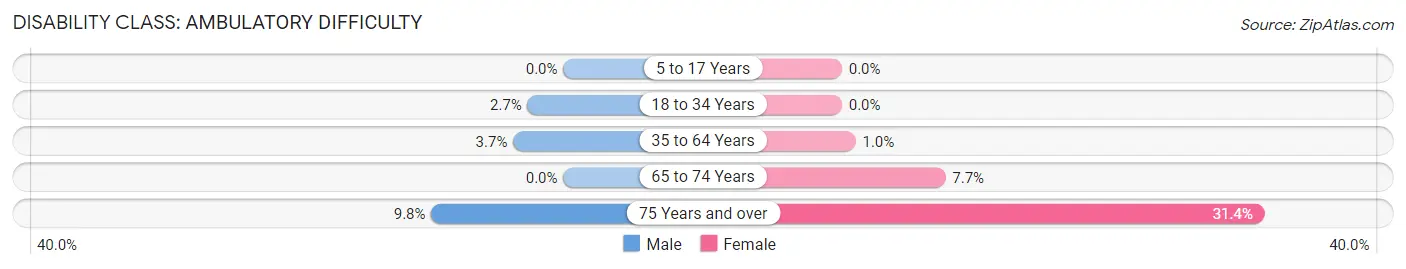
| Age Bracket | Male | Female |
| 5 to 17 Years | 0 (0.0%) | 0 (0.0%) |
| 18 to 34 Years | 9 (2.6%) | 0 (0.0%) |
| 35 to 64 Years | 22 (3.7%) | 7 (1.0%) |
| 65 to 74 Years | 0 (0.0%) | 11 (7.7%) |
| 75 Years and over | 5 (9.8%) | 27 (31.4%) |
Disability Class: Self-Care Difficulty
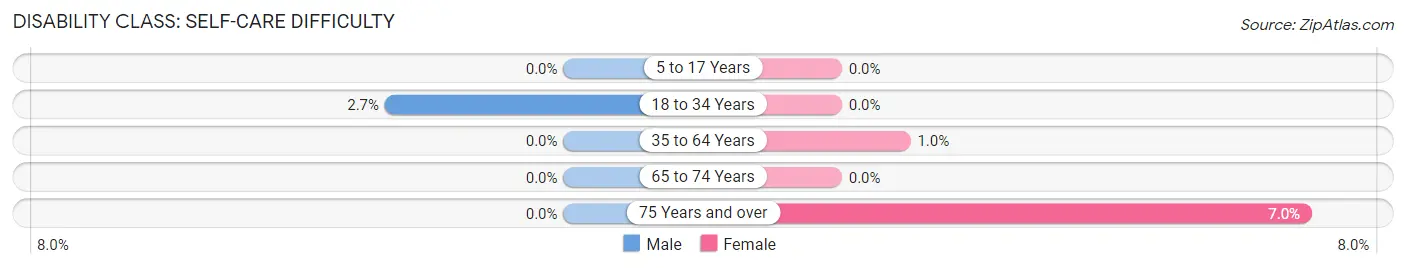
| Age Bracket | Male | Female |
| 5 to 17 Years | 0 (0.0%) | 0 (0.0%) |
| 18 to 34 Years | 9 (2.6%) | 0 (0.0%) |
| 35 to 64 Years | 0 (0.0%) | 7 (1.0%) |
| 65 to 74 Years | 0 (0.0%) | 0 (0.0%) |
| 75 Years and over | 0 (0.0%) | 6 (7.0%) |
Technology Access in Edgewood borough
Computing Device Access in Edgewood borough
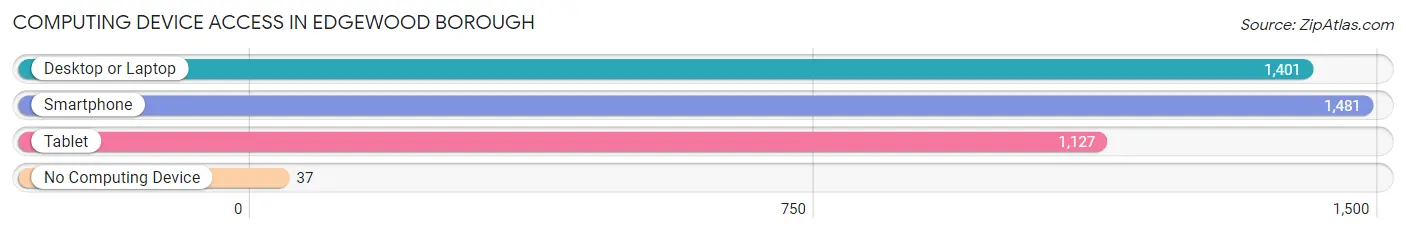
| Device Type | # Households | % Households |
| Desktop or Laptop | 1,401 | 89.9% |
| Smartphone | 1,481 | 95.0% |
| Tablet | 1,127 | 72.3% |
| No Computing Device | 37 | 2.4% |
| Total | 1,559 | 100.0% |
Internet Access in Edgewood borough
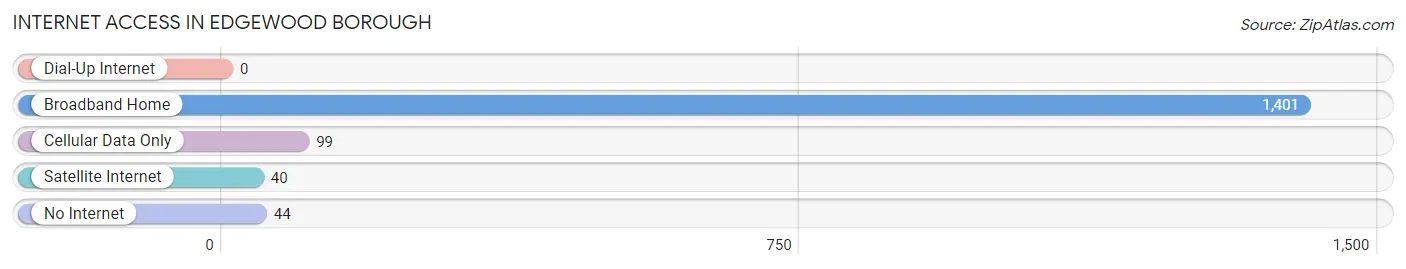
| Internet Type | # Households | % Households |
| Dial-Up Internet | 0 | 0.0% |
| Broadband Home | 1,401 | 89.9% |
| Cellular Data Only | 99 | 6.4% |
| Satellite Internet | 40 | 2.6% |
| No Internet | 44 | 2.8% |
| Total | 1,559 | 100.0% |
Edgewood borough Summary
Edgewood Borough is a small borough located in Allegheny County, Pennsylvania. It is situated in the eastern suburbs of Pittsburgh, and is part of the Pittsburgh Metropolitan Statistical Area. The borough was incorporated in 1906, and has a population of approximately 4,000 people.
Geography
Edgewood Borough is located in the eastern suburbs of Pittsburgh, and is situated in the Monongahela River Valley. The borough is bordered by Swissvale to the north, Wilkinsburg to the east, Forest Hills to the south, and Wilkins Township to the west. The borough covers an area of 1.2 square miles, and is located at an elevation of 890 feet above sea level. The borough is located in the Allegheny Plateau physiographic province, and is characterized by rolling hills and valleys. The borough is located in the humid continental climate zone, and experiences four distinct seasons.
History
Edgewood Borough was originally part of Wilkins Township, and was settled in the late 1700s by German and Scots-Irish immigrants. The area was known as “Edge Hill”, and was primarily used for farming. In the late 1800s, the area began to develop as a residential suburb of Pittsburgh. The borough was incorporated in 1906, and was named after the local Edge Hill Farm. The borough experienced rapid growth in the early 20th century, and by the 1950s, the population had reached its peak of over 8,000 people. Since then, the population has declined, and the borough now has a population of approximately 4,000 people.
Economy
Edgewood Borough has a diverse economy, with a variety of businesses and industries located in the borough. The largest employers in the borough are the University of Pittsburgh Medical Center, UPMC Presbyterian Shadyside, and the Allegheny County Health Department. Other major employers include the Edgewood Borough School District, the Edgewood Borough Police Department, and the Edgewood Borough Fire Department. The borough also has a number of small businesses, including restaurants, retail stores, and professional services.
Demographics
As of the 2010 census, Edgewood Borough had a population of 4,038 people. The racial makeup of the borough was 79.3% White, 15.2% African American, 0.3% Native American, 1.2% Asian, 0.1% Pacific Islander, and 3.9% from other races. The median household income in the borough was $45,945, and the median family income was $54,945. The per capita income in the borough was $22,945. The unemployment rate in the borough was 5.2%.
Conclusion
Edgewood Borough is a small borough located in Allegheny County, Pennsylvania. It is situated in the eastern suburbs of Pittsburgh, and is part of the Pittsburgh Metropolitan Statistical Area. The borough was incorporated in 1906, and has a population of approximately 4,000 people. Edgewood Borough has a diverse economy, with a variety of businesses and industries located in the borough. As of the 2010 census, Edgewood Borough had a population of 4,038 people. The racial makeup of the borough was 79.3% White, 15.2% African American, 0.3% Native American, 1.2% Asian, 0.1% Pacific Islander, and 3.9% from other races. The median household income in the borough was $45,945, and the median family income was $54,945. The per capita income in the borough was $22,945. The unemployment rate in the borough was 5.2%.
Common Questions
What is Per Capita Income in Edgewood borough?
Per Capita income in Edgewood borough is $63,603.
What is the Median Family Income in Edgewood borough?
Median Family Income in Edgewood borough is $129,167.
What is the Median Household income in Edgewood borough?
Median Household Income in Edgewood borough is $92,750.
What is Income or Wage Gap in Edgewood borough?
Income or Wage Gap in Edgewood borough is 37.3%.
Women in Edgewood borough earn 62.7 cents for every dollar earned by a man.
What is Inequality or Gini Index in Edgewood borough?
Inequality or Gini Index in Edgewood borough is 0.43.
What is the Total Population of Edgewood borough?
Total Population of Edgewood borough is 3,104.
What is the Total Male Population of Edgewood borough?
Total Male Population of Edgewood borough is 1,355.
What is the Total Female Population of Edgewood borough?
Total Female Population of Edgewood borough is 1,749.
What is the Ratio of Males per 100 Females in Edgewood borough?
There are 77.47 Males per 100 Females in Edgewood borough.
What is the Ratio of Females per 100 Males in Edgewood borough?
There are 129.08 Females per 100 Males in Edgewood borough.
What is the Median Population Age in Edgewood borough?
Median Population Age in Edgewood borough is 37.6 Years.
What is the Average Family Size in Edgewood borough
Average Family Size in Edgewood borough is 2.7 People.
What is the Average Household Size in Edgewood borough
Average Household Size in Edgewood borough is 2.0 People.
How Large is the Labor Force in Edgewood borough?
There are 2,223 People in the Labor Forcein in Edgewood borough.
What is the Percentage of People in the Labor Force in Edgewood borough?
83.7% of People are in the Labor Force in Edgewood borough.
What is the Unemployment Rate in Edgewood borough?
Unemployment Rate in Edgewood borough is 3.9%.