Grier City, PA Map & Demographics
Grier City Map
Grier City Overview
$39,704
PER CAPITA INCOME
$88,304
AVG FAMILY INCOME
$71,250
AVG HOUSEHOLD INCOME
69.2%
WAGE / INCOME GAP [ % ]
30.8¢/ $1
WAGE / INCOME GAP [ $ ]
0.40
INEQUALITY / GINI INDEX
242
TOTAL POPULATION
132
MALE POPULATION
110
FEMALE POPULATION
120.00
MALES / 100 FEMALES
83.33
FEMALES / 100 MALES
50.6
MEDIAN AGE
2.6
AVG FAMILY SIZE
2.1
AVG HOUSEHOLD SIZE
179
LABOR FORCE [ PEOPLE ]
74.9%
PERCENT IN LABOR FORCE
10.1%
UNEMPLOYMENT RATE
Income in Grier City
Income Overview in Grier City
Per Capita Income in Grier City is $39,704, while median incomes of families and households are $88,304 and $71,250 respectively.
| Characteristic | Number | Measure |
| Per Capita Income | 242 | $39,704 |
| Median Family Income | 77 | $88,304 |
| Mean Family Income | 77 | $99,997 |
| Median Household Income | 117 | $71,250 |
| Mean Household Income | 117 | $77,344 |
| Income Deficit | 77 | $0 |
| Wage / Income Gap (%) | 242 | 69.24% |
| Wage / Income Gap ($) | 242 | 30.76¢ per $1 |
| Gini / Inequality Index | 242 | 0.40 |
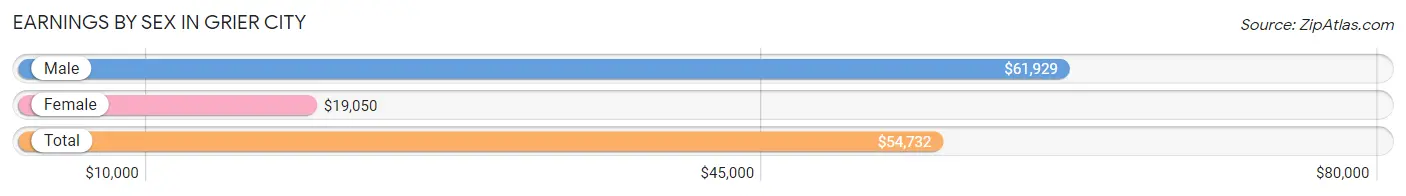
Earnings by Sex in Grier City
Average Earnings in Grier City are $54,732, $61,929 for men and $19,050 for women, a difference of 69.2%.
| Sex | Number | Average Earnings |
| Male | 98 (60.9%) | $61,929 |
| Female | 63 (39.1%) | $19,050 |
| Total | 161 (100.0%) | $54,732 |
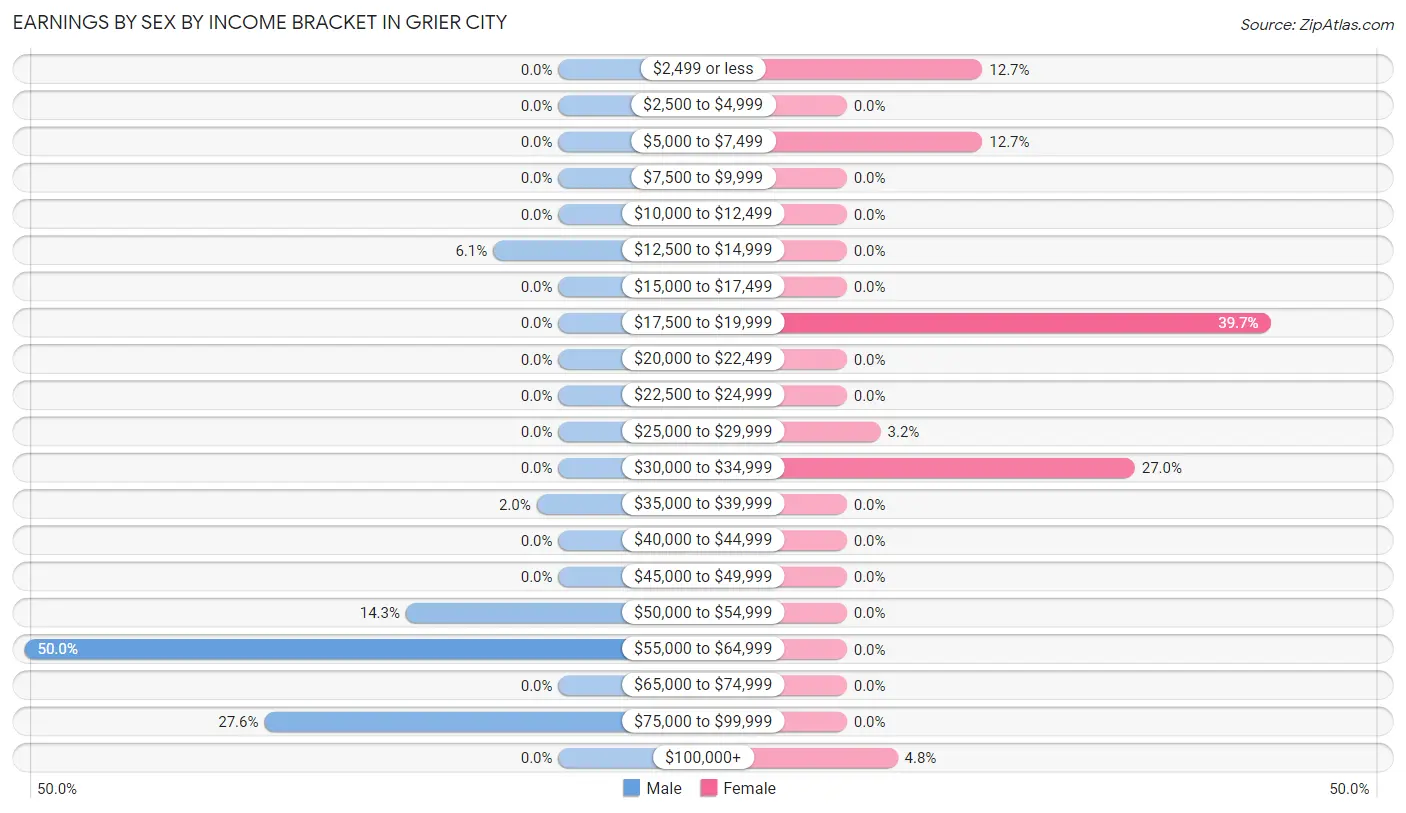
Earnings by Sex by Income Bracket in Grier City
The most common earnings brackets in Grier City are $55,000 to $64,999 for men (49 | 50.0%) and $17,500 to $19,999 for women (25 | 39.7%).
| Income | Male | Female |
| $2,499 or less | 0 (0.0%) | 8 (12.7%) |
| $2,500 to $4,999 | 0 (0.0%) | 0 (0.0%) |
| $5,000 to $7,499 | 0 (0.0%) | 8 (12.7%) |
| $7,500 to $9,999 | 0 (0.0%) | 0 (0.0%) |
| $10,000 to $12,499 | 0 (0.0%) | 0 (0.0%) |
| $12,500 to $14,999 | 6 (6.1%) | 0 (0.0%) |
| $15,000 to $17,499 | 0 (0.0%) | 0 (0.0%) |
| $17,500 to $19,999 | 0 (0.0%) | 25 (39.7%) |
| $20,000 to $22,499 | 0 (0.0%) | 0 (0.0%) |
| $22,500 to $24,999 | 0 (0.0%) | 0 (0.0%) |
| $25,000 to $29,999 | 0 (0.0%) | 2 (3.2%) |
| $30,000 to $34,999 | 0 (0.0%) | 17 (27.0%) |
| $35,000 to $39,999 | 2 (2.0%) | 0 (0.0%) |
| $40,000 to $44,999 | 0 (0.0%) | 0 (0.0%) |
| $45,000 to $49,999 | 0 (0.0%) | 0 (0.0%) |
| $50,000 to $54,999 | 14 (14.3%) | 0 (0.0%) |
| $55,000 to $64,999 | 49 (50.0%) | 0 (0.0%) |
| $65,000 to $74,999 | 0 (0.0%) | 0 (0.0%) |
| $75,000 to $99,999 | 27 (27.6%) | 0 (0.0%) |
| $100,000+ | 0 (0.0%) | 3 (4.8%) |
| Total | 98 (100.0%) | 63 (100.0%) |
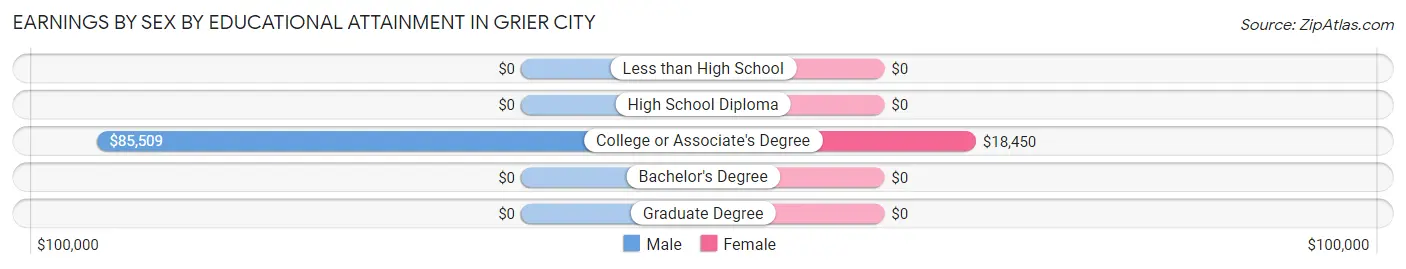
Earnings by Sex by Educational Attainment in Grier City
Average earnings in Grier City are $64,196 for men and $19,050 for women, a difference of 70.3%. Men with an educational attainment of college or associate's degree enjoy the highest average annual earnings of $85,509, while those with college or associate's degree education earn the least with $85,509. Women with an educational attainment of college or associate's degree earn the most with the average annual earnings of $18,450, while those with college or associate's degree education have the smallest earnings of $18,450.
| Educational Attainment | Male Income | Female Income |
| Less than High School | - | - |
| High School Diploma | - | - |
| College or Associate's Degree | $85,509 | $18,450 |
| Bachelor's Degree | - | - |
| Graduate Degree | - | - |
| Total | $64,196 | $19,050 |
Family Income in Grier City
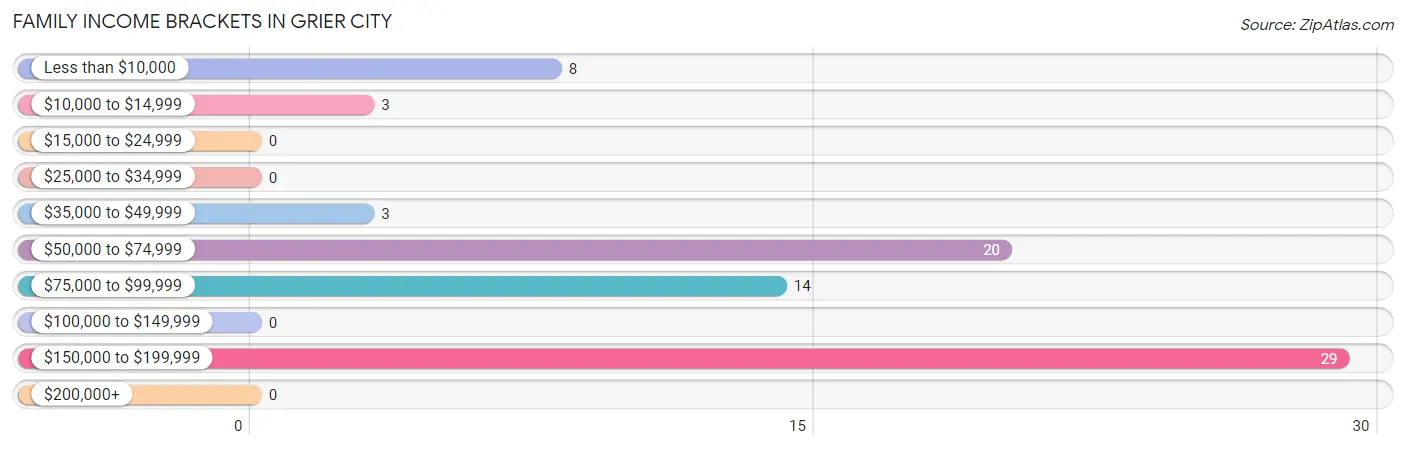
Family Income Brackets in Grier City
According to the Grier City family income data, there are 29 families falling into the $150,000 to $199,999 income range, which is the most common income bracket and makes up 37.7% of all families.
| Income Bracket | # Families | % Families |
| Less than $10,000 | 8 | 10.4% |
| $10,000 to $14,999 | 3 | 3.9% |
| $15,000 to $24,999 | 0 | 0.0% |
| $25,000 to $34,999 | 0 | 0.0% |
| $35,000 to $49,999 | 3 | 3.9% |
| $50,000 to $74,999 | 20 | 26.0% |
| $75,000 to $99,999 | 14 | 18.2% |
| $100,000 to $149,999 | 0 | 0.0% |
| $150,000 to $199,999 | 29 | 37.7% |
| $200,000+ | 0 | 0.0% |
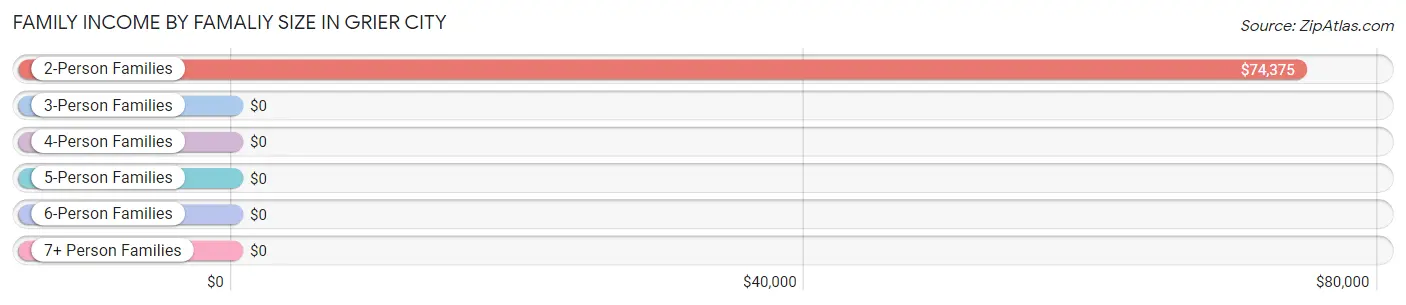
Family Income by Famaliy Size in Grier City
2-person families (39 | 50.6%) account for the highest median family income in Grier City with $74,375 per family, while 2-person families (39 | 50.6%) have the highest median income of $37,188 per family member.
| Income Bracket | # Families | Median Income |
| 2-Person Families | 39 (50.6%) | $74,375 |
| 3-Person Families | 38 (49.3%) | $0 |
| 4-Person Families | 0 (0.0%) | $0 |
| 5-Person Families | 0 (0.0%) | $0 |
| 6-Person Families | 0 (0.0%) | $0 |
| 7+ Person Families | 0 (0.0%) | $0 |
| Total | 77 (100.0%) | $88,304 |
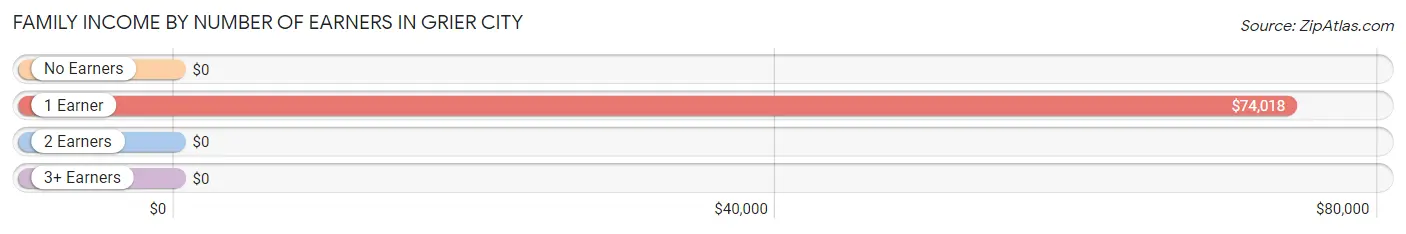
Family Income by Number of Earners in Grier City
| Number of Earners | # Families | Median Income |
| No Earners | 3 (3.9%) | $0 |
| 1 Earner | 39 (50.6%) | $74,018 |
| 2 Earners | 8 (10.4%) | $0 |
| 3+ Earners | 27 (35.1%) | $0 |
| Total | 77 (100.0%) | $88,304 |
Household Income in Grier City
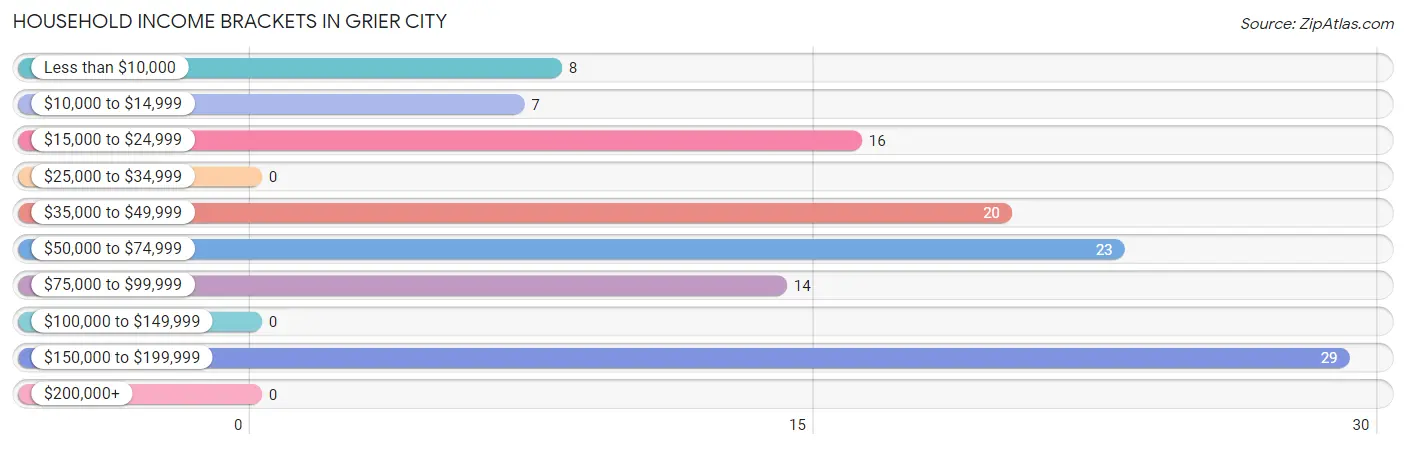
Household Income Brackets in Grier City
With 29 households falling in the category, the $150,000 to $199,999 income range is the most frequent in Grier City, accounting for 24.8% of all households.
| Income Bracket | # Households | % Households |
| Less than $10,000 | 8 | 6.8% |
| $10,000 to $14,999 | 7 | 6.0% |
| $15,000 to $24,999 | 16 | 13.7% |
| $25,000 to $34,999 | 0 | 0.0% |
| $35,000 to $49,999 | 20 | 17.1% |
| $50,000 to $74,999 | 23 | 19.7% |
| $75,000 to $99,999 | 14 | 12.0% |
| $100,000 to $149,999 | 0 | 0.0% |
| $150,000 to $199,999 | 29 | 24.8% |
| $200,000+ | 0 | 0.0% |
Household Income by Householder Age in Grier City
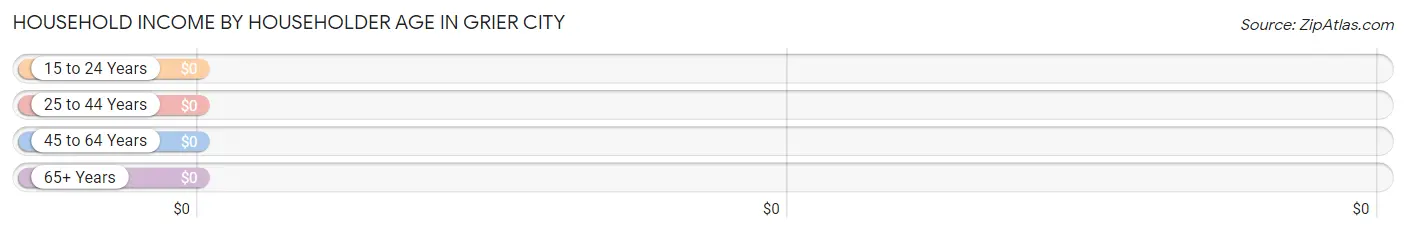
| Income Bracket | # Households | Median Income |
| 15 to 24 Years | 0 (0.0%) | $0 |
| 25 to 44 Years | 17 (14.5%) | $0 |
| 45 to 64 Years | 29 (24.8%) | $0 |
| 65+ Years | 71 (60.7%) | $0 |
| Total | 117 (100.0%) | $71,250 |
Poverty in Grier City
Income Below Poverty by Sex and Age in Grier City
With 9.1% poverty level for males and 21.8% for females among the residents of Grier City, 35 to 44 year old males and 18 to 24 year old females are the most vulnerable to poverty, with 9 males (100.0%) and 9 females (100.0%) in their respective age groups living below the poverty level.
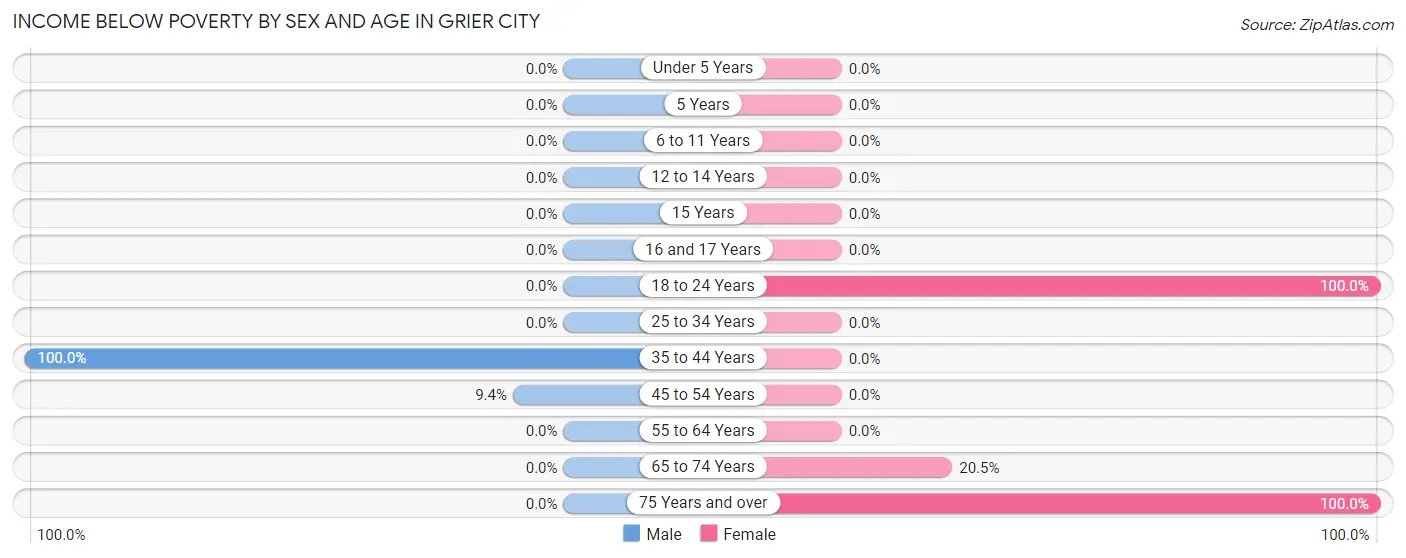
| Age Bracket | Male | Female |
| Under 5 Years | 0 (0.0%) | 0 (0.0%) |
| 5 Years | 0 (0.0%) | 0 (0.0%) |
| 6 to 11 Years | 0 (0.0%) | 0 (0.0%) |
| 12 to 14 Years | 0 (0.0%) | 0 (0.0%) |
| 15 Years | 0 (0.0%) | 0 (0.0%) |
| 16 and 17 Years | 0 (0.0%) | 0 (0.0%) |
| 18 to 24 Years | 0 (0.0%) | 9 (100.0%) |
| 25 to 34 Years | 0 (0.0%) | 0 (0.0%) |
| 35 to 44 Years | 9 (100.0%) | 0 (0.0%) |
| 45 to 54 Years | 3 (9.4%) | 0 (0.0%) |
| 55 to 64 Years | 0 (0.0%) | 0 (0.0%) |
| 65 to 74 Years | 0 (0.0%) | 8 (20.5%) |
| 75 Years and over | 0 (0.0%) | 7 (100.0%) |
| Total | 12 (9.1%) | 24 (21.8%) |
Income Above Poverty by Sex and Age in Grier City
According to the poverty statistics in Grier City, males aged 15 years and females aged 25 to 34 years are the age groups that are most secure financially, with 100.0% of males and 100.0% of females in these age groups living above the poverty line.
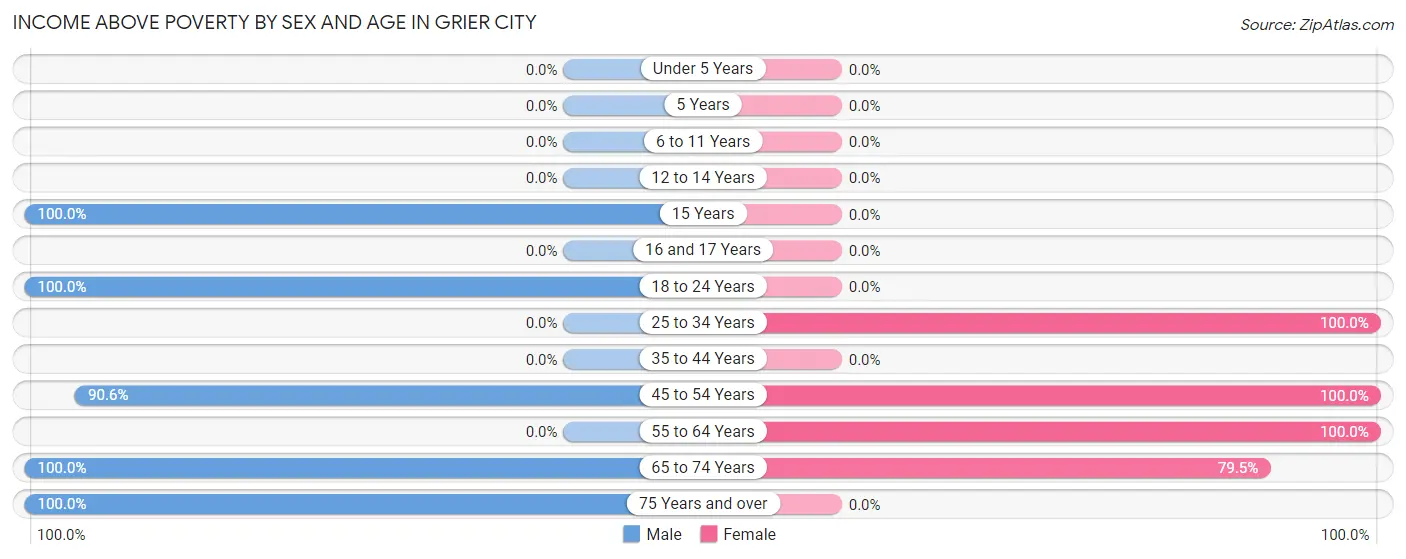
| Age Bracket | Male | Female |
| Under 5 Years | 0 (0.0%) | 0 (0.0%) |
| 5 Years | 0 (0.0%) | 0 (0.0%) |
| 6 to 11 Years | 0 (0.0%) | 0 (0.0%) |
| 12 to 14 Years | 0 (0.0%) | 0 (0.0%) |
| 15 Years | 3 (100.0%) | 0 (0.0%) |
| 16 and 17 Years | 0 (0.0%) | 0 (0.0%) |
| 18 to 24 Years | 35 (100.0%) | 0 (0.0%) |
| 25 to 34 Years | 0 (0.0%) | 17 (100.0%) |
| 35 to 44 Years | 0 (0.0%) | 0 (0.0%) |
| 45 to 54 Years | 29 (90.6%) | 27 (100.0%) |
| 55 to 64 Years | 0 (0.0%) | 11 (100.0%) |
| 65 to 74 Years | 28 (100.0%) | 31 (79.5%) |
| 75 Years and over | 25 (100.0%) | 0 (0.0%) |
| Total | 120 (90.9%) | 86 (78.2%) |
Income Below Poverty Among Married-Couple Families in Grier City
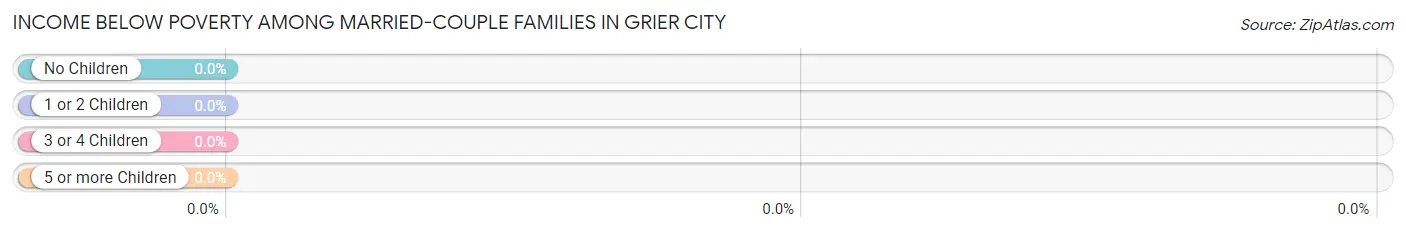
| Children | Above Poverty | Below Poverty |
| No Children | 63 (100.0%) | 0 (0.0%) |
| 1 or 2 Children | 0 (0.0%) | 0 (0.0%) |
| 3 or 4 Children | 0 (0.0%) | 0 (0.0%) |
| 5 or more Children | 0 (0.0%) | 0 (0.0%) |
| Total | 63 (100.0%) | 0 (0.0%) |
Income Below Poverty Among Single-Parent Households in Grier City
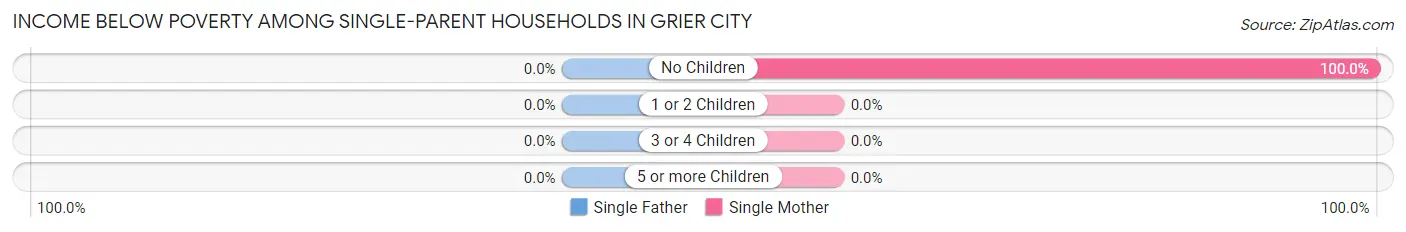
| Children | Single Father | Single Mother |
| No Children | 0 (0.0%) | 11 (100.0%) |
| 1 or 2 Children | 0 (0.0%) | 0 (0.0%) |
| 3 or 4 Children | 0 (0.0%) | 0 (0.0%) |
| 5 or more Children | 0 (0.0%) | 0 (0.0%) |
| Total | 0 (0.0%) | 11 (100.0%) |
Income Below Poverty Among Married-Couple vs Single-Parent Households in Grier City
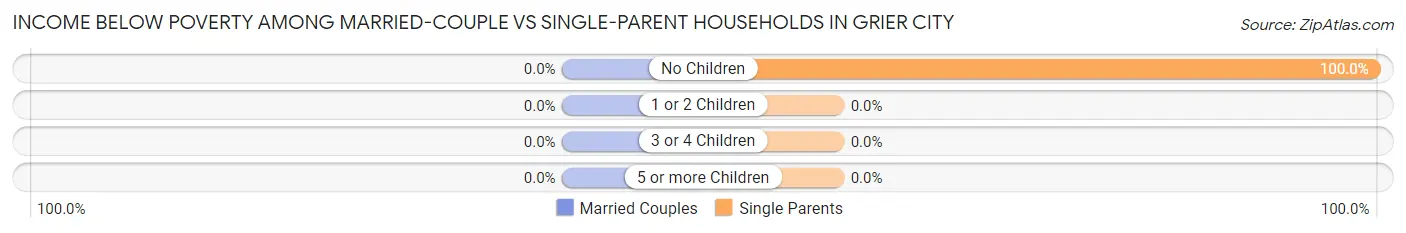
| Children | Married-Couple Families | Single-Parent Households |
| No Children | 0 (0.0%) | 11 (100.0%) |
| 1 or 2 Children | 0 (0.0%) | 0 (0.0%) |
| 3 or 4 Children | 0 (0.0%) | 0 (0.0%) |
| 5 or more Children | 0 (0.0%) | 0 (0.0%) |
| Total | 0 (0.0%) | 11 (78.6%) |
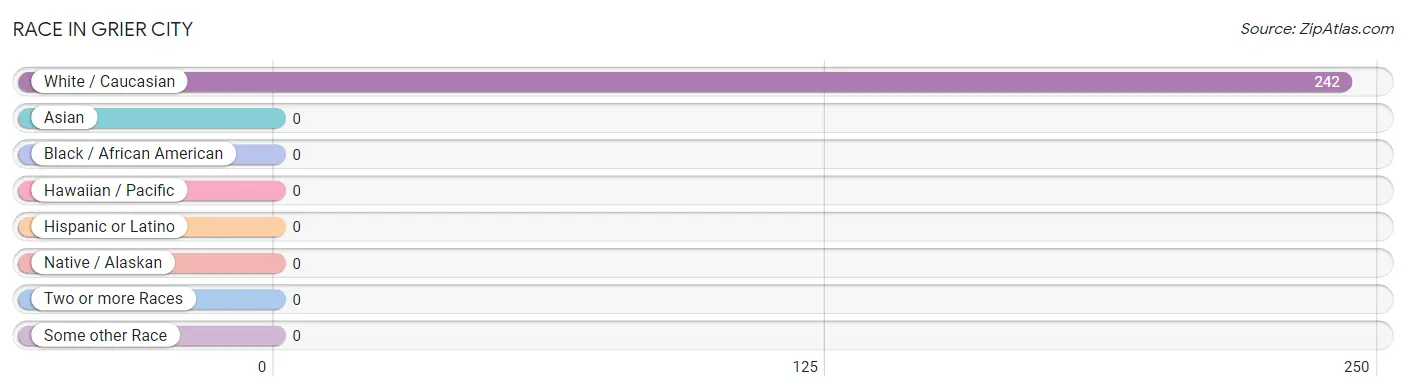
Race in Grier City
The most populous races in Grier City are , and White / Caucasian (242 | 100.0%).
| Race | # Population | % Population |
| Asian | 0 | 0.0% |
| Black / African American | 0 | 0.0% |
| Hawaiian / Pacific | 0 | 0.0% |
| Hispanic or Latino | 0 | 0.0% |
| Native / Alaskan | 0 | 0.0% |
| White / Caucasian | 242 | 100.0% |
| Two or more Races | 0 | 0.0% |
| Some other Race | 0 | 0.0% |
| Total | 242 | 100.0% |
Ancestry in Grier City
The most populous ancestries reported in Grier City are German (93 | 38.4%), Irish (77 | 31.8%), Polish (60 | 24.8%), Italian (32 | 13.2%), and Austrian (17 | 7.0%), together accounting for 115.3% of all Grier City residents.
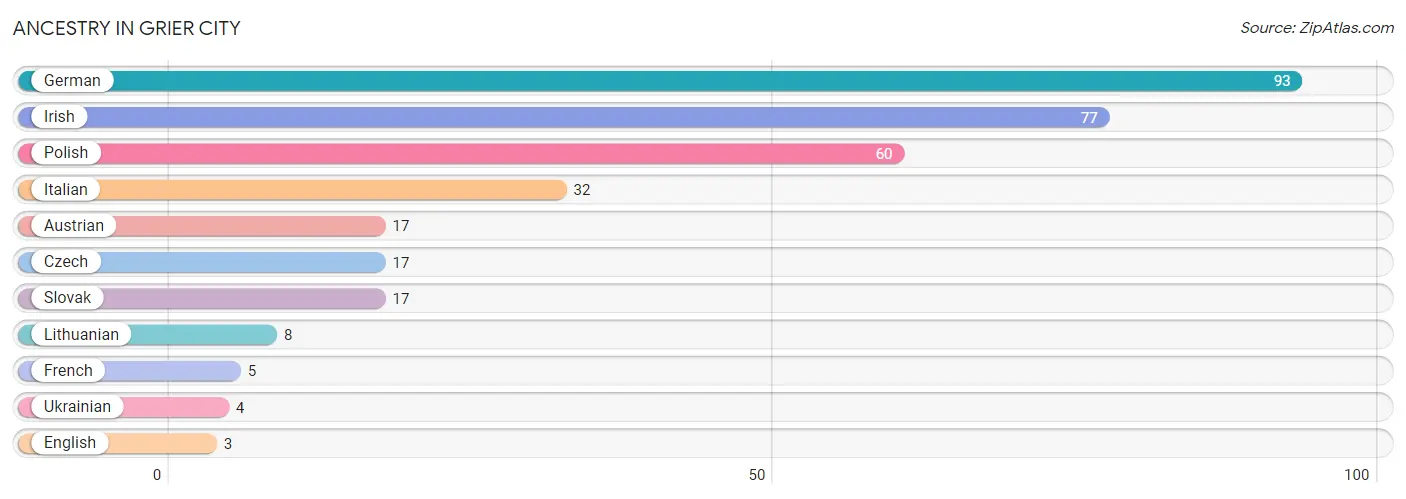
| Ancestry | # Population | % Population |
| Austrian | 17 | 7.0% |
| Czech | 17 | 7.0% |
| English | 3 | 1.2% |
| French | 5 | 2.1% |
| German | 93 | 38.4% |
| Irish | 77 | 31.8% |
| Italian | 32 | 13.2% |
| Lithuanian | 8 | 3.3% |
| Polish | 60 | 24.8% |
| Slovak | 17 | 7.0% |
| Ukrainian | 4 | 1.7% | View All 11 Rows |
Immigrants in Grier City

| Immigration Origin | # Population | % Population | View All 0 Rows |
Sex and Age in Grier City
Sex and Age in Grier City
The most populous age groups in Grier City are 20 to 24 Years (35 | 26.5%) for men and 70 to 74 Years (28 | 25.5%) for women.
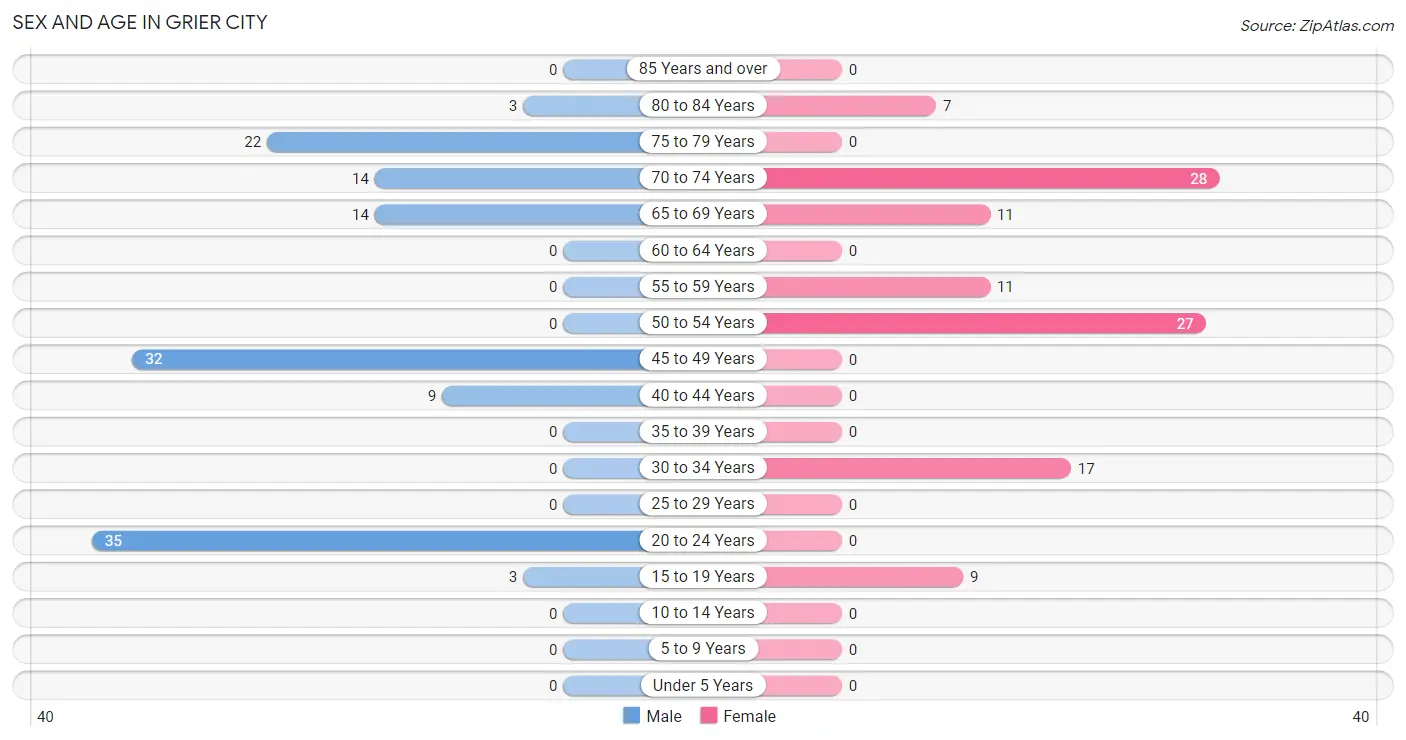
| Age Bracket | Male | Female |
| Under 5 Years | 0 (0.0%) | 0 (0.0%) |
| 5 to 9 Years | 0 (0.0%) | 0 (0.0%) |
| 10 to 14 Years | 0 (0.0%) | 0 (0.0%) |
| 15 to 19 Years | 3 (2.3%) | 9 (8.2%) |
| 20 to 24 Years | 35 (26.5%) | 0 (0.0%) |
| 25 to 29 Years | 0 (0.0%) | 0 (0.0%) |
| 30 to 34 Years | 0 (0.0%) | 17 (15.4%) |
| 35 to 39 Years | 0 (0.0%) | 0 (0.0%) |
| 40 to 44 Years | 9 (6.8%) | 0 (0.0%) |
| 45 to 49 Years | 32 (24.2%) | 0 (0.0%) |
| 50 to 54 Years | 0 (0.0%) | 27 (24.5%) |
| 55 to 59 Years | 0 (0.0%) | 11 (10.0%) |
| 60 to 64 Years | 0 (0.0%) | 0 (0.0%) |
| 65 to 69 Years | 14 (10.6%) | 11 (10.0%) |
| 70 to 74 Years | 14 (10.6%) | 28 (25.5%) |
| 75 to 79 Years | 22 (16.7%) | 0 (0.0%) |
| 80 to 84 Years | 3 (2.3%) | 7 (6.4%) |
| 85 Years and over | 0 (0.0%) | 0 (0.0%) |
| Total | 132 (100.0%) | 110 (100.0%) |
Families and Households in Grier City
Median Family Size in Grier City
The median family size in Grier City is 2.62 persons per family, with single female/mother families (11 | 14.3%) accounting for the largest median family size of 2.91 persons per family. On the other hand, married-couple families (63 | 81.8%) represent the smallest median family size with 2.57 persons per family.
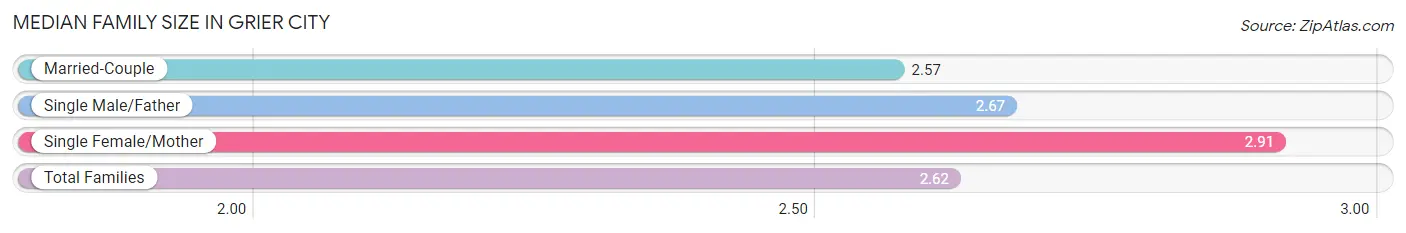
| Family Type | # Families | Family Size |
| Married-Couple | 63 (81.8%) | 2.57 |
| Single Male/Father | 3 (3.9%) | 2.67 |
| Single Female/Mother | 11 (14.3%) | 2.91 |
| Total Families | 77 (100.0%) | 2.62 |
Median Household Size in Grier City
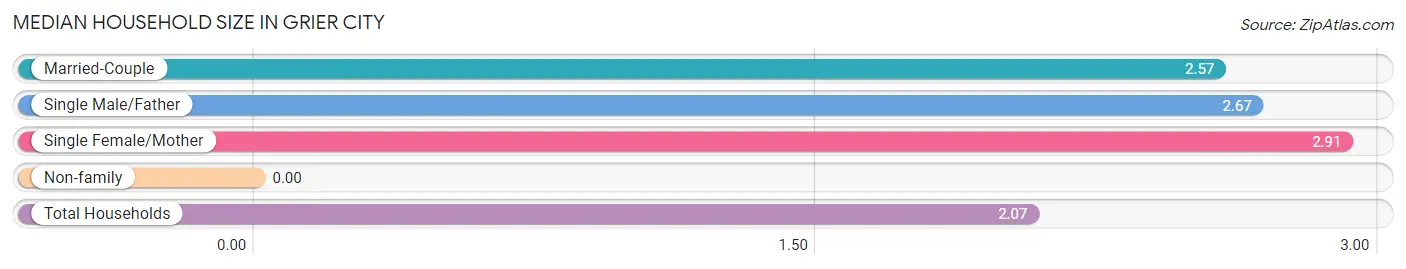
| Household Type | # Households | Household Size |
| Married-Couple | 63 (53.8%) | 2.57 |
| Single Male/Father | 3 (2.6%) | 2.67 |
| Single Female/Mother | 11 (9.4%) | 2.91 |
| Non-family | 40 (34.2%) | - |
| Total Households | 117 (100.0%) | 2.07 |
Household Size by Marriage Status in Grier City
Out of a total of 117 households in Grier City, 77 (65.8%) are family households, while 40 (34.2%) are nonfamily households. The most numerous type of family households are 2-person households, comprising 39, and the most common type of nonfamily households are 1-person households, comprising 40.
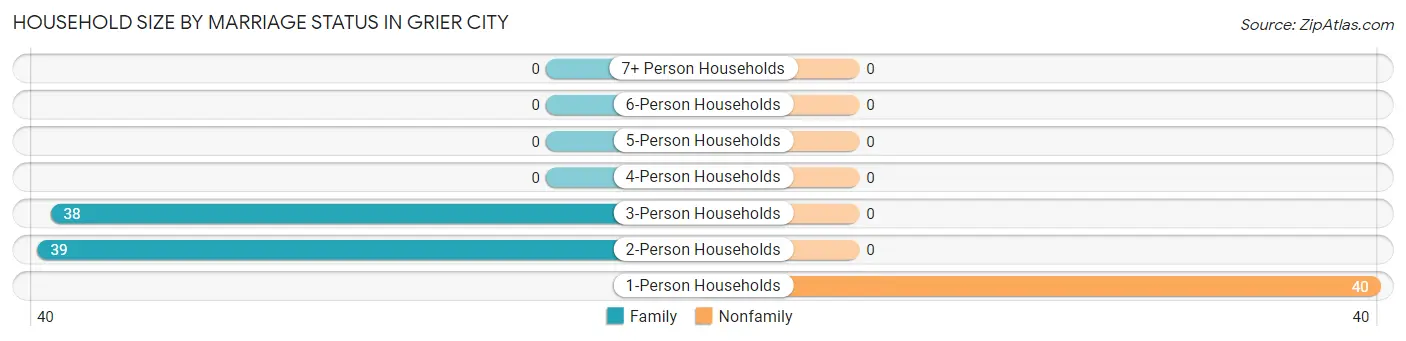
| Household Size | Family Households | Nonfamily Households |
| 1-Person Households | - | 40 (34.2%) |
| 2-Person Households | 39 (33.3%) | 0 (0.0%) |
| 3-Person Households | 38 (32.5%) | 0 (0.0%) |
| 4-Person Households | 0 (0.0%) | 0 (0.0%) |
| 5-Person Households | 0 (0.0%) | 0 (0.0%) |
| 6-Person Households | 0 (0.0%) | 0 (0.0%) |
| 7+ Person Households | 0 (0.0%) | 0 (0.0%) |
| Total | 77 (65.8%) | 40 (34.2%) |
Female Fertility in Grier City
Fertility by Age in Grier City
| Age Bracket | Women with Births | Births / 1,000 Women |
| 15 to 19 years | 0 (0.0%) | 0.0 |
| 20 to 34 years | 0 (0.0%) | 0.0 |
| 35 to 50 years | 0 (0.0%) | 0.0 |
| Total | 0 (0.0%) | 0.0 |
Fertility by Age by Marriage Status in Grier City
| Age Bracket | Married | Unmarried |
| 15 to 19 years | 0 (0.0%) | 0 (0.0%) |
| 20 to 34 years | 0 (0.0%) | 0 (0.0%) |
| 35 to 50 years | 0 (0.0%) | 0 (0.0%) |
| Total | 0 (0.0%) | 0 (0.0%) |
Fertility by Education in Grier City
| Educational Attainment | Women with Births | Births / 1,000 Women |
| Less than High School | 0 (0.0%) | 0.0 |
| High School Diploma | 0 (0.0%) | 0.0 |
| College or Associate's Degree | 0 (0.0%) | 0.0 |
| Bachelor's Degree | 0 (0.0%) | 0.0 |
| Graduate Degree | 0 (0.0%) | 0.0 |
| Total | 0 (0.0%) | 0.0 |
Fertility by Education by Marriage Status in Grier City
| Educational Attainment | Married | Unmarried |
| Less than High School | 0 (0.0%) | 0 (0.0%) |
| High School Diploma | 0 (0.0%) | 0 (0.0%) |
| College or Associate's Degree | 0 (0.0%) | 0 (0.0%) |
| Bachelor's Degree | 0 (0.0%) | 0 (0.0%) |
| Graduate Degree | 0 (0.0%) | 0 (0.0%) |
| Total | 0 (0.0%) | 0 (0.0%) |
Employment Characteristics in Grier City
Employment by Class of Employer in Grier City
Among the 161 employed individuals in Grier City, private company employees (120 | 74.5%), self-employed (not incorporated) (17 | 10.6%), and not-for-profit organizations (16 | 9.9%) make up the most common classes of employment.
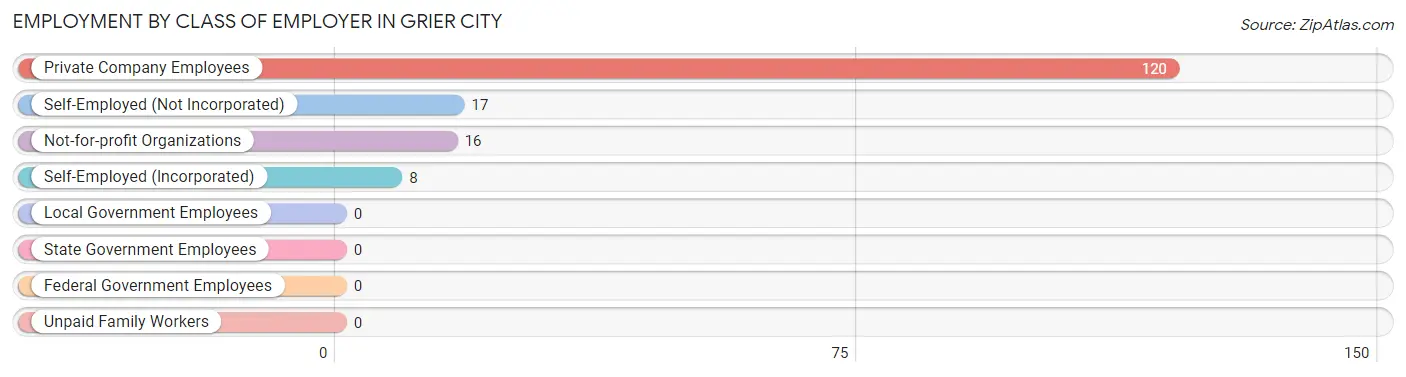
| Employer Class | # Employees | % Employees |
| Private Company Employees | 120 | 74.5% |
| Self-Employed (Incorporated) | 8 | 5.0% |
| Self-Employed (Not Incorporated) | 17 | 10.6% |
| Not-for-profit Organizations | 16 | 9.9% |
| Local Government Employees | 0 | 0.0% |
| State Government Employees | 0 | 0.0% |
| Federal Government Employees | 0 | 0.0% |
| Unpaid Family Workers | 0 | 0.0% |
| Total | 161 | 100.0% |
Employment Status by Age in Grier City
According to the labor force statistics for Grier City, out of the total population over 16 years of age (239), 74.9% or 179 individuals are in the labor force, with 10.1% or 18 of them unemployed. The age group with the highest labor force participation rate is 16 to 19 years, with 100.0% or 9 individuals in the labor force. Within the labor force, the 16 to 19 years age range has the highest percentage of unemployed individuals, with 100.0% or 9 of them being unemployed.
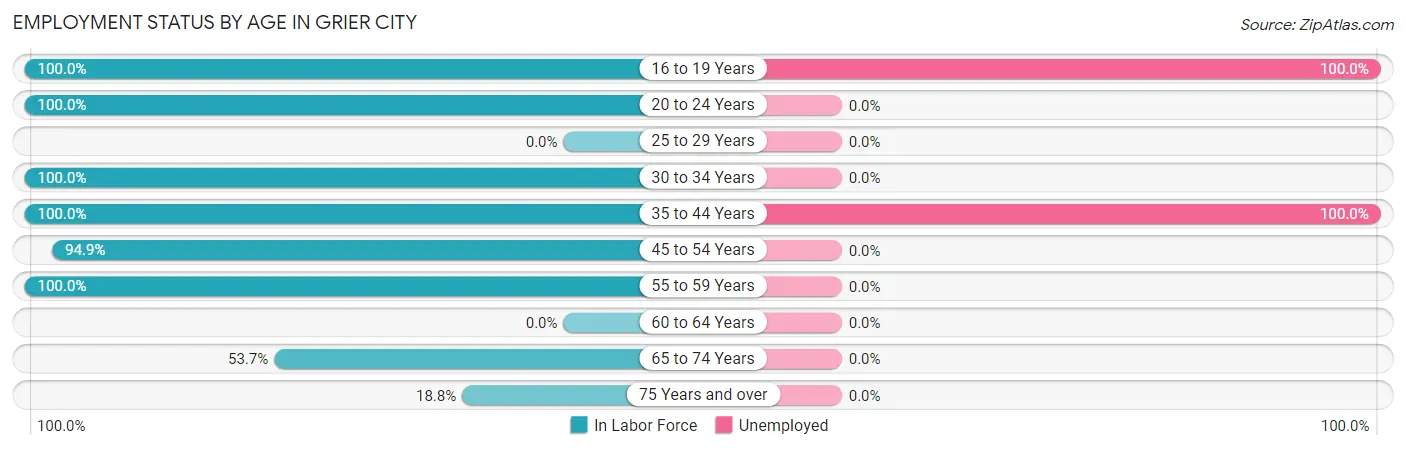
| Age Bracket | In Labor Force | Unemployed |
| 16 to 19 Years | 9 (100.0%) | 9 (100.0%) |
| 20 to 24 Years | 35 (100.0%) | 0 (0.0%) |
| 25 to 29 Years | 0 (0.0%) | 0 (0.0%) |
| 30 to 34 Years | 17 (100.0%) | 0 (0.0%) |
| 35 to 44 Years | 9 (100.0%) | 9 (100.0%) |
| 45 to 54 Years | 56 (94.9%) | 0 (0.0%) |
| 55 to 59 Years | 11 (100.0%) | 0 (0.0%) |
| 60 to 64 Years | 0 (0.0%) | 0 (0.0%) |
| 65 to 74 Years | 36 (53.7%) | 0 (0.0%) |
| 75 Years and over | 6 (18.8%) | 0 (0.0%) |
| Total | 179 (74.9%) | 18 (10.1%) |
Employment Status by Educational Attainment in Grier City
According to labor force statistics for Grier City, 96.9% of individuals (93) out of the total population between 25 and 64 years of age (96) are in the labor force, with 9.7% or 9 of them being unemployed. The group with the highest labor force participation rate are those with the educational attainment of college / associate degree, with 100.0% or 65 individuals in the labor force. Within the labor force, individuals with college / associate degree education have the highest percentage of unemployment, with 13.8% or 9 of them being unemployed.
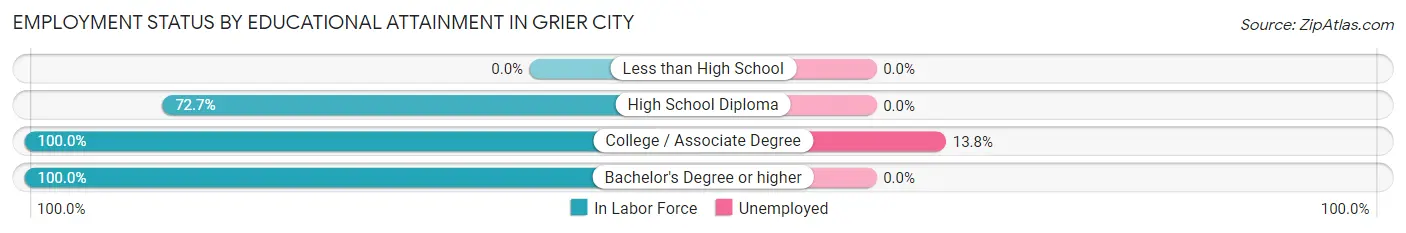
| Educational Attainment | In Labor Force | Unemployed |
| Less than High School | 0 (0.0%) | 0 (0.0%) |
| High School Diploma | 8 (72.7%) | 0 (0.0%) |
| College / Associate Degree | 65 (100.0%) | 9 (13.8%) |
| Bachelor's Degree or higher | 20 (100.0%) | 0 (0.0%) |
| Total | 93 (96.9%) | 9 (9.7%) |
Employment Occupations by Sex in Grier City
Management, Business, Science and Arts Occupations
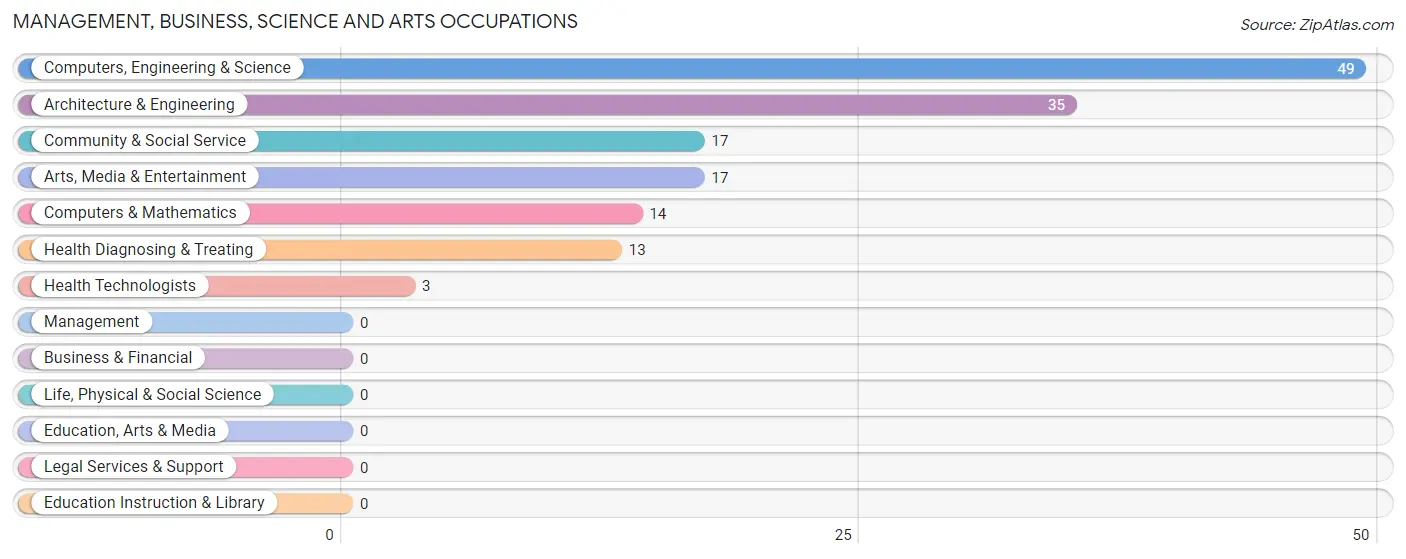
The most common Management, Business, Science and Arts occupations in Grier City are Computers, Engineering & Science (49 | 30.4%), Architecture & Engineering (35 | 21.7%), Community & Social Service (17 | 10.6%), Arts, Media & Entertainment (17 | 10.6%), and Computers & Mathematics (14 | 8.7%).
Management, Business, Science and Arts Occupations by Sex
Within the Management, Business, Science and Arts occupations in Grier City, the most male-oriented occupations are Computers, Engineering & Science (100.0%), Computers & Mathematics (100.0%), and Architecture & Engineering (100.0%), while the most female-oriented occupations are Community & Social Service (100.0%), Arts, Media & Entertainment (100.0%), and Health Technologists (100.0%).
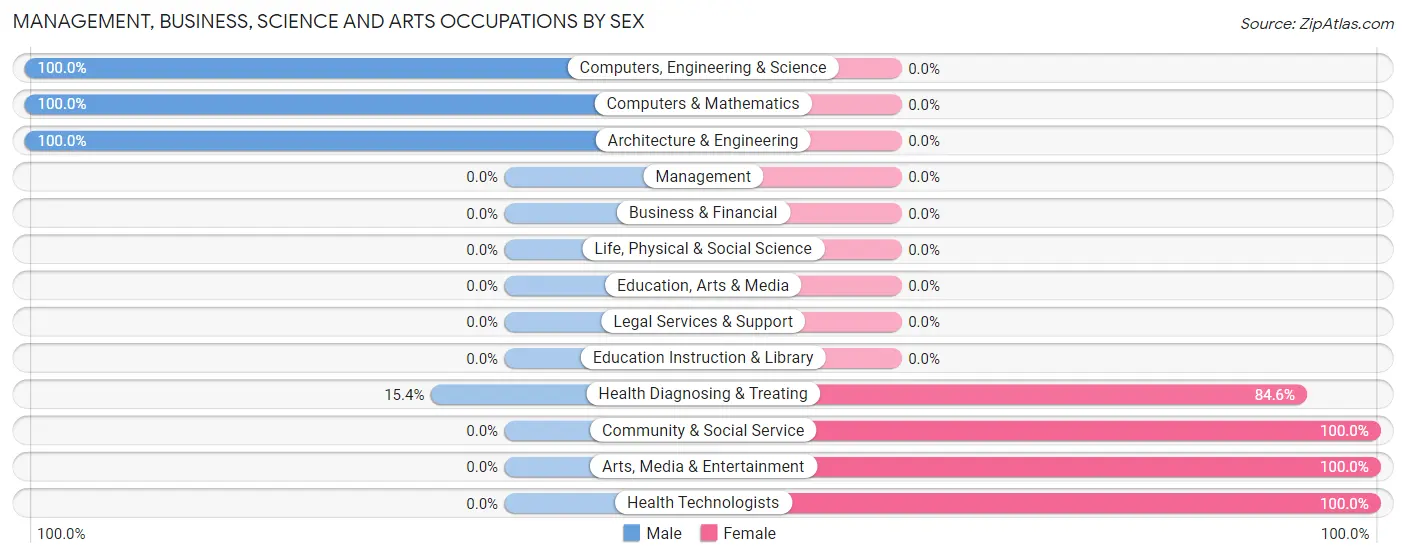
| Occupation | Male | Female |
| Management | 0 (0.0%) | 0 (0.0%) |
| Business & Financial | 0 (0.0%) | 0 (0.0%) |
| Computers, Engineering & Science | 49 (100.0%) | 0 (0.0%) |
| Computers & Mathematics | 14 (100.0%) | 0 (0.0%) |
| Architecture & Engineering | 35 (100.0%) | 0 (0.0%) |
| Life, Physical & Social Science | 0 (0.0%) | 0 (0.0%) |
| Community & Social Service | 0 (0.0%) | 17 (100.0%) |
| Education, Arts & Media | 0 (0.0%) | 0 (0.0%) |
| Legal Services & Support | 0 (0.0%) | 0 (0.0%) |
| Education Instruction & Library | 0 (0.0%) | 0 (0.0%) |
| Arts, Media & Entertainment | 0 (0.0%) | 17 (100.0%) |
| Health Diagnosing & Treating | 2 (15.4%) | 11 (84.6%) |
| Health Technologists | 0 (0.0%) | 3 (100.0%) |
| Total (Category) | 51 (64.6%) | 28 (35.4%) |
| Total (Overall) | 98 (60.9%) | 63 (39.1%) |
Services Occupations
The most common Services occupations in Grier City are , and Cleaning & Maintenance (14 | 8.7%).
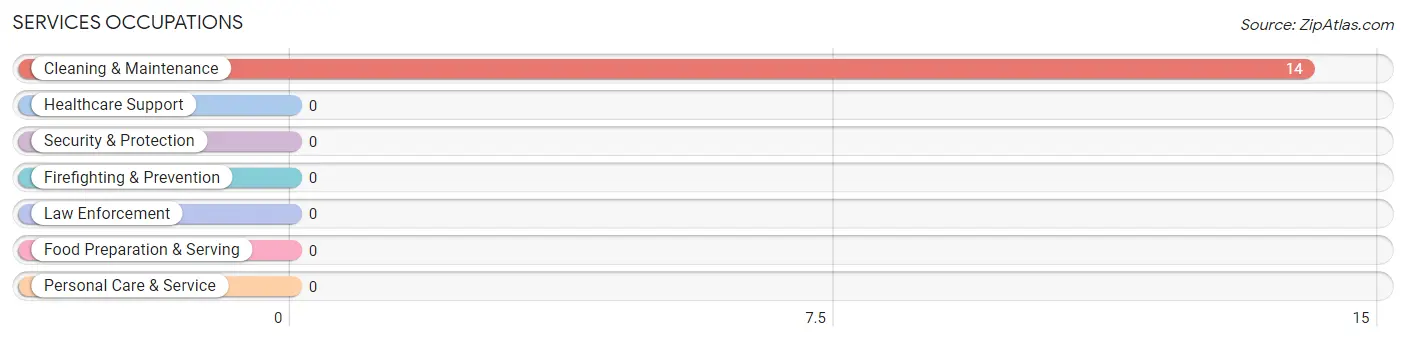
Services Occupations by Sex
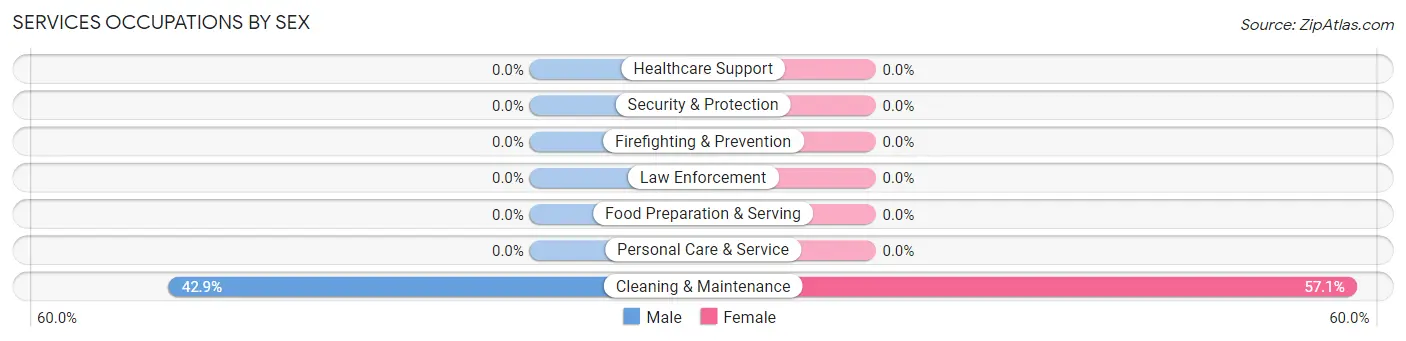
| Occupation | Male | Female |
| Healthcare Support | 0 (0.0%) | 0 (0.0%) |
| Security & Protection | 0 (0.0%) | 0 (0.0%) |
| Firefighting & Prevention | 0 (0.0%) | 0 (0.0%) |
| Law Enforcement | 0 (0.0%) | 0 (0.0%) |
| Food Preparation & Serving | 0 (0.0%) | 0 (0.0%) |
| Cleaning & Maintenance | 6 (42.9%) | 8 (57.1%) |
| Personal Care & Service | 0 (0.0%) | 0 (0.0%) |
| Total (Category) | 6 (42.9%) | 8 (57.1%) |
| Total (Overall) | 98 (60.9%) | 63 (39.1%) |
Sales and Office Occupations
The most common Sales and Office occupations in Grier City are , and Office & Administration (25 | 15.5%).
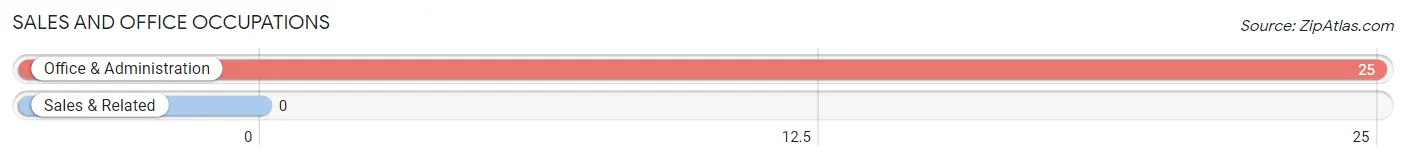
Sales and Office Occupations by Sex

| Occupation | Male | Female |
| Sales & Related | 0 (0.0%) | 0 (0.0%) |
| Office & Administration | 0 (0.0%) | 25 (100.0%) |
| Total (Category) | 0 (0.0%) | 25 (100.0%) |
| Total (Overall) | 98 (60.9%) | 63 (39.1%) |
Natural Resources, Construction and Maintenance Occupations

Natural Resources, Construction and Maintenance Occupations by Sex

| Occupation | Male | Female |
| Farming, Fishing & Forestry | 0 (0.0%) | 0 (0.0%) |
| Construction & Extraction | 0 (0.0%) | 0 (0.0%) |
| Installation, Maintenance & Repair | 0 (0.0%) | 0 (0.0%) |
| Total (Category) | 0 (0.0%) | 0 (0.0%) |
| Total (Overall) | 98 (60.9%) | 63 (39.1%) |
Production, Transportation and Moving Occupations
The most common Production, Transportation and Moving occupations in Grier City are Production (41 | 25.5%), and Material Moving (2 | 1.2%).

Production, Transportation and Moving Occupations by Sex
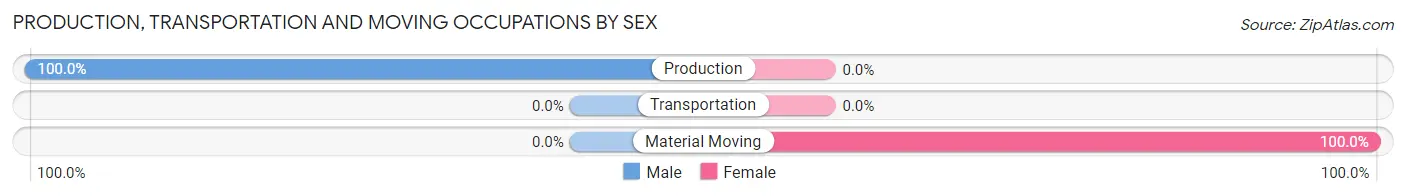
| Occupation | Male | Female |
| Production | 41 (100.0%) | 0 (0.0%) |
| Transportation | 0 (0.0%) | 0 (0.0%) |
| Material Moving | 0 (0.0%) | 2 (100.0%) |
| Total (Category) | 41 (95.4%) | 2 (4.6%) |
| Total (Overall) | 98 (60.9%) | 63 (39.1%) |
Employment Industries by Sex in Grier City
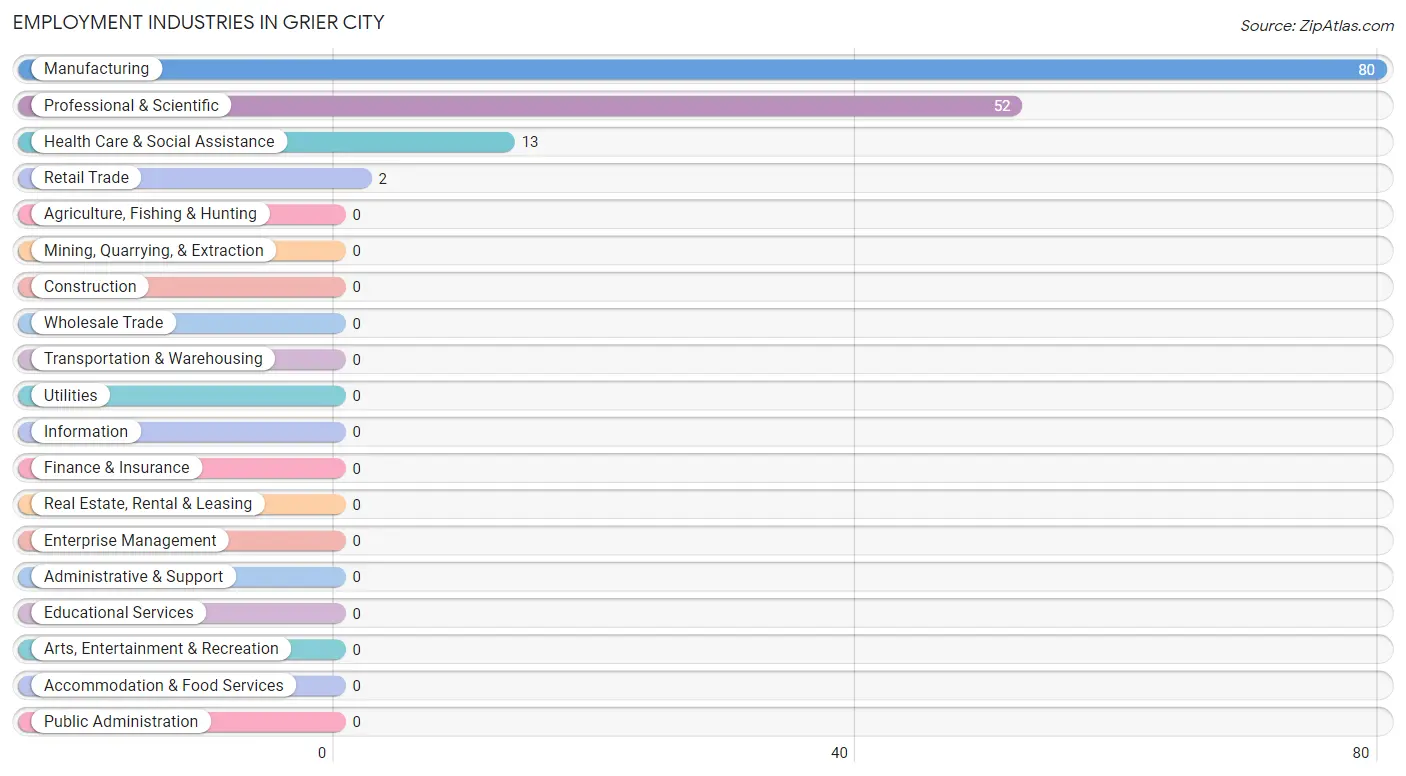
Employment Industries in Grier City
The major employment industries in Grier City include Manufacturing (80 | 49.7%), Professional & Scientific (52 | 32.3%), Health Care & Social Assistance (13 | 8.1%), and Retail Trade (2 | 1.2%).
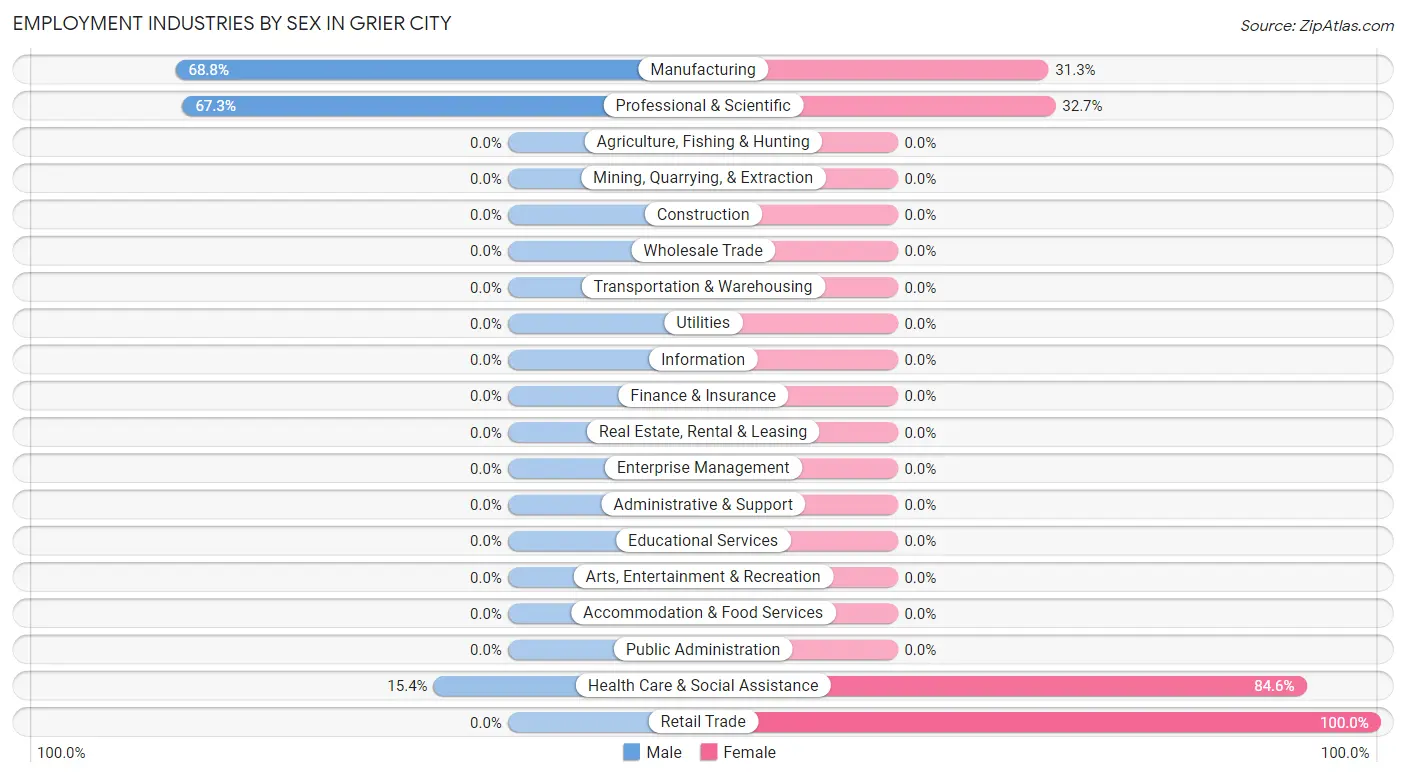
Employment Industries by Sex in Grier City
The Grier City industries that see more men than women are Manufacturing (68.8%), Professional & Scientific (67.3%), and Health Care & Social Assistance (15.4%), whereas the industries that tend to have a higher number of women are Retail Trade (100.0%), Health Care & Social Assistance (84.6%), and Professional & Scientific (32.7%).
| Industry | Male | Female |
| Agriculture, Fishing & Hunting | 0 (0.0%) | 0 (0.0%) |
| Mining, Quarrying, & Extraction | 0 (0.0%) | 0 (0.0%) |
| Construction | 0 (0.0%) | 0 (0.0%) |
| Manufacturing | 55 (68.8%) | 25 (31.2%) |
| Wholesale Trade | 0 (0.0%) | 0 (0.0%) |
| Retail Trade | 0 (0.0%) | 2 (100.0%) |
| Transportation & Warehousing | 0 (0.0%) | 0 (0.0%) |
| Utilities | 0 (0.0%) | 0 (0.0%) |
| Information | 0 (0.0%) | 0 (0.0%) |
| Finance & Insurance | 0 (0.0%) | 0 (0.0%) |
| Real Estate, Rental & Leasing | 0 (0.0%) | 0 (0.0%) |
| Professional & Scientific | 35 (67.3%) | 17 (32.7%) |
| Enterprise Management | 0 (0.0%) | 0 (0.0%) |
| Administrative & Support | 0 (0.0%) | 0 (0.0%) |
| Educational Services | 0 (0.0%) | 0 (0.0%) |
| Health Care & Social Assistance | 2 (15.4%) | 11 (84.6%) |
| Arts, Entertainment & Recreation | 0 (0.0%) | 0 (0.0%) |
| Accommodation & Food Services | 0 (0.0%) | 0 (0.0%) |
| Public Administration | 0 (0.0%) | 0 (0.0%) |
| Total | 98 (60.9%) | 63 (39.1%) |
Education in Grier City
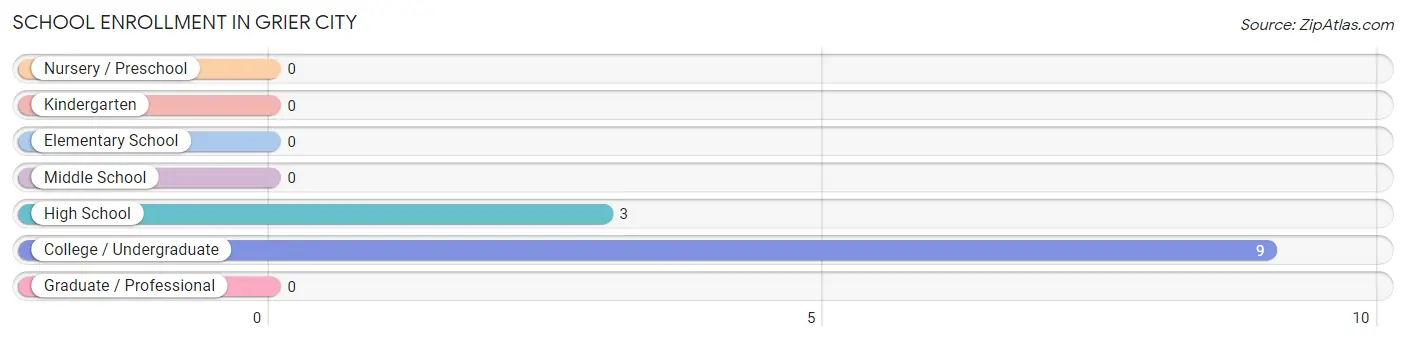
School Enrollment in Grier City
The most common levels of schooling among the 12 students in Grier City are college / undergraduate (9 | 75.0%), and high school (3 | 25.0%).
| School Level | # Students | % Students |
| Nursery / Preschool | 0 | 0.0% |
| Kindergarten | 0 | 0.0% |
| Elementary School | 0 | 0.0% |
| Middle School | 0 | 0.0% |
| High School | 3 | 25.0% |
| College / Undergraduate | 9 | 75.0% |
| Graduate / Professional | 0 | 0.0% |
| Total | 12 | 100.0% |
School Enrollment by Age by Funding Source in Grier City
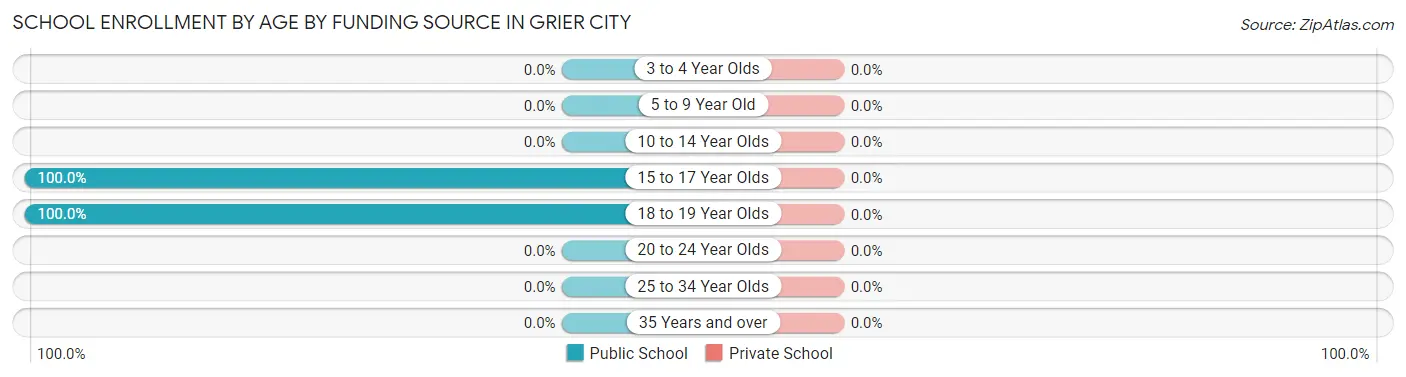
| Age Bracket | Public School | Private School |
| 3 to 4 Year Olds | 0 (0.0%) | 0 (0.0%) |
| 5 to 9 Year Old | 0 (0.0%) | 0 (0.0%) |
| 10 to 14 Year Olds | 0 (0.0%) | 0 (0.0%) |
| 15 to 17 Year Olds | 3 (100.0%) | 0 (0.0%) |
| 18 to 19 Year Olds | 9 (100.0%) | 0 (0.0%) |
| 20 to 24 Year Olds | 0 (0.0%) | 0 (0.0%) |
| 25 to 34 Year Olds | 0 (0.0%) | 0 (0.0%) |
| 35 Years and over | 0 (0.0%) | 0 (0.0%) |
| Total | 12 (100.0%) | 0 (0.0%) |
Educational Attainment by Field of Study in Grier City
Business (17 | 33.3%), physical & health sciences (14 | 27.5%), literature & languages (14 | 27.5%), science & technology (3 | 5.9%), and education (3 | 5.9%) are the most common fields of study among 51 individuals in Grier City who have obtained a bachelor's degree or higher.
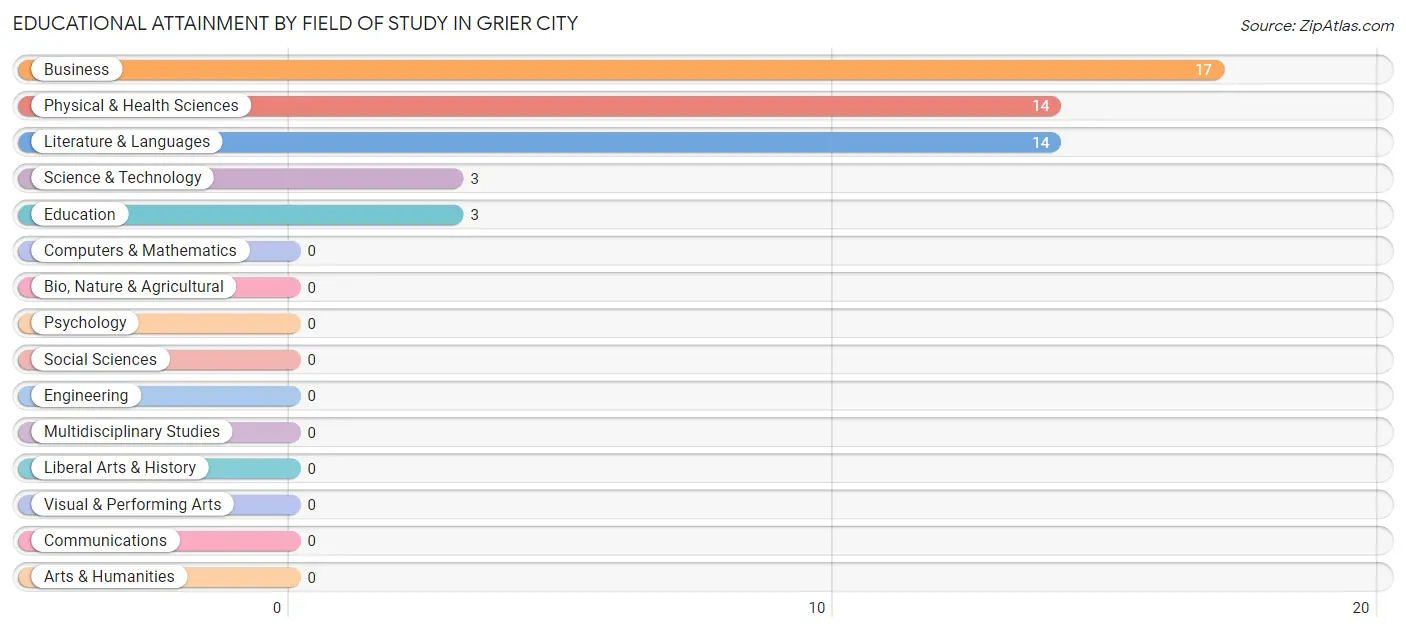
| Field of Study | # Graduates | % Graduates |
| Computers & Mathematics | 0 | 0.0% |
| Bio, Nature & Agricultural | 0 | 0.0% |
| Physical & Health Sciences | 14 | 27.5% |
| Psychology | 0 | 0.0% |
| Social Sciences | 0 | 0.0% |
| Engineering | 0 | 0.0% |
| Multidisciplinary Studies | 0 | 0.0% |
| Science & Technology | 3 | 5.9% |
| Business | 17 | 33.3% |
| Education | 3 | 5.9% |
| Literature & Languages | 14 | 27.5% |
| Liberal Arts & History | 0 | 0.0% |
| Visual & Performing Arts | 0 | 0.0% |
| Communications | 0 | 0.0% |
| Arts & Humanities | 0 | 0.0% |
| Total | 51 | 100.0% |
Transportation & Commute in Grier City
Vehicle Availability by Sex in Grier City
The most prevalent vehicle ownership categories in Grier City are males with 3 vehicles (76, accounting for 77.5%) and females with 3 vehicles (33, making up 120.6%).
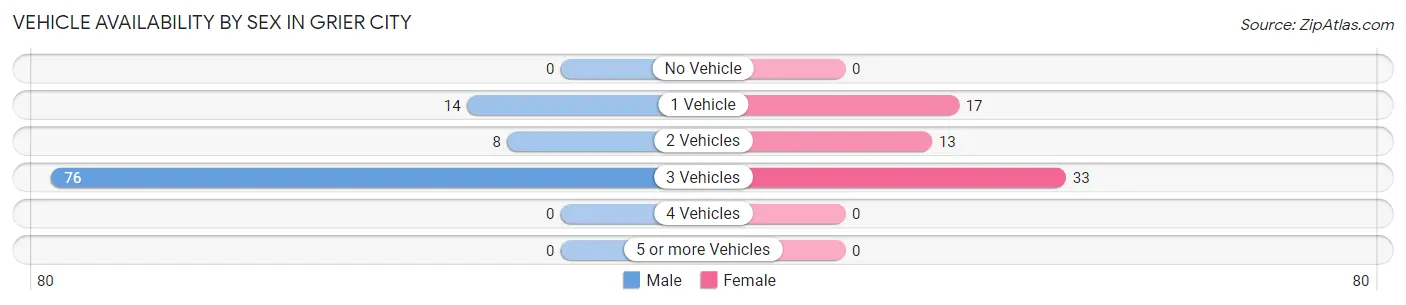
| Vehicles Available | Male | Female |
| No Vehicle | 0 (0.0%) | 0 (0.0%) |
| 1 Vehicle | 14 (14.3%) | 17 (27.0%) |
| 2 Vehicles | 8 (8.2%) | 13 (20.6%) |
| 3 Vehicles | 76 (77.5%) | 33 (52.4%) |
| 4 Vehicles | 0 (0.0%) | 0 (0.0%) |
| 5 or more Vehicles | 0 (0.0%) | 0 (0.0%) |
| Total | 98 (100.0%) | 63 (100.0%) |
Commute Time in Grier City
The most frequently occuring commute durations in Grier City are 20 to 24 minutes (51 commuters, 39.2%), 15 to 19 minutes (27 commuters, 20.8%), and 5 to 9 minutes (25 commuters, 19.2%).
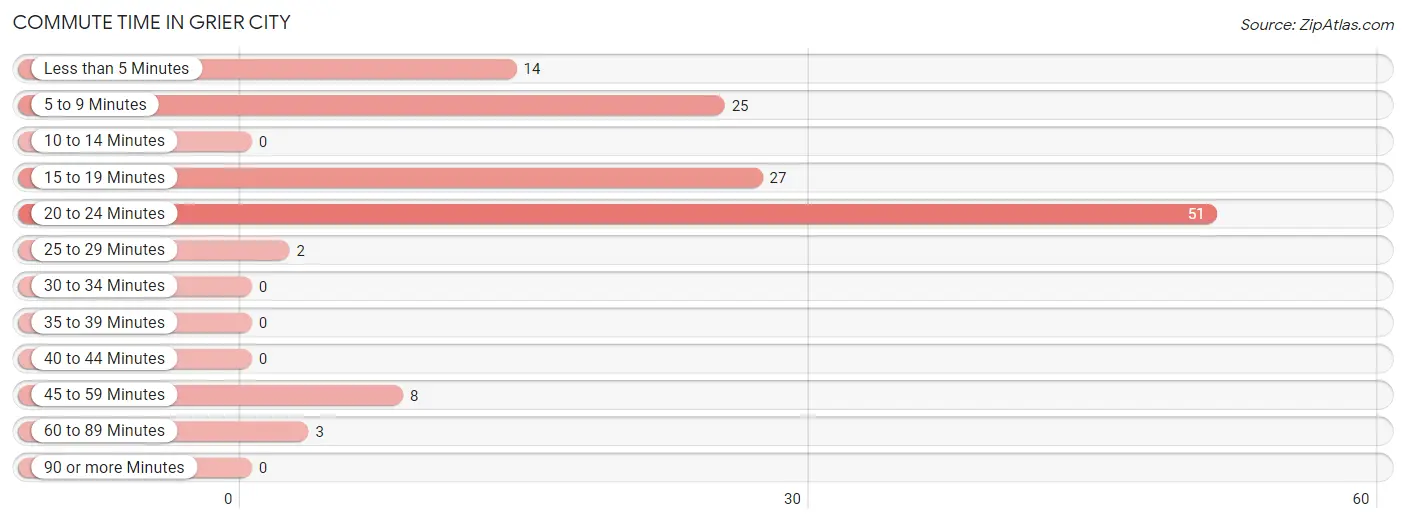
| Commute Time | # Commuters | % Commuters |
| Less than 5 Minutes | 14 | 10.8% |
| 5 to 9 Minutes | 25 | 19.2% |
| 10 to 14 Minutes | 0 | 0.0% |
| 15 to 19 Minutes | 27 | 20.8% |
| 20 to 24 Minutes | 51 | 39.2% |
| 25 to 29 Minutes | 2 | 1.5% |
| 30 to 34 Minutes | 0 | 0.0% |
| 35 to 39 Minutes | 0 | 0.0% |
| 40 to 44 Minutes | 0 | 0.0% |
| 45 to 59 Minutes | 8 | 6.1% |
| 60 to 89 Minutes | 3 | 2.3% |
| 90 or more Minutes | 0 | 0.0% |
Commute Time by Sex in Grier City
The most common commute times in Grier City are 20 to 24 minutes (51 commuters, 60.7%) for males and 5 to 9 minutes (25 commuters, 54.3%) for females.
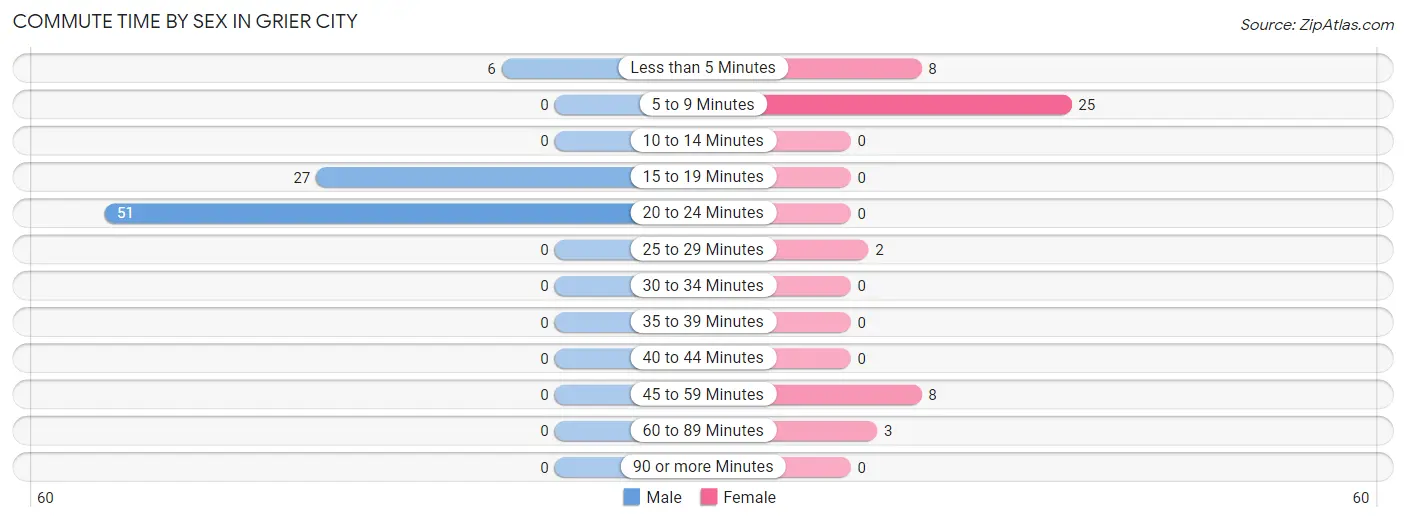
| Commute Time | Male | Female |
| Less than 5 Minutes | 6 (7.1%) | 8 (17.4%) |
| 5 to 9 Minutes | 0 (0.0%) | 25 (54.3%) |
| 10 to 14 Minutes | 0 (0.0%) | 0 (0.0%) |
| 15 to 19 Minutes | 27 (32.1%) | 0 (0.0%) |
| 20 to 24 Minutes | 51 (60.7%) | 0 (0.0%) |
| 25 to 29 Minutes | 0 (0.0%) | 2 (4.3%) |
| 30 to 34 Minutes | 0 (0.0%) | 0 (0.0%) |
| 35 to 39 Minutes | 0 (0.0%) | 0 (0.0%) |
| 40 to 44 Minutes | 0 (0.0%) | 0 (0.0%) |
| 45 to 59 Minutes | 0 (0.0%) | 8 (17.4%) |
| 60 to 89 Minutes | 0 (0.0%) | 3 (6.5%) |
| 90 or more Minutes | 0 (0.0%) | 0 (0.0%) |
Time of Departure to Work by Sex in Grier City
The most frequent times of departure to work in Grier City are 7:00 AM to 7:29 AM (62, 73.8%) for males and 9:00 AM to 9:59 AM (25, 54.3%) for females.
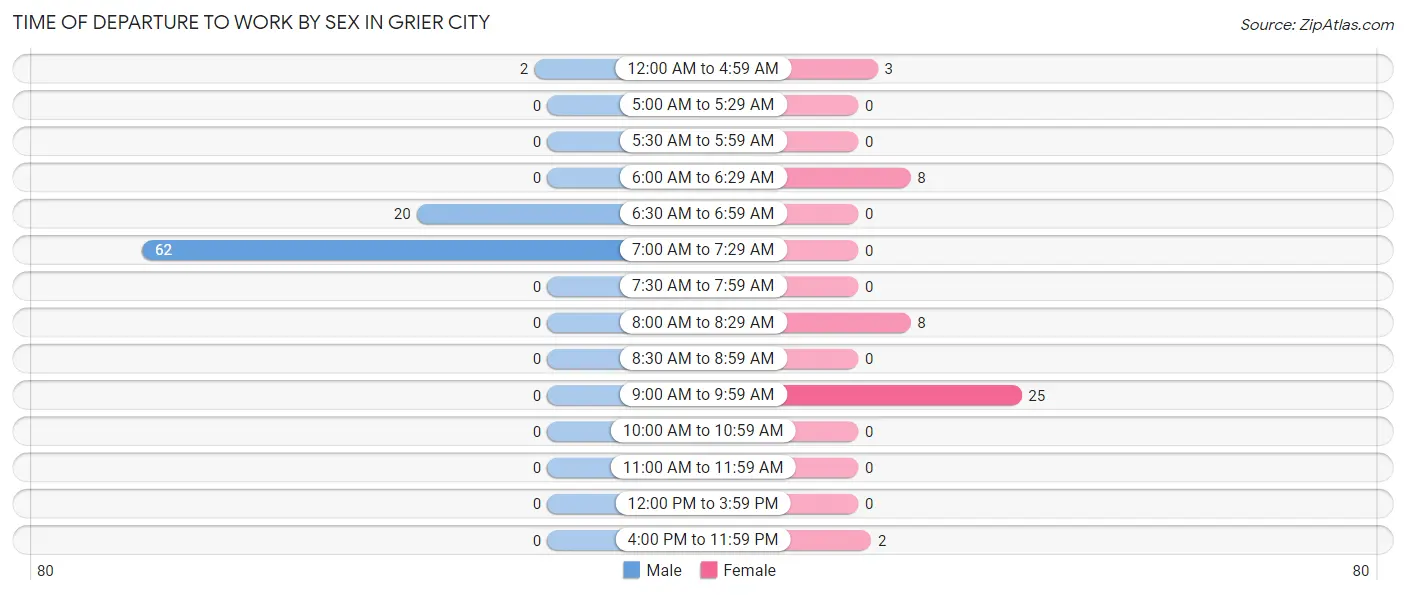
| Time of Departure | Male | Female |
| 12:00 AM to 4:59 AM | 2 (2.4%) | 3 (6.5%) |
| 5:00 AM to 5:29 AM | 0 (0.0%) | 0 (0.0%) |
| 5:30 AM to 5:59 AM | 0 (0.0%) | 0 (0.0%) |
| 6:00 AM to 6:29 AM | 0 (0.0%) | 8 (17.4%) |
| 6:30 AM to 6:59 AM | 20 (23.8%) | 0 (0.0%) |
| 7:00 AM to 7:29 AM | 62 (73.8%) | 0 (0.0%) |
| 7:30 AM to 7:59 AM | 0 (0.0%) | 0 (0.0%) |
| 8:00 AM to 8:29 AM | 0 (0.0%) | 8 (17.4%) |
| 8:30 AM to 8:59 AM | 0 (0.0%) | 0 (0.0%) |
| 9:00 AM to 9:59 AM | 0 (0.0%) | 25 (54.3%) |
| 10:00 AM to 10:59 AM | 0 (0.0%) | 0 (0.0%) |
| 11:00 AM to 11:59 AM | 0 (0.0%) | 0 (0.0%) |
| 12:00 PM to 3:59 PM | 0 (0.0%) | 0 (0.0%) |
| 4:00 PM to 11:59 PM | 0 (0.0%) | 2 (4.3%) |
| Total | 84 (100.0%) | 46 (100.0%) |
Housing Occupancy in Grier City
Occupancy by Ownership in Grier City
Of the total 117 dwellings in Grier City, owner-occupied units account for 109 (93.2%), while renter-occupied units make up 8 (6.8%).
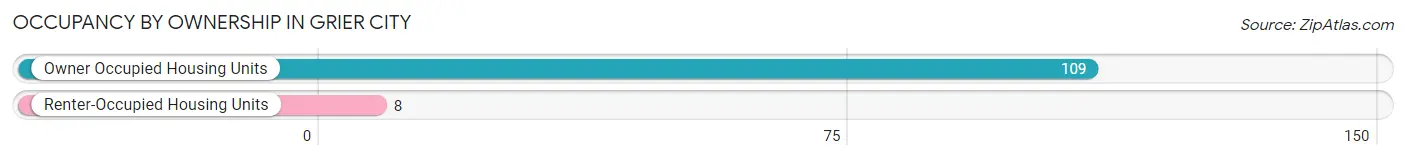
| Occupancy | # Housing Units | % Housing Units |
| Owner Occupied Housing Units | 109 | 93.2% |
| Renter-Occupied Housing Units | 8 | 6.8% |
| Total Occupied Housing Units | 117 | 100.0% |
Occupancy by Household Size in Grier City
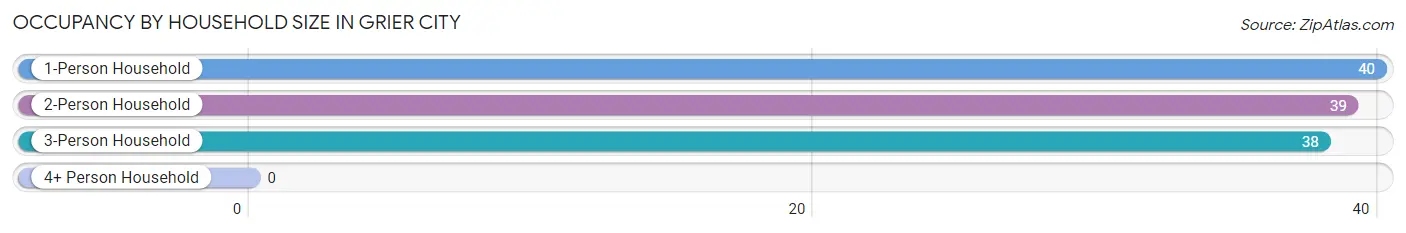
| Household Size | # Housing Units | % Housing Units |
| 1-Person Household | 40 | 34.2% |
| 2-Person Household | 39 | 33.3% |
| 3-Person Household | 38 | 32.5% |
| 4+ Person Household | 0 | 0.0% |
| Total Housing Units | 117 | 100.0% |
Occupancy by Ownership by Household Size in Grier City
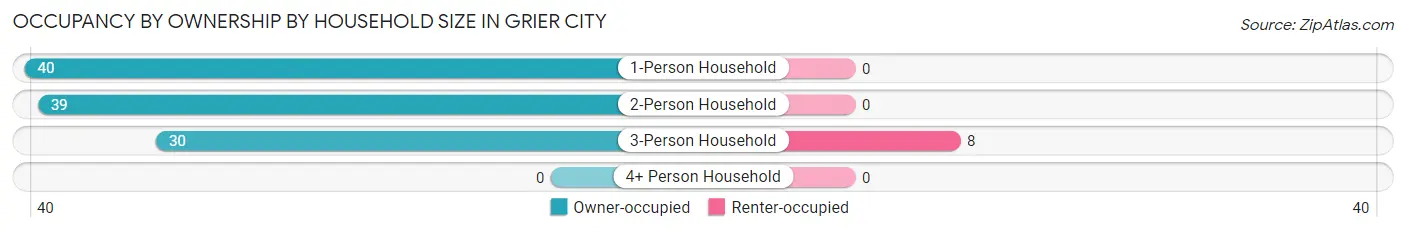
| Household Size | Owner-occupied | Renter-occupied |
| 1-Person Household | 40 (100.0%) | 0 (0.0%) |
| 2-Person Household | 39 (100.0%) | 0 (0.0%) |
| 3-Person Household | 30 (78.9%) | 8 (21.0%) |
| 4+ Person Household | 0 (0.0%) | 0 (0.0%) |
| Total Housing Units | 109 (93.2%) | 8 (6.8%) |
Occupancy by Educational Attainment in Grier City
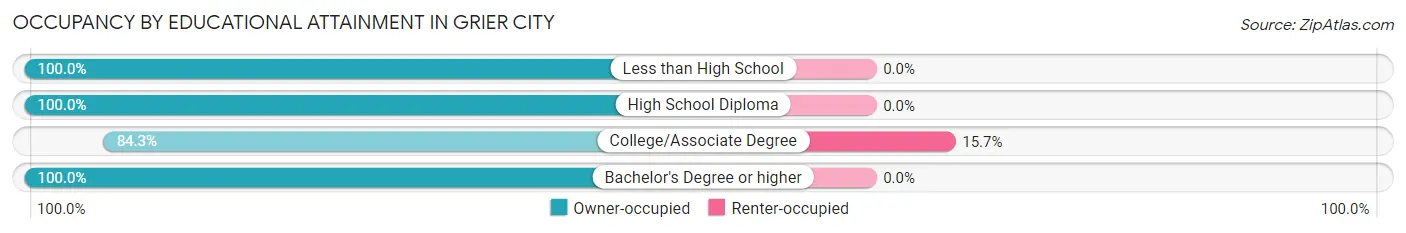
| Household Size | Owner-occupied | Renter-occupied |
| Less than High School | 4 (100.0%) | 0 (0.0%) |
| High School Diploma | 28 (100.0%) | 0 (0.0%) |
| College/Associate Degree | 43 (84.3%) | 8 (15.7%) |
| Bachelor's Degree or higher | 34 (100.0%) | 0 (0.0%) |
Occupancy by Age of Householder in Grier City
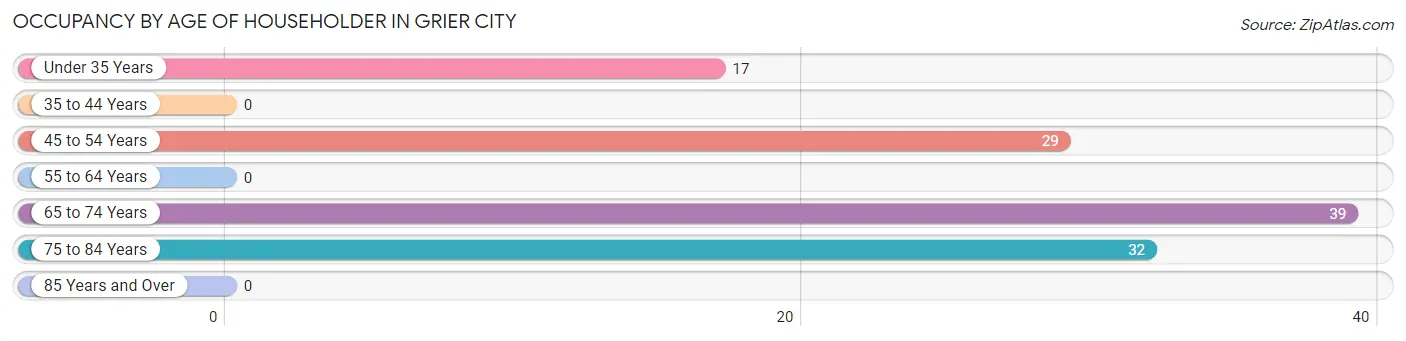
| Age Bracket | # Households | % Households |
| Under 35 Years | 17 | 14.5% |
| 35 to 44 Years | 0 | 0.0% |
| 45 to 54 Years | 29 | 24.8% |
| 55 to 64 Years | 0 | 0.0% |
| 65 to 74 Years | 39 | 33.3% |
| 75 to 84 Years | 32 | 27.4% |
| 85 Years and Over | 0 | 0.0% |
| Total | 117 | 100.0% |
Housing Finances in Grier City
Median Income by Occupancy in Grier City
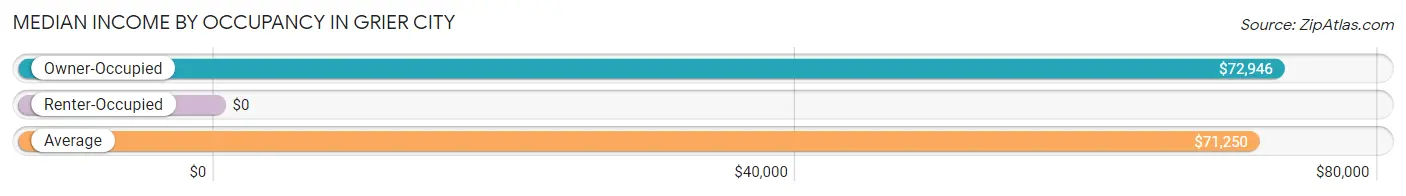
| Occupancy Type | # Households | Median Income |
| Owner-Occupied | 109 (93.2%) | $72,946 |
| Renter-Occupied | 8 (6.8%) | $0 |
| Average | 117 (100.0%) | $71,250 |
Occupancy by Householder Income Bracket in Grier City
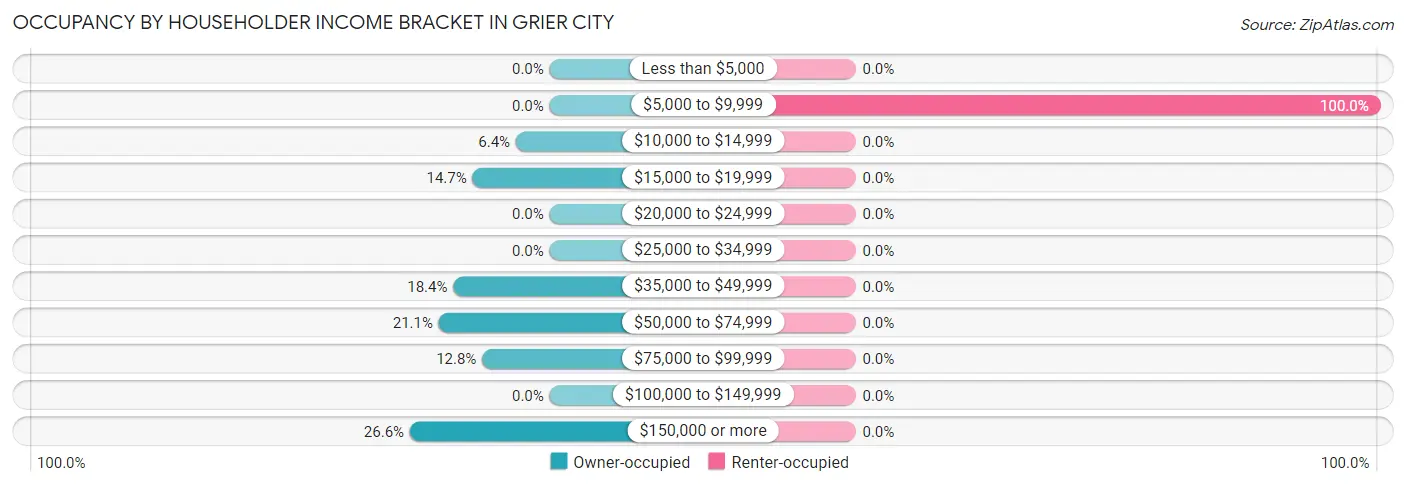
| Income Bracket | Owner-occupied | Renter-occupied |
| Less than $5,000 | 0 (0.0%) | 0 (0.0%) |
| $5,000 to $9,999 | 0 (0.0%) | 8 (100.0%) |
| $10,000 to $14,999 | 7 (6.4%) | 0 (0.0%) |
| $15,000 to $19,999 | 16 (14.7%) | 0 (0.0%) |
| $20,000 to $24,999 | 0 (0.0%) | 0 (0.0%) |
| $25,000 to $34,999 | 0 (0.0%) | 0 (0.0%) |
| $35,000 to $49,999 | 20 (18.3%) | 0 (0.0%) |
| $50,000 to $74,999 | 23 (21.1%) | 0 (0.0%) |
| $75,000 to $99,999 | 14 (12.8%) | 0 (0.0%) |
| $100,000 to $149,999 | 0 (0.0%) | 0 (0.0%) |
| $150,000 or more | 29 (26.6%) | 0 (0.0%) |
| Total | 109 (100.0%) | 8 (100.0%) |
Monthly Housing Cost Tiers in Grier City
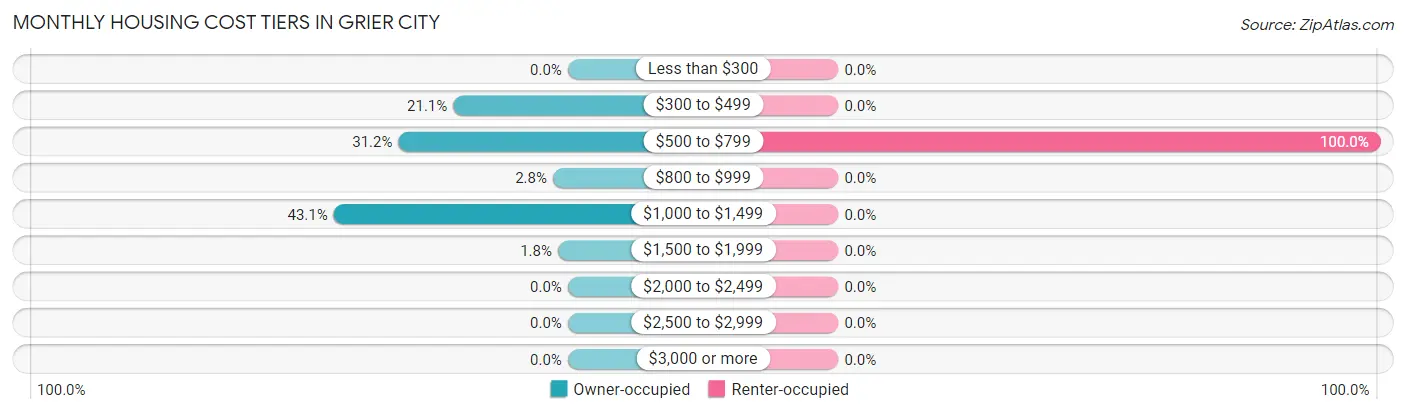
| Monthly Cost | Owner-occupied | Renter-occupied |
| Less than $300 | 0 (0.0%) | 0 (0.0%) |
| $300 to $499 | 23 (21.1%) | 0 (0.0%) |
| $500 to $799 | 34 (31.2%) | 8 (100.0%) |
| $800 to $999 | 3 (2.8%) | 0 (0.0%) |
| $1,000 to $1,499 | 47 (43.1%) | 0 (0.0%) |
| $1,500 to $1,999 | 2 (1.8%) | 0 (0.0%) |
| $2,000 to $2,499 | 0 (0.0%) | 0 (0.0%) |
| $2,500 to $2,999 | 0 (0.0%) | 0 (0.0%) |
| $3,000 or more | 0 (0.0%) | 0 (0.0%) |
| Total | 109 (100.0%) | 8 (100.0%) |
Physical Housing Characteristics in Grier City
Housing Structures in Grier City
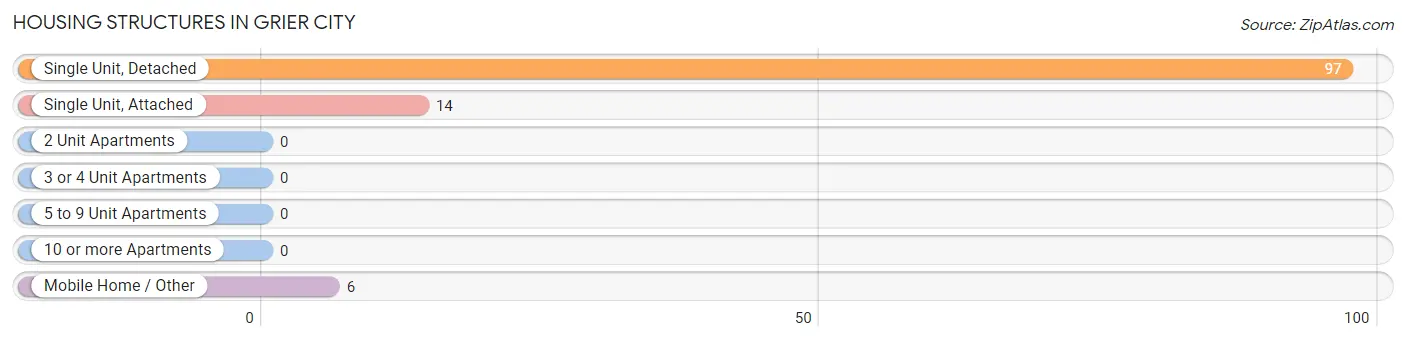
| Structure Type | # Housing Units | % Housing Units |
| Single Unit, Detached | 97 | 82.9% |
| Single Unit, Attached | 14 | 12.0% |
| 2 Unit Apartments | 0 | 0.0% |
| 3 or 4 Unit Apartments | 0 | 0.0% |
| 5 to 9 Unit Apartments | 0 | 0.0% |
| 10 or more Apartments | 0 | 0.0% |
| Mobile Home / Other | 6 | 5.1% |
| Total | 117 | 100.0% |
Housing Structures by Occupancy in Grier City
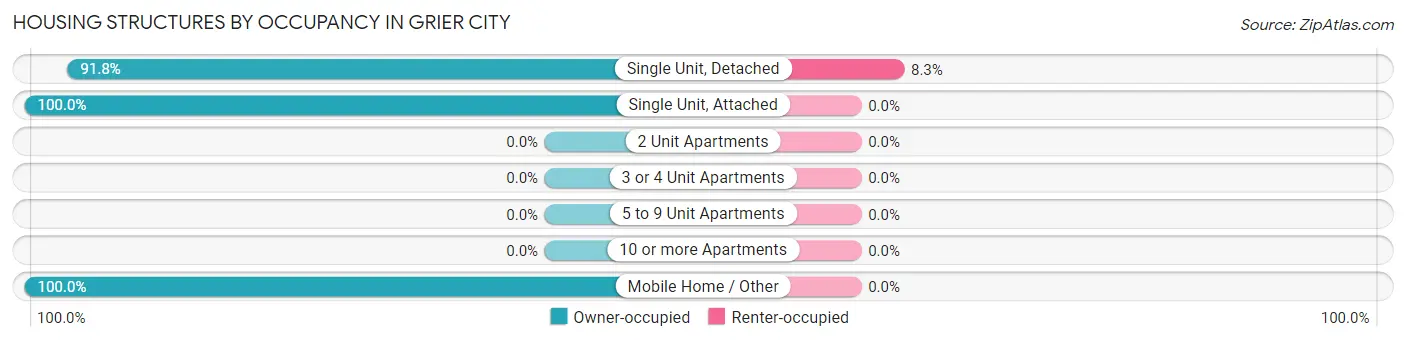
| Structure Type | Owner-occupied | Renter-occupied |
| Single Unit, Detached | 89 (91.7%) | 8 (8.3%) |
| Single Unit, Attached | 14 (100.0%) | 0 (0.0%) |
| 2 Unit Apartments | 0 (0.0%) | 0 (0.0%) |
| 3 or 4 Unit Apartments | 0 (0.0%) | 0 (0.0%) |
| 5 to 9 Unit Apartments | 0 (0.0%) | 0 (0.0%) |
| 10 or more Apartments | 0 (0.0%) | 0 (0.0%) |
| Mobile Home / Other | 6 (100.0%) | 0 (0.0%) |
| Total | 109 (93.2%) | 8 (6.8%) |
Housing Structures by Number of Rooms in Grier City
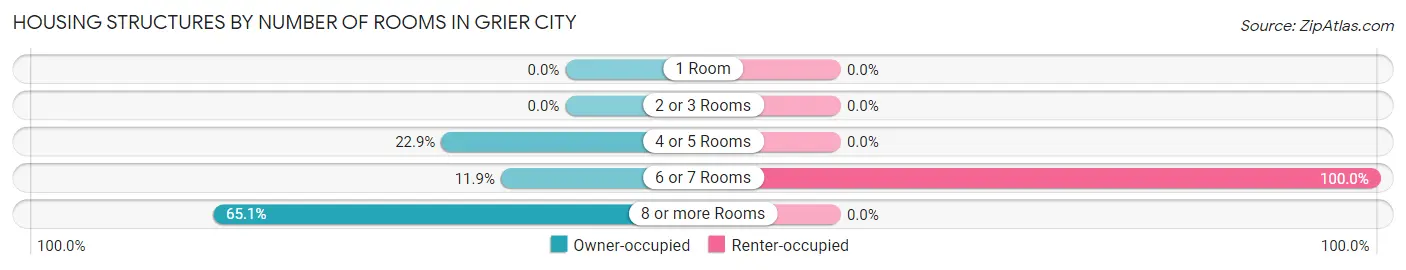
| Number of Rooms | Owner-occupied | Renter-occupied |
| 1 Room | 0 (0.0%) | 0 (0.0%) |
| 2 or 3 Rooms | 0 (0.0%) | 0 (0.0%) |
| 4 or 5 Rooms | 25 (22.9%) | 0 (0.0%) |
| 6 or 7 Rooms | 13 (11.9%) | 8 (100.0%) |
| 8 or more Rooms | 71 (65.1%) | 0 (0.0%) |
| Total | 109 (100.0%) | 8 (100.0%) |
Housing Structure by Heating Type in Grier City
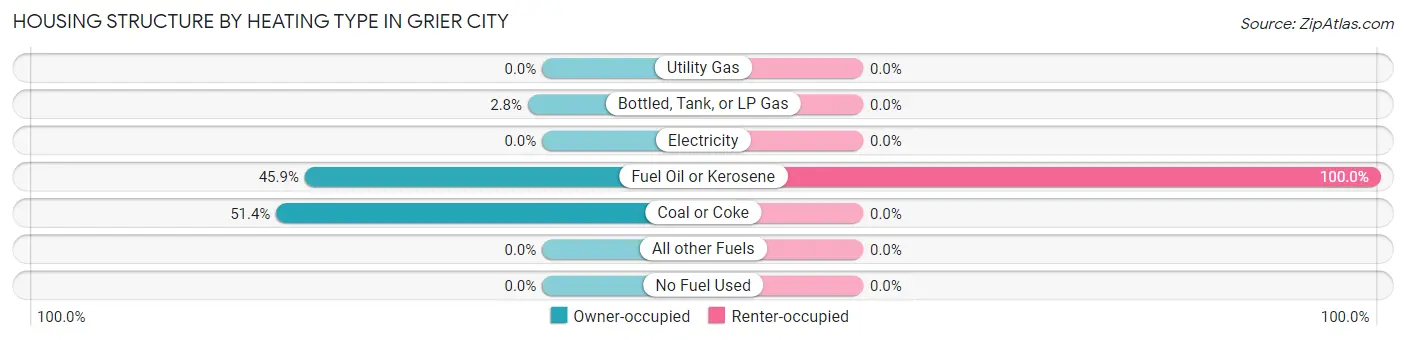
| Heating Type | Owner-occupied | Renter-occupied |
| Utility Gas | 0 (0.0%) | 0 (0.0%) |
| Bottled, Tank, or LP Gas | 3 (2.8%) | 0 (0.0%) |
| Electricity | 0 (0.0%) | 0 (0.0%) |
| Fuel Oil or Kerosene | 50 (45.9%) | 8 (100.0%) |
| Coal or Coke | 56 (51.4%) | 0 (0.0%) |
| All other Fuels | 0 (0.0%) | 0 (0.0%) |
| No Fuel Used | 0 (0.0%) | 0 (0.0%) |
| Total | 109 (100.0%) | 8 (100.0%) |
Household Vehicle Usage in Grier City
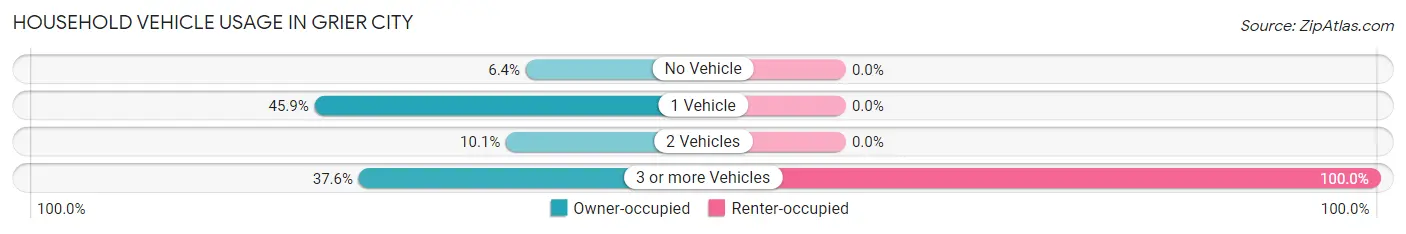
| Vehicles per Household | Owner-occupied | Renter-occupied |
| No Vehicle | 7 (6.4%) | 0 (0.0%) |
| 1 Vehicle | 50 (45.9%) | 0 (0.0%) |
| 2 Vehicles | 11 (10.1%) | 0 (0.0%) |
| 3 or more Vehicles | 41 (37.6%) | 8 (100.0%) |
| Total | 109 (100.0%) | 8 (100.0%) |
Real Estate & Mortgages in Grier City
Real Estate and Mortgage Overview in Grier City
| Characteristic | Without Mortgage | With Mortgage |
| Housing Units | 43 | 66 |
| Median Property Value | $87,800 | $129,500 |
| Median Household Income | - | - |
| Monthly Housing Costs | $493 | $0 |
| Real Estate Taxes | $2,775 | $0 |
Property Value by Mortgage Status in Grier City
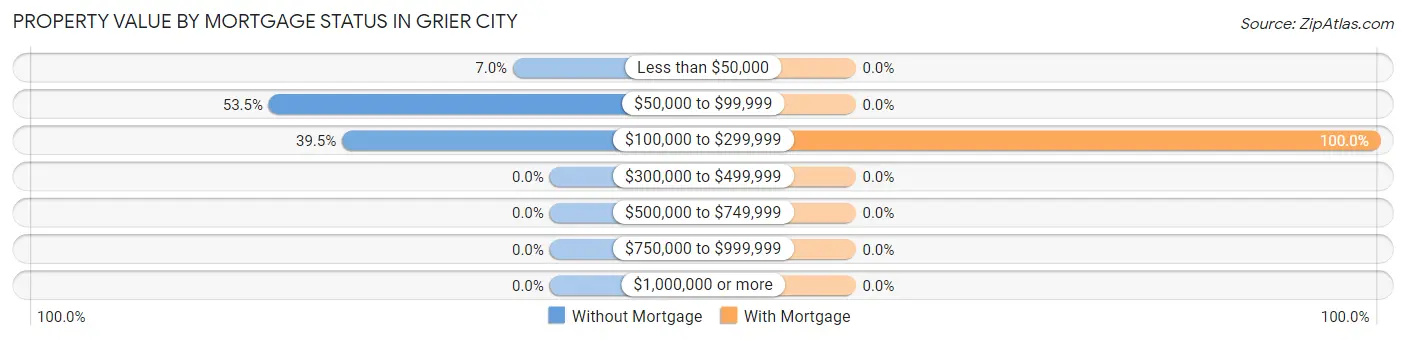
| Property Value | Without Mortgage | With Mortgage |
| Less than $50,000 | 3 (7.0%) | 0 (0.0%) |
| $50,000 to $99,999 | 23 (53.5%) | 0 (0.0%) |
| $100,000 to $299,999 | 17 (39.5%) | 66 (100.0%) |
| $300,000 to $499,999 | 0 (0.0%) | 0 (0.0%) |
| $500,000 to $749,999 | 0 (0.0%) | 0 (0.0%) |
| $750,000 to $999,999 | 0 (0.0%) | 0 (0.0%) |
| $1,000,000 or more | 0 (0.0%) | 0 (0.0%) |
| Total | 43 (100.0%) | 66 (100.0%) |
Household Income by Mortgage Status in Grier City
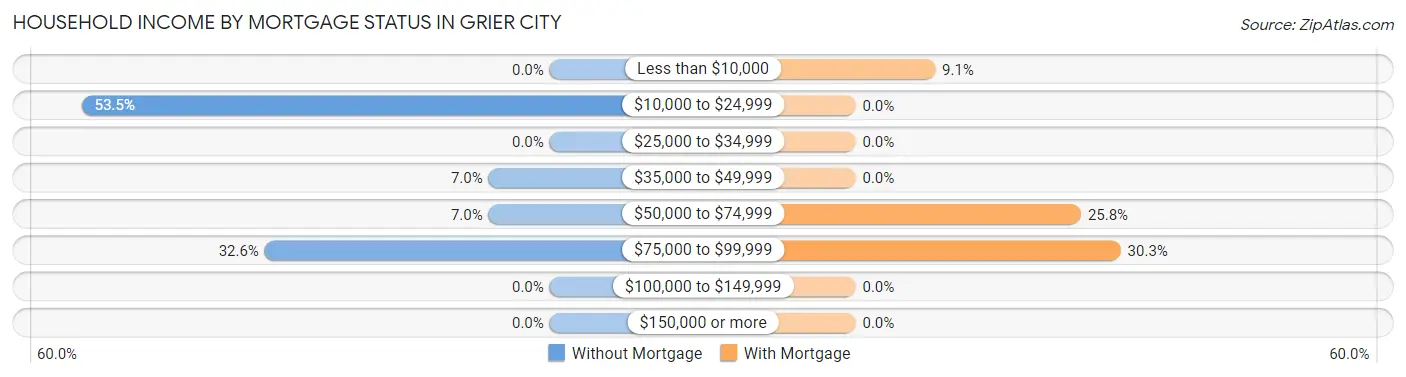
| Household Income | Without Mortgage | With Mortgage |
| Less than $10,000 | 0 (0.0%) | 6 (9.1%) |
| $10,000 to $24,999 | 23 (53.5%) | 0 (0.0%) |
| $25,000 to $34,999 | 0 (0.0%) | 0 (0.0%) |
| $35,000 to $49,999 | 3 (7.0%) | 0 (0.0%) |
| $50,000 to $74,999 | 3 (7.0%) | 17 (25.8%) |
| $75,000 to $99,999 | 14 (32.6%) | 20 (30.3%) |
| $100,000 to $149,999 | 0 (0.0%) | 0 (0.0%) |
| $150,000 or more | 0 (0.0%) | 0 (0.0%) |
| Total | 43 (100.0%) | 66 (100.0%) |
Property Value to Household Income Ratio in Grier City
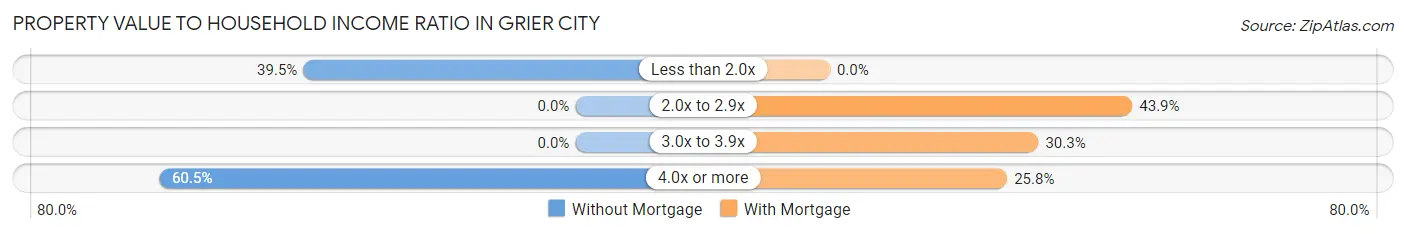
| Value-to-Income Ratio | Without Mortgage | With Mortgage |
| Less than 2.0x | 17 (39.5%) | 0 (0.0%) |
| 2.0x to 2.9x | 0 (0.0%) | 29 (43.9%) |
| 3.0x to 3.9x | 0 (0.0%) | 20 (30.3%) |
| 4.0x or more | 26 (60.5%) | 17 (25.8%) |
| Total | 43 (100.0%) | 66 (100.0%) |
Real Estate Taxes by Mortgage Status in Grier City
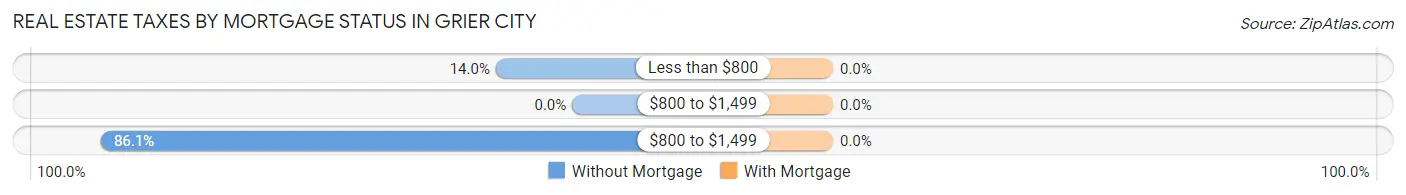
| Property Taxes | Without Mortgage | With Mortgage |
| Less than $800 | 6 (14.0%) | 0 (0.0%) |
| $800 to $1,499 | 0 (0.0%) | 0 (0.0%) |
| $800 to $1,499 | 37 (86.1%) | 0 (0.0%) |
| Total | 43 (100.0%) | 66 (100.0%) |
Health & Disability in Grier City
Health Insurance Coverage by Age in Grier City
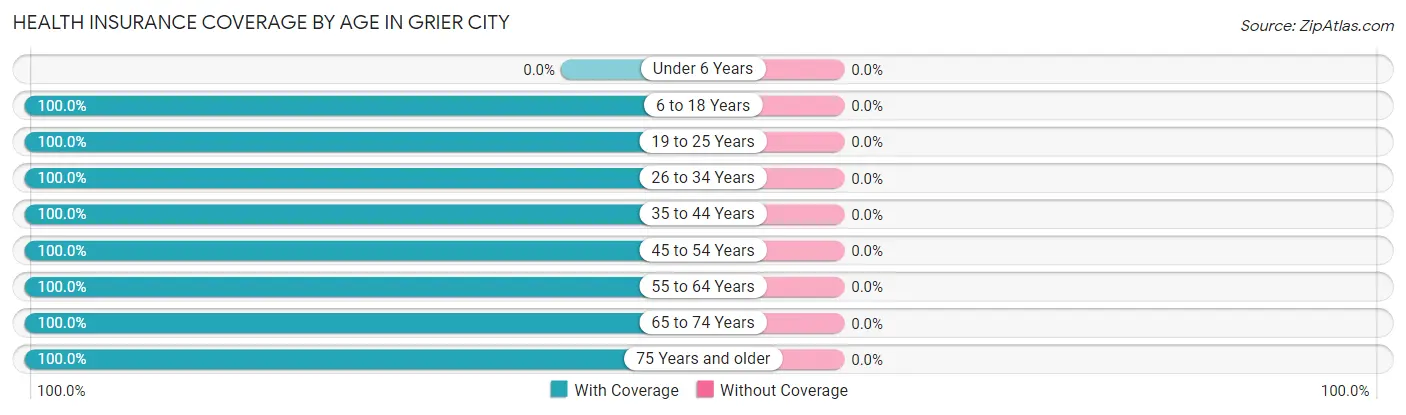
| Age Bracket | With Coverage | Without Coverage |
| Under 6 Years | 0 (0.0%) | 0 (0.0%) |
| 6 to 18 Years | 12 (100.0%) | 0 (0.0%) |
| 19 to 25 Years | 35 (100.0%) | 0 (0.0%) |
| 26 to 34 Years | 17 (100.0%) | 0 (0.0%) |
| 35 to 44 Years | 9 (100.0%) | 0 (0.0%) |
| 45 to 54 Years | 59 (100.0%) | 0 (0.0%) |
| 55 to 64 Years | 11 (100.0%) | 0 (0.0%) |
| 65 to 74 Years | 67 (100.0%) | 0 (0.0%) |
| 75 Years and older | 32 (100.0%) | 0 (0.0%) |
| Total | 242 (100.0%) | 0 (0.0%) |
Health Insurance Coverage by Citizenship Status in Grier City

| Citizenship Status | With Coverage | Without Coverage |
| Native Born | 0 (0.0%) | 0 (0.0%) |
| Foreign Born, Citizen | 12 (100.0%) | 0 (0.0%) |
| Foreign Born, not a Citizen | 35 (100.0%) | 0 (0.0%) |
Health Insurance Coverage by Household Income in Grier City
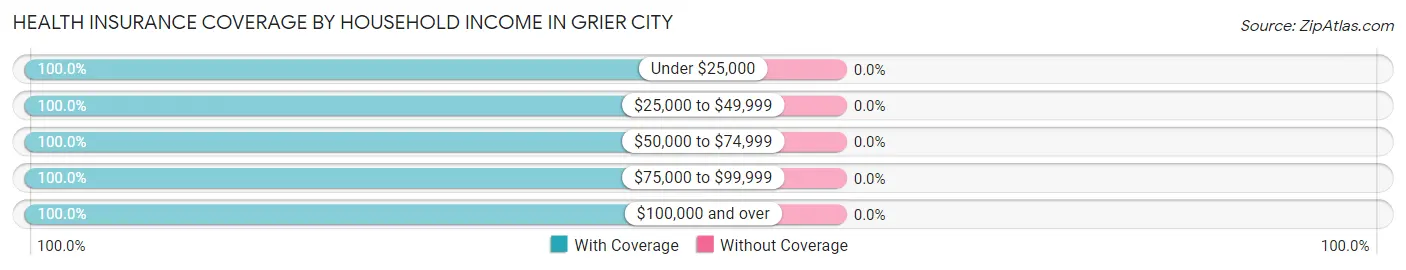
| Household Income | With Coverage | Without Coverage |
| Under $25,000 | 52 (100.0%) | 0 (0.0%) |
| $25,000 to $49,999 | 25 (100.0%) | 0 (0.0%) |
| $50,000 to $74,999 | 45 (100.0%) | 0 (0.0%) |
| $75,000 to $99,999 | 28 (100.0%) | 0 (0.0%) |
| $100,000 and over | 92 (100.0%) | 0 (0.0%) |
Public vs Private Health Insurance Coverage by Age in Grier City
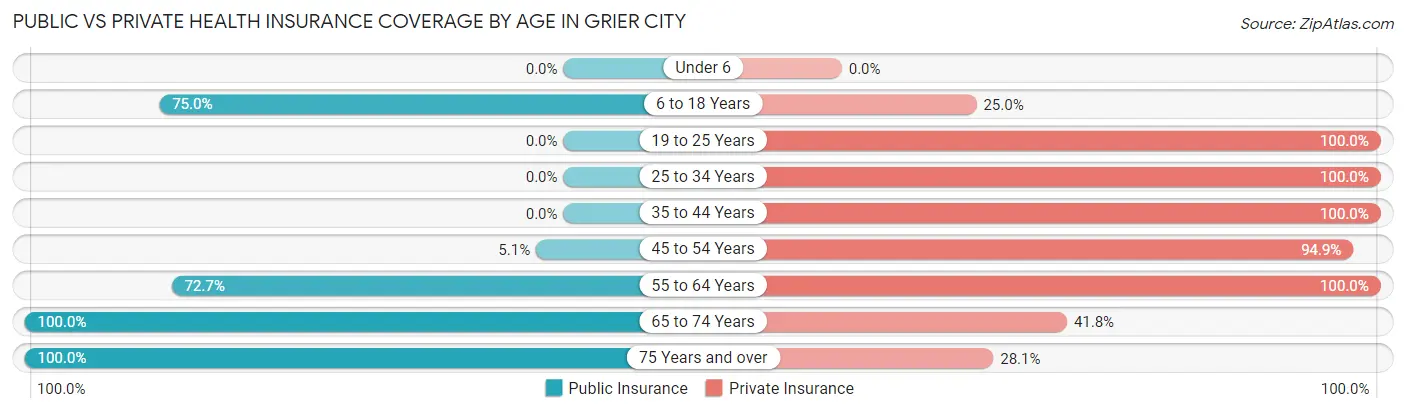
| Age Bracket | Public Insurance | Private Insurance |
| Under 6 | 0 (0.0%) | 0 (0.0%) |
| 6 to 18 Years | 9 (75.0%) | 3 (25.0%) |
| 19 to 25 Years | 0 (0.0%) | 35 (100.0%) |
| 25 to 34 Years | 0 (0.0%) | 17 (100.0%) |
| 35 to 44 Years | 0 (0.0%) | 9 (100.0%) |
| 45 to 54 Years | 3 (5.1%) | 56 (94.9%) |
| 55 to 64 Years | 8 (72.7%) | 11 (100.0%) |
| 65 to 74 Years | 67 (100.0%) | 28 (41.8%) |
| 75 Years and over | 32 (100.0%) | 9 (28.1%) |
| Total | 119 (49.2%) | 168 (69.4%) |
Disability Status by Sex by Age in Grier City
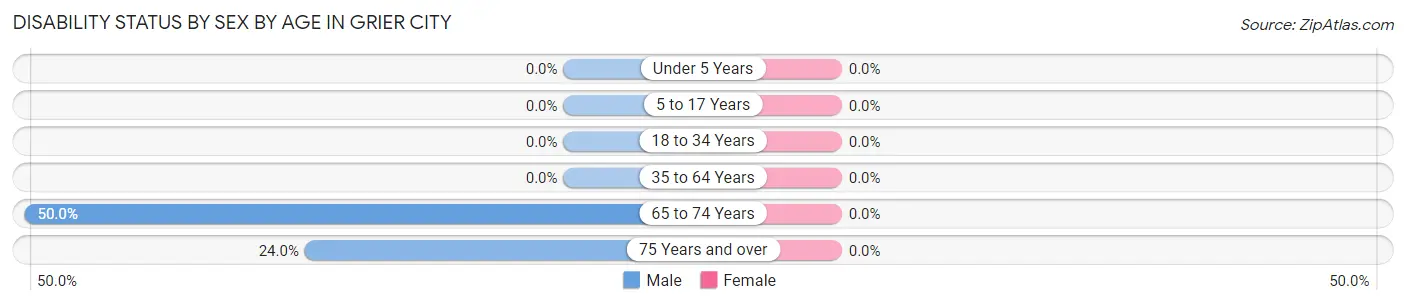
| Age Bracket | Male | Female |
| Under 5 Years | 0 (0.0%) | 0 (0.0%) |
| 5 to 17 Years | 0 (0.0%) | 0 (0.0%) |
| 18 to 34 Years | 0 (0.0%) | 0 (0.0%) |
| 35 to 64 Years | 0 (0.0%) | 0 (0.0%) |
| 65 to 74 Years | 14 (50.0%) | 0 (0.0%) |
| 75 Years and over | 6 (24.0%) | 0 (0.0%) |
Disability Class by Sex by Age in Grier City
Disability Class: Hearing Difficulty
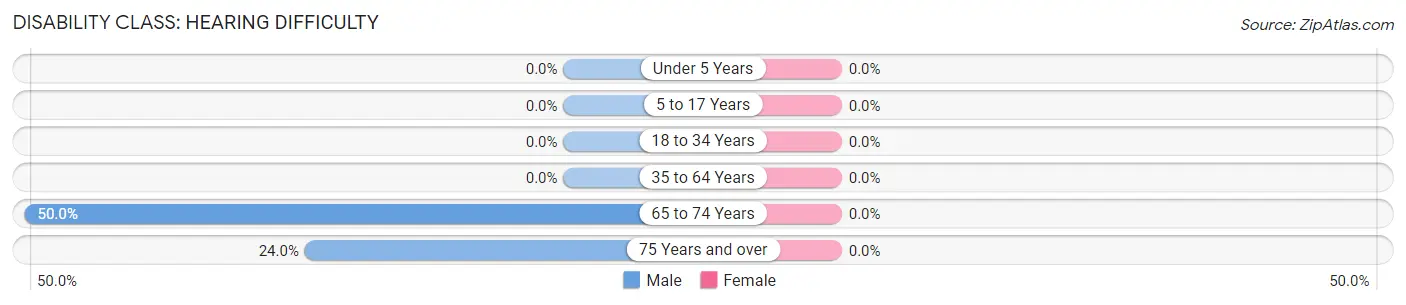
| Age Bracket | Male | Female |
| Under 5 Years | 0 (0.0%) | 0 (0.0%) |
| 5 to 17 Years | 0 (0.0%) | 0 (0.0%) |
| 18 to 34 Years | 0 (0.0%) | 0 (0.0%) |
| 35 to 64 Years | 0 (0.0%) | 0 (0.0%) |
| 65 to 74 Years | 14 (50.0%) | 0 (0.0%) |
| 75 Years and over | 6 (24.0%) | 0 (0.0%) |
Disability Class: Vision Difficulty
| Age Bracket | Male | Female |
| Under 5 Years | 0 (0.0%) | 0 (0.0%) |
| 5 to 17 Years | 0 (0.0%) | 0 (0.0%) |
| 18 to 34 Years | 0 (0.0%) | 0 (0.0%) |
| 35 to 64 Years | 0 (0.0%) | 0 (0.0%) |
| 65 to 74 Years | 0 (0.0%) | 0 (0.0%) |
| 75 Years and over | 0 (0.0%) | 0 (0.0%) |
Disability Class: Cognitive Difficulty
| Age Bracket | Male | Female |
| 5 to 17 Years | 0 (0.0%) | 0 (0.0%) |
| 18 to 34 Years | 0 (0.0%) | 0 (0.0%) |
| 35 to 64 Years | 0 (0.0%) | 0 (0.0%) |
| 65 to 74 Years | 0 (0.0%) | 0 (0.0%) |
| 75 Years and over | 0 (0.0%) | 0 (0.0%) |
Disability Class: Ambulatory Difficulty
| Age Bracket | Male | Female |
| 5 to 17 Years | 0 (0.0%) | 0 (0.0%) |
| 18 to 34 Years | 0 (0.0%) | 0 (0.0%) |
| 35 to 64 Years | 0 (0.0%) | 0 (0.0%) |
| 65 to 74 Years | 0 (0.0%) | 0 (0.0%) |
| 75 Years and over | 0 (0.0%) | 0 (0.0%) |
Disability Class: Self-Care Difficulty
| Age Bracket | Male | Female |
| 5 to 17 Years | 0 (0.0%) | 0 (0.0%) |
| 18 to 34 Years | 0 (0.0%) | 0 (0.0%) |
| 35 to 64 Years | 0 (0.0%) | 0 (0.0%) |
| 65 to 74 Years | 0 (0.0%) | 0 (0.0%) |
| 75 Years and over | 0 (0.0%) | 0 (0.0%) |
Technology Access in Grier City
Computing Device Access in Grier City
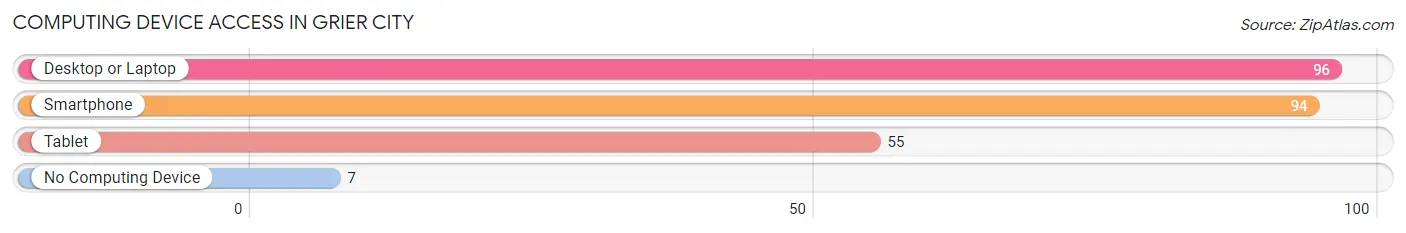
| Device Type | # Households | % Households |
| Desktop or Laptop | 96 | 82.1% |
| Smartphone | 94 | 80.3% |
| Tablet | 55 | 47.0% |
| No Computing Device | 7 | 6.0% |
| Total | 117 | 100.0% |
Internet Access in Grier City
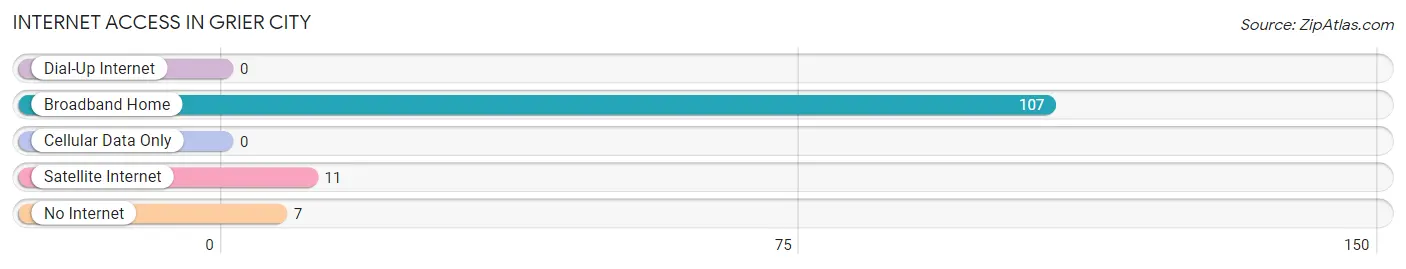
| Internet Type | # Households | % Households |
| Dial-Up Internet | 0 | 0.0% |
| Broadband Home | 107 | 91.4% |
| Cellular Data Only | 0 | 0.0% |
| Satellite Internet | 11 | 9.4% |
| No Internet | 7 | 6.0% |
| Total | 117 | 100.0% |
Grier City Summary
Grier City is a small borough located in the state of Pennsylvania. It is situated in the southwestern corner of the state, in the Allegheny Mountains region. The borough is located in the county of Fayette, and is part of the Uniontown Metropolitan Statistical Area. As of the 2010 census, the population of Grier City was 1,845.
History
Grier City was founded in 1845 by John Grier, a local landowner. Grier had purchased the land from the local Native American tribes, and he named the town after himself. The town was originally a small farming community, but it soon grew to become a center of industry. In the late 19th century, Grier City was home to several coal mines, as well as a number of factories. The town also had a number of stores and businesses, and it was a popular destination for tourists.
In the early 20th century, Grier City experienced a period of decline. The coal mines and factories closed, and the town's population began to decline. However, in the late 20th century, the town experienced a resurgence. The town was revitalized by the construction of a new shopping center, as well as the opening of a number of new businesses.
Geography
Grier City is located in the southwestern corner of Pennsylvania, in the Allegheny Mountains region. The borough is situated in the county of Fayette, and is part of the Uniontown Metropolitan Statistical Area. The borough is located at an elevation of 1,845 feet above sea level.
The borough is located in a valley, surrounded by hills and mountains. The Allegheny River runs through the borough, and the town is located near the Pennsylvania Turnpike. The borough is located approximately 50 miles south of Pittsburgh, and approximately 30 miles east of Morgantown, West Virginia.
Economy
Grier City is a small, rural community, and the economy is largely based on agriculture and tourism. The town is home to several small farms, and the local farmers produce a variety of crops, including corn, soybeans, and hay. The town is also home to a number of small businesses, including restaurants, stores, and other services.
The town is also a popular destination for tourists. The town is home to several historic sites, including the Grier City Historic District, which is listed on the National Register of Historic Places. The town is also home to a number of outdoor recreation areas, including the Grier City State Park.
Demographics
As of the 2010 census, the population of Grier City was 1,845. The population is largely white, with a small minority population. The median household income is $37,917, and the median age is 44. The town is largely rural, with a population density of just over 200 people per square mile.
Common Questions
What is Per Capita Income in Grier City?
Per Capita income in Grier City is $39,704.
What is the Median Family Income in Grier City?
Median Family Income in Grier City is $88,304.
What is the Median Household income in Grier City?
Median Household Income in Grier City is $71,250.
What is Income or Wage Gap in Grier City?
Income or Wage Gap in Grier City is 69.2%.
Women in Grier City earn 30.8 cents for every dollar earned by a man.
What is Inequality or Gini Index in Grier City?
Inequality or Gini Index in Grier City is 0.40.
What is the Total Population of Grier City?
Total Population of Grier City is 242.
What is the Total Male Population of Grier City?
Total Male Population of Grier City is 132.
What is the Total Female Population of Grier City?
Total Female Population of Grier City is 110.
What is the Ratio of Males per 100 Females in Grier City?
There are 120.00 Males per 100 Females in Grier City.
What is the Ratio of Females per 100 Males in Grier City?
There are 83.33 Females per 100 Males in Grier City.
What is the Median Population Age in Grier City?
Median Population Age in Grier City is 50.6 Years.
What is the Average Family Size in Grier City
Average Family Size in Grier City is 2.6 People.
What is the Average Household Size in Grier City
Average Household Size in Grier City is 2.1 People.
How Large is the Labor Force in Grier City?
There are 179 People in the Labor Forcein in Grier City.
What is the Percentage of People in the Labor Force in Grier City?
74.9% of People are in the Labor Force in Grier City.
What is the Unemployment Rate in Grier City?
Unemployment Rate in Grier City is 10.1%.