New Buffalo borough, PA Map & Demographics
New Buffalo borough Overview
$25,698
PER CAPITA INCOME
$71,250
AVG FAMILY INCOME
$43,750
AVG HOUSEHOLD INCOME
26.1%
WAGE / INCOME GAP [ % ]
73.9¢/ $1
WAGE / INCOME GAP [ $ ]
0.40
INEQUALITY / GINI INDEX
112
TOTAL POPULATION
69
MALE POPULATION
43
FEMALE POPULATION
160.47
MALES / 100 FEMALES
62.32
FEMALES / 100 MALES
41.3
MEDIAN AGE
3.2
AVG FAMILY SIZE
2.3
AVG HOUSEHOLD SIZE
52
LABOR FORCE [ PEOPLE ]
55.9%
PERCENT IN LABOR FORCE
Income in New Buffalo borough
Income Overview in New Buffalo borough
Per Capita Income in New Buffalo borough is $25,698, while median incomes of families and households are $71,250 and $43,750 respectively.
| Characteristic | Number | Measure |
| Per Capita Income | 112 | $25,698 |
| Median Family Income | 23 | $71,250 |
| Mean Family Income | 23 | $74,678 |
| Median Household Income | 48 | $43,750 |
| Mean Household Income | 48 | $57,065 |
| Income Deficit | 23 | $0 |
| Wage / Income Gap (%) | 112 | 26.14% |
| Wage / Income Gap ($) | 112 | 73.86¢ per $1 |
| Gini / Inequality Index | 112 | 0.40 |
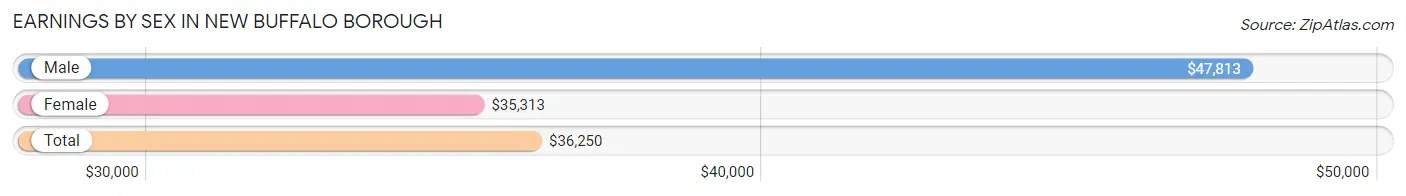
Earnings by Sex in New Buffalo borough
Average Earnings in New Buffalo borough are $36,250, $47,813 for men and $35,313 for women, a difference of 26.1%.
| Sex | Number | Average Earnings |
| Male | 33 (63.5%) | $47,813 |
| Female | 19 (36.5%) | $35,313 |
| Total | 52 (100.0%) | $36,250 |
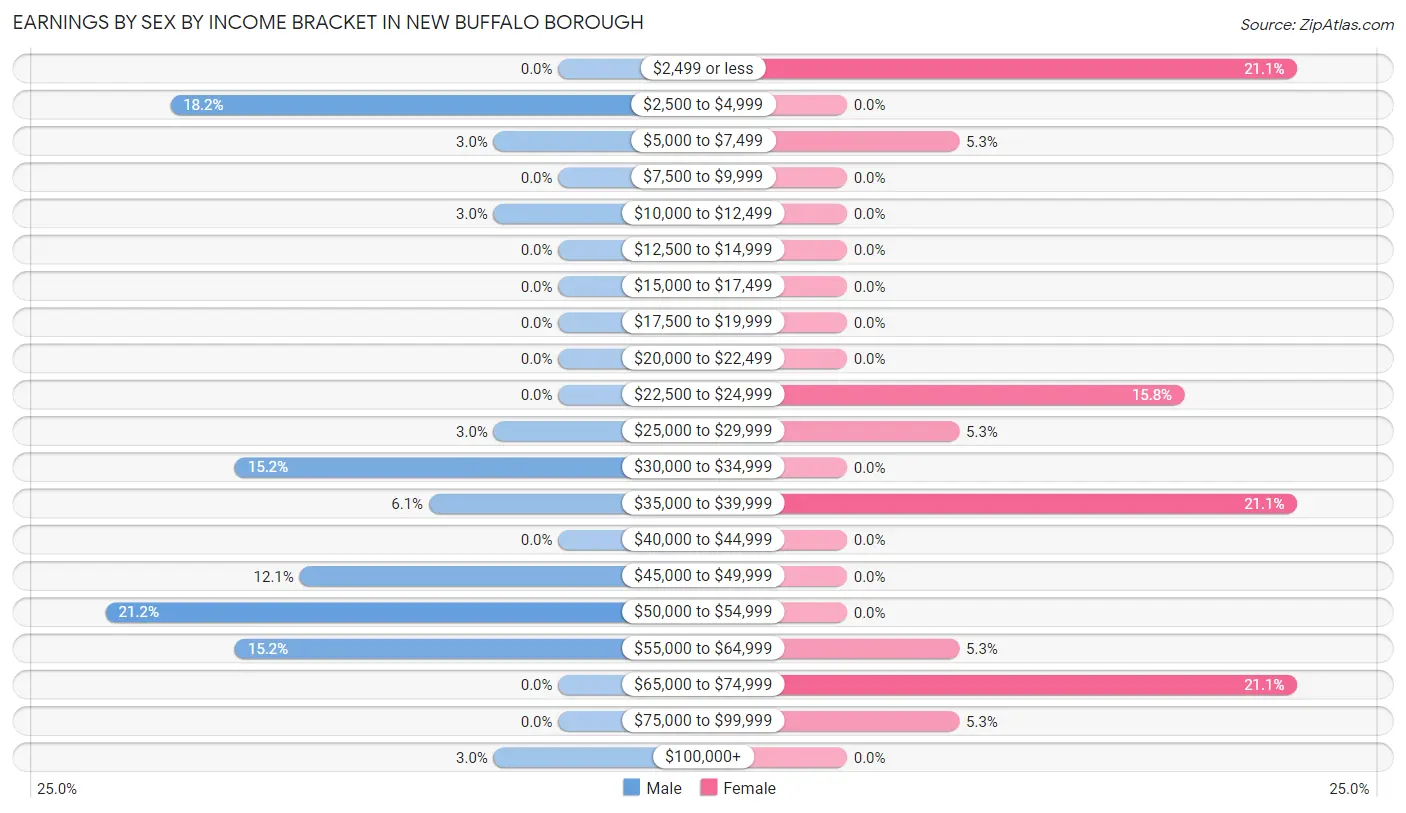
Earnings by Sex by Income Bracket in New Buffalo borough
The most common earnings brackets in New Buffalo borough are $50,000 to $54,999 for men (7 | 21.2%) and $2,499 or less for women (4 | 21.0%).
| Income | Male | Female |
| $2,499 or less | 0 (0.0%) | 4 (21.0%) |
| $2,500 to $4,999 | 6 (18.2%) | 0 (0.0%) |
| $5,000 to $7,499 | 1 (3.0%) | 1 (5.3%) |
| $7,500 to $9,999 | 0 (0.0%) | 0 (0.0%) |
| $10,000 to $12,499 | 1 (3.0%) | 0 (0.0%) |
| $12,500 to $14,999 | 0 (0.0%) | 0 (0.0%) |
| $15,000 to $17,499 | 0 (0.0%) | 0 (0.0%) |
| $17,500 to $19,999 | 0 (0.0%) | 0 (0.0%) |
| $20,000 to $22,499 | 0 (0.0%) | 0 (0.0%) |
| $22,500 to $24,999 | 0 (0.0%) | 3 (15.8%) |
| $25,000 to $29,999 | 1 (3.0%) | 1 (5.3%) |
| $30,000 to $34,999 | 5 (15.1%) | 0 (0.0%) |
| $35,000 to $39,999 | 2 (6.1%) | 4 (21.0%) |
| $40,000 to $44,999 | 0 (0.0%) | 0 (0.0%) |
| $45,000 to $49,999 | 4 (12.1%) | 0 (0.0%) |
| $50,000 to $54,999 | 7 (21.2%) | 0 (0.0%) |
| $55,000 to $64,999 | 5 (15.1%) | 1 (5.3%) |
| $65,000 to $74,999 | 0 (0.0%) | 4 (21.0%) |
| $75,000 to $99,999 | 0 (0.0%) | 1 (5.3%) |
| $100,000+ | 1 (3.0%) | 0 (0.0%) |
| Total | 33 (100.0%) | 19 (100.0%) |
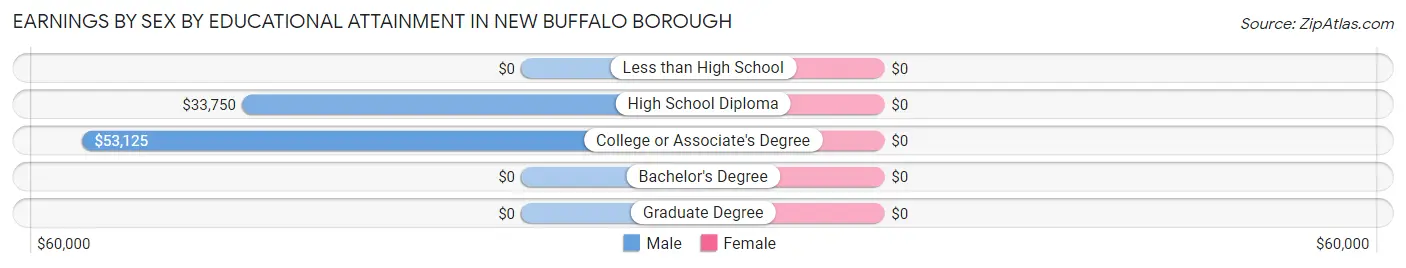
Earnings by Sex by Educational Attainment in New Buffalo borough
| Educational Attainment | Male Income | Female Income |
| Less than High School | - | - |
| High School Diploma | $33,750 | $0 |
| College or Associate's Degree | $53,125 | $0 |
| Bachelor's Degree | - | - |
| Graduate Degree | - | - |
| Total | $36,250 | $0 |
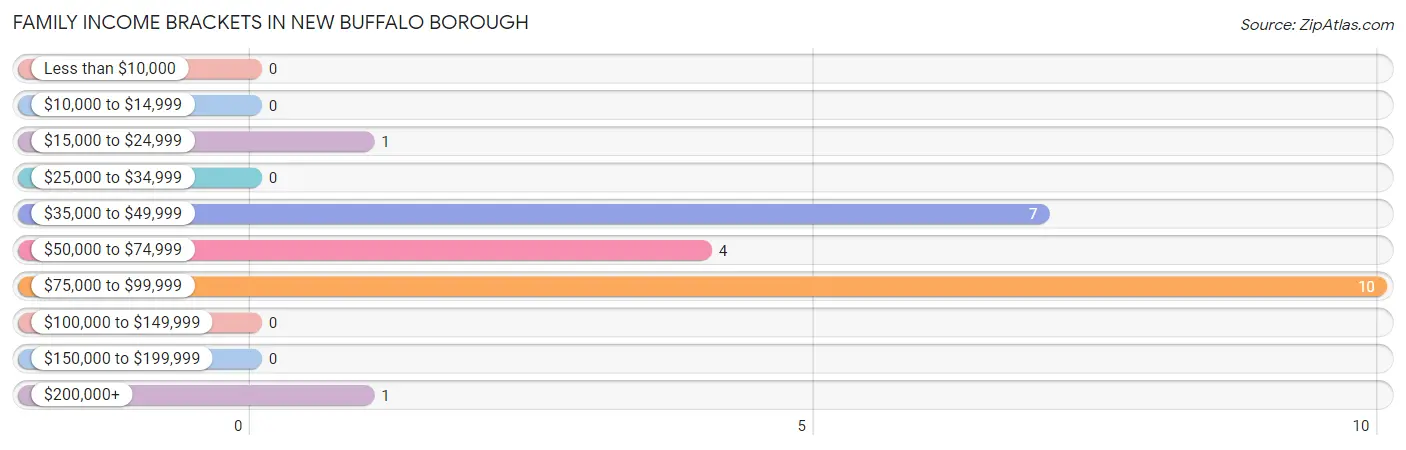
Family Income in New Buffalo borough
Family Income Brackets in New Buffalo borough
According to the New Buffalo borough family income data, there are 10 families falling into the $75,000 to $99,999 income range, which is the most common income bracket and makes up 43.5% of all families.
| Income Bracket | # Families | % Families |
| Less than $10,000 | 0 | 0.0% |
| $10,000 to $14,999 | 0 | 0.0% |
| $15,000 to $24,999 | 1 | 4.3% |
| $25,000 to $34,999 | 0 | 0.0% |
| $35,000 to $49,999 | 7 | 30.4% |
| $50,000 to $74,999 | 4 | 17.4% |
| $75,000 to $99,999 | 10 | 43.5% |
| $100,000 to $149,999 | 0 | 0.0% |
| $150,000 to $199,999 | 0 | 0.0% |
| $200,000+ | 1 | 4.3% |
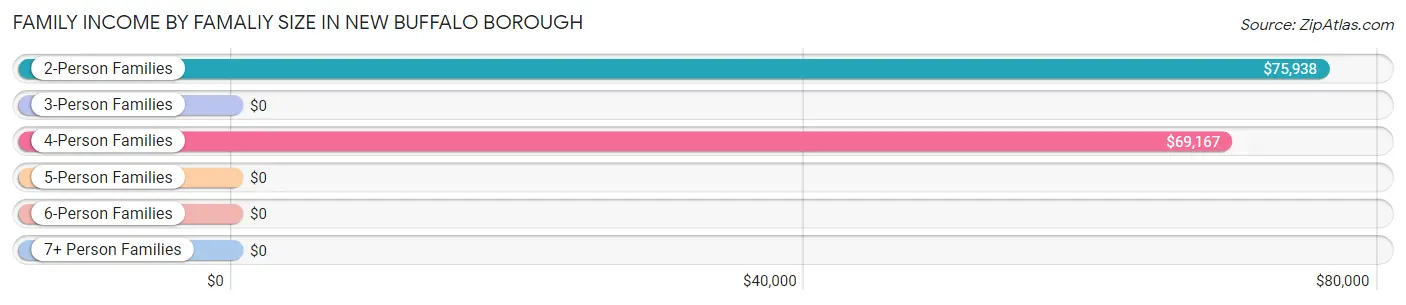
Family Income by Famaliy Size in New Buffalo borough
2-person families (9 | 39.1%) account for the highest median family income in New Buffalo borough with $75,938 per family, while 2-person families (9 | 39.1%) have the highest median income of $37,969 per family member.
| Income Bracket | # Families | Median Income |
| 2-Person Families | 9 (39.1%) | $75,938 |
| 3-Person Families | 2 (8.7%) | $0 |
| 4-Person Families | 12 (52.2%) | $69,167 |
| 5-Person Families | 0 (0.0%) | $0 |
| 6-Person Families | 0 (0.0%) | $0 |
| 7+ Person Families | 0 (0.0%) | $0 |
| Total | 23 (100.0%) | $71,250 |
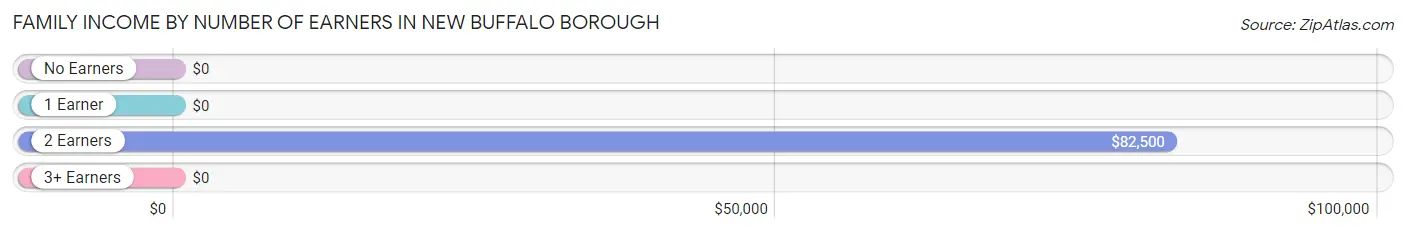
Family Income by Number of Earners in New Buffalo borough
| Number of Earners | # Families | Median Income |
| No Earners | 2 (8.7%) | $0 |
| 1 Earner | 11 (47.8%) | $0 |
| 2 Earners | 10 (43.5%) | $82,500 |
| 3+ Earners | 0 (0.0%) | $0 |
| Total | 23 (100.0%) | $71,250 |
Household Income in New Buffalo borough
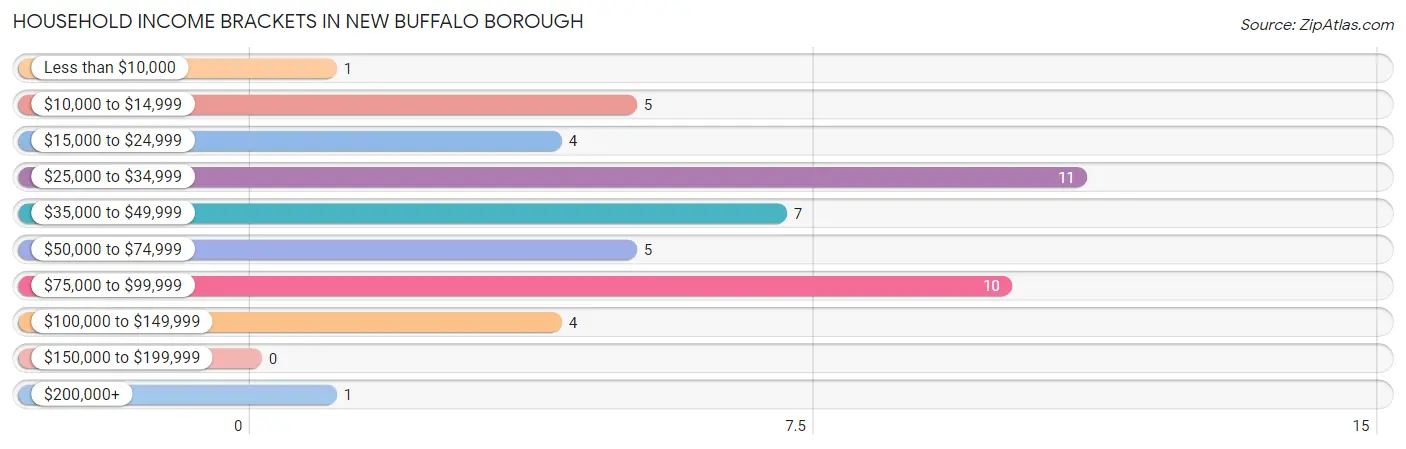
Household Income Brackets in New Buffalo borough
With 11 households falling in the category, the $25,000 to $34,999 income range is the most frequent in New Buffalo borough, accounting for 22.9% of all households.
| Income Bracket | # Households | % Households |
| Less than $10,000 | 1 | 2.1% |
| $10,000 to $14,999 | 5 | 10.4% |
| $15,000 to $24,999 | 4 | 8.3% |
| $25,000 to $34,999 | 11 | 22.9% |
| $35,000 to $49,999 | 7 | 14.6% |
| $50,000 to $74,999 | 5 | 10.4% |
| $75,000 to $99,999 | 10 | 20.8% |
| $100,000 to $149,999 | 4 | 8.3% |
| $150,000 to $199,999 | 0 | 0.0% |
| $200,000+ | 1 | 2.1% |
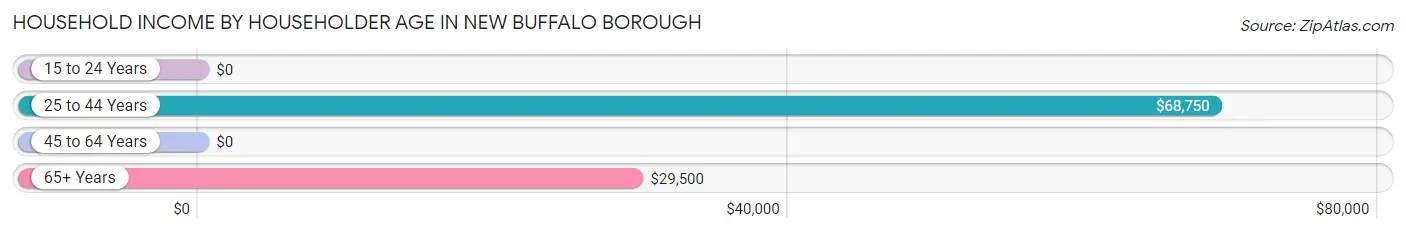
Household Income by Householder Age in New Buffalo borough
The median household income in New Buffalo borough is $43,750, with the highest median household income of $68,750 found in the 25 to 44 years age bracket for the primary householder. A total of 12 households (25.0%) fall into this category. Meanwhile, the 15 to 24 years age bracket for the primary householder has the lowest median household income of $0, with 4 households (8.3%) in this group.
| Income Bracket | # Households | Median Income |
| 15 to 24 Years | 4 (8.3%) | $0 |
| 25 to 44 Years | 12 (25.0%) | $68,750 |
| 45 to 64 Years | 8 (16.7%) | $0 |
| 65+ Years | 24 (50.0%) | $29,500 |
| Total | 48 (100.0%) | $43,750 |
Poverty in New Buffalo borough
Income Below Poverty by Sex and Age in New Buffalo borough
With 4.3% poverty level for males and 2.3% for females among the residents of New Buffalo borough, 25 to 34 year old males and 25 to 34 year old females are the most vulnerable to poverty, with 2 males (15.4%) and 1 females (20.0%) in their respective age groups living below the poverty level.
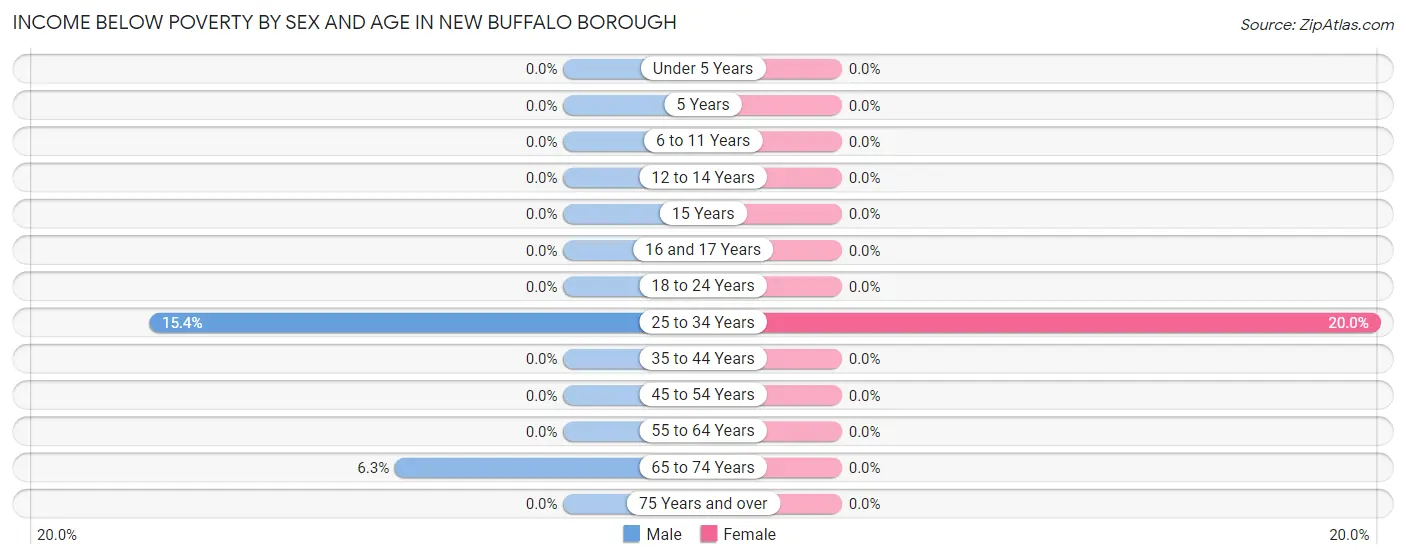
| Age Bracket | Male | Female |
| Under 5 Years | 0 (0.0%) | 0 (0.0%) |
| 5 Years | 0 (0.0%) | 0 (0.0%) |
| 6 to 11 Years | 0 (0.0%) | 0 (0.0%) |
| 12 to 14 Years | 0 (0.0%) | 0 (0.0%) |
| 15 Years | 0 (0.0%) | 0 (0.0%) |
| 16 and 17 Years | 0 (0.0%) | 0 (0.0%) |
| 18 to 24 Years | 0 (0.0%) | 0 (0.0%) |
| 25 to 34 Years | 2 (15.4%) | 1 (20.0%) |
| 35 to 44 Years | 0 (0.0%) | 0 (0.0%) |
| 45 to 54 Years | 0 (0.0%) | 0 (0.0%) |
| 55 to 64 Years | 0 (0.0%) | 0 (0.0%) |
| 65 to 74 Years | 1 (6.2%) | 0 (0.0%) |
| 75 Years and over | 0 (0.0%) | 0 (0.0%) |
| Total | 3 (4.3%) | 1 (2.3%) |
Income Above Poverty by Sex and Age in New Buffalo borough
According to the poverty statistics in New Buffalo borough, males aged under 5 years and females aged 6 to 11 years are the age groups that are most secure financially, with 100.0% of males and 100.0% of females in these age groups living above the poverty line.
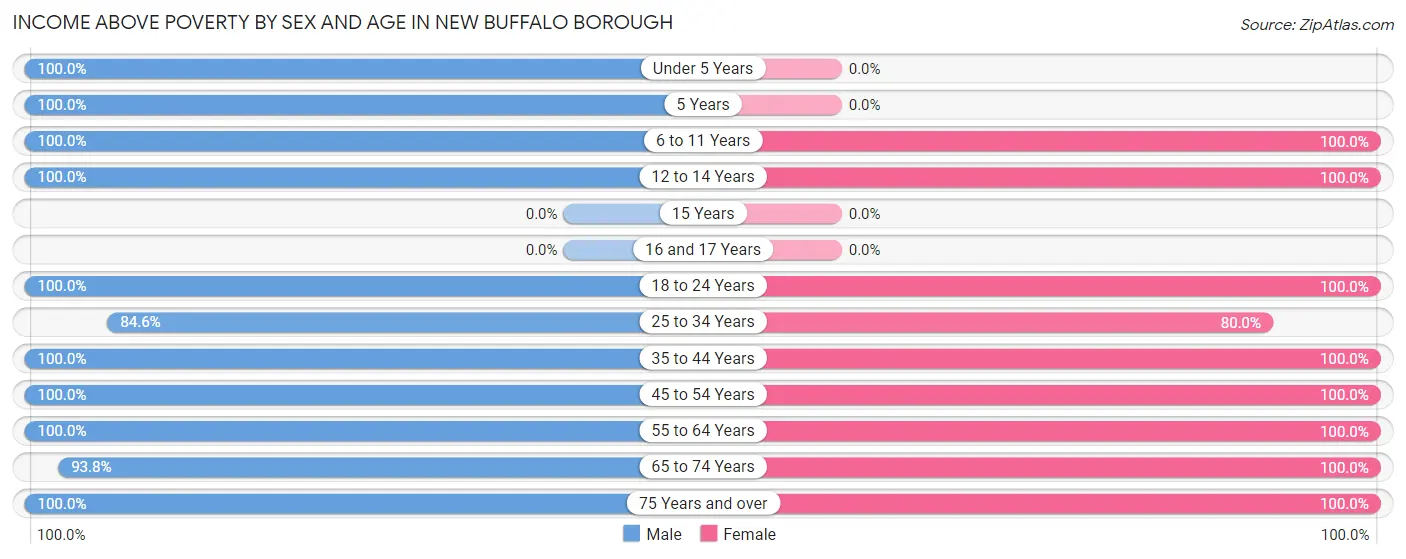
| Age Bracket | Male | Female |
| Under 5 Years | 2 (100.0%) | 0 (0.0%) |
| 5 Years | 3 (100.0%) | 0 (0.0%) |
| 6 to 11 Years | 2 (100.0%) | 4 (100.0%) |
| 12 to 14 Years | 3 (100.0%) | 5 (100.0%) |
| 15 Years | 0 (0.0%) | 0 (0.0%) |
| 16 and 17 Years | 0 (0.0%) | 0 (0.0%) |
| 18 to 24 Years | 6 (100.0%) | 4 (100.0%) |
| 25 to 34 Years | 11 (84.6%) | 4 (80.0%) |
| 35 to 44 Years | 8 (100.0%) | 4 (100.0%) |
| 45 to 54 Years | 6 (100.0%) | 4 (100.0%) |
| 55 to 64 Years | 7 (100.0%) | 4 (100.0%) |
| 65 to 74 Years | 15 (93.8%) | 6 (100.0%) |
| 75 Years and over | 3 (100.0%) | 7 (100.0%) |
| Total | 66 (95.7%) | 42 (97.7%) |
Income Below Poverty Among Married-Couple Families in New Buffalo borough
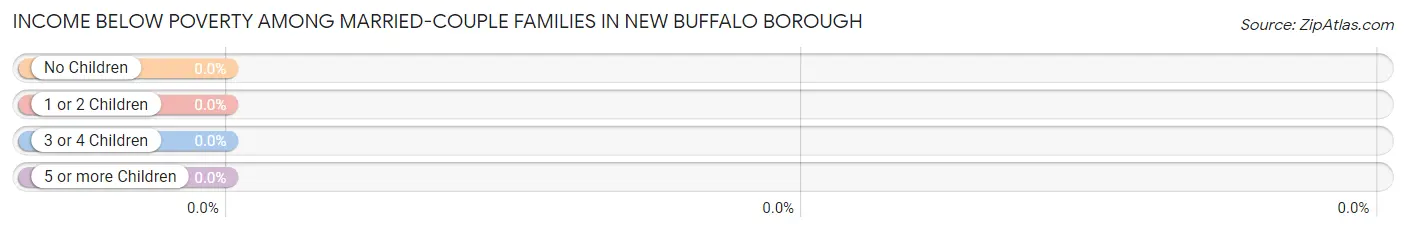
| Children | Above Poverty | Below Poverty |
| No Children | 15 (100.0%) | 0 (0.0%) |
| 1 or 2 Children | 7 (100.0%) | 0 (0.0%) |
| 3 or 4 Children | 0 (0.0%) | 0 (0.0%) |
| 5 or more Children | 0 (0.0%) | 0 (0.0%) |
| Total | 22 (100.0%) | 0 (0.0%) |
Income Below Poverty Among Single-Parent Households in New Buffalo borough
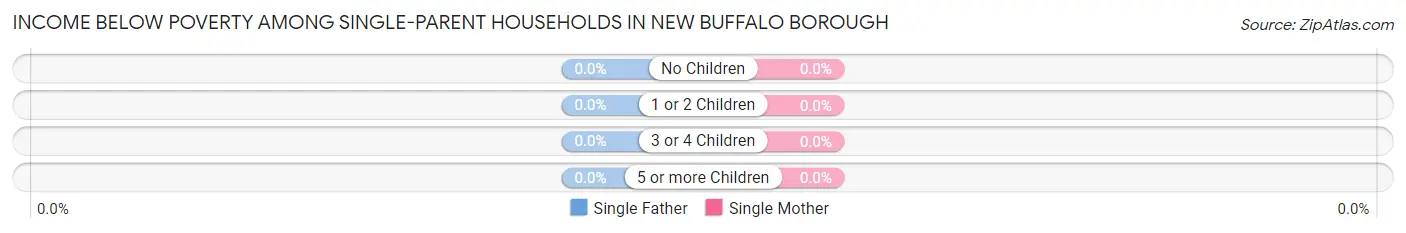
| Children | Single Father | Single Mother |
| No Children | 0 (0.0%) | 0 (0.0%) |
| 1 or 2 Children | 0 (0.0%) | 0 (0.0%) |
| 3 or 4 Children | 0 (0.0%) | 0 (0.0%) |
| 5 or more Children | 0 (0.0%) | 0 (0.0%) |
| Total | 0 (0.0%) | 0 (0.0%) |
Income Below Poverty Among Married-Couple vs Single-Parent Households in New Buffalo borough
| Children | Married-Couple Families | Single-Parent Households |
| No Children | 0 (0.0%) | 0 (0.0%) |
| 1 or 2 Children | 0 (0.0%) | 0 (0.0%) |
| 3 or 4 Children | 0 (0.0%) | 0 (0.0%) |
| 5 or more Children | 0 (0.0%) | 0 (0.0%) |
| Total | 0 (0.0%) | 0 (0.0%) |
Race in New Buffalo borough
The most populous races in New Buffalo borough are White / Caucasian (111 | 99.1%), Hispanic or Latino (2 | 1.8%), and Asian (1 | 0.9%).
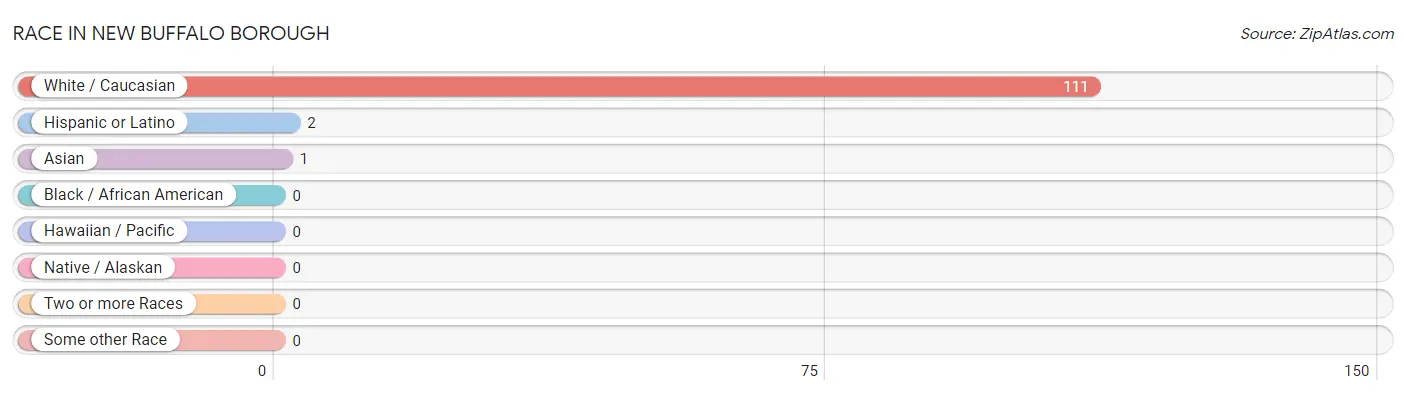
| Race | # Population | % Population |
| Asian | 1 | 0.9% |
| Black / African American | 0 | 0.0% |
| Hawaiian / Pacific | 0 | 0.0% |
| Hispanic or Latino | 2 | 1.8% |
| Native / Alaskan | 0 | 0.0% |
| White / Caucasian | 111 | 99.1% |
| Two or more Races | 0 | 0.0% |
| Some other Race | 0 | 0.0% |
| Total | 112 | 100.0% |
Ancestry in New Buffalo borough
The most populous ancestries reported in New Buffalo borough are German (45 | 40.2%), American (12 | 10.7%), Italian (9 | 8.0%), Irish (7 | 6.2%), and Swiss (4 | 3.6%), together accounting for 68.8% of all New Buffalo borough residents.
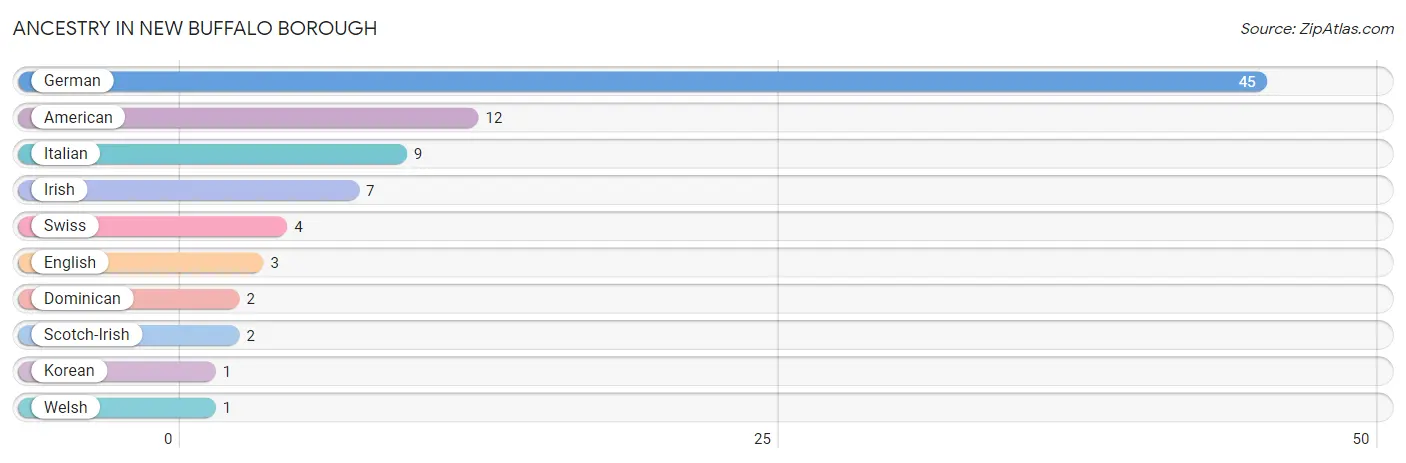
| Ancestry | # Population | % Population |
| American | 12 | 10.7% |
| Dominican | 2 | 1.8% |
| English | 3 | 2.7% |
| German | 45 | 40.2% |
| Irish | 7 | 6.2% |
| Italian | 9 | 8.0% |
| Korean | 1 | 0.9% |
| Scotch-Irish | 2 | 1.8% |
| Swiss | 4 | 3.6% |
| Welsh | 1 | 0.9% | View All 10 Rows |
Immigrants in New Buffalo borough
The most numerous immigrant groups reported in New Buffalo borough came from Asia (1 | 0.9%), England (1 | 0.9%), Europe (1 | 0.9%), Northern Europe (1 | 0.9%), and Philippines (1 | 0.9%), together accounting for 4.4% of all New Buffalo borough residents.
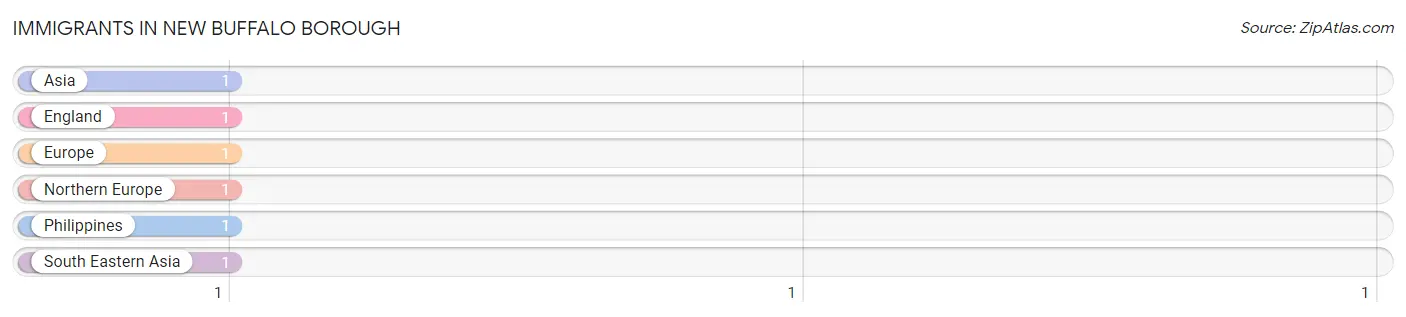
| Immigration Origin | # Population | % Population |
| Asia | 1 | 0.9% |
| England | 1 | 0.9% |
| Europe | 1 | 0.9% |
| Northern Europe | 1 | 0.9% |
| Philippines | 1 | 0.9% |
| South Eastern Asia | 1 | 0.9% | View All 6 Rows |
Sex and Age in New Buffalo borough
Sex and Age in New Buffalo borough
The most populous age groups in New Buffalo borough are 70 to 74 Years (12 | 17.4%) for men and 10 to 14 Years (5 | 11.6%) for women.
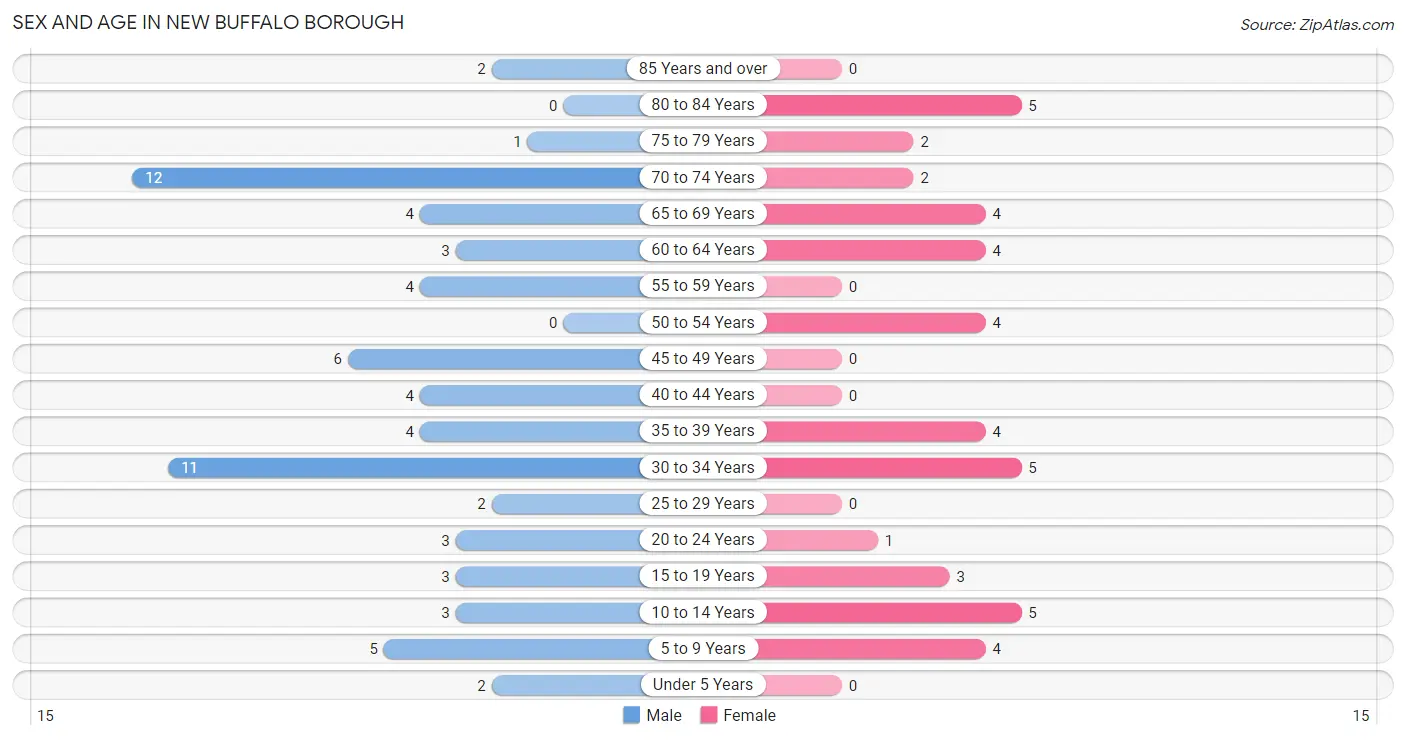
| Age Bracket | Male | Female |
| Under 5 Years | 2 (2.9%) | 0 (0.0%) |
| 5 to 9 Years | 5 (7.2%) | 4 (9.3%) |
| 10 to 14 Years | 3 (4.3%) | 5 (11.6%) |
| 15 to 19 Years | 3 (4.3%) | 3 (7.0%) |
| 20 to 24 Years | 3 (4.3%) | 1 (2.3%) |
| 25 to 29 Years | 2 (2.9%) | 0 (0.0%) |
| 30 to 34 Years | 11 (15.9%) | 5 (11.6%) |
| 35 to 39 Years | 4 (5.8%) | 4 (9.3%) |
| 40 to 44 Years | 4 (5.8%) | 0 (0.0%) |
| 45 to 49 Years | 6 (8.7%) | 0 (0.0%) |
| 50 to 54 Years | 0 (0.0%) | 4 (9.3%) |
| 55 to 59 Years | 4 (5.8%) | 0 (0.0%) |
| 60 to 64 Years | 3 (4.3%) | 4 (9.3%) |
| 65 to 69 Years | 4 (5.8%) | 4 (9.3%) |
| 70 to 74 Years | 12 (17.4%) | 2 (4.6%) |
| 75 to 79 Years | 1 (1.5%) | 2 (4.6%) |
| 80 to 84 Years | 0 (0.0%) | 5 (11.6%) |
| 85 Years and over | 2 (2.9%) | 0 (0.0%) |
| Total | 69 (100.0%) | 43 (100.0%) |
Families and Households in New Buffalo borough
Median Family Size in New Buffalo borough
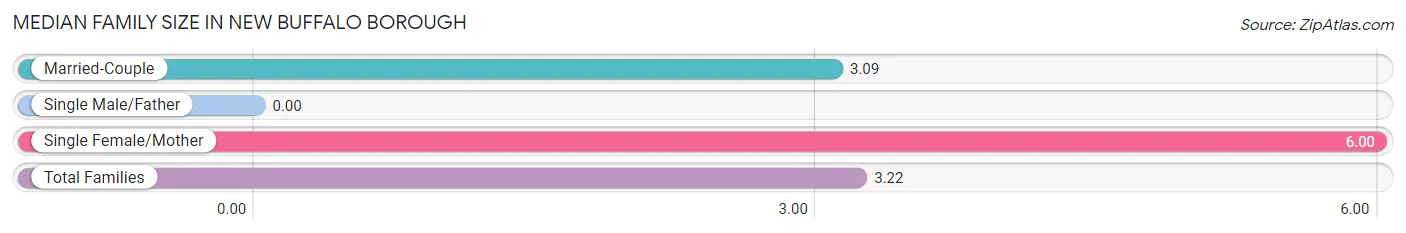
| Family Type | # Families | Family Size |
| Married-Couple | 22 (95.7%) | 3.09 |
| Single Male/Father | 0 (0.0%) | - |
| Single Female/Mother | 1 (4.3%) | 6.00 |
| Total Families | 23 (100.0%) | 3.22 |
Median Household Size in New Buffalo borough
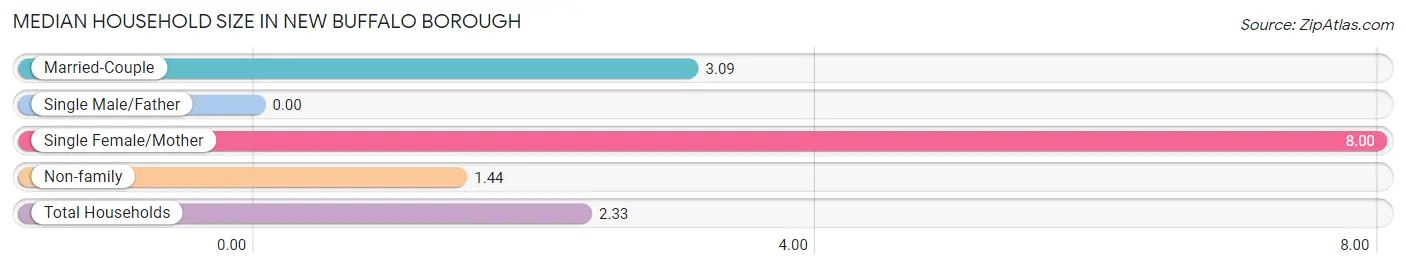
| Household Type | # Households | Household Size |
| Married-Couple | 22 (45.8%) | 3.09 |
| Single Male/Father | 0 (0.0%) | - |
| Single Female/Mother | 1 (2.1%) | 8.00 |
| Non-family | 25 (52.1%) | 1.44 |
| Total Households | 48 (100.0%) | 2.33 |
Household Size by Marriage Status in New Buffalo borough
Out of a total of 48 households in New Buffalo borough, 23 (47.9%) are family households, while 25 (52.1%) are nonfamily households. The most numerous type of family households are 4-person households, comprising 11, and the most common type of nonfamily households are 1-person households, comprising 20.
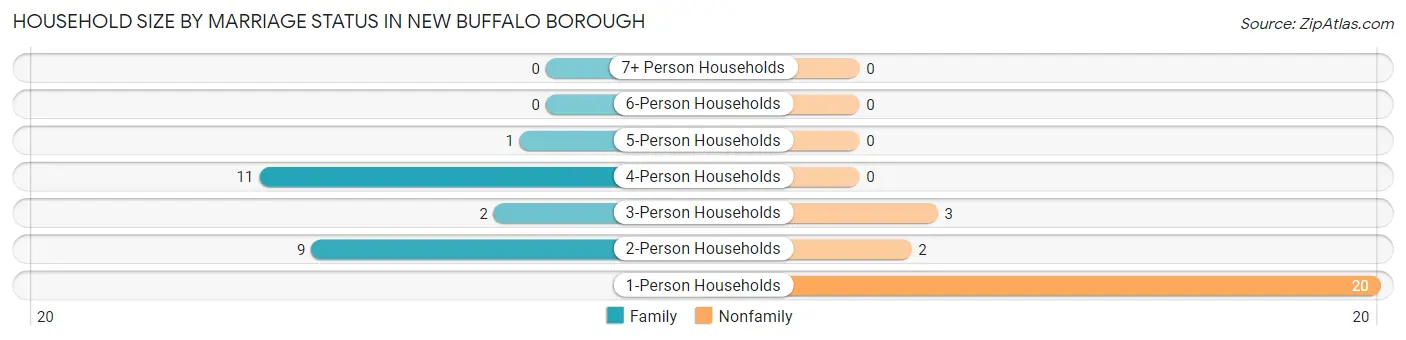
| Household Size | Family Households | Nonfamily Households |
| 1-Person Households | - | 20 (41.7%) |
| 2-Person Households | 9 (18.8%) | 2 (4.2%) |
| 3-Person Households | 2 (4.2%) | 3 (6.2%) |
| 4-Person Households | 11 (22.9%) | 0 (0.0%) |
| 5-Person Households | 1 (2.1%) | 0 (0.0%) |
| 6-Person Households | 0 (0.0%) | 0 (0.0%) |
| 7+ Person Households | 0 (0.0%) | 0 (0.0%) |
| Total | 23 (47.9%) | 25 (52.1%) |
Female Fertility in New Buffalo borough
Fertility by Age in New Buffalo borough
| Age Bracket | Women with Births | Births / 1,000 Women |
| 15 to 19 years | 0 (0.0%) | 0.0 |
| 20 to 34 years | 0 (0.0%) | 0.0 |
| 35 to 50 years | 0 (0.0%) | 0.0 |
| Total | 0 (0.0%) | 0.0 |
Fertility by Age by Marriage Status in New Buffalo borough
| Age Bracket | Married | Unmarried |
| 15 to 19 years | 0 (0.0%) | 0 (0.0%) |
| 20 to 34 years | 0 (0.0%) | 0 (0.0%) |
| 35 to 50 years | 0 (0.0%) | 0 (0.0%) |
| Total | 0 (0.0%) | 0 (0.0%) |
Fertility by Education in New Buffalo borough
| Educational Attainment | Women with Births | Births / 1,000 Women |
| Less than High School | 0 (0.0%) | 0.0 |
| High School Diploma | 0 (0.0%) | 0.0 |
| College or Associate's Degree | 0 (0.0%) | 0.0 |
| Bachelor's Degree | 0 (0.0%) | 0.0 |
| Graduate Degree | 0 (0.0%) | 0.0 |
| Total | 0 (0.0%) | 0.0 |
Fertility by Education by Marriage Status in New Buffalo borough
| Educational Attainment | Married | Unmarried |
| Less than High School | 0 (0.0%) | 0 (0.0%) |
| High School Diploma | 0 (0.0%) | 0 (0.0%) |
| College or Associate's Degree | 0 (0.0%) | 0 (0.0%) |
| Bachelor's Degree | 0 (0.0%) | 0 (0.0%) |
| Graduate Degree | 0 (0.0%) | 0 (0.0%) |
| Total | 0 (0.0%) | 0 (0.0%) |
Employment Characteristics in New Buffalo borough
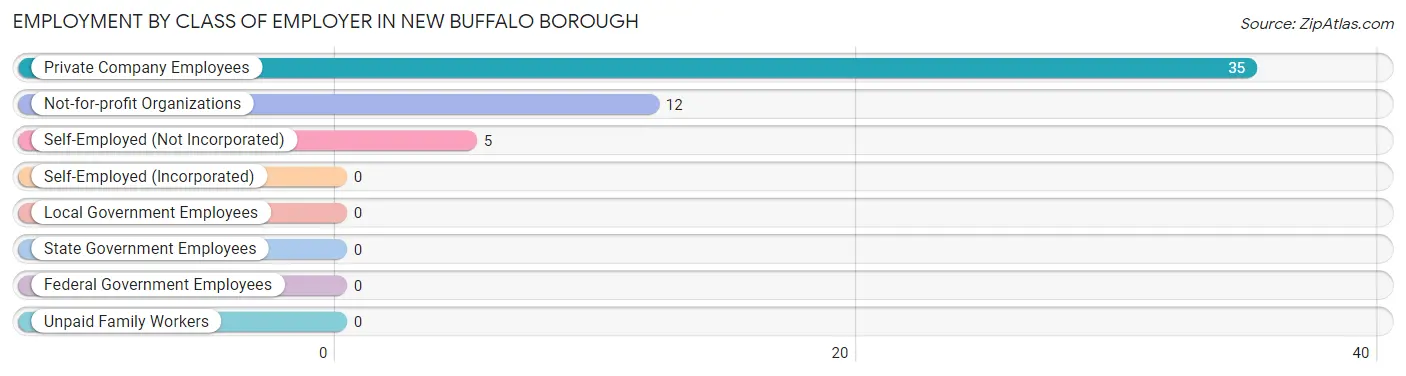
Employment by Class of Employer in New Buffalo borough
Among the 52 employed individuals in New Buffalo borough, private company employees (35 | 67.3%), not-for-profit organizations (12 | 23.1%), and self-employed (not incorporated) (5 | 9.6%) make up the most common classes of employment.
| Employer Class | # Employees | % Employees |
| Private Company Employees | 35 | 67.3% |
| Self-Employed (Incorporated) | 0 | 0.0% |
| Self-Employed (Not Incorporated) | 5 | 9.6% |
| Not-for-profit Organizations | 12 | 23.1% |
| Local Government Employees | 0 | 0.0% |
| State Government Employees | 0 | 0.0% |
| Federal Government Employees | 0 | 0.0% |
| Unpaid Family Workers | 0 | 0.0% |
| Total | 52 | 100.0% |
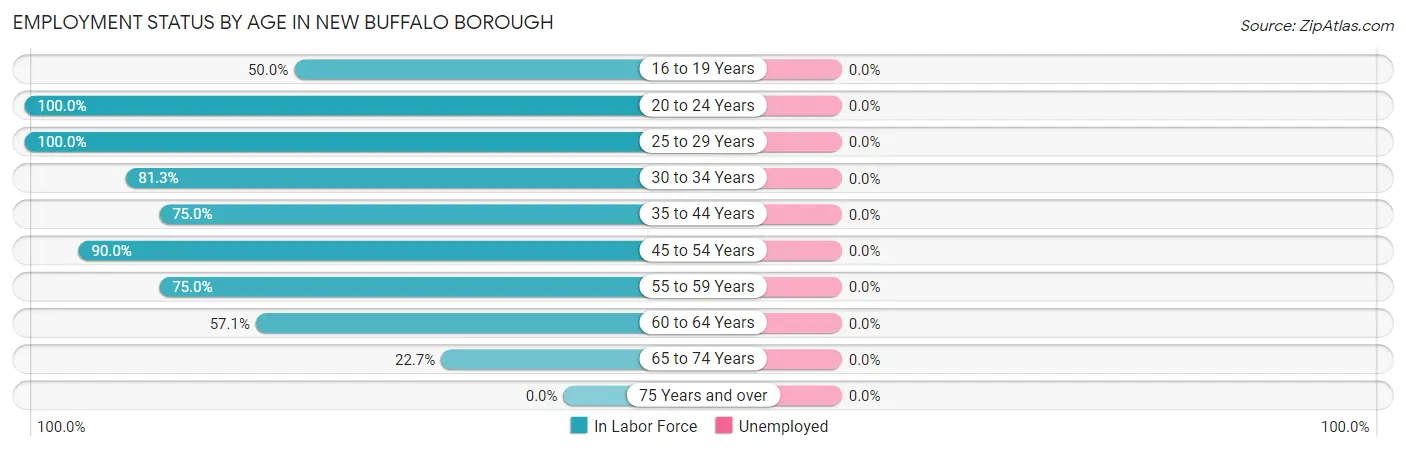
Employment Status by Age in New Buffalo borough
| Age Bracket | In Labor Force | Unemployed |
| 16 to 19 Years | 3 (50.0%) | 0 (0.0%) |
| 20 to 24 Years | 4 (100.0%) | 0 (0.0%) |
| 25 to 29 Years | 2 (100.0%) | 0 (0.0%) |
| 30 to 34 Years | 13 (81.3%) | 0 (0.0%) |
| 35 to 44 Years | 9 (75.0%) | 0 (0.0%) |
| 45 to 54 Years | 9 (90.0%) | 0 (0.0%) |
| 55 to 59 Years | 3 (75.0%) | 0 (0.0%) |
| 60 to 64 Years | 4 (57.1%) | 0 (0.0%) |
| 65 to 74 Years | 5 (22.7%) | 0 (0.0%) |
| 75 Years and over | 0 (0.0%) | 0 (0.0%) |
| Total | 52 (55.9%) | 0 (0.0%) |
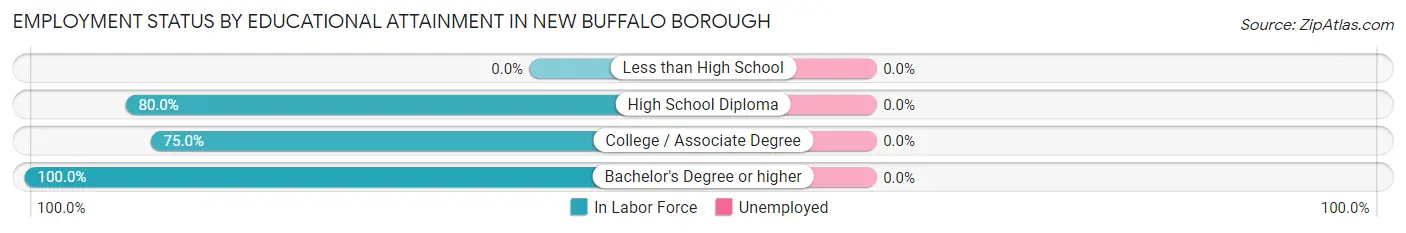
Employment Status by Educational Attainment in New Buffalo borough
| Educational Attainment | In Labor Force | Unemployed |
| Less than High School | 0 (0.0%) | 0 (0.0%) |
| High School Diploma | 28 (80.0%) | 0 (0.0%) |
| College / Associate Degree | 9 (75.0%) | 0 (0.0%) |
| Bachelor's Degree or higher | 3 (100.0%) | 0 (0.0%) |
| Total | 40 (78.4%) | 0 (0.0%) |
Employment Occupations by Sex in New Buffalo borough
Management, Business, Science and Arts Occupations
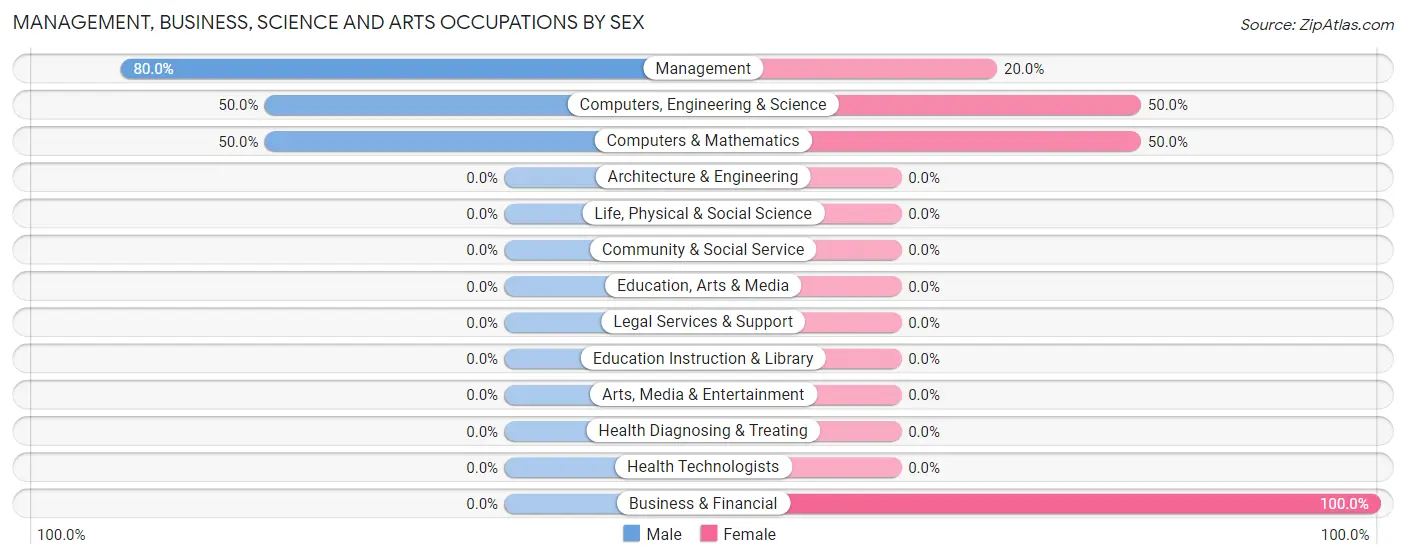
The most common Management, Business, Science and Arts occupations in New Buffalo borough are Computers, Engineering & Science (8 | 15.4%), Computers & Mathematics (8 | 15.4%), Management (5 | 9.6%), and Business & Financial (2 | 3.8%).
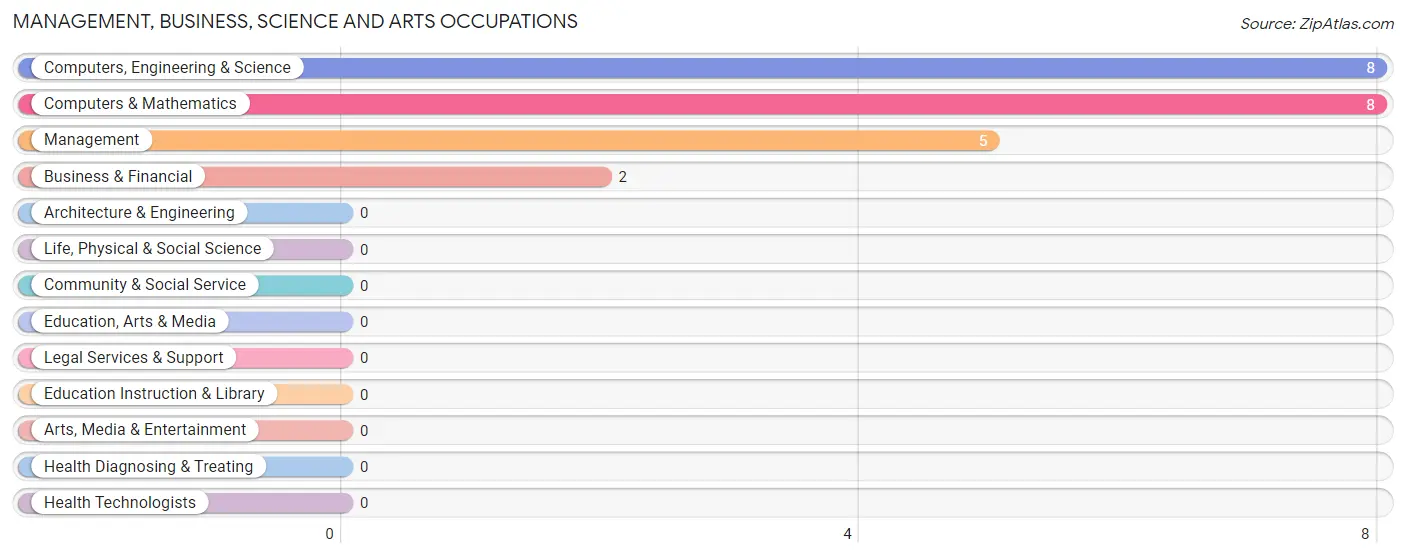
Management, Business, Science and Arts Occupations by Sex
Within the Management, Business, Science and Arts occupations in New Buffalo borough, the most male-oriented occupations are Management (80.0%), Computers, Engineering & Science (50.0%), and Computers & Mathematics (50.0%), while the most female-oriented occupations are Business & Financial (100.0%), Computers, Engineering & Science (50.0%), and Computers & Mathematics (50.0%).
| Occupation | Male | Female |
| Management | 4 (80.0%) | 1 (20.0%) |
| Business & Financial | 0 (0.0%) | 2 (100.0%) |
| Computers, Engineering & Science | 4 (50.0%) | 4 (50.0%) |
| Computers & Mathematics | 4 (50.0%) | 4 (50.0%) |
| Architecture & Engineering | 0 (0.0%) | 0 (0.0%) |
| Life, Physical & Social Science | 0 (0.0%) | 0 (0.0%) |
| Community & Social Service | 0 (0.0%) | 0 (0.0%) |
| Education, Arts & Media | 0 (0.0%) | 0 (0.0%) |
| Legal Services & Support | 0 (0.0%) | 0 (0.0%) |
| Education Instruction & Library | 0 (0.0%) | 0 (0.0%) |
| Arts, Media & Entertainment | 0 (0.0%) | 0 (0.0%) |
| Health Diagnosing & Treating | 0 (0.0%) | 0 (0.0%) |
| Health Technologists | 0 (0.0%) | 0 (0.0%) |
| Total (Category) | 8 (53.3%) | 7 (46.7%) |
| Total (Overall) | 33 (63.5%) | 19 (36.5%) |
Services Occupations
The most common Services occupations in New Buffalo borough are Personal Care & Service (4 | 7.7%), Healthcare Support (1 | 1.9%), and Food Preparation & Serving (1 | 1.9%).
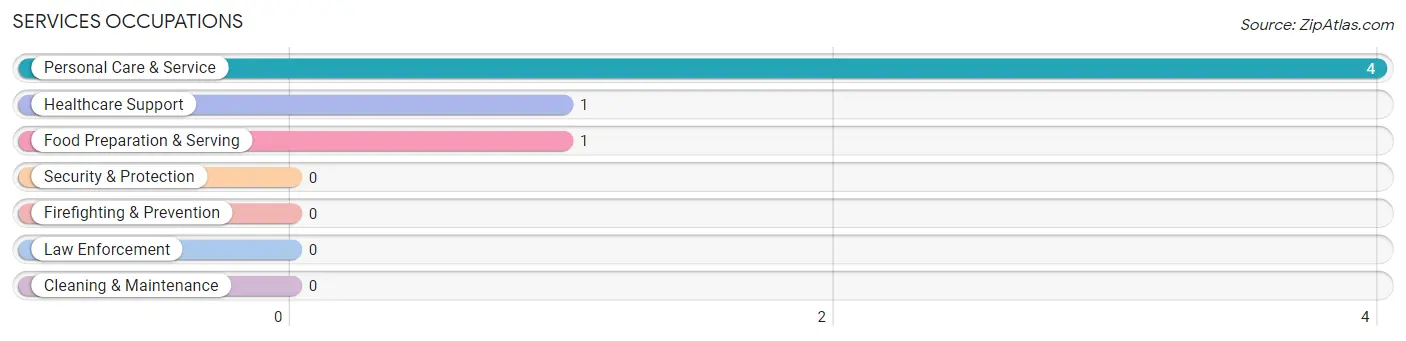
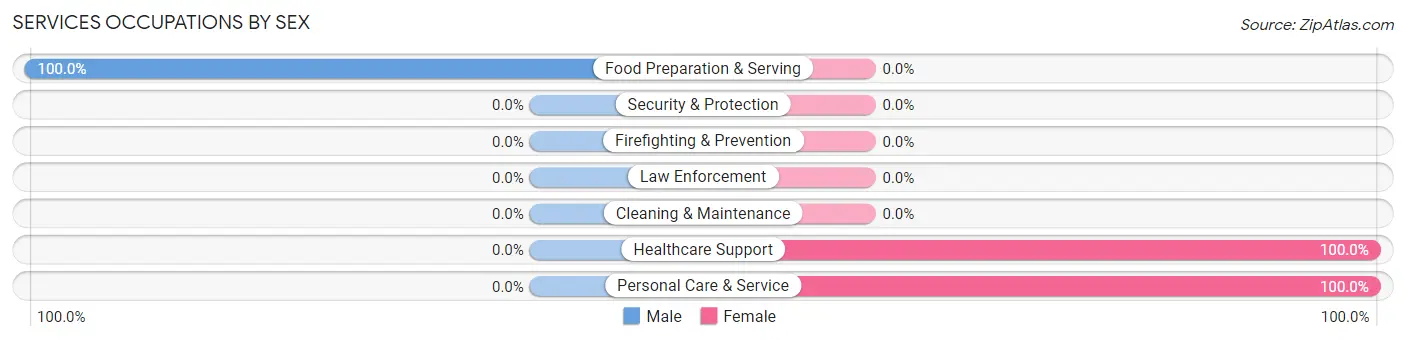
Services Occupations by Sex
| Occupation | Male | Female |
| Healthcare Support | 0 (0.0%) | 1 (100.0%) |
| Security & Protection | 0 (0.0%) | 0 (0.0%) |
| Firefighting & Prevention | 0 (0.0%) | 0 (0.0%) |
| Law Enforcement | 0 (0.0%) | 0 (0.0%) |
| Food Preparation & Serving | 1 (100.0%) | 0 (0.0%) |
| Cleaning & Maintenance | 0 (0.0%) | 0 (0.0%) |
| Personal Care & Service | 0 (0.0%) | 4 (100.0%) |
| Total (Category) | 1 (16.7%) | 5 (83.3%) |
| Total (Overall) | 33 (63.5%) | 19 (36.5%) |
Sales and Office Occupations
The most common Sales and Office occupations in New Buffalo borough are , and Office & Administration (6 | 11.5%).
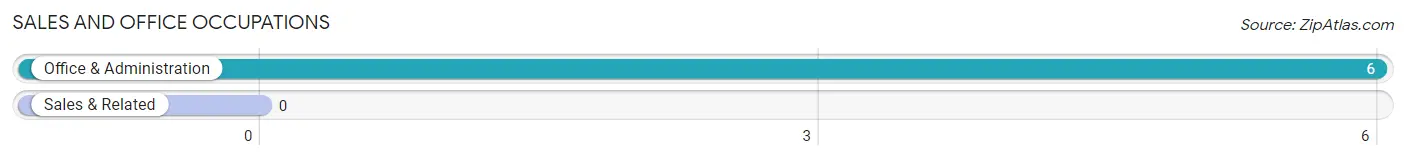
Sales and Office Occupations by Sex
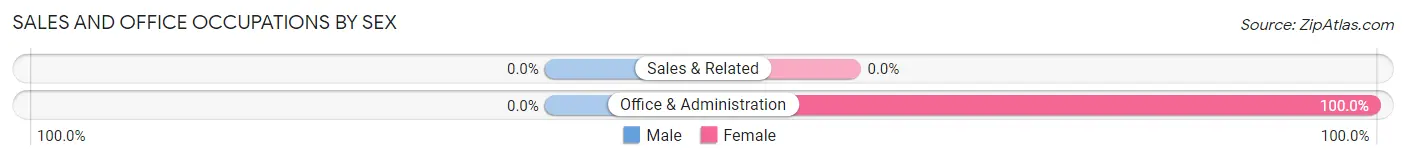
| Occupation | Male | Female |
| Sales & Related | 0 (0.0%) | 0 (0.0%) |
| Office & Administration | 0 (0.0%) | 6 (100.0%) |
| Total (Category) | 0 (0.0%) | 6 (100.0%) |
| Total (Overall) | 33 (63.5%) | 19 (36.5%) |
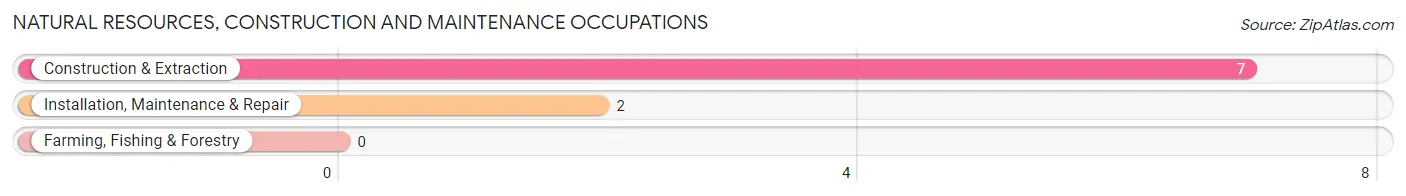
Natural Resources, Construction and Maintenance Occupations
The most common Natural Resources, Construction and Maintenance occupations in New Buffalo borough are Construction & Extraction (7 | 13.5%), and Installation, Maintenance & Repair (2 | 3.8%).
Natural Resources, Construction and Maintenance Occupations by Sex
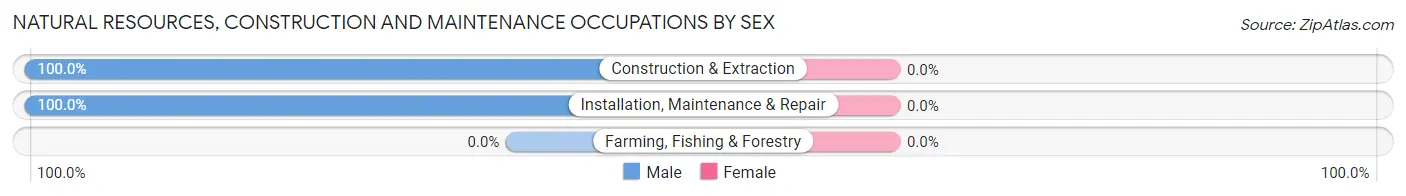
| Occupation | Male | Female |
| Farming, Fishing & Forestry | 0 (0.0%) | 0 (0.0%) |
| Construction & Extraction | 7 (100.0%) | 0 (0.0%) |
| Installation, Maintenance & Repair | 2 (100.0%) | 0 (0.0%) |
| Total (Category) | 9 (100.0%) | 0 (0.0%) |
| Total (Overall) | 33 (63.5%) | 19 (36.5%) |
Production, Transportation and Moving Occupations
The most common Production, Transportation and Moving occupations in New Buffalo borough are Transportation (7 | 13.5%), Production (5 | 9.6%), and Material Moving (4 | 7.7%).
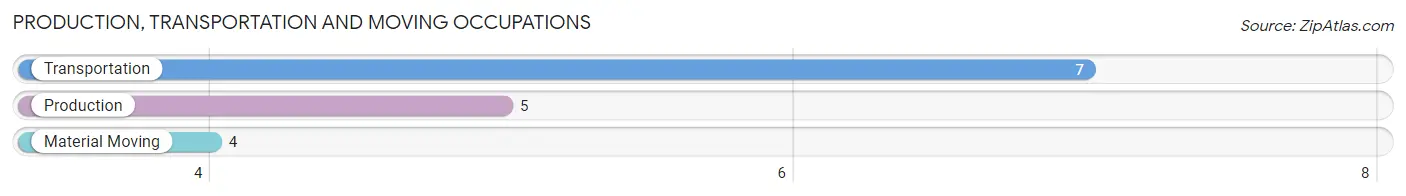
Production, Transportation and Moving Occupations by Sex
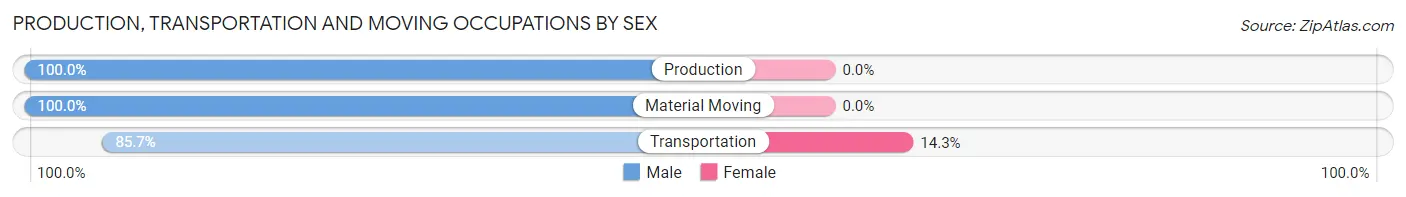
| Occupation | Male | Female |
| Production | 5 (100.0%) | 0 (0.0%) |
| Transportation | 6 (85.7%) | 1 (14.3%) |
| Material Moving | 4 (100.0%) | 0 (0.0%) |
| Total (Category) | 15 (93.8%) | 1 (6.2%) |
| Total (Overall) | 33 (63.5%) | 19 (36.5%) |
Employment Industries by Sex in New Buffalo borough
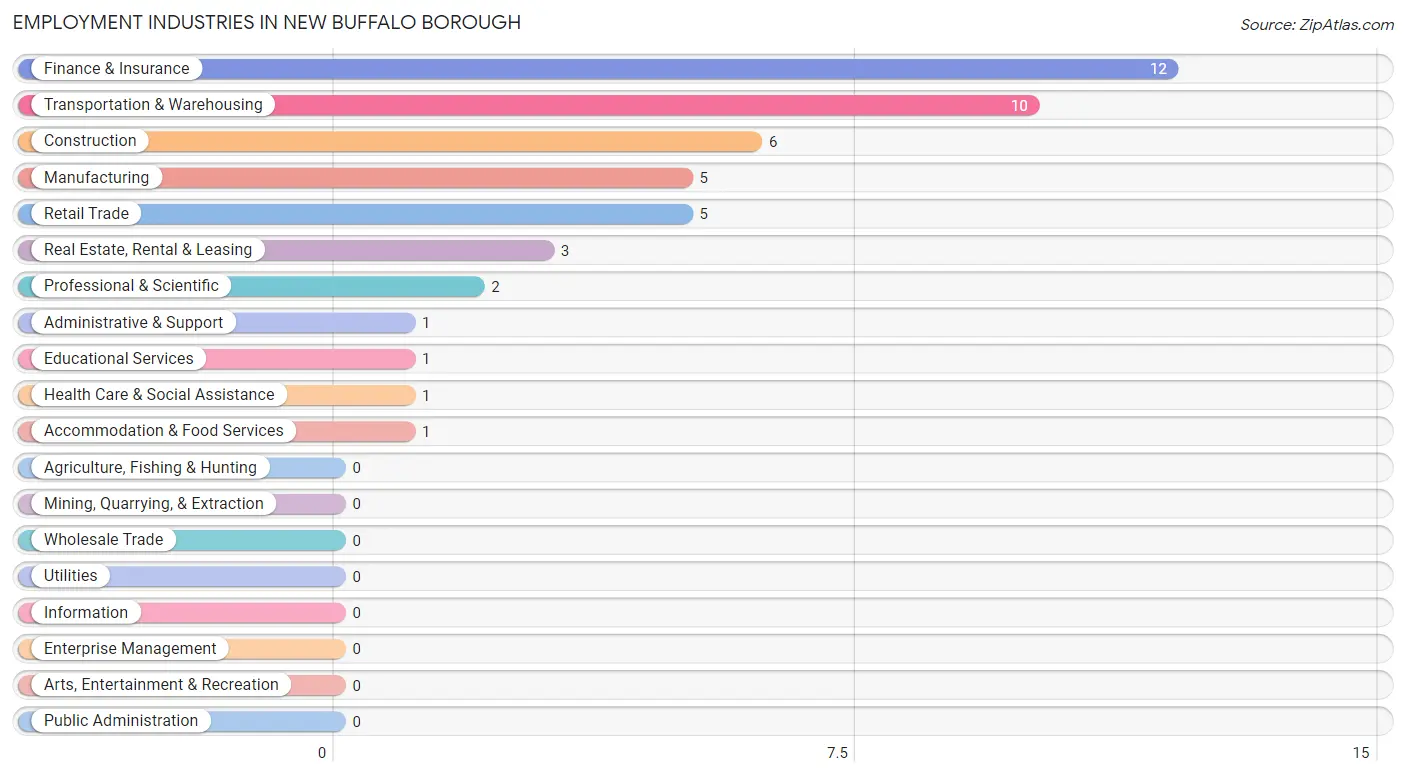
Employment Industries in New Buffalo borough
The major employment industries in New Buffalo borough include Finance & Insurance (12 | 23.1%), Transportation & Warehousing (10 | 19.2%), Construction (6 | 11.5%), Manufacturing (5 | 9.6%), and Retail Trade (5 | 9.6%).
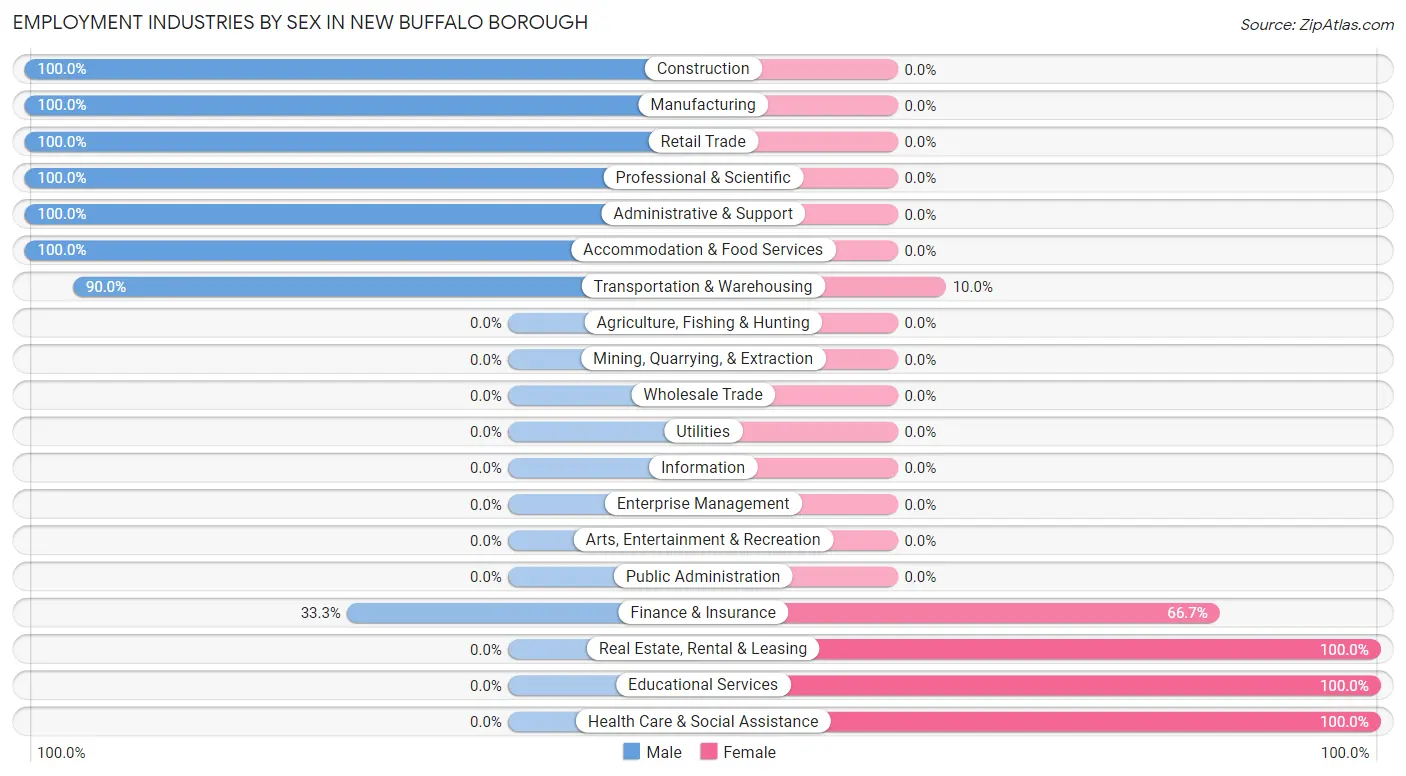
Employment Industries by Sex in New Buffalo borough
The New Buffalo borough industries that see more men than women are Construction (100.0%), Manufacturing (100.0%), and Retail Trade (100.0%), whereas the industries that tend to have a higher number of women are Real Estate, Rental & Leasing (100.0%), Educational Services (100.0%), and Health Care & Social Assistance (100.0%).
| Industry | Male | Female |
| Agriculture, Fishing & Hunting | 0 (0.0%) | 0 (0.0%) |
| Mining, Quarrying, & Extraction | 0 (0.0%) | 0 (0.0%) |
| Construction | 6 (100.0%) | 0 (0.0%) |
| Manufacturing | 5 (100.0%) | 0 (0.0%) |
| Wholesale Trade | 0 (0.0%) | 0 (0.0%) |
| Retail Trade | 5 (100.0%) | 0 (0.0%) |
| Transportation & Warehousing | 9 (90.0%) | 1 (10.0%) |
| Utilities | 0 (0.0%) | 0 (0.0%) |
| Information | 0 (0.0%) | 0 (0.0%) |
| Finance & Insurance | 4 (33.3%) | 8 (66.7%) |
| Real Estate, Rental & Leasing | 0 (0.0%) | 3 (100.0%) |
| Professional & Scientific | 2 (100.0%) | 0 (0.0%) |
| Enterprise Management | 0 (0.0%) | 0 (0.0%) |
| Administrative & Support | 1 (100.0%) | 0 (0.0%) |
| Educational Services | 0 (0.0%) | 1 (100.0%) |
| Health Care & Social Assistance | 0 (0.0%) | 1 (100.0%) |
| Arts, Entertainment & Recreation | 0 (0.0%) | 0 (0.0%) |
| Accommodation & Food Services | 1 (100.0%) | 0 (0.0%) |
| Public Administration | 0 (0.0%) | 0 (0.0%) |
| Total | 33 (63.5%) | 19 (36.5%) |
Education in New Buffalo borough
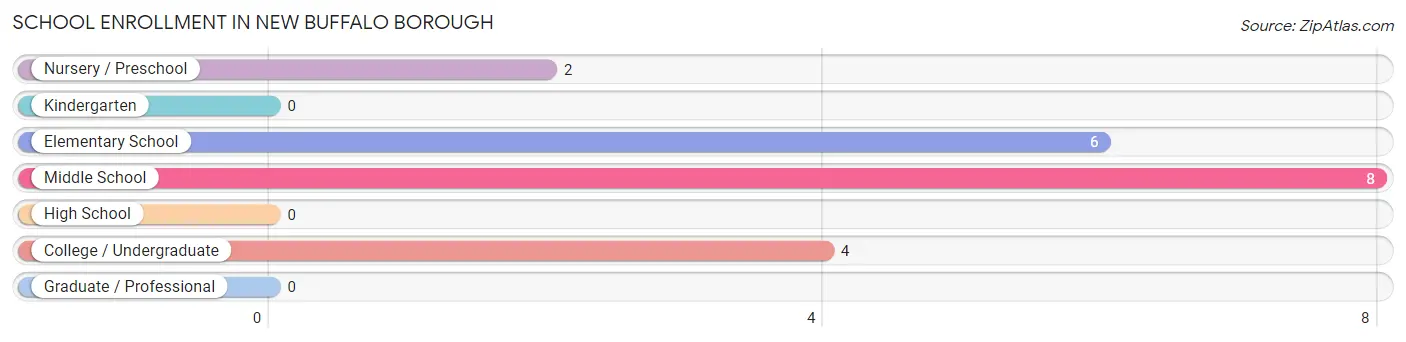
School Enrollment in New Buffalo borough
The most common levels of schooling among the 20 students in New Buffalo borough are middle school (8 | 40.0%), elementary school (6 | 30.0%), and college / undergraduate (4 | 20.0%).
| School Level | # Students | % Students |
| Nursery / Preschool | 2 | 10.0% |
| Kindergarten | 0 | 0.0% |
| Elementary School | 6 | 30.0% |
| Middle School | 8 | 40.0% |
| High School | 0 | 0.0% |
| College / Undergraduate | 4 | 20.0% |
| Graduate / Professional | 0 | 0.0% |
| Total | 20 | 100.0% |
School Enrollment by Age by Funding Source in New Buffalo borough
Out of a total of 20 students who are enrolled in schools in New Buffalo borough, 2 (10.0%) attend a private institution, while the remaining 18 (90.0%) are enrolled in public schools. The age group of 5 to 9 year old has the highest likelihood of being enrolled in private schools, with 2 (25.0% in the age bracket) enrolled. Conversely, the age group of 10 to 14 year olds has the lowest likelihood of being enrolled in a private school, with 8 (100.0% in the age bracket) attending a public institution.
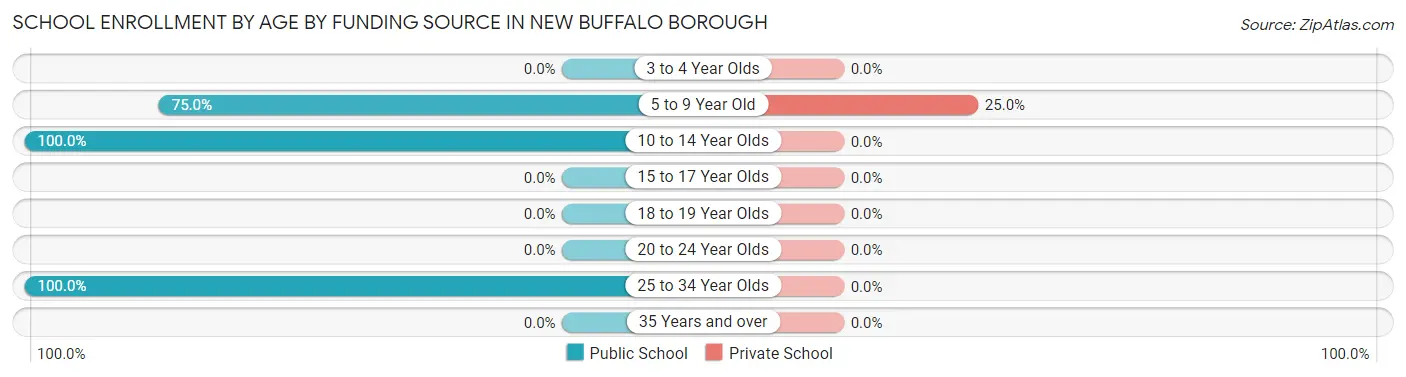
| Age Bracket | Public School | Private School |
| 3 to 4 Year Olds | 0 (0.0%) | 0 (0.0%) |
| 5 to 9 Year Old | 6 (75.0%) | 2 (25.0%) |
| 10 to 14 Year Olds | 8 (100.0%) | 0 (0.0%) |
| 15 to 17 Year Olds | 0 (0.0%) | 0 (0.0%) |
| 18 to 19 Year Olds | 0 (0.0%) | 0 (0.0%) |
| 20 to 24 Year Olds | 0 (0.0%) | 0 (0.0%) |
| 25 to 34 Year Olds | 4 (100.0%) | 0 (0.0%) |
| 35 Years and over | 0 (0.0%) | 0 (0.0%) |
| Total | 18 (90.0%) | 2 (10.0%) |
Educational Attainment by Field of Study in New Buffalo borough
Bio, nature & agricultural (3 | 50.0%), business (1 | 16.7%), education (1 | 16.7%), and visual & performing arts (1 | 16.7%) are the most common fields of study among 6 individuals in New Buffalo borough who have obtained a bachelor's degree or higher.
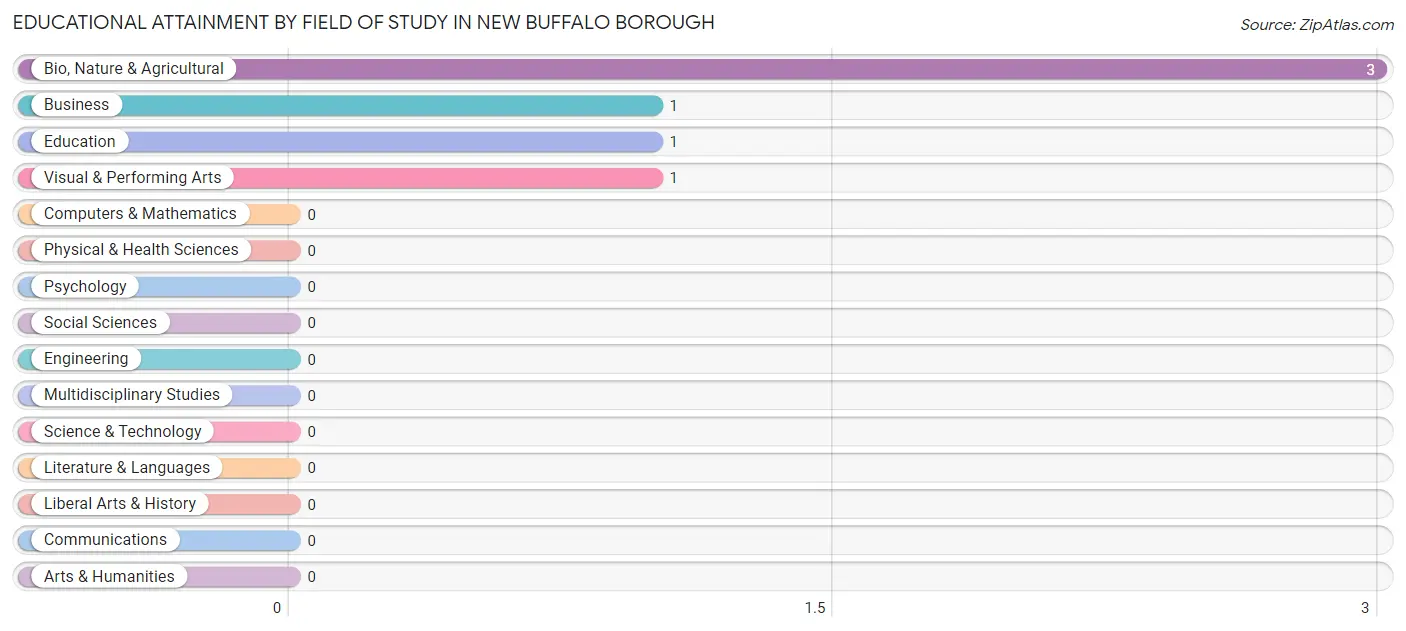
| Field of Study | # Graduates | % Graduates |
| Computers & Mathematics | 0 | 0.0% |
| Bio, Nature & Agricultural | 3 | 50.0% |
| Physical & Health Sciences | 0 | 0.0% |
| Psychology | 0 | 0.0% |
| Social Sciences | 0 | 0.0% |
| Engineering | 0 | 0.0% |
| Multidisciplinary Studies | 0 | 0.0% |
| Science & Technology | 0 | 0.0% |
| Business | 1 | 16.7% |
| Education | 1 | 16.7% |
| Literature & Languages | 0 | 0.0% |
| Liberal Arts & History | 0 | 0.0% |
| Visual & Performing Arts | 1 | 16.7% |
| Communications | 0 | 0.0% |
| Arts & Humanities | 0 | 0.0% |
| Total | 6 | 100.0% |
Transportation & Commute in New Buffalo borough
Vehicle Availability by Sex in New Buffalo borough
The most prevalent vehicle ownership categories in New Buffalo borough are males with 3 vehicles (13, accounting for 39.4%) and females with 3 vehicles (5, making up 68.4%).
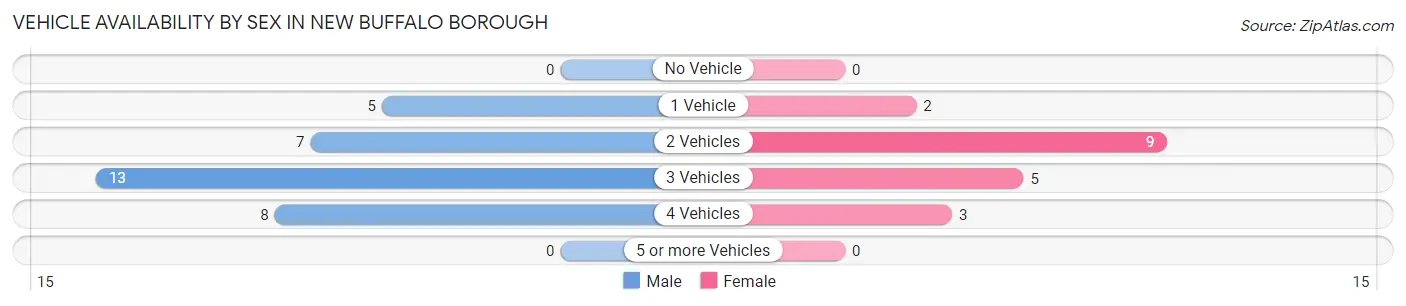
| Vehicles Available | Male | Female |
| No Vehicle | 0 (0.0%) | 0 (0.0%) |
| 1 Vehicle | 5 (15.1%) | 2 (10.5%) |
| 2 Vehicles | 7 (21.2%) | 9 (47.4%) |
| 3 Vehicles | 13 (39.4%) | 5 (26.3%) |
| 4 Vehicles | 8 (24.2%) | 3 (15.8%) |
| 5 or more Vehicles | 0 (0.0%) | 0 (0.0%) |
| Total | 33 (100.0%) | 19 (100.0%) |
Commute Time in New Buffalo borough
The most frequently occuring commute durations in New Buffalo borough are 30 to 34 minutes (17 commuters, 34.7%), 25 to 29 minutes (12 commuters, 24.5%), and 20 to 24 minutes (8 commuters, 16.3%).
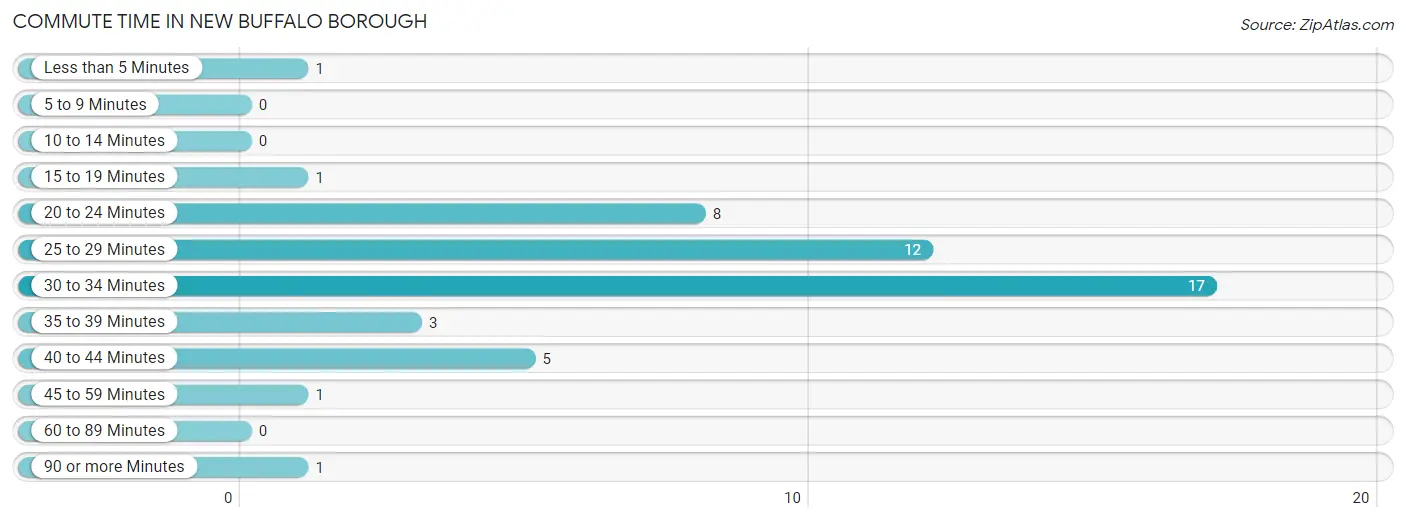
| Commute Time | # Commuters | % Commuters |
| Less than 5 Minutes | 1 | 2.0% |
| 5 to 9 Minutes | 0 | 0.0% |
| 10 to 14 Minutes | 0 | 0.0% |
| 15 to 19 Minutes | 1 | 2.0% |
| 20 to 24 Minutes | 8 | 16.3% |
| 25 to 29 Minutes | 12 | 24.5% |
| 30 to 34 Minutes | 17 | 34.7% |
| 35 to 39 Minutes | 3 | 6.1% |
| 40 to 44 Minutes | 5 | 10.2% |
| 45 to 59 Minutes | 1 | 2.0% |
| 60 to 89 Minutes | 0 | 0.0% |
| 90 or more Minutes | 1 | 2.0% |
Commute Time by Sex in New Buffalo borough
The most common commute times in New Buffalo borough are 30 to 34 minutes (17 commuters, 51.5%) for males and 25 to 29 minutes (8 commuters, 50.0%) for females.
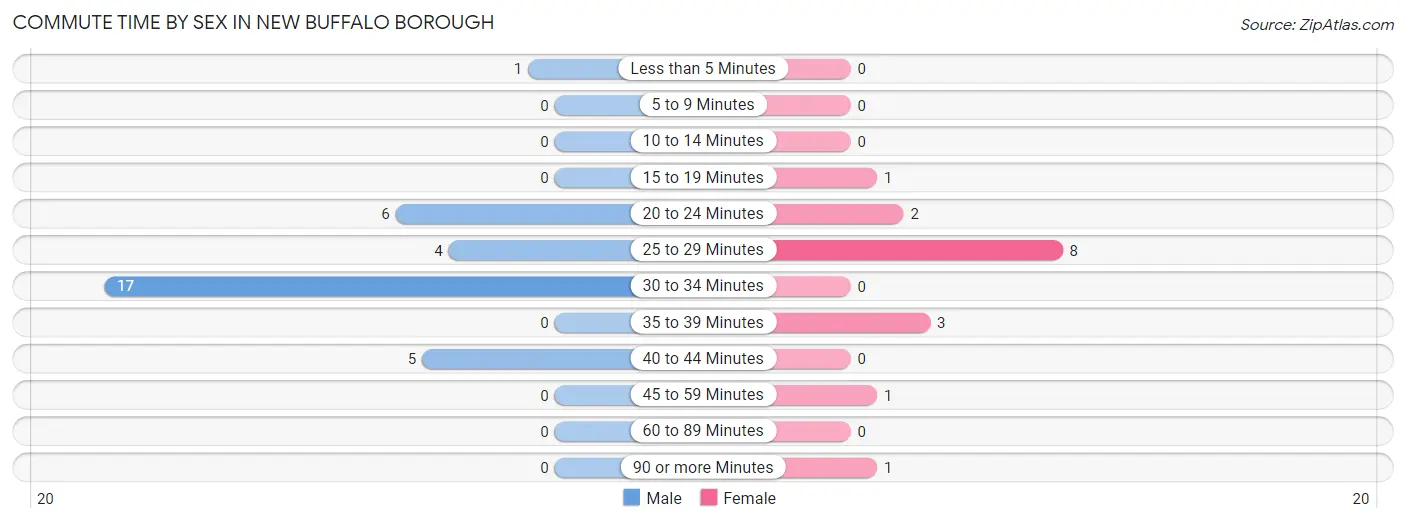
| Commute Time | Male | Female |
| Less than 5 Minutes | 1 (3.0%) | 0 (0.0%) |
| 5 to 9 Minutes | 0 (0.0%) | 0 (0.0%) |
| 10 to 14 Minutes | 0 (0.0%) | 0 (0.0%) |
| 15 to 19 Minutes | 0 (0.0%) | 1 (6.2%) |
| 20 to 24 Minutes | 6 (18.2%) | 2 (12.5%) |
| 25 to 29 Minutes | 4 (12.1%) | 8 (50.0%) |
| 30 to 34 Minutes | 17 (51.5%) | 0 (0.0%) |
| 35 to 39 Minutes | 0 (0.0%) | 3 (18.8%) |
| 40 to 44 Minutes | 5 (15.1%) | 0 (0.0%) |
| 45 to 59 Minutes | 0 (0.0%) | 1 (6.2%) |
| 60 to 89 Minutes | 0 (0.0%) | 0 (0.0%) |
| 90 or more Minutes | 0 (0.0%) | 1 (6.2%) |
Time of Departure to Work by Sex in New Buffalo borough
The most frequent times of departure to work in New Buffalo borough are 4:00 PM to 11:59 PM (13, 39.4%) for males and 5:30 AM to 5:59 AM (8, 50.0%) for females.
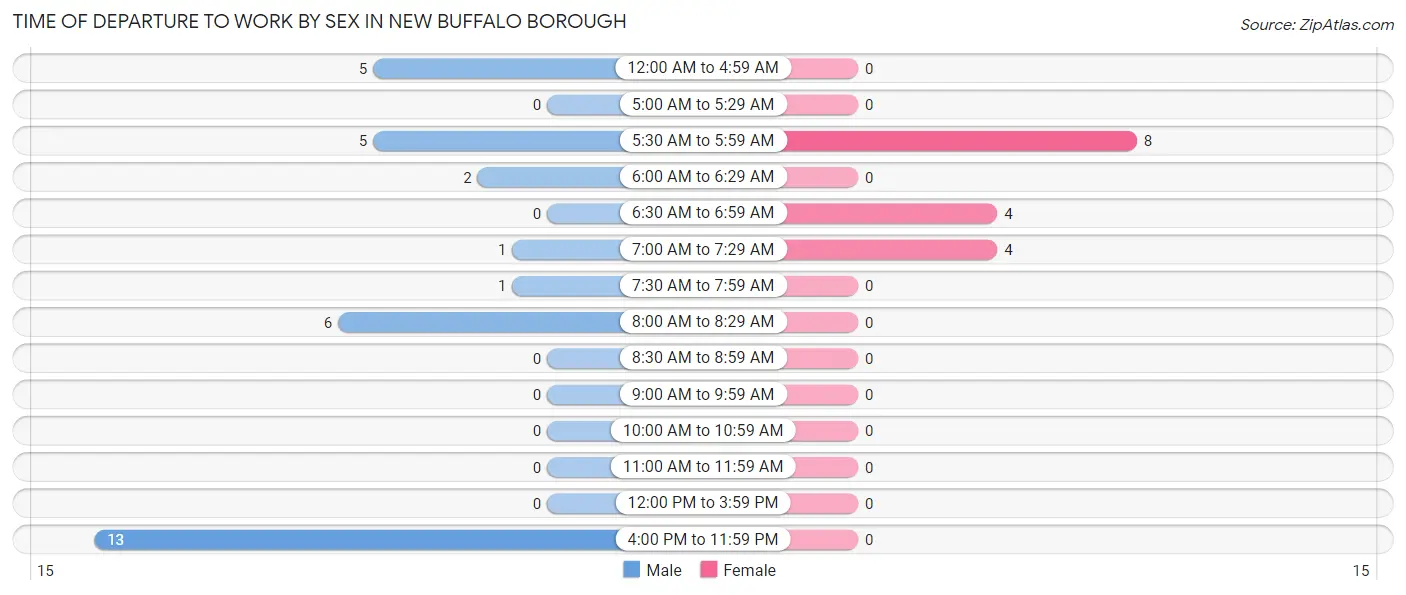
| Time of Departure | Male | Female |
| 12:00 AM to 4:59 AM | 5 (15.1%) | 0 (0.0%) |
| 5:00 AM to 5:29 AM | 0 (0.0%) | 0 (0.0%) |
| 5:30 AM to 5:59 AM | 5 (15.1%) | 8 (50.0%) |
| 6:00 AM to 6:29 AM | 2 (6.1%) | 0 (0.0%) |
| 6:30 AM to 6:59 AM | 0 (0.0%) | 4 (25.0%) |
| 7:00 AM to 7:29 AM | 1 (3.0%) | 4 (25.0%) |
| 7:30 AM to 7:59 AM | 1 (3.0%) | 0 (0.0%) |
| 8:00 AM to 8:29 AM | 6 (18.2%) | 0 (0.0%) |
| 8:30 AM to 8:59 AM | 0 (0.0%) | 0 (0.0%) |
| 9:00 AM to 9:59 AM | 0 (0.0%) | 0 (0.0%) |
| 10:00 AM to 10:59 AM | 0 (0.0%) | 0 (0.0%) |
| 11:00 AM to 11:59 AM | 0 (0.0%) | 0 (0.0%) |
| 12:00 PM to 3:59 PM | 0 (0.0%) | 0 (0.0%) |
| 4:00 PM to 11:59 PM | 13 (39.4%) | 0 (0.0%) |
| Total | 33 (100.0%) | 16 (100.0%) |
Housing Occupancy in New Buffalo borough
Occupancy by Ownership in New Buffalo borough
Of the total 48 dwellings in New Buffalo borough, owner-occupied units account for 26 (54.2%), while renter-occupied units make up 22 (45.8%).
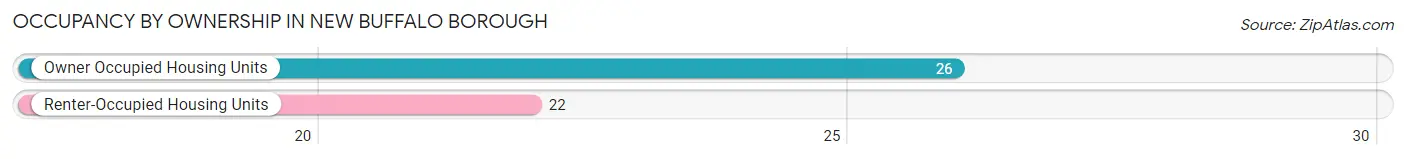
| Occupancy | # Housing Units | % Housing Units |
| Owner Occupied Housing Units | 26 | 54.2% |
| Renter-Occupied Housing Units | 22 | 45.8% |
| Total Occupied Housing Units | 48 | 100.0% |
Occupancy by Household Size in New Buffalo borough
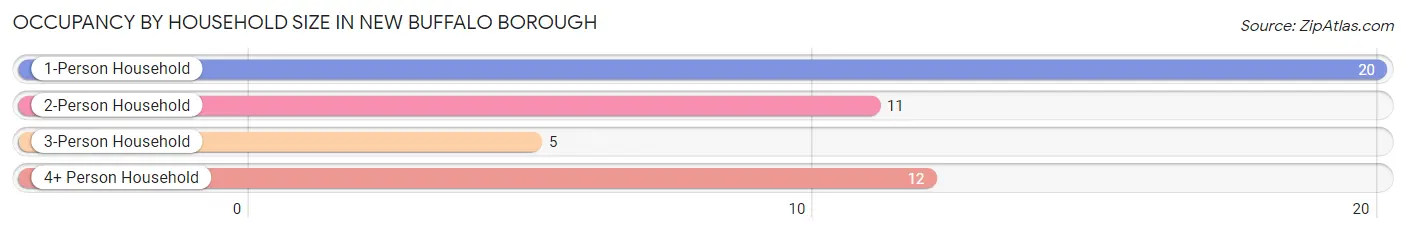
| Household Size | # Housing Units | % Housing Units |
| 1-Person Household | 20 | 41.7% |
| 2-Person Household | 11 | 22.9% |
| 3-Person Household | 5 | 10.4% |
| 4+ Person Household | 12 | 25.0% |
| Total Housing Units | 48 | 100.0% |
Occupancy by Ownership by Household Size in New Buffalo borough
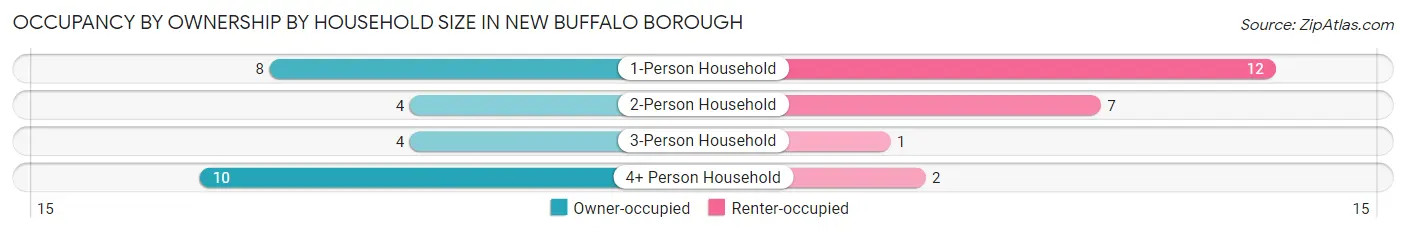
| Household Size | Owner-occupied | Renter-occupied |
| 1-Person Household | 8 (40.0%) | 12 (60.0%) |
| 2-Person Household | 4 (36.4%) | 7 (63.6%) |
| 3-Person Household | 4 (80.0%) | 1 (20.0%) |
| 4+ Person Household | 10 (83.3%) | 2 (16.7%) |
| Total Housing Units | 26 (54.2%) | 22 (45.8%) |
Occupancy by Educational Attainment in New Buffalo borough
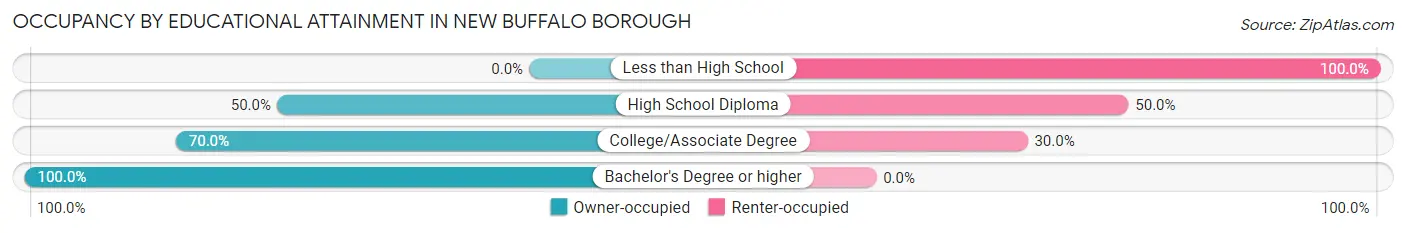
| Household Size | Owner-occupied | Renter-occupied |
| Less than High School | 0 (0.0%) | 5 (100.0%) |
| High School Diploma | 14 (50.0%) | 14 (50.0%) |
| College/Associate Degree | 7 (70.0%) | 3 (30.0%) |
| Bachelor's Degree or higher | 5 (100.0%) | 0 (0.0%) |
Occupancy by Age of Householder in New Buffalo borough
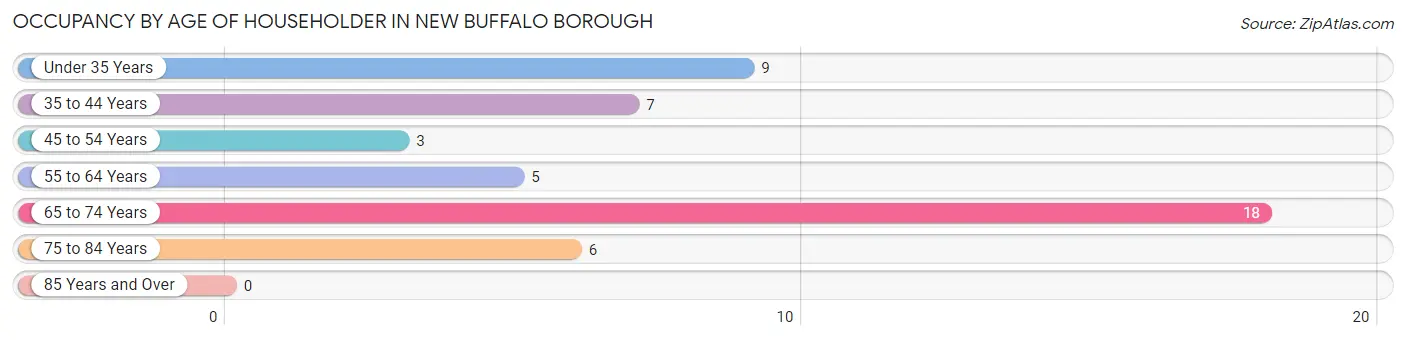
| Age Bracket | # Households | % Households |
| Under 35 Years | 9 | 18.8% |
| 35 to 44 Years | 7 | 14.6% |
| 45 to 54 Years | 3 | 6.2% |
| 55 to 64 Years | 5 | 10.4% |
| 65 to 74 Years | 18 | 37.5% |
| 75 to 84 Years | 6 | 12.5% |
| 85 Years and Over | 0 | 0.0% |
| Total | 48 | 100.0% |
Housing Finances in New Buffalo borough
Median Income by Occupancy in New Buffalo borough
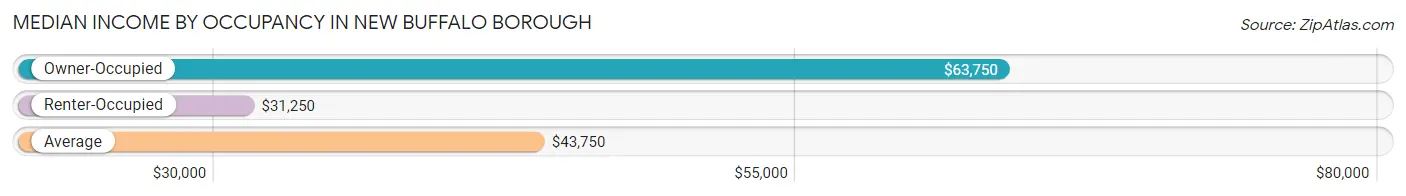
| Occupancy Type | # Households | Median Income |
| Owner-Occupied | 26 (54.2%) | $63,750 |
| Renter-Occupied | 22 (45.8%) | $31,250 |
| Average | 48 (100.0%) | $43,750 |
Occupancy by Householder Income Bracket in New Buffalo borough
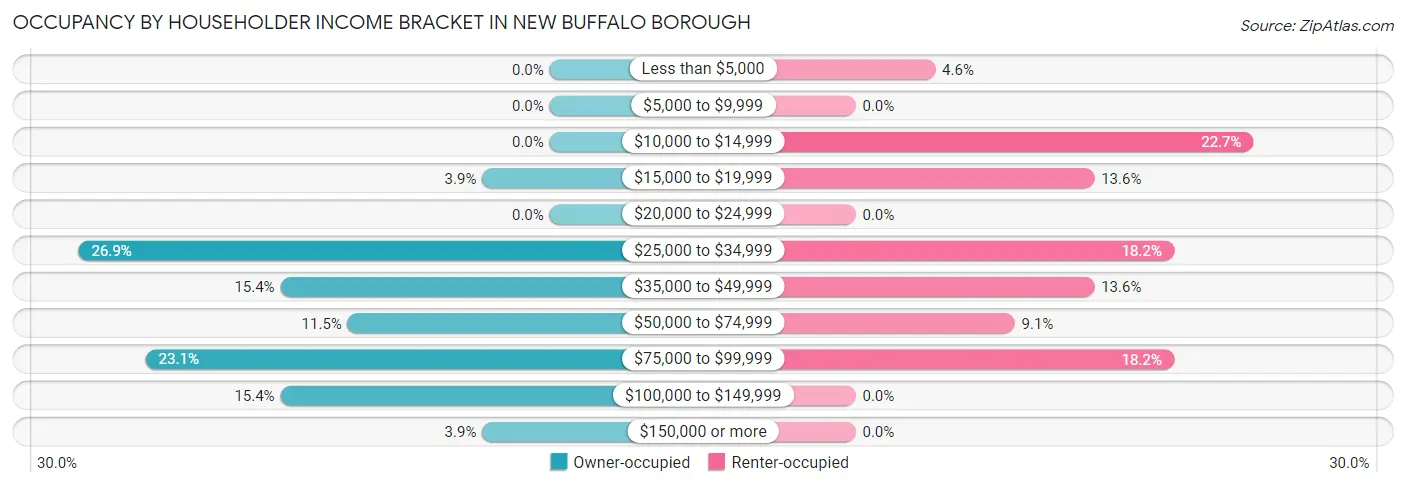
| Income Bracket | Owner-occupied | Renter-occupied |
| Less than $5,000 | 0 (0.0%) | 1 (4.5%) |
| $5,000 to $9,999 | 0 (0.0%) | 0 (0.0%) |
| $10,000 to $14,999 | 0 (0.0%) | 5 (22.7%) |
| $15,000 to $19,999 | 1 (3.8%) | 3 (13.6%) |
| $20,000 to $24,999 | 0 (0.0%) | 0 (0.0%) |
| $25,000 to $34,999 | 7 (26.9%) | 4 (18.2%) |
| $35,000 to $49,999 | 4 (15.4%) | 3 (13.6%) |
| $50,000 to $74,999 | 3 (11.5%) | 2 (9.1%) |
| $75,000 to $99,999 | 6 (23.1%) | 4 (18.2%) |
| $100,000 to $149,999 | 4 (15.4%) | 0 (0.0%) |
| $150,000 or more | 1 (3.8%) | 0 (0.0%) |
| Total | 26 (100.0%) | 22 (100.0%) |
Monthly Housing Cost Tiers in New Buffalo borough
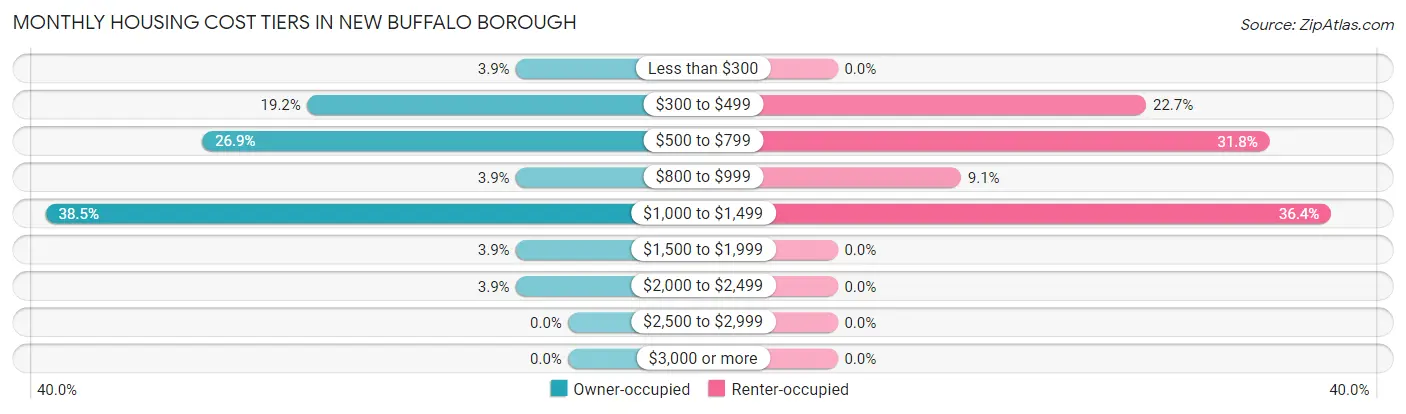
| Monthly Cost | Owner-occupied | Renter-occupied |
| Less than $300 | 1 (3.8%) | 0 (0.0%) |
| $300 to $499 | 5 (19.2%) | 5 (22.7%) |
| $500 to $799 | 7 (26.9%) | 7 (31.8%) |
| $800 to $999 | 1 (3.8%) | 2 (9.1%) |
| $1,000 to $1,499 | 10 (38.5%) | 8 (36.4%) |
| $1,500 to $1,999 | 1 (3.8%) | 0 (0.0%) |
| $2,000 to $2,499 | 1 (3.8%) | 0 (0.0%) |
| $2,500 to $2,999 | 0 (0.0%) | 0 (0.0%) |
| $3,000 or more | 0 (0.0%) | 0 (0.0%) |
| Total | 26 (100.0%) | 22 (100.0%) |
Physical Housing Characteristics in New Buffalo borough
Housing Structures in New Buffalo borough
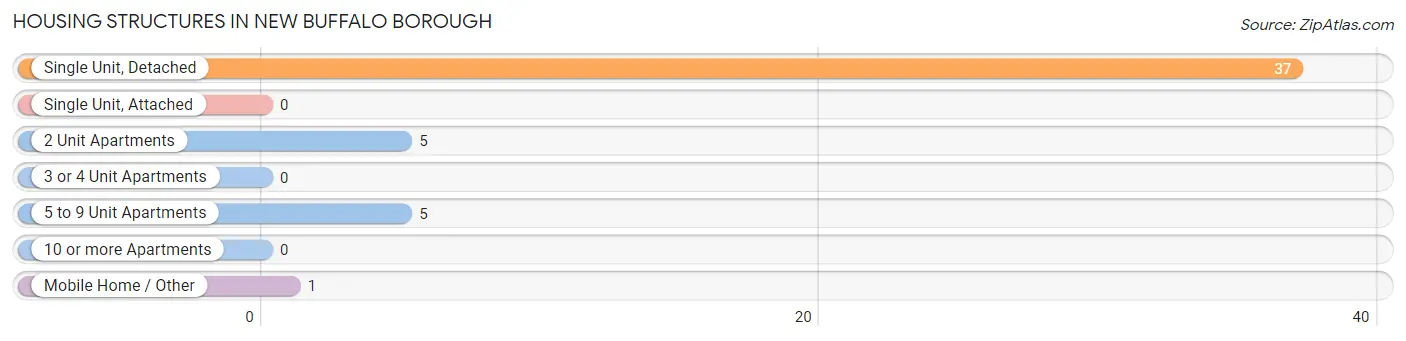
| Structure Type | # Housing Units | % Housing Units |
| Single Unit, Detached | 37 | 77.1% |
| Single Unit, Attached | 0 | 0.0% |
| 2 Unit Apartments | 5 | 10.4% |
| 3 or 4 Unit Apartments | 0 | 0.0% |
| 5 to 9 Unit Apartments | 5 | 10.4% |
| 10 or more Apartments | 0 | 0.0% |
| Mobile Home / Other | 1 | 2.1% |
| Total | 48 | 100.0% |
Housing Structures by Occupancy in New Buffalo borough
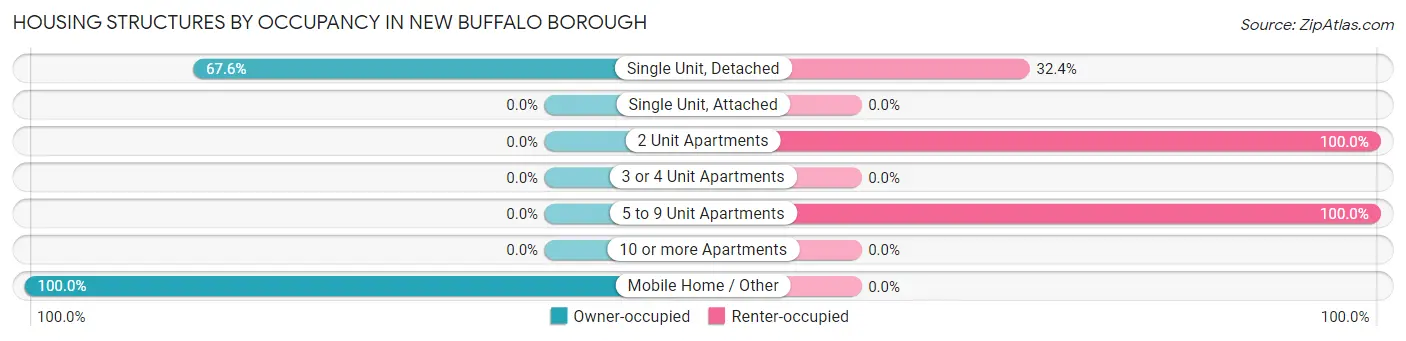
| Structure Type | Owner-occupied | Renter-occupied |
| Single Unit, Detached | 25 (67.6%) | 12 (32.4%) |
| Single Unit, Attached | 0 (0.0%) | 0 (0.0%) |
| 2 Unit Apartments | 0 (0.0%) | 5 (100.0%) |
| 3 or 4 Unit Apartments | 0 (0.0%) | 0 (0.0%) |
| 5 to 9 Unit Apartments | 0 (0.0%) | 5 (100.0%) |
| 10 or more Apartments | 0 (0.0%) | 0 (0.0%) |
| Mobile Home / Other | 1 (100.0%) | 0 (0.0%) |
| Total | 26 (54.2%) | 22 (45.8%) |
Housing Structures by Number of Rooms in New Buffalo borough
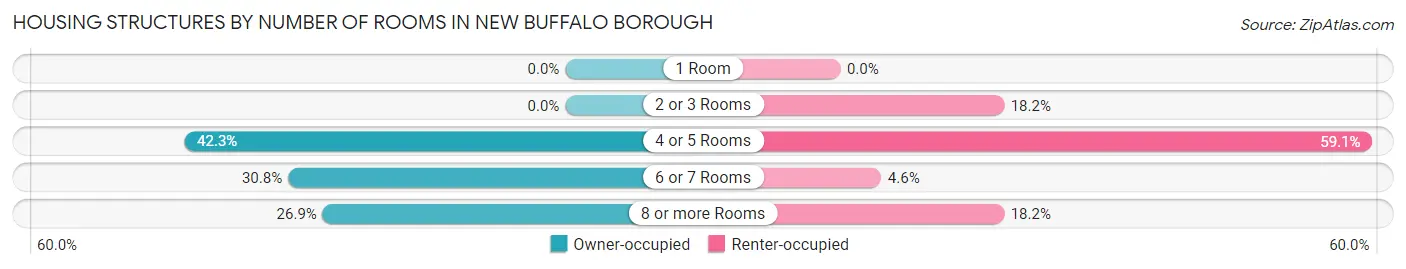
| Number of Rooms | Owner-occupied | Renter-occupied |
| 1 Room | 0 (0.0%) | 0 (0.0%) |
| 2 or 3 Rooms | 0 (0.0%) | 4 (18.2%) |
| 4 or 5 Rooms | 11 (42.3%) | 13 (59.1%) |
| 6 or 7 Rooms | 8 (30.8%) | 1 (4.5%) |
| 8 or more Rooms | 7 (26.9%) | 4 (18.2%) |
| Total | 26 (100.0%) | 22 (100.0%) |
Housing Structure by Heating Type in New Buffalo borough
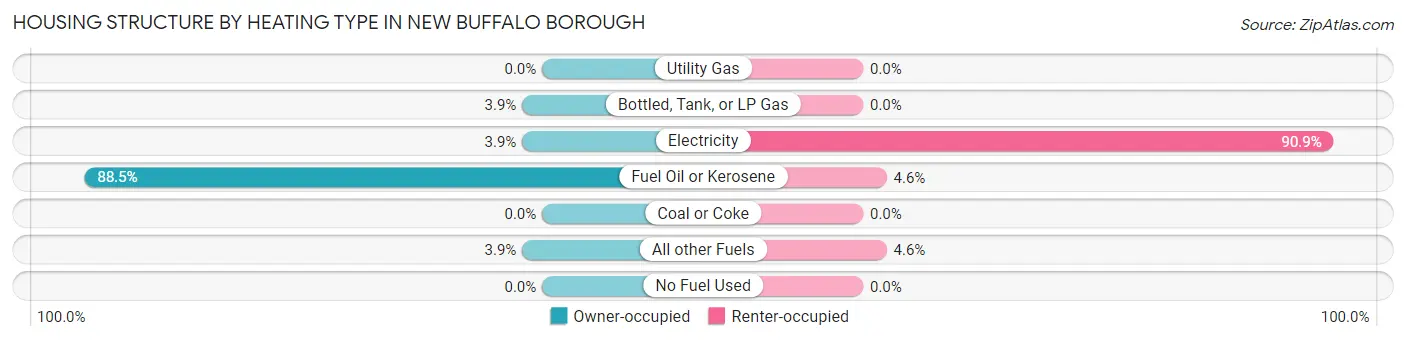
| Heating Type | Owner-occupied | Renter-occupied |
| Utility Gas | 0 (0.0%) | 0 (0.0%) |
| Bottled, Tank, or LP Gas | 1 (3.8%) | 0 (0.0%) |
| Electricity | 1 (3.8%) | 20 (90.9%) |
| Fuel Oil or Kerosene | 23 (88.5%) | 1 (4.5%) |
| Coal or Coke | 0 (0.0%) | 0 (0.0%) |
| All other Fuels | 1 (3.8%) | 1 (4.5%) |
| No Fuel Used | 0 (0.0%) | 0 (0.0%) |
| Total | 26 (100.0%) | 22 (100.0%) |
Household Vehicle Usage in New Buffalo borough
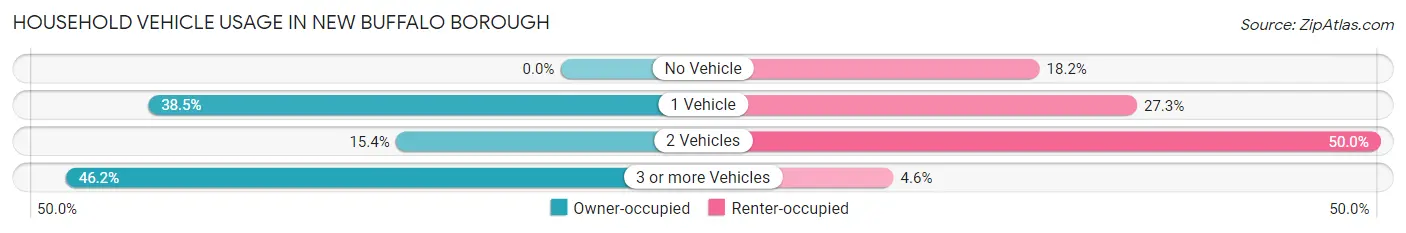
| Vehicles per Household | Owner-occupied | Renter-occupied |
| No Vehicle | 0 (0.0%) | 4 (18.2%) |
| 1 Vehicle | 10 (38.5%) | 6 (27.3%) |
| 2 Vehicles | 4 (15.4%) | 11 (50.0%) |
| 3 or more Vehicles | 12 (46.2%) | 1 (4.5%) |
| Total | 26 (100.0%) | 22 (100.0%) |
Real Estate & Mortgages in New Buffalo borough
Real Estate and Mortgage Overview in New Buffalo borough
| Characteristic | Without Mortgage | With Mortgage |
| Housing Units | 11 | 15 |
| Median Property Value | $63,000 | $158,900 |
| Median Household Income | - | - |
| Monthly Housing Costs | $488 | $0 |
| Real Estate Taxes | - | - |
Property Value by Mortgage Status in New Buffalo borough
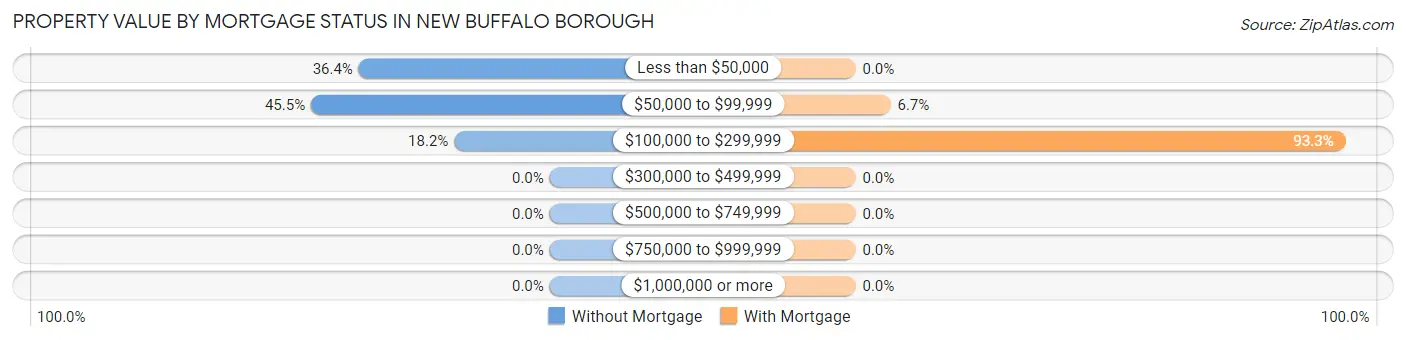
| Property Value | Without Mortgage | With Mortgage |
| Less than $50,000 | 4 (36.4%) | 0 (0.0%) |
| $50,000 to $99,999 | 5 (45.5%) | 1 (6.7%) |
| $100,000 to $299,999 | 2 (18.2%) | 14 (93.3%) |
| $300,000 to $499,999 | 0 (0.0%) | 0 (0.0%) |
| $500,000 to $749,999 | 0 (0.0%) | 0 (0.0%) |
| $750,000 to $999,999 | 0 (0.0%) | 0 (0.0%) |
| $1,000,000 or more | 0 (0.0%) | 0 (0.0%) |
| Total | 11 (100.0%) | 15 (100.0%) |
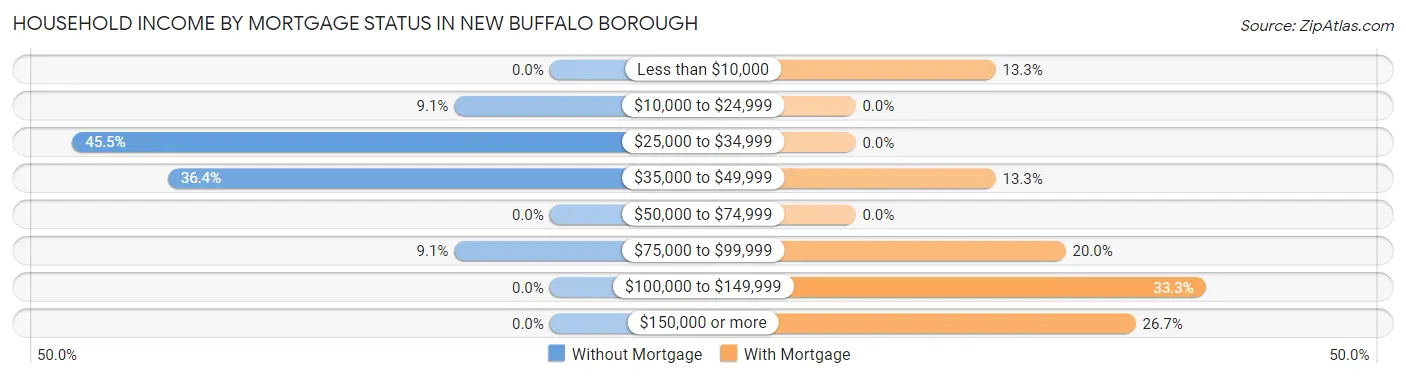
Household Income by Mortgage Status in New Buffalo borough
| Household Income | Without Mortgage | With Mortgage |
| Less than $10,000 | 0 (0.0%) | 2 (13.3%) |
| $10,000 to $24,999 | 1 (9.1%) | 0 (0.0%) |
| $25,000 to $34,999 | 5 (45.5%) | 0 (0.0%) |
| $35,000 to $49,999 | 4 (36.4%) | 2 (13.3%) |
| $50,000 to $74,999 | 0 (0.0%) | 0 (0.0%) |
| $75,000 to $99,999 | 1 (9.1%) | 3 (20.0%) |
| $100,000 to $149,999 | 0 (0.0%) | 5 (33.3%) |
| $150,000 or more | 0 (0.0%) | 4 (26.7%) |
| Total | 11 (100.0%) | 15 (100.0%) |
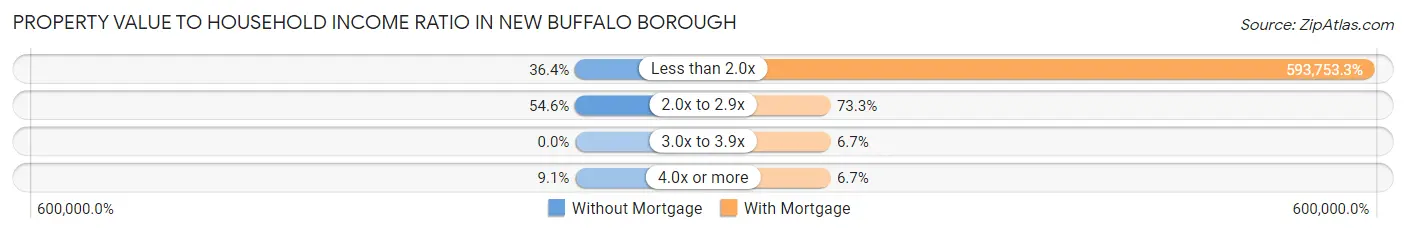
Property Value to Household Income Ratio in New Buffalo borough
| Value-to-Income Ratio | Without Mortgage | With Mortgage |
| Less than 2.0x | 4 (36.4%) | 89,063 (593,753.3%) |
| 2.0x to 2.9x | 6 (54.5%) | 11 (73.3%) |
| 3.0x to 3.9x | 0 (0.0%) | 1 (6.7%) |
| 4.0x or more | 1 (9.1%) | 1 (6.7%) |
| Total | 11 (100.0%) | 15 (100.0%) |
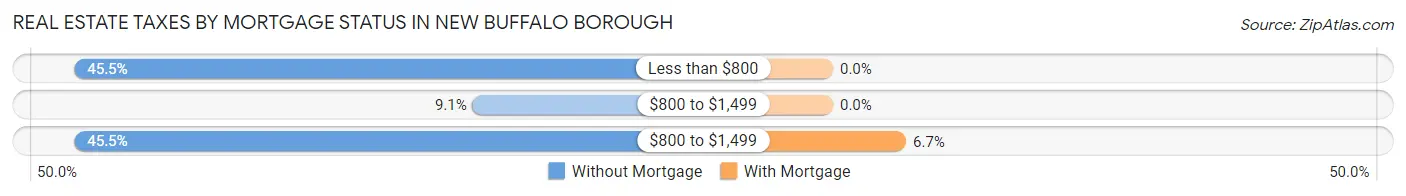
Real Estate Taxes by Mortgage Status in New Buffalo borough
| Property Taxes | Without Mortgage | With Mortgage |
| Less than $800 | 5 (45.5%) | 0 (0.0%) |
| $800 to $1,499 | 1 (9.1%) | 0 (0.0%) |
| $800 to $1,499 | 5 (45.5%) | 1 (6.7%) |
| Total | 11 (100.0%) | 15 (100.0%) |
Health & Disability in New Buffalo borough
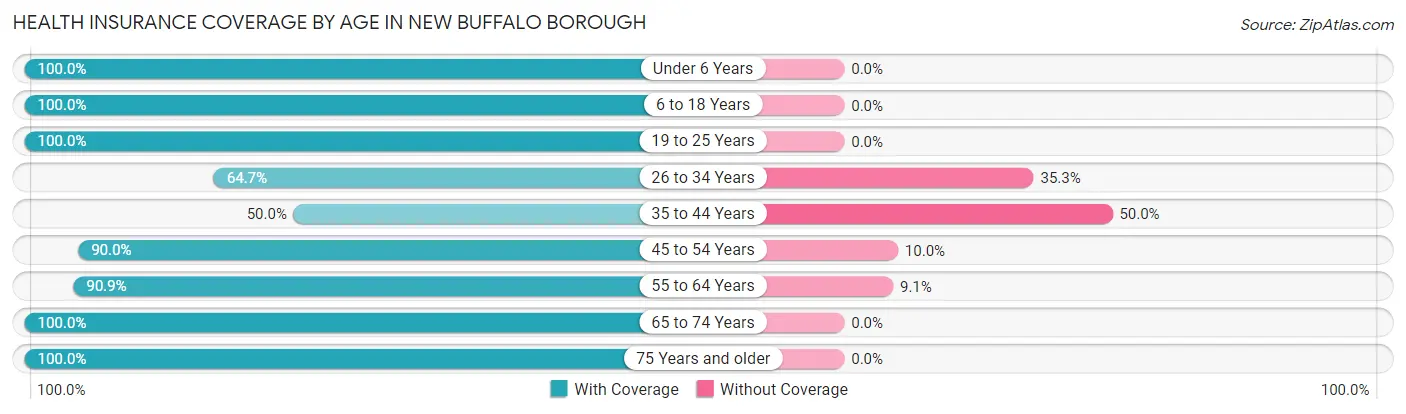
Health Insurance Coverage by Age in New Buffalo borough
| Age Bracket | With Coverage | Without Coverage |
| Under 6 Years | 5 (100.0%) | 0 (0.0%) |
| 6 to 18 Years | 14 (100.0%) | 0 (0.0%) |
| 19 to 25 Years | 11 (100.0%) | 0 (0.0%) |
| 26 to 34 Years | 11 (64.7%) | 6 (35.3%) |
| 35 to 44 Years | 6 (50.0%) | 6 (50.0%) |
| 45 to 54 Years | 9 (90.0%) | 1 (10.0%) |
| 55 to 64 Years | 10 (90.9%) | 1 (9.1%) |
| 65 to 74 Years | 22 (100.0%) | 0 (0.0%) |
| 75 Years and older | 10 (100.0%) | 0 (0.0%) |
| Total | 98 (87.5%) | 14 (12.5%) |
Health Insurance Coverage by Citizenship Status in New Buffalo borough
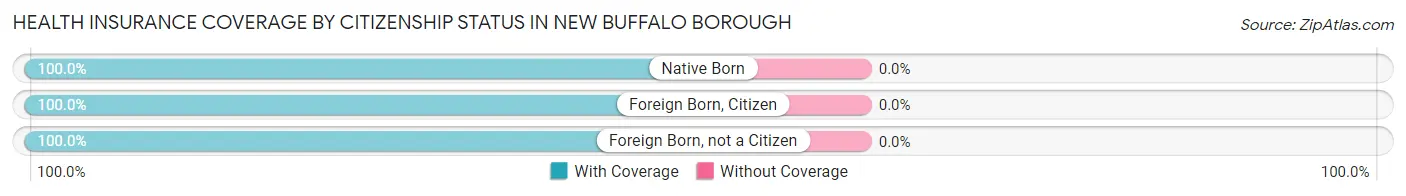
| Citizenship Status | With Coverage | Without Coverage |
| Native Born | 5 (100.0%) | 0 (0.0%) |
| Foreign Born, Citizen | 14 (100.0%) | 0 (0.0%) |
| Foreign Born, not a Citizen | 11 (100.0%) | 0 (0.0%) |
Health Insurance Coverage by Household Income in New Buffalo borough
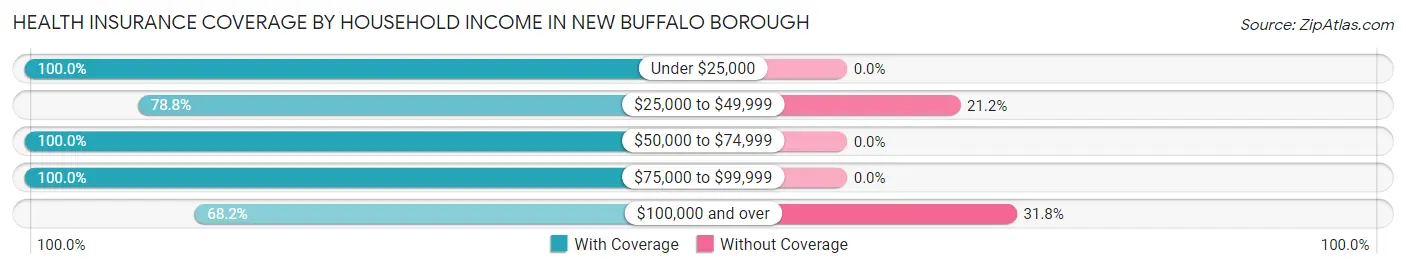
| Household Income | With Coverage | Without Coverage |
| Under $25,000 | 14 (100.0%) | 0 (0.0%) |
| $25,000 to $49,999 | 26 (78.8%) | 7 (21.2%) |
| $50,000 to $74,999 | 16 (100.0%) | 0 (0.0%) |
| $75,000 to $99,999 | 27 (100.0%) | 0 (0.0%) |
| $100,000 and over | 15 (68.2%) | 7 (31.8%) |
Public vs Private Health Insurance Coverage by Age in New Buffalo borough
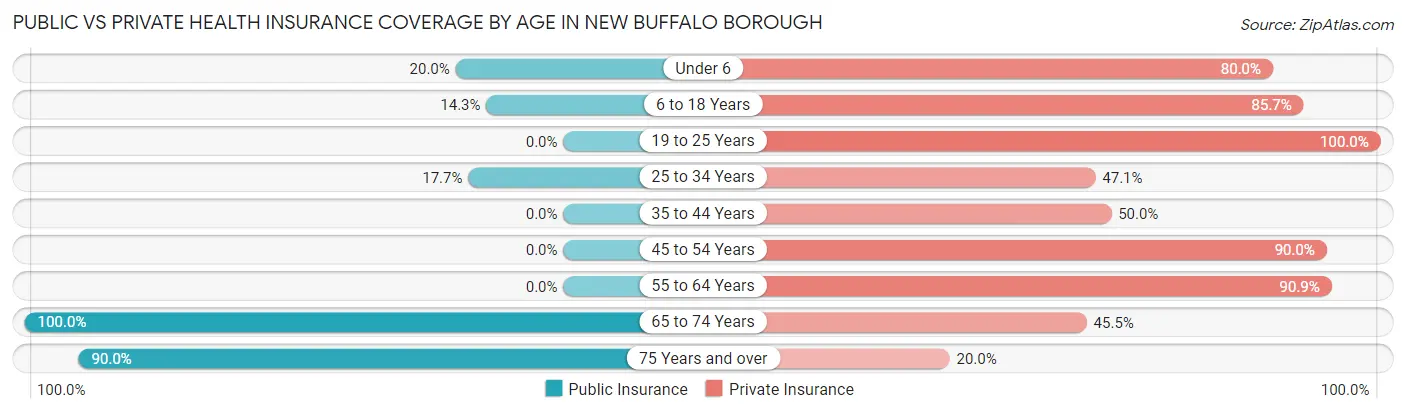
| Age Bracket | Public Insurance | Private Insurance |
| Under 6 | 1 (20.0%) | 4 (80.0%) |
| 6 to 18 Years | 2 (14.3%) | 12 (85.7%) |
| 19 to 25 Years | 0 (0.0%) | 11 (100.0%) |
| 25 to 34 Years | 3 (17.6%) | 8 (47.1%) |
| 35 to 44 Years | 0 (0.0%) | 6 (50.0%) |
| 45 to 54 Years | 0 (0.0%) | 9 (90.0%) |
| 55 to 64 Years | 0 (0.0%) | 10 (90.9%) |
| 65 to 74 Years | 22 (100.0%) | 10 (45.5%) |
| 75 Years and over | 9 (90.0%) | 2 (20.0%) |
| Total | 37 (33.0%) | 72 (64.3%) |
Disability Status by Sex by Age in New Buffalo borough
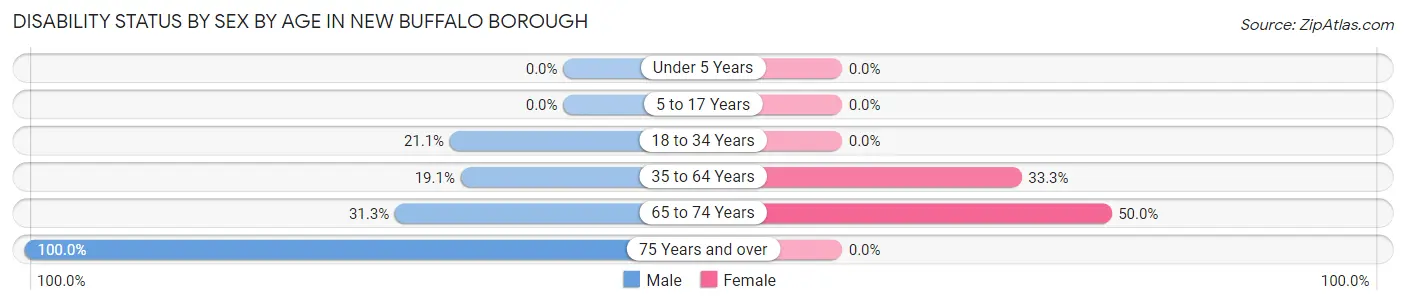
| Age Bracket | Male | Female |
| Under 5 Years | 0 (0.0%) | 0 (0.0%) |
| 5 to 17 Years | 0 (0.0%) | 0 (0.0%) |
| 18 to 34 Years | 4 (21.0%) | 0 (0.0%) |
| 35 to 64 Years | 4 (19.1%) | 4 (33.3%) |
| 65 to 74 Years | 5 (31.2%) | 3 (50.0%) |
| 75 Years and over | 3 (100.0%) | 0 (0.0%) |
Disability Class by Sex by Age in New Buffalo borough
Disability Class: Hearing Difficulty
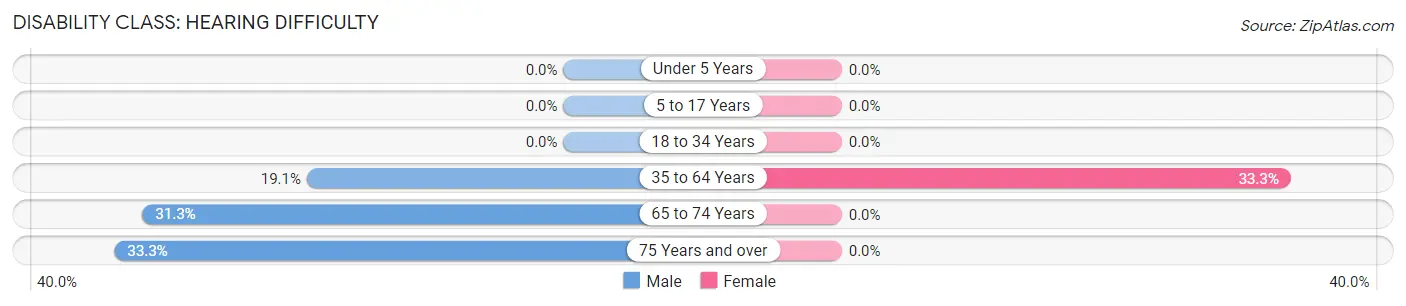
| Age Bracket | Male | Female |
| Under 5 Years | 0 (0.0%) | 0 (0.0%) |
| 5 to 17 Years | 0 (0.0%) | 0 (0.0%) |
| 18 to 34 Years | 0 (0.0%) | 0 (0.0%) |
| 35 to 64 Years | 4 (19.1%) | 4 (33.3%) |
| 65 to 74 Years | 5 (31.2%) | 0 (0.0%) |
| 75 Years and over | 1 (33.3%) | 0 (0.0%) |
Disability Class: Vision Difficulty
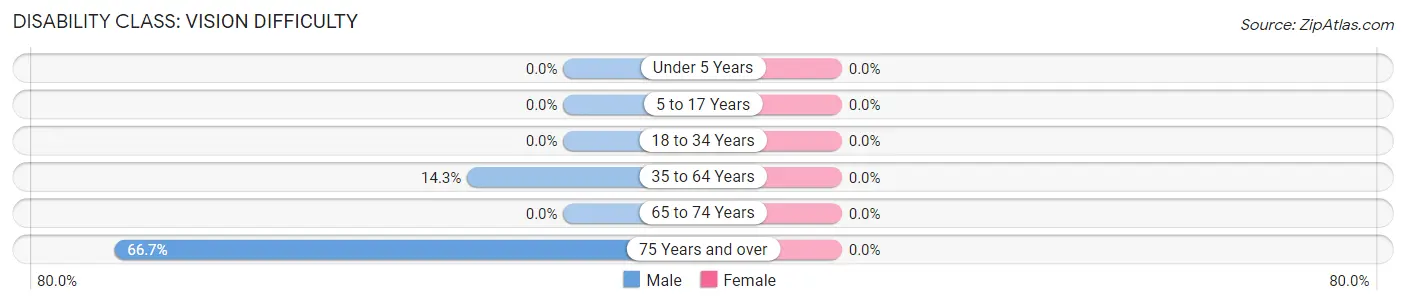
| Age Bracket | Male | Female |
| Under 5 Years | 0 (0.0%) | 0 (0.0%) |
| 5 to 17 Years | 0 (0.0%) | 0 (0.0%) |
| 18 to 34 Years | 0 (0.0%) | 0 (0.0%) |
| 35 to 64 Years | 3 (14.3%) | 0 (0.0%) |
| 65 to 74 Years | 0 (0.0%) | 0 (0.0%) |
| 75 Years and over | 2 (66.7%) | 0 (0.0%) |
Disability Class: Cognitive Difficulty
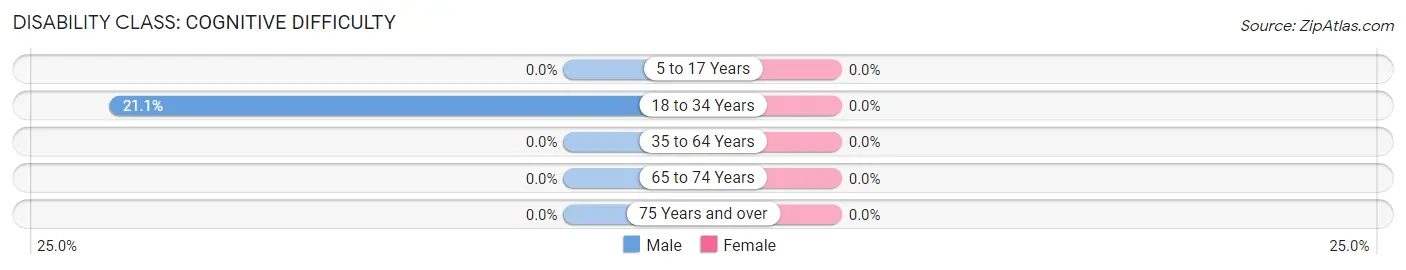
| Age Bracket | Male | Female |
| 5 to 17 Years | 0 (0.0%) | 0 (0.0%) |
| 18 to 34 Years | 4 (21.0%) | 0 (0.0%) |
| 35 to 64 Years | 0 (0.0%) | 0 (0.0%) |
| 65 to 74 Years | 0 (0.0%) | 0 (0.0%) |
| 75 Years and over | 0 (0.0%) | 0 (0.0%) |
Disability Class: Ambulatory Difficulty
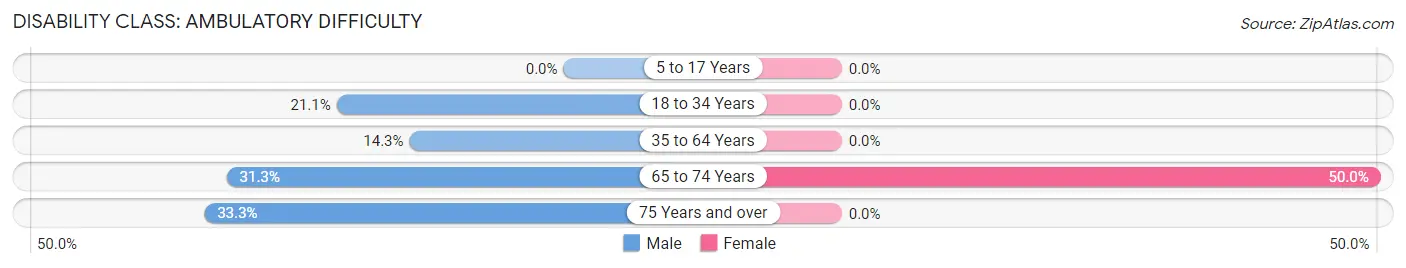
| Age Bracket | Male | Female |
| 5 to 17 Years | 0 (0.0%) | 0 (0.0%) |
| 18 to 34 Years | 4 (21.0%) | 0 (0.0%) |
| 35 to 64 Years | 3 (14.3%) | 0 (0.0%) |
| 65 to 74 Years | 5 (31.2%) | 3 (50.0%) |
| 75 Years and over | 1 (33.3%) | 0 (0.0%) |
Disability Class: Self-Care Difficulty
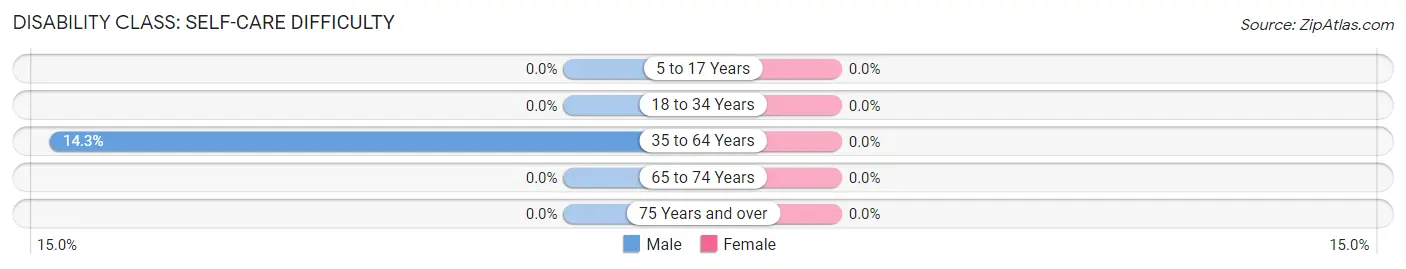
| Age Bracket | Male | Female |
| 5 to 17 Years | 0 (0.0%) | 0 (0.0%) |
| 18 to 34 Years | 0 (0.0%) | 0 (0.0%) |
| 35 to 64 Years | 3 (14.3%) | 0 (0.0%) |
| 65 to 74 Years | 0 (0.0%) | 0 (0.0%) |
| 75 Years and over | 0 (0.0%) | 0 (0.0%) |
Technology Access in New Buffalo borough
Computing Device Access in New Buffalo borough
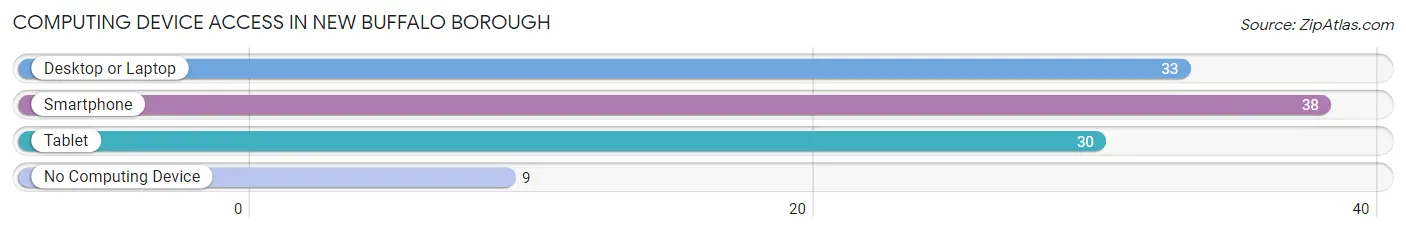
| Device Type | # Households | % Households |
| Desktop or Laptop | 33 | 68.8% |
| Smartphone | 38 | 79.2% |
| Tablet | 30 | 62.5% |
| No Computing Device | 9 | 18.8% |
| Total | 48 | 100.0% |
Internet Access in New Buffalo borough
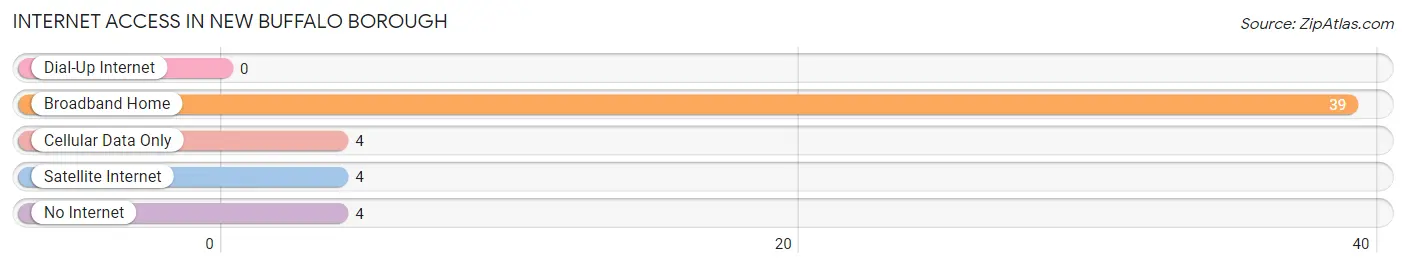
| Internet Type | # Households | % Households |
| Dial-Up Internet | 0 | 0.0% |
| Broadband Home | 39 | 81.2% |
| Cellular Data Only | 4 | 8.3% |
| Satellite Internet | 4 | 8.3% |
| No Internet | 4 | 8.3% |
| Total | 48 | 100.0% |
New Buffalo borough Summary
New Buffalo Borough is a small borough located in Perry County, Pennsylvania. It is situated in the Susquehanna Valley, approximately 10 miles south of Harrisburg, the state capital. The borough is home to a population of just over 1,000 people, and is part of the larger New Buffalo Township.
History
New Buffalo Borough was founded in 1845 by a group of settlers from New York. The settlers were attracted to the area due to its fertile soil and abundant natural resources. The borough was named after the nearby Buffalo Creek, which was named by the Native Americans who lived in the area.
The borough was incorporated in 1851, and the first mayor was elected in 1852. The first post office was established in 1853, and the first school was built in 1854.
The borough experienced rapid growth in the late 19th and early 20th centuries, due to the construction of the Pennsylvania Canal and the Pennsylvania Railroad. The canal and railroad provided easy access to the borough, and allowed for the transportation of goods and people.
The borough was also home to several industries, including a sawmill, a grist mill, a tannery, and a brickyard. These industries provided employment for many of the borough’s residents.
Geography
New Buffalo Borough is located in the Susquehanna Valley, approximately 10 miles south of Harrisburg. The borough is situated on the east bank of the Susquehanna River, and is bordered by New Buffalo Township to the north, East Buffalo Township to the east, and Buffalo Township to the south.
The borough has a total area of 0.7 square miles, all of which is land. The terrain is mostly flat, with some rolling hills. The borough is located in a temperate climate zone, with hot summers and cold winters.
Economy
The economy of New Buffalo Borough is largely based on agriculture and tourism. The borough is home to several farms, which produce a variety of crops, including corn, soybeans, wheat, and hay. The borough also has several wineries, which produce a variety of wines.
The borough is also home to several small businesses, including restaurants, shops, and other services. The borough is also home to a small industrial park, which houses several light manufacturing businesses.
Demographics
As of the 2010 census, the population of New Buffalo Borough was 1,072. The racial makeup of the borough was 97.3% White, 0.9% African American, 0.2% Native American, 0.2% Asian, 0.2% from other races, and 1.2% from two or more races. Hispanic or Latino of any race were 0.7% of the population.
The median household income in the borough was $45,000, and the median family income was $50,000. The per capita income was $20,000. About 8.3% of families and 10.2% of the population were below the poverty line, including 14.3% of those under age 18 and 6.3% of those age 65 or over.
Conclusion
New Buffalo Borough is a small borough located in Perry County, Pennsylvania. It is situated in the Susquehanna Valley, approximately 10 miles south of Harrisburg. The borough is home to a population of just over 1,000 people, and is part of the larger New Buffalo Township. The economy of the borough is largely based on agriculture and tourism, and the borough is home to several small businesses. The racial makeup of the borough is predominantly White, with a small percentage of African American, Native American, and Asian residents. The median household income in the borough is $45,000, and the per capita income is $20,000.
Common Questions
What is Per Capita Income in New Buffalo borough?
Per Capita income in New Buffalo borough is $25,698.
What is the Median Family Income in New Buffalo borough?
Median Family Income in New Buffalo borough is $71,250.
What is the Median Household income in New Buffalo borough?
Median Household Income in New Buffalo borough is $43,750.
What is Income or Wage Gap in New Buffalo borough?
Income or Wage Gap in New Buffalo borough is 26.1%.
Women in New Buffalo borough earn 73.9 cents for every dollar earned by a man.
What is Inequality or Gini Index in New Buffalo borough?
Inequality or Gini Index in New Buffalo borough is 0.40.
What is the Total Population of New Buffalo borough?
Total Population of New Buffalo borough is 112.
What is the Total Male Population of New Buffalo borough?
Total Male Population of New Buffalo borough is 69.
What is the Total Female Population of New Buffalo borough?
Total Female Population of New Buffalo borough is 43.
What is the Ratio of Males per 100 Females in New Buffalo borough?
There are 160.47 Males per 100 Females in New Buffalo borough.
What is the Ratio of Females per 100 Males in New Buffalo borough?
There are 62.32 Females per 100 Males in New Buffalo borough.
What is the Median Population Age in New Buffalo borough?
Median Population Age in New Buffalo borough is 41.3 Years.
What is the Average Family Size in New Buffalo borough
Average Family Size in New Buffalo borough is 3.2 People.
What is the Average Household Size in New Buffalo borough
Average Household Size in New Buffalo borough is 2.3 People.
How Large is the Labor Force in New Buffalo borough?
There are 52 People in the Labor Forcein in New Buffalo borough.
What is the Percentage of People in the Labor Force in New Buffalo borough?
55.9% of People are in the Labor Force in New Buffalo borough.