Berwyn, PA Map & Demographics
Berwyn Map
Berwyn Overview
$60,913
PER CAPITA INCOME
$152,222
AVG FAMILY INCOME
$102,101
AVG HOUSEHOLD INCOME
40.6%
WAGE / INCOME GAP [ % ]
59.4¢/ $1
WAGE / INCOME GAP [ $ ]
0.51
INEQUALITY / GINI INDEX
3,700
TOTAL POPULATION
1,621
MALE POPULATION
2,079
FEMALE POPULATION
77.97
MALES / 100 FEMALES
128.25
FEMALES / 100 MALES
40.7
MEDIAN AGE
2.9
AVG FAMILY SIZE
2.5
AVG HOUSEHOLD SIZE
1,692
LABOR FORCE [ PEOPLE ]
59.9%
PERCENT IN LABOR FORCE
5.1%
UNEMPLOYMENT RATE
Berwyn Zip Codes
Income in Berwyn
Income Overview in Berwyn
Per Capita Income in Berwyn is $60,913, while median incomes of families and households are $152,222 and $102,101 respectively.
| Characteristic | Number | Measure |
| Per Capita Income | 3,700 | $60,913 |
| Median Family Income | 1,016 | $152,222 |
| Mean Family Income | 1,016 | $184,360 |
| Median Household Income | 1,473 | $102,101 |
| Mean Household Income | 1,473 | $152,021 |
| Income Deficit | 1,016 | $0 |
| Wage / Income Gap (%) | 3,700 | 40.65% |
| Wage / Income Gap ($) | 3,700 | 59.35¢ per $1 |
| Gini / Inequality Index | 3,700 | 0.51 |
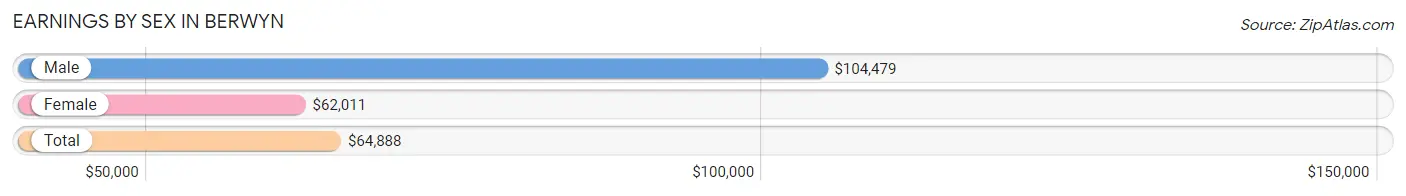
Earnings by Sex in Berwyn
Average Earnings in Berwyn are $64,888, $104,479 for men and $62,011 for women, a difference of 40.6%.
| Sex | Number | Average Earnings |
| Male | 866 (44.3%) | $104,479 |
| Female | 1,089 (55.7%) | $62,011 |
| Total | 1,955 (100.0%) | $64,888 |
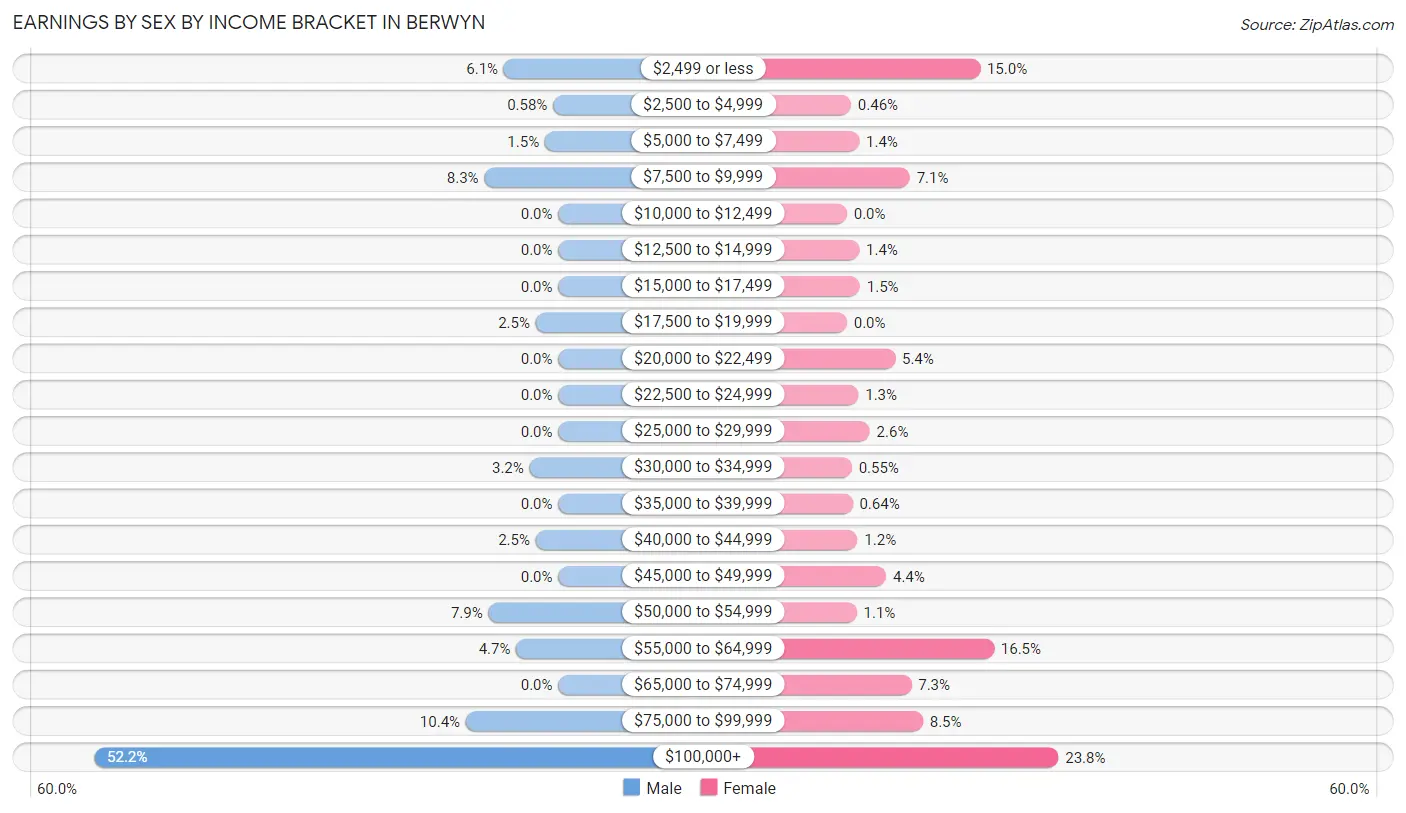
Earnings by Sex by Income Bracket in Berwyn
The most common earnings brackets in Berwyn are $100,000+ for men (452 | 52.2%) and $100,000+ for women (259 | 23.8%).
| Income | Male | Female |
| $2,499 or less | 53 (6.1%) | 163 (15.0%) |
| $2,500 to $4,999 | 5 (0.6%) | 5 (0.5%) |
| $5,000 to $7,499 | 13 (1.5%) | 15 (1.4%) |
| $7,500 to $9,999 | 72 (8.3%) | 77 (7.1%) |
| $10,000 to $12,499 | 0 (0.0%) | 0 (0.0%) |
| $12,500 to $14,999 | 0 (0.0%) | 15 (1.4%) |
| $15,000 to $17,499 | 0 (0.0%) | 16 (1.5%) |
| $17,500 to $19,999 | 22 (2.5%) | 0 (0.0%) |
| $20,000 to $22,499 | 0 (0.0%) | 59 (5.4%) |
| $22,500 to $24,999 | 0 (0.0%) | 14 (1.3%) |
| $25,000 to $29,999 | 0 (0.0%) | 28 (2.6%) |
| $30,000 to $34,999 | 28 (3.2%) | 6 (0.5%) |
| $35,000 to $39,999 | 0 (0.0%) | 7 (0.6%) |
| $40,000 to $44,999 | 22 (2.5%) | 13 (1.2%) |
| $45,000 to $49,999 | 0 (0.0%) | 48 (4.4%) |
| $50,000 to $54,999 | 68 (7.9%) | 12 (1.1%) |
| $55,000 to $64,999 | 41 (4.7%) | 180 (16.5%) |
| $65,000 to $74,999 | 0 (0.0%) | 79 (7.2%) |
| $75,000 to $99,999 | 90 (10.4%) | 93 (8.5%) |
| $100,000+ | 452 (52.2%) | 259 (23.8%) |
| Total | 866 (100.0%) | 1,089 (100.0%) |
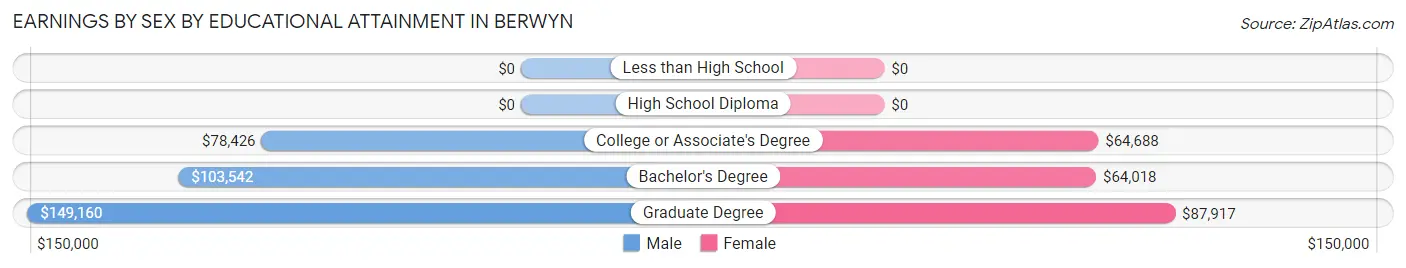
Earnings by Sex by Educational Attainment in Berwyn
Average earnings in Berwyn are $125,086 for men and $65,802 for women, a difference of 47.4%. Men with an educational attainment of graduate degree enjoy the highest average annual earnings of $149,160, while those with college or associate's degree education earn the least with $78,426. Women with an educational attainment of graduate degree earn the most with the average annual earnings of $87,917, while those with bachelor's degree education have the smallest earnings of $64,018.
| Educational Attainment | Male Income | Female Income |
| Less than High School | - | - |
| High School Diploma | - | - |
| College or Associate's Degree | $78,426 | $64,688 |
| Bachelor's Degree | $103,542 | $64,018 |
| Graduate Degree | $149,160 | $87,917 |
| Total | $125,086 | $65,802 |
Family Income in Berwyn
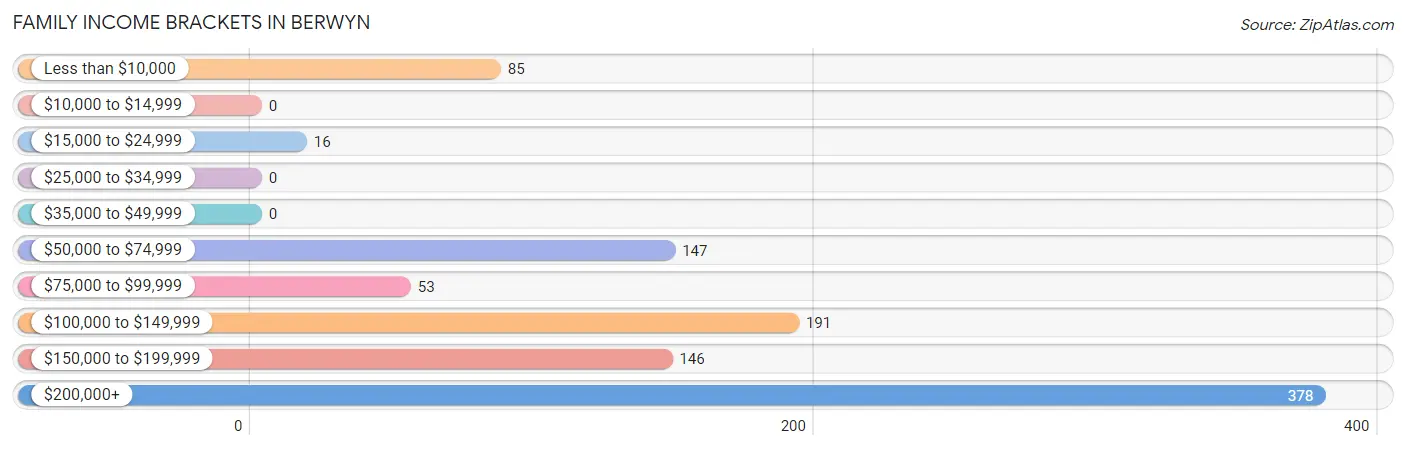
Family Income Brackets in Berwyn
According to the Berwyn family income data, there are 378 families falling into the $200,000+ income range, which is the most common income bracket and makes up 37.2% of all families.
| Income Bracket | # Families | % Families |
| Less than $10,000 | 85 | 8.4% |
| $10,000 to $14,999 | 0 | 0.0% |
| $15,000 to $24,999 | 16 | 1.6% |
| $25,000 to $34,999 | 0 | 0.0% |
| $35,000 to $49,999 | 0 | 0.0% |
| $50,000 to $74,999 | 147 | 14.5% |
| $75,000 to $99,999 | 53 | 5.2% |
| $100,000 to $149,999 | 191 | 18.8% |
| $150,000 to $199,999 | 146 | 14.4% |
| $200,000+ | 378 | 37.2% |
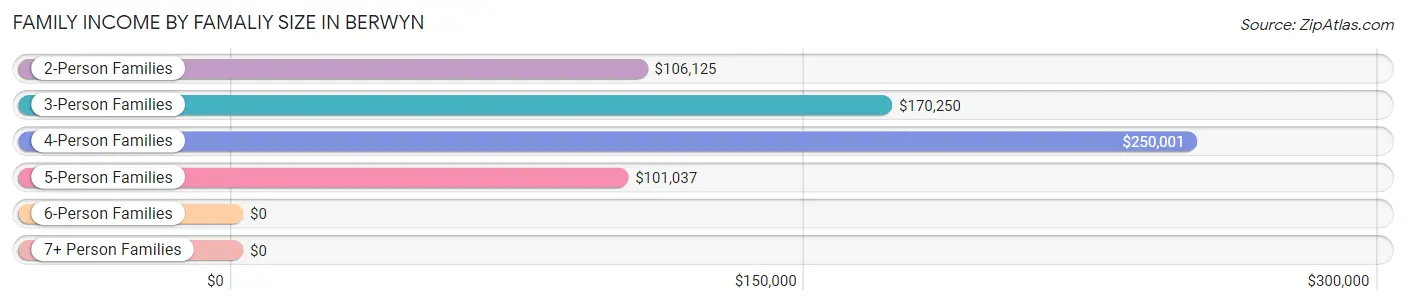
Family Income by Famaliy Size in Berwyn
4-person families (240 | 23.6%) account for the highest median family income in Berwyn with $250,001 per family, while 4-person families (240 | 23.6%) have the highest median income of $62,500 per family member.
| Income Bracket | # Families | Median Income |
| 2-Person Families | 507 (49.9%) | $106,125 |
| 3-Person Families | 197 (19.4%) | $170,250 |
| 4-Person Families | 240 (23.6%) | $250,001 |
| 5-Person Families | 65 (6.4%) | $101,037 |
| 6-Person Families | 7 (0.7%) | $0 |
| 7+ Person Families | 0 (0.0%) | $0 |
| Total | 1,016 (100.0%) | $152,222 |
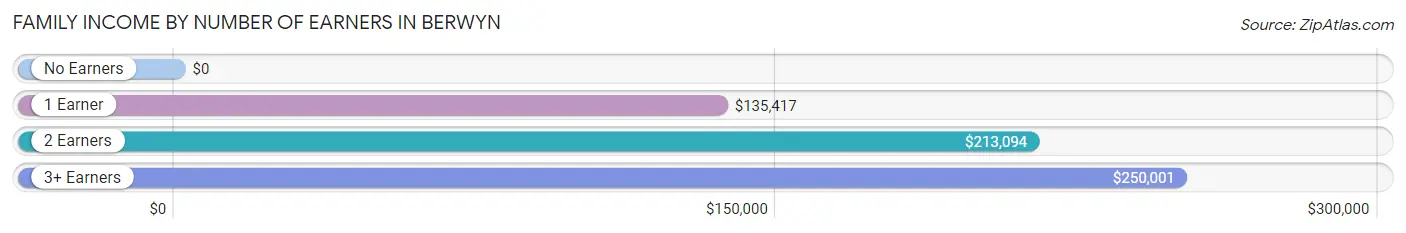
Family Income by Number of Earners in Berwyn
| Number of Earners | # Families | Median Income |
| No Earners | 172 (16.9%) | $0 |
| 1 Earner | 294 (28.9%) | $135,417 |
| 2 Earners | 481 (47.3%) | $213,094 |
| 3+ Earners | 69 (6.8%) | $250,001 |
| Total | 1,016 (100.0%) | $152,222 |
Household Income in Berwyn
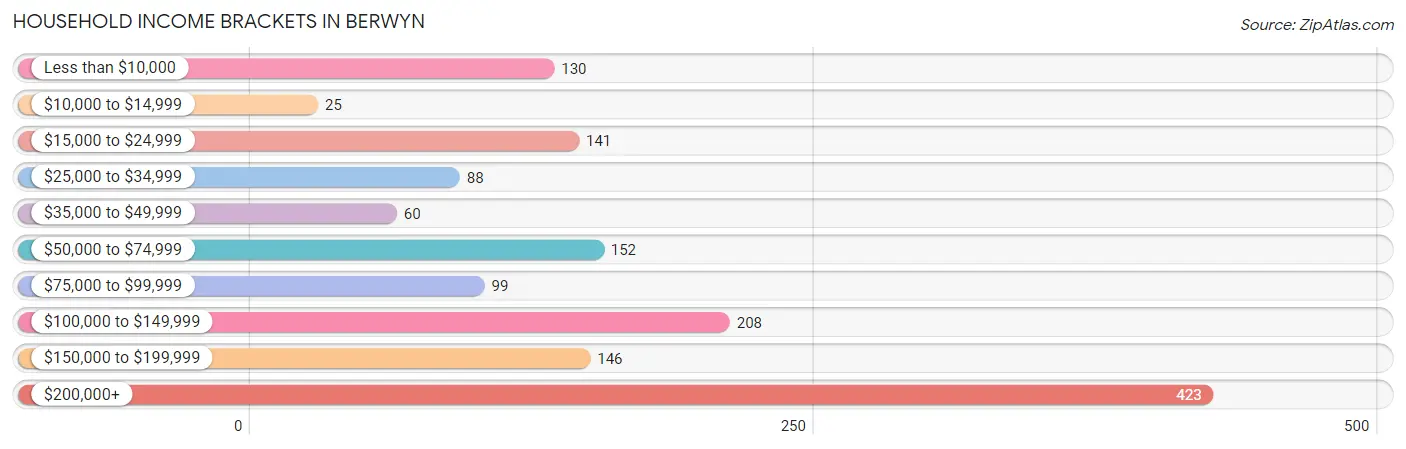
Household Income Brackets in Berwyn
With 423 households falling in the category, the $200,000+ income range is the most frequent in Berwyn, accounting for 28.7% of all households. In contrast, only 25 households (1.7%) fall into the $10,000 to $14,999 income bracket, making it the least populous group.
| Income Bracket | # Households | % Households |
| Less than $10,000 | 130 | 8.8% |
| $10,000 to $14,999 | 25 | 1.7% |
| $15,000 to $24,999 | 141 | 9.6% |
| $25,000 to $34,999 | 88 | 6.0% |
| $35,000 to $49,999 | 60 | 4.1% |
| $50,000 to $74,999 | 152 | 10.3% |
| $75,000 to $99,999 | 99 | 6.7% |
| $100,000 to $149,999 | 208 | 14.1% |
| $150,000 to $199,999 | 146 | 9.9% |
| $200,000+ | 423 | 28.7% |
Household Income by Householder Age in Berwyn
The median household income in Berwyn is $102,101, with the highest median household income of $131,797 found in the 45 to 64 years age bracket for the primary householder. A total of 561 households (38.1%) fall into this category. Meanwhile, the 15 to 24 years age bracket for the primary householder has the lowest median household income of $0, with 73 households (5.0%) in this group.
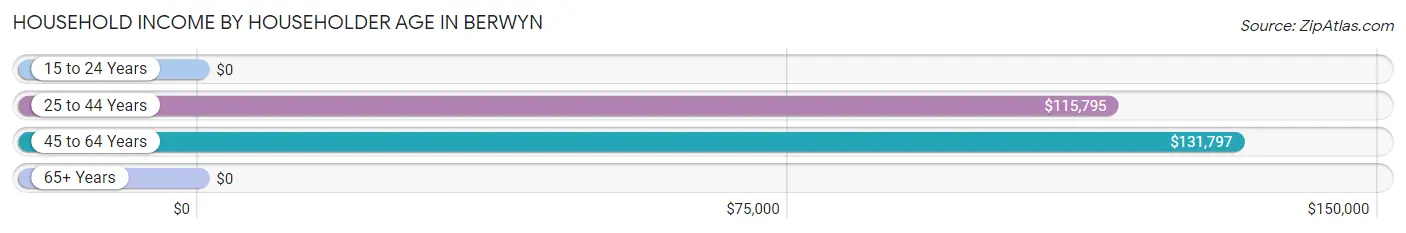
| Income Bracket | # Households | Median Income |
| 15 to 24 Years | 73 (5.0%) | $0 |
| 25 to 44 Years | 412 (28.0%) | $115,795 |
| 45 to 64 Years | 561 (38.1%) | $131,797 |
| 65+ Years | 427 (29.0%) | $0 |
| Total | 1,473 (100.0%) | $102,101 |
Poverty in Berwyn
Income Below Poverty by Sex and Age in Berwyn
With 14.1% poverty level for males and 18.1% for females among the residents of Berwyn, 18 to 24 year old males and 18 to 24 year old females are the most vulnerable to poverty, with 83 males (74.1%) and 227 females (93.4%) in their respective age groups living below the poverty level.
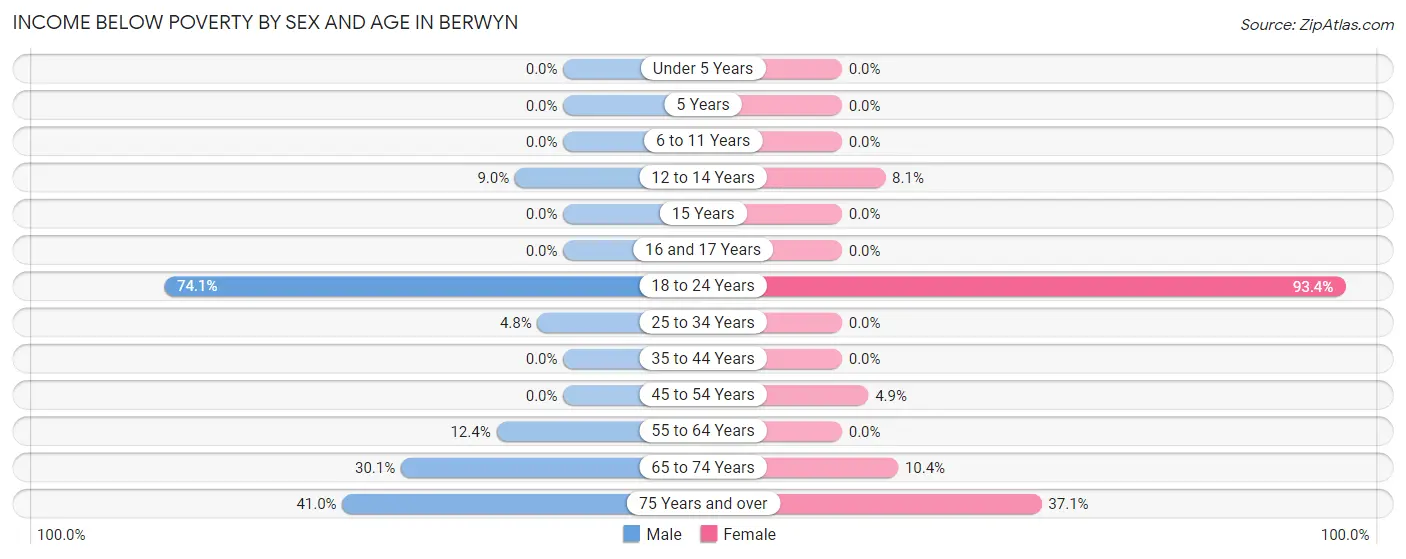
| Age Bracket | Male | Female |
| Under 5 Years | 0 (0.0%) | 0 (0.0%) |
| 5 Years | 0 (0.0%) | 0 (0.0%) |
| 6 to 11 Years | 0 (0.0%) | 0 (0.0%) |
| 12 to 14 Years | 13 (9.0%) | 14 (8.1%) |
| 15 Years | 0 (0.0%) | 0 (0.0%) |
| 16 and 17 Years | 0 (0.0%) | 0 (0.0%) |
| 18 to 24 Years | 83 (74.1%) | 227 (93.4%) |
| 25 to 34 Years | 8 (4.8%) | 0 (0.0%) |
| 35 to 44 Years | 0 (0.0%) | 0 (0.0%) |
| 45 to 54 Years | 0 (0.0%) | 15 (4.9%) |
| 55 to 64 Years | 17 (12.4%) | 0 (0.0%) |
| 65 to 74 Years | 25 (30.1%) | 15 (10.4%) |
| 75 Years and over | 82 (41.0%) | 103 (37.0%) |
| Total | 228 (14.1%) | 374 (18.1%) |
Income Above Poverty by Sex and Age in Berwyn
According to the poverty statistics in Berwyn, males aged under 5 years and females aged under 5 years are the age groups that are most secure financially, with 100.0% of males and 100.0% of females in these age groups living above the poverty line.
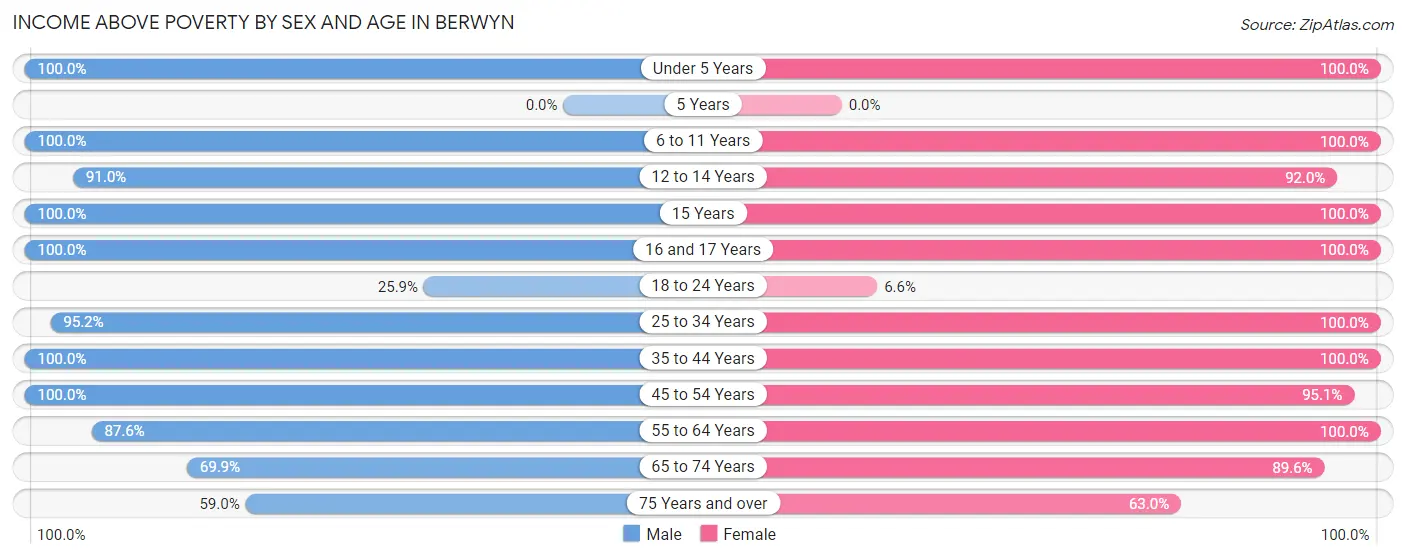
| Age Bracket | Male | Female |
| Under 5 Years | 86 (100.0%) | 56 (100.0%) |
| 5 Years | 0 (0.0%) | 0 (0.0%) |
| 6 to 11 Years | 134 (100.0%) | 154 (100.0%) |
| 12 to 14 Years | 132 (91.0%) | 160 (91.9%) |
| 15 Years | 16 (100.0%) | 98 (100.0%) |
| 16 and 17 Years | 102 (100.0%) | 27 (100.0%) |
| 18 to 24 Years | 29 (25.9%) | 16 (6.6%) |
| 25 to 34 Years | 159 (95.2%) | 202 (100.0%) |
| 35 to 44 Years | 188 (100.0%) | 177 (100.0%) |
| 45 to 54 Years | 245 (100.0%) | 291 (95.1%) |
| 55 to 64 Years | 120 (87.6%) | 202 (100.0%) |
| 65 to 74 Years | 58 (69.9%) | 129 (89.6%) |
| 75 Years and over | 118 (59.0%) | 175 (62.9%) |
| Total | 1,387 (85.9%) | 1,687 (81.9%) |
Income Below Poverty Among Married-Couple Families in Berwyn
The poverty statistics for married-couple families in Berwyn show that 10.3% or 82 of the total 793 families live below the poverty line. Families with no children have the highest poverty rate of 19.5%, comprising of 82 families. On the other hand, families with 1 or 2 children have the lowest poverty rate of 0.0%, which includes 0 families.
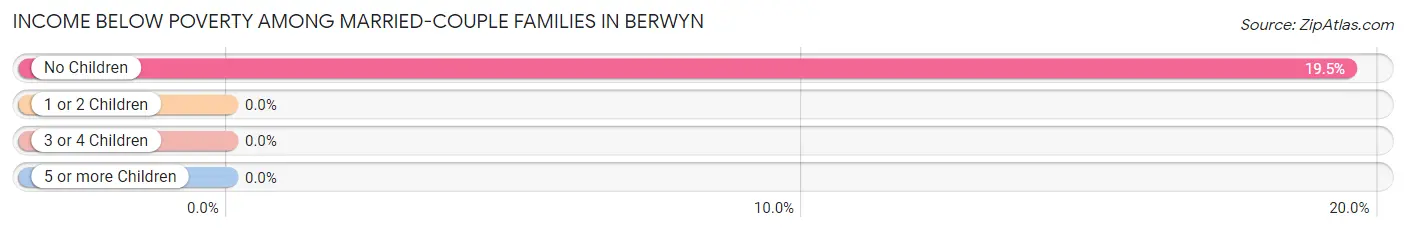
| Children | Above Poverty | Below Poverty |
| No Children | 339 (80.5%) | 82 (19.5%) |
| 1 or 2 Children | 305 (100.0%) | 0 (0.0%) |
| 3 or 4 Children | 67 (100.0%) | 0 (0.0%) |
| 5 or more Children | 0 (0.0%) | 0 (0.0%) |
| Total | 711 (89.7%) | 82 (10.3%) |
Income Below Poverty Among Single-Parent Households in Berwyn
According to the poverty data in Berwyn, 23.5% or 4 single-father households and 7.3% or 15 single-mother households are living below the poverty line. Among single-father households, those with no children have the highest poverty rate, with 4 households (23.5%) experiencing poverty. Likewise, among single-mother households, those with 1 or 2 children have the highest poverty rate, with 15 households (8.5%) falling below the poverty line.
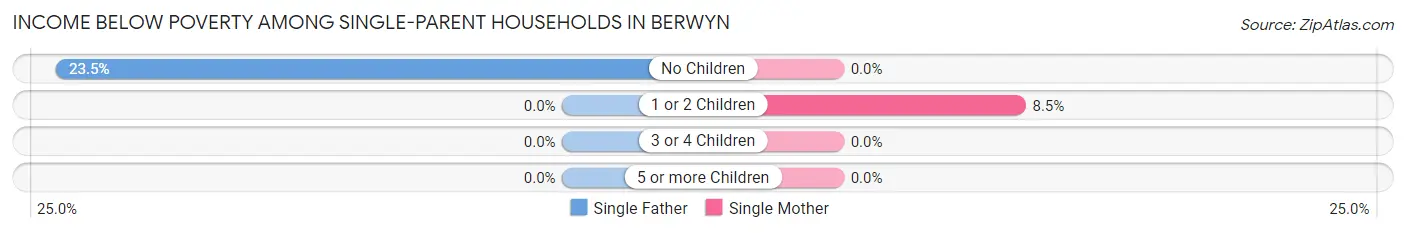
| Children | Single Father | Single Mother |
| No Children | 4 (23.5%) | 0 (0.0%) |
| 1 or 2 Children | 0 (0.0%) | 15 (8.5%) |
| 3 or 4 Children | 0 (0.0%) | 0 (0.0%) |
| 5 or more Children | 0 (0.0%) | 0 (0.0%) |
| Total | 4 (23.5%) | 15 (7.3%) |
Income Below Poverty Among Married-Couple vs Single-Parent Households in Berwyn
The poverty data for Berwyn shows that 82 of the married-couple family households (10.3%) and 19 of the single-parent households (8.5%) are living below the poverty level. Within the married-couple family households, those with no children have the highest poverty rate, with 82 households (19.5%) falling below the poverty line. Among the single-parent households, those with no children have the highest poverty rate, with 4 household (8.7%) living below poverty.
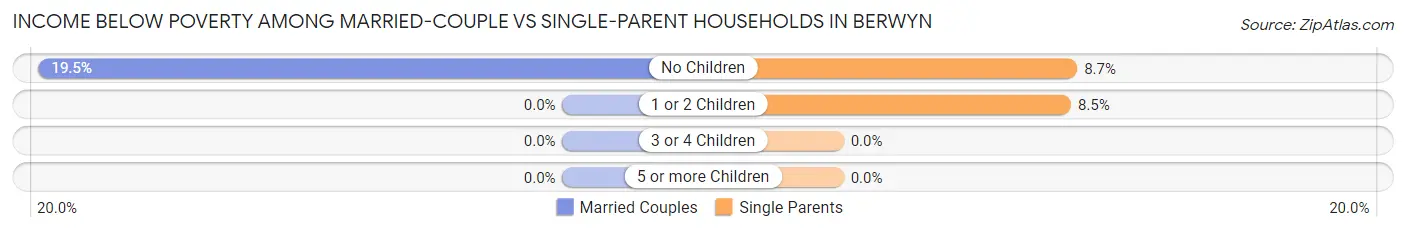
| Children | Married-Couple Families | Single-Parent Households |
| No Children | 82 (19.5%) | 4 (8.7%) |
| 1 or 2 Children | 0 (0.0%) | 15 (8.5%) |
| 3 or 4 Children | 0 (0.0%) | 0 (0.0%) |
| 5 or more Children | 0 (0.0%) | 0 (0.0%) |
| Total | 82 (10.3%) | 19 (8.5%) |
Race in Berwyn
The most populous races in Berwyn are White / Caucasian (3,067 | 82.9%), Asian (438 | 11.8%), and Two or more Races (158 | 4.3%).
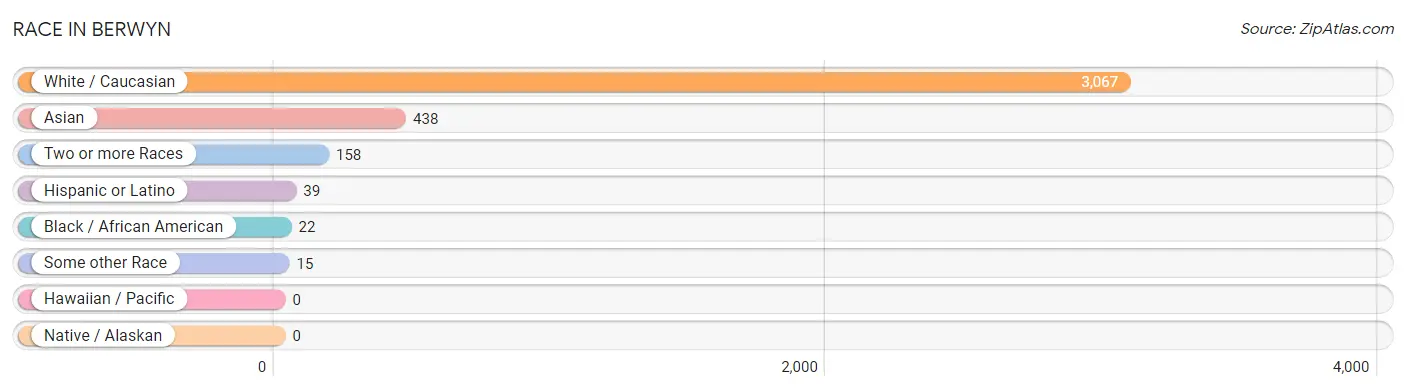
| Race | # Population | % Population |
| Asian | 438 | 11.8% |
| Black / African American | 22 | 0.6% |
| Hawaiian / Pacific | 0 | 0.0% |
| Hispanic or Latino | 39 | 1.1% |
| Native / Alaskan | 0 | 0.0% |
| White / Caucasian | 3,067 | 82.9% |
| Two or more Races | 158 | 4.3% |
| Some other Race | 15 | 0.4% |
| Total | 3,700 | 100.0% |
Ancestry in Berwyn
The most populous ancestries reported in Berwyn are German (963 | 26.0%), Irish (716 | 19.4%), Italian (578 | 15.6%), English (528 | 14.3%), and Albanian (234 | 6.3%), together accounting for 81.6% of all Berwyn residents.
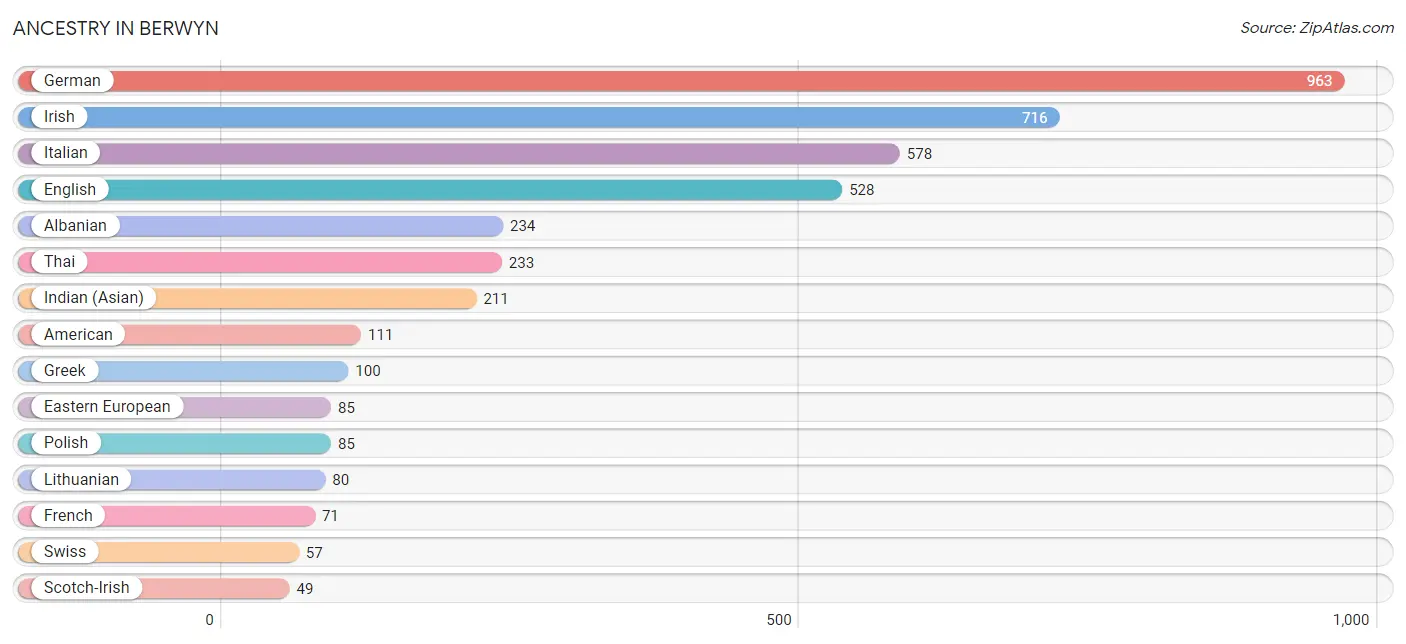
| Ancestry | # Population | % Population |
| Albanian | 234 | 6.3% |
| American | 111 | 3.0% |
| Bhutanese | 30 | 0.8% |
| Brazilian | 12 | 0.3% |
| Canadian | 27 | 0.7% |
| Central American | 11 | 0.3% |
| Dutch | 17 | 0.5% |
| Eastern European | 85 | 2.3% |
| English | 528 | 14.3% |
| French | 71 | 1.9% |
| French Canadian | 18 | 0.5% |
| German | 963 | 26.0% |
| Greek | 100 | 2.7% |
| Guatemalan | 11 | 0.3% |
| Hungarian | 22 | 0.6% |
| Indian (Asian) | 211 | 5.7% |
| Irish | 716 | 19.4% |
| Italian | 578 | 15.6% |
| Lithuanian | 80 | 2.2% |
| Mexican | 28 | 0.8% |
| Northern European | 20 | 0.5% |
| Norwegian | 18 | 0.5% |
| Polish | 85 | 2.3% |
| Portuguese | 31 | 0.8% |
| Russian | 7 | 0.2% |
| Scandinavian | 29 | 0.8% |
| Scotch-Irish | 49 | 1.3% |
| Scottish | 44 | 1.2% |
| Slovak | 23 | 0.6% |
| Slovene | 11 | 0.3% |
| Sri Lankan | 6 | 0.2% |
| Swedish | 29 | 0.8% |
| Swiss | 57 | 1.5% |
| Thai | 233 | 6.3% |
| Ukrainian | 49 | 1.3% |
| Welsh | 17 | 0.5% | View All 36 Rows |
Immigrants in Berwyn
The most numerous immigrant groups reported in Berwyn came from Asia (319 | 8.6%), China (193 | 5.2%), Eastern Asia (193 | 5.2%), Europe (182 | 4.9%), and Eastern Europe (144 | 3.9%), together accounting for 27.9% of all Berwyn residents.
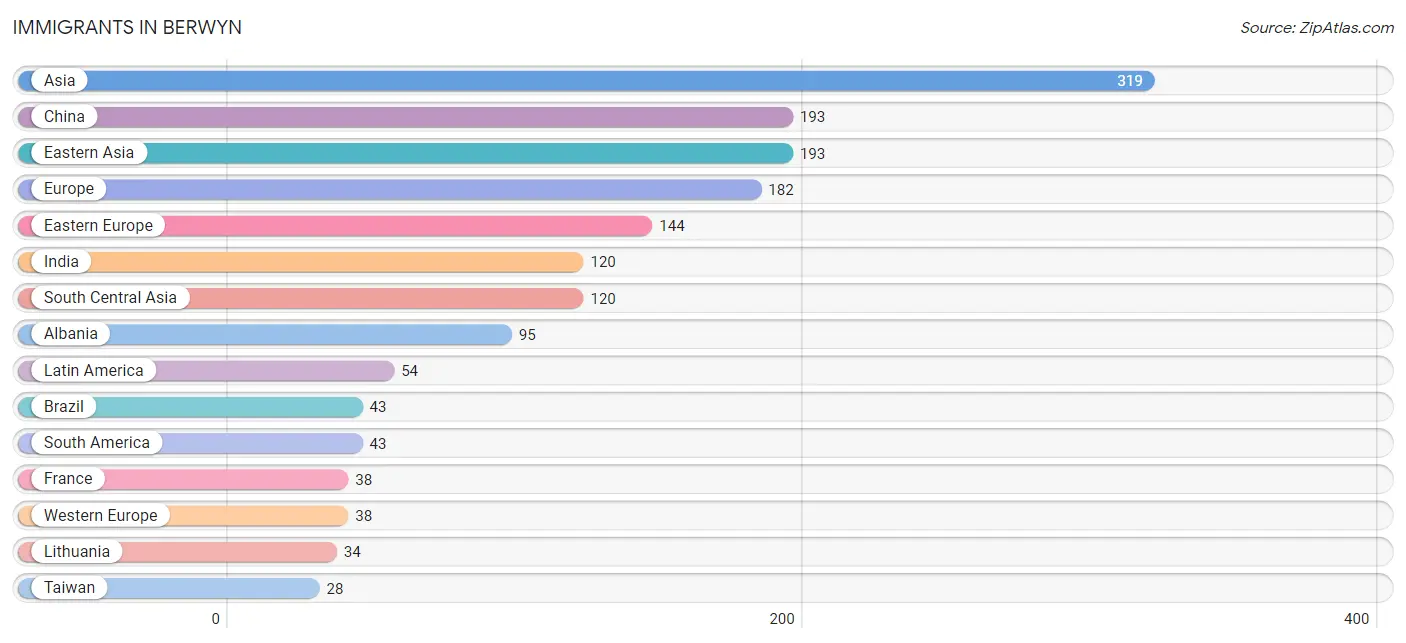
| Immigration Origin | # Population | % Population |
| Africa | 15 | 0.4% |
| Albania | 95 | 2.6% |
| Asia | 319 | 8.6% |
| Brazil | 43 | 1.2% |
| Central America | 11 | 0.3% |
| China | 193 | 5.2% |
| Eastern Africa | 15 | 0.4% |
| Eastern Asia | 193 | 5.2% |
| Eastern Europe | 144 | 3.9% |
| Europe | 182 | 4.9% |
| France | 38 | 1.0% |
| Guatemala | 11 | 0.3% |
| India | 120 | 3.2% |
| Latin America | 54 | 1.5% |
| Lithuania | 34 | 0.9% |
| Poland | 15 | 0.4% |
| South America | 43 | 1.2% |
| South Central Asia | 120 | 3.2% |
| South Eastern Asia | 6 | 0.2% |
| Taiwan | 28 | 0.8% |
| Uganda | 15 | 0.4% |
| Vietnam | 6 | 0.2% |
| Western Europe | 38 | 1.0% | View All 23 Rows |
Sex and Age in Berwyn
Sex and Age in Berwyn
The most populous age groups in Berwyn are 45 to 49 Years (182 | 11.2%) for men and 10 to 14 Years (288 | 13.9%) for women.
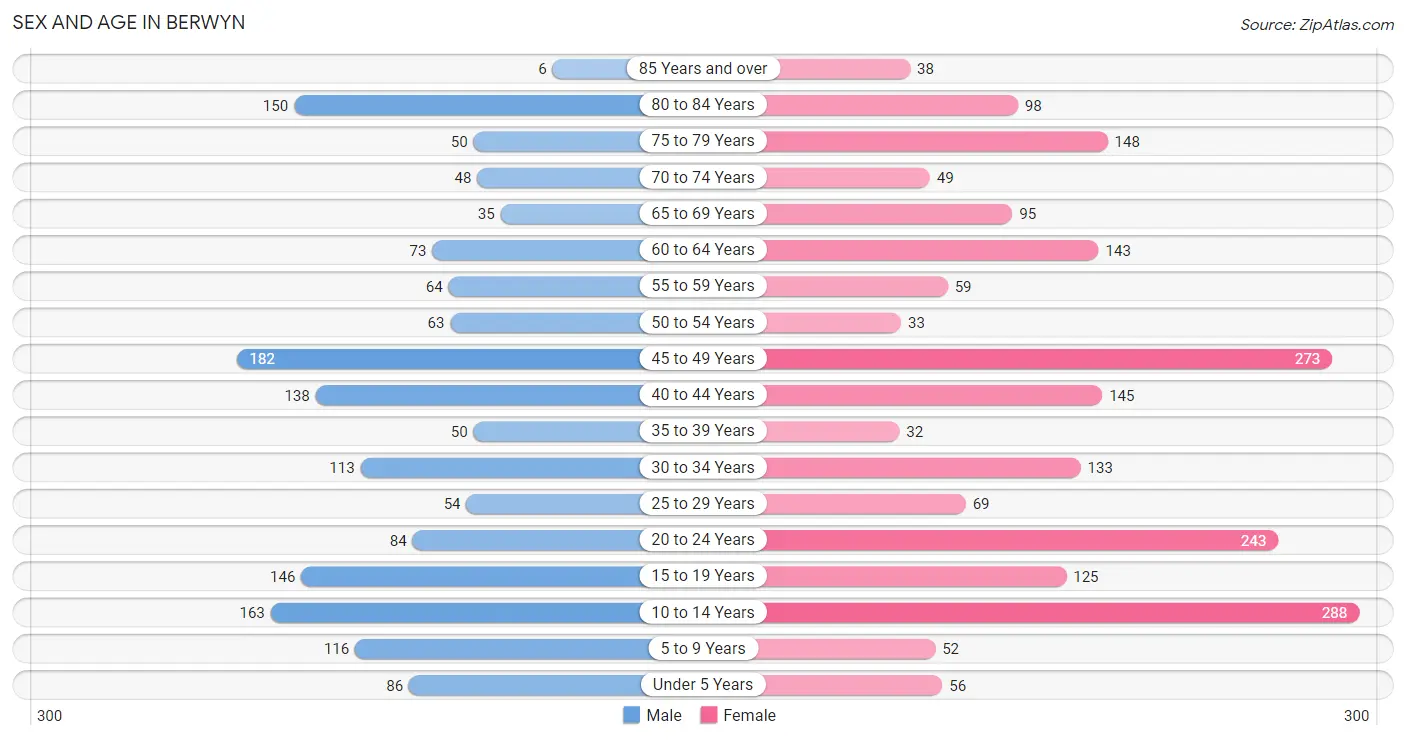
| Age Bracket | Male | Female |
| Under 5 Years | 86 (5.3%) | 56 (2.7%) |
| 5 to 9 Years | 116 (7.2%) | 52 (2.5%) |
| 10 to 14 Years | 163 (10.1%) | 288 (13.9%) |
| 15 to 19 Years | 146 (9.0%) | 125 (6.0%) |
| 20 to 24 Years | 84 (5.2%) | 243 (11.7%) |
| 25 to 29 Years | 54 (3.3%) | 69 (3.3%) |
| 30 to 34 Years | 113 (7.0%) | 133 (6.4%) |
| 35 to 39 Years | 50 (3.1%) | 32 (1.5%) |
| 40 to 44 Years | 138 (8.5%) | 145 (7.0%) |
| 45 to 49 Years | 182 (11.2%) | 273 (13.1%) |
| 50 to 54 Years | 63 (3.9%) | 33 (1.6%) |
| 55 to 59 Years | 64 (4.0%) | 59 (2.8%) |
| 60 to 64 Years | 73 (4.5%) | 143 (6.9%) |
| 65 to 69 Years | 35 (2.2%) | 95 (4.6%) |
| 70 to 74 Years | 48 (3.0%) | 49 (2.4%) |
| 75 to 79 Years | 50 (3.1%) | 148 (7.1%) |
| 80 to 84 Years | 150 (9.2%) | 98 (4.7%) |
| 85 Years and over | 6 (0.4%) | 38 (1.8%) |
| Total | 1,621 (100.0%) | 2,079 (100.0%) |
Families and Households in Berwyn
Median Family Size in Berwyn
The median family size in Berwyn is 2.88 persons per family, with married-couple families (793 | 78.0%) accounting for the largest median family size of 2.99 persons per family. On the other hand, single male/father families (17 | 1.7%) represent the smallest median family size with 2.41 persons per family.
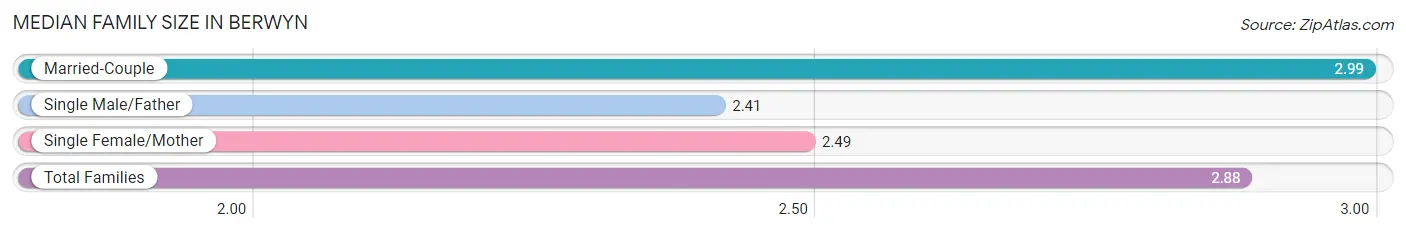
| Family Type | # Families | Family Size |
| Married-Couple | 793 (78.0%) | 2.99 |
| Single Male/Father | 17 (1.7%) | 2.41 |
| Single Female/Mother | 206 (20.3%) | 2.49 |
| Total Families | 1,016 (100.0%) | 2.88 |
Median Household Size in Berwyn
The median household size in Berwyn is 2.48 persons per household, with single male/father households (17 | 1.1%) accounting for the largest median household size of 3.29 persons per household. non-family households (457 | 31.0%) represent the smallest median household size with 1.50 persons per household.
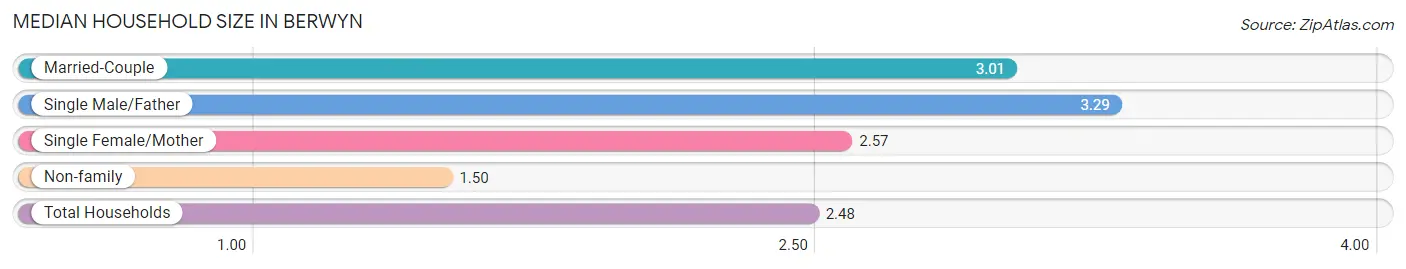
| Household Type | # Households | Household Size |
| Married-Couple | 793 (53.8%) | 3.01 |
| Single Male/Father | 17 (1.1%) | 3.29 |
| Single Female/Mother | 206 (14.0%) | 2.57 |
| Non-family | 457 (31.0%) | 1.50 |
| Total Households | 1,473 (100.0%) | 2.48 |
Household Size by Marriage Status in Berwyn
Out of a total of 1,473 households in Berwyn, 1,016 (69.0%) are family households, while 457 (31.0%) are nonfamily households. The most numerous type of family households are 2-person households, comprising 478, and the most common type of nonfamily households are 1-person households, comprising 388.
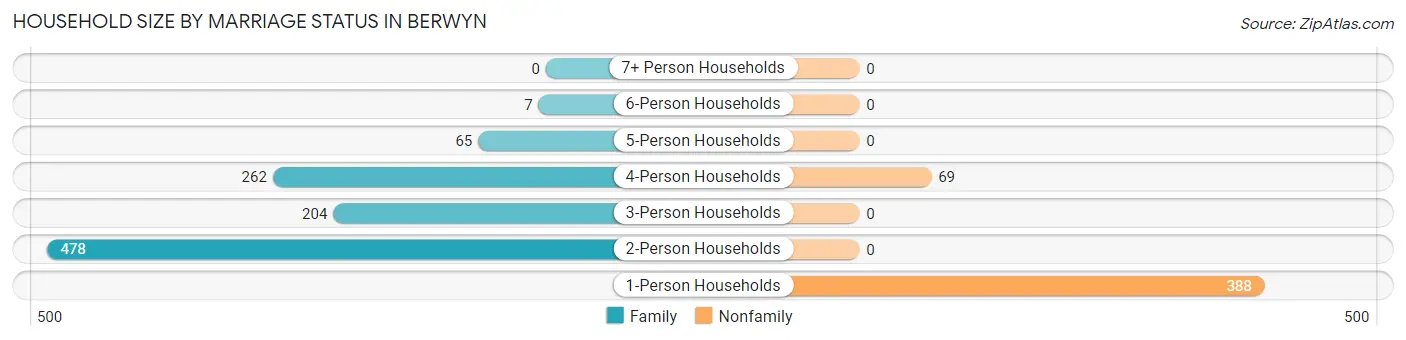
| Household Size | Family Households | Nonfamily Households |
| 1-Person Households | - | 388 (26.3%) |
| 2-Person Households | 478 (32.5%) | 0 (0.0%) |
| 3-Person Households | 204 (13.9%) | 0 (0.0%) |
| 4-Person Households | 262 (17.8%) | 69 (4.7%) |
| 5-Person Households | 65 (4.4%) | 0 (0.0%) |
| 6-Person Households | 7 (0.5%) | 0 (0.0%) |
| 7+ Person Households | 0 (0.0%) | 0 (0.0%) |
| Total | 1,016 (69.0%) | 457 (31.0%) |
Female Fertility in Berwyn
Fertility by Age in Berwyn
Average fertility rate in Berwyn is 47.0 births per 1,000 women. Women in the age bracket of 20 to 34 years have the highest fertility rate with 108.0 births per 1,000 women. Women in the age bracket of 20 to 34 years acount for 100.0% of all women with births.
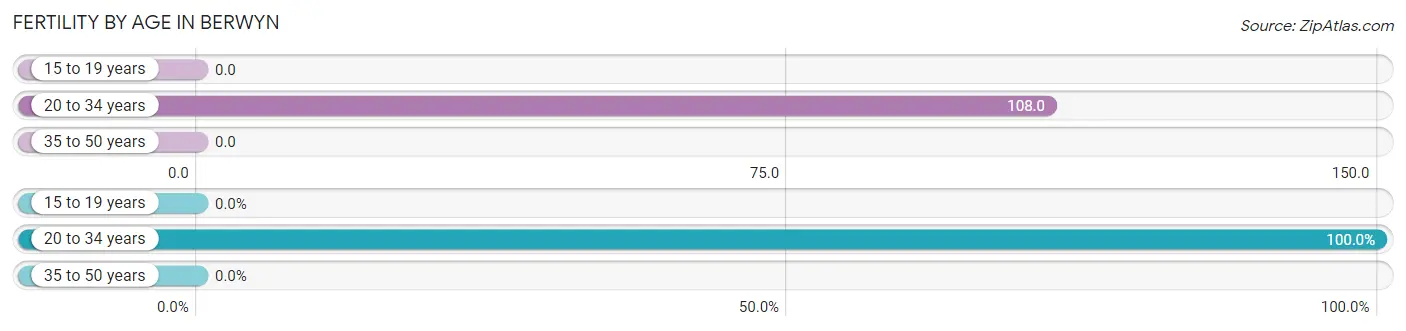
| Age Bracket | Women with Births | Births / 1,000 Women |
| 15 to 19 years | 0 (0.0%) | 0.0 |
| 20 to 34 years | 48 (100.0%) | 108.0 |
| 35 to 50 years | 0 (0.0%) | 0.0 |
| Total | 48 (100.0%) | 47.0 |
Fertility by Age by Marriage Status in Berwyn
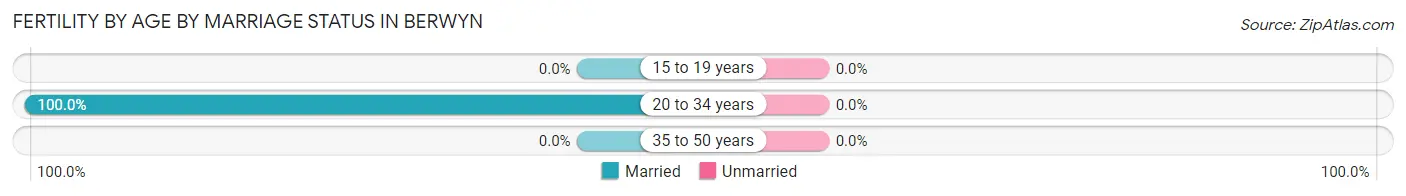
| Age Bracket | Married | Unmarried |
| 15 to 19 years | 0 (0.0%) | 0 (0.0%) |
| 20 to 34 years | 48 (100.0%) | 0 (0.0%) |
| 35 to 50 years | 0 (0.0%) | 0 (0.0%) |
| Total | 48 (100.0%) | 0 (0.0%) |
Fertility by Education in Berwyn
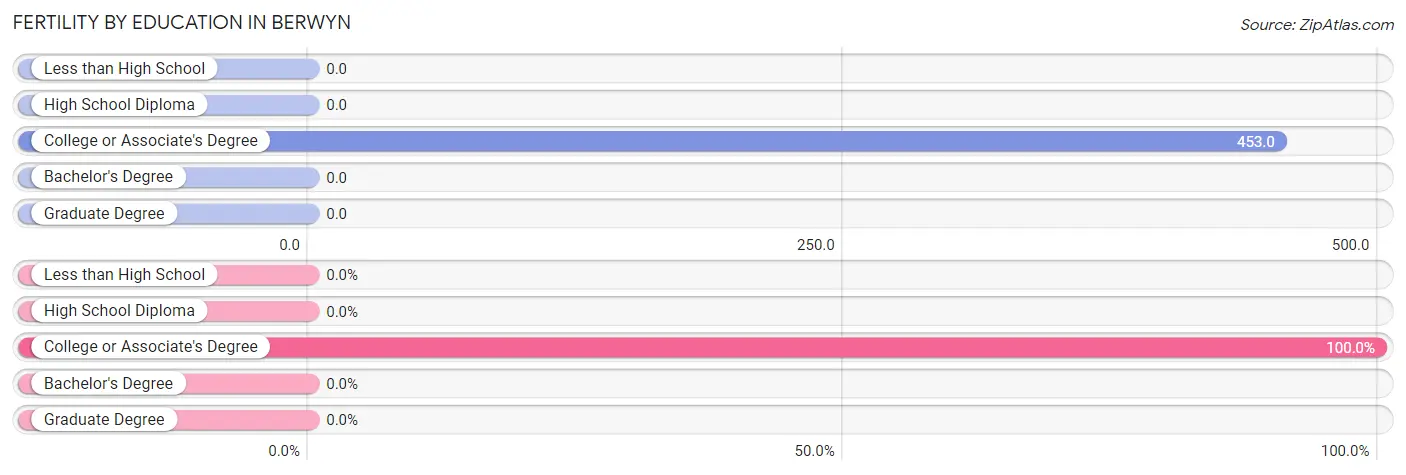
| Educational Attainment | Women with Births | Births / 1,000 Women |
| Less than High School | 0 (0.0%) | 0.0 |
| High School Diploma | 0 (0.0%) | 0.0 |
| College or Associate's Degree | 48 (100.0%) | 453.0 |
| Bachelor's Degree | 0 (0.0%) | 0.0 |
| Graduate Degree | 0 (0.0%) | 0.0 |
| Total | 48 (100.0%) | 47.0 |
Fertility by Education by Marriage Status in Berwyn
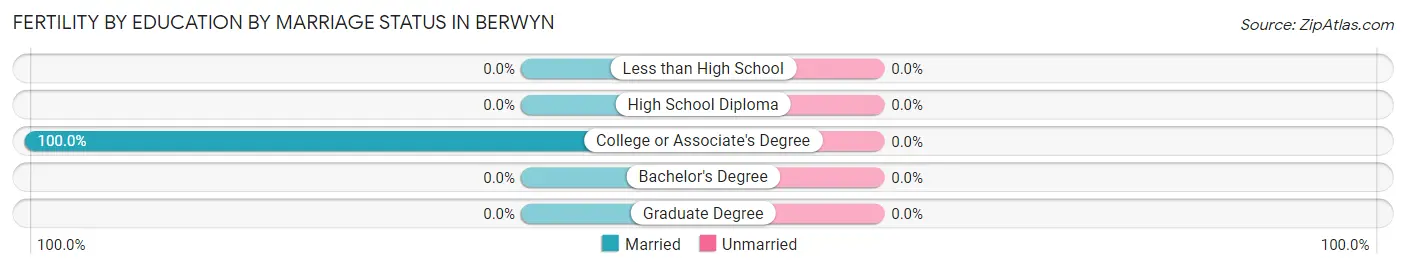
| Educational Attainment | Married | Unmarried |
| Less than High School | 0 (0.0%) | 0 (0.0%) |
| High School Diploma | 0 (0.0%) | 0 (0.0%) |
| College or Associate's Degree | 48 (100.0%) | 0 (0.0%) |
| Bachelor's Degree | 0 (0.0%) | 0 (0.0%) |
| Graduate Degree | 0 (0.0%) | 0 (0.0%) |
| Total | 48 (100.0%) | 0 (0.0%) |
Employment Characteristics in Berwyn
Employment by Class of Employer in Berwyn
Among the 1,510 employed individuals in Berwyn, private company employees (1,122 | 74.3%), not-for-profit organizations (238 | 15.8%), and self-employed (incorporated) (103 | 6.8%) make up the most common classes of employment.
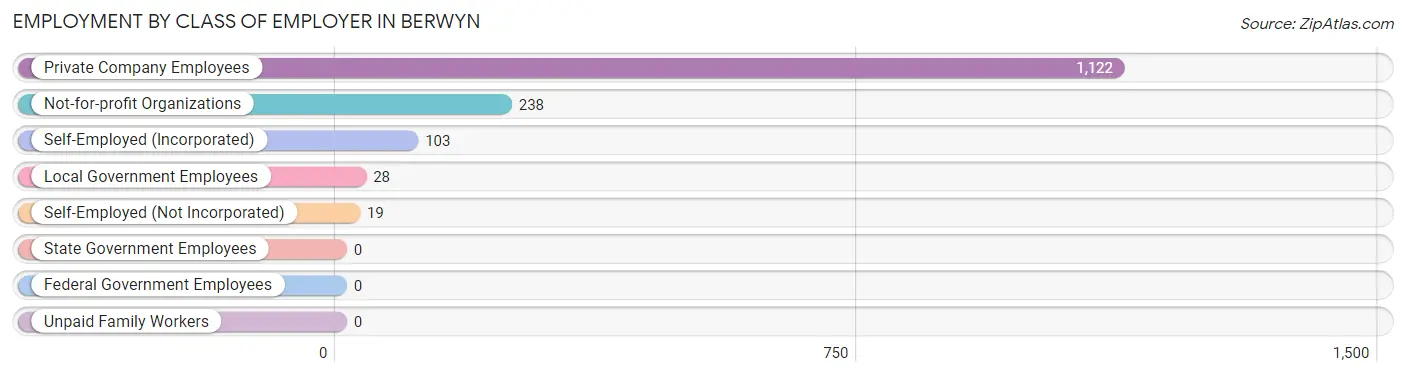
| Employer Class | # Employees | % Employees |
| Private Company Employees | 1,122 | 74.3% |
| Self-Employed (Incorporated) | 103 | 6.8% |
| Self-Employed (Not Incorporated) | 19 | 1.3% |
| Not-for-profit Organizations | 238 | 15.8% |
| Local Government Employees | 28 | 1.8% |
| State Government Employees | 0 | 0.0% |
| Federal Government Employees | 0 | 0.0% |
| Unpaid Family Workers | 0 | 0.0% |
| Total | 1,510 | 100.0% |
Employment Status by Age in Berwyn
According to the labor force statistics for Berwyn, out of the total population over 16 years of age (2,825), 59.9% or 1,692 individuals are in the labor force, with 5.1% or 86 of them unemployed. The age group with the highest labor force participation rate is 25 to 29 years, with 100.0% or 123 individuals in the labor force. Within the labor force, the 20 to 24 years age range has the highest percentage of unemployed individuals, with 78.1% or 75 of them being unemployed.
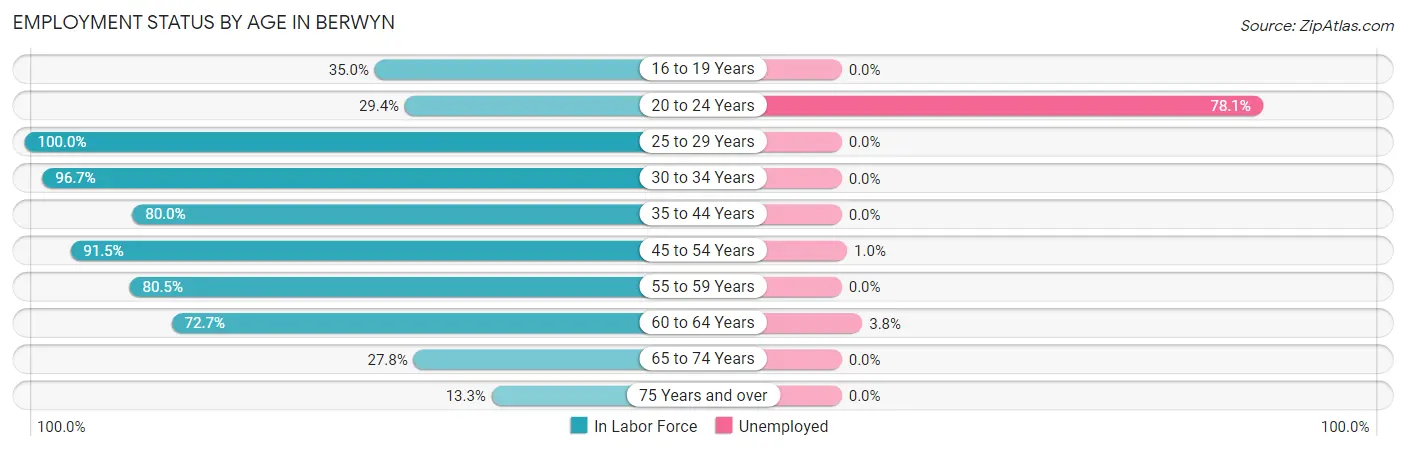
| Age Bracket | In Labor Force | Unemployed |
| 16 to 19 Years | 55 (35.0%) | 0 (0.0%) |
| 20 to 24 Years | 96 (29.4%) | 75 (78.1%) |
| 25 to 29 Years | 123 (100.0%) | 0 (0.0%) |
| 30 to 34 Years | 238 (96.7%) | 0 (0.0%) |
| 35 to 44 Years | 292 (80.0%) | 0 (0.0%) |
| 45 to 54 Years | 504 (91.5%) | 5 (1.0%) |
| 55 to 59 Years | 99 (80.5%) | 0 (0.0%) |
| 60 to 64 Years | 157 (72.7%) | 6 (3.8%) |
| 65 to 74 Years | 63 (27.8%) | 0 (0.0%) |
| 75 Years and over | 65 (13.3%) | 0 (0.0%) |
| Total | 1,692 (59.9%) | 86 (5.1%) |
Employment Status by Educational Attainment in Berwyn
According to labor force statistics for Berwyn, 87.0% of individuals (1,413) out of the total population between 25 and 64 years of age (1,624) are in the labor force, with 0.8% or 11 of them being unemployed. The group with the highest labor force participation rate are those with the educational attainment of college / associate degree, with 93.9% or 260 individuals in the labor force. Within the labor force, individuals with college / associate degree education have the highest percentage of unemployment, with 1.9% or 5 of them being unemployed.
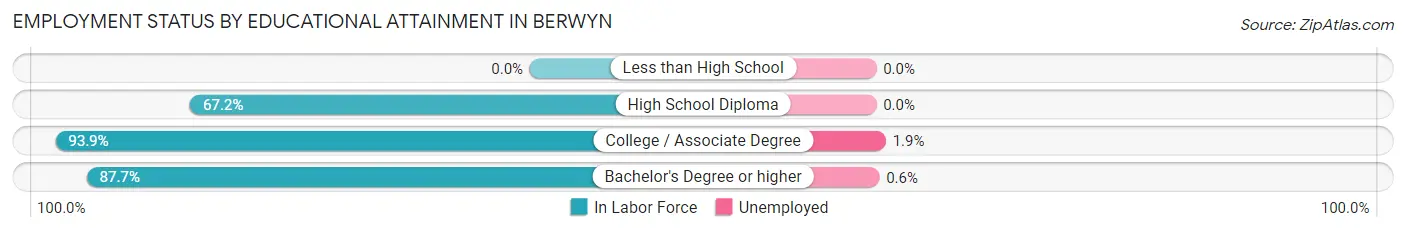
| Educational Attainment | In Labor Force | Unemployed |
| Less than High School | 0 (0.0%) | 0 (0.0%) |
| High School Diploma | 92 (67.2%) | 0 (0.0%) |
| College / Associate Degree | 260 (93.9%) | 5 (1.9%) |
| Bachelor's Degree or higher | 1,061 (87.7%) | 7 (0.6%) |
| Total | 1,413 (87.0%) | 13 (0.8%) |
Employment Occupations by Sex in Berwyn
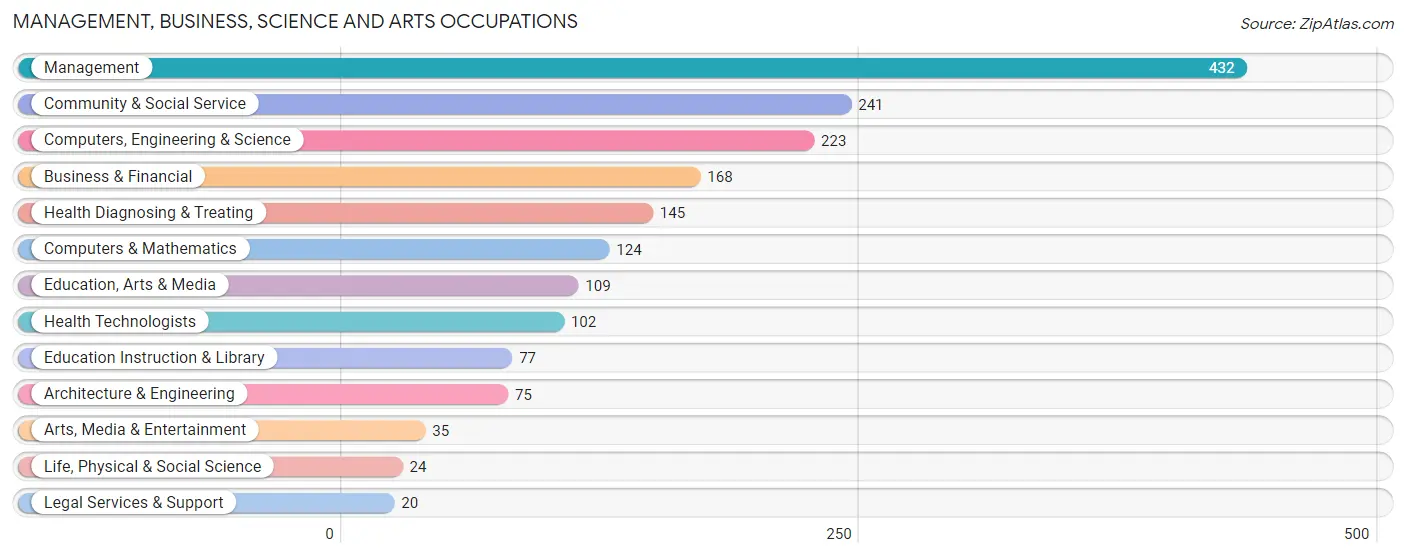
Management, Business, Science and Arts Occupations
The most common Management, Business, Science and Arts occupations in Berwyn are Management (432 | 26.9%), Community & Social Service (241 | 15.0%), Computers, Engineering & Science (223 | 13.9%), Business & Financial (168 | 10.5%), and Health Diagnosing & Treating (145 | 9.0%).
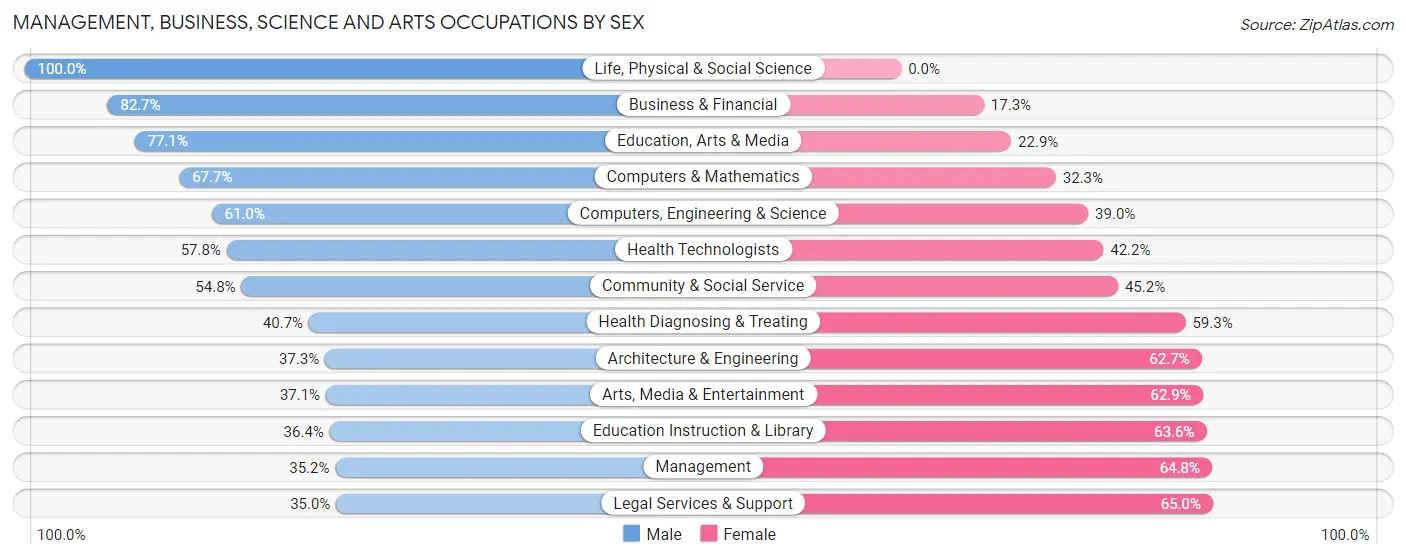
Management, Business, Science and Arts Occupations by Sex
Within the Management, Business, Science and Arts occupations in Berwyn, the most male-oriented occupations are Life, Physical & Social Science (100.0%), Business & Financial (82.7%), and Education, Arts & Media (77.1%), while the most female-oriented occupations are Legal Services & Support (65.0%), Management (64.8%), and Education Instruction & Library (63.6%).
| Occupation | Male | Female |
| Management | 152 (35.2%) | 280 (64.8%) |
| Business & Financial | 139 (82.7%) | 29 (17.3%) |
| Computers, Engineering & Science | 136 (61.0%) | 87 (39.0%) |
| Computers & Mathematics | 84 (67.7%) | 40 (32.3%) |
| Architecture & Engineering | 28 (37.3%) | 47 (62.7%) |
| Life, Physical & Social Science | 24 (100.0%) | 0 (0.0%) |
| Community & Social Service | 132 (54.8%) | 109 (45.2%) |
| Education, Arts & Media | 84 (77.1%) | 25 (22.9%) |
| Legal Services & Support | 7 (35.0%) | 13 (65.0%) |
| Education Instruction & Library | 28 (36.4%) | 49 (63.6%) |
| Arts, Media & Entertainment | 13 (37.1%) | 22 (62.9%) |
| Health Diagnosing & Treating | 59 (40.7%) | 86 (59.3%) |
| Health Technologists | 59 (57.8%) | 43 (42.2%) |
| Total (Category) | 618 (51.1%) | 591 (48.9%) |
| Total (Overall) | 825 (51.4%) | 781 (48.6%) |
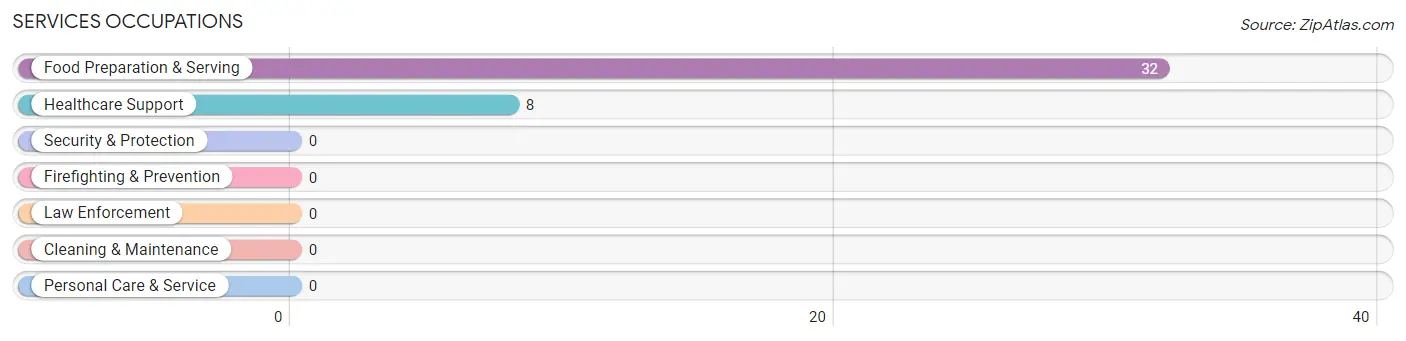
Services Occupations
The most common Services occupations in Berwyn are Food Preparation & Serving (32 | 2.0%), and Healthcare Support (8 | 0.5%).
Services Occupations by Sex
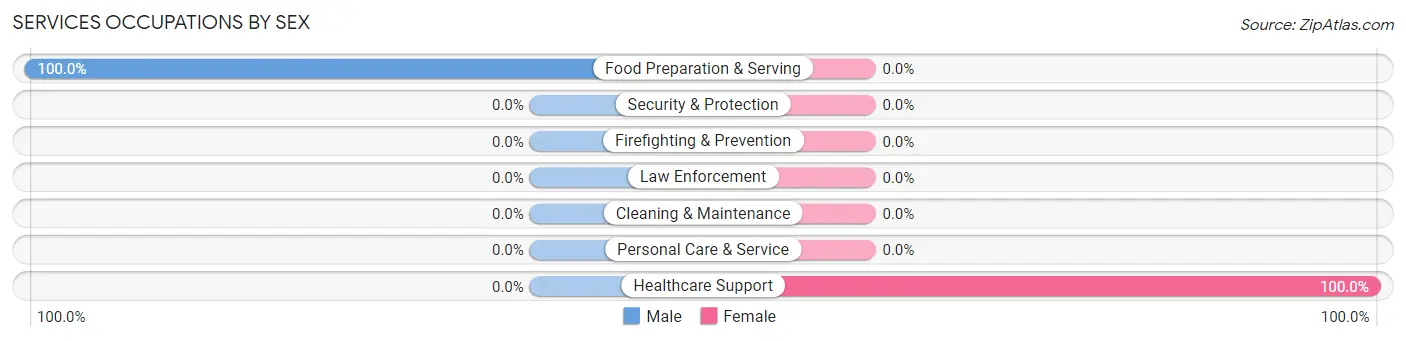
| Occupation | Male | Female |
| Healthcare Support | 0 (0.0%) | 8 (100.0%) |
| Security & Protection | 0 (0.0%) | 0 (0.0%) |
| Firefighting & Prevention | 0 (0.0%) | 0 (0.0%) |
| Law Enforcement | 0 (0.0%) | 0 (0.0%) |
| Food Preparation & Serving | 32 (100.0%) | 0 (0.0%) |
| Cleaning & Maintenance | 0 (0.0%) | 0 (0.0%) |
| Personal Care & Service | 0 (0.0%) | 0 (0.0%) |
| Total (Category) | 32 (80.0%) | 8 (20.0%) |
| Total (Overall) | 825 (51.4%) | 781 (48.6%) |
Sales and Office Occupations
The most common Sales and Office occupations in Berwyn are Sales & Related (151 | 9.4%), and Office & Administration (112 | 7.0%).

Sales and Office Occupations by Sex

| Occupation | Male | Female |
| Sales & Related | 78 (51.7%) | 73 (48.3%) |
| Office & Administration | 23 (20.5%) | 89 (79.5%) |
| Total (Category) | 101 (38.4%) | 162 (61.6%) |
| Total (Overall) | 825 (51.4%) | 781 (48.6%) |
Natural Resources, Construction and Maintenance Occupations
The most common Natural Resources, Construction and Maintenance occupations in Berwyn are , and Installation, Maintenance & Repair (19 | 1.2%).
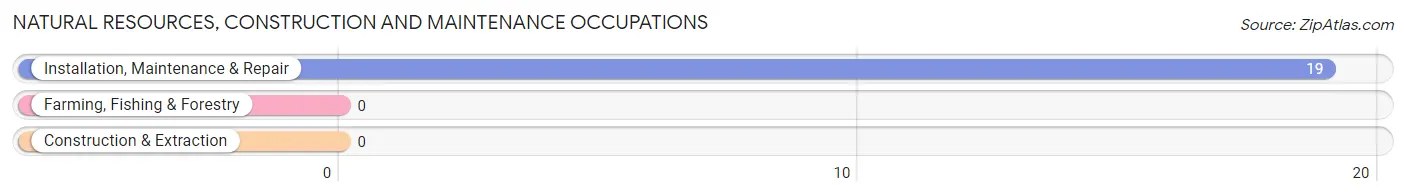
Natural Resources, Construction and Maintenance Occupations by Sex
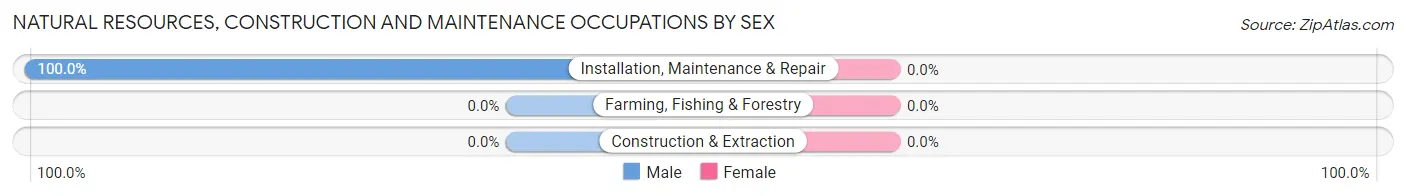
| Occupation | Male | Female |
| Farming, Fishing & Forestry | 0 (0.0%) | 0 (0.0%) |
| Construction & Extraction | 0 (0.0%) | 0 (0.0%) |
| Installation, Maintenance & Repair | 19 (100.0%) | 0 (0.0%) |
| Total (Category) | 19 (100.0%) | 0 (0.0%) |
| Total (Overall) | 825 (51.4%) | 781 (48.6%) |
Production, Transportation and Moving Occupations
The most common Production, Transportation and Moving occupations in Berwyn are Production (53 | 3.3%), and Transportation (22 | 1.4%).
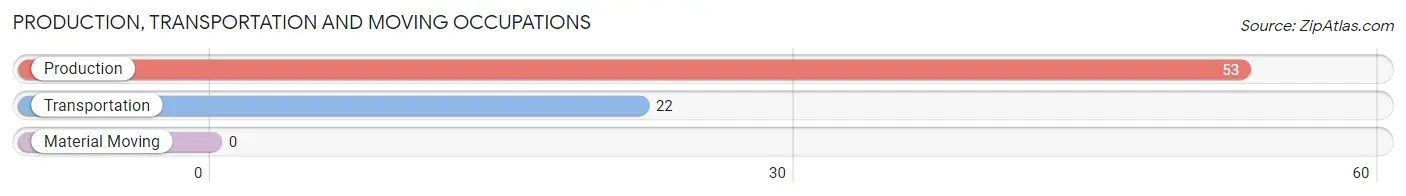
Production, Transportation and Moving Occupations by Sex
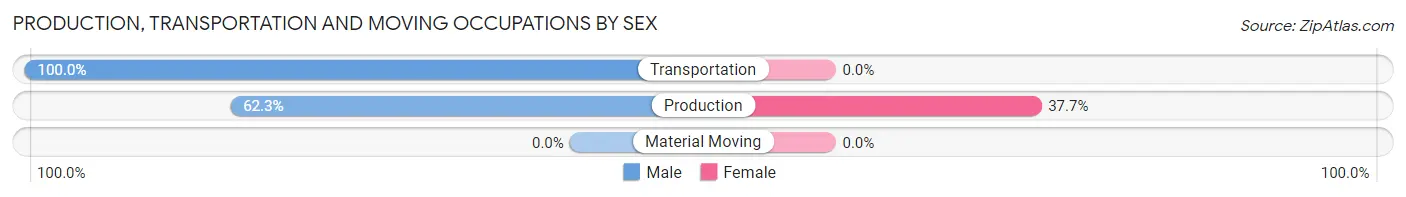
| Occupation | Male | Female |
| Production | 33 (62.3%) | 20 (37.7%) |
| Transportation | 22 (100.0%) | 0 (0.0%) |
| Material Moving | 0 (0.0%) | 0 (0.0%) |
| Total (Category) | 55 (73.3%) | 20 (26.7%) |
| Total (Overall) | 825 (51.4%) | 781 (48.6%) |
Employment Industries by Sex in Berwyn
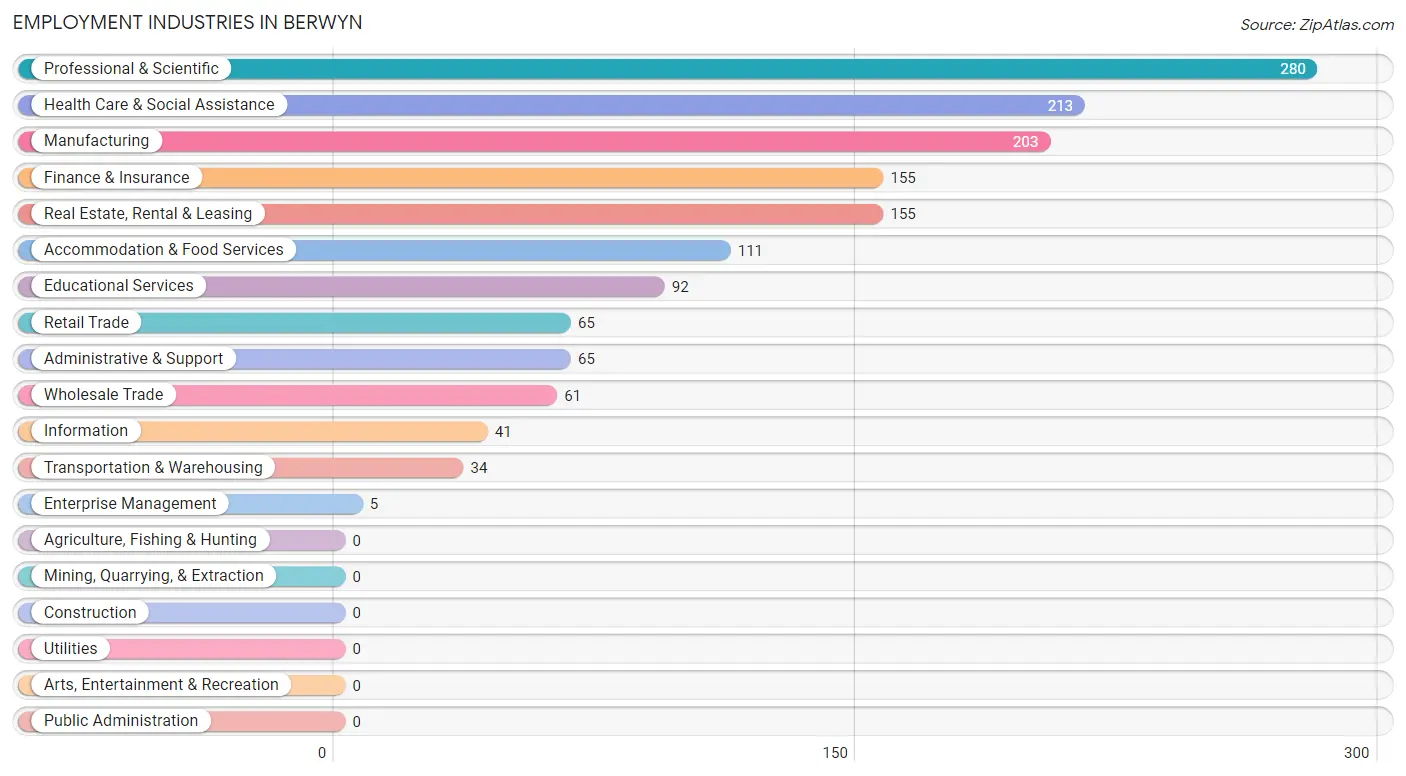
Employment Industries in Berwyn
The major employment industries in Berwyn include Professional & Scientific (280 | 17.4%), Health Care & Social Assistance (213 | 13.3%), Manufacturing (203 | 12.6%), Finance & Insurance (155 | 9.7%), and Real Estate, Rental & Leasing (155 | 9.7%).
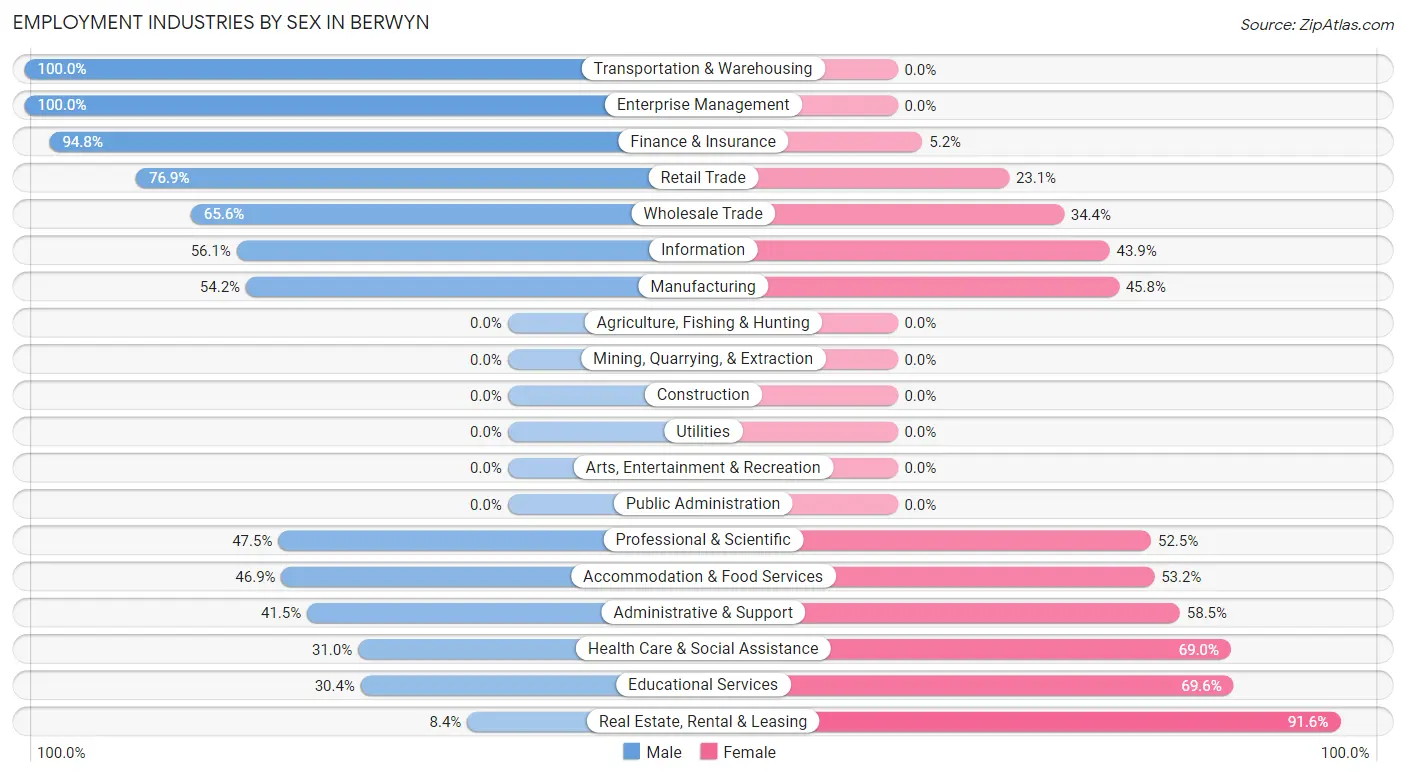
Employment Industries by Sex in Berwyn
The Berwyn industries that see more men than women are Transportation & Warehousing (100.0%), Enterprise Management (100.0%), and Finance & Insurance (94.8%), whereas the industries that tend to have a higher number of women are Real Estate, Rental & Leasing (91.6%), Educational Services (69.6%), and Health Care & Social Assistance (69.0%).
| Industry | Male | Female |
| Agriculture, Fishing & Hunting | 0 (0.0%) | 0 (0.0%) |
| Mining, Quarrying, & Extraction | 0 (0.0%) | 0 (0.0%) |
| Construction | 0 (0.0%) | 0 (0.0%) |
| Manufacturing | 110 (54.2%) | 93 (45.8%) |
| Wholesale Trade | 40 (65.6%) | 21 (34.4%) |
| Retail Trade | 50 (76.9%) | 15 (23.1%) |
| Transportation & Warehousing | 34 (100.0%) | 0 (0.0%) |
| Utilities | 0 (0.0%) | 0 (0.0%) |
| Information | 23 (56.1%) | 18 (43.9%) |
| Finance & Insurance | 147 (94.8%) | 8 (5.2%) |
| Real Estate, Rental & Leasing | 13 (8.4%) | 142 (91.6%) |
| Professional & Scientific | 133 (47.5%) | 147 (52.5%) |
| Enterprise Management | 5 (100.0%) | 0 (0.0%) |
| Administrative & Support | 27 (41.5%) | 38 (58.5%) |
| Educational Services | 28 (30.4%) | 64 (69.6%) |
| Health Care & Social Assistance | 66 (31.0%) | 147 (69.0%) |
| Arts, Entertainment & Recreation | 0 (0.0%) | 0 (0.0%) |
| Accommodation & Food Services | 52 (46.9%) | 59 (53.1%) |
| Public Administration | 0 (0.0%) | 0 (0.0%) |
| Total | 825 (51.4%) | 781 (48.6%) |
Education in Berwyn
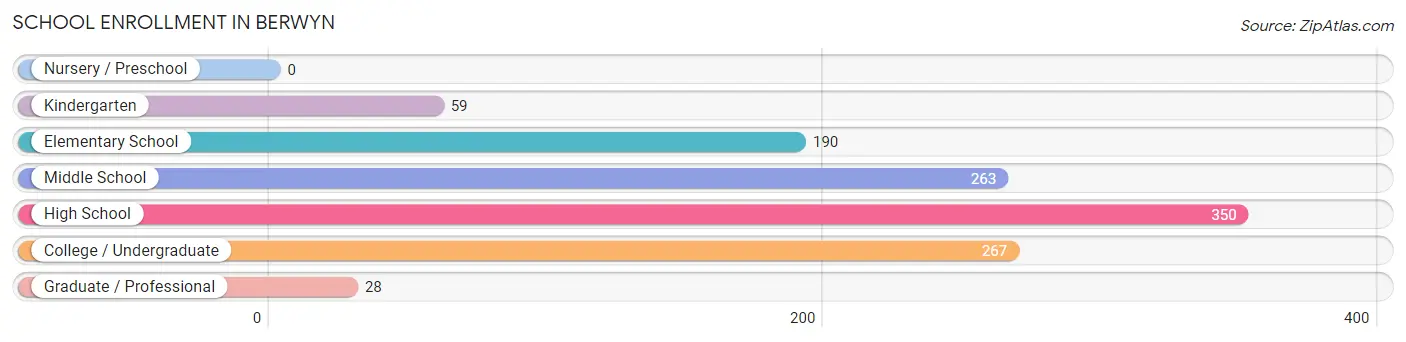
School Enrollment in Berwyn
The most common levels of schooling among the 1,157 students in Berwyn are high school (350 | 30.2%), college / undergraduate (267 | 23.1%), and middle school (263 | 22.7%).
| School Level | # Students | % Students |
| Nursery / Preschool | 0 | 0.0% |
| Kindergarten | 59 | 5.1% |
| Elementary School | 190 | 16.4% |
| Middle School | 263 | 22.7% |
| High School | 350 | 30.2% |
| College / Undergraduate | 267 | 23.1% |
| Graduate / Professional | 28 | 2.4% |
| Total | 1,157 | 100.0% |
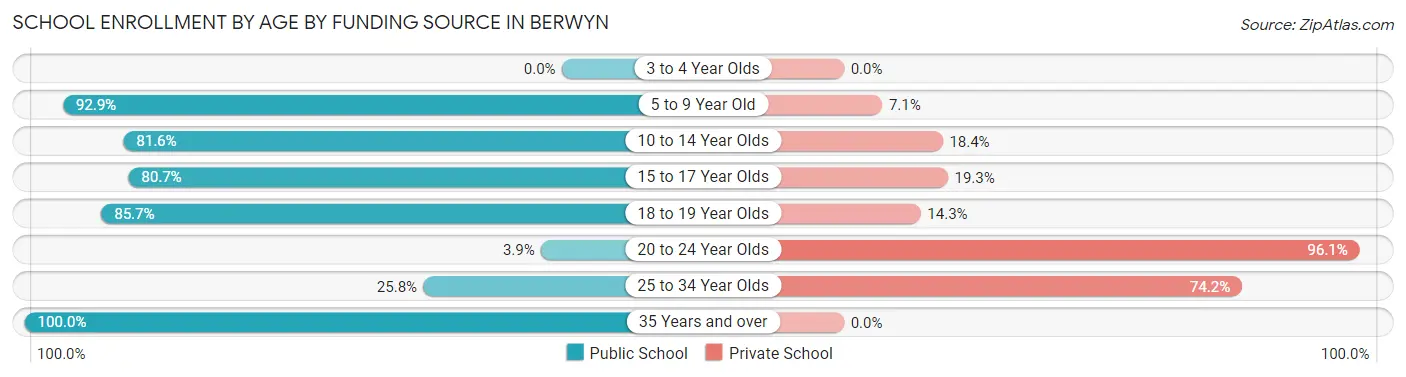
School Enrollment by Age by Funding Source in Berwyn
Out of a total of 1,157 students who are enrolled in schools in Berwyn, 391 (33.8%) attend a private institution, while the remaining 766 (66.2%) are enrolled in public schools. The age group of 20 to 24 year olds has the highest likelihood of being enrolled in private schools, with 222 (96.1% in the age bracket) enrolled. Conversely, the age group of 35 years and over has the lowest likelihood of being enrolled in a private school, with 5 (100.0% in the age bracket) attending a public institution.
| Age Bracket | Public School | Private School |
| 3 to 4 Year Olds | 0 (0.0%) | 0 (0.0%) |
| 5 to 9 Year Old | 156 (92.9%) | 12 (7.1%) |
| 10 to 14 Year Olds | 368 (81.6%) | 83 (18.4%) |
| 15 to 17 Year Olds | 196 (80.7%) | 47 (19.3%) |
| 18 to 19 Year Olds | 24 (85.7%) | 4 (14.3%) |
| 20 to 24 Year Olds | 9 (3.9%) | 222 (96.1%) |
| 25 to 34 Year Olds | 8 (25.8%) | 23 (74.2%) |
| 35 Years and over | 5 (100.0%) | 0 (0.0%) |
| Total | 766 (66.2%) | 391 (33.8%) |
Educational Attainment by Field of Study in Berwyn
Science & technology (278 | 15.4%), business (227 | 12.6%), social sciences (214 | 11.8%), literature & languages (207 | 11.5%), and computers & mathematics (205 | 11.3%) are the most common fields of study among 1,807 individuals in Berwyn who have obtained a bachelor's degree or higher.
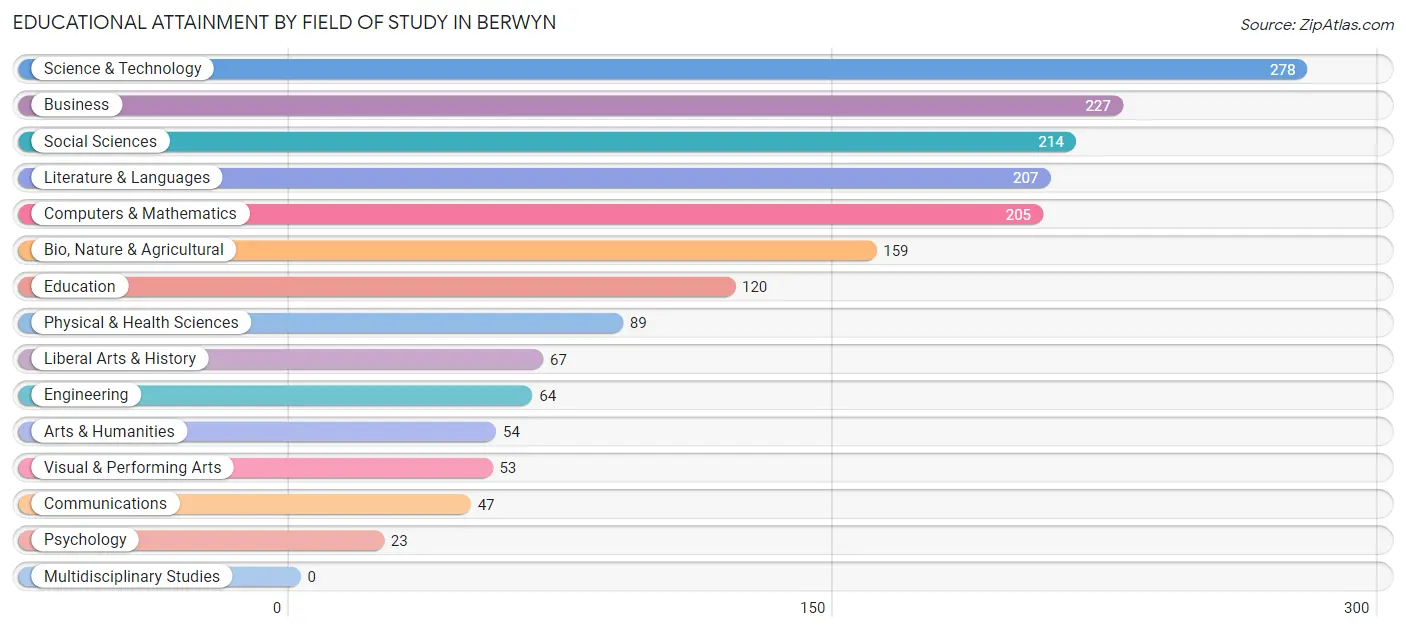
| Field of Study | # Graduates | % Graduates |
| Computers & Mathematics | 205 | 11.3% |
| Bio, Nature & Agricultural | 159 | 8.8% |
| Physical & Health Sciences | 89 | 4.9% |
| Psychology | 23 | 1.3% |
| Social Sciences | 214 | 11.8% |
| Engineering | 64 | 3.5% |
| Multidisciplinary Studies | 0 | 0.0% |
| Science & Technology | 278 | 15.4% |
| Business | 227 | 12.6% |
| Education | 120 | 6.6% |
| Literature & Languages | 207 | 11.5% |
| Liberal Arts & History | 67 | 3.7% |
| Visual & Performing Arts | 53 | 2.9% |
| Communications | 47 | 2.6% |
| Arts & Humanities | 54 | 3.0% |
| Total | 1,807 | 100.0% |
Transportation & Commute in Berwyn
Vehicle Availability by Sex in Berwyn
The most prevalent vehicle ownership categories in Berwyn are males with 2 vehicles (470, accounting for 57.5%) and females with 2 vehicles (303, making up 68.6%).
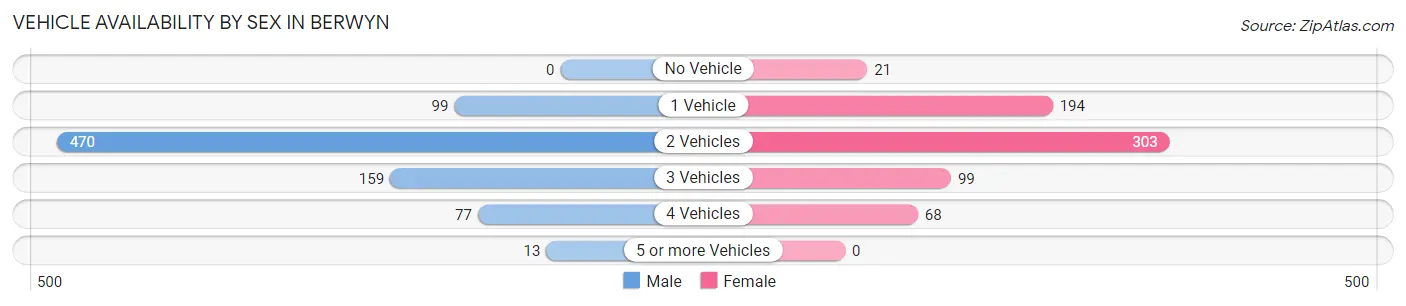
| Vehicles Available | Male | Female |
| No Vehicle | 0 (0.0%) | 21 (3.1%) |
| 1 Vehicle | 99 (12.1%) | 194 (28.3%) |
| 2 Vehicles | 470 (57.5%) | 303 (44.2%) |
| 3 Vehicles | 159 (19.4%) | 99 (14.4%) |
| 4 Vehicles | 77 (9.4%) | 68 (9.9%) |
| 5 or more Vehicles | 13 (1.6%) | 0 (0.0%) |
| Total | 818 (100.0%) | 685 (100.0%) |
Commute Time in Berwyn
The most frequently occuring commute durations in Berwyn are 15 to 19 minutes (196 commuters, 18.6%), 20 to 24 minutes (164 commuters, 15.6%), and 25 to 29 minutes (143 commuters, 13.6%).
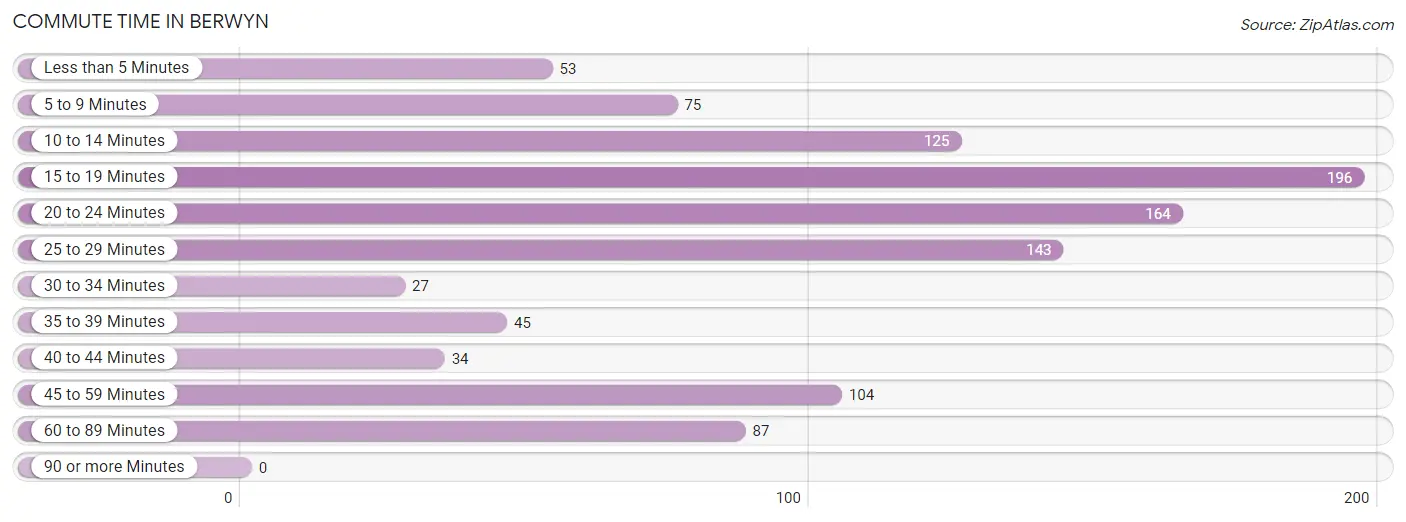
| Commute Time | # Commuters | % Commuters |
| Less than 5 Minutes | 53 | 5.0% |
| 5 to 9 Minutes | 75 | 7.1% |
| 10 to 14 Minutes | 125 | 11.9% |
| 15 to 19 Minutes | 196 | 18.6% |
| 20 to 24 Minutes | 164 | 15.6% |
| 25 to 29 Minutes | 143 | 13.6% |
| 30 to 34 Minutes | 27 | 2.6% |
| 35 to 39 Minutes | 45 | 4.3% |
| 40 to 44 Minutes | 34 | 3.2% |
| 45 to 59 Minutes | 104 | 9.9% |
| 60 to 89 Minutes | 87 | 8.3% |
| 90 or more Minutes | 0 | 0.0% |
Commute Time by Sex in Berwyn
The most common commute times in Berwyn are 20 to 24 minutes (147 commuters, 31.8%) for males and 15 to 19 minutes (116 commuters, 19.6%) for females.
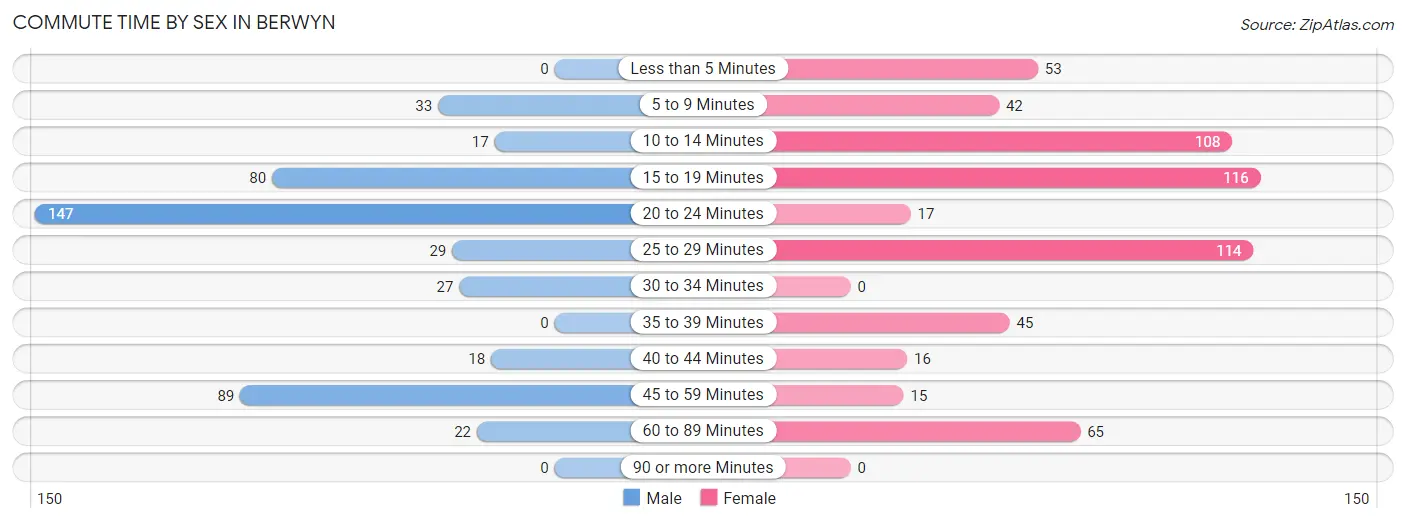
| Commute Time | Male | Female |
| Less than 5 Minutes | 0 (0.0%) | 53 (9.0%) |
| 5 to 9 Minutes | 33 (7.1%) | 42 (7.1%) |
| 10 to 14 Minutes | 17 (3.7%) | 108 (18.3%) |
| 15 to 19 Minutes | 80 (17.3%) | 116 (19.6%) |
| 20 to 24 Minutes | 147 (31.8%) | 17 (2.9%) |
| 25 to 29 Minutes | 29 (6.3%) | 114 (19.3%) |
| 30 to 34 Minutes | 27 (5.8%) | 0 (0.0%) |
| 35 to 39 Minutes | 0 (0.0%) | 45 (7.6%) |
| 40 to 44 Minutes | 18 (3.9%) | 16 (2.7%) |
| 45 to 59 Minutes | 89 (19.3%) | 15 (2.5%) |
| 60 to 89 Minutes | 22 (4.8%) | 65 (11.0%) |
| 90 or more Minutes | 0 (0.0%) | 0 (0.0%) |
Time of Departure to Work by Sex in Berwyn
The most frequent times of departure to work in Berwyn are 8:00 AM to 8:29 AM (96, 20.8%) for males and 7:00 AM to 7:29 AM (215, 36.4%) for females.
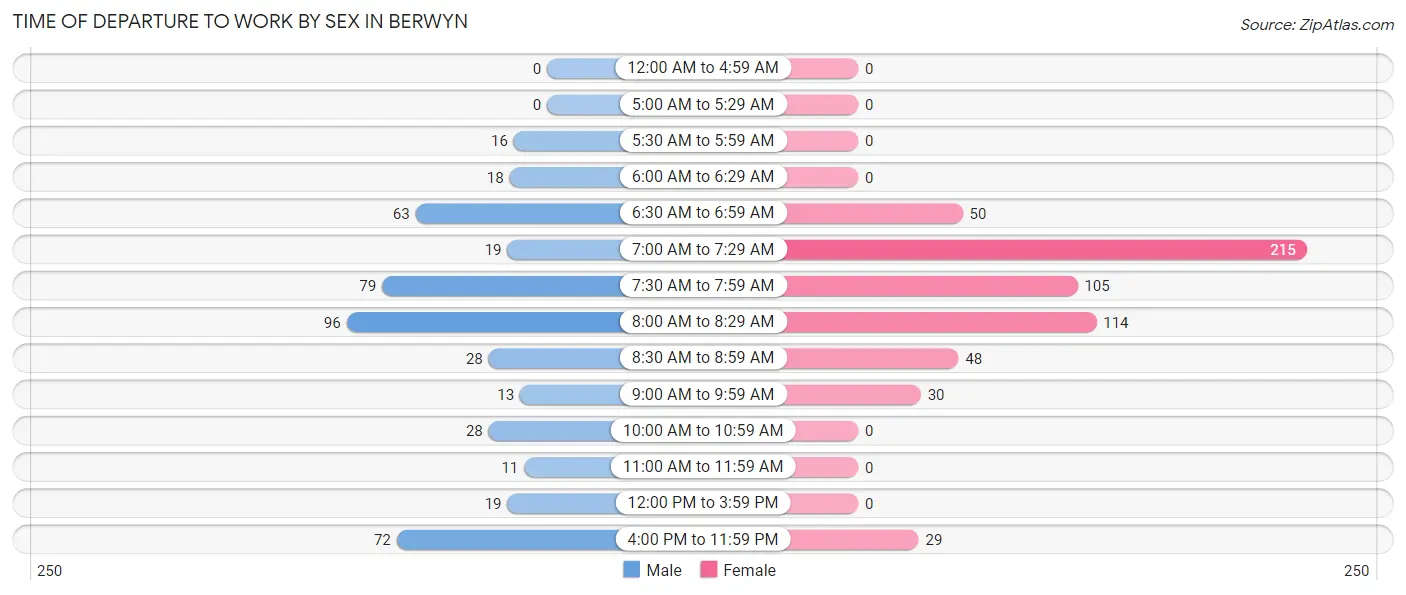
| Time of Departure | Male | Female |
| 12:00 AM to 4:59 AM | 0 (0.0%) | 0 (0.0%) |
| 5:00 AM to 5:29 AM | 0 (0.0%) | 0 (0.0%) |
| 5:30 AM to 5:59 AM | 16 (3.5%) | 0 (0.0%) |
| 6:00 AM to 6:29 AM | 18 (3.9%) | 0 (0.0%) |
| 6:30 AM to 6:59 AM | 63 (13.6%) | 50 (8.5%) |
| 7:00 AM to 7:29 AM | 19 (4.1%) | 215 (36.4%) |
| 7:30 AM to 7:59 AM | 79 (17.1%) | 105 (17.8%) |
| 8:00 AM to 8:29 AM | 96 (20.8%) | 114 (19.3%) |
| 8:30 AM to 8:59 AM | 28 (6.1%) | 48 (8.1%) |
| 9:00 AM to 9:59 AM | 13 (2.8%) | 30 (5.1%) |
| 10:00 AM to 10:59 AM | 28 (6.1%) | 0 (0.0%) |
| 11:00 AM to 11:59 AM | 11 (2.4%) | 0 (0.0%) |
| 12:00 PM to 3:59 PM | 19 (4.1%) | 0 (0.0%) |
| 4:00 PM to 11:59 PM | 72 (15.6%) | 29 (4.9%) |
| Total | 462 (100.0%) | 591 (100.0%) |
Housing Occupancy in Berwyn
Occupancy by Ownership in Berwyn
Of the total 1,473 dwellings in Berwyn, owner-occupied units account for 803 (54.5%), while renter-occupied units make up 670 (45.5%).
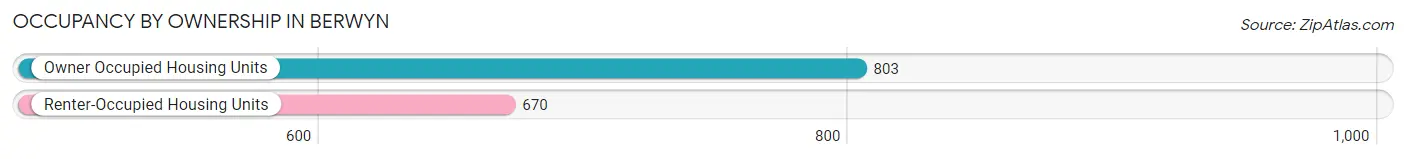
| Occupancy | # Housing Units | % Housing Units |
| Owner Occupied Housing Units | 803 | 54.5% |
| Renter-Occupied Housing Units | 670 | 45.5% |
| Total Occupied Housing Units | 1,473 | 100.0% |
Occupancy by Household Size in Berwyn
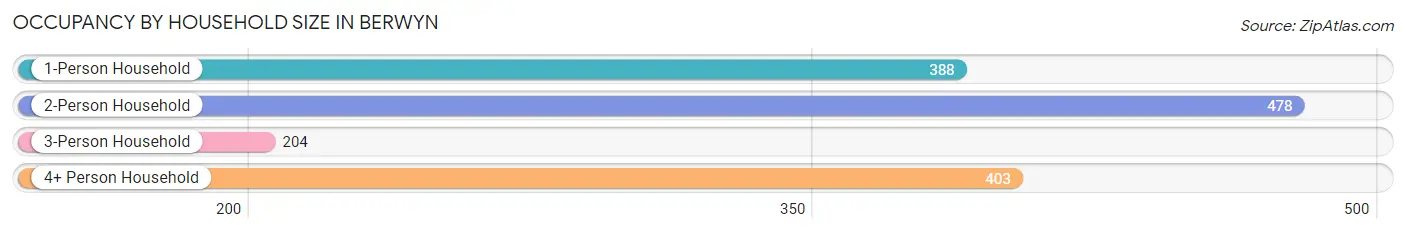
| Household Size | # Housing Units | % Housing Units |
| 1-Person Household | 388 | 26.3% |
| 2-Person Household | 478 | 32.5% |
| 3-Person Household | 204 | 13.9% |
| 4+ Person Household | 403 | 27.4% |
| Total Housing Units | 1,473 | 100.0% |
Occupancy by Ownership by Household Size in Berwyn
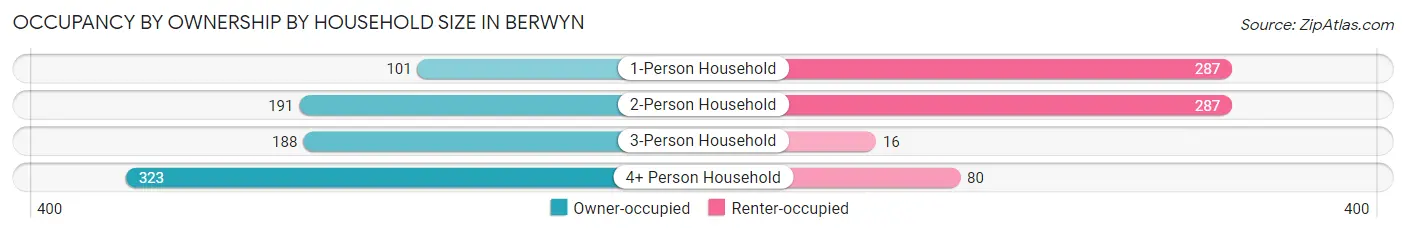
| Household Size | Owner-occupied | Renter-occupied |
| 1-Person Household | 101 (26.0%) | 287 (74.0%) |
| 2-Person Household | 191 (40.0%) | 287 (60.0%) |
| 3-Person Household | 188 (92.2%) | 16 (7.8%) |
| 4+ Person Household | 323 (80.1%) | 80 (19.9%) |
| Total Housing Units | 803 (54.5%) | 670 (45.5%) |
Occupancy by Educational Attainment in Berwyn
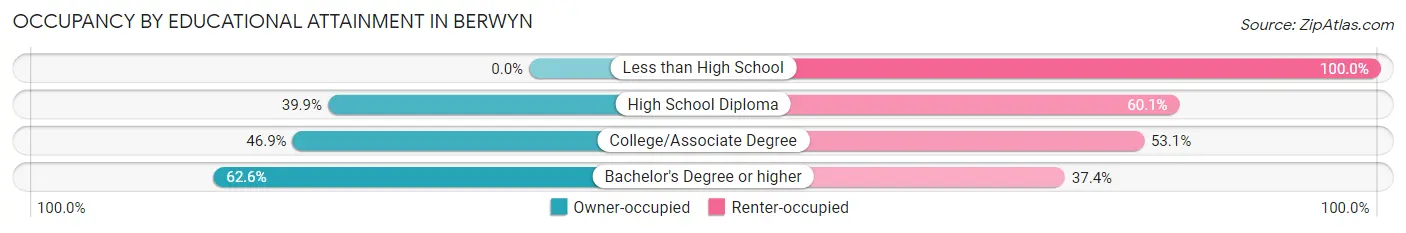
| Household Size | Owner-occupied | Renter-occupied |
| Less than High School | 0 (0.0%) | 66 (100.0%) |
| High School Diploma | 65 (39.9%) | 98 (60.1%) |
| College/Associate Degree | 121 (46.9%) | 137 (53.1%) |
| Bachelor's Degree or higher | 617 (62.6%) | 369 (37.4%) |
Occupancy by Age of Householder in Berwyn
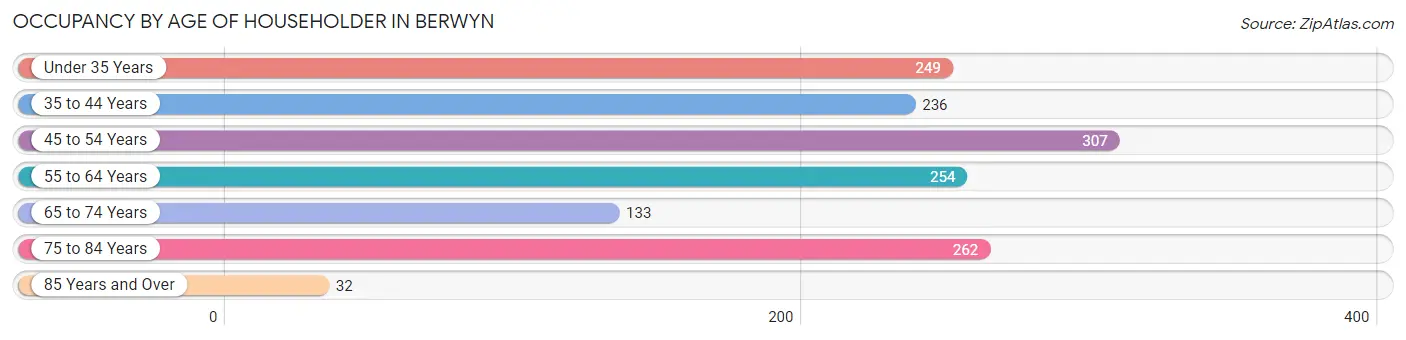
| Age Bracket | # Households | % Households |
| Under 35 Years | 249 | 16.9% |
| 35 to 44 Years | 236 | 16.0% |
| 45 to 54 Years | 307 | 20.8% |
| 55 to 64 Years | 254 | 17.2% |
| 65 to 74 Years | 133 | 9.0% |
| 75 to 84 Years | 262 | 17.8% |
| 85 Years and Over | 32 | 2.2% |
| Total | 1,473 | 100.0% |
Housing Finances in Berwyn
Median Income by Occupancy in Berwyn
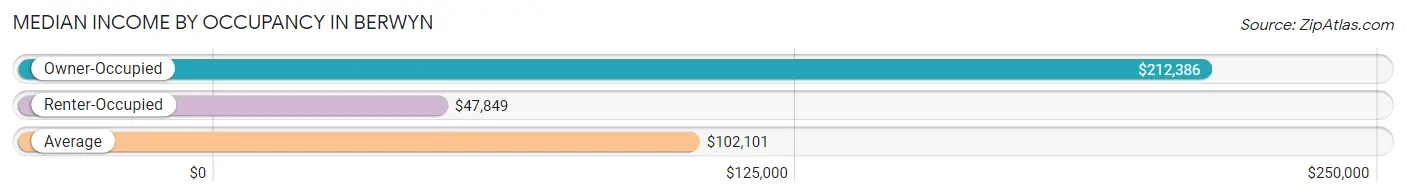
| Occupancy Type | # Households | Median Income |
| Owner-Occupied | 803 (54.5%) | $212,386 |
| Renter-Occupied | 670 (45.5%) | $47,849 |
| Average | 1,473 (100.0%) | $102,101 |
Occupancy by Householder Income Bracket in Berwyn
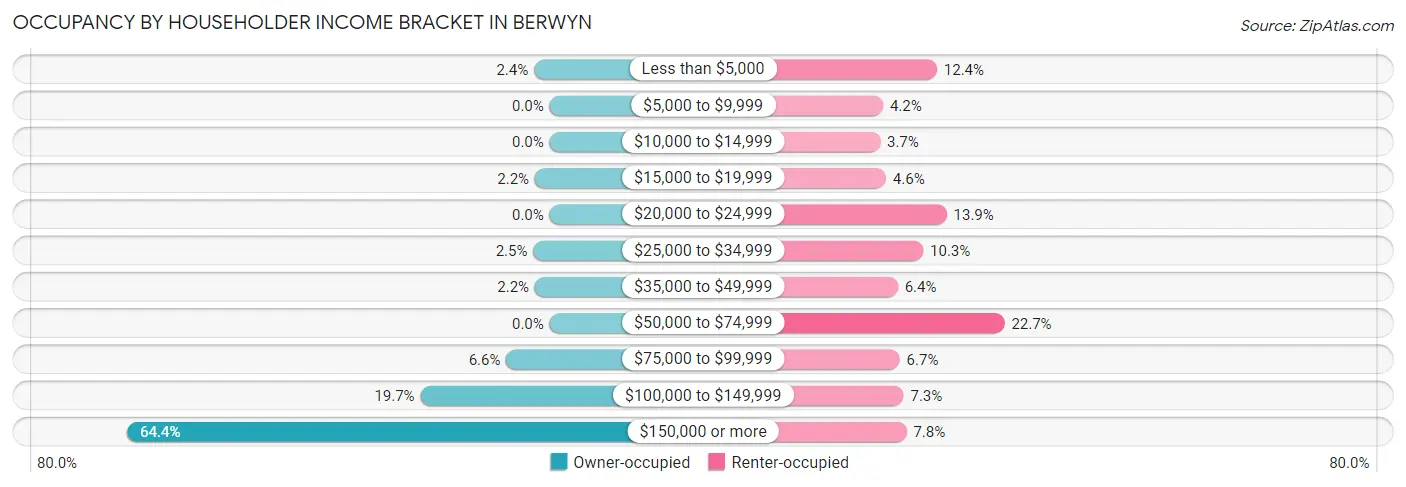
| Income Bracket | Owner-occupied | Renter-occupied |
| Less than $5,000 | 19 (2.4%) | 83 (12.4%) |
| $5,000 to $9,999 | 0 (0.0%) | 28 (4.2%) |
| $10,000 to $14,999 | 0 (0.0%) | 25 (3.7%) |
| $15,000 to $19,999 | 18 (2.2%) | 31 (4.6%) |
| $20,000 to $24,999 | 0 (0.0%) | 93 (13.9%) |
| $25,000 to $34,999 | 20 (2.5%) | 69 (10.3%) |
| $35,000 to $49,999 | 18 (2.2%) | 43 (6.4%) |
| $50,000 to $74,999 | 0 (0.0%) | 152 (22.7%) |
| $75,000 to $99,999 | 53 (6.6%) | 45 (6.7%) |
| $100,000 to $149,999 | 158 (19.7%) | 49 (7.3%) |
| $150,000 or more | 517 (64.4%) | 52 (7.8%) |
| Total | 803 (100.0%) | 670 (100.0%) |
Monthly Housing Cost Tiers in Berwyn
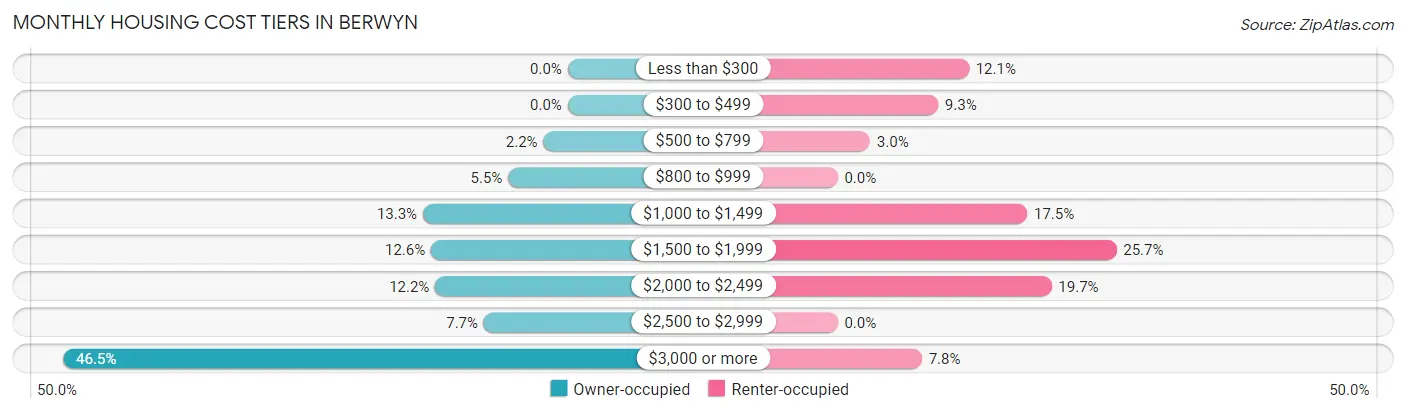
| Monthly Cost | Owner-occupied | Renter-occupied |
| Less than $300 | 0 (0.0%) | 81 (12.1%) |
| $300 to $499 | 0 (0.0%) | 62 (9.2%) |
| $500 to $799 | 18 (2.2%) | 20 (3.0%) |
| $800 to $999 | 44 (5.5%) | 0 (0.0%) |
| $1,000 to $1,499 | 107 (13.3%) | 117 (17.5%) |
| $1,500 to $1,999 | 101 (12.6%) | 172 (25.7%) |
| $2,000 to $2,499 | 98 (12.2%) | 132 (19.7%) |
| $2,500 to $2,999 | 62 (7.7%) | 0 (0.0%) |
| $3,000 or more | 373 (46.5%) | 52 (7.8%) |
| Total | 803 (100.0%) | 670 (100.0%) |
Physical Housing Characteristics in Berwyn
Housing Structures in Berwyn
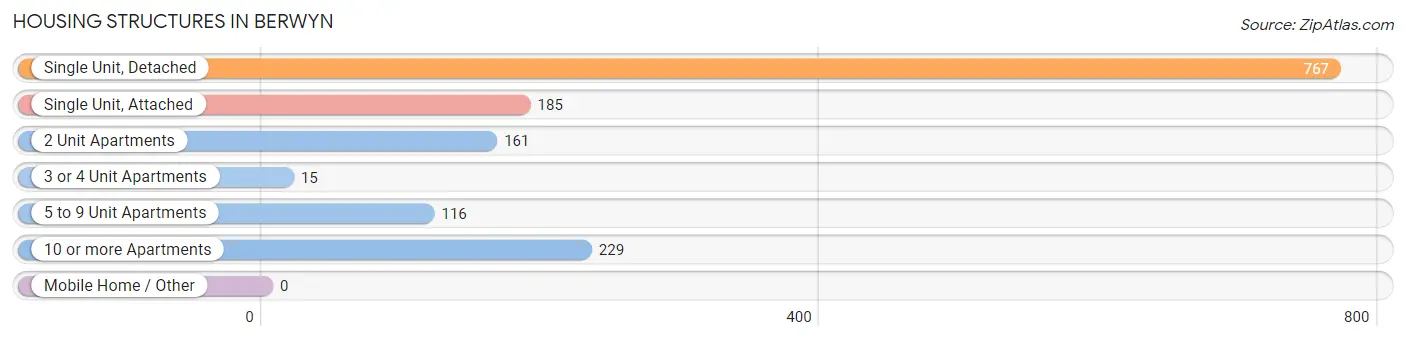
| Structure Type | # Housing Units | % Housing Units |
| Single Unit, Detached | 767 | 52.1% |
| Single Unit, Attached | 185 | 12.6% |
| 2 Unit Apartments | 161 | 10.9% |
| 3 or 4 Unit Apartments | 15 | 1.0% |
| 5 to 9 Unit Apartments | 116 | 7.9% |
| 10 or more Apartments | 229 | 15.5% |
| Mobile Home / Other | 0 | 0.0% |
| Total | 1,473 | 100.0% |
Housing Structures by Occupancy in Berwyn
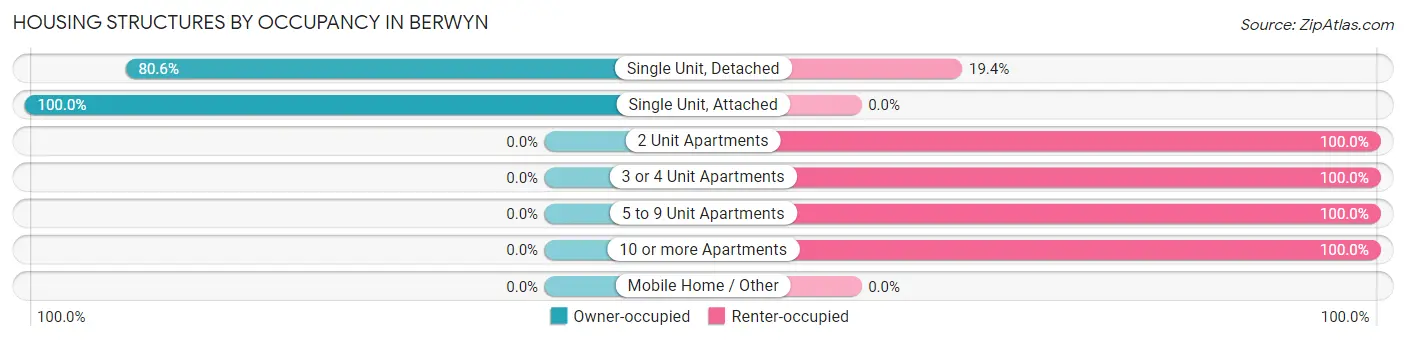
| Structure Type | Owner-occupied | Renter-occupied |
| Single Unit, Detached | 618 (80.6%) | 149 (19.4%) |
| Single Unit, Attached | 185 (100.0%) | 0 (0.0%) |
| 2 Unit Apartments | 0 (0.0%) | 161 (100.0%) |
| 3 or 4 Unit Apartments | 0 (0.0%) | 15 (100.0%) |
| 5 to 9 Unit Apartments | 0 (0.0%) | 116 (100.0%) |
| 10 or more Apartments | 0 (0.0%) | 229 (100.0%) |
| Mobile Home / Other | 0 (0.0%) | 0 (0.0%) |
| Total | 803 (54.5%) | 670 (45.5%) |
Housing Structures by Number of Rooms in Berwyn
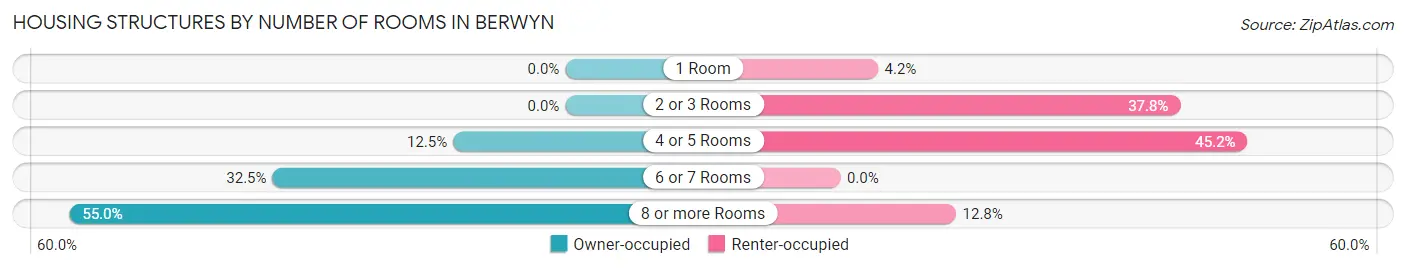
| Number of Rooms | Owner-occupied | Renter-occupied |
| 1 Room | 0 (0.0%) | 28 (4.2%) |
| 2 or 3 Rooms | 0 (0.0%) | 253 (37.8%) |
| 4 or 5 Rooms | 100 (12.4%) | 303 (45.2%) |
| 6 or 7 Rooms | 261 (32.5%) | 0 (0.0%) |
| 8 or more Rooms | 442 (55.0%) | 86 (12.8%) |
| Total | 803 (100.0%) | 670 (100.0%) |
Housing Structure by Heating Type in Berwyn
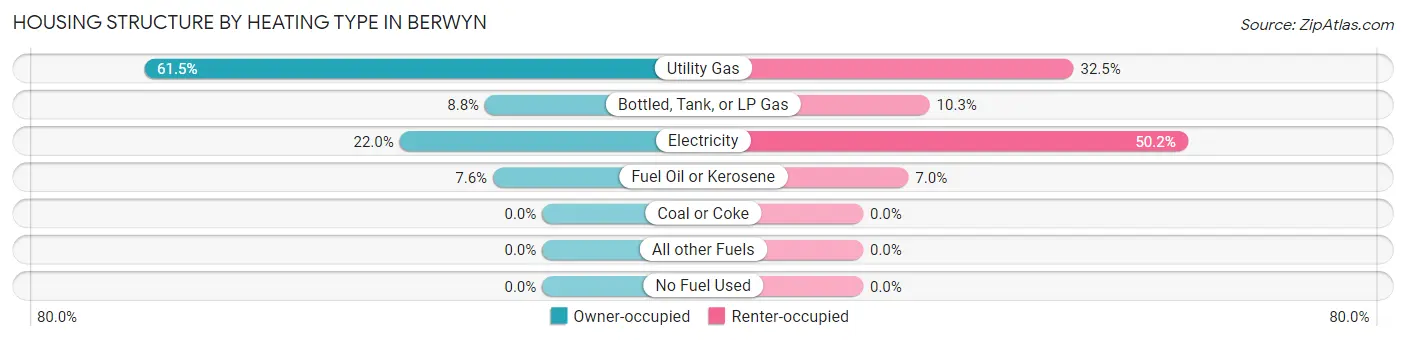
| Heating Type | Owner-occupied | Renter-occupied |
| Utility Gas | 494 (61.5%) | 218 (32.5%) |
| Bottled, Tank, or LP Gas | 71 (8.8%) | 69 (10.3%) |
| Electricity | 177 (22.0%) | 336 (50.1%) |
| Fuel Oil or Kerosene | 61 (7.6%) | 47 (7.0%) |
| Coal or Coke | 0 (0.0%) | 0 (0.0%) |
| All other Fuels | 0 (0.0%) | 0 (0.0%) |
| No Fuel Used | 0 (0.0%) | 0 (0.0%) |
| Total | 803 (100.0%) | 670 (100.0%) |
Household Vehicle Usage in Berwyn
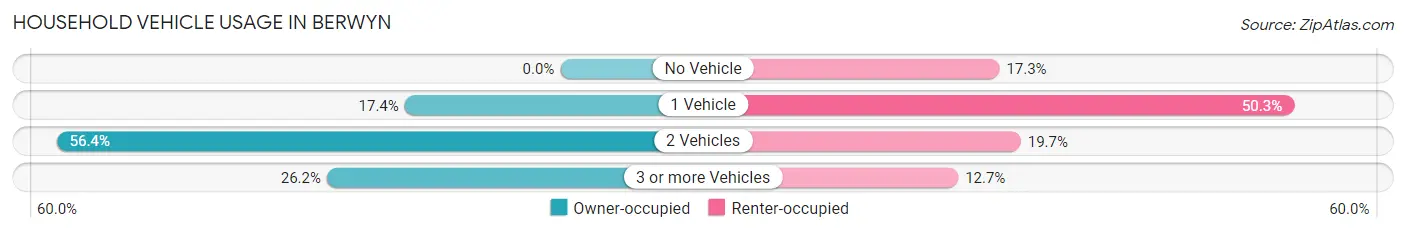
| Vehicles per Household | Owner-occupied | Renter-occupied |
| No Vehicle | 0 (0.0%) | 116 (17.3%) |
| 1 Vehicle | 140 (17.4%) | 337 (50.3%) |
| 2 Vehicles | 453 (56.4%) | 132 (19.7%) |
| 3 or more Vehicles | 210 (26.2%) | 85 (12.7%) |
| Total | 803 (100.0%) | 670 (100.0%) |
Real Estate & Mortgages in Berwyn
Real Estate and Mortgage Overview in Berwyn
| Characteristic | Without Mortgage | With Mortgage |
| Housing Units | 214 | 589 |
| Median Property Value | $667,900 | $650,300 |
| Median Household Income | $155,147 | $409 |
| Monthly Housing Costs | $1,286 | $352 |
| Real Estate Taxes | $8,171 | $0 |
Property Value by Mortgage Status in Berwyn
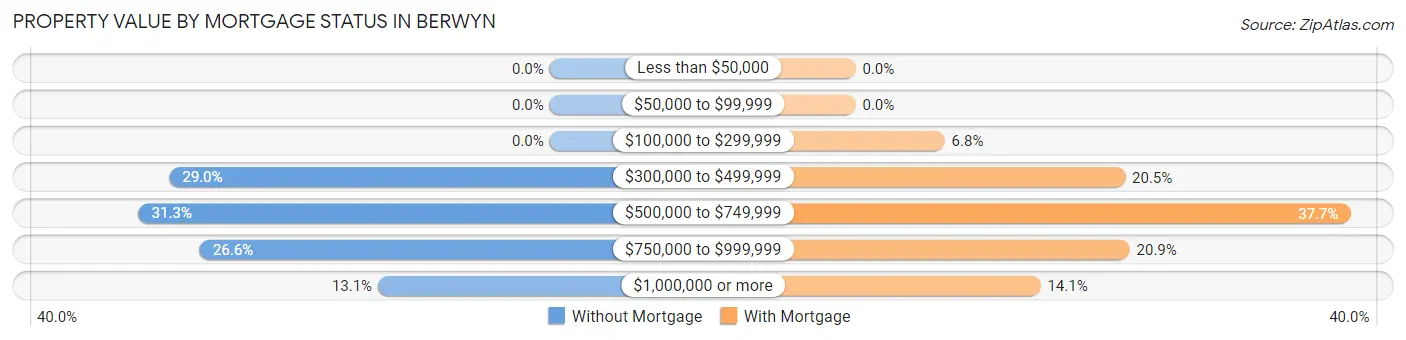
| Property Value | Without Mortgage | With Mortgage |
| Less than $50,000 | 0 (0.0%) | 0 (0.0%) |
| $50,000 to $99,999 | 0 (0.0%) | 0 (0.0%) |
| $100,000 to $299,999 | 0 (0.0%) | 40 (6.8%) |
| $300,000 to $499,999 | 62 (29.0%) | 121 (20.5%) |
| $500,000 to $749,999 | 67 (31.3%) | 222 (37.7%) |
| $750,000 to $999,999 | 57 (26.6%) | 123 (20.9%) |
| $1,000,000 or more | 28 (13.1%) | 83 (14.1%) |
| Total | 214 (100.0%) | 589 (100.0%) |
Household Income by Mortgage Status in Berwyn
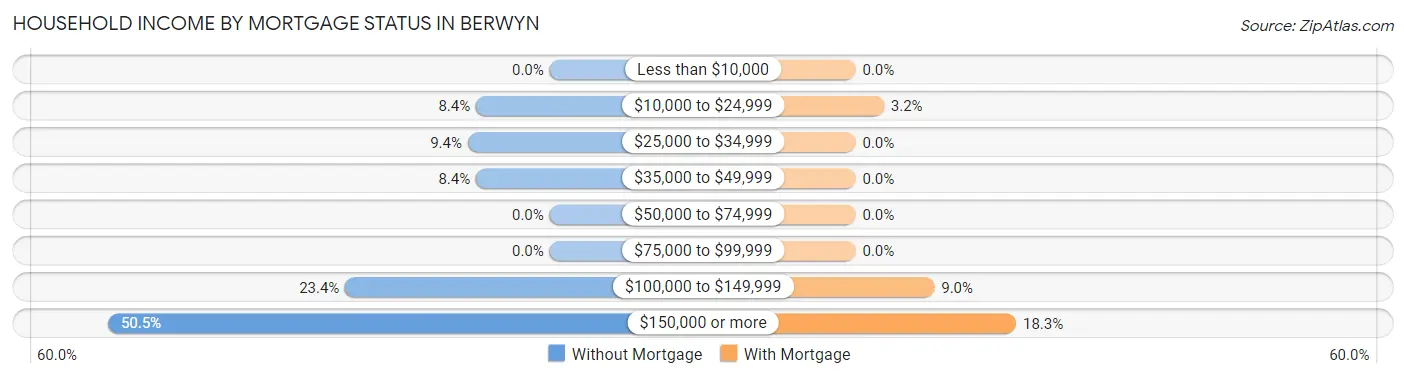
| Household Income | Without Mortgage | With Mortgage |
| Less than $10,000 | 0 (0.0%) | 0 (0.0%) |
| $10,000 to $24,999 | 18 (8.4%) | 19 (3.2%) |
| $25,000 to $34,999 | 20 (9.3%) | 0 (0.0%) |
| $35,000 to $49,999 | 18 (8.4%) | 0 (0.0%) |
| $50,000 to $74,999 | 0 (0.0%) | 0 (0.0%) |
| $75,000 to $99,999 | 0 (0.0%) | 0 (0.0%) |
| $100,000 to $149,999 | 50 (23.4%) | 53 (9.0%) |
| $150,000 or more | 108 (50.5%) | 108 (18.3%) |
| Total | 214 (100.0%) | 589 (100.0%) |
Property Value to Household Income Ratio in Berwyn
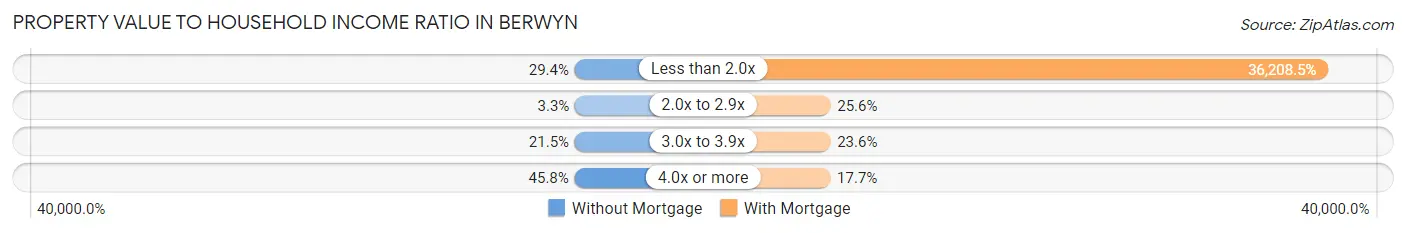
| Value-to-Income Ratio | Without Mortgage | With Mortgage |
| Less than 2.0x | 63 (29.4%) | 213,268 (36,208.5%) |
| 2.0x to 2.9x | 7 (3.3%) | 151 (25.6%) |
| 3.0x to 3.9x | 46 (21.5%) | 139 (23.6%) |
| 4.0x or more | 98 (45.8%) | 104 (17.7%) |
| Total | 214 (100.0%) | 589 (100.0%) |
Real Estate Taxes by Mortgage Status in Berwyn

| Property Taxes | Without Mortgage | With Mortgage |
| Less than $800 | 0 (0.0%) | 0 (0.0%) |
| $800 to $1,499 | 0 (0.0%) | 40 (6.8%) |
| $800 to $1,499 | 214 (100.0%) | 0 (0.0%) |
| Total | 214 (100.0%) | 589 (100.0%) |
Health & Disability in Berwyn
Health Insurance Coverage by Age in Berwyn
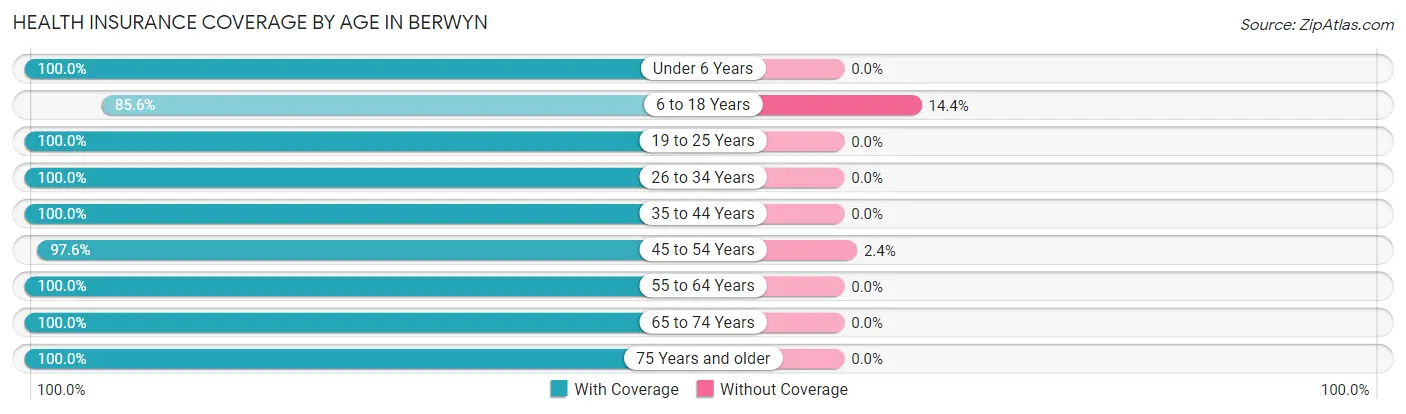
| Age Bracket | With Coverage | Without Coverage |
| Under 6 Years | 142 (100.0%) | 0 (0.0%) |
| 6 to 18 Years | 742 (85.6%) | 125 (14.4%) |
| 19 to 25 Years | 358 (100.0%) | 0 (0.0%) |
| 26 to 34 Years | 361 (100.0%) | 0 (0.0%) |
| 35 to 44 Years | 365 (100.0%) | 0 (0.0%) |
| 45 to 54 Years | 538 (97.6%) | 13 (2.4%) |
| 55 to 64 Years | 339 (100.0%) | 0 (0.0%) |
| 65 to 74 Years | 227 (100.0%) | 0 (0.0%) |
| 75 Years and older | 478 (100.0%) | 0 (0.0%) |
| Total | 3,550 (96.3%) | 138 (3.7%) |
Health Insurance Coverage by Citizenship Status in Berwyn
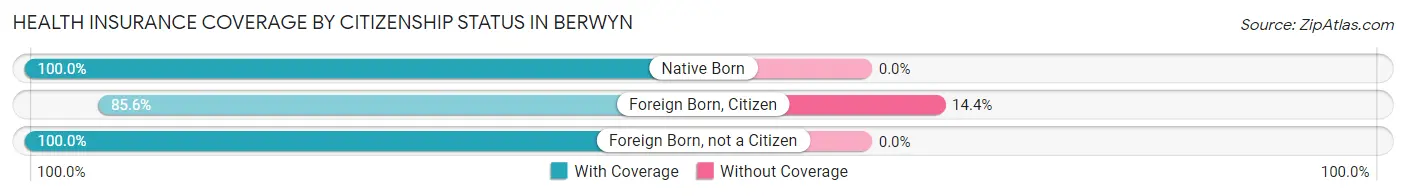
| Citizenship Status | With Coverage | Without Coverage |
| Native Born | 142 (100.0%) | 0 (0.0%) |
| Foreign Born, Citizen | 742 (85.6%) | 125 (14.4%) |
| Foreign Born, not a Citizen | 358 (100.0%) | 0 (0.0%) |
Health Insurance Coverage by Household Income in Berwyn
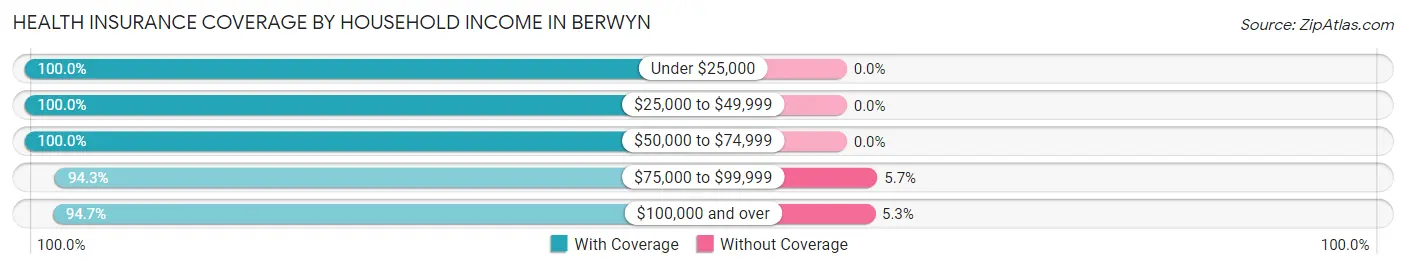
| Household Income | With Coverage | Without Coverage |
| Under $25,000 | 636 (100.0%) | 0 (0.0%) |
| $25,000 to $49,999 | 150 (100.0%) | 0 (0.0%) |
| $50,000 to $74,999 | 284 (100.0%) | 0 (0.0%) |
| $75,000 to $99,999 | 214 (94.3%) | 13 (5.7%) |
| $100,000 and over | 2,236 (94.7%) | 125 (5.3%) |
Public vs Private Health Insurance Coverage by Age in Berwyn
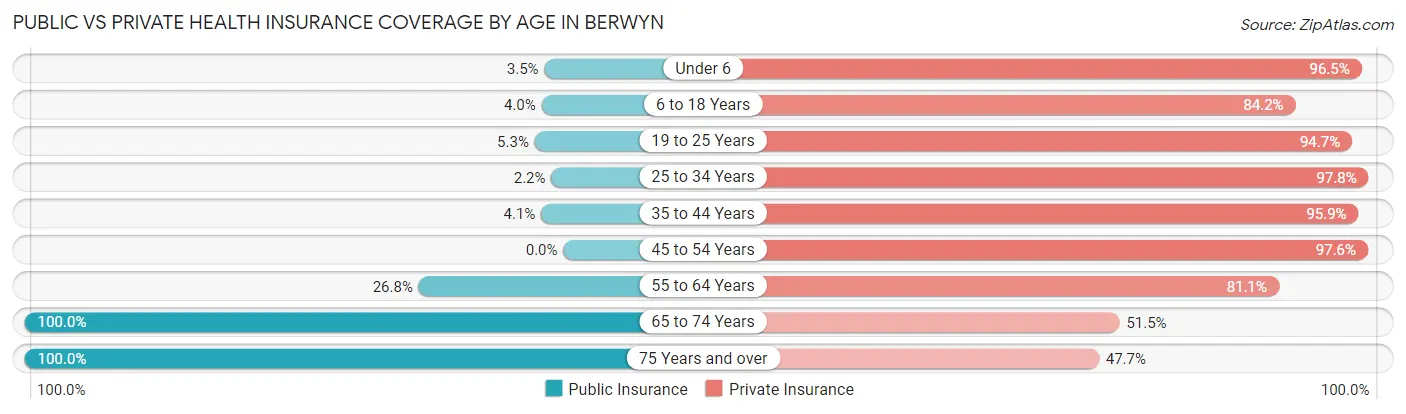
| Age Bracket | Public Insurance | Private Insurance |
| Under 6 | 5 (3.5%) | 137 (96.5%) |
| 6 to 18 Years | 35 (4.0%) | 730 (84.2%) |
| 19 to 25 Years | 19 (5.3%) | 339 (94.7%) |
| 25 to 34 Years | 8 (2.2%) | 353 (97.8%) |
| 35 to 44 Years | 15 (4.1%) | 350 (95.9%) |
| 45 to 54 Years | 0 (0.0%) | 538 (97.6%) |
| 55 to 64 Years | 91 (26.8%) | 275 (81.1%) |
| 65 to 74 Years | 227 (100.0%) | 117 (51.5%) |
| 75 Years and over | 478 (100.0%) | 228 (47.7%) |
| Total | 878 (23.8%) | 3,067 (83.2%) |
Disability Status by Sex by Age in Berwyn
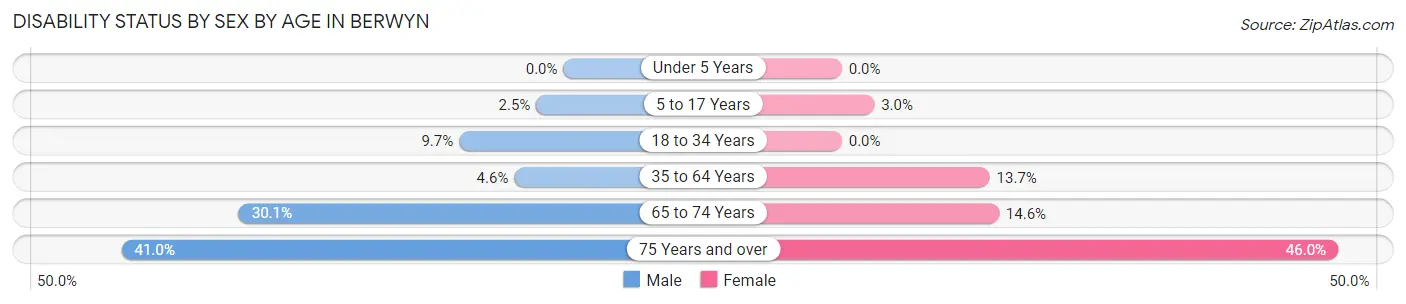
| Age Bracket | Male | Female |
| Under 5 Years | 0 (0.0%) | 0 (0.0%) |
| 5 to 17 Years | 10 (2.5%) | 14 (3.0%) |
| 18 to 34 Years | 27 (9.7%) | 0 (0.0%) |
| 35 to 64 Years | 26 (4.6%) | 94 (13.7%) |
| 65 to 74 Years | 25 (30.1%) | 21 (14.6%) |
| 75 Years and over | 82 (41.0%) | 128 (46.0%) |
Disability Class by Sex by Age in Berwyn
Disability Class: Hearing Difficulty
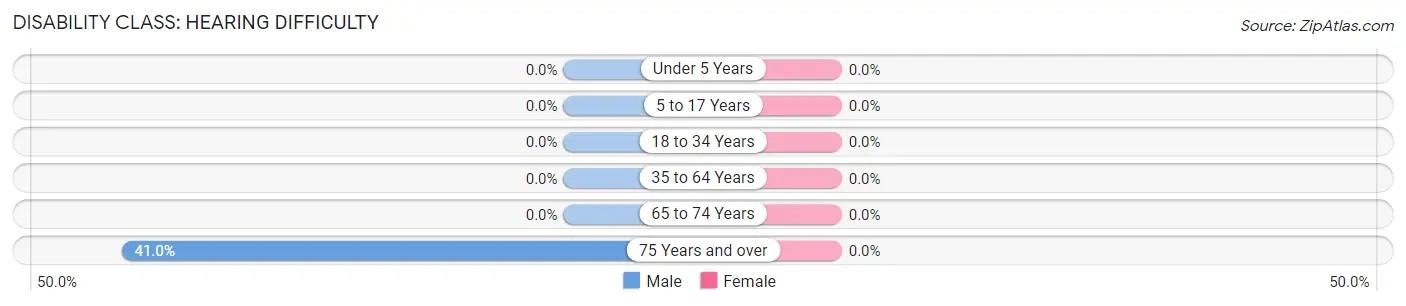
| Age Bracket | Male | Female |
| Under 5 Years | 0 (0.0%) | 0 (0.0%) |
| 5 to 17 Years | 0 (0.0%) | 0 (0.0%) |
| 18 to 34 Years | 0 (0.0%) | 0 (0.0%) |
| 35 to 64 Years | 0 (0.0%) | 0 (0.0%) |
| 65 to 74 Years | 0 (0.0%) | 0 (0.0%) |
| 75 Years and over | 82 (41.0%) | 0 (0.0%) |
Disability Class: Vision Difficulty
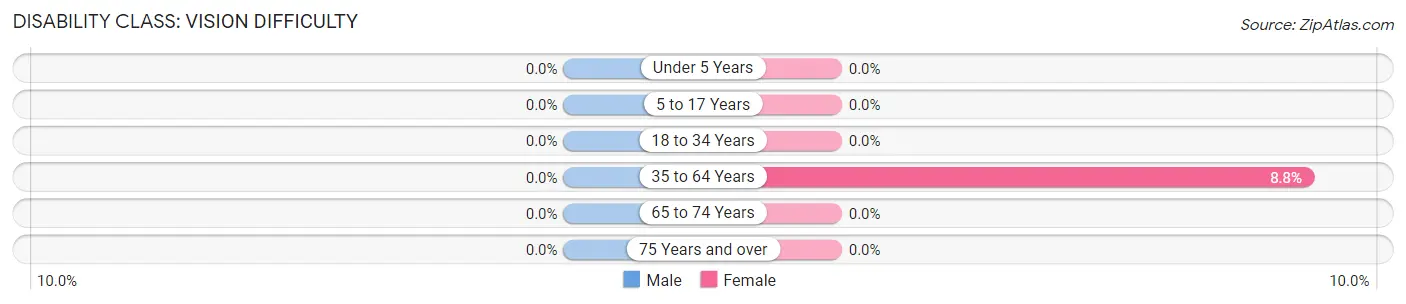
| Age Bracket | Male | Female |
| Under 5 Years | 0 (0.0%) | 0 (0.0%) |
| 5 to 17 Years | 0 (0.0%) | 0 (0.0%) |
| 18 to 34 Years | 0 (0.0%) | 0 (0.0%) |
| 35 to 64 Years | 0 (0.0%) | 60 (8.8%) |
| 65 to 74 Years | 0 (0.0%) | 0 (0.0%) |
| 75 Years and over | 0 (0.0%) | 0 (0.0%) |
Disability Class: Cognitive Difficulty
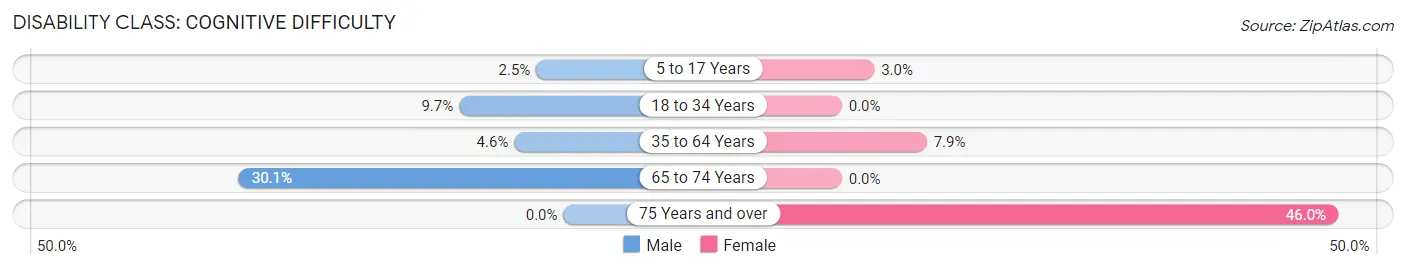
| Age Bracket | Male | Female |
| 5 to 17 Years | 10 (2.5%) | 14 (3.0%) |
| 18 to 34 Years | 27 (9.7%) | 0 (0.0%) |
| 35 to 64 Years | 26 (4.6%) | 54 (7.9%) |
| 65 to 74 Years | 25 (30.1%) | 0 (0.0%) |
| 75 Years and over | 0 (0.0%) | 128 (46.0%) |
Disability Class: Ambulatory Difficulty
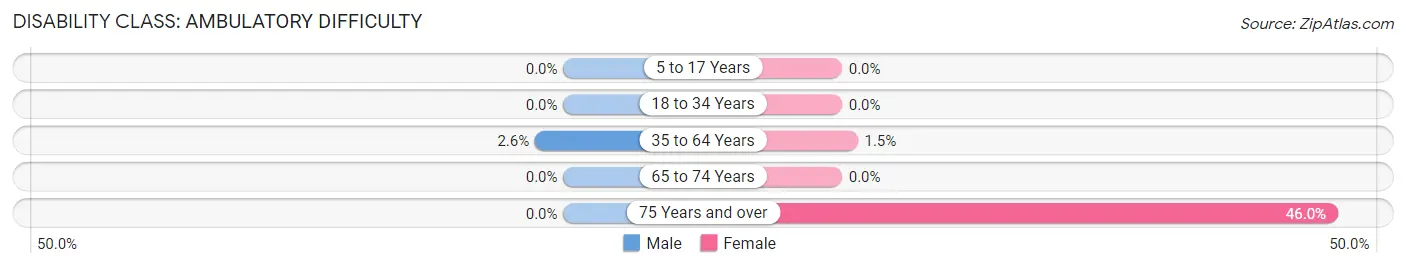
| Age Bracket | Male | Female |
| 5 to 17 Years | 0 (0.0%) | 0 (0.0%) |
| 18 to 34 Years | 0 (0.0%) | 0 (0.0%) |
| 35 to 64 Years | 15 (2.6%) | 10 (1.5%) |
| 65 to 74 Years | 0 (0.0%) | 0 (0.0%) |
| 75 Years and over | 0 (0.0%) | 128 (46.0%) |
Disability Class: Self-Care Difficulty
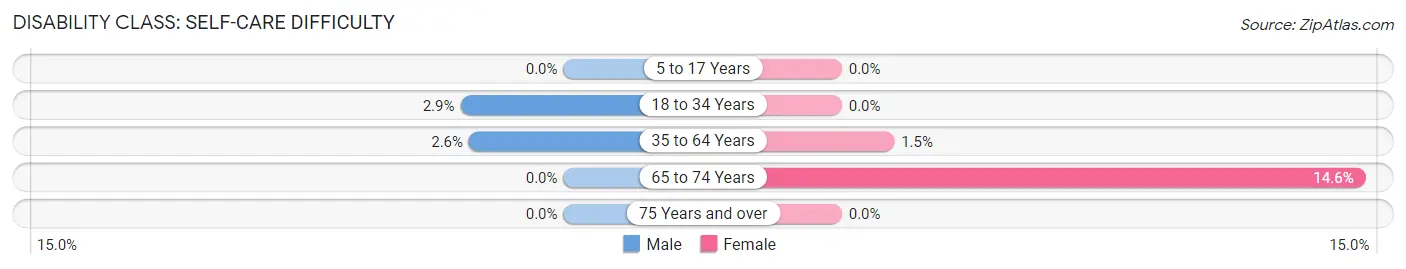
| Age Bracket | Male | Female |
| 5 to 17 Years | 0 (0.0%) | 0 (0.0%) |
| 18 to 34 Years | 8 (2.9%) | 0 (0.0%) |
| 35 to 64 Years | 15 (2.6%) | 10 (1.5%) |
| 65 to 74 Years | 0 (0.0%) | 21 (14.6%) |
| 75 Years and over | 0 (0.0%) | 0 (0.0%) |
Technology Access in Berwyn
Computing Device Access in Berwyn
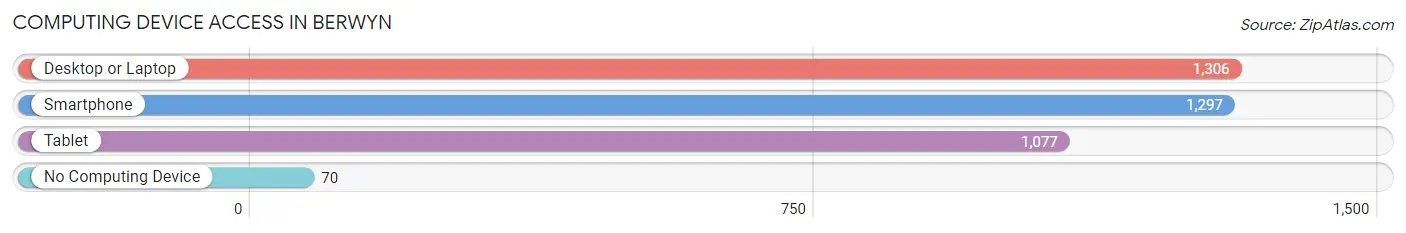
| Device Type | # Households | % Households |
| Desktop or Laptop | 1,306 | 88.7% |
| Smartphone | 1,297 | 88.0% |
| Tablet | 1,077 | 73.1% |
| No Computing Device | 70 | 4.8% |
| Total | 1,473 | 100.0% |
Internet Access in Berwyn
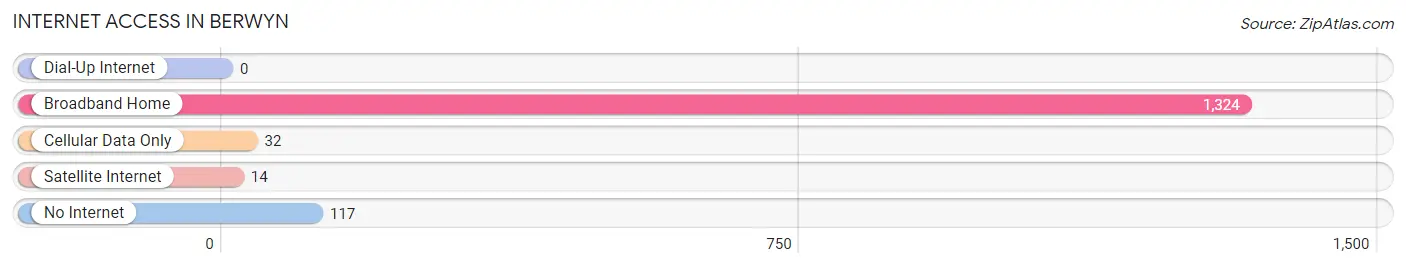
| Internet Type | # Households | % Households |
| Dial-Up Internet | 0 | 0.0% |
| Broadband Home | 1,324 | 89.9% |
| Cellular Data Only | 32 | 2.2% |
| Satellite Internet | 14 | 0.9% |
| No Internet | 117 | 7.9% |
| Total | 1,473 | 100.0% |
Berwyn Summary
Berwyn, Pennsylvania is a small borough located in Chester County, Pennsylvania. It is situated in the southeastern corner of the county, approximately 20 miles west of Philadelphia. The population of Berwyn was 3,631 at the 2010 census.
History
Berwyn was founded in 1877 by a group of Welsh immigrants who had recently arrived in the United States. The town was named after the Welsh town of Berwyn, which is located in the county of Denbighshire. The immigrants were attracted to the area due to its proximity to Philadelphia and its abundance of natural resources. The town was officially incorporated in 1883.
In the early 20th century, Berwyn was a thriving agricultural community. The town was home to several farms, as well as a number of small businesses. The town also had a train station, which allowed for easy access to Philadelphia.
In the 1950s, Berwyn began to experience a period of growth and development. The town was home to several new businesses, including a shopping center and a movie theater. The town also saw an influx of new residents, as many people moved to the area from Philadelphia.
Geography
Berwyn is located in southeastern Chester County, Pennsylvania. It is situated in the Brandywine Valley, which is a region of rolling hills and valleys. The town is bordered by Easttown Township to the north, Tredyffrin Township to the east, East Goshen Township to the south, and Westtown Township to the west.
The town is located approximately 20 miles west of Philadelphia. It is also located near several major highways, including the Pennsylvania Turnpike, Interstate 76, and US Route 202.
Economy
Berwyn is a small, rural community with a limited economy. The town is home to several small businesses, including a grocery store, a hardware store, and a few restaurants. The town also has a few small manufacturing companies.
The town is also home to several large employers, including the Berwyn Business Park, which is home to several corporate offices. The town is also home to the Berwyn Fire Company, which provides fire protection services to the area.
Demographics
As of the 2010 census, the population of Berwyn was 3,631. The racial makeup of the town was 94.3% White, 2.2% African American, 0.3% Native American, 0.9% Asian, 0.1% Pacific Islander, 0.7% from other races, and 1.5% from two or more races. Hispanic or Latino of any race were 2.2% of the population.
The median household income in Berwyn was $68,958, and the median family income was $77,917. The per capita income for the town was $31,945. About 4.3% of families and 5.7% of the population were below the poverty line, including 6.3% of those under age 18 and 4.2% of those age 65 or over.
Common Questions
What is Per Capita Income in Berwyn?
Per Capita income in Berwyn is $60,913.
What is the Median Family Income in Berwyn?
Median Family Income in Berwyn is $152,222.
What is the Median Household income in Berwyn?
Median Household Income in Berwyn is $102,101.
What is Income or Wage Gap in Berwyn?
Income or Wage Gap in Berwyn is 40.6%.
Women in Berwyn earn 59.4 cents for every dollar earned by a man.
What is Inequality or Gini Index in Berwyn?
Inequality or Gini Index in Berwyn is 0.51.
What is the Total Population of Berwyn?
Total Population of Berwyn is 3,700.
What is the Total Male Population of Berwyn?
Total Male Population of Berwyn is 1,621.
What is the Total Female Population of Berwyn?
Total Female Population of Berwyn is 2,079.
What is the Ratio of Males per 100 Females in Berwyn?
There are 77.97 Males per 100 Females in Berwyn.
What is the Ratio of Females per 100 Males in Berwyn?
There are 128.25 Females per 100 Males in Berwyn.
What is the Median Population Age in Berwyn?
Median Population Age in Berwyn is 40.7 Years.
What is the Average Family Size in Berwyn
Average Family Size in Berwyn is 2.9 People.
What is the Average Household Size in Berwyn
Average Household Size in Berwyn is 2.5 People.
How Large is the Labor Force in Berwyn?
There are 1,692 People in the Labor Forcein in Berwyn.
What is the Percentage of People in the Labor Force in Berwyn?
59.9% of People are in the Labor Force in Berwyn.
What is the Unemployment Rate in Berwyn?
Unemployment Rate in Berwyn is 5.1%.