Faxon, PA Map & Demographics
Faxon Map
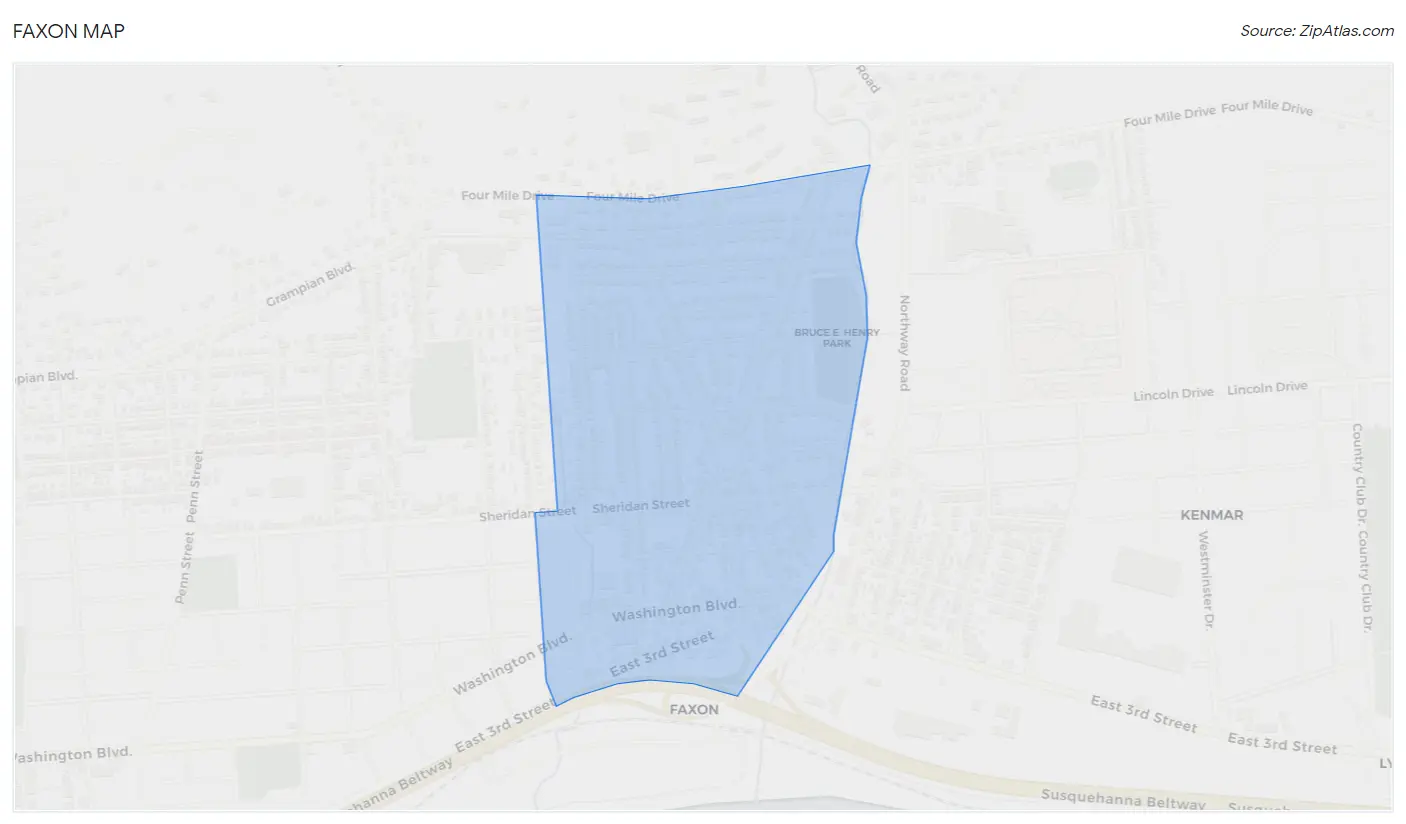
Faxon Overview
$33,412
PER CAPITA INCOME
$81,081
AVG FAMILY INCOME
$80,148
AVG HOUSEHOLD INCOME
38.0%
WAGE / INCOME GAP [ % ]
62.0¢/ $1
WAGE / INCOME GAP [ $ ]
0.32
INEQUALITY / GINI INDEX
1,101
TOTAL POPULATION
475
MALE POPULATION
626
FEMALE POPULATION
75.88
MALES / 100 FEMALES
131.79
FEMALES / 100 MALES
41.3
MEDIAN AGE
2.5
AVG FAMILY SIZE
2.3
AVG HOUSEHOLD SIZE
487
LABOR FORCE [ PEOPLE ]
58.5%
PERCENT IN LABOR FORCE
Income in Faxon
Income Overview in Faxon
Per Capita Income in Faxon is $33,412, while median incomes of families and households are $81,081 and $80,148 respectively.
| Characteristic | Number | Measure |
| Per Capita Income | 1,101 | $33,412 |
| Median Family Income | 375 | $81,081 |
| Mean Family Income | 375 | $82,458 |
| Median Household Income | 479 | $80,148 |
| Mean Household Income | 479 | $78,167 |
| Income Deficit | 375 | $0 |
| Wage / Income Gap (%) | 1,101 | 37.95% |
| Wage / Income Gap ($) | 1,101 | 62.05¢ per $1 |
| Gini / Inequality Index | 1,101 | 0.32 |
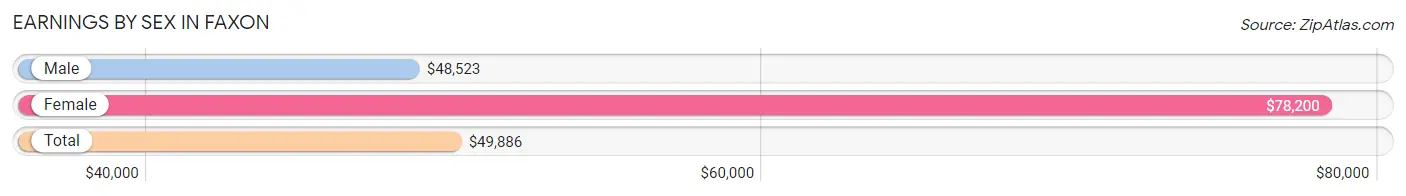
Earnings by Sex in Faxon
Average Earnings in Faxon are $49,886, $48,523 for men and $78,200 for women, a difference of 38.0%.
| Sex | Number | Average Earnings |
| Male | 203 (41.7%) | $48,523 |
| Female | 284 (58.3%) | $78,200 |
| Total | 487 (100.0%) | $49,886 |
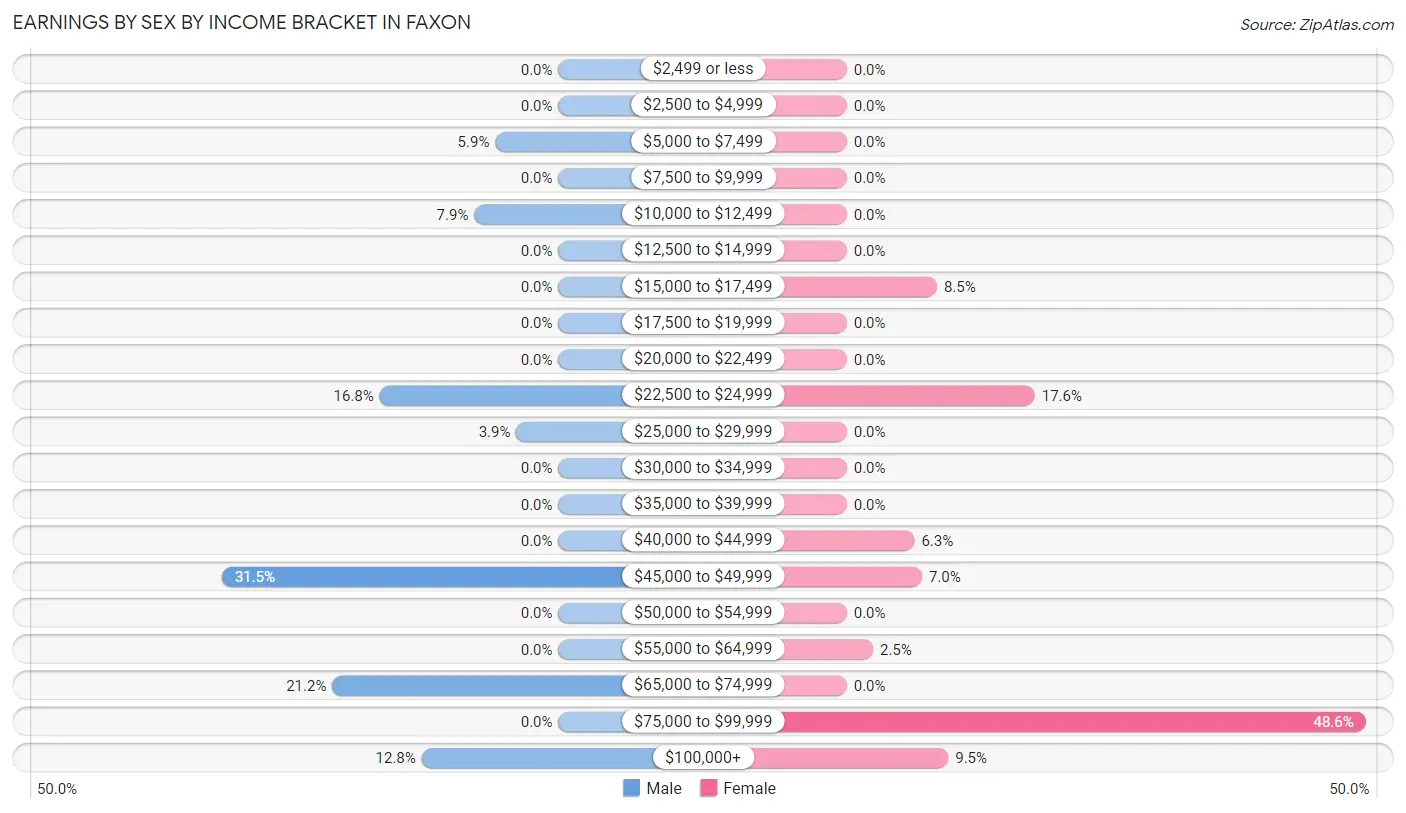
Earnings by Sex by Income Bracket in Faxon
The most common earnings brackets in Faxon are $45,000 to $49,999 for men (64 | 31.5%) and $75,000 to $99,999 for women (138 | 48.6%).
| Income | Male | Female |
| $2,499 or less | 0 (0.0%) | 0 (0.0%) |
| $2,500 to $4,999 | 0 (0.0%) | 0 (0.0%) |
| $5,000 to $7,499 | 12 (5.9%) | 0 (0.0%) |
| $7,500 to $9,999 | 0 (0.0%) | 0 (0.0%) |
| $10,000 to $12,499 | 16 (7.9%) | 0 (0.0%) |
| $12,500 to $14,999 | 0 (0.0%) | 0 (0.0%) |
| $15,000 to $17,499 | 0 (0.0%) | 24 (8.5%) |
| $17,500 to $19,999 | 0 (0.0%) | 0 (0.0%) |
| $20,000 to $22,499 | 0 (0.0%) | 0 (0.0%) |
| $22,500 to $24,999 | 34 (16.8%) | 50 (17.6%) |
| $25,000 to $29,999 | 8 (3.9%) | 0 (0.0%) |
| $30,000 to $34,999 | 0 (0.0%) | 0 (0.0%) |
| $35,000 to $39,999 | 0 (0.0%) | 0 (0.0%) |
| $40,000 to $44,999 | 0 (0.0%) | 18 (6.3%) |
| $45,000 to $49,999 | 64 (31.5%) | 20 (7.0%) |
| $50,000 to $54,999 | 0 (0.0%) | 0 (0.0%) |
| $55,000 to $64,999 | 0 (0.0%) | 7 (2.5%) |
| $65,000 to $74,999 | 43 (21.2%) | 0 (0.0%) |
| $75,000 to $99,999 | 0 (0.0%) | 138 (48.6%) |
| $100,000+ | 26 (12.8%) | 27 (9.5%) |
| Total | 203 (100.0%) | 284 (100.0%) |
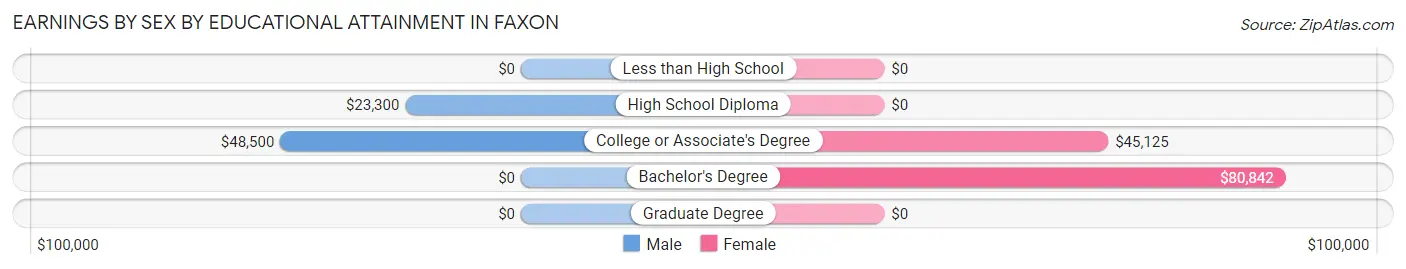
Earnings by Sex by Educational Attainment in Faxon
Average earnings in Faxon are $49,000 for men and $78,200 for women, a difference of 37.3%. Men with an educational attainment of college or associate's degree enjoy the highest average annual earnings of $48,500, while those with high school diploma education earn the least with $23,300. Women with an educational attainment of bachelor's degree earn the most with the average annual earnings of $80,842, while those with college or associate's degree education have the smallest earnings of $45,125.
| Educational Attainment | Male Income | Female Income |
| Less than High School | - | - |
| High School Diploma | $23,300 | $0 |
| College or Associate's Degree | $48,500 | $45,125 |
| Bachelor's Degree | - | - |
| Graduate Degree | - | - |
| Total | $49,000 | $78,200 |
Family Income in Faxon
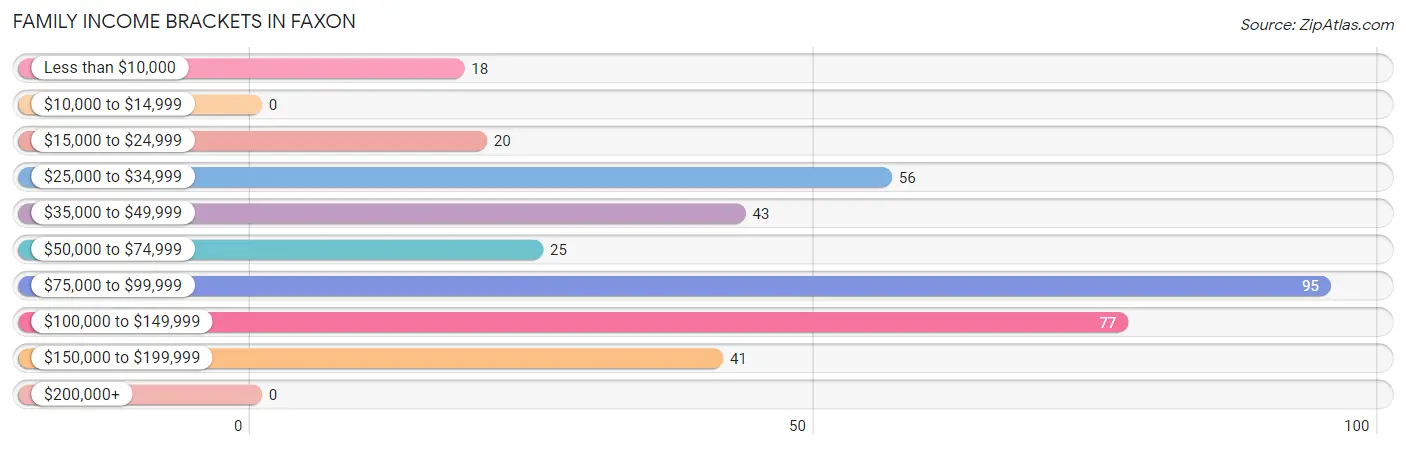
Family Income Brackets in Faxon
According to the Faxon family income data, there are 95 families falling into the $75,000 to $99,999 income range, which is the most common income bracket and makes up 25.3% of all families.
| Income Bracket | # Families | % Families |
| Less than $10,000 | 18 | 4.8% |
| $10,000 to $14,999 | 0 | 0.0% |
| $15,000 to $24,999 | 20 | 5.3% |
| $25,000 to $34,999 | 56 | 14.9% |
| $35,000 to $49,999 | 43 | 11.5% |
| $50,000 to $74,999 | 25 | 6.7% |
| $75,000 to $99,999 | 95 | 25.3% |
| $100,000 to $149,999 | 77 | 20.5% |
| $150,000 to $199,999 | 41 | 10.9% |
| $200,000+ | 0 | 0.0% |
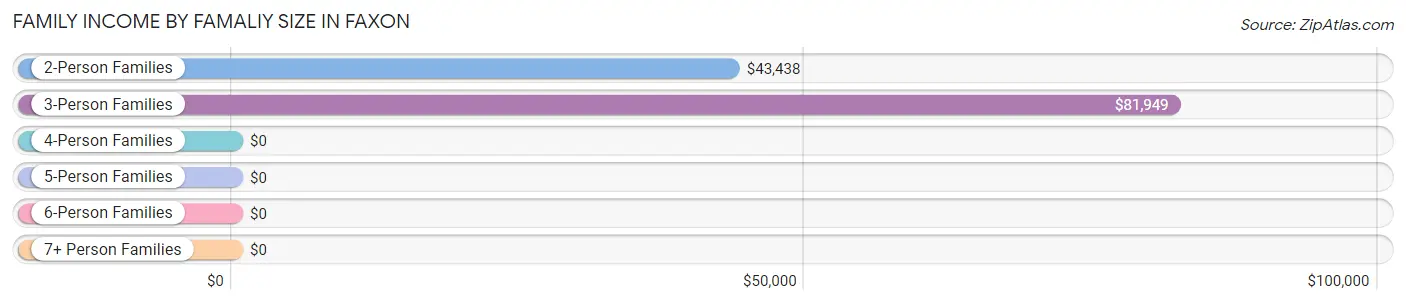
Family Income by Famaliy Size in Faxon
3-person families (142 | 37.9%) account for the highest median family income in Faxon with $81,949 per family, while 3-person families (142 | 37.9%) have the highest median income of $27,316 per family member.
| Income Bracket | # Families | Median Income |
| 2-Person Families | 197 (52.5%) | $43,438 |
| 3-Person Families | 142 (37.9%) | $81,949 |
| 4-Person Families | 0 (0.0%) | $0 |
| 5-Person Families | 36 (9.6%) | $0 |
| 6-Person Families | 0 (0.0%) | $0 |
| 7+ Person Families | 0 (0.0%) | $0 |
| Total | 375 (100.0%) | $81,081 |
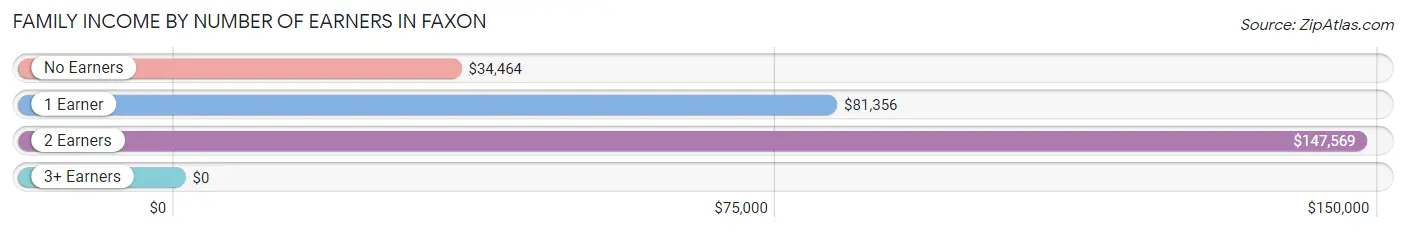
Family Income by Number of Earners in Faxon
| Number of Earners | # Families | Median Income |
| No Earners | 124 (33.1%) | $34,464 |
| 1 Earner | 104 (27.7%) | $81,356 |
| 2 Earners | 124 (33.1%) | $147,569 |
| 3+ Earners | 23 (6.1%) | $0 |
| Total | 375 (100.0%) | $81,081 |
Household Income in Faxon
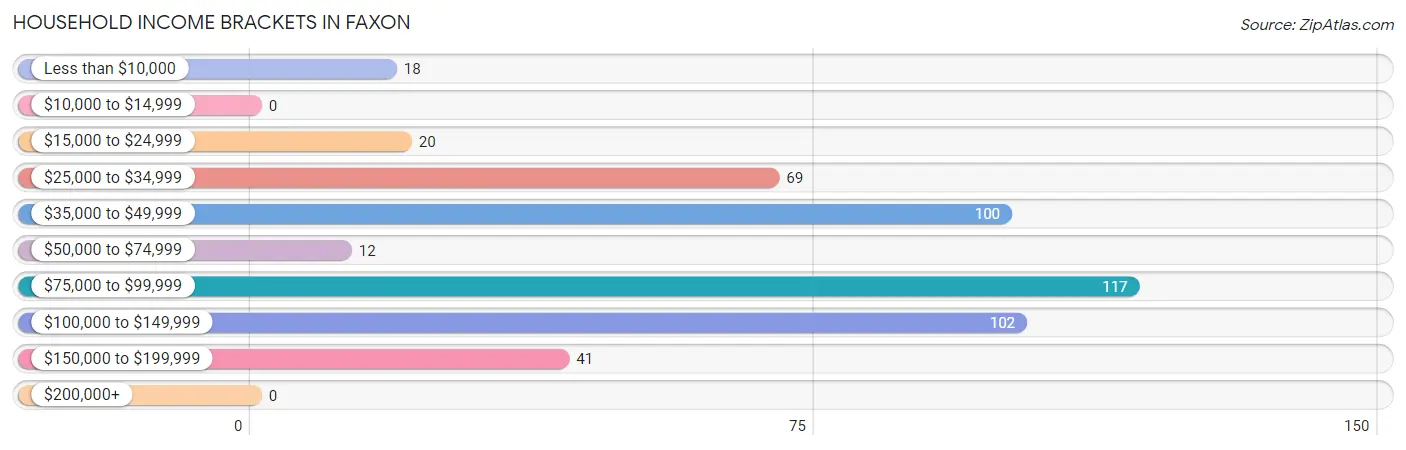
Household Income Brackets in Faxon
With 117 households falling in the category, the $75,000 to $99,999 income range is the most frequent in Faxon, accounting for 24.4% of all households.
| Income Bracket | # Households | % Households |
| Less than $10,000 | 18 | 3.8% |
| $10,000 to $14,999 | 0 | 0.0% |
| $15,000 to $24,999 | 20 | 4.2% |
| $25,000 to $34,999 | 69 | 14.4% |
| $35,000 to $49,999 | 100 | 20.9% |
| $50,000 to $74,999 | 12 | 2.5% |
| $75,000 to $99,999 | 117 | 24.4% |
| $100,000 to $149,999 | 102 | 21.3% |
| $150,000 to $199,999 | 41 | 8.6% |
| $200,000+ | 0 | 0.0% |
Household Income by Householder Age in Faxon
The median household income in Faxon is $80,148, with the highest median household income of $102,700 found in the 25 to 44 years age bracket for the primary householder. A total of 172 households (35.9%) fall into this category.
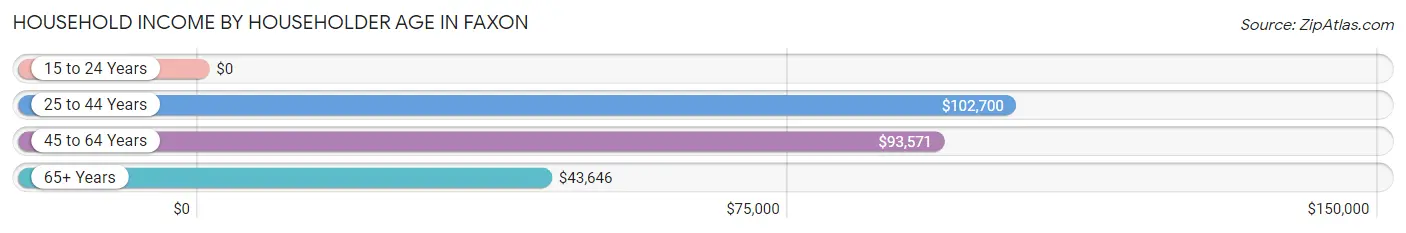
| Income Bracket | # Households | Median Income |
| 15 to 24 Years | 0 (0.0%) | $0 |
| 25 to 44 Years | 172 (35.9%) | $102,700 |
| 45 to 64 Years | 94 (19.6%) | $93,571 |
| 65+ Years | 213 (44.5%) | $43,646 |
| Total | 479 (100.0%) | $80,148 |
Poverty in Faxon
Income Below Poverty by Sex and Age in Faxon
With 2.3% poverty level for males and 3.0% for females among the residents of Faxon, 75 year old and over males and 65 to 74 year old females are the most vulnerable to poverty, with 9 males (9.8%) and 18 females (36.7%) in their respective age groups living below the poverty level.
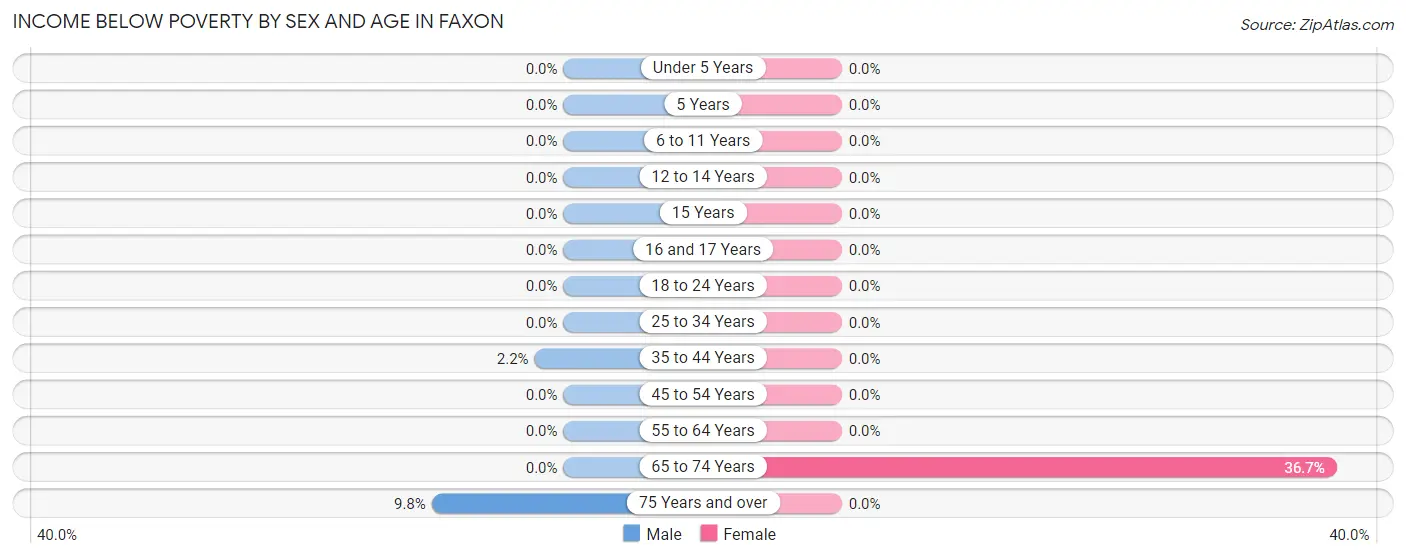
| Age Bracket | Male | Female |
| Under 5 Years | 0 (0.0%) | 0 (0.0%) |
| 5 Years | 0 (0.0%) | 0 (0.0%) |
| 6 to 11 Years | 0 (0.0%) | 0 (0.0%) |
| 12 to 14 Years | 0 (0.0%) | 0 (0.0%) |
| 15 Years | 0 (0.0%) | 0 (0.0%) |
| 16 and 17 Years | 0 (0.0%) | 0 (0.0%) |
| 18 to 24 Years | 0 (0.0%) | 0 (0.0%) |
| 25 to 34 Years | 0 (0.0%) | 0 (0.0%) |
| 35 to 44 Years | 2 (2.1%) | 0 (0.0%) |
| 45 to 54 Years | 0 (0.0%) | 0 (0.0%) |
| 55 to 64 Years | 0 (0.0%) | 0 (0.0%) |
| 65 to 74 Years | 0 (0.0%) | 18 (36.7%) |
| 75 Years and over | 9 (9.8%) | 0 (0.0%) |
| Total | 11 (2.3%) | 18 (3.0%) |
Income Above Poverty by Sex and Age in Faxon
According to the poverty statistics in Faxon, males aged 6 to 11 years and females aged under 5 years are the age groups that are most secure financially, with 100.0% of males and 100.0% of females in these age groups living above the poverty line.
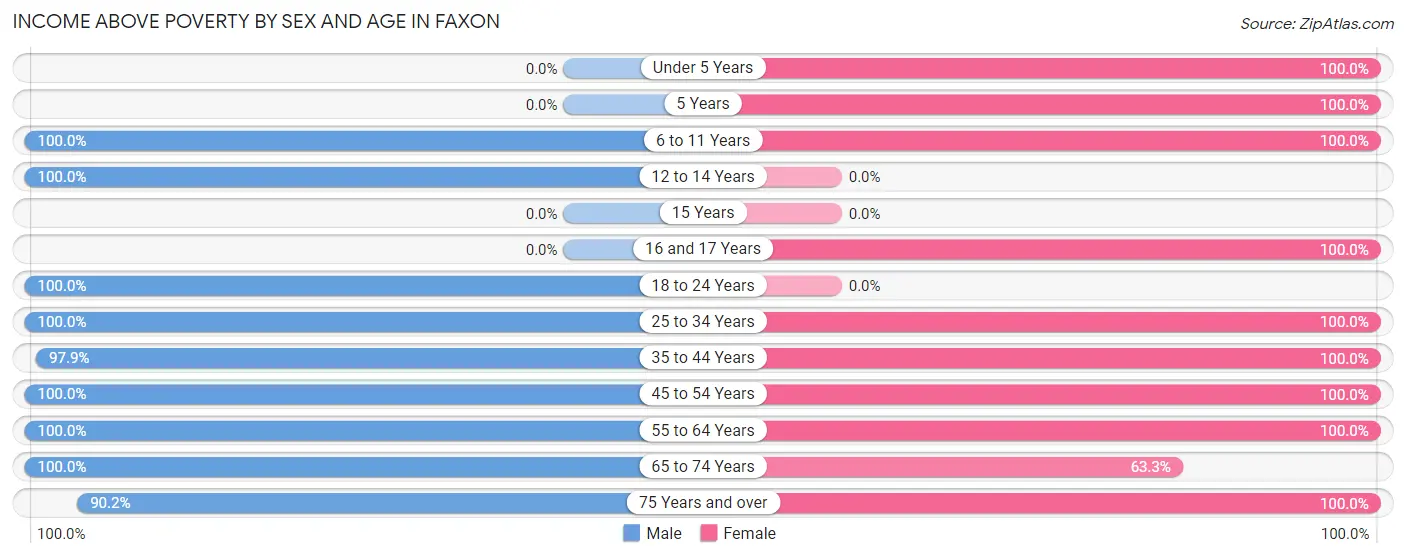
| Age Bracket | Male | Female |
| Under 5 Years | 0 (0.0%) | 27 (100.0%) |
| 5 Years | 0 (0.0%) | 53 (100.0%) |
| 6 to 11 Years | 70 (100.0%) | 36 (100.0%) |
| 12 to 14 Years | 66 (100.0%) | 0 (0.0%) |
| 15 Years | 0 (0.0%) | 0 (0.0%) |
| 16 and 17 Years | 0 (0.0%) | 24 (100.0%) |
| 18 to 24 Years | 21 (100.0%) | 0 (0.0%) |
| 25 to 34 Years | 35 (100.0%) | 54 (100.0%) |
| 35 to 44 Years | 91 (97.9%) | 144 (100.0%) |
| 45 to 54 Years | 21 (100.0%) | 27 (100.0%) |
| 55 to 64 Years | 29 (100.0%) | 90 (100.0%) |
| 65 to 74 Years | 48 (100.0%) | 31 (63.3%) |
| 75 Years and over | 83 (90.2%) | 105 (100.0%) |
| Total | 464 (97.7%) | 591 (97.0%) |
Income Below Poverty Among Married-Couple Families in Faxon
The poverty statistics for married-couple families in Faxon show that 7.2% or 18 of the total 250 families live below the poverty line. Families with no children have the highest poverty rate of 9.6%, comprising of 18 families. On the other hand, families with 1 or 2 children have the lowest poverty rate of 0.0%, which includes 0 families.
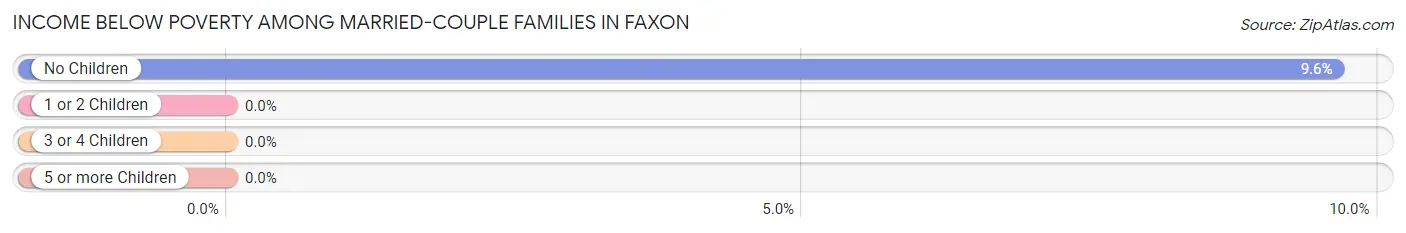
| Children | Above Poverty | Below Poverty |
| No Children | 169 (90.4%) | 18 (9.6%) |
| 1 or 2 Children | 27 (100.0%) | 0 (0.0%) |
| 3 or 4 Children | 36 (100.0%) | 0 (0.0%) |
| 5 or more Children | 0 (0.0%) | 0 (0.0%) |
| Total | 232 (92.8%) | 18 (7.2%) |
Income Below Poverty Among Single-Parent Households in Faxon
| Children | Single Father | Single Mother |
| No Children | 0 (0.0%) | 0 (0.0%) |
| 1 or 2 Children | 0 (0.0%) | 0 (0.0%) |
| 3 or 4 Children | 0 (0.0%) | 0 (0.0%) |
| 5 or more Children | 0 (0.0%) | 0 (0.0%) |
| Total | 0 (0.0%) | 0 (0.0%) |
Income Below Poverty Among Married-Couple vs Single-Parent Households in Faxon
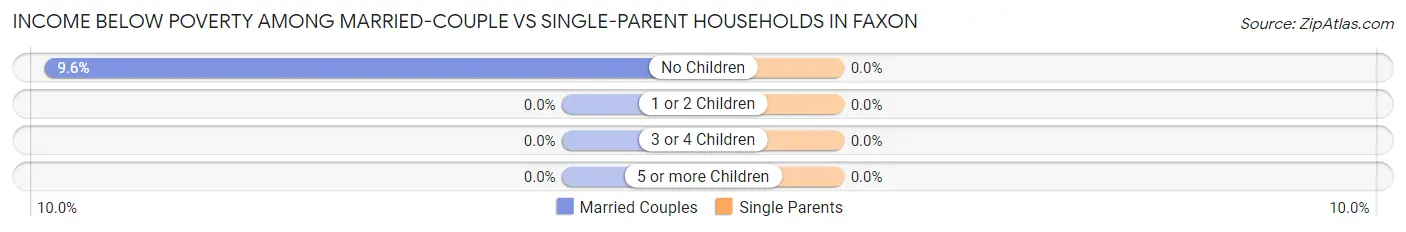
| Children | Married-Couple Families | Single-Parent Households |
| No Children | 18 (9.6%) | 0 (0.0%) |
| 1 or 2 Children | 0 (0.0%) | 0 (0.0%) |
| 3 or 4 Children | 0 (0.0%) | 0 (0.0%) |
| 5 or more Children | 0 (0.0%) | 0 (0.0%) |
| Total | 18 (7.2%) | 0 (0.0%) |
Race in Faxon
The most populous races in Faxon are White / Caucasian (982 | 89.2%), Black / African American (119 | 10.8%), and Hispanic or Latino (43 | 3.9%).
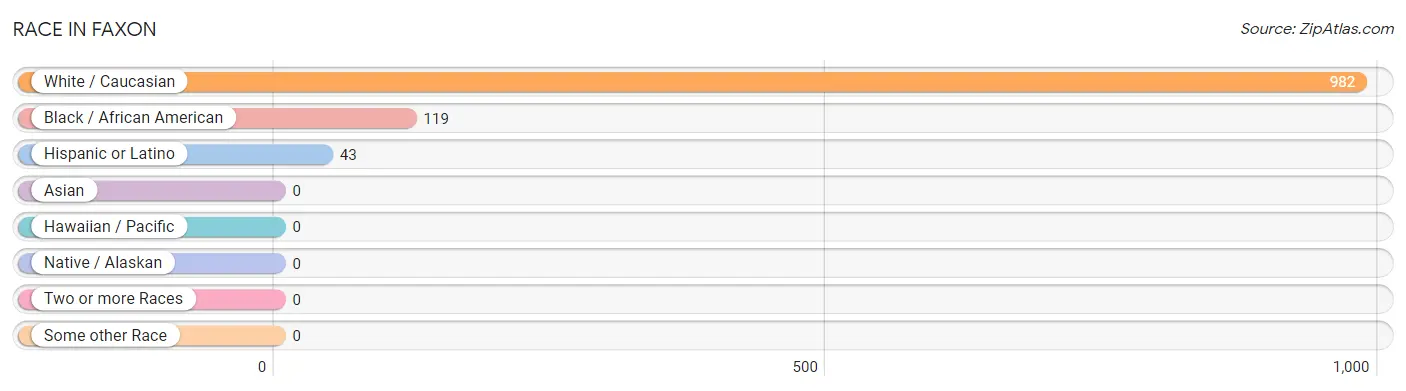
| Race | # Population | % Population |
| Asian | 0 | 0.0% |
| Black / African American | 119 | 10.8% |
| Hawaiian / Pacific | 0 | 0.0% |
| Hispanic or Latino | 43 | 3.9% |
| Native / Alaskan | 0 | 0.0% |
| White / Caucasian | 982 | 89.2% |
| Two or more Races | 0 | 0.0% |
| Some other Race | 0 | 0.0% |
| Total | 1,101 | 100.0% |
Ancestry in Faxon
The most populous ancestries reported in Faxon are German (417 | 37.9%), Irish (227 | 20.6%), English (214 | 19.4%), Polish (193 | 17.5%), and American (81 | 7.4%), together accounting for 102.8% of all Faxon residents.
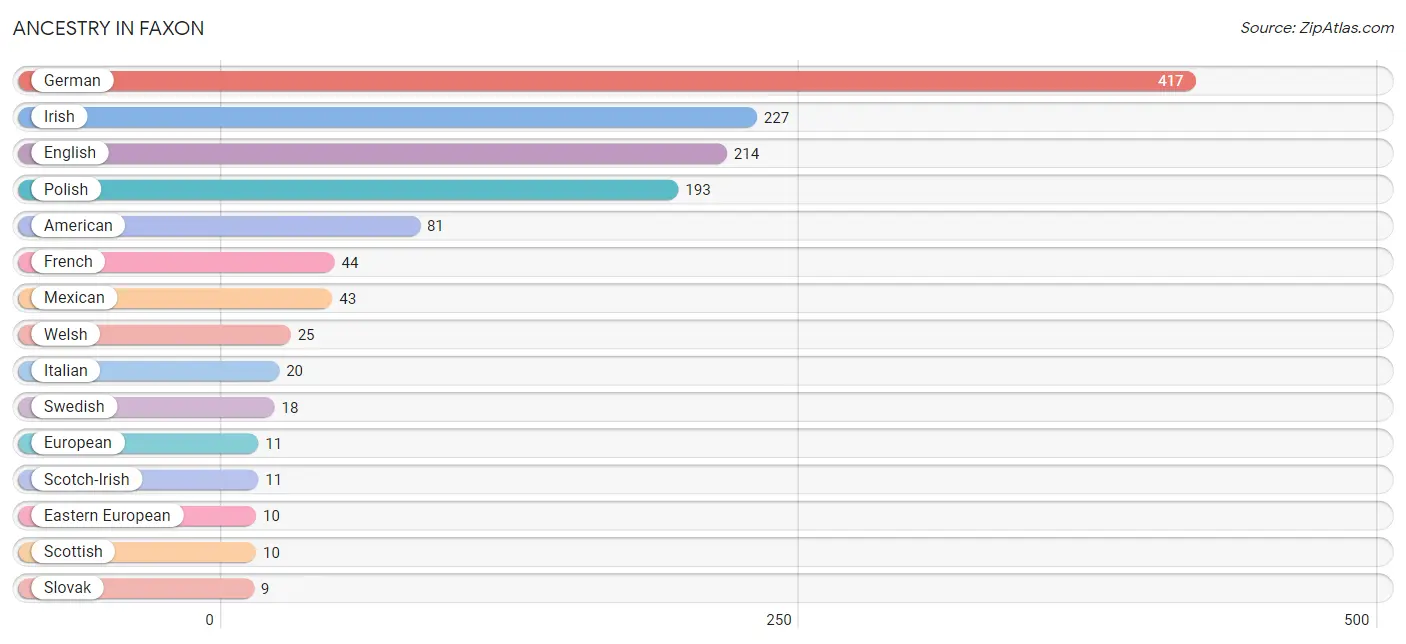
| Ancestry | # Population | % Population |
| American | 81 | 7.4% |
| Dutch | 2 | 0.2% |
| Eastern European | 10 | 0.9% |
| English | 214 | 19.4% |
| European | 11 | 1.0% |
| French | 44 | 4.0% |
| German | 417 | 37.9% |
| Irish | 227 | 20.6% |
| Italian | 20 | 1.8% |
| Mexican | 43 | 3.9% |
| Polish | 193 | 17.5% |
| Scotch-Irish | 11 | 1.0% |
| Scottish | 10 | 0.9% |
| Slovak | 9 | 0.8% |
| Swedish | 18 | 1.6% |
| Welsh | 25 | 2.3% |
| Yugoslavian | 7 | 0.6% | View All 17 Rows |
Immigrants in Faxon

| Immigration Origin | # Population | % Population | View All 0 Rows |
Sex and Age in Faxon
Sex and Age in Faxon
The most populous age groups in Faxon are 10 to 14 Years (101 | 21.3%) for men and 5 to 9 Years (106 | 16.9%) for women.
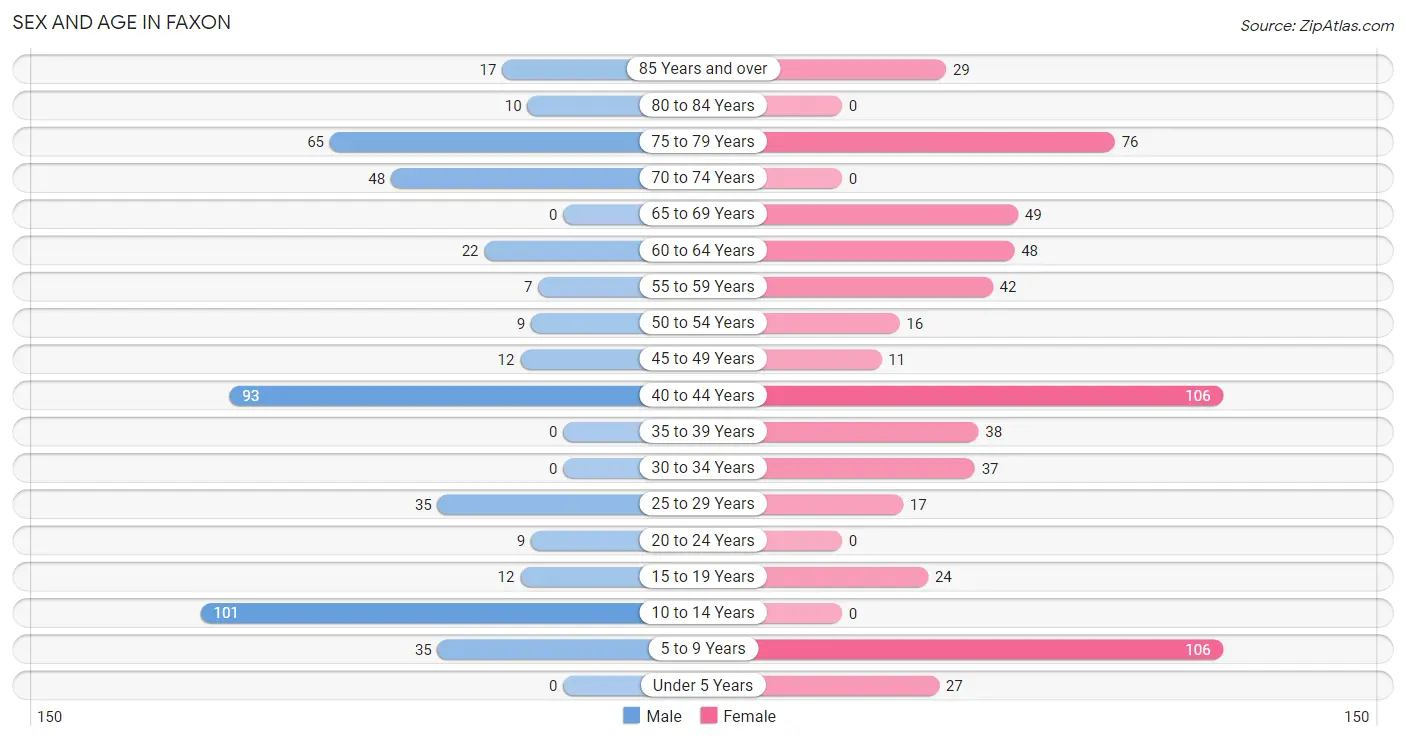
| Age Bracket | Male | Female |
| Under 5 Years | 0 (0.0%) | 27 (4.3%) |
| 5 to 9 Years | 35 (7.4%) | 106 (16.9%) |
| 10 to 14 Years | 101 (21.3%) | 0 (0.0%) |
| 15 to 19 Years | 12 (2.5%) | 24 (3.8%) |
| 20 to 24 Years | 9 (1.9%) | 0 (0.0%) |
| 25 to 29 Years | 35 (7.4%) | 17 (2.7%) |
| 30 to 34 Years | 0 (0.0%) | 37 (5.9%) |
| 35 to 39 Years | 0 (0.0%) | 38 (6.1%) |
| 40 to 44 Years | 93 (19.6%) | 106 (16.9%) |
| 45 to 49 Years | 12 (2.5%) | 11 (1.8%) |
| 50 to 54 Years | 9 (1.9%) | 16 (2.6%) |
| 55 to 59 Years | 7 (1.5%) | 42 (6.7%) |
| 60 to 64 Years | 22 (4.6%) | 48 (7.7%) |
| 65 to 69 Years | 0 (0.0%) | 49 (7.8%) |
| 70 to 74 Years | 48 (10.1%) | 0 (0.0%) |
| 75 to 79 Years | 65 (13.7%) | 76 (12.1%) |
| 80 to 84 Years | 10 (2.1%) | 0 (0.0%) |
| 85 Years and over | 17 (3.6%) | 29 (4.6%) |
| Total | 475 (100.0%) | 626 (100.0%) |
Families and Households in Faxon
Median Family Size in Faxon
The median family size in Faxon is 2.55 persons per family, with single female/mother families (95 | 25.3%) accounting for the largest median family size of 2.69 persons per family. On the other hand, single male/father families (30 | 8.0%) represent the smallest median family size with 2.43 persons per family.
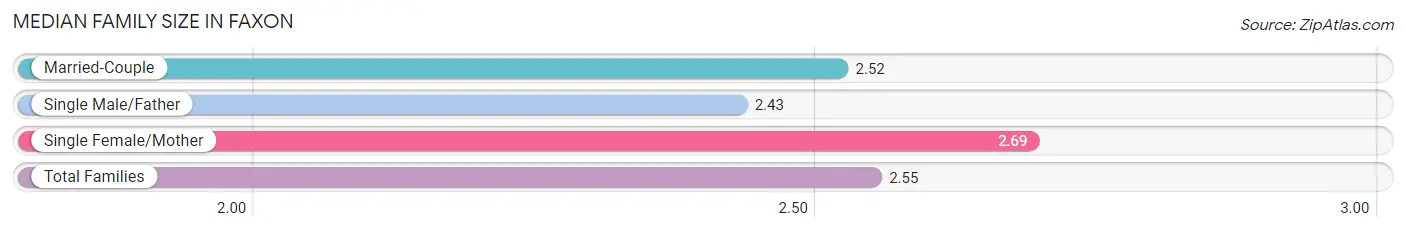
| Family Type | # Families | Family Size |
| Married-Couple | 250 (66.7%) | 2.52 |
| Single Male/Father | 30 (8.0%) | 2.43 |
| Single Female/Mother | 95 (25.3%) | 2.69 |
| Total Families | 375 (100.0%) | 2.55 |
Median Household Size in Faxon
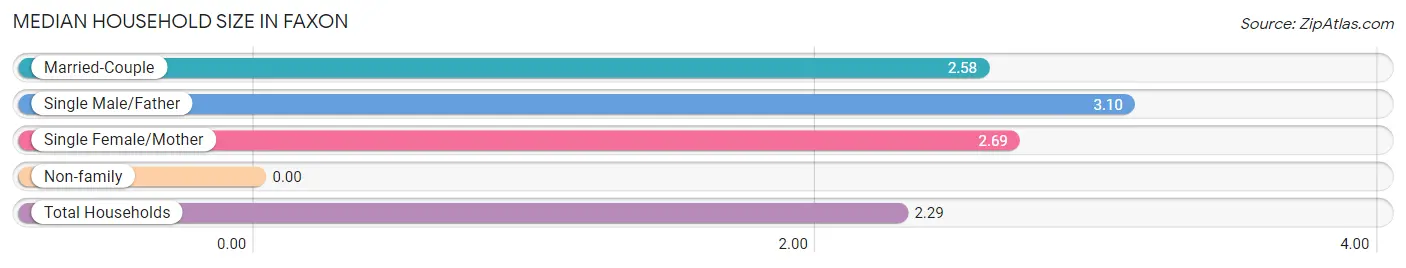
| Household Type | # Households | Household Size |
| Married-Couple | 250 (52.2%) | 2.58 |
| Single Male/Father | 30 (6.3%) | 3.10 |
| Single Female/Mother | 95 (19.8%) | 2.69 |
| Non-family | 104 (21.7%) | - |
| Total Households | 479 (100.0%) | 2.29 |
Household Size by Marriage Status in Faxon
Out of a total of 479 households in Faxon, 375 (78.3%) are family households, while 104 (21.7%) are nonfamily households. The most numerous type of family households are 2-person households, comprising 197, and the most common type of nonfamily households are 1-person households, comprising 104.
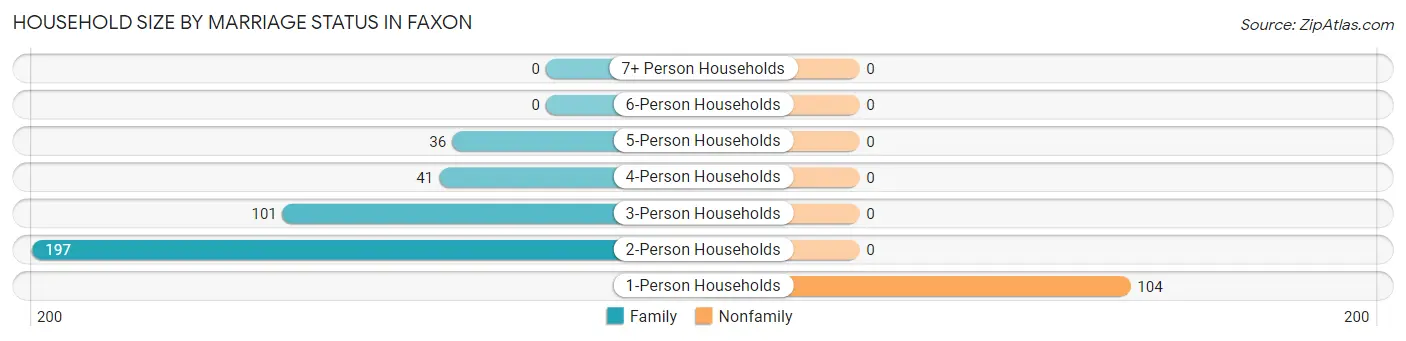
| Household Size | Family Households | Nonfamily Households |
| 1-Person Households | - | 104 (21.7%) |
| 2-Person Households | 197 (41.1%) | 0 (0.0%) |
| 3-Person Households | 101 (21.1%) | 0 (0.0%) |
| 4-Person Households | 41 (8.6%) | 0 (0.0%) |
| 5-Person Households | 36 (7.5%) | 0 (0.0%) |
| 6-Person Households | 0 (0.0%) | 0 (0.0%) |
| 7+ Person Households | 0 (0.0%) | 0 (0.0%) |
| Total | 375 (78.3%) | 104 (21.7%) |
Female Fertility in Faxon
Fertility by Age in Faxon
| Age Bracket | Women with Births | Births / 1,000 Women |
| 15 to 19 years | 0 (0.0%) | 0.0 |
| 20 to 34 years | 0 (0.0%) | 0.0 |
| 35 to 50 years | 0 (0.0%) | 0.0 |
| Total | 0 (0.0%) | 0.0 |
Fertility by Age by Marriage Status in Faxon
| Age Bracket | Married | Unmarried |
| 15 to 19 years | 0 (0.0%) | 0 (0.0%) |
| 20 to 34 years | 0 (0.0%) | 0 (0.0%) |
| 35 to 50 years | 0 (0.0%) | 0 (0.0%) |
| Total | 0 (0.0%) | 0 (0.0%) |
Fertility by Education in Faxon
| Educational Attainment | Women with Births | Births / 1,000 Women |
| Less than High School | 0 (0.0%) | 0.0 |
| High School Diploma | 0 (0.0%) | 0.0 |
| College or Associate's Degree | 0 (0.0%) | 0.0 |
| Bachelor's Degree | 0 (0.0%) | 0.0 |
| Graduate Degree | 0 (0.0%) | 0.0 |
| Total | 0 (0.0%) | 0.0 |
Fertility by Education by Marriage Status in Faxon
| Educational Attainment | Married | Unmarried |
| Less than High School | 0 (0.0%) | 0 (0.0%) |
| High School Diploma | 0 (0.0%) | 0 (0.0%) |
| College or Associate's Degree | 0 (0.0%) | 0 (0.0%) |
| Bachelor's Degree | 0 (0.0%) | 0 (0.0%) |
| Graduate Degree | 0 (0.0%) | 0 (0.0%) |
| Total | 0 (0.0%) | 0 (0.0%) |
Employment Characteristics in Faxon
Employment by Class of Employer in Faxon
Among the 487 employed individuals in Faxon, private company employees (252 | 51.7%), not-for-profit organizations (120 | 24.6%), and local government employees (49 | 10.1%) make up the most common classes of employment.
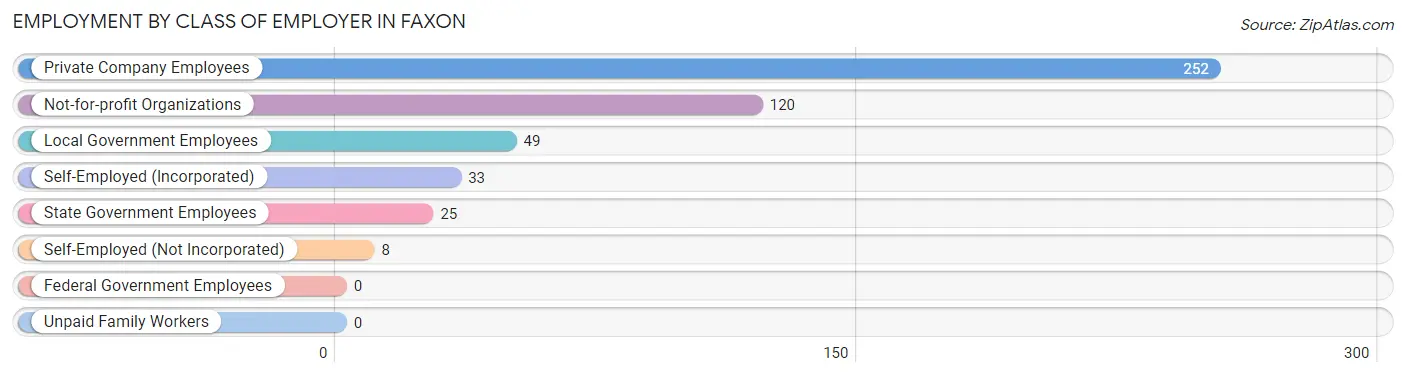
| Employer Class | # Employees | % Employees |
| Private Company Employees | 252 | 51.7% |
| Self-Employed (Incorporated) | 33 | 6.8% |
| Self-Employed (Not Incorporated) | 8 | 1.6% |
| Not-for-profit Organizations | 120 | 24.6% |
| Local Government Employees | 49 | 10.1% |
| State Government Employees | 25 | 5.1% |
| Federal Government Employees | 0 | 0.0% |
| Unpaid Family Workers | 0 | 0.0% |
| Total | 487 | 100.0% |
Employment Status by Age in Faxon
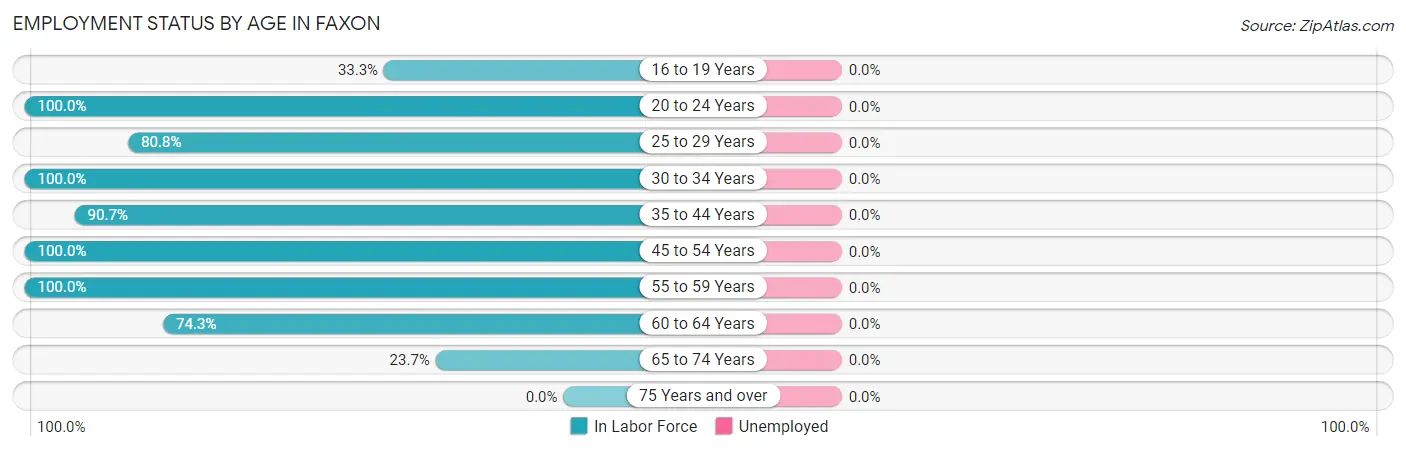
| Age Bracket | In Labor Force | Unemployed |
| 16 to 19 Years | 12 (33.3%) | 0 (0.0%) |
| 20 to 24 Years | 9 (100.0%) | 0 (0.0%) |
| 25 to 29 Years | 42 (80.8%) | 0 (0.0%) |
| 30 to 34 Years | 37 (100.0%) | 0 (0.0%) |
| 35 to 44 Years | 215 (90.7%) | 0 (0.0%) |
| 45 to 54 Years | 48 (100.0%) | 0 (0.0%) |
| 55 to 59 Years | 49 (100.0%) | 0 (0.0%) |
| 60 to 64 Years | 52 (74.3%) | 0 (0.0%) |
| 65 to 74 Years | 23 (23.7%) | 0 (0.0%) |
| 75 Years and over | 0 (0.0%) | 0 (0.0%) |
| Total | 487 (58.5%) | 0 (0.0%) |
Employment Status by Educational Attainment in Faxon
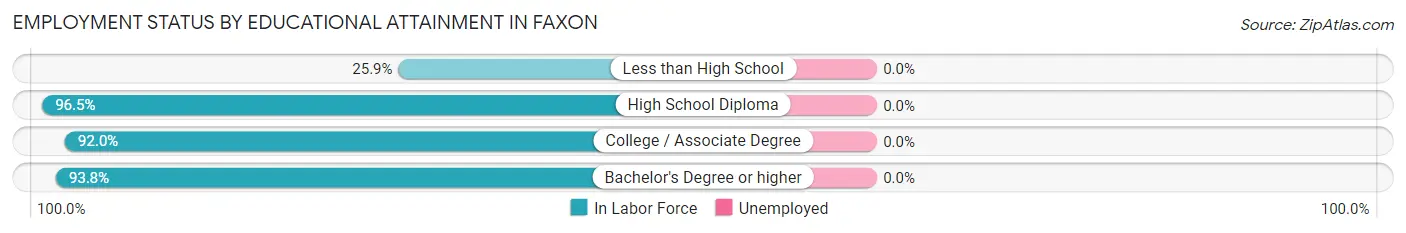
| Educational Attainment | In Labor Force | Unemployed |
| Less than High School | 7 (25.9%) | 0 (0.0%) |
| High School Diploma | 55 (96.5%) | 0 (0.0%) |
| College / Associate Degree | 126 (92.0%) | 0 (0.0%) |
| Bachelor's Degree or higher | 255 (93.8%) | 0 (0.0%) |
| Total | 443 (89.9%) | 0 (0.0%) |
Employment Occupations by Sex in Faxon
Management, Business, Science and Arts Occupations
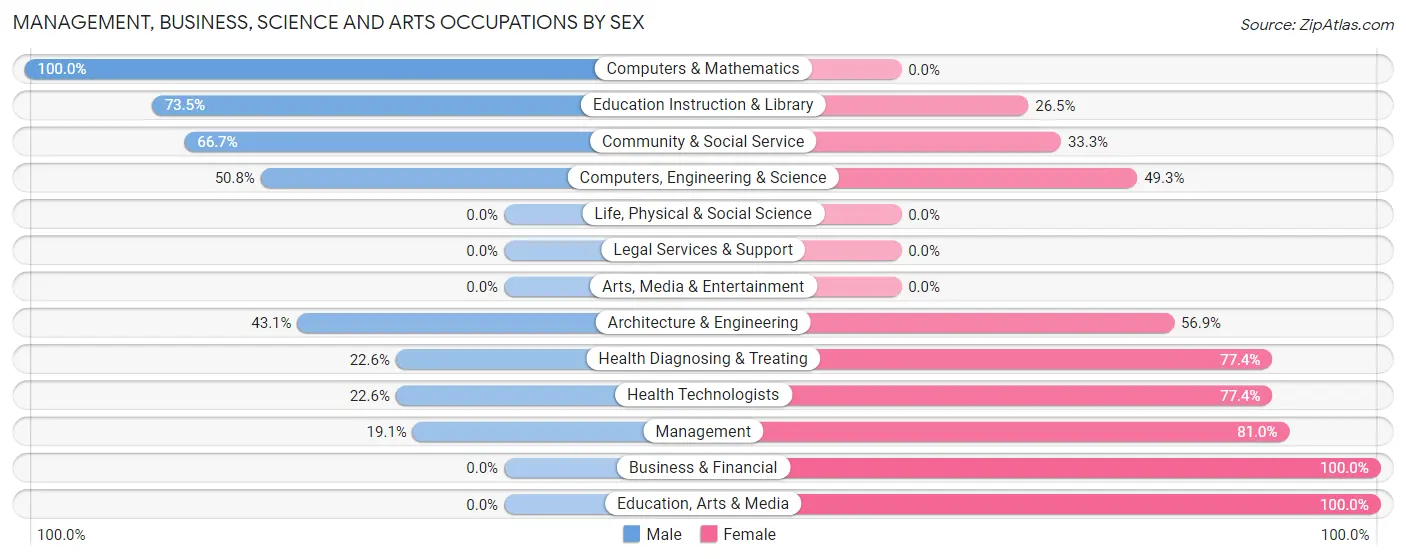
The most common Management, Business, Science and Arts occupations in Faxon are Business & Financial (88 | 18.1%), Computers, Engineering & Science (67 | 13.8%), Management (63 | 12.9%), Architecture & Engineering (58 | 11.9%), and Community & Social Service (54 | 11.1%).
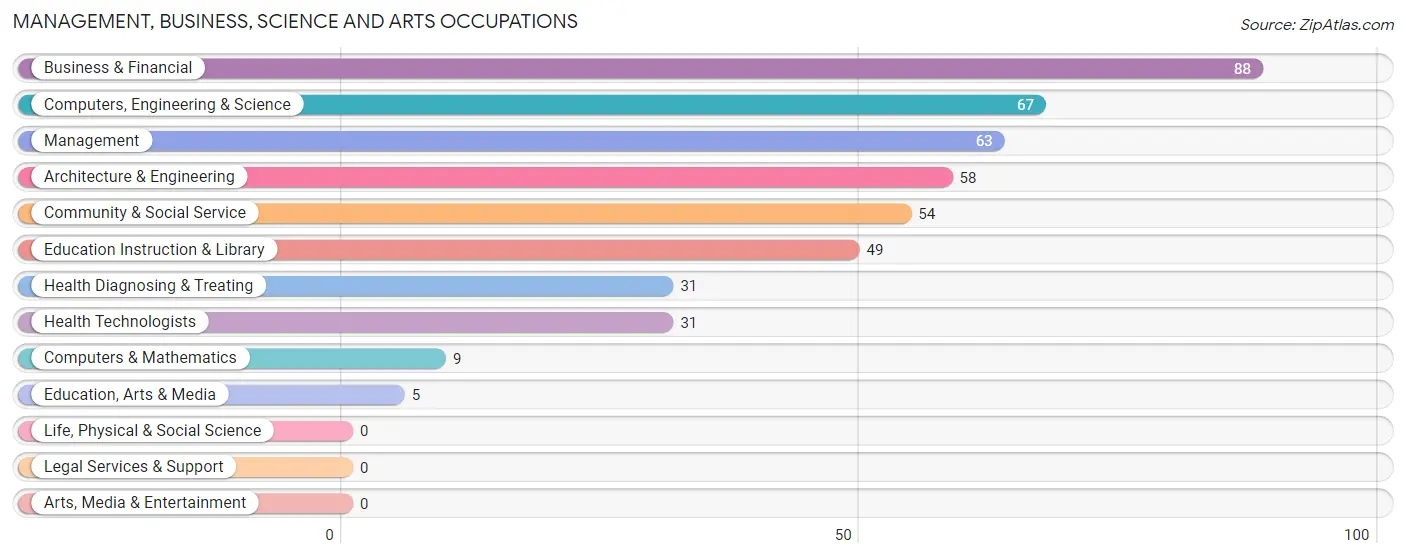
Management, Business, Science and Arts Occupations by Sex
Within the Management, Business, Science and Arts occupations in Faxon, the most male-oriented occupations are Computers & Mathematics (100.0%), Education Instruction & Library (73.5%), and Community & Social Service (66.7%), while the most female-oriented occupations are Business & Financial (100.0%), Education, Arts & Media (100.0%), and Management (80.9%).
| Occupation | Male | Female |
| Management | 12 (19.1%) | 51 (80.9%) |
| Business & Financial | 0 (0.0%) | 88 (100.0%) |
| Computers, Engineering & Science | 34 (50.7%) | 33 (49.2%) |
| Computers & Mathematics | 9 (100.0%) | 0 (0.0%) |
| Architecture & Engineering | 25 (43.1%) | 33 (56.9%) |
| Life, Physical & Social Science | 0 (0.0%) | 0 (0.0%) |
| Community & Social Service | 36 (66.7%) | 18 (33.3%) |
| Education, Arts & Media | 0 (0.0%) | 5 (100.0%) |
| Legal Services & Support | 0 (0.0%) | 0 (0.0%) |
| Education Instruction & Library | 36 (73.5%) | 13 (26.5%) |
| Arts, Media & Entertainment | 0 (0.0%) | 0 (0.0%) |
| Health Diagnosing & Treating | 7 (22.6%) | 24 (77.4%) |
| Health Technologists | 7 (22.6%) | 24 (77.4%) |
| Total (Category) | 89 (29.4%) | 214 (70.6%) |
| Total (Overall) | 203 (41.7%) | 284 (58.3%) |
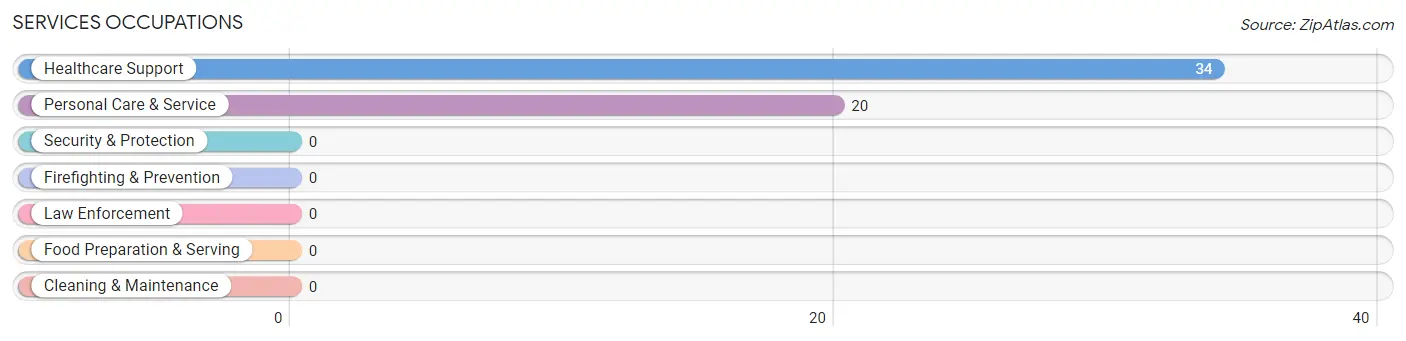
Services Occupations
The most common Services occupations in Faxon are Healthcare Support (34 | 7.0%), and Personal Care & Service (20 | 4.1%).
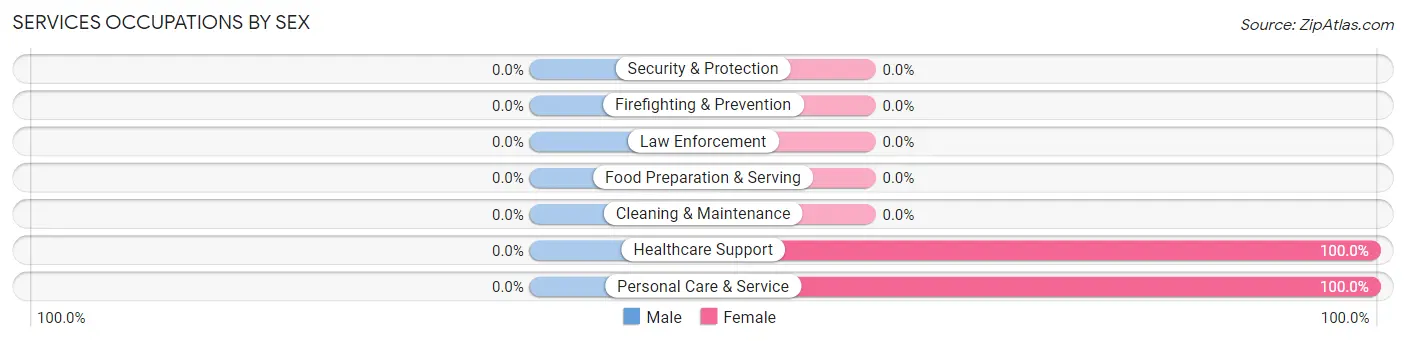
Services Occupations by Sex
| Occupation | Male | Female |
| Healthcare Support | 0 (0.0%) | 34 (100.0%) |
| Security & Protection | 0 (0.0%) | 0 (0.0%) |
| Firefighting & Prevention | 0 (0.0%) | 0 (0.0%) |
| Law Enforcement | 0 (0.0%) | 0 (0.0%) |
| Food Preparation & Serving | 0 (0.0%) | 0 (0.0%) |
| Cleaning & Maintenance | 0 (0.0%) | 0 (0.0%) |
| Personal Care & Service | 0 (0.0%) | 20 (100.0%) |
| Total (Category) | 0 (0.0%) | 54 (100.0%) |
| Total (Overall) | 203 (41.7%) | 284 (58.3%) |
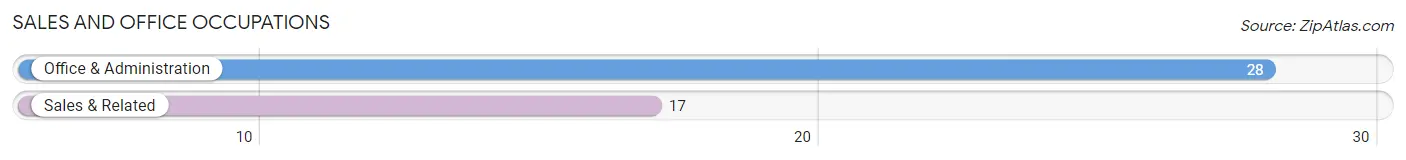
Sales and Office Occupations
The most common Sales and Office occupations in Faxon are Office & Administration (28 | 5.8%), and Sales & Related (17 | 3.5%).
Sales and Office Occupations by Sex

| Occupation | Male | Female |
| Sales & Related | 17 (100.0%) | 0 (0.0%) |
| Office & Administration | 12 (42.9%) | 16 (57.1%) |
| Total (Category) | 29 (64.4%) | 16 (35.6%) |
| Total (Overall) | 203 (41.7%) | 284 (58.3%) |
Natural Resources, Construction and Maintenance Occupations
The most common Natural Resources, Construction and Maintenance occupations in Faxon are , and Construction & Extraction (37 | 7.6%).
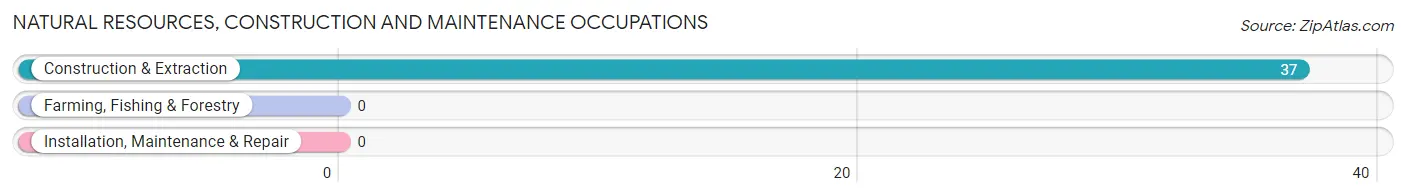
Natural Resources, Construction and Maintenance Occupations by Sex
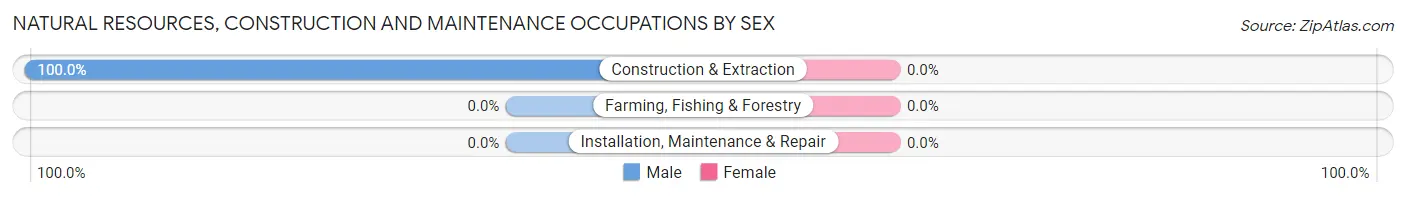
| Occupation | Male | Female |
| Farming, Fishing & Forestry | 0 (0.0%) | 0 (0.0%) |
| Construction & Extraction | 37 (100.0%) | 0 (0.0%) |
| Installation, Maintenance & Repair | 0 (0.0%) | 0 (0.0%) |
| Total (Category) | 37 (100.0%) | 0 (0.0%) |
| Total (Overall) | 203 (41.7%) | 284 (58.3%) |
Production, Transportation and Moving Occupations
The most common Production, Transportation and Moving occupations in Faxon are Production (25 | 5.1%), Material Moving (16 | 3.3%), and Transportation (7 | 1.4%).
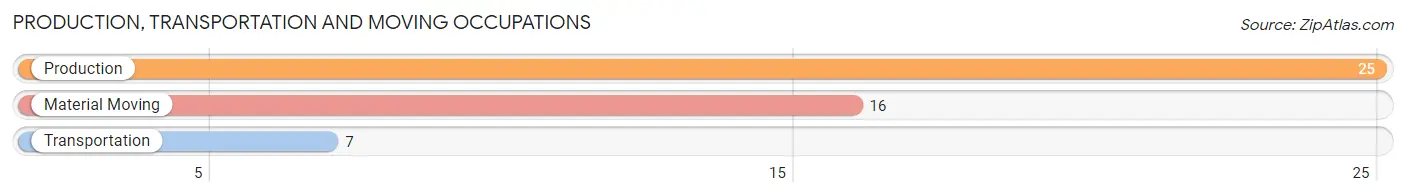
Production, Transportation and Moving Occupations by Sex
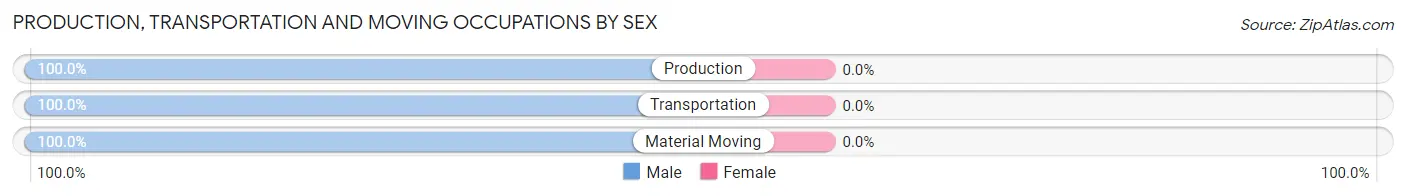
| Occupation | Male | Female |
| Production | 25 (100.0%) | 0 (0.0%) |
| Transportation | 7 (100.0%) | 0 (0.0%) |
| Material Moving | 16 (100.0%) | 0 (0.0%) |
| Total (Category) | 48 (100.0%) | 0 (0.0%) |
| Total (Overall) | 203 (41.7%) | 284 (58.3%) |
Employment Industries by Sex in Faxon
Employment Industries in Faxon
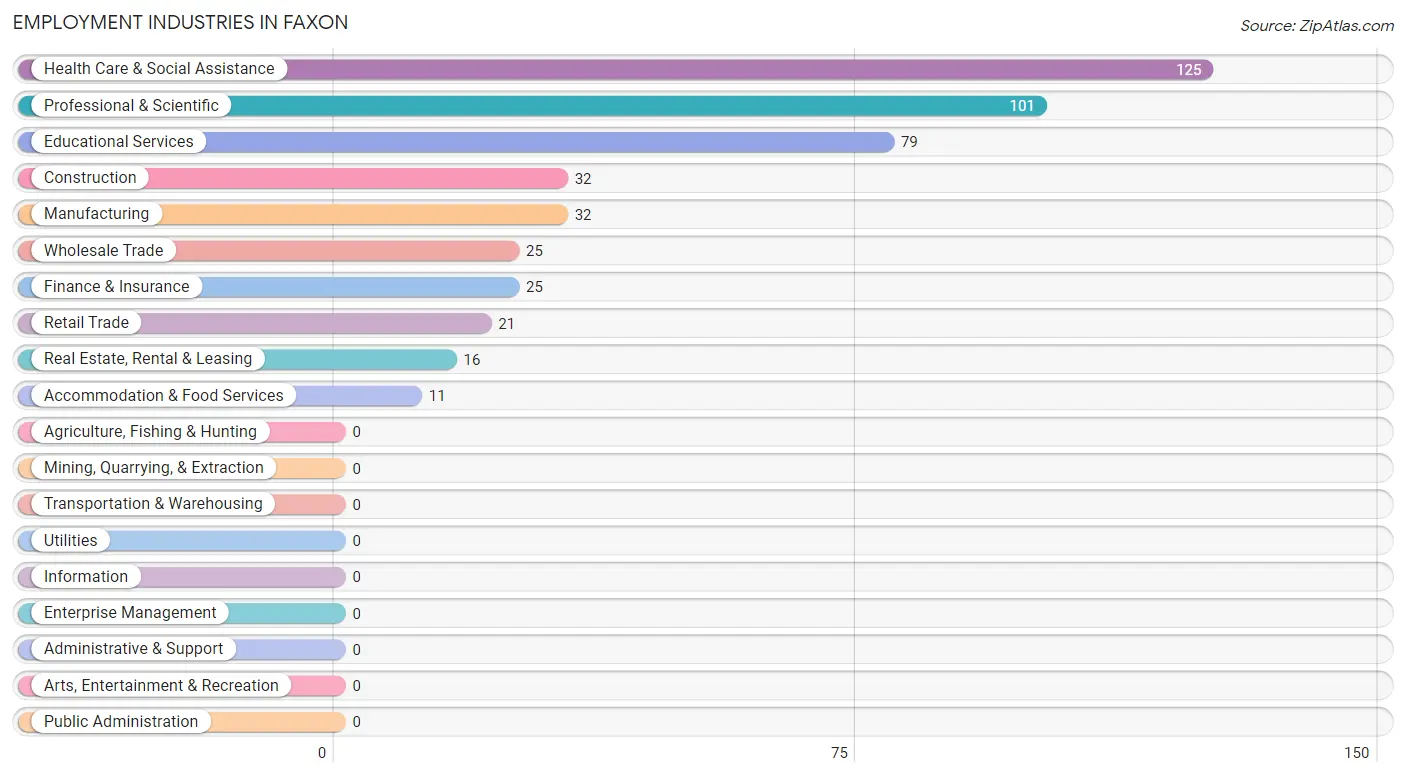
The major employment industries in Faxon include Health Care & Social Assistance (125 | 25.7%), Professional & Scientific (101 | 20.7%), Educational Services (79 | 16.2%), Construction (32 | 6.6%), and Manufacturing (32 | 6.6%).
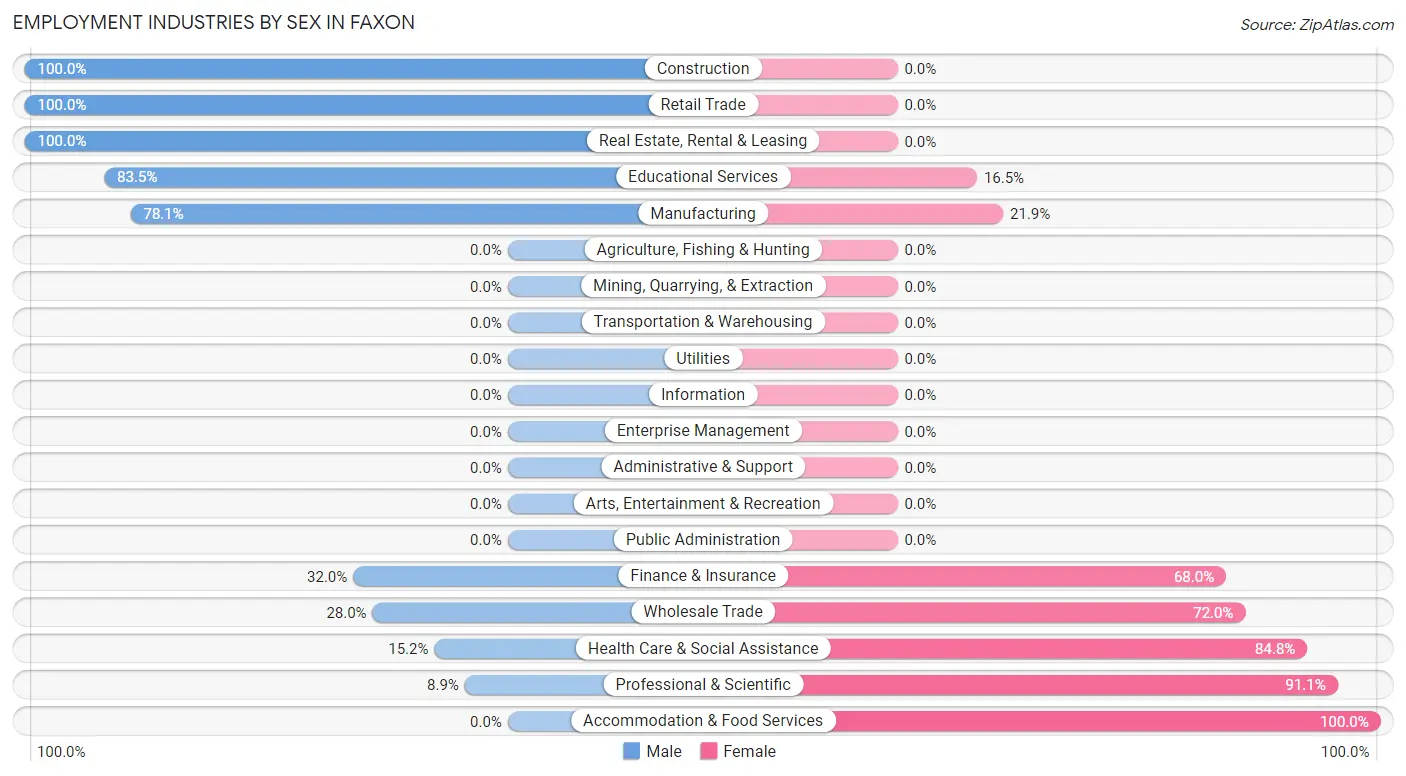
Employment Industries by Sex in Faxon
The Faxon industries that see more men than women are Construction (100.0%), Retail Trade (100.0%), and Real Estate, Rental & Leasing (100.0%), whereas the industries that tend to have a higher number of women are Accommodation & Food Services (100.0%), Professional & Scientific (91.1%), and Health Care & Social Assistance (84.8%).
| Industry | Male | Female |
| Agriculture, Fishing & Hunting | 0 (0.0%) | 0 (0.0%) |
| Mining, Quarrying, & Extraction | 0 (0.0%) | 0 (0.0%) |
| Construction | 32 (100.0%) | 0 (0.0%) |
| Manufacturing | 25 (78.1%) | 7 (21.9%) |
| Wholesale Trade | 7 (28.0%) | 18 (72.0%) |
| Retail Trade | 21 (100.0%) | 0 (0.0%) |
| Transportation & Warehousing | 0 (0.0%) | 0 (0.0%) |
| Utilities | 0 (0.0%) | 0 (0.0%) |
| Information | 0 (0.0%) | 0 (0.0%) |
| Finance & Insurance | 8 (32.0%) | 17 (68.0%) |
| Real Estate, Rental & Leasing | 16 (100.0%) | 0 (0.0%) |
| Professional & Scientific | 9 (8.9%) | 92 (91.1%) |
| Enterprise Management | 0 (0.0%) | 0 (0.0%) |
| Administrative & Support | 0 (0.0%) | 0 (0.0%) |
| Educational Services | 66 (83.5%) | 13 (16.5%) |
| Health Care & Social Assistance | 19 (15.2%) | 106 (84.8%) |
| Arts, Entertainment & Recreation | 0 (0.0%) | 0 (0.0%) |
| Accommodation & Food Services | 0 (0.0%) | 11 (100.0%) |
| Public Administration | 0 (0.0%) | 0 (0.0%) |
| Total | 203 (41.7%) | 284 (58.3%) |
Education in Faxon
School Enrollment in Faxon
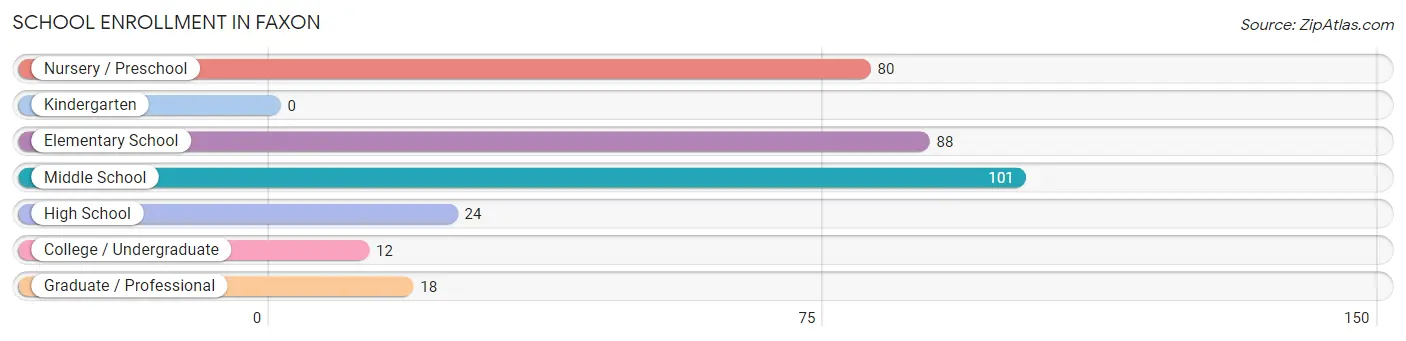
The most common levels of schooling among the 323 students in Faxon are middle school (101 | 31.3%), elementary school (88 | 27.2%), and nursery / preschool (80 | 24.8%).
| School Level | # Students | % Students |
| Nursery / Preschool | 80 | 24.8% |
| Kindergarten | 0 | 0.0% |
| Elementary School | 88 | 27.2% |
| Middle School | 101 | 31.3% |
| High School | 24 | 7.4% |
| College / Undergraduate | 12 | 3.7% |
| Graduate / Professional | 18 | 5.6% |
| Total | 323 | 100.0% |
School Enrollment by Age by Funding Source in Faxon
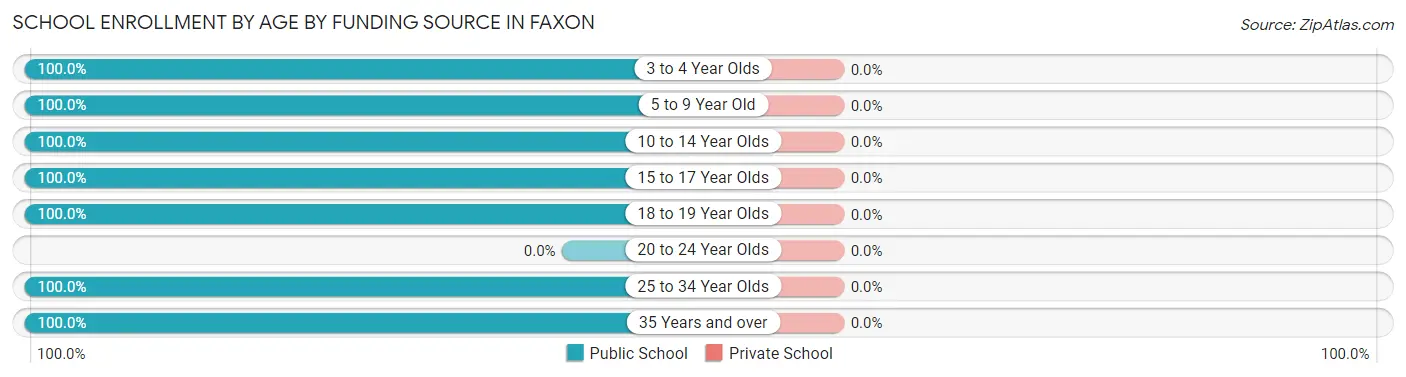
| Age Bracket | Public School | Private School |
| 3 to 4 Year Olds | 27 (100.0%) | 0 (0.0%) |
| 5 to 9 Year Old | 141 (100.0%) | 0 (0.0%) |
| 10 to 14 Year Olds | 101 (100.0%) | 0 (0.0%) |
| 15 to 17 Year Olds | 24 (100.0%) | 0 (0.0%) |
| 18 to 19 Year Olds | 12 (100.0%) | 0 (0.0%) |
| 20 to 24 Year Olds | 0 (0.0%) | 0 (0.0%) |
| 25 to 34 Year Olds | 10 (100.0%) | 0 (0.0%) |
| 35 Years and over | 8 (100.0%) | 0 (0.0%) |
| Total | 323 (100.0%) | 0 (0.0%) |
Educational Attainment by Field of Study in Faxon
Social sciences (83 | 21.2%), education (74 | 18.9%), science & technology (55 | 14.0%), engineering (45 | 11.5%), and psychology (40 | 10.2%) are the most common fields of study among 392 individuals in Faxon who have obtained a bachelor's degree or higher.
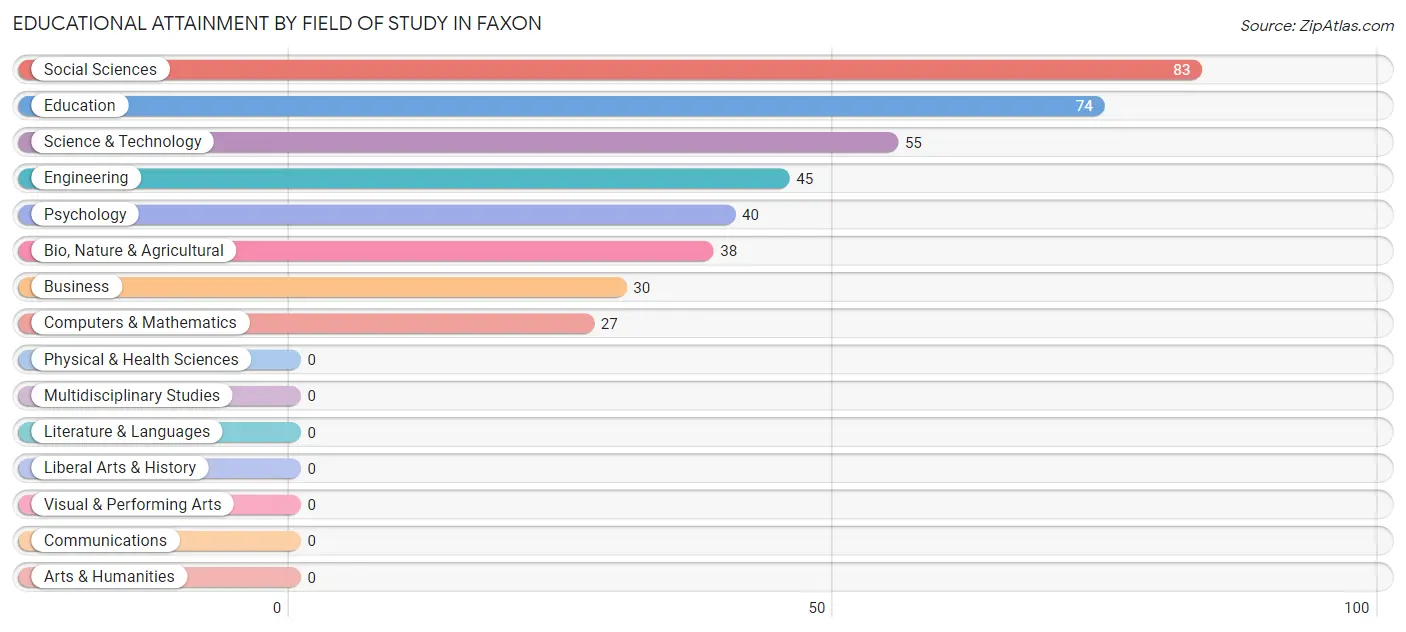
| Field of Study | # Graduates | % Graduates |
| Computers & Mathematics | 27 | 6.9% |
| Bio, Nature & Agricultural | 38 | 9.7% |
| Physical & Health Sciences | 0 | 0.0% |
| Psychology | 40 | 10.2% |
| Social Sciences | 83 | 21.2% |
| Engineering | 45 | 11.5% |
| Multidisciplinary Studies | 0 | 0.0% |
| Science & Technology | 55 | 14.0% |
| Business | 30 | 7.6% |
| Education | 74 | 18.9% |
| Literature & Languages | 0 | 0.0% |
| Liberal Arts & History | 0 | 0.0% |
| Visual & Performing Arts | 0 | 0.0% |
| Communications | 0 | 0.0% |
| Arts & Humanities | 0 | 0.0% |
| Total | 392 | 100.0% |
Transportation & Commute in Faxon
Vehicle Availability by Sex in Faxon
The most prevalent vehicle ownership categories in Faxon are males with 3 vehicles (70, accounting for 34.5%) and females with 3 vehicles (75, making up 24.6%).
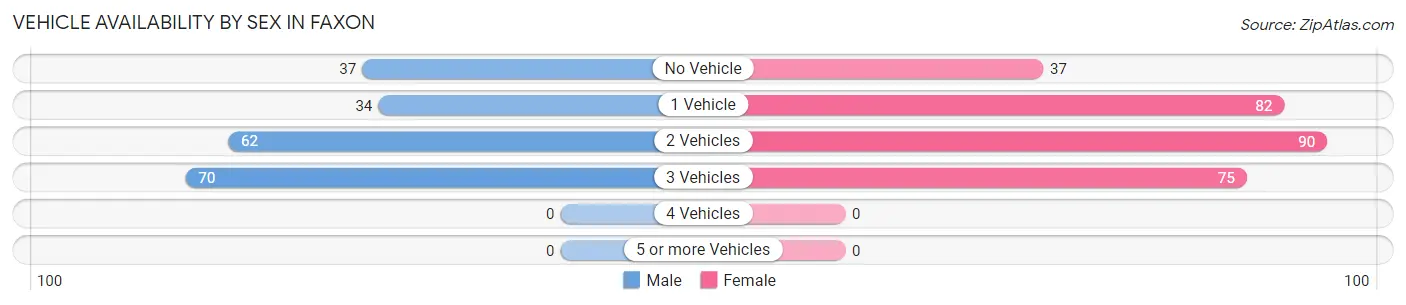
| Vehicles Available | Male | Female |
| No Vehicle | 37 (18.2%) | 37 (13.0%) |
| 1 Vehicle | 34 (16.8%) | 82 (28.9%) |
| 2 Vehicles | 62 (30.5%) | 90 (31.7%) |
| 3 Vehicles | 70 (34.5%) | 75 (26.4%) |
| 4 Vehicles | 0 (0.0%) | 0 (0.0%) |
| 5 or more Vehicles | 0 (0.0%) | 0 (0.0%) |
| Total | 203 (100.0%) | 284 (100.0%) |
Commute Time in Faxon
The most frequently occuring commute durations in Faxon are 10 to 14 minutes (182 commuters, 40.3%), 5 to 9 minutes (119 commuters, 26.3%), and less than 5 minutes (33 commuters, 7.3%).
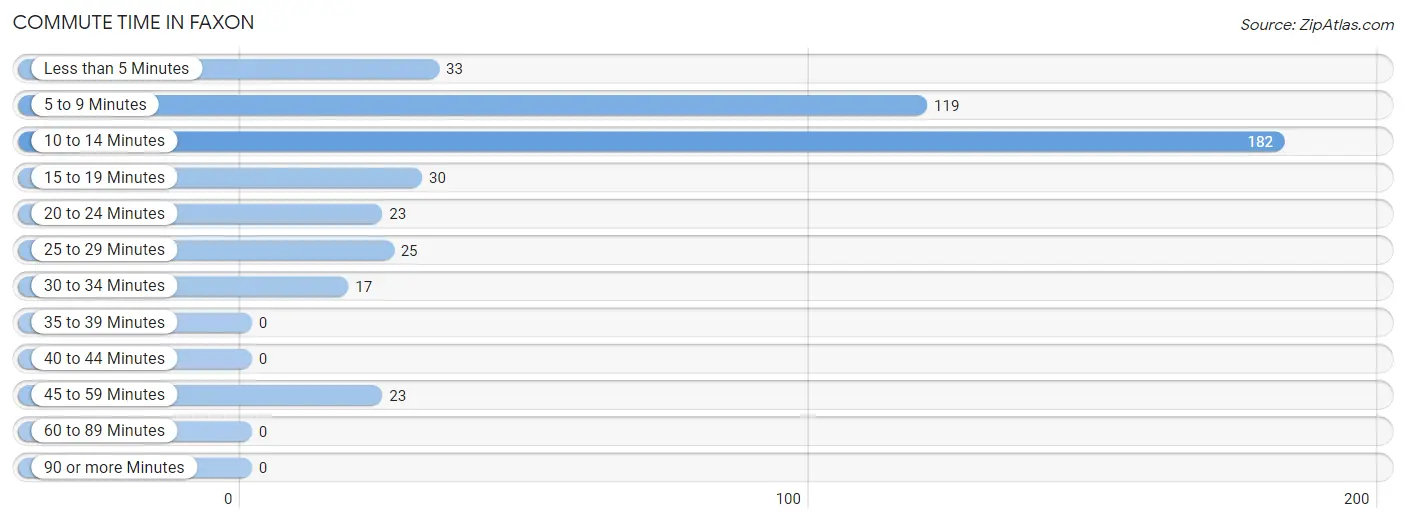
| Commute Time | # Commuters | % Commuters |
| Less than 5 Minutes | 33 | 7.3% |
| 5 to 9 Minutes | 119 | 26.3% |
| 10 to 14 Minutes | 182 | 40.3% |
| 15 to 19 Minutes | 30 | 6.6% |
| 20 to 24 Minutes | 23 | 5.1% |
| 25 to 29 Minutes | 25 | 5.5% |
| 30 to 34 Minutes | 17 | 3.8% |
| 35 to 39 Minutes | 0 | 0.0% |
| 40 to 44 Minutes | 0 | 0.0% |
| 45 to 59 Minutes | 23 | 5.1% |
| 60 to 89 Minutes | 0 | 0.0% |
| 90 or more Minutes | 0 | 0.0% |
Commute Time by Sex in Faxon
The most common commute times in Faxon are 10 to 14 minutes (85 commuters, 43.6%) for males and 10 to 14 minutes (97 commuters, 37.7%) for females.
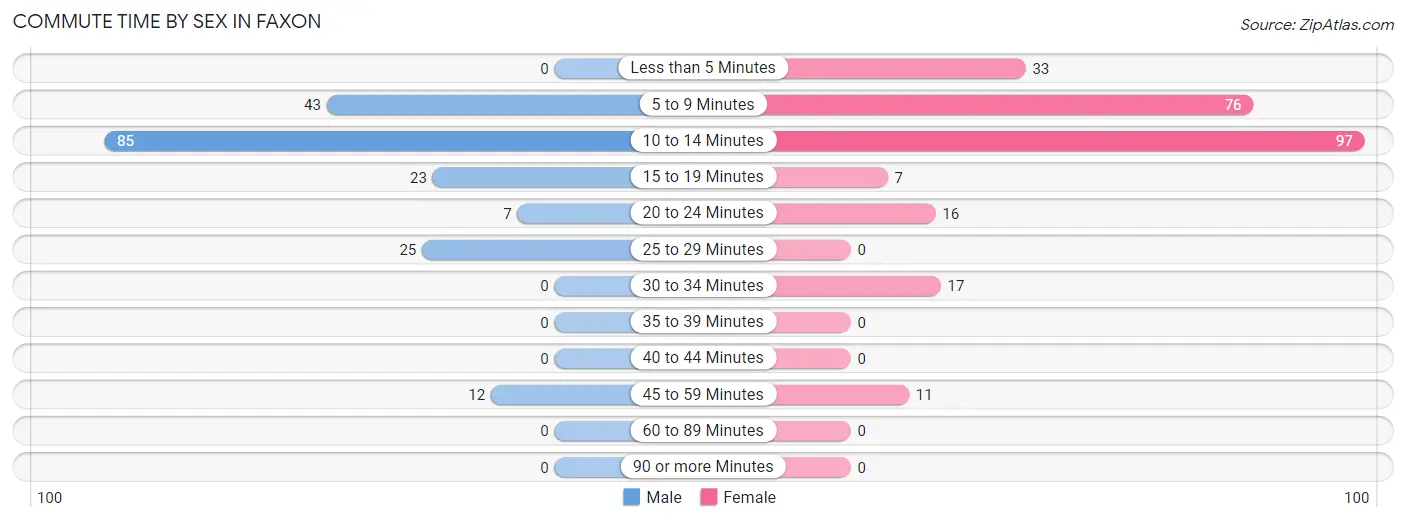
| Commute Time | Male | Female |
| Less than 5 Minutes | 0 (0.0%) | 33 (12.8%) |
| 5 to 9 Minutes | 43 (22.1%) | 76 (29.6%) |
| 10 to 14 Minutes | 85 (43.6%) | 97 (37.7%) |
| 15 to 19 Minutes | 23 (11.8%) | 7 (2.7%) |
| 20 to 24 Minutes | 7 (3.6%) | 16 (6.2%) |
| 25 to 29 Minutes | 25 (12.8%) | 0 (0.0%) |
| 30 to 34 Minutes | 0 (0.0%) | 17 (6.6%) |
| 35 to 39 Minutes | 0 (0.0%) | 0 (0.0%) |
| 40 to 44 Minutes | 0 (0.0%) | 0 (0.0%) |
| 45 to 59 Minutes | 12 (6.1%) | 11 (4.3%) |
| 60 to 89 Minutes | 0 (0.0%) | 0 (0.0%) |
| 90 or more Minutes | 0 (0.0%) | 0 (0.0%) |
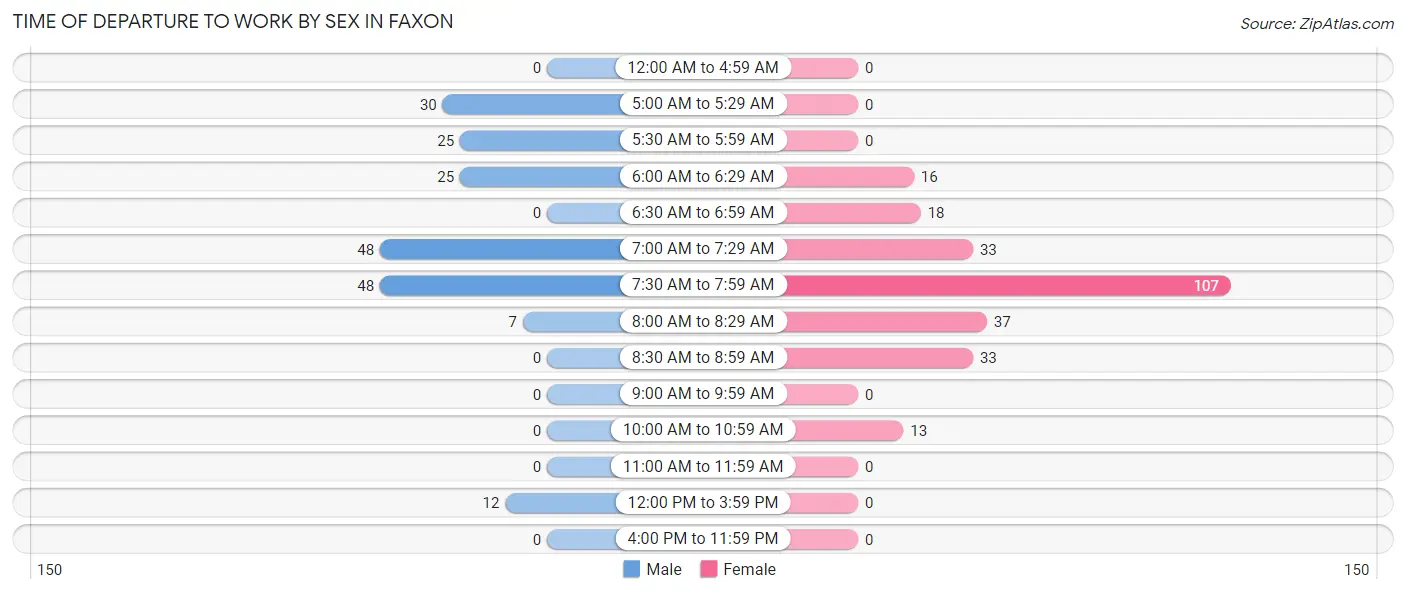
Time of Departure to Work by Sex in Faxon
The most frequent times of departure to work in Faxon are 7:00 AM to 7:29 AM (48, 24.6%) for males and 7:30 AM to 7:59 AM (107, 41.6%) for females.
| Time of Departure | Male | Female |
| 12:00 AM to 4:59 AM | 0 (0.0%) | 0 (0.0%) |
| 5:00 AM to 5:29 AM | 30 (15.4%) | 0 (0.0%) |
| 5:30 AM to 5:59 AM | 25 (12.8%) | 0 (0.0%) |
| 6:00 AM to 6:29 AM | 25 (12.8%) | 16 (6.2%) |
| 6:30 AM to 6:59 AM | 0 (0.0%) | 18 (7.0%) |
| 7:00 AM to 7:29 AM | 48 (24.6%) | 33 (12.8%) |
| 7:30 AM to 7:59 AM | 48 (24.6%) | 107 (41.6%) |
| 8:00 AM to 8:29 AM | 7 (3.6%) | 37 (14.4%) |
| 8:30 AM to 8:59 AM | 0 (0.0%) | 33 (12.8%) |
| 9:00 AM to 9:59 AM | 0 (0.0%) | 0 (0.0%) |
| 10:00 AM to 10:59 AM | 0 (0.0%) | 13 (5.1%) |
| 11:00 AM to 11:59 AM | 0 (0.0%) | 0 (0.0%) |
| 12:00 PM to 3:59 PM | 12 (6.1%) | 0 (0.0%) |
| 4:00 PM to 11:59 PM | 0 (0.0%) | 0 (0.0%) |
| Total | 195 (100.0%) | 257 (100.0%) |
Housing Occupancy in Faxon
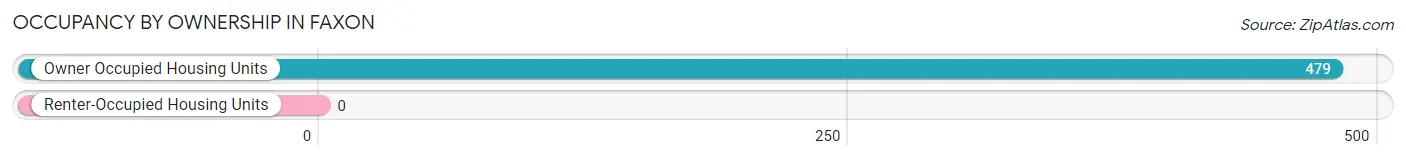
Occupancy by Ownership in Faxon
Of the total 479 dwellings in Faxon, owner-occupied units account for 479 (100.0%), while renter-occupied units make up 0 (0.0%).
| Occupancy | # Housing Units | % Housing Units |
| Owner Occupied Housing Units | 479 | 100.0% |
| Renter-Occupied Housing Units | 0 | 0.0% |
| Total Occupied Housing Units | 479 | 100.0% |
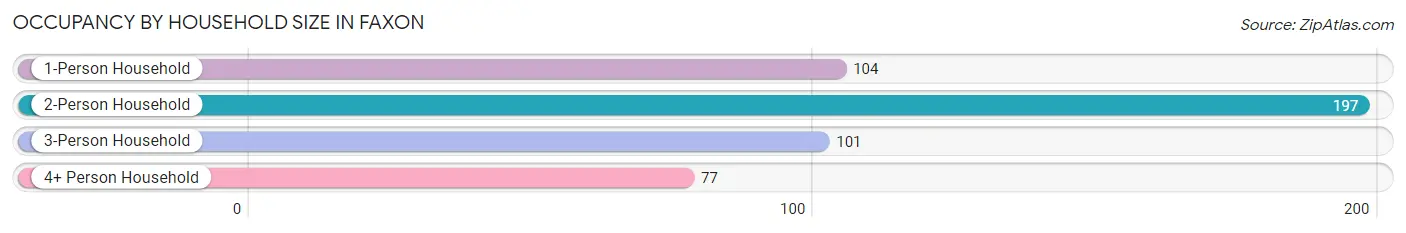
Occupancy by Household Size in Faxon
| Household Size | # Housing Units | % Housing Units |
| 1-Person Household | 104 | 21.7% |
| 2-Person Household | 197 | 41.1% |
| 3-Person Household | 101 | 21.1% |
| 4+ Person Household | 77 | 16.1% |
| Total Housing Units | 479 | 100.0% |
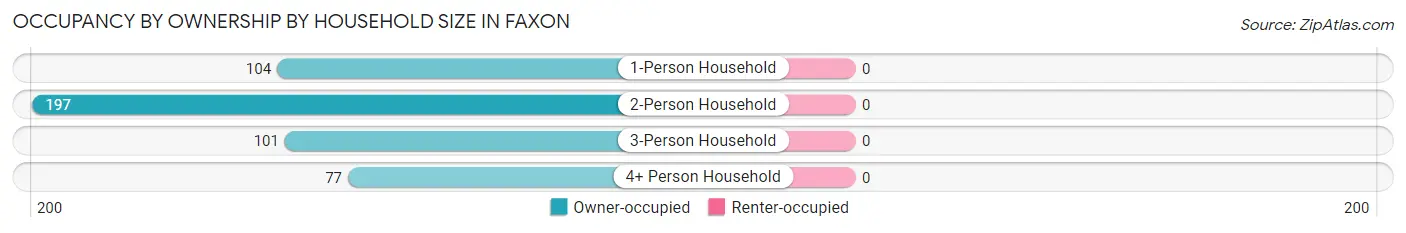
Occupancy by Ownership by Household Size in Faxon
| Household Size | Owner-occupied | Renter-occupied |
| 1-Person Household | 104 (100.0%) | 0 (0.0%) |
| 2-Person Household | 197 (100.0%) | 0 (0.0%) |
| 3-Person Household | 101 (100.0%) | 0 (0.0%) |
| 4+ Person Household | 77 (100.0%) | 0 (0.0%) |
| Total Housing Units | 479 (100.0%) | 0 (0.0%) |
Occupancy by Educational Attainment in Faxon
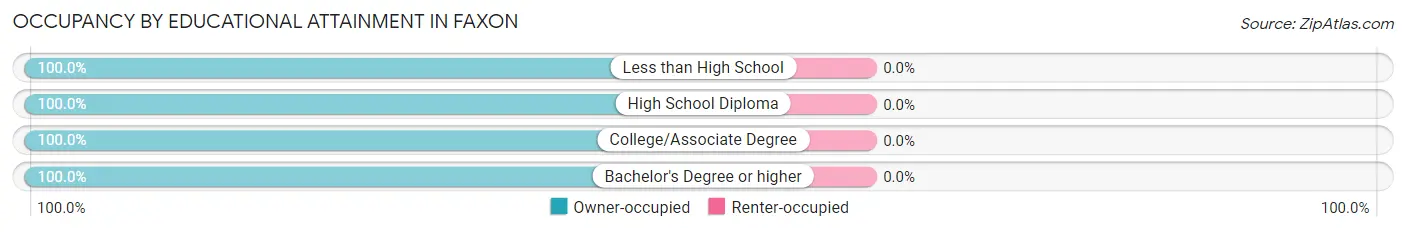
| Household Size | Owner-occupied | Renter-occupied |
| Less than High School | 20 (100.0%) | 0 (0.0%) |
| High School Diploma | 39 (100.0%) | 0 (0.0%) |
| College/Associate Degree | 172 (100.0%) | 0 (0.0%) |
| Bachelor's Degree or higher | 248 (100.0%) | 0 (0.0%) |
Occupancy by Age of Householder in Faxon
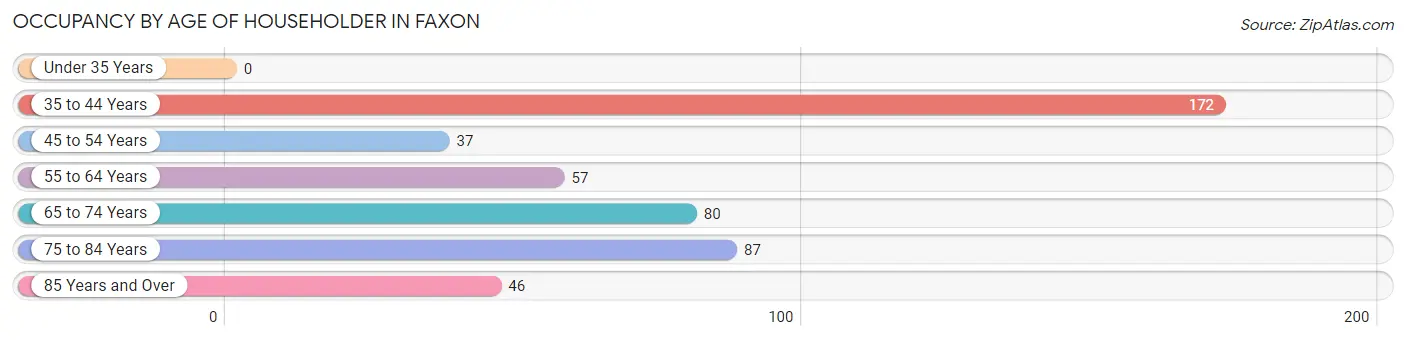
| Age Bracket | # Households | % Households |
| Under 35 Years | 0 | 0.0% |
| 35 to 44 Years | 172 | 35.9% |
| 45 to 54 Years | 37 | 7.7% |
| 55 to 64 Years | 57 | 11.9% |
| 65 to 74 Years | 80 | 16.7% |
| 75 to 84 Years | 87 | 18.2% |
| 85 Years and Over | 46 | 9.6% |
| Total | 479 | 100.0% |
Housing Finances in Faxon
Median Income by Occupancy in Faxon
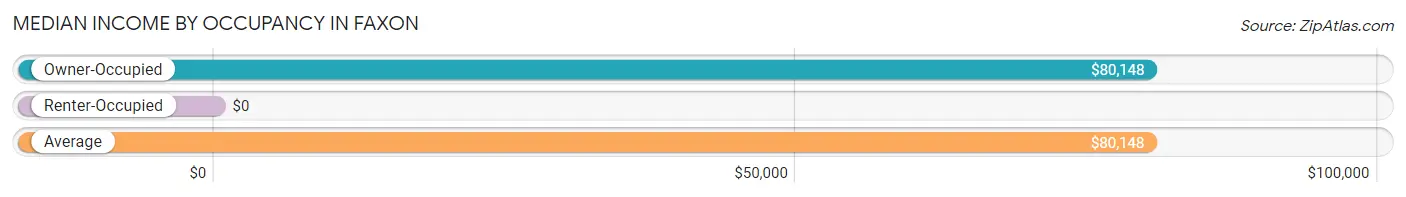
| Occupancy Type | # Households | Median Income |
| Owner-Occupied | 479 (100.0%) | $80,148 |
| Renter-Occupied | 0 (0.0%) | $0 |
| Average | 479 (100.0%) | $80,148 |
Occupancy by Householder Income Bracket in Faxon
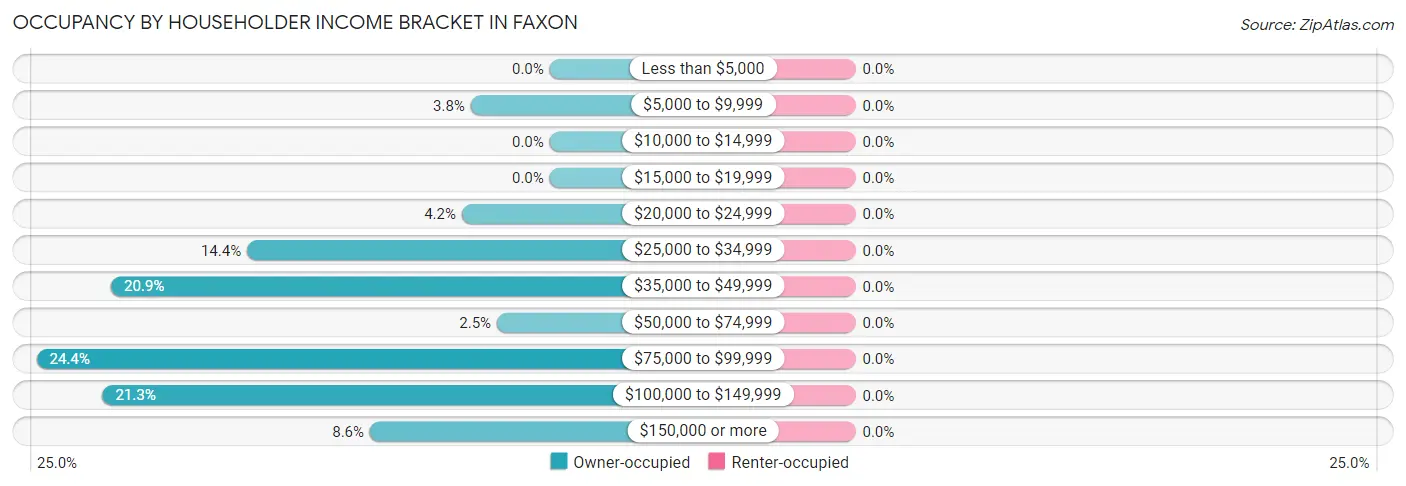
| Income Bracket | Owner-occupied | Renter-occupied |
| Less than $5,000 | 0 (0.0%) | 0 (0.0%) |
| $5,000 to $9,999 | 18 (3.8%) | 0 (0.0%) |
| $10,000 to $14,999 | 0 (0.0%) | 0 (0.0%) |
| $15,000 to $19,999 | 0 (0.0%) | 0 (0.0%) |
| $20,000 to $24,999 | 20 (4.2%) | 0 (0.0%) |
| $25,000 to $34,999 | 69 (14.4%) | 0 (0.0%) |
| $35,000 to $49,999 | 100 (20.9%) | 0 (0.0%) |
| $50,000 to $74,999 | 12 (2.5%) | 0 (0.0%) |
| $75,000 to $99,999 | 117 (24.4%) | 0 (0.0%) |
| $100,000 to $149,999 | 102 (21.3%) | 0 (0.0%) |
| $150,000 or more | 41 (8.6%) | 0 (0.0%) |
| Total | 479 (100.0%) | 0 (0.0%) |
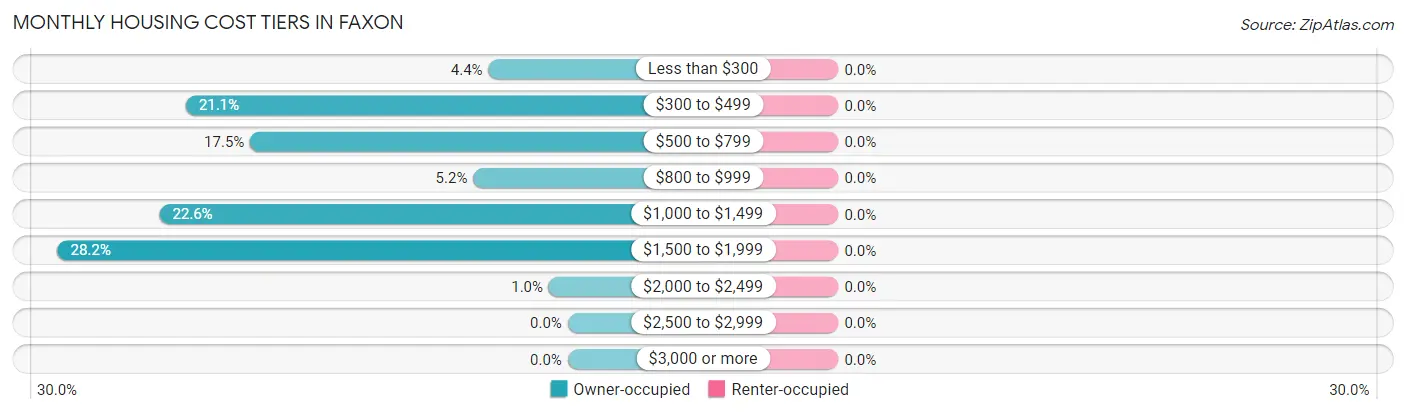
Monthly Housing Cost Tiers in Faxon
| Monthly Cost | Owner-occupied | Renter-occupied |
| Less than $300 | 21 (4.4%) | 0 (0.0%) |
| $300 to $499 | 101 (21.1%) | 0 (0.0%) |
| $500 to $799 | 84 (17.5%) | 0 (0.0%) |
| $800 to $999 | 25 (5.2%) | 0 (0.0%) |
| $1,000 to $1,499 | 108 (22.6%) | 0 (0.0%) |
| $1,500 to $1,999 | 135 (28.2%) | 0 (0.0%) |
| $2,000 to $2,499 | 5 (1.0%) | 0 (0.0%) |
| $2,500 to $2,999 | 0 (0.0%) | 0 (0.0%) |
| $3,000 or more | 0 (0.0%) | 0 (0.0%) |
| Total | 479 (100.0%) | 0 (0.0%) |
Physical Housing Characteristics in Faxon
Housing Structures in Faxon
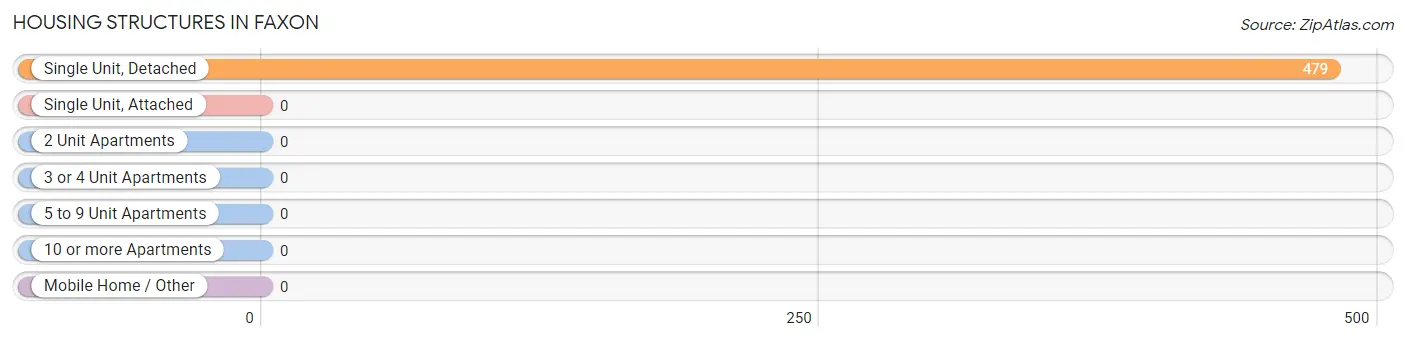
| Structure Type | # Housing Units | % Housing Units |
| Single Unit, Detached | 479 | 100.0% |
| Single Unit, Attached | 0 | 0.0% |
| 2 Unit Apartments | 0 | 0.0% |
| 3 or 4 Unit Apartments | 0 | 0.0% |
| 5 to 9 Unit Apartments | 0 | 0.0% |
| 10 or more Apartments | 0 | 0.0% |
| Mobile Home / Other | 0 | 0.0% |
| Total | 479 | 100.0% |
Housing Structures by Occupancy in Faxon
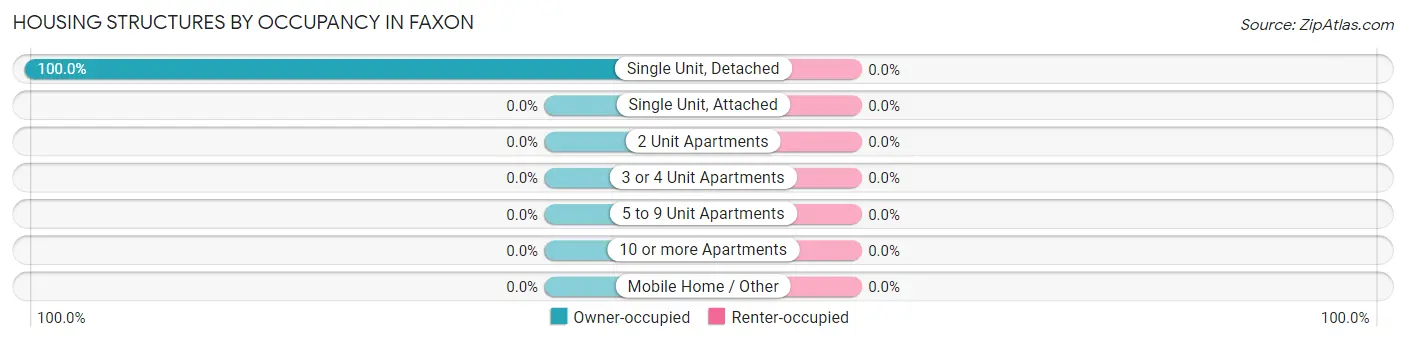
| Structure Type | Owner-occupied | Renter-occupied |
| Single Unit, Detached | 479 (100.0%) | 0 (0.0%) |
| Single Unit, Attached | 0 (0.0%) | 0 (0.0%) |
| 2 Unit Apartments | 0 (0.0%) | 0 (0.0%) |
| 3 or 4 Unit Apartments | 0 (0.0%) | 0 (0.0%) |
| 5 to 9 Unit Apartments | 0 (0.0%) | 0 (0.0%) |
| 10 or more Apartments | 0 (0.0%) | 0 (0.0%) |
| Mobile Home / Other | 0 (0.0%) | 0 (0.0%) |
| Total | 479 (100.0%) | 0 (0.0%) |
Housing Structures by Number of Rooms in Faxon
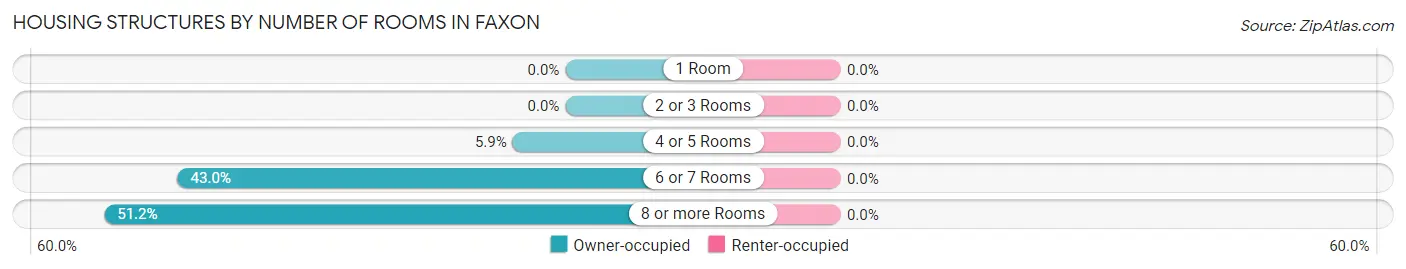
| Number of Rooms | Owner-occupied | Renter-occupied |
| 1 Room | 0 (0.0%) | 0 (0.0%) |
| 2 or 3 Rooms | 0 (0.0%) | 0 (0.0%) |
| 4 or 5 Rooms | 28 (5.9%) | 0 (0.0%) |
| 6 or 7 Rooms | 206 (43.0%) | 0 (0.0%) |
| 8 or more Rooms | 245 (51.1%) | 0 (0.0%) |
| Total | 479 (100.0%) | 0 (0.0%) |
Housing Structure by Heating Type in Faxon
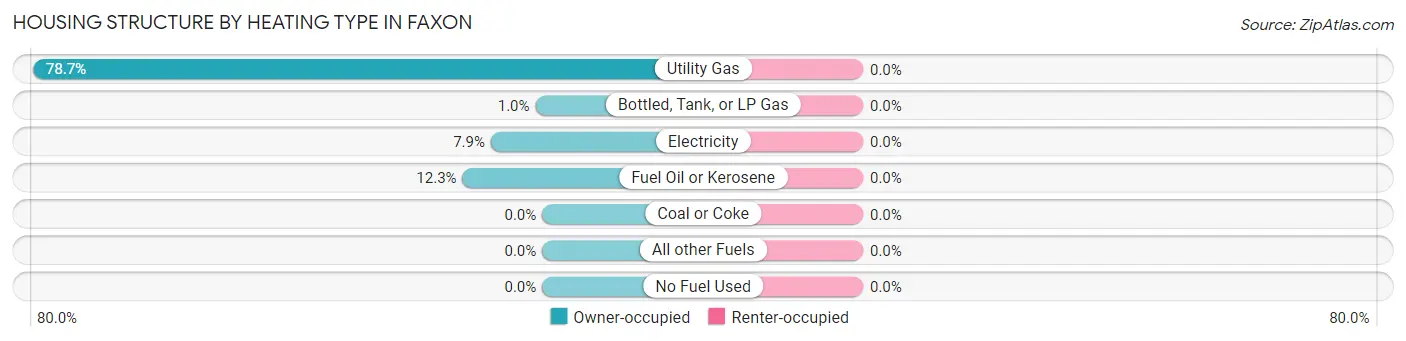
| Heating Type | Owner-occupied | Renter-occupied |
| Utility Gas | 377 (78.7%) | 0 (0.0%) |
| Bottled, Tank, or LP Gas | 5 (1.0%) | 0 (0.0%) |
| Electricity | 38 (7.9%) | 0 (0.0%) |
| Fuel Oil or Kerosene | 59 (12.3%) | 0 (0.0%) |
| Coal or Coke | 0 (0.0%) | 0 (0.0%) |
| All other Fuels | 0 (0.0%) | 0 (0.0%) |
| No Fuel Used | 0 (0.0%) | 0 (0.0%) |
| Total | 479 (100.0%) | 0 (0.0%) |
Household Vehicle Usage in Faxon
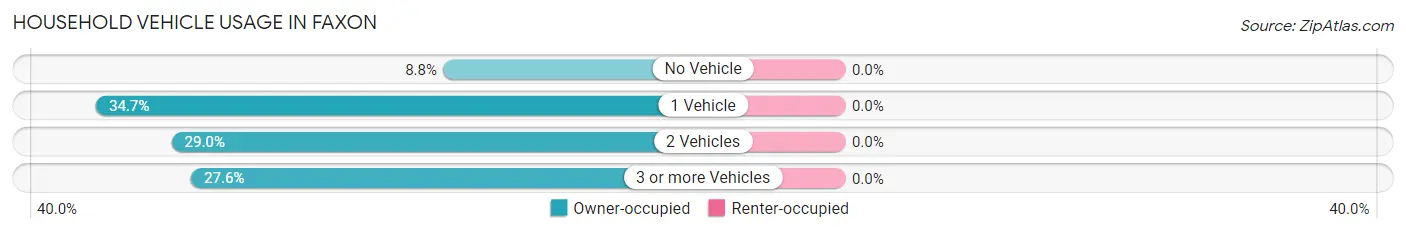
| Vehicles per Household | Owner-occupied | Renter-occupied |
| No Vehicle | 42 (8.8%) | 0 (0.0%) |
| 1 Vehicle | 166 (34.7%) | 0 (0.0%) |
| 2 Vehicles | 139 (29.0%) | 0 (0.0%) |
| 3 or more Vehicles | 132 (27.6%) | 0 (0.0%) |
| Total | 479 (100.0%) | 0 (0.0%) |
Real Estate & Mortgages in Faxon
Real Estate and Mortgage Overview in Faxon
| Characteristic | Without Mortgage | With Mortgage |
| Housing Units | 210 | 269 |
| Median Property Value | $177,100 | $194,300 |
| Median Household Income | $34,911 | $34 |
| Monthly Housing Costs | $483 | $0 |
| Real Estate Taxes | $2,580 | $0 |
Property Value by Mortgage Status in Faxon
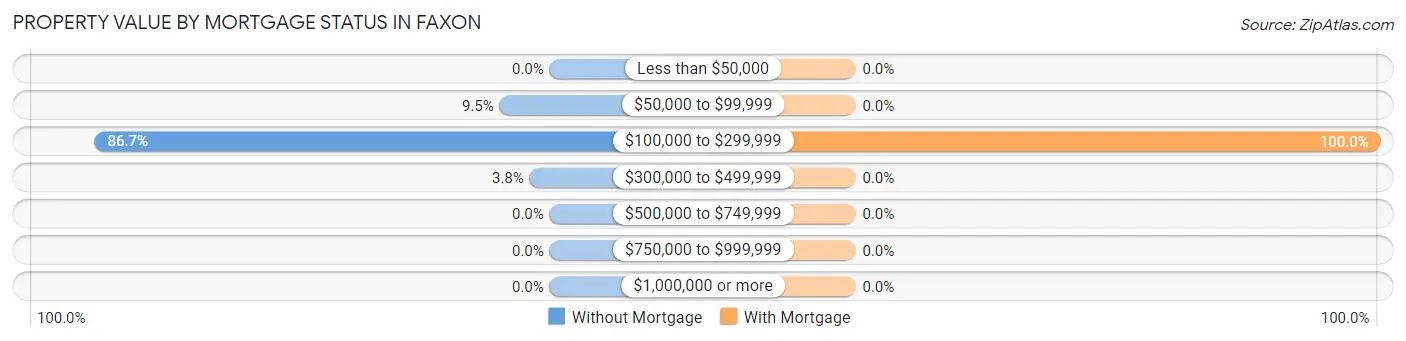
| Property Value | Without Mortgage | With Mortgage |
| Less than $50,000 | 0 (0.0%) | 0 (0.0%) |
| $50,000 to $99,999 | 20 (9.5%) | 0 (0.0%) |
| $100,000 to $299,999 | 182 (86.7%) | 269 (100.0%) |
| $300,000 to $499,999 | 8 (3.8%) | 0 (0.0%) |
| $500,000 to $749,999 | 0 (0.0%) | 0 (0.0%) |
| $750,000 to $999,999 | 0 (0.0%) | 0 (0.0%) |
| $1,000,000 or more | 0 (0.0%) | 0 (0.0%) |
| Total | 210 (100.0%) | 269 (100.0%) |
Household Income by Mortgage Status in Faxon
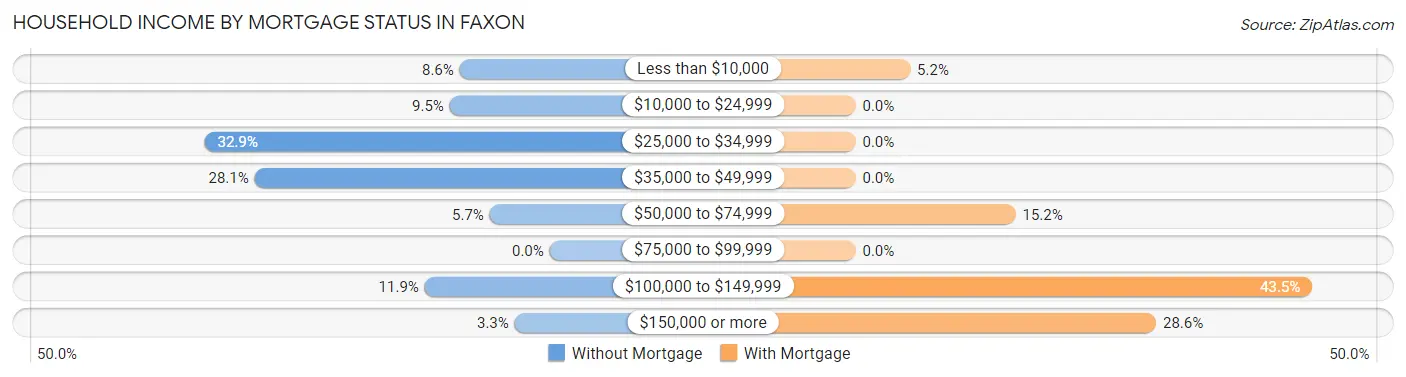
| Household Income | Without Mortgage | With Mortgage |
| Less than $10,000 | 18 (8.6%) | 14 (5.2%) |
| $10,000 to $24,999 | 20 (9.5%) | 0 (0.0%) |
| $25,000 to $34,999 | 69 (32.9%) | 0 (0.0%) |
| $35,000 to $49,999 | 59 (28.1%) | 0 (0.0%) |
| $50,000 to $74,999 | 12 (5.7%) | 41 (15.2%) |
| $75,000 to $99,999 | 0 (0.0%) | 0 (0.0%) |
| $100,000 to $149,999 | 25 (11.9%) | 117 (43.5%) |
| $150,000 or more | 7 (3.3%) | 77 (28.6%) |
| Total | 210 (100.0%) | 269 (100.0%) |
Property Value to Household Income Ratio in Faxon
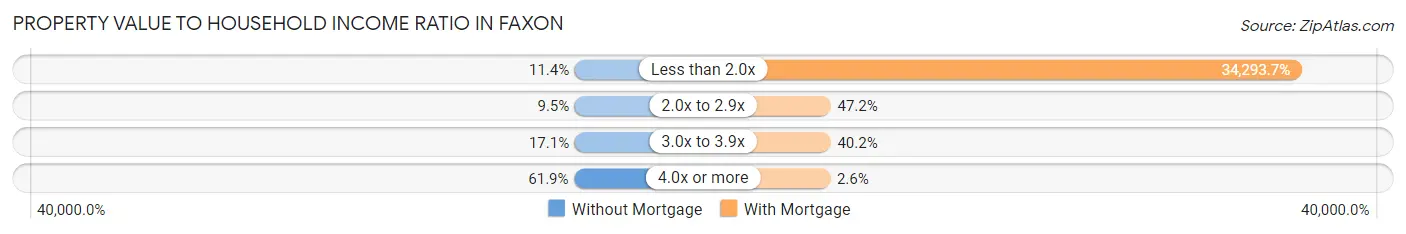
| Value-to-Income Ratio | Without Mortgage | With Mortgage |
| Less than 2.0x | 24 (11.4%) | 92,250 (34,293.7%) |
| 2.0x to 2.9x | 20 (9.5%) | 127 (47.2%) |
| 3.0x to 3.9x | 36 (17.1%) | 108 (40.2%) |
| 4.0x or more | 130 (61.9%) | 7 (2.6%) |
| Total | 210 (100.0%) | 269 (100.0%) |
Real Estate Taxes by Mortgage Status in Faxon
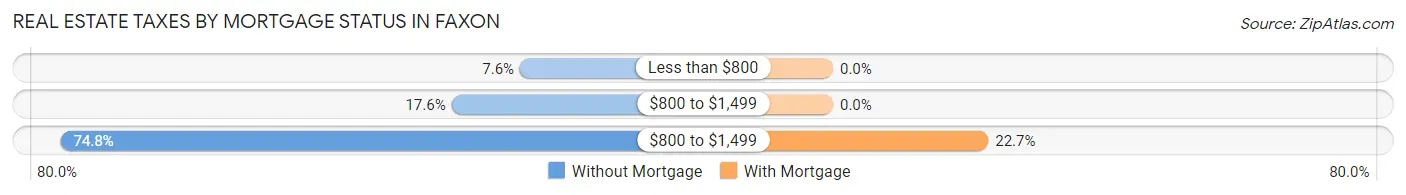
| Property Taxes | Without Mortgage | With Mortgage |
| Less than $800 | 16 (7.6%) | 0 (0.0%) |
| $800 to $1,499 | 37 (17.6%) | 0 (0.0%) |
| $800 to $1,499 | 157 (74.8%) | 61 (22.7%) |
| Total | 210 (100.0%) | 269 (100.0%) |
Health & Disability in Faxon
Health Insurance Coverage by Age in Faxon
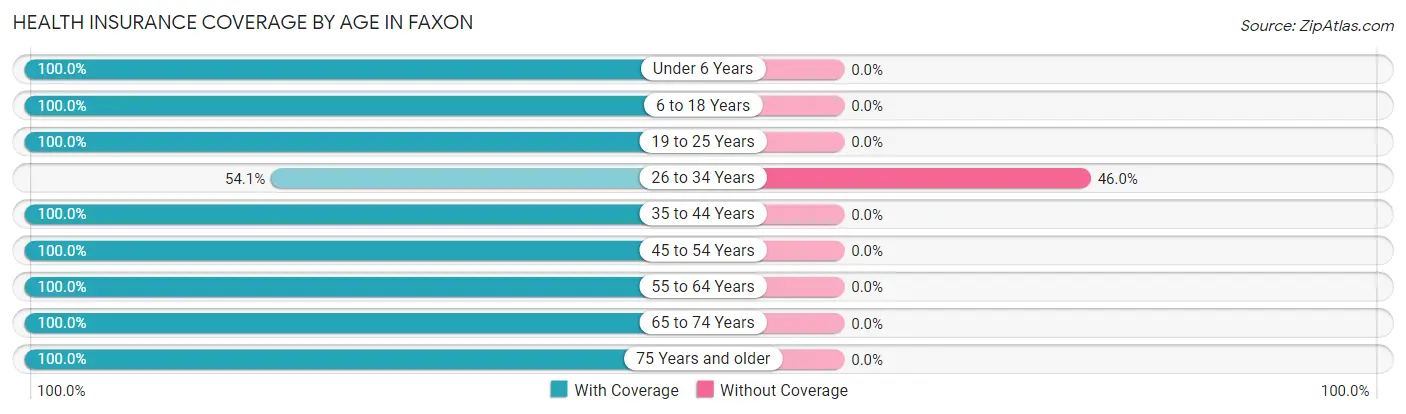
| Age Bracket | With Coverage | Without Coverage |
| Under 6 Years | 80 (100.0%) | 0 (0.0%) |
| 6 to 18 Years | 213 (100.0%) | 0 (0.0%) |
| 19 to 25 Years | 73 (100.0%) | 0 (0.0%) |
| 26 to 34 Years | 20 (54.0%) | 17 (46.0%) |
| 35 to 44 Years | 237 (100.0%) | 0 (0.0%) |
| 45 to 54 Years | 48 (100.0%) | 0 (0.0%) |
| 55 to 64 Years | 119 (100.0%) | 0 (0.0%) |
| 65 to 74 Years | 97 (100.0%) | 0 (0.0%) |
| 75 Years and older | 197 (100.0%) | 0 (0.0%) |
| Total | 1,084 (98.5%) | 17 (1.5%) |
Health Insurance Coverage by Citizenship Status in Faxon
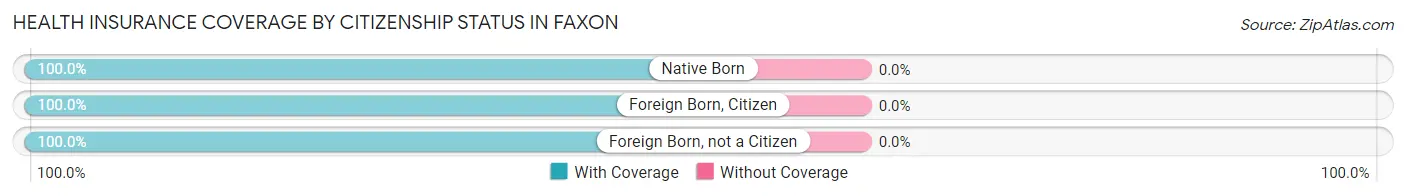
| Citizenship Status | With Coverage | Without Coverage |
| Native Born | 80 (100.0%) | 0 (0.0%) |
| Foreign Born, Citizen | 213 (100.0%) | 0 (0.0%) |
| Foreign Born, not a Citizen | 73 (100.0%) | 0 (0.0%) |
Health Insurance Coverage by Household Income in Faxon
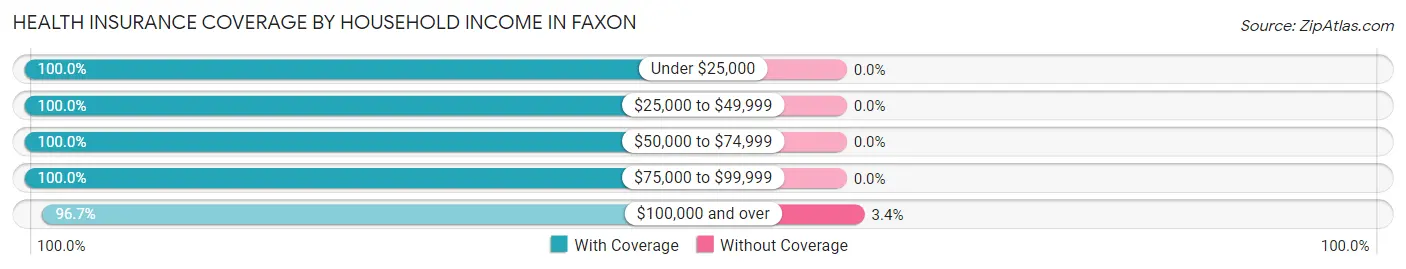
| Household Income | With Coverage | Without Coverage |
| Under $25,000 | 72 (100.0%) | 0 (0.0%) |
| $25,000 to $49,999 | 235 (100.0%) | 0 (0.0%) |
| $50,000 to $74,999 | 12 (100.0%) | 0 (0.0%) |
| $75,000 to $99,999 | 272 (100.0%) | 0 (0.0%) |
| $100,000 and over | 491 (96.7%) | 17 (3.4%) |
Public vs Private Health Insurance Coverage by Age in Faxon
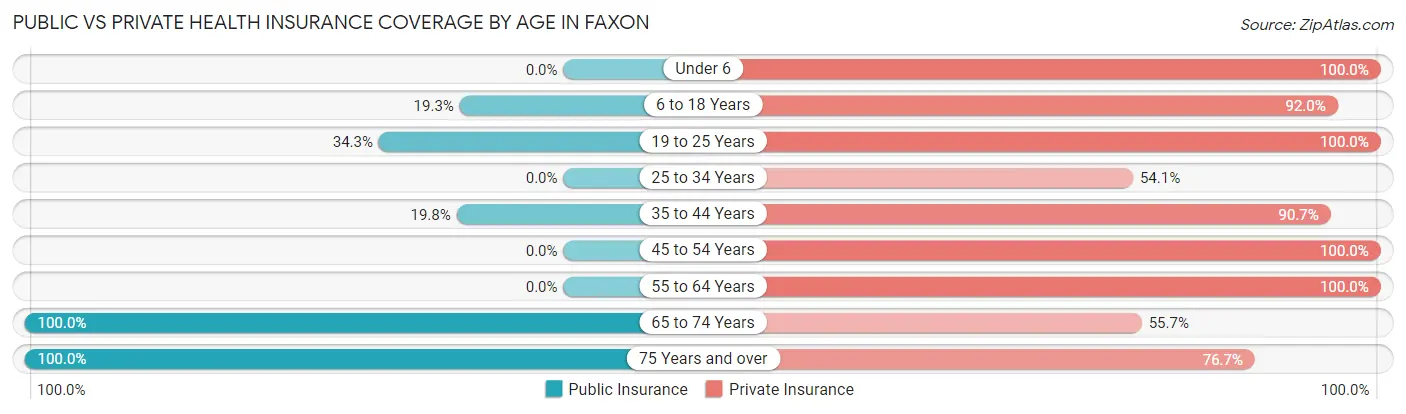
| Age Bracket | Public Insurance | Private Insurance |
| Under 6 | 0 (0.0%) | 80 (100.0%) |
| 6 to 18 Years | 41 (19.3%) | 196 (92.0%) |
| 19 to 25 Years | 25 (34.3%) | 73 (100.0%) |
| 25 to 34 Years | 0 (0.0%) | 20 (54.0%) |
| 35 to 44 Years | 47 (19.8%) | 215 (90.7%) |
| 45 to 54 Years | 0 (0.0%) | 48 (100.0%) |
| 55 to 64 Years | 0 (0.0%) | 119 (100.0%) |
| 65 to 74 Years | 97 (100.0%) | 54 (55.7%) |
| 75 Years and over | 197 (100.0%) | 151 (76.6%) |
| Total | 407 (37.0%) | 956 (86.8%) |
Disability Status by Sex by Age in Faxon
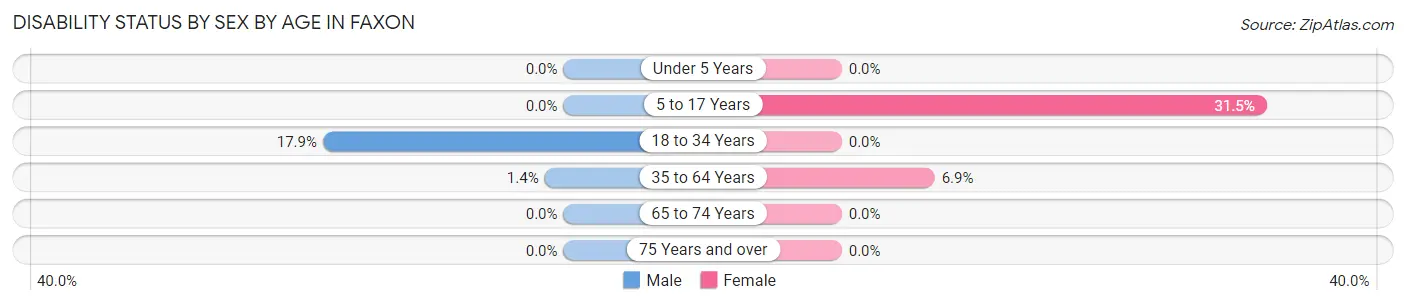
| Age Bracket | Male | Female |
| Under 5 Years | 0 (0.0%) | 0 (0.0%) |
| 5 to 17 Years | 0 (0.0%) | 41 (31.5%) |
| 18 to 34 Years | 10 (17.9%) | 0 (0.0%) |
| 35 to 64 Years | 2 (1.4%) | 18 (6.9%) |
| 65 to 74 Years | 0 (0.0%) | 0 (0.0%) |
| 75 Years and over | 0 (0.0%) | 0 (0.0%) |
Disability Class by Sex by Age in Faxon
Disability Class: Hearing Difficulty
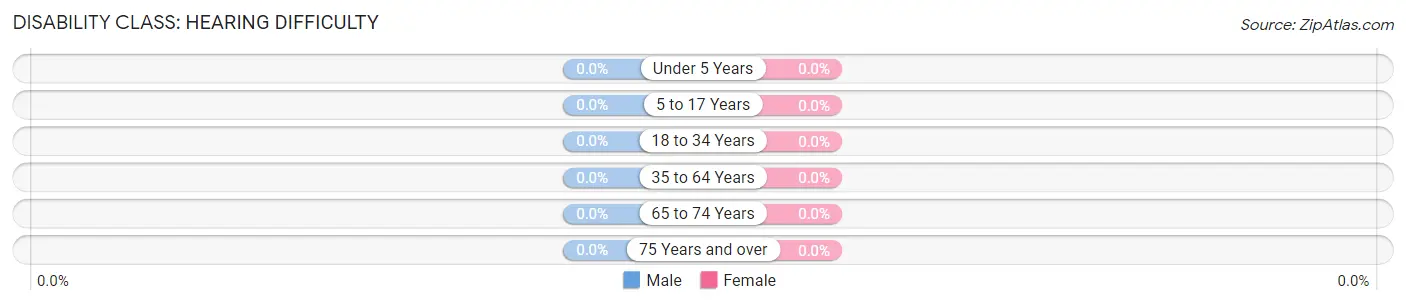
| Age Bracket | Male | Female |
| Under 5 Years | 0 (0.0%) | 0 (0.0%) |
| 5 to 17 Years | 0 (0.0%) | 0 (0.0%) |
| 18 to 34 Years | 0 (0.0%) | 0 (0.0%) |
| 35 to 64 Years | 0 (0.0%) | 0 (0.0%) |
| 65 to 74 Years | 0 (0.0%) | 0 (0.0%) |
| 75 Years and over | 0 (0.0%) | 0 (0.0%) |
Disability Class: Vision Difficulty
| Age Bracket | Male | Female |
| Under 5 Years | 0 (0.0%) | 0 (0.0%) |
| 5 to 17 Years | 0 (0.0%) | 0 (0.0%) |
| 18 to 34 Years | 0 (0.0%) | 0 (0.0%) |
| 35 to 64 Years | 0 (0.0%) | 0 (0.0%) |
| 65 to 74 Years | 0 (0.0%) | 0 (0.0%) |
| 75 Years and over | 0 (0.0%) | 0 (0.0%) |
Disability Class: Cognitive Difficulty
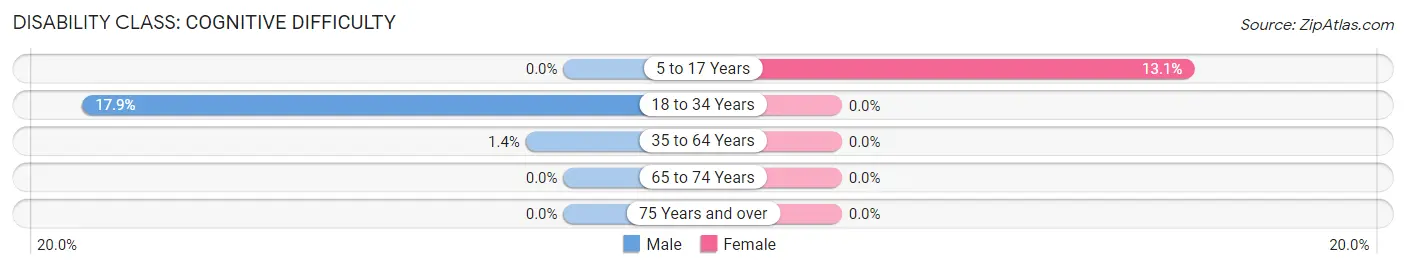
| Age Bracket | Male | Female |
| 5 to 17 Years | 0 (0.0%) | 17 (13.1%) |
| 18 to 34 Years | 10 (17.9%) | 0 (0.0%) |
| 35 to 64 Years | 2 (1.4%) | 0 (0.0%) |
| 65 to 74 Years | 0 (0.0%) | 0 (0.0%) |
| 75 Years and over | 0 (0.0%) | 0 (0.0%) |
Disability Class: Ambulatory Difficulty
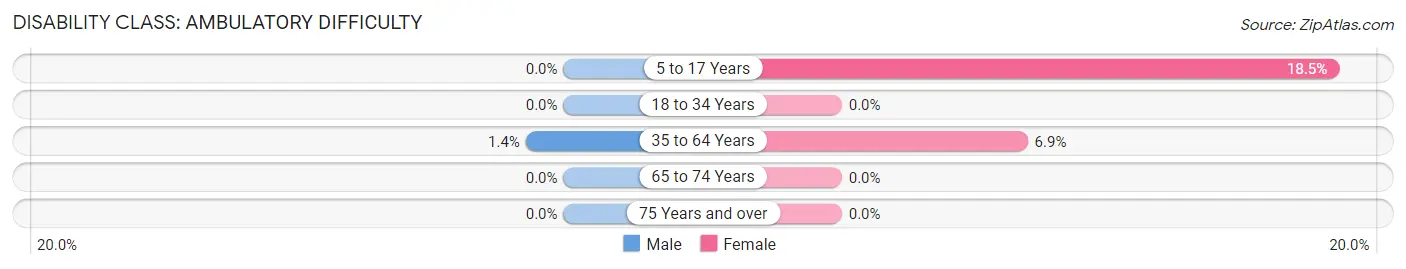
| Age Bracket | Male | Female |
| 5 to 17 Years | 0 (0.0%) | 24 (18.5%) |
| 18 to 34 Years | 0 (0.0%) | 0 (0.0%) |
| 35 to 64 Years | 2 (1.4%) | 18 (6.9%) |
| 65 to 74 Years | 0 (0.0%) | 0 (0.0%) |
| 75 Years and over | 0 (0.0%) | 0 (0.0%) |
Disability Class: Self-Care Difficulty
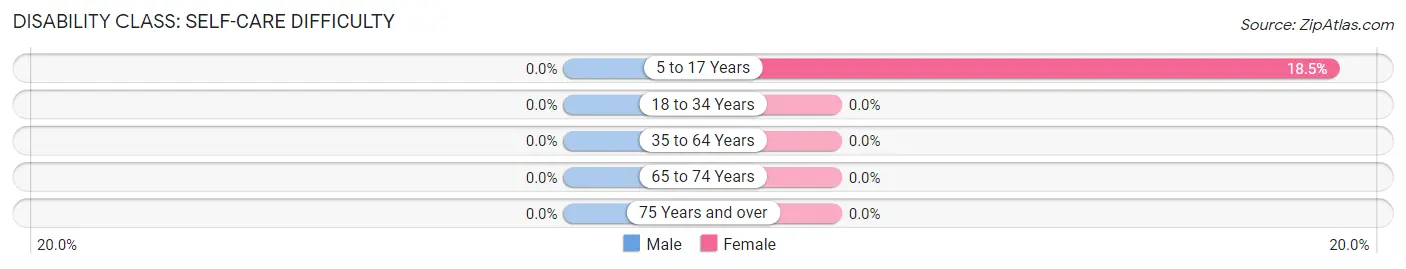
| Age Bracket | Male | Female |
| 5 to 17 Years | 0 (0.0%) | 24 (18.5%) |
| 18 to 34 Years | 0 (0.0%) | 0 (0.0%) |
| 35 to 64 Years | 0 (0.0%) | 0 (0.0%) |
| 65 to 74 Years | 0 (0.0%) | 0 (0.0%) |
| 75 Years and over | 0 (0.0%) | 0 (0.0%) |
Technology Access in Faxon
Computing Device Access in Faxon
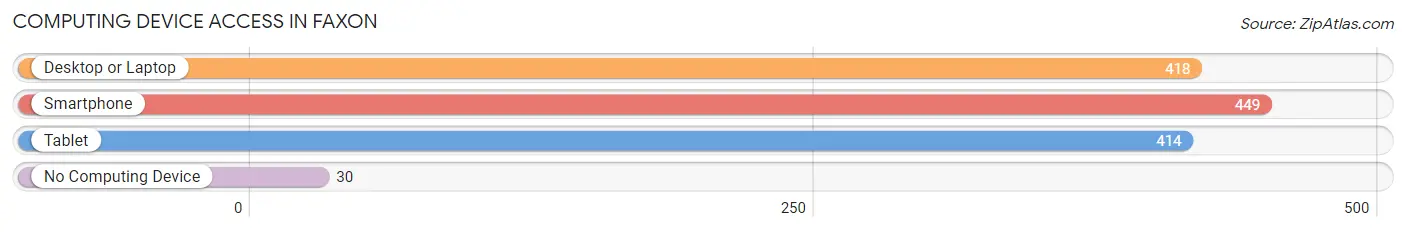
| Device Type | # Households | % Households |
| Desktop or Laptop | 418 | 87.3% |
| Smartphone | 449 | 93.7% |
| Tablet | 414 | 86.4% |
| No Computing Device | 30 | 6.3% |
| Total | 479 | 100.0% |
Internet Access in Faxon
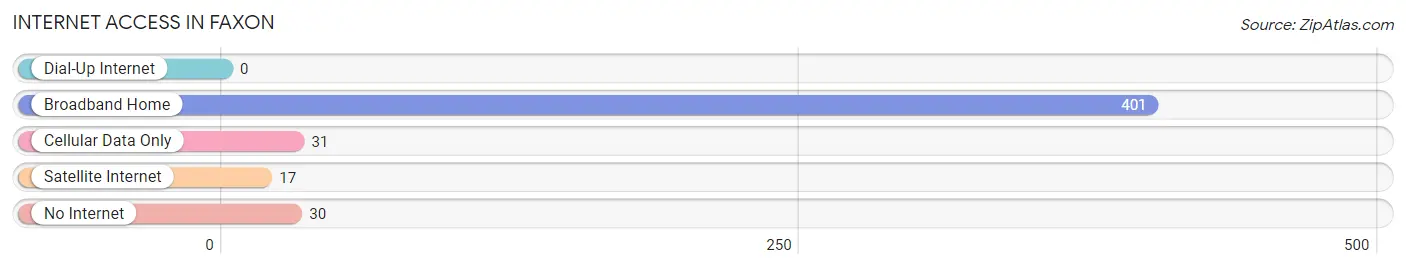
| Internet Type | # Households | % Households |
| Dial-Up Internet | 0 | 0.0% |
| Broadband Home | 401 | 83.7% |
| Cellular Data Only | 31 | 6.5% |
| Satellite Internet | 17 | 3.5% |
| No Internet | 30 | 6.3% |
| Total | 479 | 100.0% |
Faxon Summary
History
The small town of Taxon, Pennsylvania is located in the southeastern corner of the state, in the heart of the Susquehanna Valley. The town was founded in 1790 by a group of settlers from the nearby town of Lancaster. The settlers were looking for a place to settle and start a new life, and Taxon was the perfect spot. The town was named after the Taxon Creek, which runs through the area.
The town was originally a farming community, and the settlers quickly established a thriving agricultural economy. The town was also known for its iron ore deposits, which were mined and used to make tools and weapons. The town also had a thriving lumber industry, and the surrounding forests provided the town with an abundance of timber.
In the late 19th century, Taxon began to experience a period of growth and prosperity. The town was connected to the rest of the state by the Pennsylvania Railroad, and the town's population began to grow. The town also became a popular tourist destination, as visitors flocked to the area to enjoy the scenic beauty of the Susquehanna Valley.
In the early 20th century, Taxon experienced a period of decline. The railroad was replaced by the automobile, and the town's population began to decline. The town's economy also suffered, as the iron ore deposits were depleted and the lumber industry began to decline.
Geography
Taxon is located in the southeastern corner of Pennsylvania, in the heart of the Susquehanna Valley. The town is situated on the banks of the Taxon Creek, which runs through the area. The town is surrounded by rolling hills and lush forests, and the area is known for its scenic beauty.
The town is located approximately 30 miles from the state capital of Harrisburg, and is within easy driving distance of Philadelphia and Baltimore. The town is also close to the Susquehanna River, which provides a variety of recreational activities.
Economy
Taxon's economy is largely based on agriculture and tourism. The town is home to several farms, which produce a variety of crops, including corn, soybeans, wheat, and hay. The town is also home to several wineries, which produce a variety of wines.
The town is also a popular tourist destination, as visitors flock to the area to enjoy the scenic beauty of the Susquehanna Valley. The town is home to several bed and breakfasts, as well as a variety of restaurants and shops. The town is also home to several historic sites, including the Taxon Historic District, which is listed on the National Register of Historic Places.
Demographics
As of the 2010 census, the population of Taxon was 1,845. The town has a median household income of $45,000, and the median age is 43. The town is predominantly white, with a small percentage of African Americans and Hispanics. The town is also home to a small Amish community.
Taxon is a small town with a rich history and a vibrant economy. The town is home to a variety of businesses, and the town's economy is largely based on agriculture and tourism. The town is also home to a variety of historic sites, and the town's scenic beauty makes it a popular tourist destination.
Common Questions
What is Per Capita Income in Faxon?
Per Capita income in Faxon is $33,412.
What is the Median Family Income in Faxon?
Median Family Income in Faxon is $81,081.
What is the Median Household income in Faxon?
Median Household Income in Faxon is $80,148.
What is Income or Wage Gap in Faxon?
Income or Wage Gap in Faxon is 38.0%.
Women in Faxon earn 62.0 cents for every dollar earned by a man.
What is Inequality or Gini Index in Faxon?
Inequality or Gini Index in Faxon is 0.32.
What is the Total Population of Faxon?
Total Population of Faxon is 1,101.
What is the Total Male Population of Faxon?
Total Male Population of Faxon is 475.
What is the Total Female Population of Faxon?
Total Female Population of Faxon is 626.
What is the Ratio of Males per 100 Females in Faxon?
There are 75.88 Males per 100 Females in Faxon.
What is the Ratio of Females per 100 Males in Faxon?
There are 131.79 Females per 100 Males in Faxon.
What is the Median Population Age in Faxon?
Median Population Age in Faxon is 41.3 Years.
What is the Average Family Size in Faxon
Average Family Size in Faxon is 2.5 People.
What is the Average Household Size in Faxon
Average Household Size in Faxon is 2.3 People.
How Large is the Labor Force in Faxon?
There are 487 People in the Labor Forcein in Faxon.
What is the Percentage of People in the Labor Force in Faxon?
58.5% of People are in the Labor Force in Faxon.