Driftwood borough, PA Map & Demographics
Driftwood borough Overview
$19,951
PER CAPITA INCOME
$30,625
AVG FAMILY INCOME
$24,167
AVG HOUSEHOLD INCOME
0.29
INEQUALITY / GINI INDEX
35
TOTAL POPULATION
21
MALE POPULATION
14
FEMALE POPULATION
150.00
MALES / 100 FEMALES
66.67
FEMALES / 100 MALES
65.3
MEDIAN AGE
1.8
AVG FAMILY SIZE
1.5
AVG HOUSEHOLD SIZE
6
LABOR FORCE [ PEOPLE ]
17.1%
PERCENT IN LABOR FORCE
Income in Driftwood borough
Income Overview in Driftwood borough
Per Capita Income in Driftwood borough is $19,951, while median incomes of families and households are $30,625 and $24,167 respectively.
| Characteristic | Number | Measure |
| Per Capita Income | 35 | $19,951 |
| Median Family Income | 14 | $30,625 |
| Mean Family Income | 14 | $31,143 |
| Median Household Income | 24 | $24,167 |
| Mean Household Income | 24 | $30,967 |
| Income Deficit | 14 | $0 |
| Wage / Income Gap (%) | 35 | 0.00% |
| Wage / Income Gap ($) | 35 | 100.00¢ per $1 |
| Gini / Inequality Index | 35 | 0.29 |
Earnings by Sex in Driftwood borough
| Sex | Number | Average Earnings |
| Male | 6 (100.0%) | $0 |
| Female | 0 (0.0%) | $0 |
| Total | 6 (100.0%) | $0 |
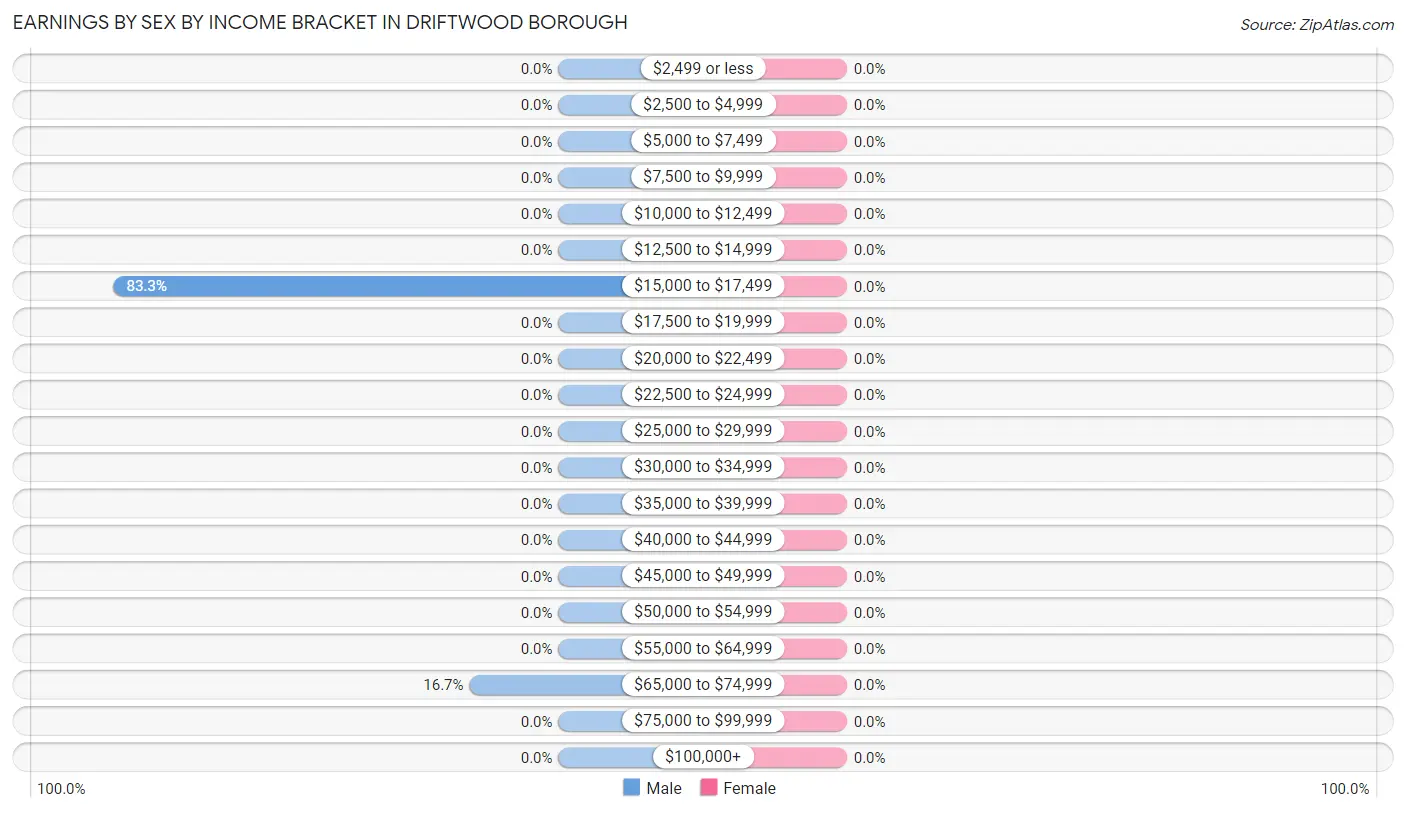
Earnings by Sex by Income Bracket in Driftwood borough
| Income | Male | Female |
| $2,499 or less | 0 (0.0%) | 0 (0.0%) |
| $2,500 to $4,999 | 0 (0.0%) | 0 (0.0%) |
| $5,000 to $7,499 | 0 (0.0%) | 0 (0.0%) |
| $7,500 to $9,999 | 0 (0.0%) | 0 (0.0%) |
| $10,000 to $12,499 | 0 (0.0%) | 0 (0.0%) |
| $12,500 to $14,999 | 0 (0.0%) | 0 (0.0%) |
| $15,000 to $17,499 | 5 (83.3%) | 0 (0.0%) |
| $17,500 to $19,999 | 0 (0.0%) | 0 (0.0%) |
| $20,000 to $22,499 | 0 (0.0%) | 0 (0.0%) |
| $22,500 to $24,999 | 0 (0.0%) | 0 (0.0%) |
| $25,000 to $29,999 | 0 (0.0%) | 0 (0.0%) |
| $30,000 to $34,999 | 0 (0.0%) | 0 (0.0%) |
| $35,000 to $39,999 | 0 (0.0%) | 0 (0.0%) |
| $40,000 to $44,999 | 0 (0.0%) | 0 (0.0%) |
| $45,000 to $49,999 | 0 (0.0%) | 0 (0.0%) |
| $50,000 to $54,999 | 0 (0.0%) | 0 (0.0%) |
| $55,000 to $64,999 | 0 (0.0%) | 0 (0.0%) |
| $65,000 to $74,999 | 1 (16.7%) | 0 (0.0%) |
| $75,000 to $99,999 | 0 (0.0%) | 0 (0.0%) |
| $100,000+ | 0 (0.0%) | 0 (0.0%) |
| Total | 6 (100.0%) | 0 (0.0%) |
Earnings by Sex by Educational Attainment in Driftwood borough
| Educational Attainment | Male Income | Female Income |
| Less than High School | - | - |
| High School Diploma | - | - |
| College or Associate's Degree | - | - |
| Bachelor's Degree | - | - |
| Graduate Degree | - | - |
| Total | - | - |
Family Income in Driftwood borough
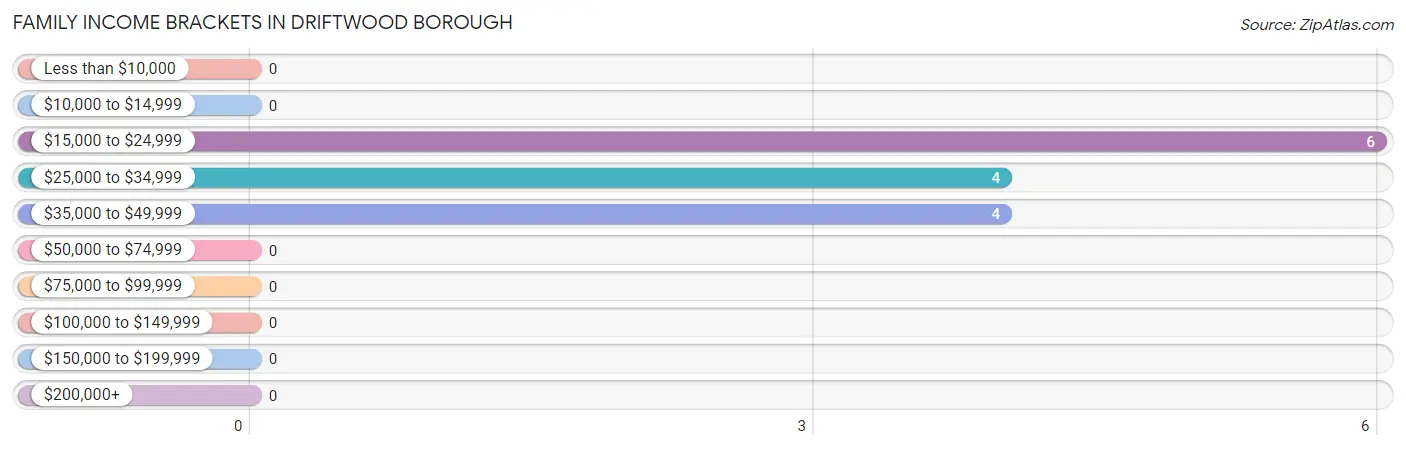
Family Income Brackets in Driftwood borough
According to the Driftwood borough family income data, there are 6 families falling into the $15,000 to $24,999 income range, which is the most common income bracket and makes up 42.9% of all families.
| Income Bracket | # Families | % Families |
| Less than $10,000 | 0 | 0.0% |
| $10,000 to $14,999 | 0 | 0.0% |
| $15,000 to $24,999 | 6 | 42.9% |
| $25,000 to $34,999 | 4 | 28.6% |
| $35,000 to $49,999 | 4 | 28.6% |
| $50,000 to $74,999 | 0 | 0.0% |
| $75,000 to $99,999 | 0 | 0.0% |
| $100,000 to $149,999 | 0 | 0.0% |
| $150,000 to $199,999 | 0 | 0.0% |
| $200,000+ | 0 | 0.0% |
Family Income by Famaliy Size in Driftwood borough
2-person families (14 | 100.0%) account for the highest median family income in Driftwood borough with $30,625 per family, while 2-person families (14 | 100.0%) have the highest median income of $15,312 per family member.
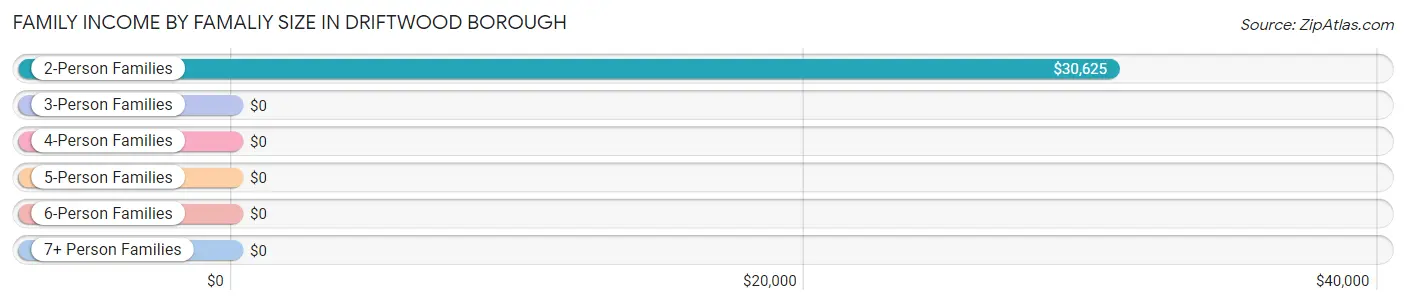
| Income Bracket | # Families | Median Income |
| 2-Person Families | 14 (100.0%) | $30,625 |
| 3-Person Families | 0 (0.0%) | $0 |
| 4-Person Families | 0 (0.0%) | $0 |
| 5-Person Families | 0 (0.0%) | $0 |
| 6-Person Families | 0 (0.0%) | $0 |
| 7+ Person Families | 0 (0.0%) | $0 |
| Total | 14 (100.0%) | $30,625 |
Family Income by Number of Earners in Driftwood borough
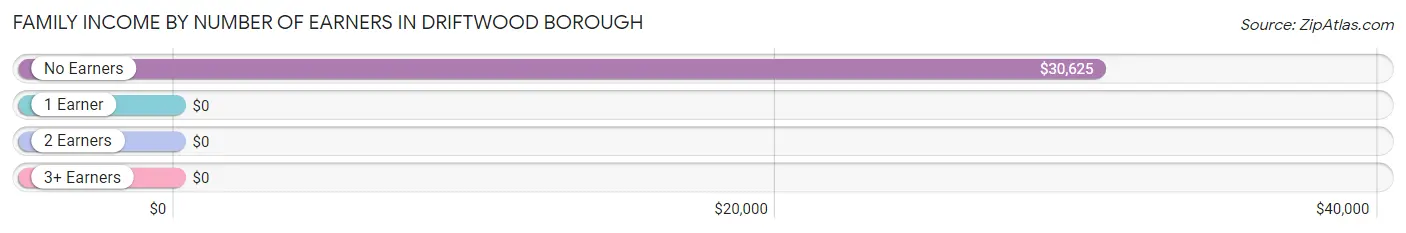
| Number of Earners | # Families | Median Income |
| No Earners | 14 (100.0%) | $30,625 |
| 1 Earner | 0 (0.0%) | $0 |
| 2 Earners | 0 (0.0%) | $0 |
| 3+ Earners | 0 (0.0%) | $0 |
| Total | 14 (100.0%) | $30,625 |
Household Income in Driftwood borough
Household Income Brackets in Driftwood borough
With 13 households falling in the category, the $15,000 to $24,999 income range is the most frequent in Driftwood borough, accounting for 54.2% of all households.
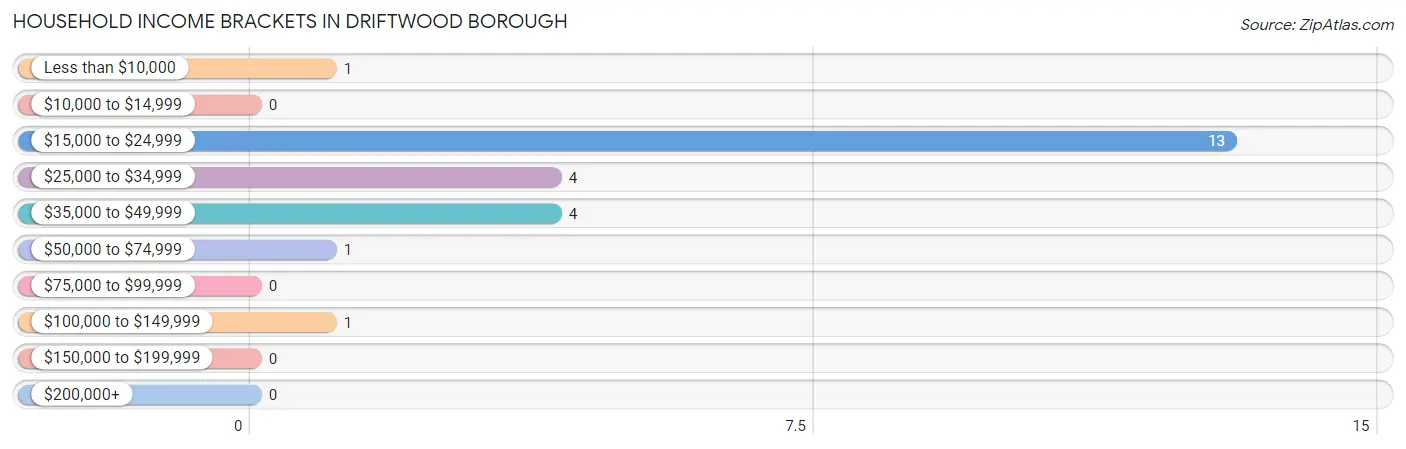
| Income Bracket | # Households | % Households |
| Less than $10,000 | 1 | 4.2% |
| $10,000 to $14,999 | 0 | 0.0% |
| $15,000 to $24,999 | 13 | 54.2% |
| $25,000 to $34,999 | 4 | 16.7% |
| $35,000 to $49,999 | 4 | 16.7% |
| $50,000 to $74,999 | 1 | 4.2% |
| $75,000 to $99,999 | 0 | 0.0% |
| $100,000 to $149,999 | 1 | 4.2% |
| $150,000 to $199,999 | 0 | 0.0% |
| $200,000+ | 0 | 0.0% |
Household Income by Householder Age in Driftwood borough
The median household income in Driftwood borough is $24,167, with the highest median household income of $30,313 found in the 65+ years age bracket for the primary householder. A total of 17 households (70.8%) fall into this category.
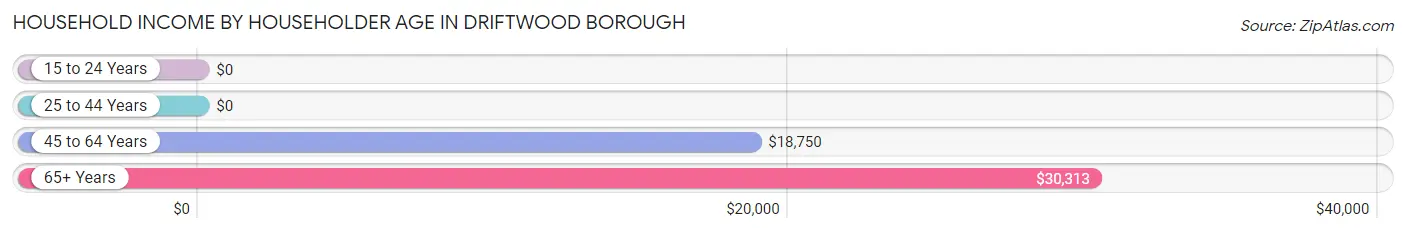
| Income Bracket | # Households | Median Income |
| 15 to 24 Years | 0 (0.0%) | $0 |
| 25 to 44 Years | 0 (0.0%) | $0 |
| 45 to 64 Years | 7 (29.2%) | $18,750 |
| 65+ Years | 17 (70.8%) | $30,313 |
| Total | 24 (100.0%) | $24,167 |
Poverty in Driftwood borough
Income Below Poverty by Sex and Age in Driftwood borough
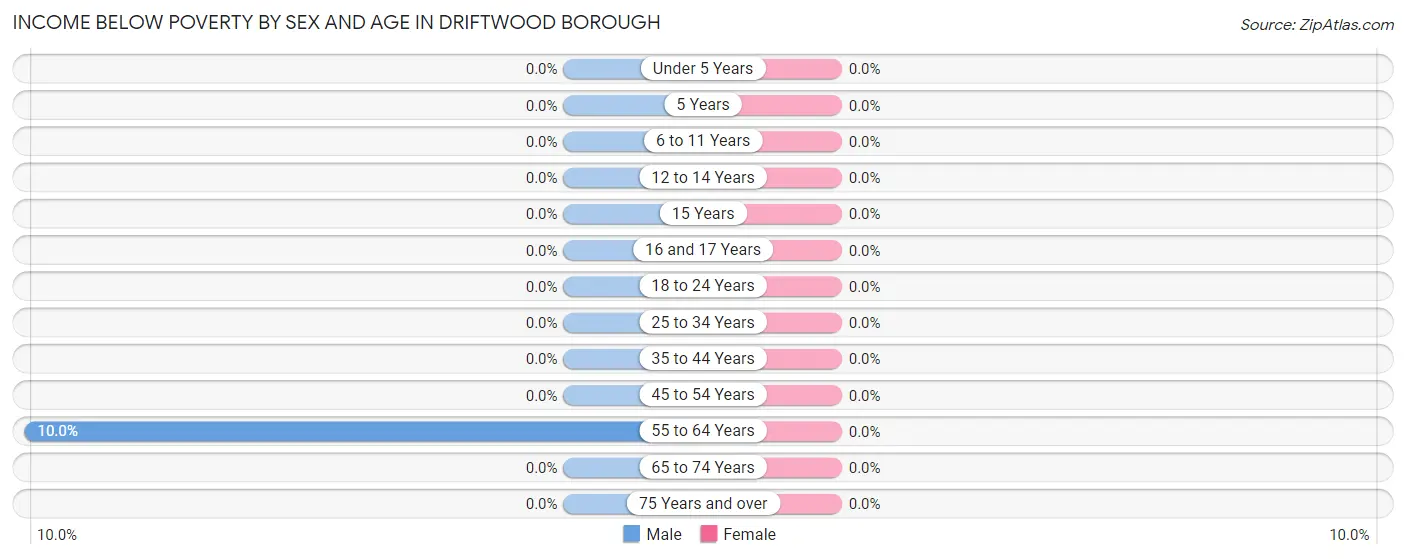
| Age Bracket | Male | Female |
| Under 5 Years | 0 (0.0%) | 0 (0.0%) |
| 5 Years | 0 (0.0%) | 0 (0.0%) |
| 6 to 11 Years | 0 (0.0%) | 0 (0.0%) |
| 12 to 14 Years | 0 (0.0%) | 0 (0.0%) |
| 15 Years | 0 (0.0%) | 0 (0.0%) |
| 16 and 17 Years | 0 (0.0%) | 0 (0.0%) |
| 18 to 24 Years | 0 (0.0%) | 0 (0.0%) |
| 25 to 34 Years | 0 (0.0%) | 0 (0.0%) |
| 35 to 44 Years | 0 (0.0%) | 0 (0.0%) |
| 45 to 54 Years | 0 (0.0%) | 0 (0.0%) |
| 55 to 64 Years | 1 (10.0%) | 0 (0.0%) |
| 65 to 74 Years | 0 (0.0%) | 0 (0.0%) |
| 75 Years and over | 0 (0.0%) | 0 (0.0%) |
| Total | 1 (4.8%) | 0 (0.0%) |
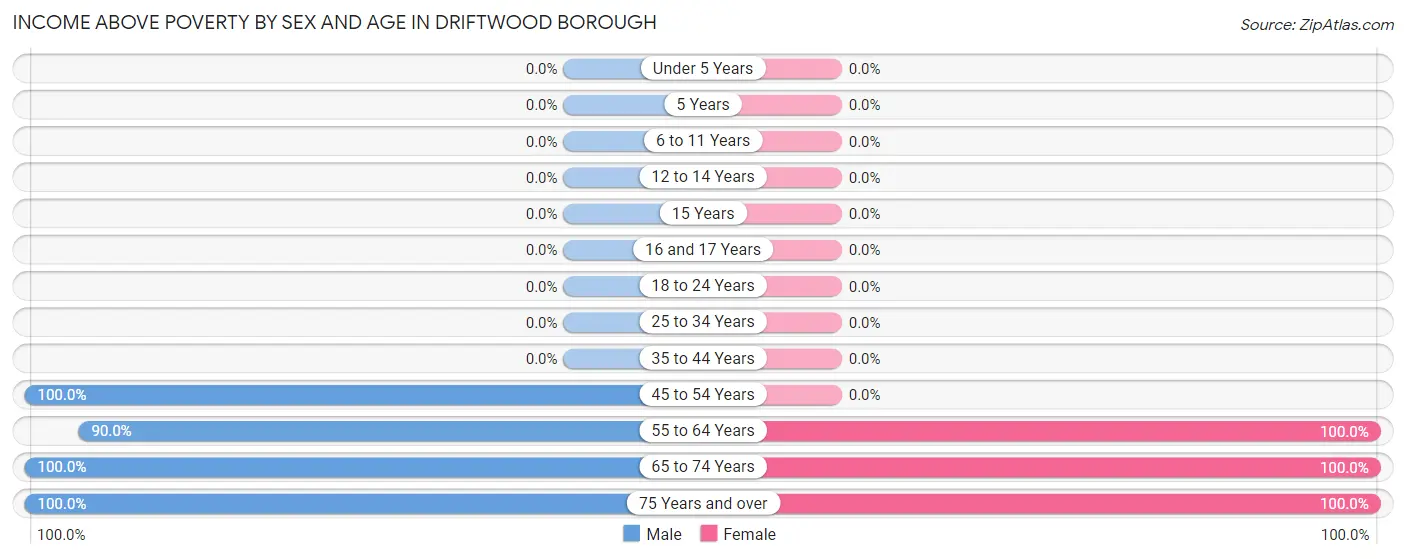
Income Above Poverty by Sex and Age in Driftwood borough
According to the poverty statistics in Driftwood borough, males aged 45 to 54 years and females aged 55 to 64 years are the age groups that are most secure financially, with 100.0% of males and 100.0% of females in these age groups living above the poverty line.
| Age Bracket | Male | Female |
| Under 5 Years | 0 (0.0%) | 0 (0.0%) |
| 5 Years | 0 (0.0%) | 0 (0.0%) |
| 6 to 11 Years | 0 (0.0%) | 0 (0.0%) |
| 12 to 14 Years | 0 (0.0%) | 0 (0.0%) |
| 15 Years | 0 (0.0%) | 0 (0.0%) |
| 16 and 17 Years | 0 (0.0%) | 0 (0.0%) |
| 18 to 24 Years | 0 (0.0%) | 0 (0.0%) |
| 25 to 34 Years | 0 (0.0%) | 0 (0.0%) |
| 35 to 44 Years | 0 (0.0%) | 0 (0.0%) |
| 45 to 54 Years | 1 (100.0%) | 0 (0.0%) |
| 55 to 64 Years | 9 (90.0%) | 5 (100.0%) |
| 65 to 74 Years | 7 (100.0%) | 2 (100.0%) |
| 75 Years and over | 3 (100.0%) | 7 (100.0%) |
| Total | 20 (95.2%) | 14 (100.0%) |
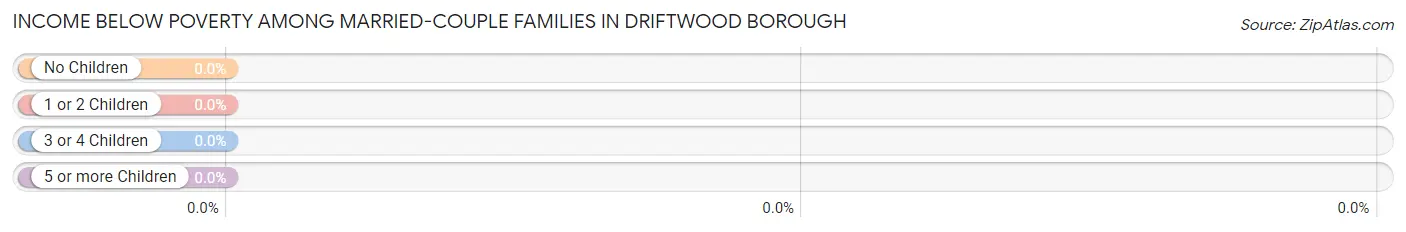
Income Below Poverty Among Married-Couple Families in Driftwood borough
| Children | Above Poverty | Below Poverty |
| No Children | 10 (100.0%) | 0 (0.0%) |
| 1 or 2 Children | 0 (0.0%) | 0 (0.0%) |
| 3 or 4 Children | 0 (0.0%) | 0 (0.0%) |
| 5 or more Children | 0 (0.0%) | 0 (0.0%) |
| Total | 10 (100.0%) | 0 (0.0%) |
Income Below Poverty Among Single-Parent Households in Driftwood borough
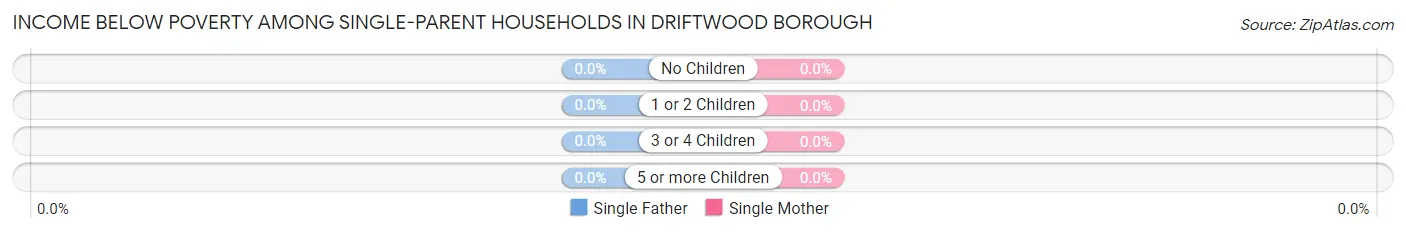
| Children | Single Father | Single Mother |
| No Children | 0 (0.0%) | 0 (0.0%) |
| 1 or 2 Children | 0 (0.0%) | 0 (0.0%) |
| 3 or 4 Children | 0 (0.0%) | 0 (0.0%) |
| 5 or more Children | 0 (0.0%) | 0 (0.0%) |
| Total | 0 (0.0%) | 0 (0.0%) |
Income Below Poverty Among Married-Couple vs Single-Parent Households in Driftwood borough
| Children | Married-Couple Families | Single-Parent Households |
| No Children | 0 (0.0%) | 0 (0.0%) |
| 1 or 2 Children | 0 (0.0%) | 0 (0.0%) |
| 3 or 4 Children | 0 (0.0%) | 0 (0.0%) |
| 5 or more Children | 0 (0.0%) | 0 (0.0%) |
| Total | 0 (0.0%) | 0 (0.0%) |
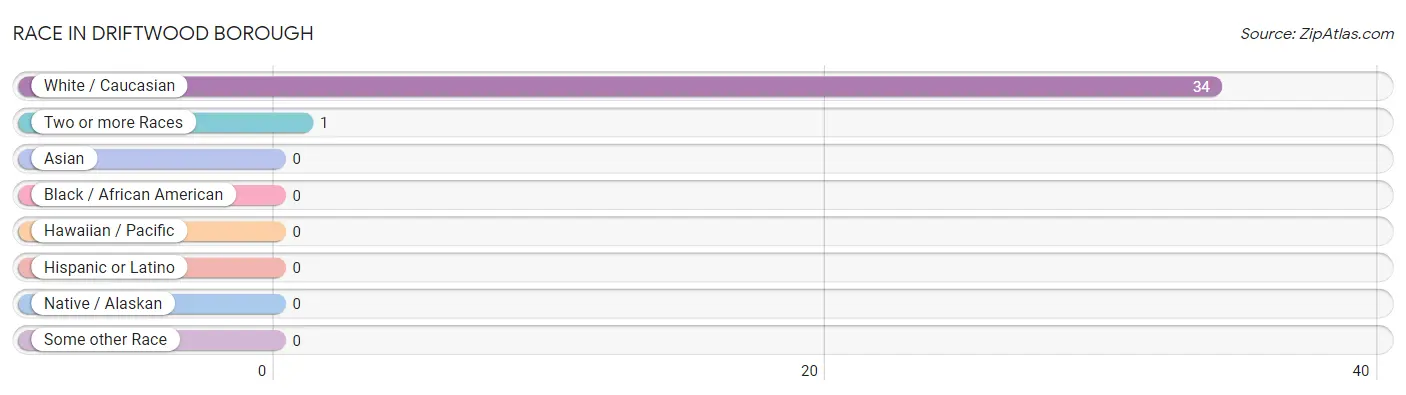
Race in Driftwood borough
The most populous races in Driftwood borough are White / Caucasian (34 | 97.1%), and Two or more Races (1 | 2.9%).
| Race | # Population | % Population |
| Asian | 0 | 0.0% |
| Black / African American | 0 | 0.0% |
| Hawaiian / Pacific | 0 | 0.0% |
| Hispanic or Latino | 0 | 0.0% |
| Native / Alaskan | 0 | 0.0% |
| White / Caucasian | 34 | 97.1% |
| Two or more Races | 1 | 2.9% |
| Some other Race | 0 | 0.0% |
| Total | 35 | 100.0% |
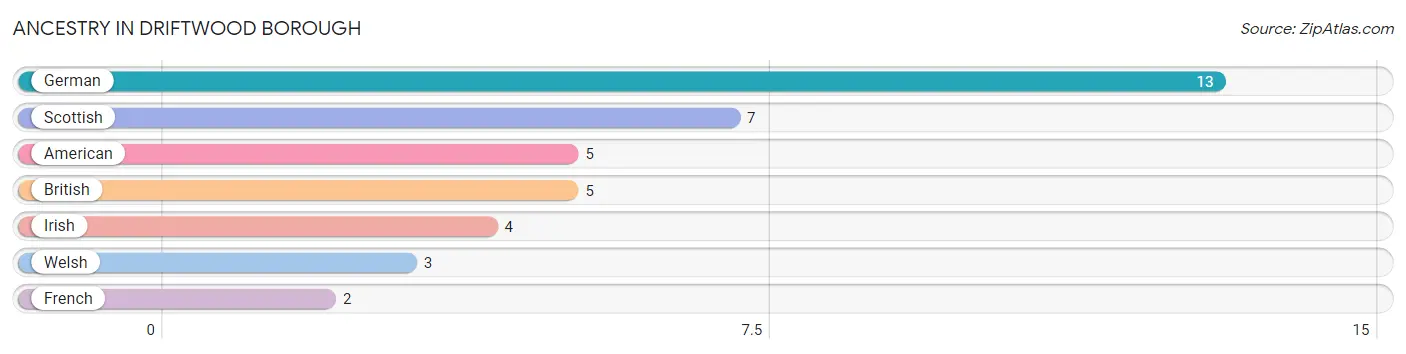
Ancestry in Driftwood borough
The most populous ancestries reported in Driftwood borough are German (13 | 37.1%), Scottish (7 | 20.0%), American (5 | 14.3%), British (5 | 14.3%), and Irish (4 | 11.4%), together accounting for 97.2% of all Driftwood borough residents.
| Ancestry | # Population | % Population |
| American | 5 | 14.3% |
| British | 5 | 14.3% |
| French | 2 | 5.7% |
| German | 13 | 37.1% |
| Irish | 4 | 11.4% |
| Scottish | 7 | 20.0% |
| Welsh | 3 | 8.6% | View All 7 Rows |
Immigrants in Driftwood borough

| Immigration Origin | # Population | % Population | View All 0 Rows |
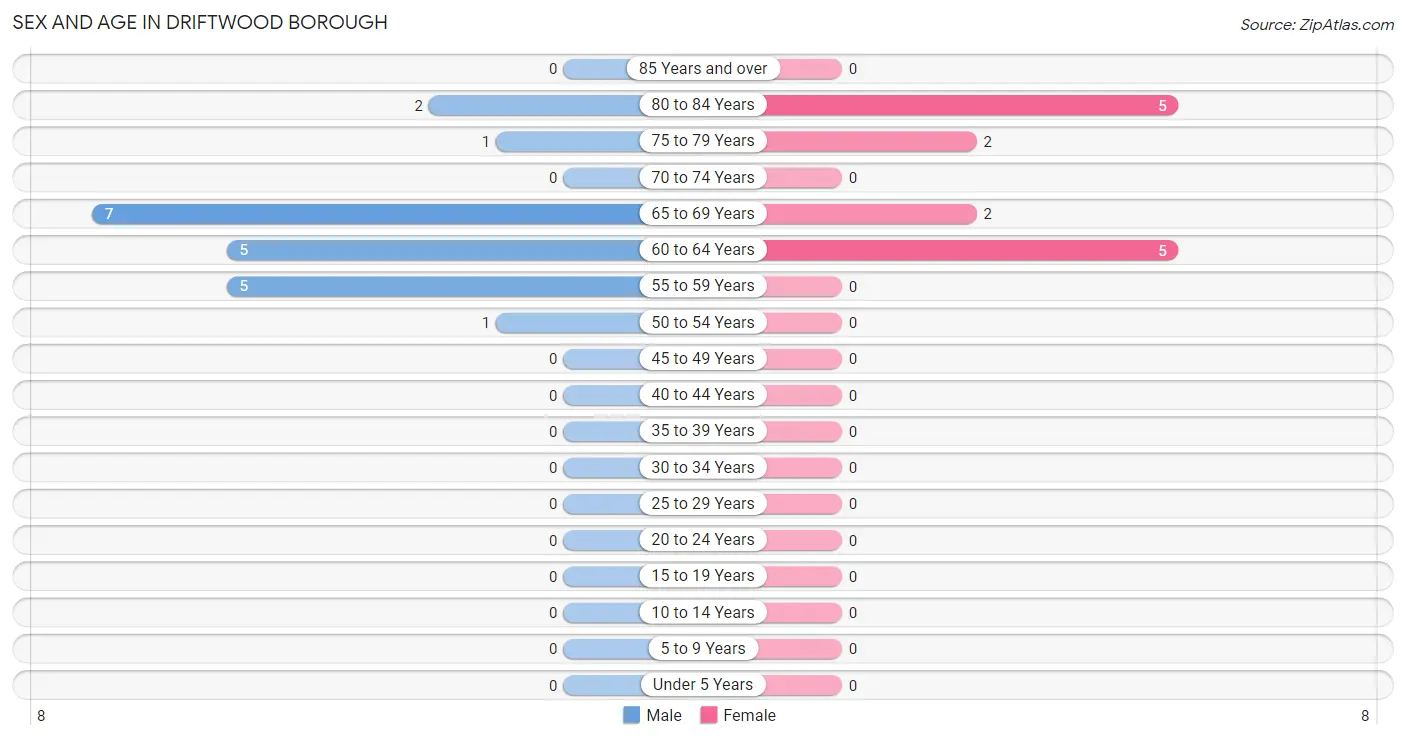
Sex and Age in Driftwood borough
Sex and Age in Driftwood borough
The most populous age groups in Driftwood borough are 65 to 69 Years (7 | 33.3%) for men and 60 to 64 Years (5 | 35.7%) for women.
| Age Bracket | Male | Female |
| Under 5 Years | 0 (0.0%) | 0 (0.0%) |
| 5 to 9 Years | 0 (0.0%) | 0 (0.0%) |
| 10 to 14 Years | 0 (0.0%) | 0 (0.0%) |
| 15 to 19 Years | 0 (0.0%) | 0 (0.0%) |
| 20 to 24 Years | 0 (0.0%) | 0 (0.0%) |
| 25 to 29 Years | 0 (0.0%) | 0 (0.0%) |
| 30 to 34 Years | 0 (0.0%) | 0 (0.0%) |
| 35 to 39 Years | 0 (0.0%) | 0 (0.0%) |
| 40 to 44 Years | 0 (0.0%) | 0 (0.0%) |
| 45 to 49 Years | 0 (0.0%) | 0 (0.0%) |
| 50 to 54 Years | 1 (4.8%) | 0 (0.0%) |
| 55 to 59 Years | 5 (23.8%) | 0 (0.0%) |
| 60 to 64 Years | 5 (23.8%) | 5 (35.7%) |
| 65 to 69 Years | 7 (33.3%) | 2 (14.3%) |
| 70 to 74 Years | 0 (0.0%) | 0 (0.0%) |
| 75 to 79 Years | 1 (4.8%) | 2 (14.3%) |
| 80 to 84 Years | 2 (9.5%) | 5 (35.7%) |
| 85 Years and over | 0 (0.0%) | 0 (0.0%) |
| Total | 21 (100.0%) | 14 (100.0%) |
Families and Households in Driftwood borough
Median Family Size in Driftwood borough
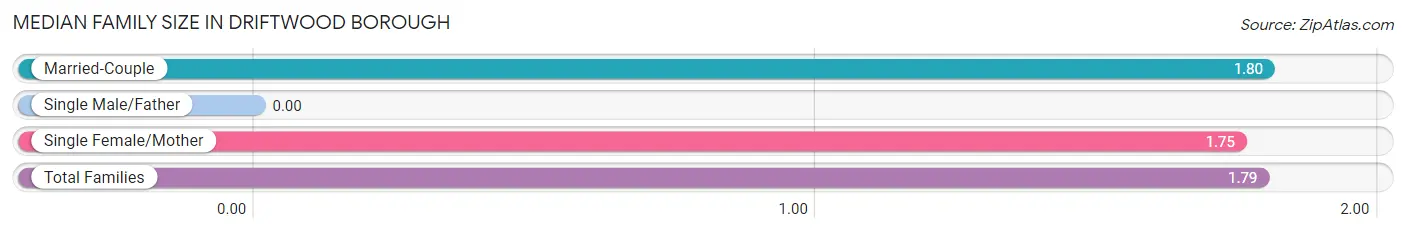
| Family Type | # Families | Family Size |
| Married-Couple | 10 (71.4%) | 1.80 |
| Single Male/Father | 0 (0.0%) | - |
| Single Female/Mother | 4 (28.6%) | 1.75 |
| Total Families | 14 (100.0%) | 1.79 |
Median Household Size in Driftwood borough
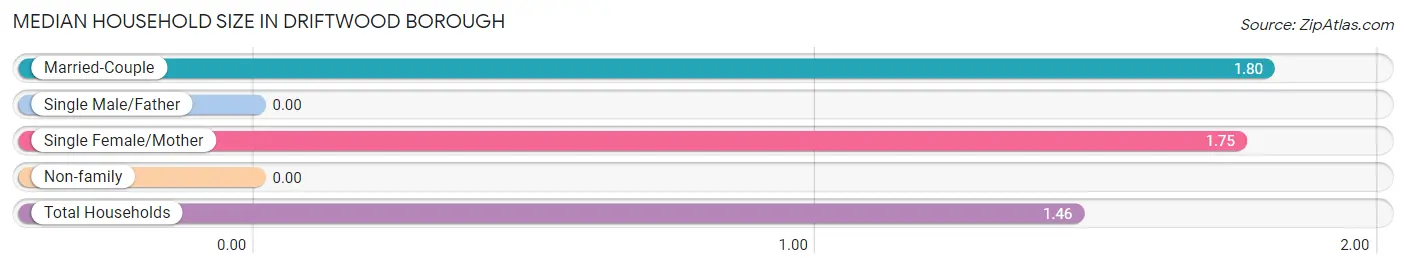
| Household Type | # Households | Household Size |
| Married-Couple | 10 (41.7%) | 1.80 |
| Single Male/Father | 0 (0.0%) | - |
| Single Female/Mother | 4 (16.7%) | 1.75 |
| Non-family | 10 (41.7%) | - |
| Total Households | 24 (100.0%) | 1.46 |
Household Size by Marriage Status in Driftwood borough
Out of a total of 24 households in Driftwood borough, 14 (58.3%) are family households, while 10 (41.7%) are nonfamily households. The most numerous type of family households are 2-person households, comprising 14, and the most common type of nonfamily households are 1-person households, comprising 10.
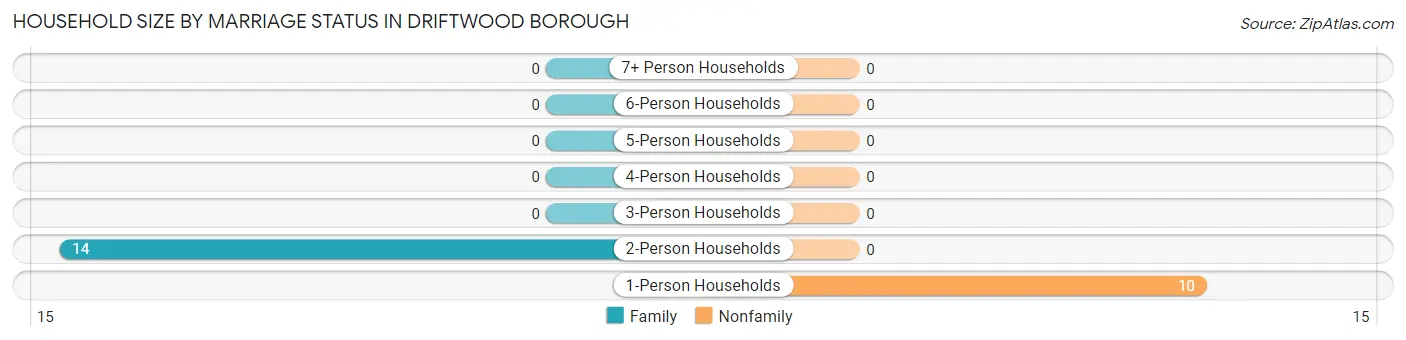
| Household Size | Family Households | Nonfamily Households |
| 1-Person Households | - | 10 (41.7%) |
| 2-Person Households | 14 (58.3%) | 0 (0.0%) |
| 3-Person Households | 0 (0.0%) | 0 (0.0%) |
| 4-Person Households | 0 (0.0%) | 0 (0.0%) |
| 5-Person Households | 0 (0.0%) | 0 (0.0%) |
| 6-Person Households | 0 (0.0%) | 0 (0.0%) |
| 7+ Person Households | 0 (0.0%) | 0 (0.0%) |
| Total | 14 (58.3%) | 10 (41.7%) |
Female Fertility in Driftwood borough
Fertility by Age in Driftwood borough
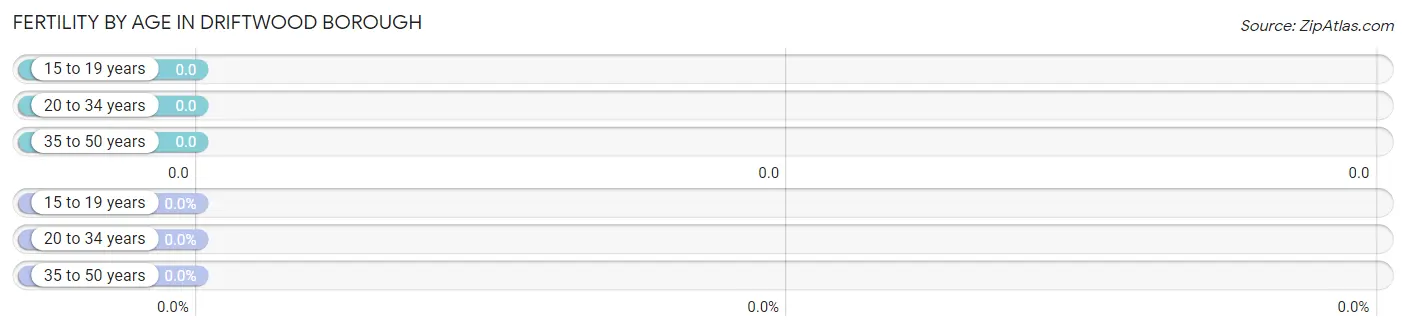
| Age Bracket | Women with Births | Births / 1,000 Women |
| 15 to 19 years | 0 (0.0%) | 0.0 |
| 20 to 34 years | 0 (0.0%) | 0.0 |
| 35 to 50 years | 0 (0.0%) | 0.0 |
| Total | 0 (0.0%) | 0.0 |
Fertility by Age by Marriage Status in Driftwood borough
| Age Bracket | Married | Unmarried |
| 15 to 19 years | 0 (0.0%) | 0 (0.0%) |
| 20 to 34 years | 0 (0.0%) | 0 (0.0%) |
| 35 to 50 years | 0 (0.0%) | 0 (0.0%) |
| Total | 0 (0.0%) | 0 (0.0%) |
Fertility by Education in Driftwood borough
| Educational Attainment | Women with Births | Births / 1,000 Women |
| Less than High School | 0 (0.0%) | 0.0 |
| High School Diploma | 0 (0.0%) | 0.0 |
| College or Associate's Degree | 0 (0.0%) | 0.0 |
| Bachelor's Degree | 0 (0.0%) | 0.0 |
| Graduate Degree | 0 (0.0%) | 0.0 |
| Total | 0 (0.0%) | 0.0 |
Fertility by Education by Marriage Status in Driftwood borough
| Educational Attainment | Married | Unmarried |
| Less than High School | 0 (0.0%) | 0 (0.0%) |
| High School Diploma | 0 (0.0%) | 0 (0.0%) |
| College or Associate's Degree | 0 (0.0%) | 0 (0.0%) |
| Bachelor's Degree | 0 (0.0%) | 0 (0.0%) |
| Graduate Degree | 0 (0.0%) | 0 (0.0%) |
| Total | 0 (0.0%) | 0 (0.0%) |
Employment Characteristics in Driftwood borough
Employment by Class of Employer in Driftwood borough
Among the 1 employed individuals in Driftwood borough, , and private company employees (1 | 100.0%) make up the most common classes of employment.
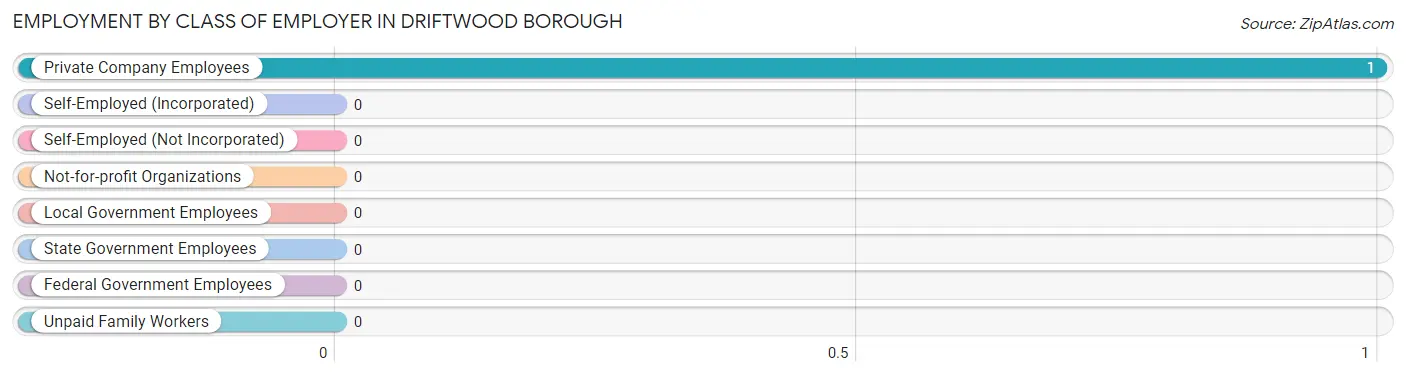
| Employer Class | # Employees | % Employees |
| Private Company Employees | 1 | 100.0% |
| Self-Employed (Incorporated) | 0 | 0.0% |
| Self-Employed (Not Incorporated) | 0 | 0.0% |
| Not-for-profit Organizations | 0 | 0.0% |
| Local Government Employees | 0 | 0.0% |
| State Government Employees | 0 | 0.0% |
| Federal Government Employees | 0 | 0.0% |
| Unpaid Family Workers | 0 | 0.0% |
| Total | 1 | 100.0% |
Employment Status by Age in Driftwood borough
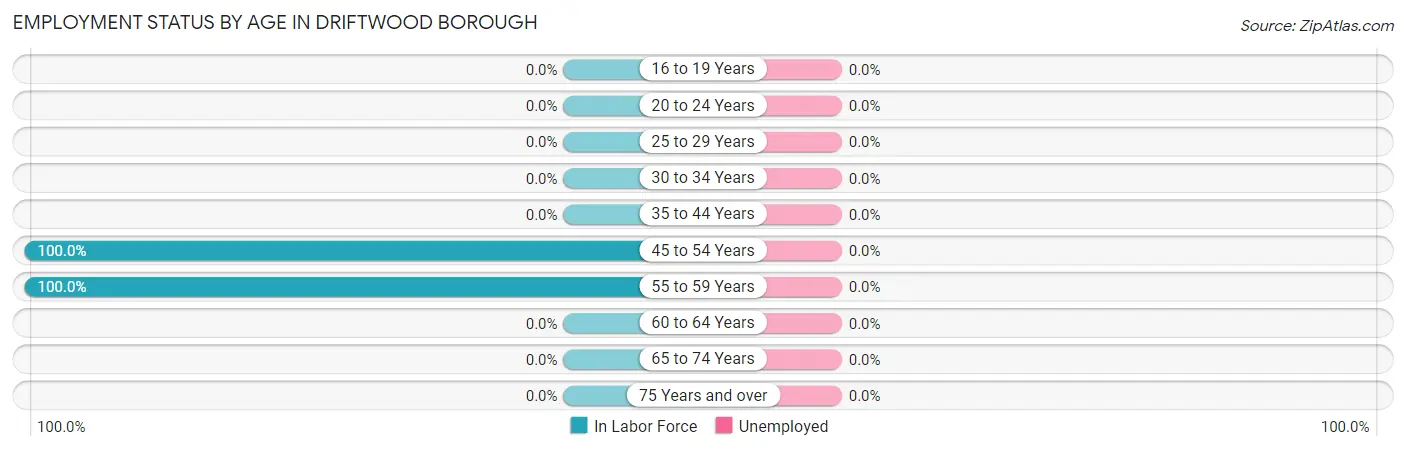
| Age Bracket | In Labor Force | Unemployed |
| 16 to 19 Years | 0 (0.0%) | 0 (0.0%) |
| 20 to 24 Years | 0 (0.0%) | 0 (0.0%) |
| 25 to 29 Years | 0 (0.0%) | 0 (0.0%) |
| 30 to 34 Years | 0 (0.0%) | 0 (0.0%) |
| 35 to 44 Years | 0 (0.0%) | 0 (0.0%) |
| 45 to 54 Years | 1 (100.0%) | 0 (0.0%) |
| 55 to 59 Years | 5 (100.0%) | 0 (0.0%) |
| 60 to 64 Years | 0 (0.0%) | 0 (0.0%) |
| 65 to 74 Years | 0 (0.0%) | 0 (0.0%) |
| 75 Years and over | 0 (0.0%) | 0 (0.0%) |
| Total | 6 (17.1%) | 0 (0.0%) |
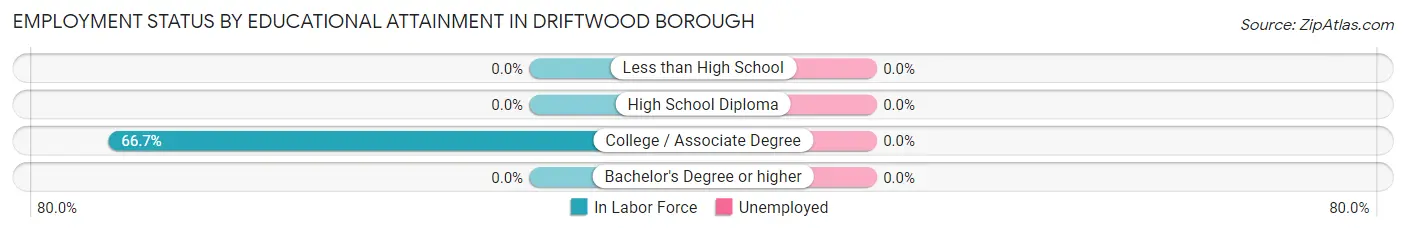
Employment Status by Educational Attainment in Driftwood borough
| Educational Attainment | In Labor Force | Unemployed |
| Less than High School | 0 (0.0%) | 0 (0.0%) |
| High School Diploma | 0 (0.0%) | 0 (0.0%) |
| College / Associate Degree | 6 (66.7%) | 0 (0.0%) |
| Bachelor's Degree or higher | 0 (0.0%) | 0 (0.0%) |
| Total | 6 (37.5%) | 0 (0.0%) |
Employment Occupations by Sex in Driftwood borough
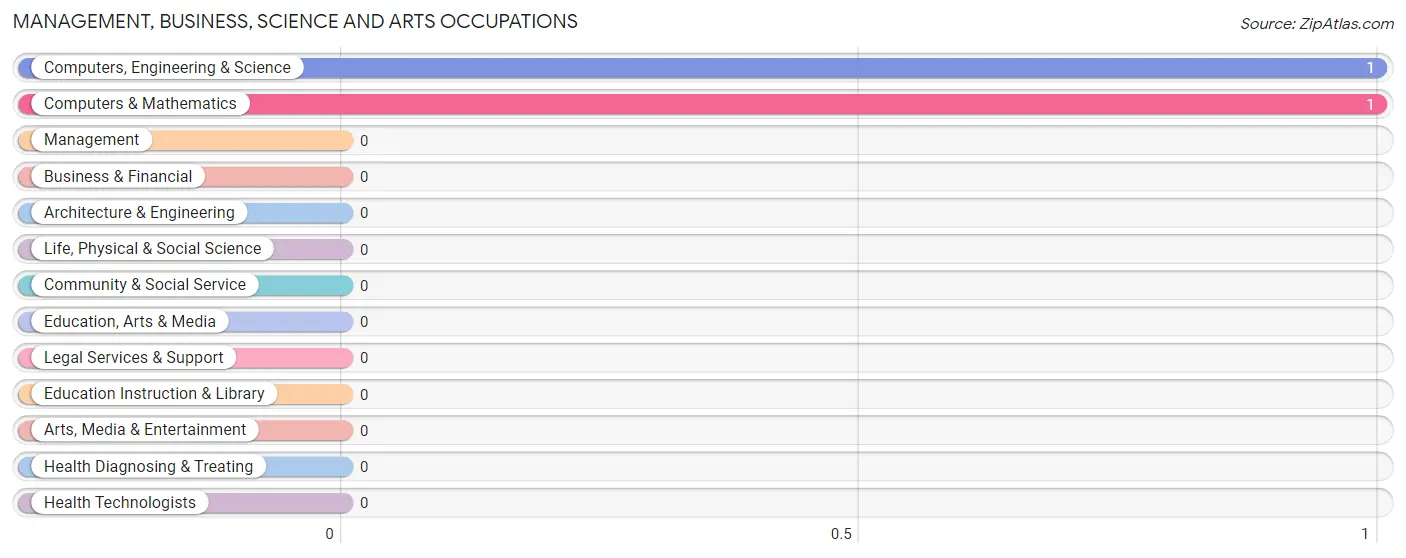
Management, Business, Science and Arts Occupations
The most common Management, Business, Science and Arts occupations in Driftwood borough are Computers, Engineering & Science (1 | 16.7%), and Computers & Mathematics (1 | 16.7%).
Management, Business, Science and Arts Occupations by Sex
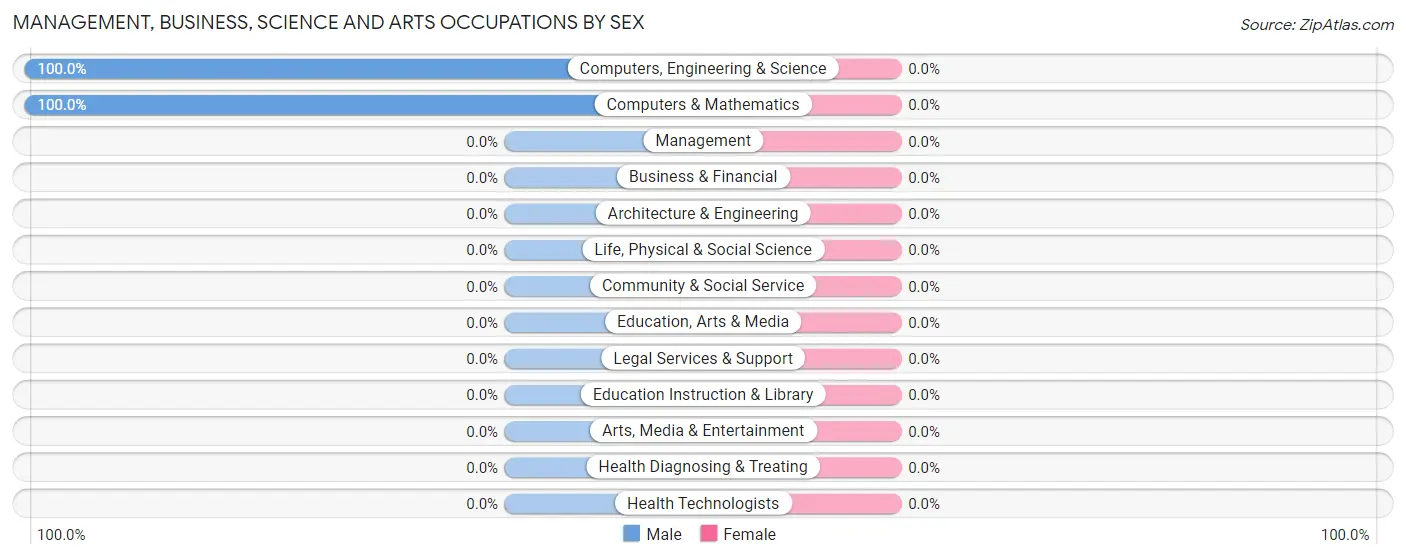
| Occupation | Male | Female |
| Management | 0 (0.0%) | 0 (0.0%) |
| Business & Financial | 0 (0.0%) | 0 (0.0%) |
| Computers, Engineering & Science | 1 (100.0%) | 0 (0.0%) |
| Computers & Mathematics | 1 (100.0%) | 0 (0.0%) |
| Architecture & Engineering | 0 (0.0%) | 0 (0.0%) |
| Life, Physical & Social Science | 0 (0.0%) | 0 (0.0%) |
| Community & Social Service | 0 (0.0%) | 0 (0.0%) |
| Education, Arts & Media | 0 (0.0%) | 0 (0.0%) |
| Legal Services & Support | 0 (0.0%) | 0 (0.0%) |
| Education Instruction & Library | 0 (0.0%) | 0 (0.0%) |
| Arts, Media & Entertainment | 0 (0.0%) | 0 (0.0%) |
| Health Diagnosing & Treating | 0 (0.0%) | 0 (0.0%) |
| Health Technologists | 0 (0.0%) | 0 (0.0%) |
| Total (Category) | 1 (100.0%) | 0 (0.0%) |
| Total (Overall) | 6 (100.0%) | 0 (0.0%) |
Services Occupations
The most common Services occupations in Driftwood borough are , and Cleaning & Maintenance (5 | 83.3%).
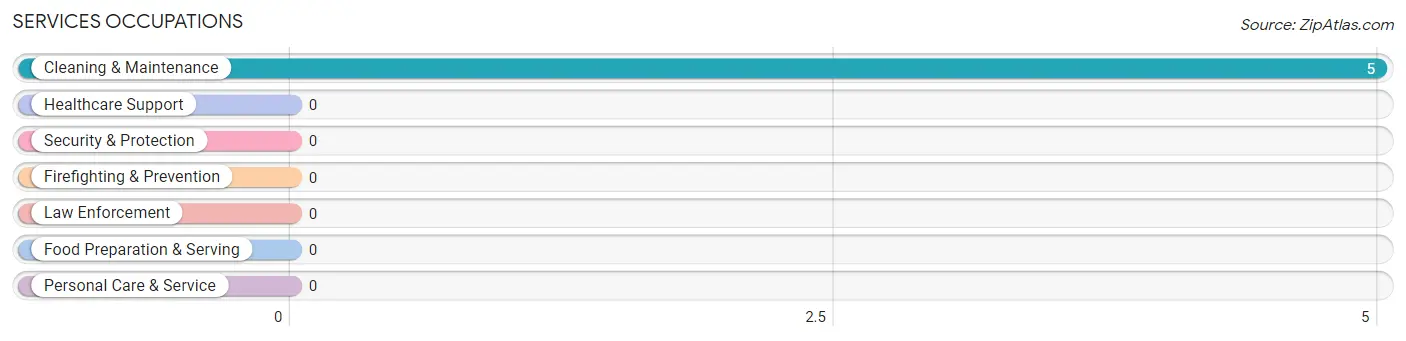
Services Occupations by Sex
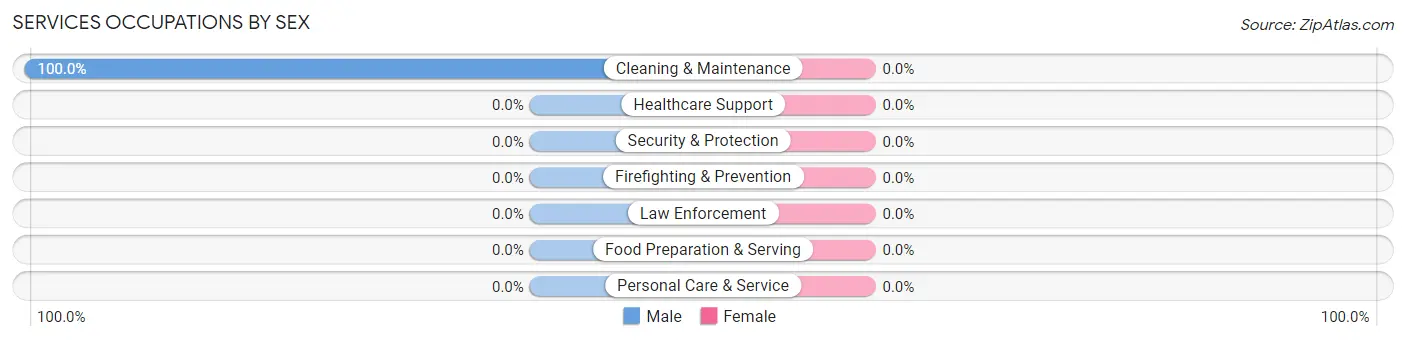
| Occupation | Male | Female |
| Healthcare Support | 0 (0.0%) | 0 (0.0%) |
| Security & Protection | 0 (0.0%) | 0 (0.0%) |
| Firefighting & Prevention | 0 (0.0%) | 0 (0.0%) |
| Law Enforcement | 0 (0.0%) | 0 (0.0%) |
| Food Preparation & Serving | 0 (0.0%) | 0 (0.0%) |
| Cleaning & Maintenance | 5 (100.0%) | 0 (0.0%) |
| Personal Care & Service | 0 (0.0%) | 0 (0.0%) |
| Total (Category) | 5 (100.0%) | 0 (0.0%) |
| Total (Overall) | 6 (100.0%) | 0 (0.0%) |
Sales and Office Occupations
Sales and Office Occupations by Sex
| Occupation | Male | Female |
| Sales & Related | 0 (0.0%) | 0 (0.0%) |
| Office & Administration | 0 (0.0%) | 0 (0.0%) |
| Total (Category) | 0 (0.0%) | 0 (0.0%) |
| Total (Overall) | 6 (100.0%) | 0 (0.0%) |
Natural Resources, Construction and Maintenance Occupations
Natural Resources, Construction and Maintenance Occupations by Sex
| Occupation | Male | Female |
| Farming, Fishing & Forestry | 0 (0.0%) | 0 (0.0%) |
| Construction & Extraction | 0 (0.0%) | 0 (0.0%) |
| Installation, Maintenance & Repair | 0 (0.0%) | 0 (0.0%) |
| Total (Category) | 0 (0.0%) | 0 (0.0%) |
| Total (Overall) | 6 (100.0%) | 0 (0.0%) |
Production, Transportation and Moving Occupations
Production, Transportation and Moving Occupations by Sex
| Occupation | Male | Female |
| Production | 0 (0.0%) | 0 (0.0%) |
| Transportation | 0 (0.0%) | 0 (0.0%) |
| Material Moving | 0 (0.0%) | 0 (0.0%) |
| Total (Category) | 0 (0.0%) | 0 (0.0%) |
| Total (Overall) | 6 (100.0%) | 0 (0.0%) |
Employment Industries by Sex in Driftwood borough
Employment Industries in Driftwood borough
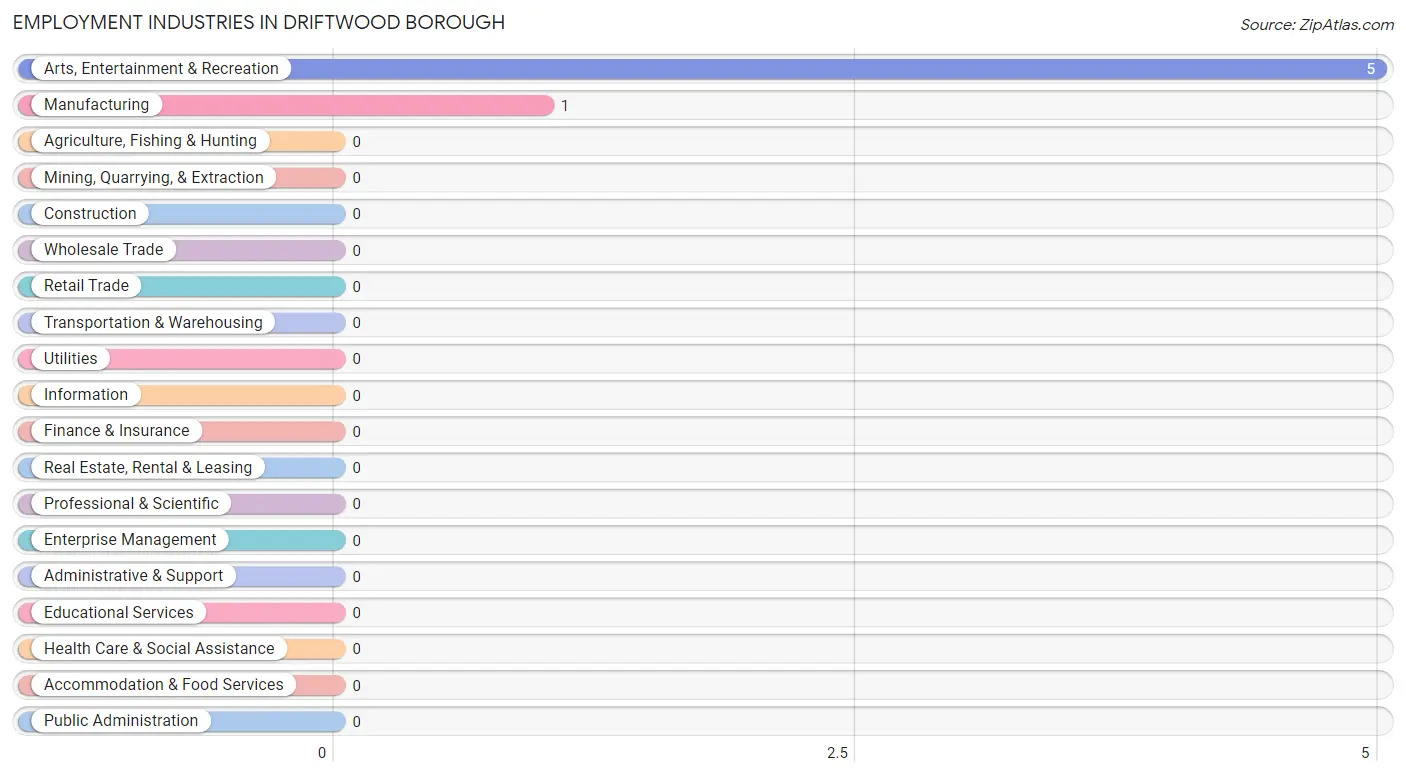
The major employment industries in Driftwood borough include Arts, Entertainment & Recreation (5 | 83.3%), and Manufacturing (1 | 16.7%).
Employment Industries by Sex in Driftwood borough
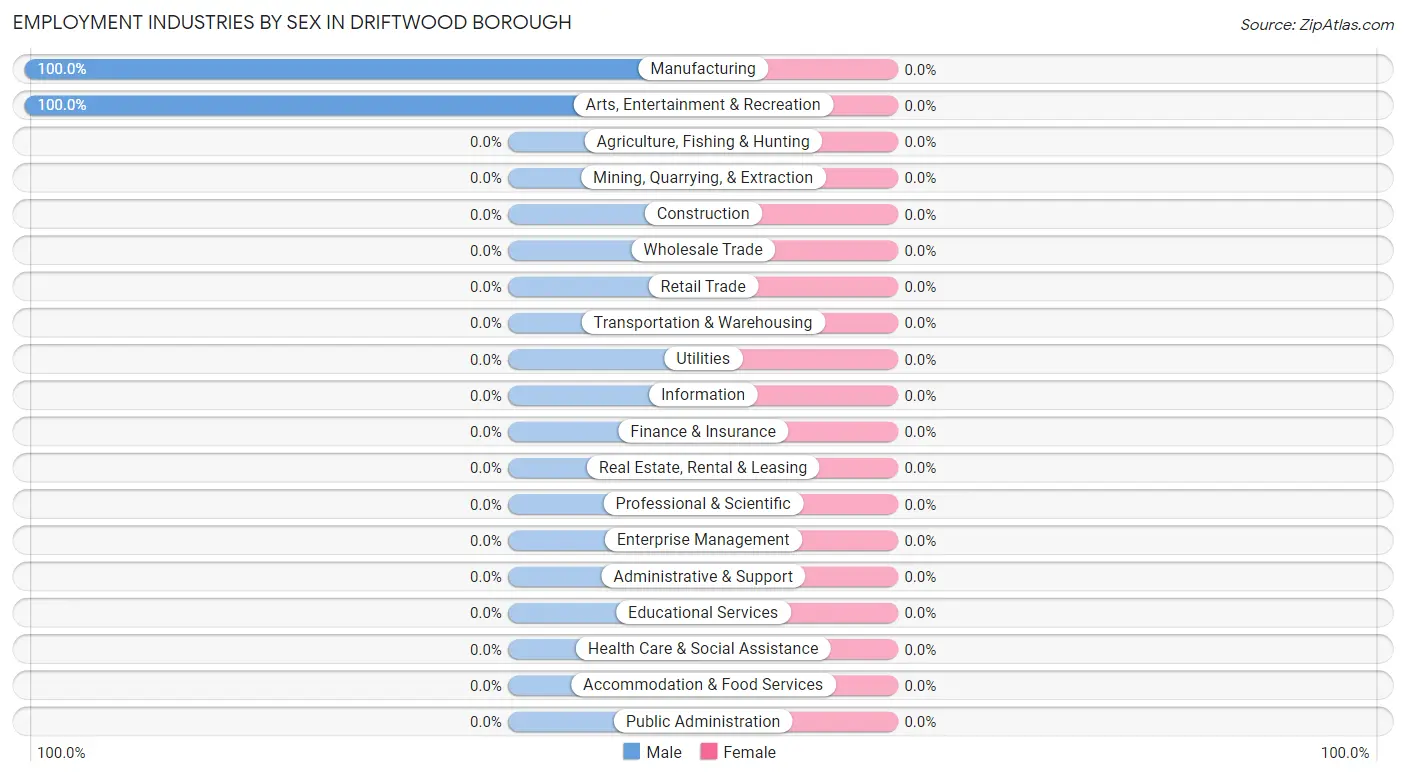
| Industry | Male | Female |
| Agriculture, Fishing & Hunting | 0 (0.0%) | 0 (0.0%) |
| Mining, Quarrying, & Extraction | 0 (0.0%) | 0 (0.0%) |
| Construction | 0 (0.0%) | 0 (0.0%) |
| Manufacturing | 1 (100.0%) | 0 (0.0%) |
| Wholesale Trade | 0 (0.0%) | 0 (0.0%) |
| Retail Trade | 0 (0.0%) | 0 (0.0%) |
| Transportation & Warehousing | 0 (0.0%) | 0 (0.0%) |
| Utilities | 0 (0.0%) | 0 (0.0%) |
| Information | 0 (0.0%) | 0 (0.0%) |
| Finance & Insurance | 0 (0.0%) | 0 (0.0%) |
| Real Estate, Rental & Leasing | 0 (0.0%) | 0 (0.0%) |
| Professional & Scientific | 0 (0.0%) | 0 (0.0%) |
| Enterprise Management | 0 (0.0%) | 0 (0.0%) |
| Administrative & Support | 0 (0.0%) | 0 (0.0%) |
| Educational Services | 0 (0.0%) | 0 (0.0%) |
| Health Care & Social Assistance | 0 (0.0%) | 0 (0.0%) |
| Arts, Entertainment & Recreation | 5 (100.0%) | 0 (0.0%) |
| Accommodation & Food Services | 0 (0.0%) | 0 (0.0%) |
| Public Administration | 0 (0.0%) | 0 (0.0%) |
| Total | 6 (100.0%) | 0 (0.0%) |
Education in Driftwood borough
School Enrollment in Driftwood borough
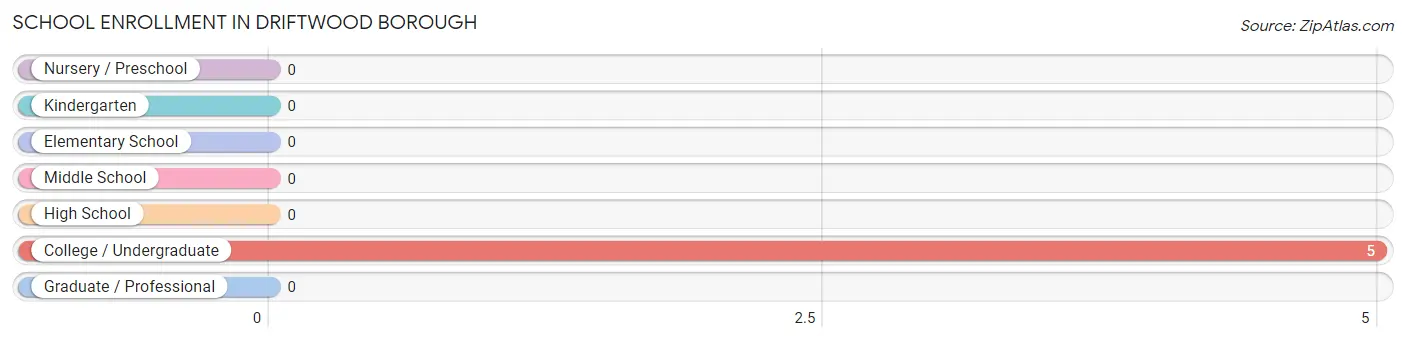
| School Level | # Students | % Students |
| Nursery / Preschool | 0 | 0.0% |
| Kindergarten | 0 | 0.0% |
| Elementary School | 0 | 0.0% |
| Middle School | 0 | 0.0% |
| High School | 0 | 0.0% |
| College / Undergraduate | 5 | 100.0% |
| Graduate / Professional | 0 | 0.0% |
| Total | 5 | 100.0% |
School Enrollment by Age by Funding Source in Driftwood borough
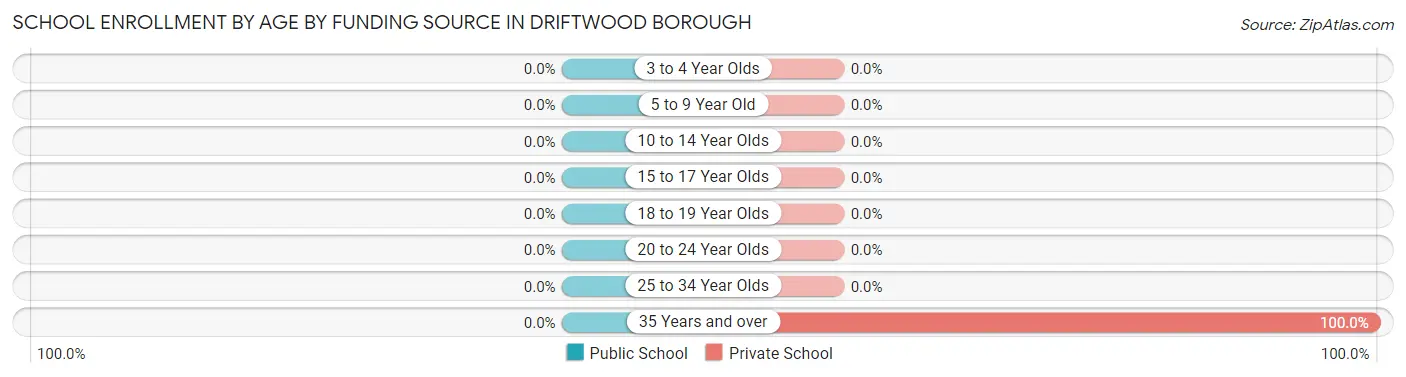
| Age Bracket | Public School | Private School |
| 3 to 4 Year Olds | 0 (0.0%) | 0 (0.0%) |
| 5 to 9 Year Old | 0 (0.0%) | 0 (0.0%) |
| 10 to 14 Year Olds | 0 (0.0%) | 0 (0.0%) |
| 15 to 17 Year Olds | 0 (0.0%) | 0 (0.0%) |
| 18 to 19 Year Olds | 0 (0.0%) | 0 (0.0%) |
| 20 to 24 Year Olds | 0 (0.0%) | 0 (0.0%) |
| 25 to 34 Year Olds | 0 (0.0%) | 0 (0.0%) |
| 35 Years and over | 0 (0.0%) | 5 (100.0%) |
| Total | 0 (0.0%) | 5 (100.0%) |
Educational Attainment by Field of Study in Driftwood borough
| Field of Study | # Graduates | % Graduates |
| Computers & Mathematics | 0 | 0.0% |
| Bio, Nature & Agricultural | 0 | 0.0% |
| Physical & Health Sciences | 0 | 0.0% |
| Psychology | 0 | 0.0% |
| Social Sciences | 0 | 0.0% |
| Engineering | 0 | 0.0% |
| Multidisciplinary Studies | 0 | 0.0% |
| Science & Technology | 0 | 0.0% |
| Business | 0 | 0.0% |
| Education | 0 | 0.0% |
| Literature & Languages | 0 | 0.0% |
| Liberal Arts & History | 0 | 0.0% |
| Visual & Performing Arts | 0 | 0.0% |
| Communications | 0 | 0.0% |
| Arts & Humanities | 0 | 0.0% |
| Total | 0 | 0.0% |
Transportation & Commute in Driftwood borough
Vehicle Availability by Sex in Driftwood borough
| Vehicles Available | Male | Female |
| No Vehicle | 0 (0.0%) | 0 (0.0%) |
| 1 Vehicle | 0 (0.0%) | 0 (0.0%) |
| 2 Vehicles | 0 (0.0%) | 0 (0.0%) |
| 3 Vehicles | 1 (100.0%) | 0 (0.0%) |
| 4 Vehicles | 0 (0.0%) | 0 (0.0%) |
| 5 or more Vehicles | 0 (0.0%) | 0 (0.0%) |
| Total | 1 (100.0%) | 0 (0.0%) |
Commute Time in Driftwood borough
The most frequently occuring commute durations in Driftwood borough are 25 to 29 minutes (1 commuters, 100.0%), less than 5 minutes (0 commuters, 0.0%), and 5 to 9 minutes (0 commuters, 0.0%).
| Commute Time | # Commuters | % Commuters |
| Less than 5 Minutes | 0 | 0.0% |
| 5 to 9 Minutes | 0 | 0.0% |
| 10 to 14 Minutes | 0 | 0.0% |
| 15 to 19 Minutes | 0 | 0.0% |
| 20 to 24 Minutes | 0 | 0.0% |
| 25 to 29 Minutes | 1 | 100.0% |
| 30 to 34 Minutes | 0 | 0.0% |
| 35 to 39 Minutes | 0 | 0.0% |
| 40 to 44 Minutes | 0 | 0.0% |
| 45 to 59 Minutes | 0 | 0.0% |
| 60 to 89 Minutes | 0 | 0.0% |
| 90 or more Minutes | 0 | 0.0% |
Commute Time by Sex in Driftwood borough
| Commute Time | Male | Female |
| Less than 5 Minutes | 0 (0.0%) | 0 (0.0%) |
| 5 to 9 Minutes | 0 (0.0%) | 0 (0.0%) |
| 10 to 14 Minutes | 0 (0.0%) | 0 (0.0%) |
| 15 to 19 Minutes | 0 (0.0%) | 0 (0.0%) |
| 20 to 24 Minutes | 0 (0.0%) | 0 (0.0%) |
| 25 to 29 Minutes | 1 (100.0%) | 0 (0.0%) |
| 30 to 34 Minutes | 0 (0.0%) | 0 (0.0%) |
| 35 to 39 Minutes | 0 (0.0%) | 0 (0.0%) |
| 40 to 44 Minutes | 0 (0.0%) | 0 (0.0%) |
| 45 to 59 Minutes | 0 (0.0%) | 0 (0.0%) |
| 60 to 89 Minutes | 0 (0.0%) | 0 (0.0%) |
| 90 or more Minutes | 0 (0.0%) | 0 (0.0%) |
Time of Departure to Work by Sex in Driftwood borough
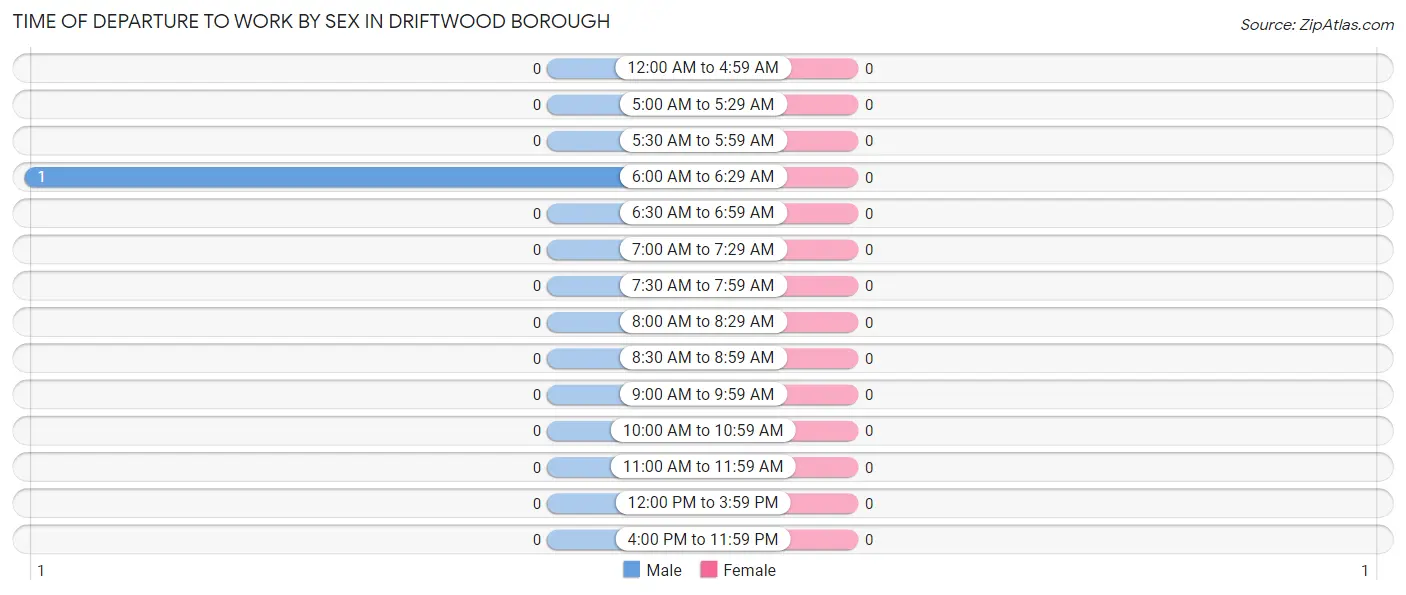
| Time of Departure | Male | Female |
| 12:00 AM to 4:59 AM | 0 (0.0%) | 0 (0.0%) |
| 5:00 AM to 5:29 AM | 0 (0.0%) | 0 (0.0%) |
| 5:30 AM to 5:59 AM | 0 (0.0%) | 0 (0.0%) |
| 6:00 AM to 6:29 AM | 1 (100.0%) | 0 (0.0%) |
| 6:30 AM to 6:59 AM | 0 (0.0%) | 0 (0.0%) |
| 7:00 AM to 7:29 AM | 0 (0.0%) | 0 (0.0%) |
| 7:30 AM to 7:59 AM | 0 (0.0%) | 0 (0.0%) |
| 8:00 AM to 8:29 AM | 0 (0.0%) | 0 (0.0%) |
| 8:30 AM to 8:59 AM | 0 (0.0%) | 0 (0.0%) |
| 9:00 AM to 9:59 AM | 0 (0.0%) | 0 (0.0%) |
| 10:00 AM to 10:59 AM | 0 (0.0%) | 0 (0.0%) |
| 11:00 AM to 11:59 AM | 0 (0.0%) | 0 (0.0%) |
| 12:00 PM to 3:59 PM | 0 (0.0%) | 0 (0.0%) |
| 4:00 PM to 11:59 PM | 0 (0.0%) | 0 (0.0%) |
| Total | 1 (100.0%) | 0 (0.0%) |
Housing Occupancy in Driftwood borough
Occupancy by Ownership in Driftwood borough
Of the total 24 dwellings in Driftwood borough, owner-occupied units account for 24 (100.0%), while renter-occupied units make up 0 (0.0%).
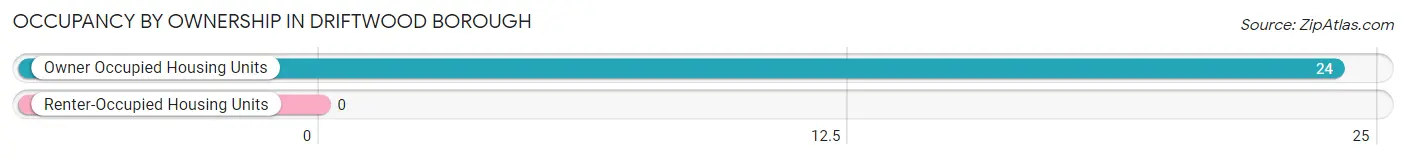
| Occupancy | # Housing Units | % Housing Units |
| Owner Occupied Housing Units | 24 | 100.0% |
| Renter-Occupied Housing Units | 0 | 0.0% |
| Total Occupied Housing Units | 24 | 100.0% |
Occupancy by Household Size in Driftwood borough
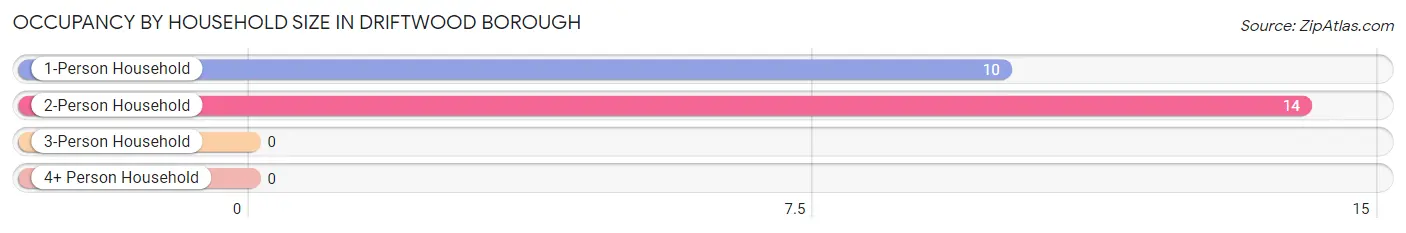
| Household Size | # Housing Units | % Housing Units |
| 1-Person Household | 10 | 41.7% |
| 2-Person Household | 14 | 58.3% |
| 3-Person Household | 0 | 0.0% |
| 4+ Person Household | 0 | 0.0% |
| Total Housing Units | 24 | 100.0% |
Occupancy by Ownership by Household Size in Driftwood borough
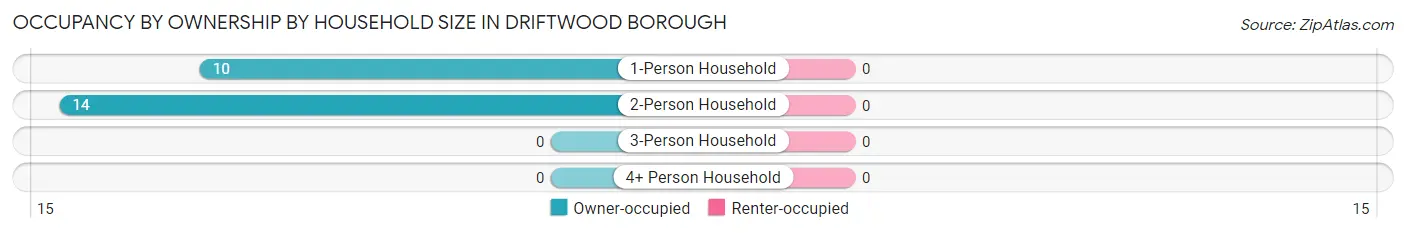
| Household Size | Owner-occupied | Renter-occupied |
| 1-Person Household | 10 (100.0%) | 0 (0.0%) |
| 2-Person Household | 14 (100.0%) | 0 (0.0%) |
| 3-Person Household | 0 (0.0%) | 0 (0.0%) |
| 4+ Person Household | 0 (0.0%) | 0 (0.0%) |
| Total Housing Units | 24 (100.0%) | 0 (0.0%) |
Occupancy by Educational Attainment in Driftwood borough
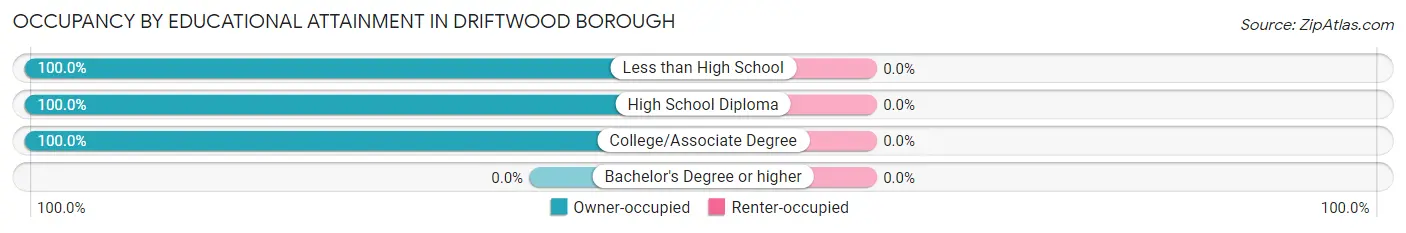
| Household Size | Owner-occupied | Renter-occupied |
| Less than High School | 1 (100.0%) | 0 (0.0%) |
| High School Diploma | 11 (100.0%) | 0 (0.0%) |
| College/Associate Degree | 12 (100.0%) | 0 (0.0%) |
| Bachelor's Degree or higher | 0 (0.0%) | 0 (0.0%) |
Occupancy by Age of Householder in Driftwood borough
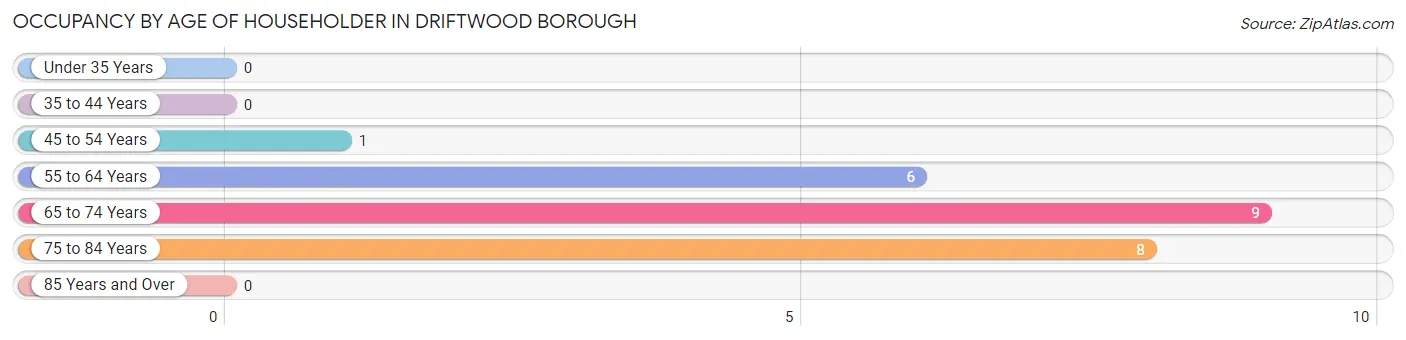
| Age Bracket | # Households | % Households |
| Under 35 Years | 0 | 0.0% |
| 35 to 44 Years | 0 | 0.0% |
| 45 to 54 Years | 1 | 4.2% |
| 55 to 64 Years | 6 | 25.0% |
| 65 to 74 Years | 9 | 37.5% |
| 75 to 84 Years | 8 | 33.3% |
| 85 Years and Over | 0 | 0.0% |
| Total | 24 | 100.0% |
Housing Finances in Driftwood borough
Median Income by Occupancy in Driftwood borough
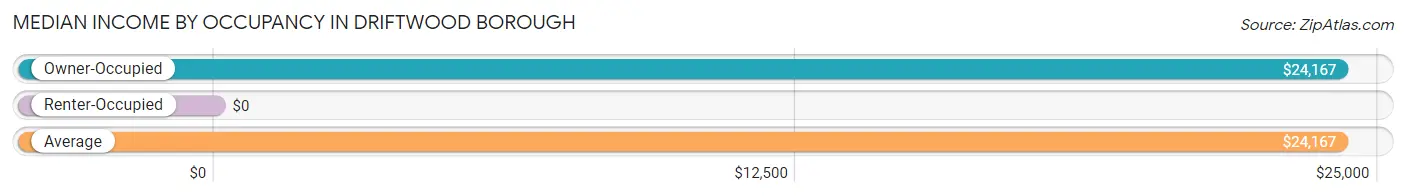
| Occupancy Type | # Households | Median Income |
| Owner-Occupied | 24 (100.0%) | $24,167 |
| Renter-Occupied | 0 (0.0%) | $0 |
| Average | 24 (100.0%) | $24,167 |
Occupancy by Householder Income Bracket in Driftwood borough
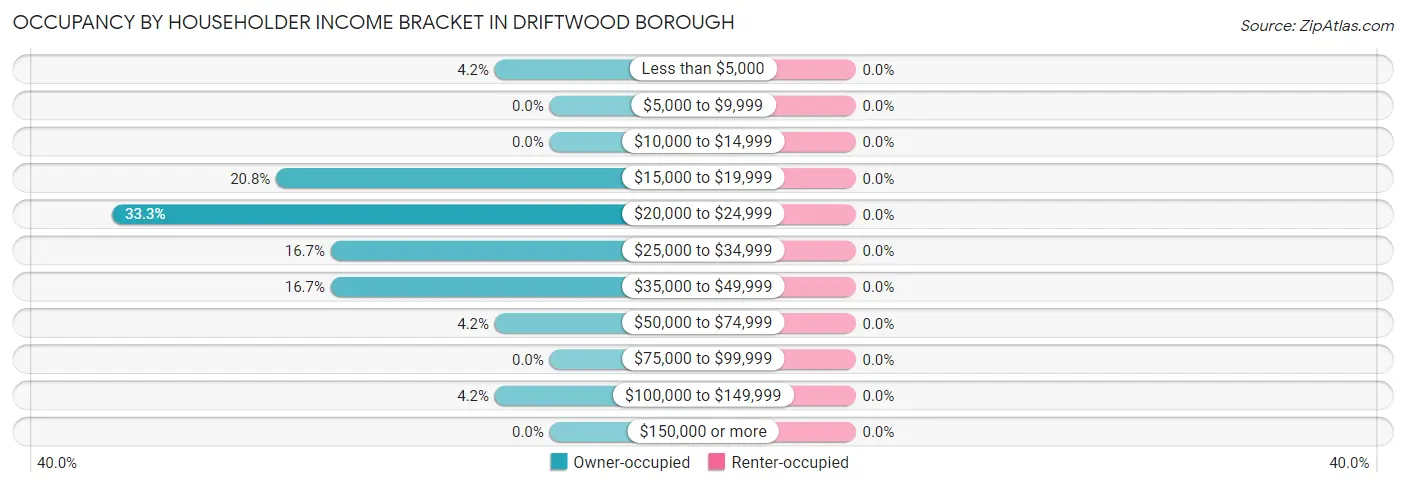
| Income Bracket | Owner-occupied | Renter-occupied |
| Less than $5,000 | 1 (4.2%) | 0 (0.0%) |
| $5,000 to $9,999 | 0 (0.0%) | 0 (0.0%) |
| $10,000 to $14,999 | 0 (0.0%) | 0 (0.0%) |
| $15,000 to $19,999 | 5 (20.8%) | 0 (0.0%) |
| $20,000 to $24,999 | 8 (33.3%) | 0 (0.0%) |
| $25,000 to $34,999 | 4 (16.7%) | 0 (0.0%) |
| $35,000 to $49,999 | 4 (16.7%) | 0 (0.0%) |
| $50,000 to $74,999 | 1 (4.2%) | 0 (0.0%) |
| $75,000 to $99,999 | 0 (0.0%) | 0 (0.0%) |
| $100,000 to $149,999 | 1 (4.2%) | 0 (0.0%) |
| $150,000 or more | 0 (0.0%) | 0 (0.0%) |
| Total | 24 (100.0%) | 0 (0.0%) |
Monthly Housing Cost Tiers in Driftwood borough
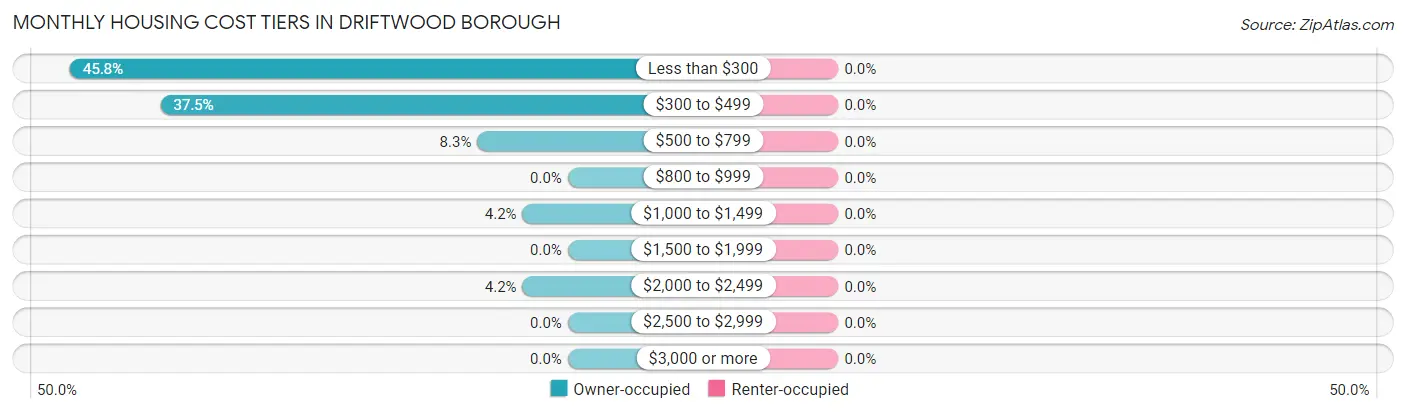
| Monthly Cost | Owner-occupied | Renter-occupied |
| Less than $300 | 11 (45.8%) | 0 (0.0%) |
| $300 to $499 | 9 (37.5%) | 0 (0.0%) |
| $500 to $799 | 2 (8.3%) | 0 (0.0%) |
| $800 to $999 | 0 (0.0%) | 0 (0.0%) |
| $1,000 to $1,499 | 1 (4.2%) | 0 (0.0%) |
| $1,500 to $1,999 | 0 (0.0%) | 0 (0.0%) |
| $2,000 to $2,499 | 1 (4.2%) | 0 (0.0%) |
| $2,500 to $2,999 | 0 (0.0%) | 0 (0.0%) |
| $3,000 or more | 0 (0.0%) | 0 (0.0%) |
| Total | 24 (100.0%) | 0 (0.0%) |
Physical Housing Characteristics in Driftwood borough
Housing Structures in Driftwood borough
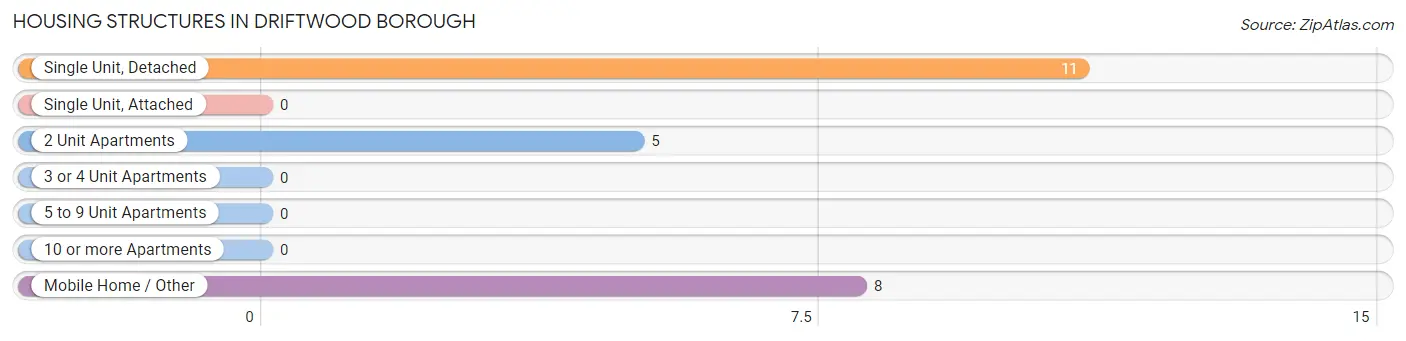
| Structure Type | # Housing Units | % Housing Units |
| Single Unit, Detached | 11 | 45.8% |
| Single Unit, Attached | 0 | 0.0% |
| 2 Unit Apartments | 5 | 20.8% |
| 3 or 4 Unit Apartments | 0 | 0.0% |
| 5 to 9 Unit Apartments | 0 | 0.0% |
| 10 or more Apartments | 0 | 0.0% |
| Mobile Home / Other | 8 | 33.3% |
| Total | 24 | 100.0% |
Housing Structures by Occupancy in Driftwood borough
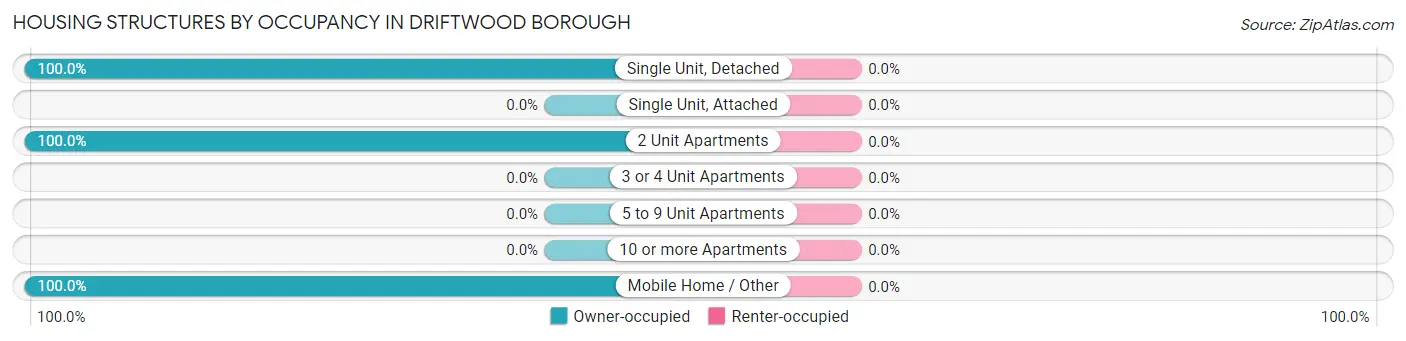
| Structure Type | Owner-occupied | Renter-occupied |
| Single Unit, Detached | 11 (100.0%) | 0 (0.0%) |
| Single Unit, Attached | 0 (0.0%) | 0 (0.0%) |
| 2 Unit Apartments | 5 (100.0%) | 0 (0.0%) |
| 3 or 4 Unit Apartments | 0 (0.0%) | 0 (0.0%) |
| 5 to 9 Unit Apartments | 0 (0.0%) | 0 (0.0%) |
| 10 or more Apartments | 0 (0.0%) | 0 (0.0%) |
| Mobile Home / Other | 8 (100.0%) | 0 (0.0%) |
| Total | 24 (100.0%) | 0 (0.0%) |
Housing Structures by Number of Rooms in Driftwood borough
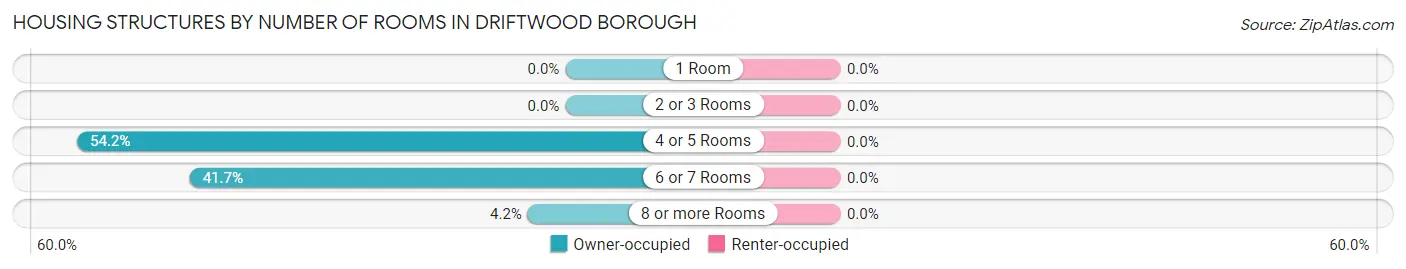
| Number of Rooms | Owner-occupied | Renter-occupied |
| 1 Room | 0 (0.0%) | 0 (0.0%) |
| 2 or 3 Rooms | 0 (0.0%) | 0 (0.0%) |
| 4 or 5 Rooms | 13 (54.2%) | 0 (0.0%) |
| 6 or 7 Rooms | 10 (41.7%) | 0 (0.0%) |
| 8 or more Rooms | 1 (4.2%) | 0 (0.0%) |
| Total | 24 (100.0%) | 0 (0.0%) |
Housing Structure by Heating Type in Driftwood borough
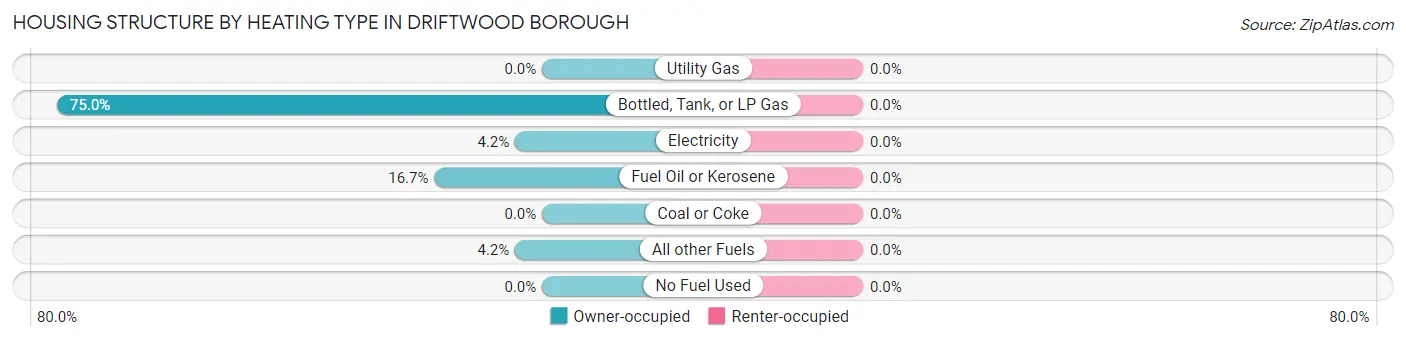
| Heating Type | Owner-occupied | Renter-occupied |
| Utility Gas | 0 (0.0%) | 0 (0.0%) |
| Bottled, Tank, or LP Gas | 18 (75.0%) | 0 (0.0%) |
| Electricity | 1 (4.2%) | 0 (0.0%) |
| Fuel Oil or Kerosene | 4 (16.7%) | 0 (0.0%) |
| Coal or Coke | 0 (0.0%) | 0 (0.0%) |
| All other Fuels | 1 (4.2%) | 0 (0.0%) |
| No Fuel Used | 0 (0.0%) | 0 (0.0%) |
| Total | 24 (100.0%) | 0 (0.0%) |
Household Vehicle Usage in Driftwood borough
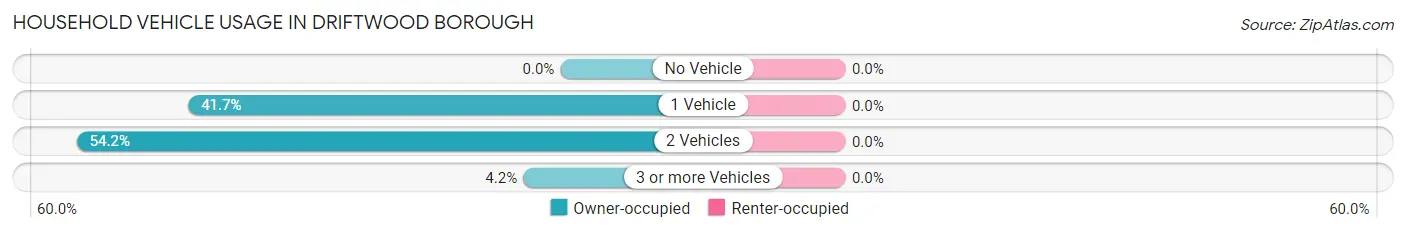
| Vehicles per Household | Owner-occupied | Renter-occupied |
| No Vehicle | 0 (0.0%) | 0 (0.0%) |
| 1 Vehicle | 10 (41.7%) | 0 (0.0%) |
| 2 Vehicles | 13 (54.2%) | 0 (0.0%) |
| 3 or more Vehicles | 1 (4.2%) | 0 (0.0%) |
| Total | 24 (100.0%) | 0 (0.0%) |
Real Estate & Mortgages in Driftwood borough
Real Estate and Mortgage Overview in Driftwood borough
| Characteristic | Without Mortgage | With Mortgage |
| Housing Units | 22 | 2 |
| Median Property Value | - | - |
| Median Household Income | $24,167 | $0 |
| Monthly Housing Costs | $300 | $0 |
| Real Estate Taxes | $725 | $0 |
Property Value by Mortgage Status in Driftwood borough
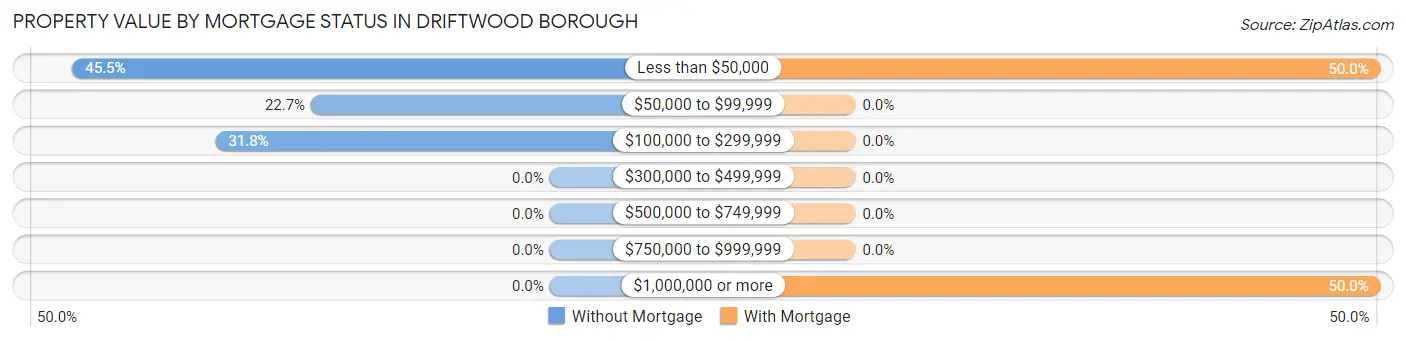
| Property Value | Without Mortgage | With Mortgage |
| Less than $50,000 | 10 (45.5%) | 1 (50.0%) |
| $50,000 to $99,999 | 5 (22.7%) | 0 (0.0%) |
| $100,000 to $299,999 | 7 (31.8%) | 0 (0.0%) |
| $300,000 to $499,999 | 0 (0.0%) | 0 (0.0%) |
| $500,000 to $749,999 | 0 (0.0%) | 0 (0.0%) |
| $750,000 to $999,999 | 0 (0.0%) | 0 (0.0%) |
| $1,000,000 or more | 0 (0.0%) | 1 (50.0%) |
| Total | 22 (100.0%) | 2 (100.0%) |
Household Income by Mortgage Status in Driftwood borough
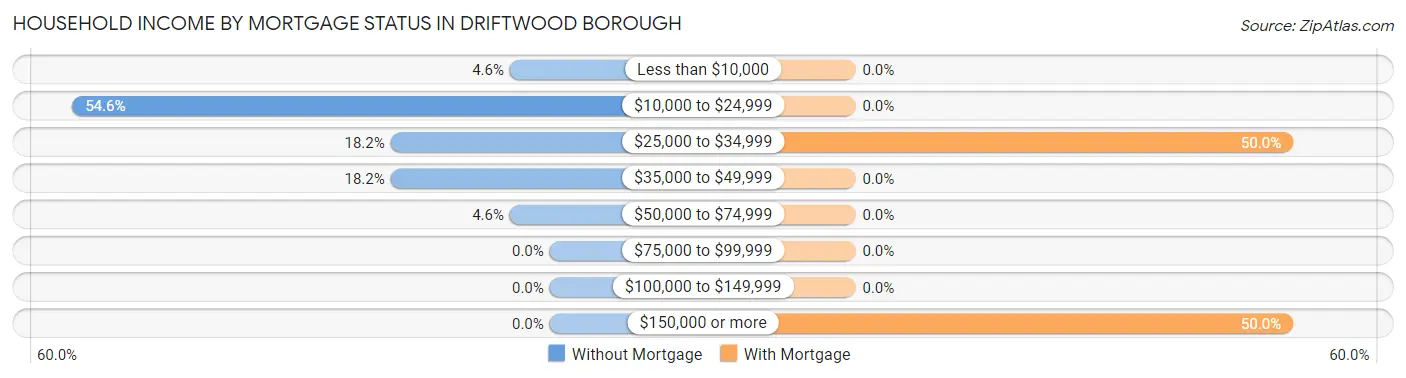
| Household Income | Without Mortgage | With Mortgage |
| Less than $10,000 | 1 (4.5%) | 0 (0.0%) |
| $10,000 to $24,999 | 12 (54.5%) | 0 (0.0%) |
| $25,000 to $34,999 | 4 (18.2%) | 1 (50.0%) |
| $35,000 to $49,999 | 4 (18.2%) | 0 (0.0%) |
| $50,000 to $74,999 | 1 (4.5%) | 0 (0.0%) |
| $75,000 to $99,999 | 0 (0.0%) | 0 (0.0%) |
| $100,000 to $149,999 | 0 (0.0%) | 0 (0.0%) |
| $150,000 or more | 0 (0.0%) | 1 (50.0%) |
| Total | 22 (100.0%) | 2 (100.0%) |
Property Value to Household Income Ratio in Driftwood borough
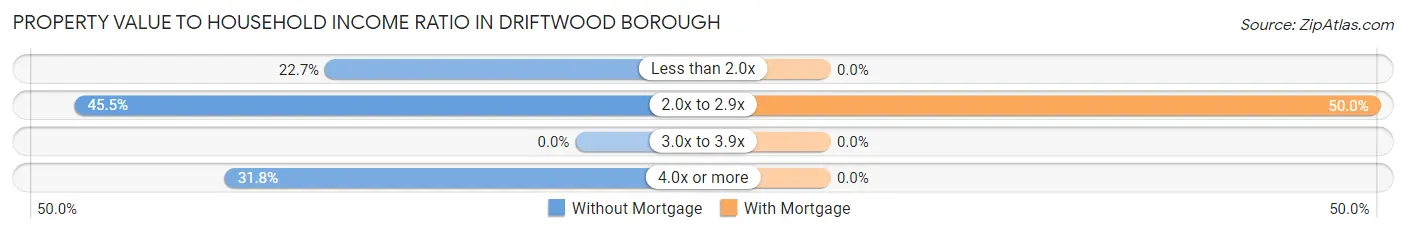
| Value-to-Income Ratio | Without Mortgage | With Mortgage |
| Less than 2.0x | 5 (22.7%) | 0 (0.0%) |
| 2.0x to 2.9x | 10 (45.5%) | 1 (50.0%) |
| 3.0x to 3.9x | 0 (0.0%) | 0 (0.0%) |
| 4.0x or more | 7 (31.8%) | 0 (0.0%) |
| Total | 22 (100.0%) | 2 (100.0%) |
Real Estate Taxes by Mortgage Status in Driftwood borough
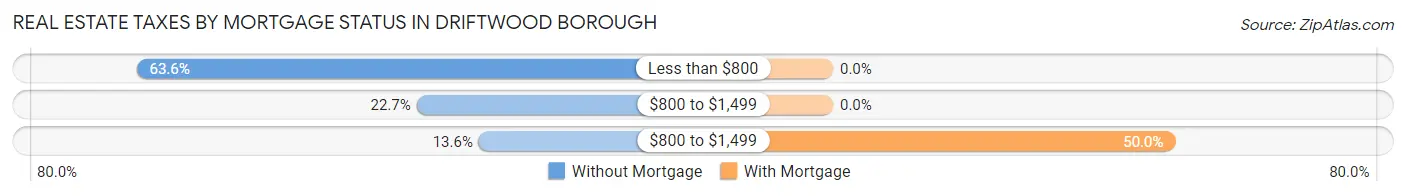
| Property Taxes | Without Mortgage | With Mortgage |
| Less than $800 | 14 (63.6%) | 0 (0.0%) |
| $800 to $1,499 | 5 (22.7%) | 0 (0.0%) |
| $800 to $1,499 | 3 (13.6%) | 1 (50.0%) |
| Total | 22 (100.0%) | 2 (100.0%) |
Health & Disability in Driftwood borough
Health Insurance Coverage by Age in Driftwood borough
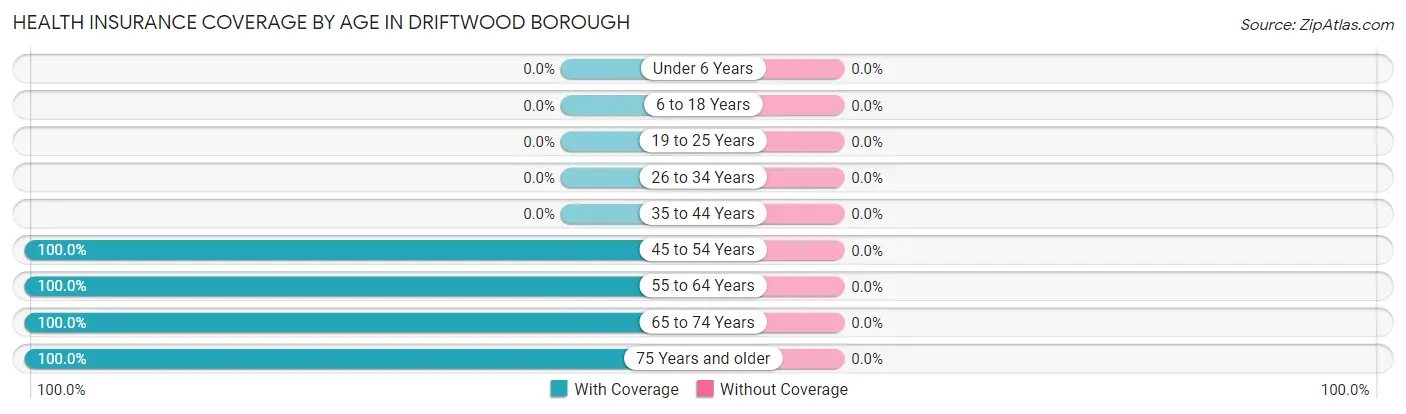
| Age Bracket | With Coverage | Without Coverage |
| Under 6 Years | 0 (0.0%) | 0 (0.0%) |
| 6 to 18 Years | 0 (0.0%) | 0 (0.0%) |
| 19 to 25 Years | 0 (0.0%) | 0 (0.0%) |
| 26 to 34 Years | 0 (0.0%) | 0 (0.0%) |
| 35 to 44 Years | 0 (0.0%) | 0 (0.0%) |
| 45 to 54 Years | 1 (100.0%) | 0 (0.0%) |
| 55 to 64 Years | 15 (100.0%) | 0 (0.0%) |
| 65 to 74 Years | 9 (100.0%) | 0 (0.0%) |
| 75 Years and older | 10 (100.0%) | 0 (0.0%) |
| Total | 35 (100.0%) | 0 (0.0%) |
Health Insurance Coverage by Citizenship Status in Driftwood borough
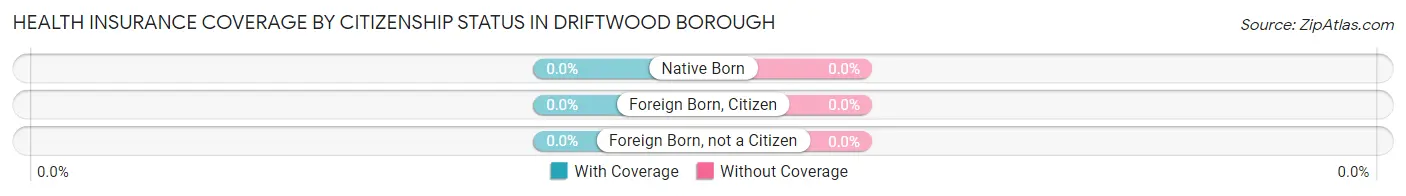
| Citizenship Status | With Coverage | Without Coverage |
| Native Born | 0 (0.0%) | 0 (0.0%) |
| Foreign Born, Citizen | 0 (0.0%) | 0 (0.0%) |
| Foreign Born, not a Citizen | 0 (0.0%) | 0 (0.0%) |
Health Insurance Coverage by Household Income in Driftwood borough
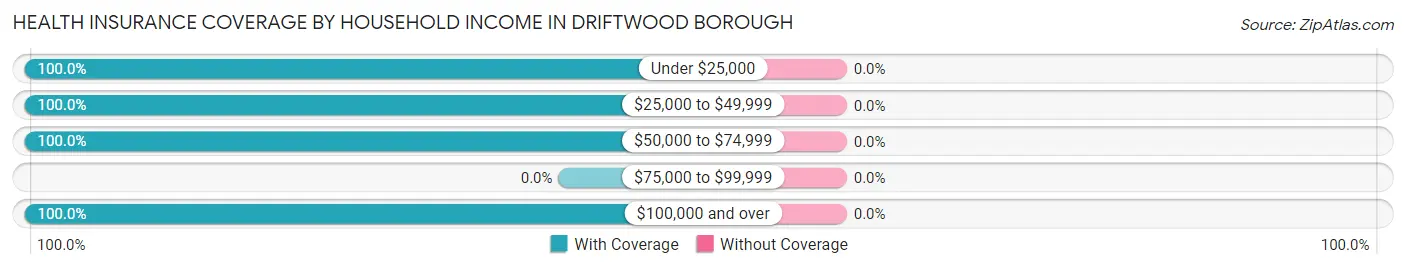
| Household Income | With Coverage | Without Coverage |
| Under $25,000 | 19 (100.0%) | 0 (0.0%) |
| $25,000 to $49,999 | 14 (100.0%) | 0 (0.0%) |
| $50,000 to $74,999 | 1 (100.0%) | 0 (0.0%) |
| $75,000 to $99,999 | 0 (0.0%) | 0 (0.0%) |
| $100,000 and over | 1 (100.0%) | 0 (0.0%) |
Public vs Private Health Insurance Coverage by Age in Driftwood borough
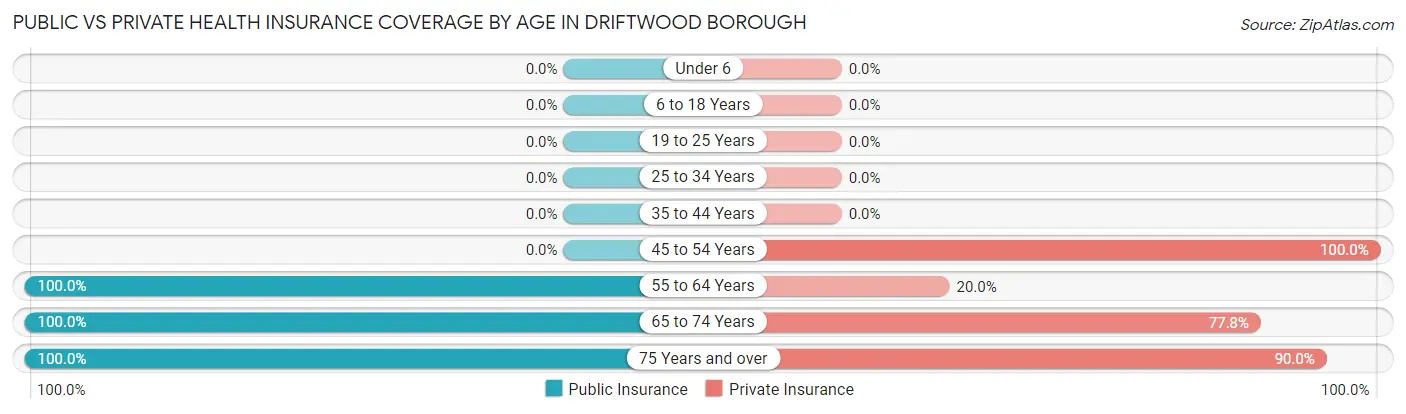
| Age Bracket | Public Insurance | Private Insurance |
| Under 6 | 0 (0.0%) | 0 (0.0%) |
| 6 to 18 Years | 0 (0.0%) | 0 (0.0%) |
| 19 to 25 Years | 0 (0.0%) | 0 (0.0%) |
| 25 to 34 Years | 0 (0.0%) | 0 (0.0%) |
| 35 to 44 Years | 0 (0.0%) | 0 (0.0%) |
| 45 to 54 Years | 0 (0.0%) | 1 (100.0%) |
| 55 to 64 Years | 15 (100.0%) | 3 (20.0%) |
| 65 to 74 Years | 9 (100.0%) | 7 (77.8%) |
| 75 Years and over | 10 (100.0%) | 9 (90.0%) |
| Total | 34 (97.1%) | 20 (57.1%) |
Disability Status by Sex by Age in Driftwood borough
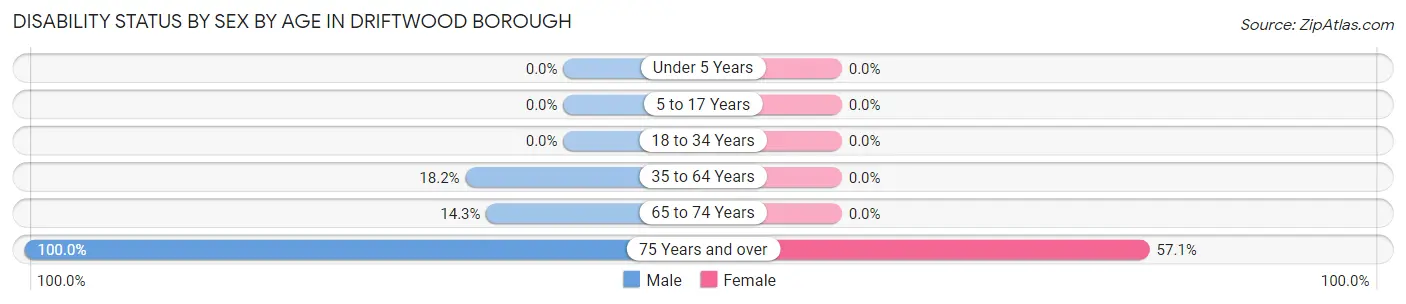
| Age Bracket | Male | Female |
| Under 5 Years | 0 (0.0%) | 0 (0.0%) |
| 5 to 17 Years | 0 (0.0%) | 0 (0.0%) |
| 18 to 34 Years | 0 (0.0%) | 0 (0.0%) |
| 35 to 64 Years | 2 (18.2%) | 0 (0.0%) |
| 65 to 74 Years | 1 (14.3%) | 0 (0.0%) |
| 75 Years and over | 3 (100.0%) | 4 (57.1%) |
Disability Class by Sex by Age in Driftwood borough
Disability Class: Hearing Difficulty
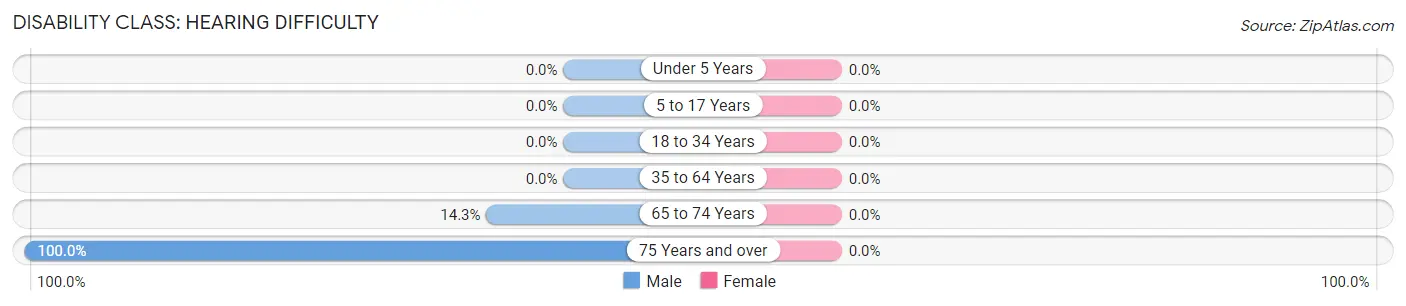
| Age Bracket | Male | Female |
| Under 5 Years | 0 (0.0%) | 0 (0.0%) |
| 5 to 17 Years | 0 (0.0%) | 0 (0.0%) |
| 18 to 34 Years | 0 (0.0%) | 0 (0.0%) |
| 35 to 64 Years | 0 (0.0%) | 0 (0.0%) |
| 65 to 74 Years | 1 (14.3%) | 0 (0.0%) |
| 75 Years and over | 3 (100.0%) | 0 (0.0%) |
Disability Class: Vision Difficulty
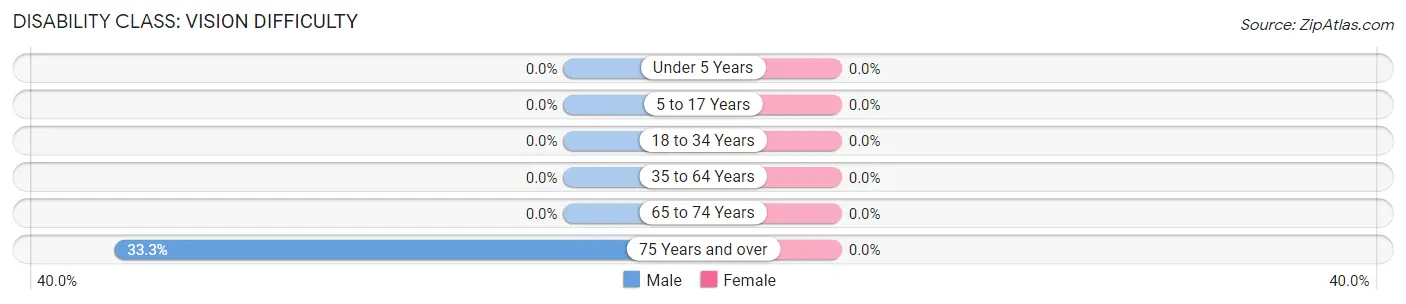
| Age Bracket | Male | Female |
| Under 5 Years | 0 (0.0%) | 0 (0.0%) |
| 5 to 17 Years | 0 (0.0%) | 0 (0.0%) |
| 18 to 34 Years | 0 (0.0%) | 0 (0.0%) |
| 35 to 64 Years | 0 (0.0%) | 0 (0.0%) |
| 65 to 74 Years | 0 (0.0%) | 0 (0.0%) |
| 75 Years and over | 1 (33.3%) | 0 (0.0%) |
Disability Class: Cognitive Difficulty
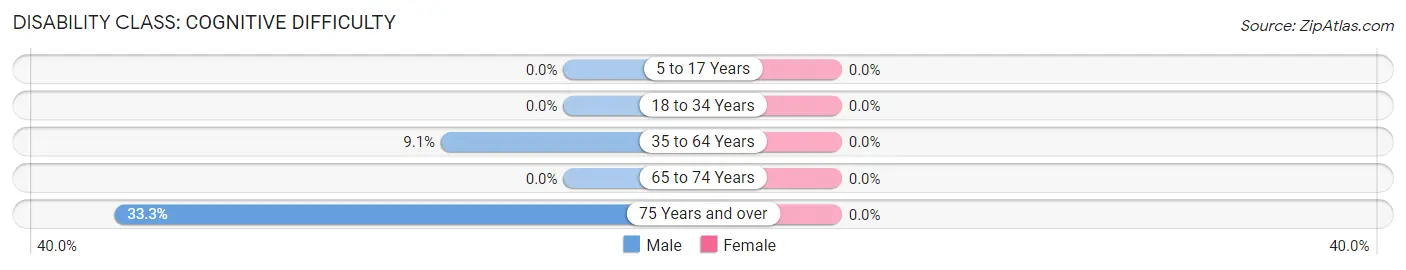
| Age Bracket | Male | Female |
| 5 to 17 Years | 0 (0.0%) | 0 (0.0%) |
| 18 to 34 Years | 0 (0.0%) | 0 (0.0%) |
| 35 to 64 Years | 1 (9.1%) | 0 (0.0%) |
| 65 to 74 Years | 0 (0.0%) | 0 (0.0%) |
| 75 Years and over | 1 (33.3%) | 0 (0.0%) |
Disability Class: Ambulatory Difficulty
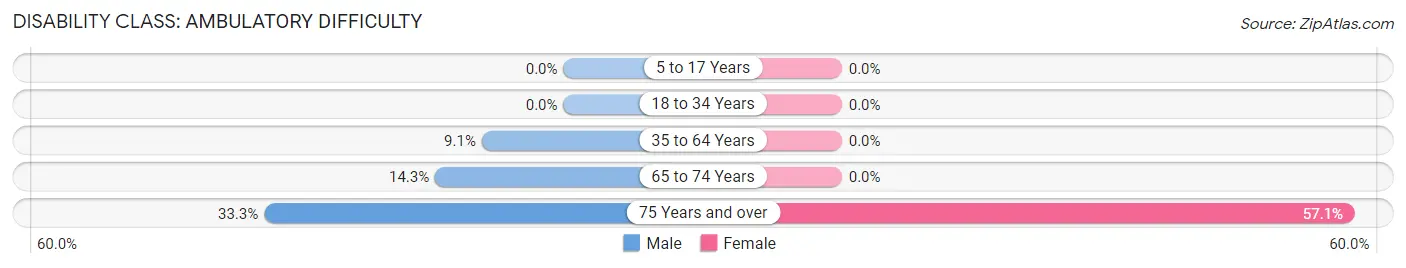
| Age Bracket | Male | Female |
| 5 to 17 Years | 0 (0.0%) | 0 (0.0%) |
| 18 to 34 Years | 0 (0.0%) | 0 (0.0%) |
| 35 to 64 Years | 1 (9.1%) | 0 (0.0%) |
| 65 to 74 Years | 1 (14.3%) | 0 (0.0%) |
| 75 Years and over | 1 (33.3%) | 4 (57.1%) |
Disability Class: Self-Care Difficulty
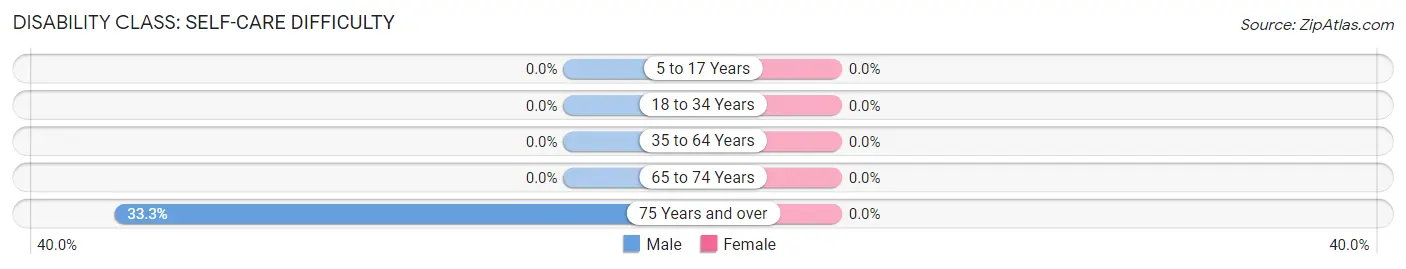
| Age Bracket | Male | Female |
| 5 to 17 Years | 0 (0.0%) | 0 (0.0%) |
| 18 to 34 Years | 0 (0.0%) | 0 (0.0%) |
| 35 to 64 Years | 0 (0.0%) | 0 (0.0%) |
| 65 to 74 Years | 0 (0.0%) | 0 (0.0%) |
| 75 Years and over | 1 (33.3%) | 0 (0.0%) |
Technology Access in Driftwood borough
Computing Device Access in Driftwood borough
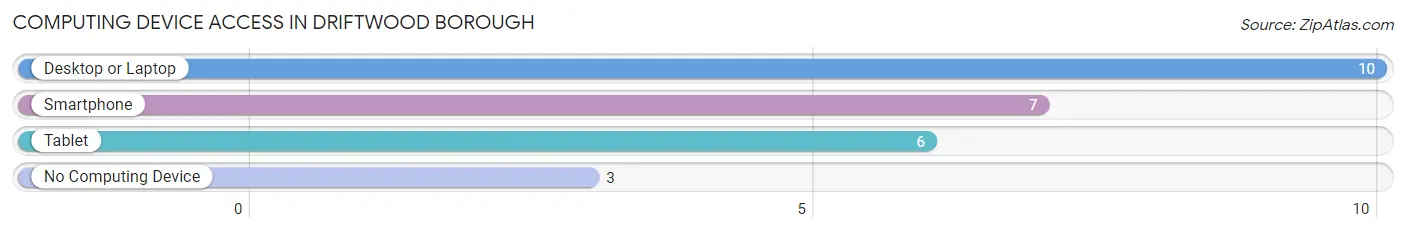
| Device Type | # Households | % Households |
| Desktop or Laptop | 10 | 41.7% |
| Smartphone | 7 | 29.2% |
| Tablet | 6 | 25.0% |
| No Computing Device | 3 | 12.5% |
| Total | 24 | 100.0% |
Internet Access in Driftwood borough
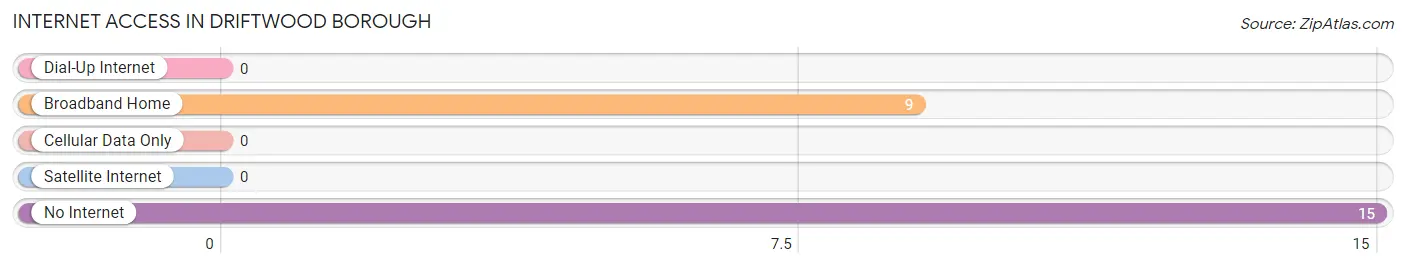
| Internet Type | # Households | % Households |
| Dial-Up Internet | 0 | 0.0% |
| Broadband Home | 9 | 37.5% |
| Cellular Data Only | 0 | 0.0% |
| Satellite Internet | 0 | 0.0% |
| No Internet | 15 | 62.5% |
| Total | 24 | 100.0% |
Driftwood borough Summary
Driftwood Borough is a small borough located in Cambria County, Pennsylvania. It is situated in the foothills of the Allegheny Mountains, approximately 10 miles east of Johnstown. The borough is home to a population of approximately 1,500 people, and is known for its rural charm and small-town atmosphere.
History
Driftwood Borough was founded in 1876, when a group of settlers from the nearby town of Ebensburg purchased a tract of land from the Pennsylvania Railroad. The settlers named the new town after the nearby Driftwood Creek, which was named for the large amount of driftwood that had accumulated along its banks.
The town quickly grew, and by the early 1900s, it had become a thriving community. The town was home to a variety of businesses, including a sawmill, a grist mill, a blacksmith shop, and a general store. The town also had a post office, a school, and several churches.
In the early 1900s, the town was also home to a large number of coal mines. The coal industry was a major source of employment for the town, and it provided much of the economic stability for the area.
Geography
Driftwood Borough is located in the foothills of the Allegheny Mountains, approximately 10 miles east of Johnstown. The borough is situated in a valley, surrounded by rolling hills and forests. The borough is located in a temperate climate, with warm summers and cold winters.
The borough is home to a variety of natural features, including Driftwood Creek, which runs through the center of town. The creek is a popular spot for fishing and swimming, and it is also home to a variety of wildlife, including beavers, muskrats, and deer.
Economy
The economy of Driftwood Borough is largely based on agriculture and tourism. The town is home to a number of farms, which produce a variety of crops, including corn, soybeans, and hay. The town is also home to a number of tourist attractions, including a historic covered bridge, a museum, and a number of antique shops.
The town is also home to a number of small businesses, including restaurants, cafes, and retail stores. The town is also home to a number of manufacturing companies, which produce a variety of products, including furniture, clothing, and electronics.
Demographics
As of the 2010 census, the population of Driftwood Borough was 1,500. The population is largely white (97.3%), with a small percentage of African Americans (1.3%) and Hispanics (1.3%). The median household income is $37,500, and the median age is 43.
Conclusion
Driftwood Borough is a small borough located in Cambria County, Pennsylvania. It is situated in the foothills of the Allegheny Mountains, and is known for its rural charm and small-town atmosphere. The borough is home to a population of approximately 1,500 people, and its economy is largely based on agriculture and tourism. The town is also home to a number of small businesses, and it is a popular destination for tourists.
Common Questions
What is Per Capita Income in Driftwood borough?
Per Capita income in Driftwood borough is $19,951.
What is the Median Family Income in Driftwood borough?
Median Family Income in Driftwood borough is $30,625.
What is the Median Household income in Driftwood borough?
Median Household Income in Driftwood borough is $24,167.
What is Inequality or Gini Index in Driftwood borough?
Inequality or Gini Index in Driftwood borough is 0.29.
What is the Total Population of Driftwood borough?
Total Population of Driftwood borough is 35.
What is the Total Male Population of Driftwood borough?
Total Male Population of Driftwood borough is 21.
What is the Total Female Population of Driftwood borough?
Total Female Population of Driftwood borough is 14.
What is the Ratio of Males per 100 Females in Driftwood borough?
There are 150.00 Males per 100 Females in Driftwood borough.
What is the Ratio of Females per 100 Males in Driftwood borough?
There are 66.67 Females per 100 Males in Driftwood borough.
What is the Median Population Age in Driftwood borough?
Median Population Age in Driftwood borough is 65.3 Years.
What is the Average Family Size in Driftwood borough
Average Family Size in Driftwood borough is 1.8 People.
What is the Average Household Size in Driftwood borough
Average Household Size in Driftwood borough is 1.5 People.
How Large is the Labor Force in Driftwood borough?
There are 6 People in the Labor Forcein in Driftwood borough.
What is the Percentage of People in the Labor Force in Driftwood borough?
17.1% of People are in the Labor Force in Driftwood borough.