Ben Avon borough, PA Map & Demographics
Ben Avon borough Overview
$55,513
PER CAPITA INCOME
$134,688
AVG FAMILY INCOME
$97,175
AVG HOUSEHOLD INCOME
30.4%
WAGE / INCOME GAP [ % ]
69.6¢/ $1
WAGE / INCOME GAP [ $ ]
0.41
INEQUALITY / GINI INDEX
1,878
TOTAL POPULATION
906
MALE POPULATION
972
FEMALE POPULATION
93.21
MALES / 100 FEMALES
107.28
FEMALES / 100 MALES
38.5
MEDIAN AGE
2.9
AVG FAMILY SIZE
2.4
AVG HOUSEHOLD SIZE
1,118
LABOR FORCE [ PEOPLE ]
74.6%
PERCENT IN LABOR FORCE
3.7%
UNEMPLOYMENT RATE
Income in Ben Avon borough
Income Overview in Ben Avon borough
Per Capita Income in Ben Avon borough is $55,513, while median incomes of families and households are $134,688 and $97,175 respectively.
| Characteristic | Number | Measure |
| Per Capita Income | 1,878 | $55,513 |
| Median Family Income | 544 | $134,688 |
| Mean Family Income | 544 | $164,373 |
| Median Household Income | 779 | $97,175 |
| Mean Household Income | 779 | $134,299 |
| Income Deficit | 544 | $0 |
| Wage / Income Gap (%) | 1,878 | 30.36% |
| Wage / Income Gap ($) | 1,878 | 69.64¢ per $1 |
| Gini / Inequality Index | 1,878 | 0.41 |
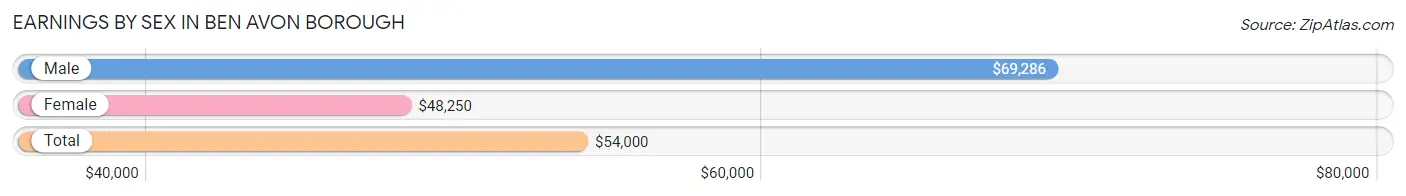
Earnings by Sex in Ben Avon borough
Average Earnings in Ben Avon borough are $54,000, $69,286 for men and $48,250 for women, a difference of 30.4%.
| Sex | Number | Average Earnings |
| Male | 590 (50.3%) | $69,286 |
| Female | 584 (49.7%) | $48,250 |
| Total | 1,174 (100.0%) | $54,000 |
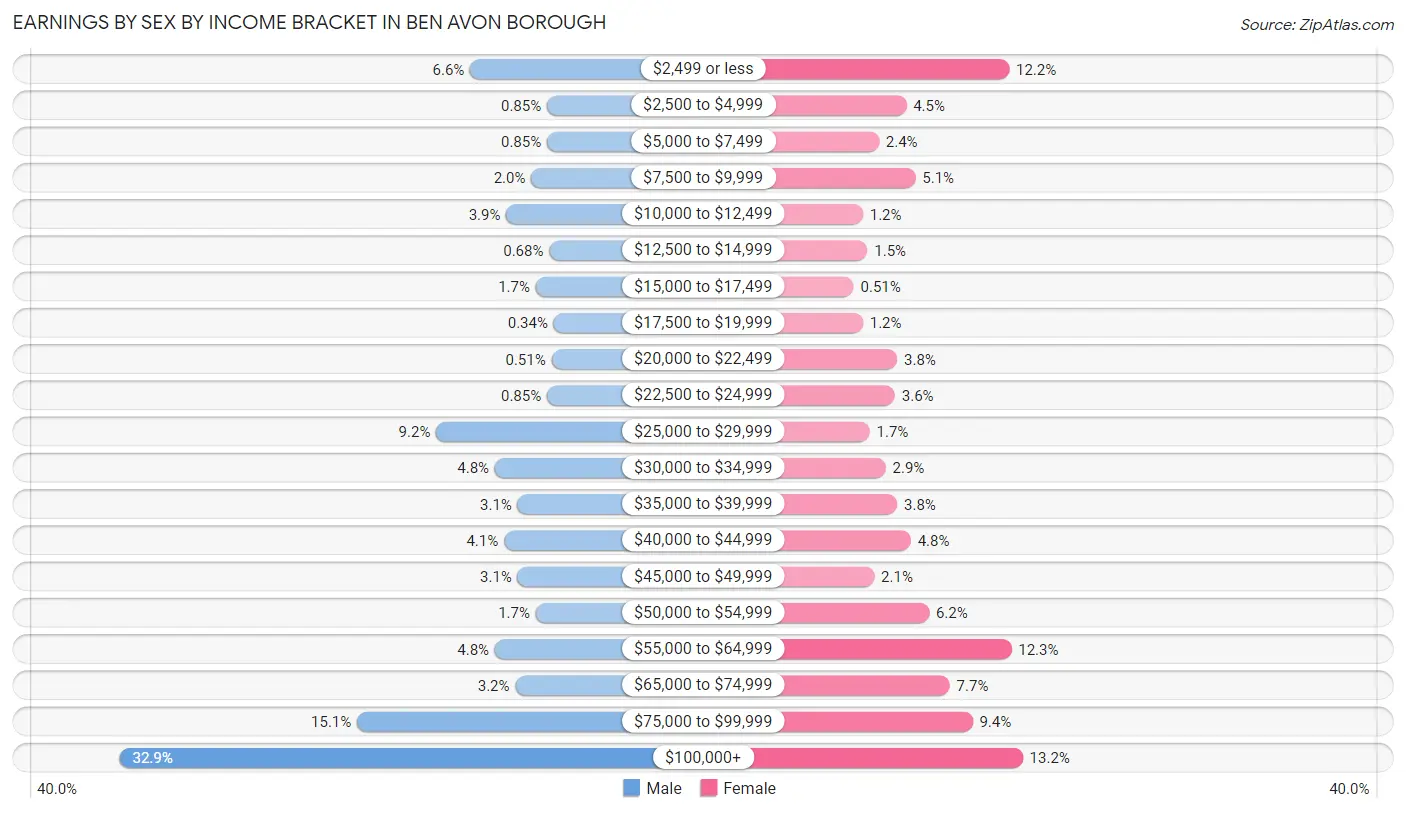
Earnings by Sex by Income Bracket in Ben Avon borough
The most common earnings brackets in Ben Avon borough are $100,000+ for men (194 | 32.9%) and $100,000+ for women (77 | 13.2%).
| Income | Male | Female |
| $2,499 or less | 39 (6.6%) | 71 (12.2%) |
| $2,500 to $4,999 | 5 (0.9%) | 26 (4.4%) |
| $5,000 to $7,499 | 5 (0.9%) | 14 (2.4%) |
| $7,500 to $9,999 | 12 (2.0%) | 30 (5.1%) |
| $10,000 to $12,499 | 23 (3.9%) | 7 (1.2%) |
| $12,500 to $14,999 | 4 (0.7%) | 9 (1.5%) |
| $15,000 to $17,499 | 10 (1.7%) | 3 (0.5%) |
| $17,500 to $19,999 | 2 (0.3%) | 7 (1.2%) |
| $20,000 to $22,499 | 3 (0.5%) | 22 (3.8%) |
| $22,500 to $24,999 | 5 (0.9%) | 21 (3.6%) |
| $25,000 to $29,999 | 54 (9.1%) | 10 (1.7%) |
| $30,000 to $34,999 | 28 (4.8%) | 17 (2.9%) |
| $35,000 to $39,999 | 18 (3.0%) | 22 (3.8%) |
| $40,000 to $44,999 | 24 (4.1%) | 28 (4.8%) |
| $45,000 to $49,999 | 18 (3.0%) | 12 (2.1%) |
| $50,000 to $54,999 | 10 (1.7%) | 36 (6.2%) |
| $55,000 to $64,999 | 28 (4.8%) | 72 (12.3%) |
| $65,000 to $74,999 | 19 (3.2%) | 45 (7.7%) |
| $75,000 to $99,999 | 89 (15.1%) | 55 (9.4%) |
| $100,000+ | 194 (32.9%) | 77 (13.2%) |
| Total | 590 (100.0%) | 584 (100.0%) |
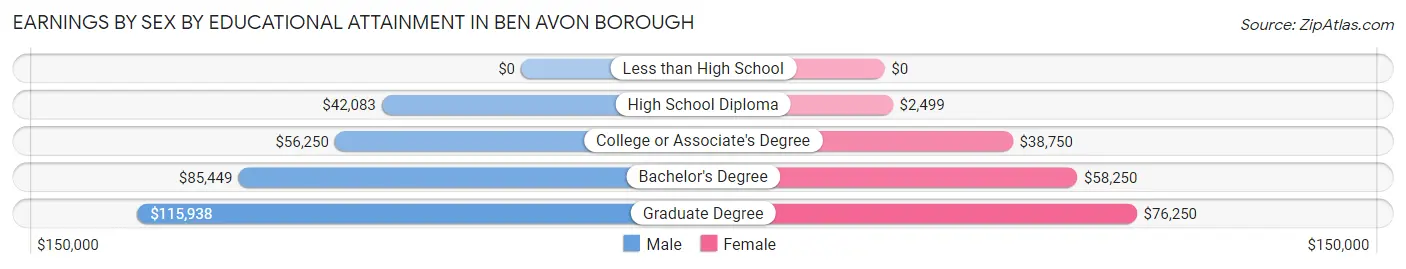
Earnings by Sex by Educational Attainment in Ben Avon borough
Average earnings in Ben Avon borough are $85,000 for men and $51,750 for women, a difference of 39.1%. Men with an educational attainment of graduate degree enjoy the highest average annual earnings of $115,938, while those with high school diploma education earn the least with $42,083. Women with an educational attainment of graduate degree earn the most with the average annual earnings of $76,250, while those with high school diploma education have the smallest earnings of $2,499.
| Educational Attainment | Male Income | Female Income |
| Less than High School | - | - |
| High School Diploma | $42,083 | $2,499 |
| College or Associate's Degree | $56,250 | $38,750 |
| Bachelor's Degree | $85,449 | $58,250 |
| Graduate Degree | $115,938 | $76,250 |
| Total | $85,000 | $51,750 |
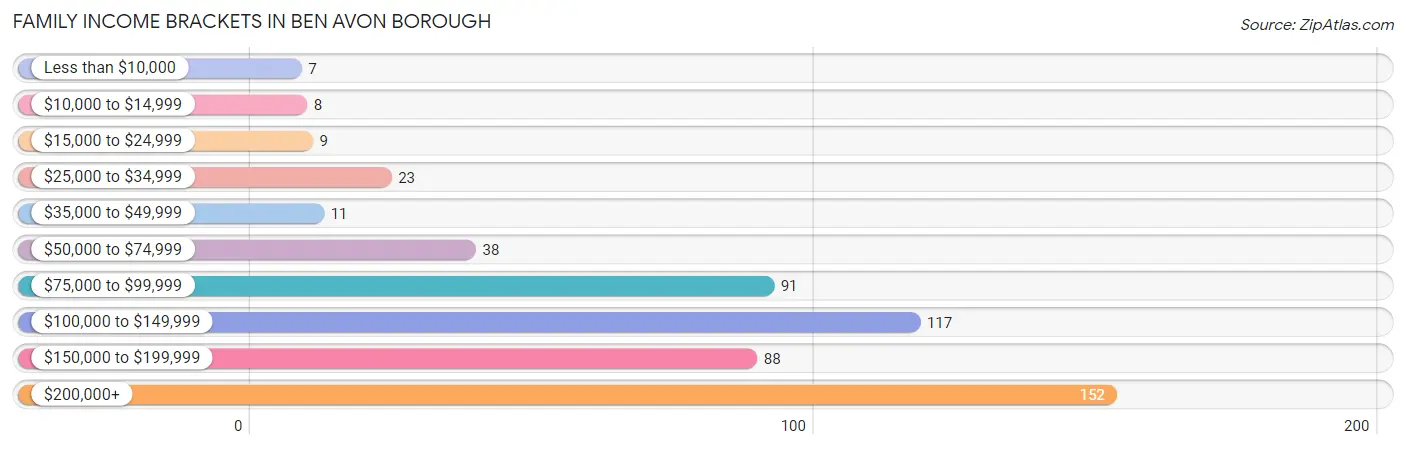
Family Income in Ben Avon borough
Family Income Brackets in Ben Avon borough
According to the Ben Avon borough family income data, there are 152 families falling into the $200,000+ income range, which is the most common income bracket and makes up 27.9% of all families. Conversely, the less than $10,000 income bracket is the least frequent group with only 7 families (1.3%) belonging to this category.
| Income Bracket | # Families | % Families |
| Less than $10,000 | 7 | 1.3% |
| $10,000 to $14,999 | 8 | 1.5% |
| $15,000 to $24,999 | 9 | 1.7% |
| $25,000 to $34,999 | 23 | 4.2% |
| $35,000 to $49,999 | 11 | 2.0% |
| $50,000 to $74,999 | 38 | 7.0% |
| $75,000 to $99,999 | 91 | 16.7% |
| $100,000 to $149,999 | 117 | 21.5% |
| $150,000 to $199,999 | 88 | 16.2% |
| $200,000+ | 152 | 27.9% |
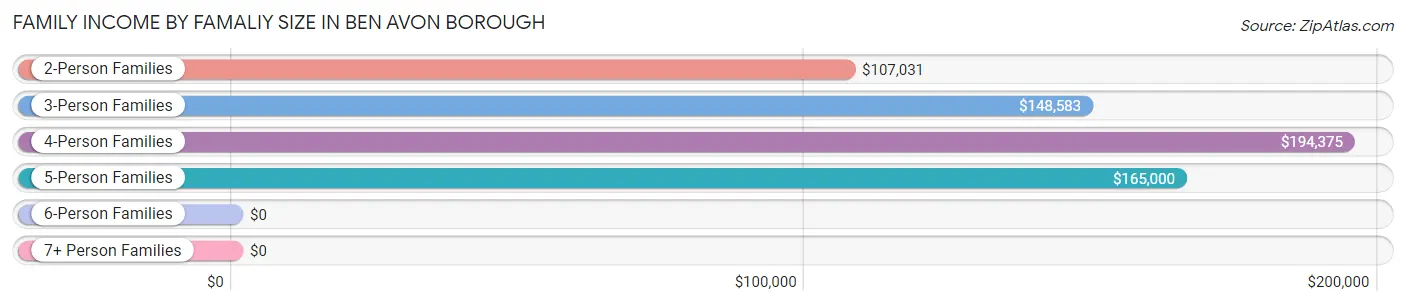
Family Income by Famaliy Size in Ben Avon borough
4-person families (123 | 22.6%) account for the highest median family income in Ben Avon borough with $194,375 per family, while 2-person families (255 | 46.9%) have the highest median income of $53,516 per family member.
| Income Bracket | # Families | Median Income |
| 2-Person Families | 255 (46.9%) | $107,031 |
| 3-Person Families | 115 (21.1%) | $148,583 |
| 4-Person Families | 123 (22.6%) | $194,375 |
| 5-Person Families | 38 (7.0%) | $165,000 |
| 6-Person Families | 13 (2.4%) | $0 |
| 7+ Person Families | 0 (0.0%) | $0 |
| Total | 544 (100.0%) | $134,688 |
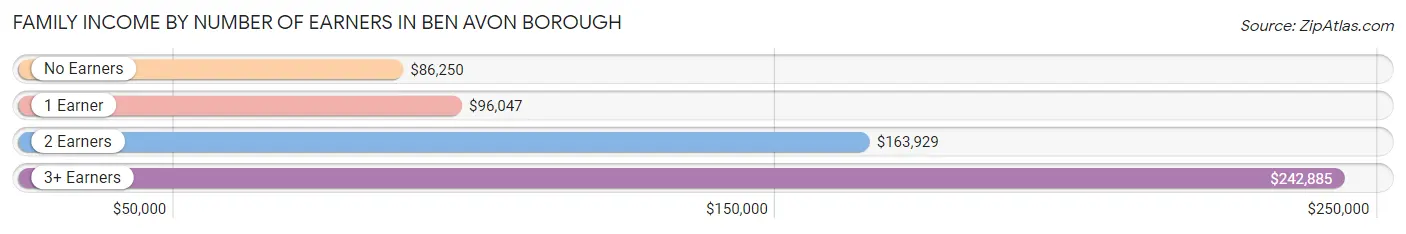
Family Income by Number of Earners in Ben Avon borough
The median family income in Ben Avon borough is $134,688, with families comprising 3+ earners (60) having the highest median family income of $242,885, while families with no earners (32) have the lowest median family income of $86,250, accounting for 11.0% and 5.9% of families, respectively.
| Number of Earners | # Families | Median Income |
| No Earners | 32 (5.9%) | $86,250 |
| 1 Earner | 174 (32.0%) | $96,047 |
| 2 Earners | 278 (51.1%) | $163,929 |
| 3+ Earners | 60 (11.0%) | $242,885 |
| Total | 544 (100.0%) | $134,688 |
Household Income in Ben Avon borough
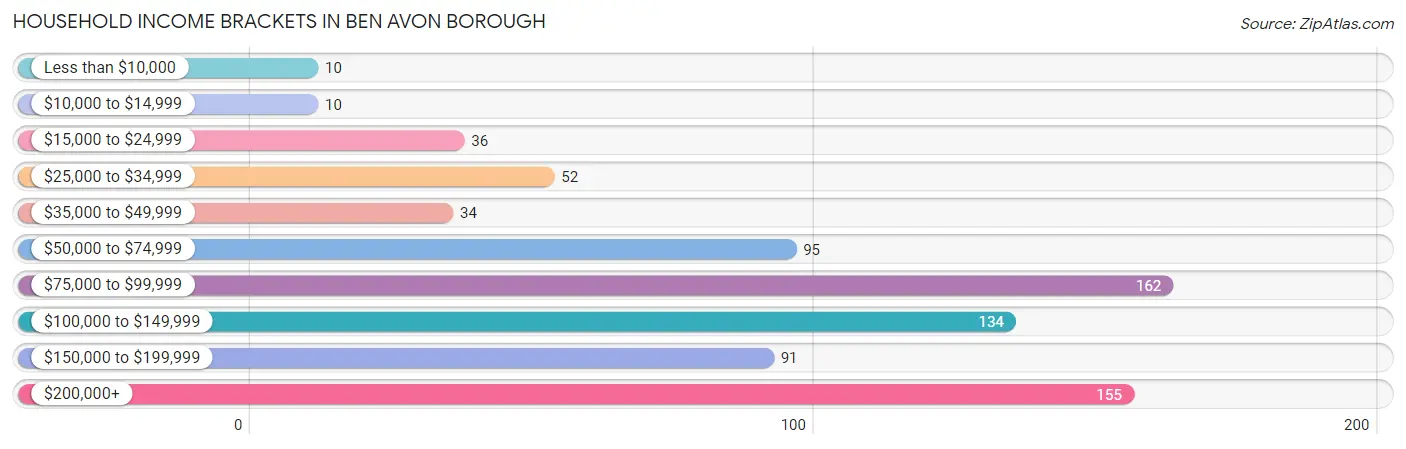
Household Income Brackets in Ben Avon borough
With 162 households falling in the category, the $75,000 to $99,999 income range is the most frequent in Ben Avon borough, accounting for 20.8% of all households. In contrast, only 10 households (1.3%) fall into the less than $10,000 income bracket, making it the least populous group.
| Income Bracket | # Households | % Households |
| Less than $10,000 | 10 | 1.3% |
| $10,000 to $14,999 | 10 | 1.3% |
| $15,000 to $24,999 | 36 | 4.6% |
| $25,000 to $34,999 | 52 | 6.7% |
| $35,000 to $49,999 | 34 | 4.4% |
| $50,000 to $74,999 | 95 | 12.2% |
| $75,000 to $99,999 | 162 | 20.8% |
| $100,000 to $149,999 | 134 | 17.2% |
| $150,000 to $199,999 | 91 | 11.7% |
| $200,000+ | 155 | 19.9% |
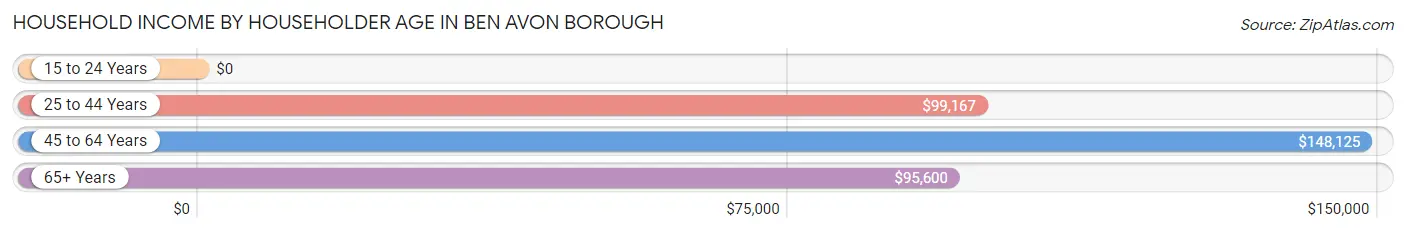
Household Income by Householder Age in Ben Avon borough
The median household income in Ben Avon borough is $97,175, with the highest median household income of $148,125 found in the 45 to 64 years age bracket for the primary householder. A total of 253 households (32.5%) fall into this category. Meanwhile, the 15 to 24 years age bracket for the primary householder has the lowest median household income of $0, with 16 households (2.1%) in this group.
| Income Bracket | # Households | Median Income |
| 15 to 24 Years | 16 (2.1%) | $0 |
| 25 to 44 Years | 318 (40.8%) | $99,167 |
| 45 to 64 Years | 253 (32.5%) | $148,125 |
| 65+ Years | 192 (24.6%) | $95,600 |
| Total | 779 (100.0%) | $97,175 |
Poverty in Ben Avon borough
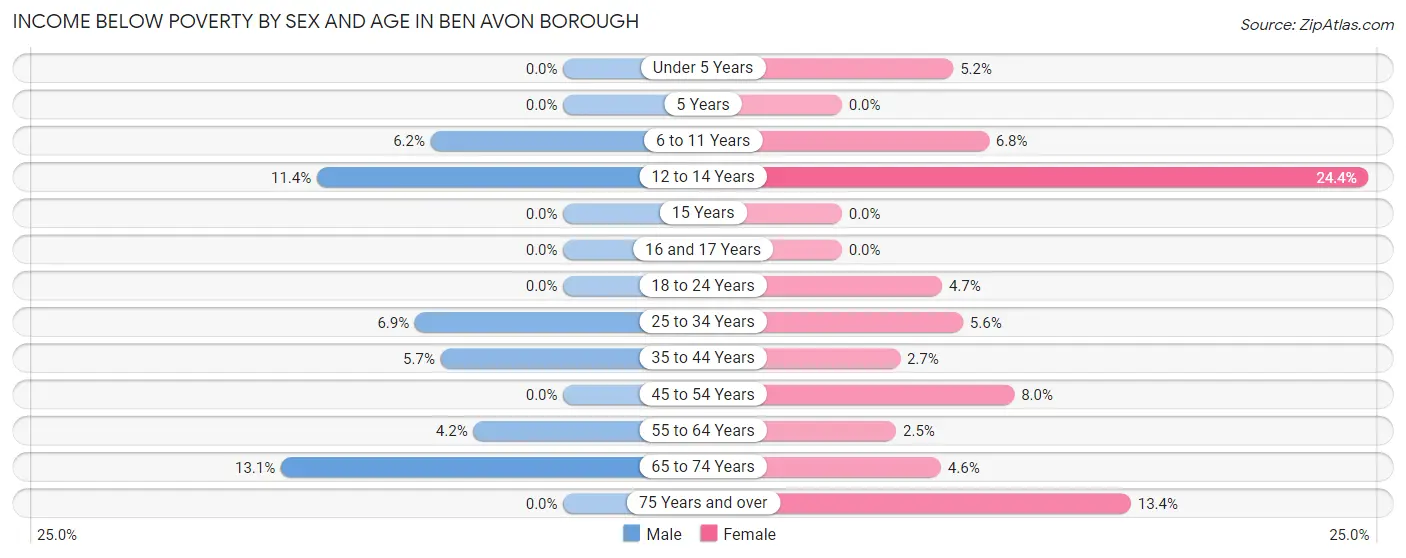
Income Below Poverty by Sex and Age in Ben Avon borough
With 4.5% poverty level for males and 6.3% for females among the residents of Ben Avon borough, 65 to 74 year old males and 12 to 14 year old females are the most vulnerable to poverty, with 11 males (13.1%) and 11 females (24.4%) in their respective age groups living below the poverty level.
| Age Bracket | Male | Female |
| Under 5 Years | 0 (0.0%) | 3 (5.2%) |
| 5 Years | 0 (0.0%) | 0 (0.0%) |
| 6 to 11 Years | 4 (6.1%) | 6 (6.8%) |
| 12 to 14 Years | 4 (11.4%) | 11 (24.4%) |
| 15 Years | 0 (0.0%) | 0 (0.0%) |
| 16 and 17 Years | 0 (0.0%) | 0 (0.0%) |
| 18 to 24 Years | 0 (0.0%) | 2 (4.6%) |
| 25 to 34 Years | 11 (6.9%) | 9 (5.6%) |
| 35 to 44 Years | 7 (5.7%) | 4 (2.7%) |
| 45 to 54 Years | 0 (0.0%) | 8 (8.0%) |
| 55 to 64 Years | 4 (4.2%) | 3 (2.5%) |
| 65 to 74 Years | 11 (13.1%) | 4 (4.6%) |
| 75 Years and over | 0 (0.0%) | 11 (13.4%) |
| Total | 41 (4.5%) | 61 (6.3%) |
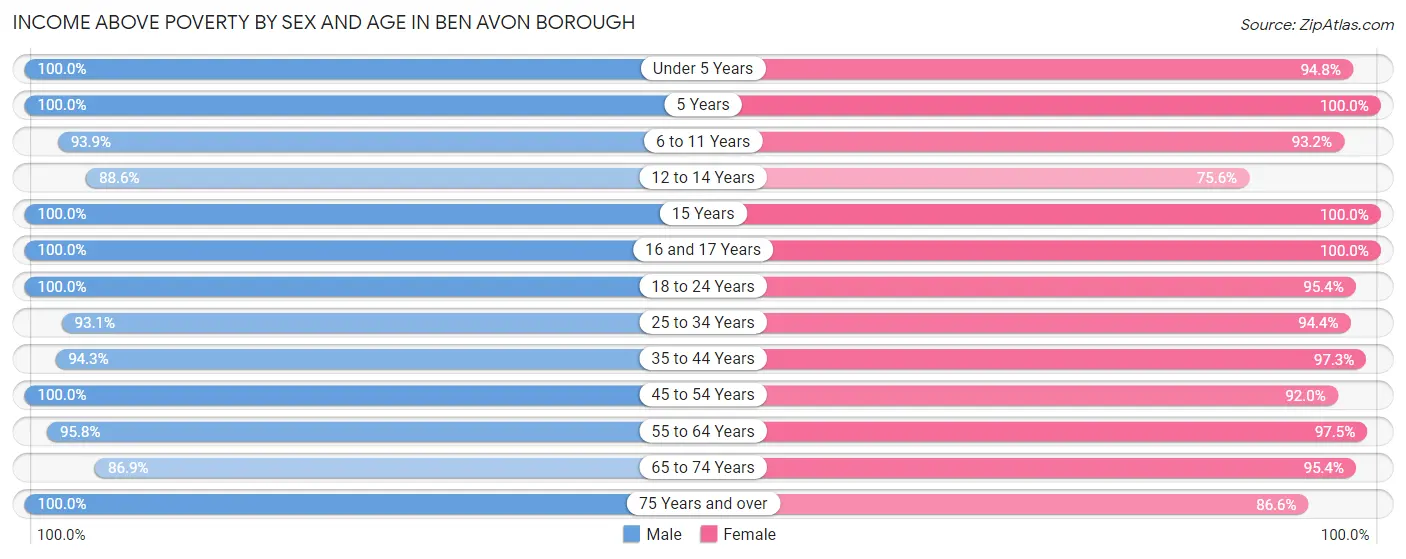
Income Above Poverty by Sex and Age in Ben Avon borough
According to the poverty statistics in Ben Avon borough, males aged under 5 years and females aged 5 years are the age groups that are most secure financially, with 100.0% of males and 100.0% of females in these age groups living above the poverty line.
| Age Bracket | Male | Female |
| Under 5 Years | 55 (100.0%) | 55 (94.8%) |
| 5 Years | 12 (100.0%) | 15 (100.0%) |
| 6 to 11 Years | 61 (93.9%) | 82 (93.2%) |
| 12 to 14 Years | 31 (88.6%) | 34 (75.6%) |
| 15 Years | 3 (100.0%) | 4 (100.0%) |
| 16 and 17 Years | 35 (100.0%) | 23 (100.0%) |
| 18 to 24 Years | 43 (100.0%) | 41 (95.4%) |
| 25 to 34 Years | 149 (93.1%) | 151 (94.4%) |
| 35 to 44 Years | 116 (94.3%) | 144 (97.3%) |
| 45 to 54 Years | 127 (100.0%) | 92 (92.0%) |
| 55 to 64 Years | 92 (95.8%) | 116 (97.5%) |
| 65 to 74 Years | 73 (86.9%) | 83 (95.4%) |
| 75 Years and over | 68 (100.0%) | 71 (86.6%) |
| Total | 865 (95.5%) | 911 (93.7%) |
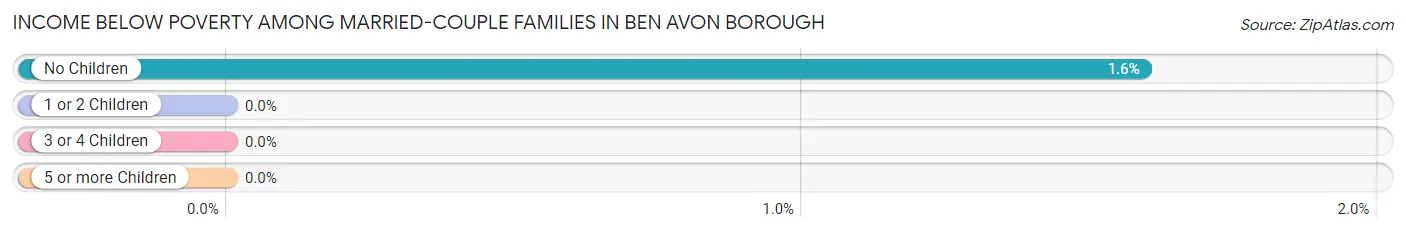
Income Below Poverty Among Married-Couple Families in Ben Avon borough
The poverty statistics for married-couple families in Ben Avon borough show that 0.9% or 4 of the total 464 families live below the poverty line. Families with no children have the highest poverty rate of 1.6%, comprising of 4 families. On the other hand, families with 1 or 2 children have the lowest poverty rate of 0.0%, which includes 0 families.
| Children | Above Poverty | Below Poverty |
| No Children | 247 (98.4%) | 4 (1.6%) |
| 1 or 2 Children | 180 (100.0%) | 0 (0.0%) |
| 3 or 4 Children | 33 (100.0%) | 0 (0.0%) |
| 5 or more Children | 0 (0.0%) | 0 (0.0%) |
| Total | 460 (99.1%) | 4 (0.9%) |
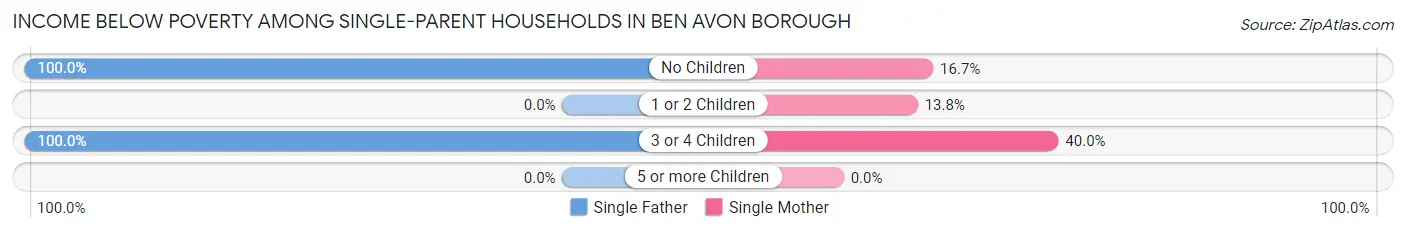
Income Below Poverty Among Single-Parent Households in Ben Avon borough
According to the poverty data in Ben Avon borough, 46.4% or 13 single-father households and 17.3% or 9 single-mother households are living below the poverty line. Among single-father households, those with no children have the highest poverty rate, with 8 households (100.0%) experiencing poverty. Likewise, among single-mother households, those with 3 or 4 children have the highest poverty rate, with 2 households (40.0%) falling below the poverty line.
| Children | Single Father | Single Mother |
| No Children | 8 (100.0%) | 3 (16.7%) |
| 1 or 2 Children | 0 (0.0%) | 4 (13.8%) |
| 3 or 4 Children | 5 (100.0%) | 2 (40.0%) |
| 5 or more Children | 0 (0.0%) | 0 (0.0%) |
| Total | 13 (46.4%) | 9 (17.3%) |
Income Below Poverty Among Married-Couple vs Single-Parent Households in Ben Avon borough
The poverty data for Ben Avon borough shows that 4 of the married-couple family households (0.9%) and 22 of the single-parent households (27.5%) are living below the poverty level. Within the married-couple family households, those with no children have the highest poverty rate, with 4 households (1.6%) falling below the poverty line. Among the single-parent households, those with 3 or 4 children have the highest poverty rate, with 7 household (70.0%) living below poverty.
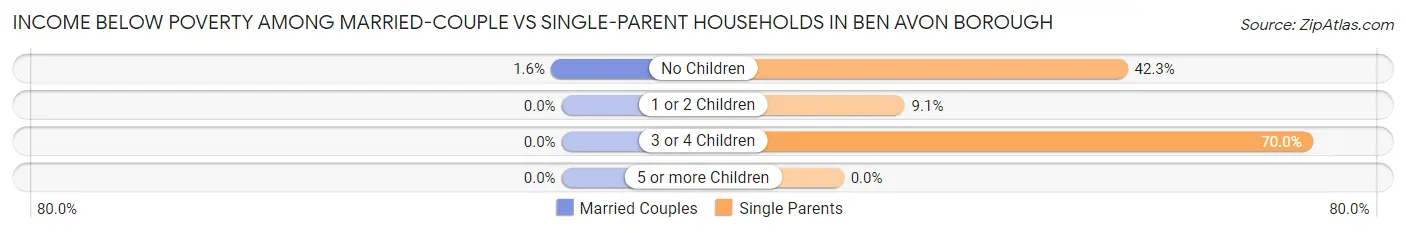
| Children | Married-Couple Families | Single-Parent Households |
| No Children | 4 (1.6%) | 11 (42.3%) |
| 1 or 2 Children | 0 (0.0%) | 4 (9.1%) |
| 3 or 4 Children | 0 (0.0%) | 7 (70.0%) |
| 5 or more Children | 0 (0.0%) | 0 (0.0%) |
| Total | 4 (0.9%) | 22 (27.5%) |
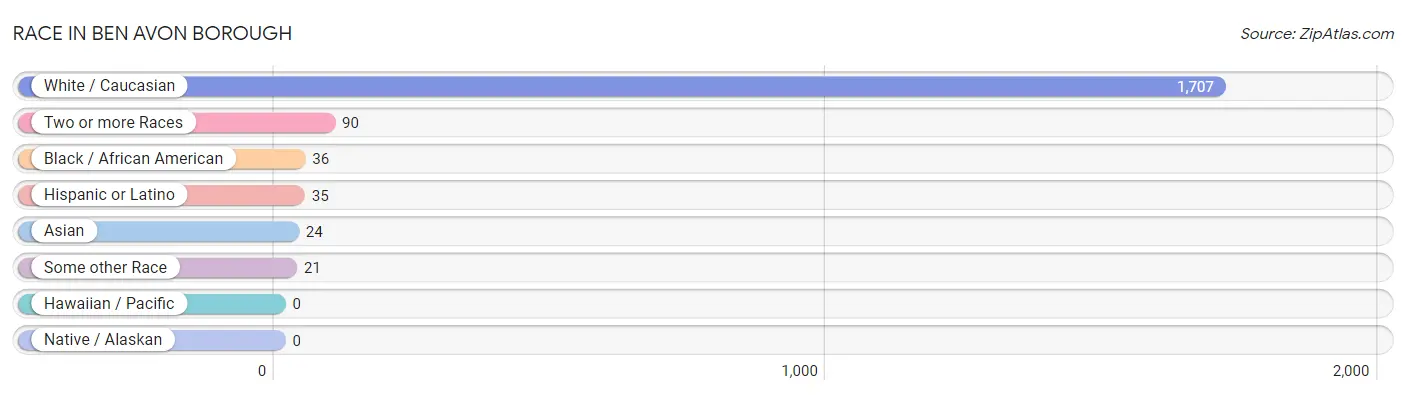
Race in Ben Avon borough
The most populous races in Ben Avon borough are White / Caucasian (1,707 | 90.9%), Two or more Races (90 | 4.8%), and Black / African American (36 | 1.9%).
| Race | # Population | % Population |
| Asian | 24 | 1.3% |
| Black / African American | 36 | 1.9% |
| Hawaiian / Pacific | 0 | 0.0% |
| Hispanic or Latino | 35 | 1.9% |
| Native / Alaskan | 0 | 0.0% |
| White / Caucasian | 1,707 | 90.9% |
| Two or more Races | 90 | 4.8% |
| Some other Race | 21 | 1.1% |
| Total | 1,878 | 100.0% |
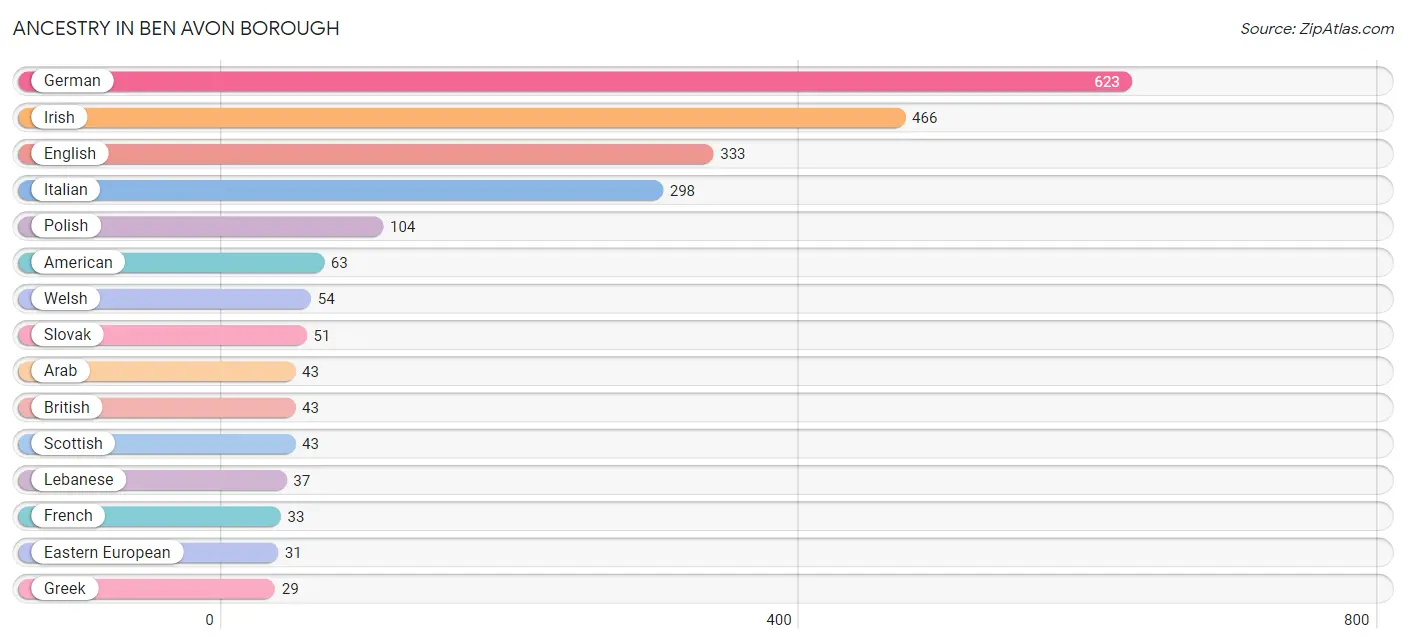
Ancestry in Ben Avon borough
The most populous ancestries reported in Ben Avon borough are German (623 | 33.2%), Irish (466 | 24.8%), English (333 | 17.7%), Italian (298 | 15.9%), and Polish (104 | 5.5%), together accounting for 97.1% of all Ben Avon borough residents.
| Ancestry | # Population | % Population |
| American | 63 | 3.4% |
| Arab | 43 | 2.3% |
| Austrian | 8 | 0.4% |
| Bhutanese | 21 | 1.1% |
| British | 43 | 2.3% |
| Burmese | 18 | 1.0% |
| Cambodian | 3 | 0.2% |
| Croatian | 11 | 0.6% |
| Czech | 3 | 0.2% |
| Czechoslovakian | 2 | 0.1% |
| Danish | 4 | 0.2% |
| Dutch | 6 | 0.3% |
| Eastern European | 31 | 1.7% |
| English | 333 | 17.7% |
| European | 19 | 1.0% |
| Finnish | 6 | 0.3% |
| French | 33 | 1.8% |
| German | 623 | 33.2% |
| Greek | 29 | 1.5% |
| Hungarian | 12 | 0.6% |
| Indian (Asian) | 9 | 0.5% |
| Iranian | 4 | 0.2% |
| Irish | 466 | 24.8% |
| Italian | 298 | 15.9% |
| Jamaican | 8 | 0.4% |
| Lebanese | 37 | 2.0% |
| Lithuanian | 10 | 0.5% |
| Mexican | 6 | 0.3% |
| Northern European | 3 | 0.2% |
| Norwegian | 21 | 1.1% |
| Pennsylvania German | 2 | 0.1% |
| Polish | 104 | 5.5% |
| Puerto Rican | 20 | 1.1% |
| Romanian | 11 | 0.6% |
| Russian | 5 | 0.3% |
| Scandinavian | 8 | 0.4% |
| Scotch-Irish | 28 | 1.5% |
| Scottish | 43 | 2.3% |
| Slovak | 51 | 2.7% |
| Slovene | 6 | 0.3% |
| Spanish | 5 | 0.3% |
| Swedish | 27 | 1.4% |
| Swiss | 18 | 1.0% |
| Syrian | 6 | 0.3% |
| Thai | 3 | 0.2% |
| Ukrainian | 4 | 0.2% |
| Welsh | 54 | 2.9% |
| Yugoslavian | 8 | 0.4% | View All 48 Rows |
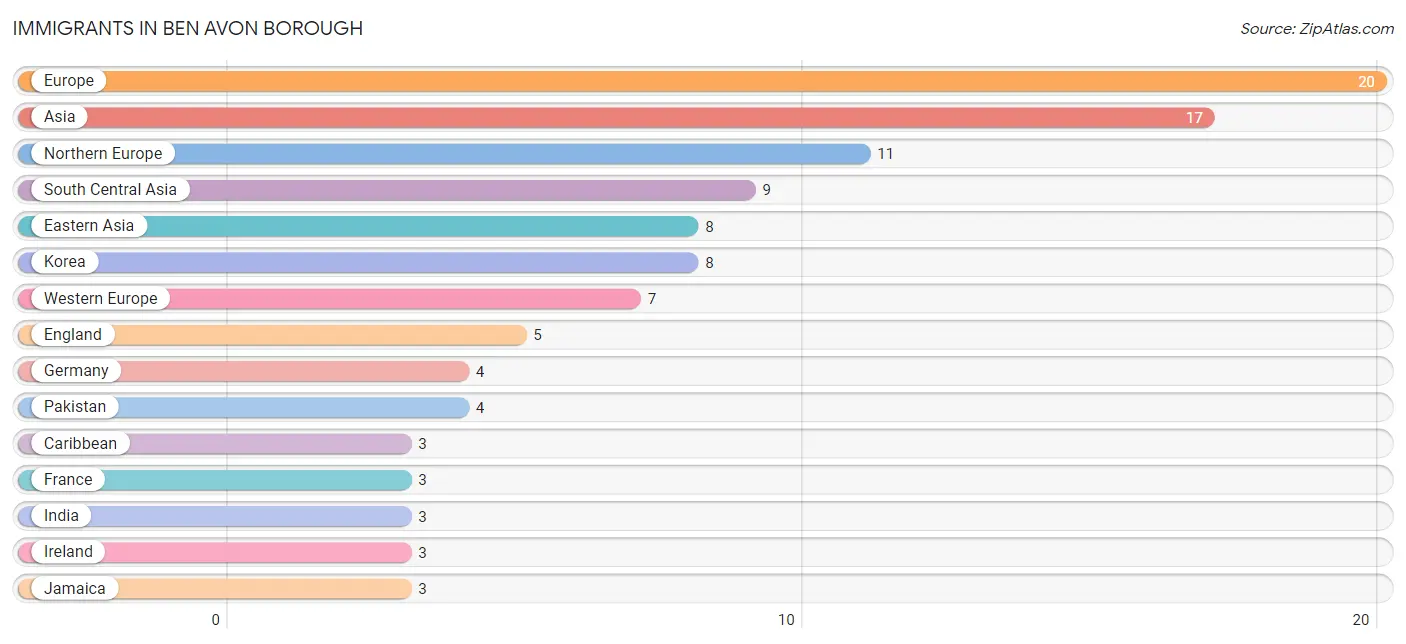
Immigrants in Ben Avon borough
The most numerous immigrant groups reported in Ben Avon borough came from Europe (20 | 1.1%), Asia (17 | 0.9%), Northern Europe (11 | 0.6%), South Central Asia (9 | 0.5%), and Eastern Asia (8 | 0.4%), together accounting for 3.5% of all Ben Avon borough residents.
| Immigration Origin | # Population | % Population |
| Asia | 17 | 0.9% |
| Caribbean | 3 | 0.2% |
| Eastern Asia | 8 | 0.4% |
| Eastern Europe | 2 | 0.1% |
| England | 5 | 0.3% |
| Europe | 20 | 1.1% |
| France | 3 | 0.2% |
| Germany | 4 | 0.2% |
| Hungary | 2 | 0.1% |
| India | 3 | 0.2% |
| Ireland | 3 | 0.2% |
| Jamaica | 3 | 0.2% |
| Kazakhstan | 2 | 0.1% |
| Korea | 8 | 0.4% |
| Latin America | 3 | 0.2% |
| Northern Europe | 11 | 0.6% |
| Pakistan | 4 | 0.2% |
| South Central Asia | 9 | 0.5% |
| Western Europe | 7 | 0.4% | View All 19 Rows |
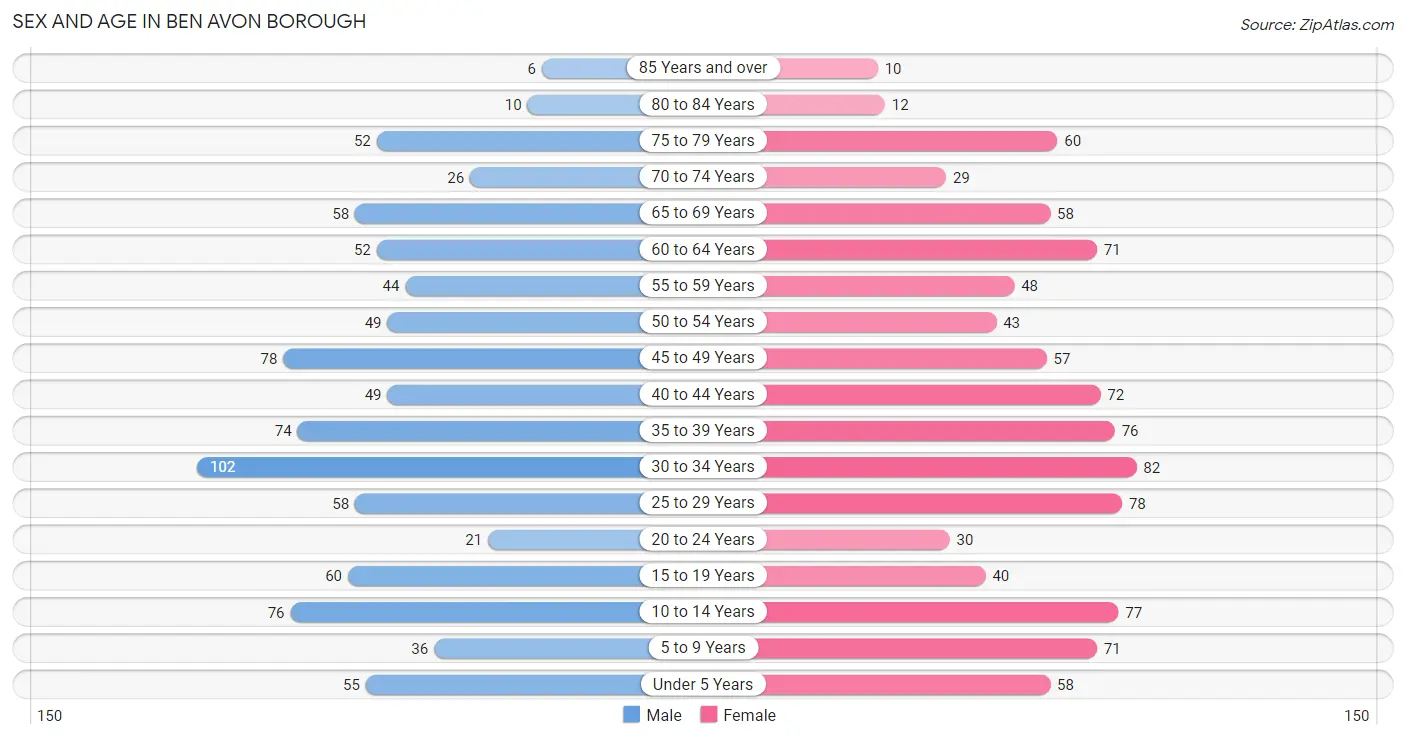
Sex and Age in Ben Avon borough
Sex and Age in Ben Avon borough
The most populous age groups in Ben Avon borough are 30 to 34 Years (102 | 11.3%) for men and 30 to 34 Years (82 | 8.4%) for women.
| Age Bracket | Male | Female |
| Under 5 Years | 55 (6.1%) | 58 (6.0%) |
| 5 to 9 Years | 36 (4.0%) | 71 (7.3%) |
| 10 to 14 Years | 76 (8.4%) | 77 (7.9%) |
| 15 to 19 Years | 60 (6.6%) | 40 (4.1%) |
| 20 to 24 Years | 21 (2.3%) | 30 (3.1%) |
| 25 to 29 Years | 58 (6.4%) | 78 (8.0%) |
| 30 to 34 Years | 102 (11.3%) | 82 (8.4%) |
| 35 to 39 Years | 74 (8.2%) | 76 (7.8%) |
| 40 to 44 Years | 49 (5.4%) | 72 (7.4%) |
| 45 to 49 Years | 78 (8.6%) | 57 (5.9%) |
| 50 to 54 Years | 49 (5.4%) | 43 (4.4%) |
| 55 to 59 Years | 44 (4.9%) | 48 (4.9%) |
| 60 to 64 Years | 52 (5.7%) | 71 (7.3%) |
| 65 to 69 Years | 58 (6.4%) | 58 (6.0%) |
| 70 to 74 Years | 26 (2.9%) | 29 (3.0%) |
| 75 to 79 Years | 52 (5.7%) | 60 (6.2%) |
| 80 to 84 Years | 10 (1.1%) | 12 (1.2%) |
| 85 Years and over | 6 (0.7%) | 10 (1.0%) |
| Total | 906 (100.0%) | 972 (100.0%) |
Families and Households in Ben Avon borough
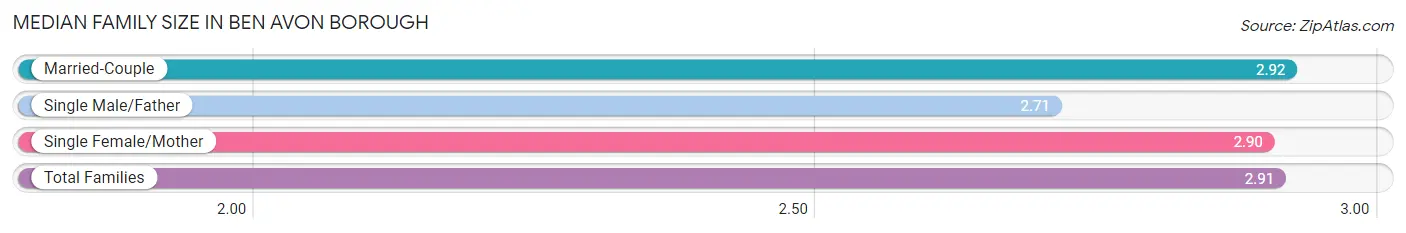
Median Family Size in Ben Avon borough
The median family size in Ben Avon borough is 2.91 persons per family, with married-couple families (464 | 85.3%) accounting for the largest median family size of 2.92 persons per family. On the other hand, single male/father families (28 | 5.1%) represent the smallest median family size with 2.71 persons per family.
| Family Type | # Families | Family Size |
| Married-Couple | 464 (85.3%) | 2.92 |
| Single Male/Father | 28 (5.1%) | 2.71 |
| Single Female/Mother | 52 (9.6%) | 2.90 |
| Total Families | 544 (100.0%) | 2.91 |
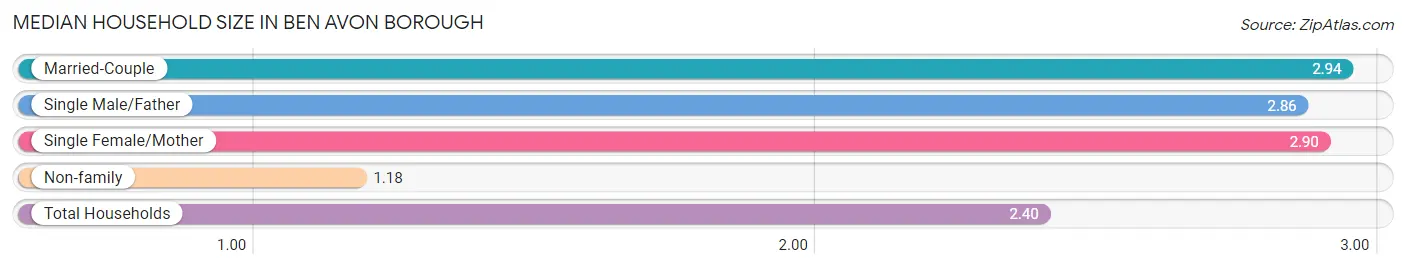
Median Household Size in Ben Avon borough
The median household size in Ben Avon borough is 2.40 persons per household, with married-couple households (464 | 59.6%) accounting for the largest median household size of 2.94 persons per household. non-family households (235 | 30.2%) represent the smallest median household size with 1.18 persons per household.
| Household Type | # Households | Household Size |
| Married-Couple | 464 (59.6%) | 2.94 |
| Single Male/Father | 28 (3.6%) | 2.86 |
| Single Female/Mother | 52 (6.7%) | 2.90 |
| Non-family | 235 (30.2%) | 1.18 |
| Total Households | 779 (100.0%) | 2.40 |
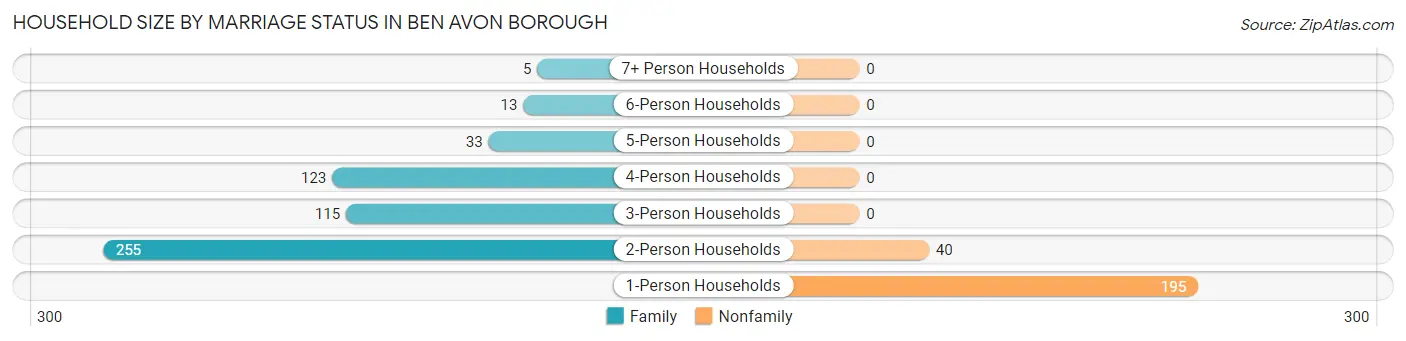
Household Size by Marriage Status in Ben Avon borough
Out of a total of 779 households in Ben Avon borough, 544 (69.8%) are family households, while 235 (30.2%) are nonfamily households. The most numerous type of family households are 2-person households, comprising 255, and the most common type of nonfamily households are 1-person households, comprising 195.
| Household Size | Family Households | Nonfamily Households |
| 1-Person Households | - | 195 (25.0%) |
| 2-Person Households | 255 (32.7%) | 40 (5.1%) |
| 3-Person Households | 115 (14.8%) | 0 (0.0%) |
| 4-Person Households | 123 (15.8%) | 0 (0.0%) |
| 5-Person Households | 33 (4.2%) | 0 (0.0%) |
| 6-Person Households | 13 (1.7%) | 0 (0.0%) |
| 7+ Person Households | 5 (0.6%) | 0 (0.0%) |
| Total | 544 (69.8%) | 235 (30.2%) |
Female Fertility in Ben Avon borough
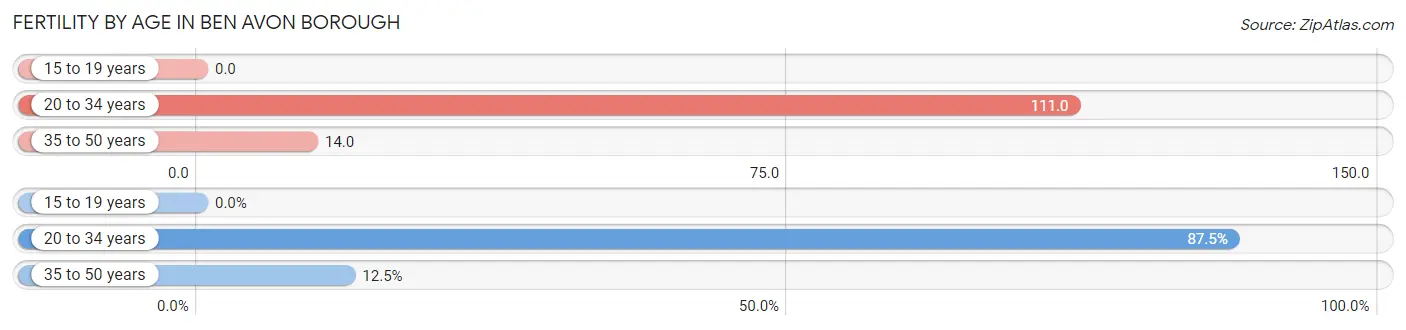
Fertility by Age in Ben Avon borough
Average fertility rate in Ben Avon borough is 53.0 births per 1,000 women. Women in the age bracket of 20 to 34 years have the highest fertility rate with 111.0 births per 1,000 women. Women in the age bracket of 20 to 34 years acount for 87.5% of all women with births.
| Age Bracket | Women with Births | Births / 1,000 Women |
| 15 to 19 years | 0 (0.0%) | 0.0 |
| 20 to 34 years | 21 (87.5%) | 111.0 |
| 35 to 50 years | 3 (12.5%) | 14.0 |
| Total | 24 (100.0%) | 53.0 |
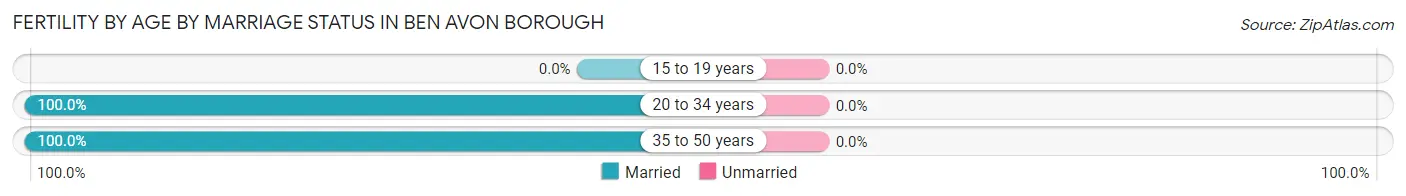
Fertility by Age by Marriage Status in Ben Avon borough
| Age Bracket | Married | Unmarried |
| 15 to 19 years | 0 (0.0%) | 0 (0.0%) |
| 20 to 34 years | 21 (100.0%) | 0 (0.0%) |
| 35 to 50 years | 3 (100.0%) | 0 (0.0%) |
| Total | 24 (100.0%) | 0 (0.0%) |
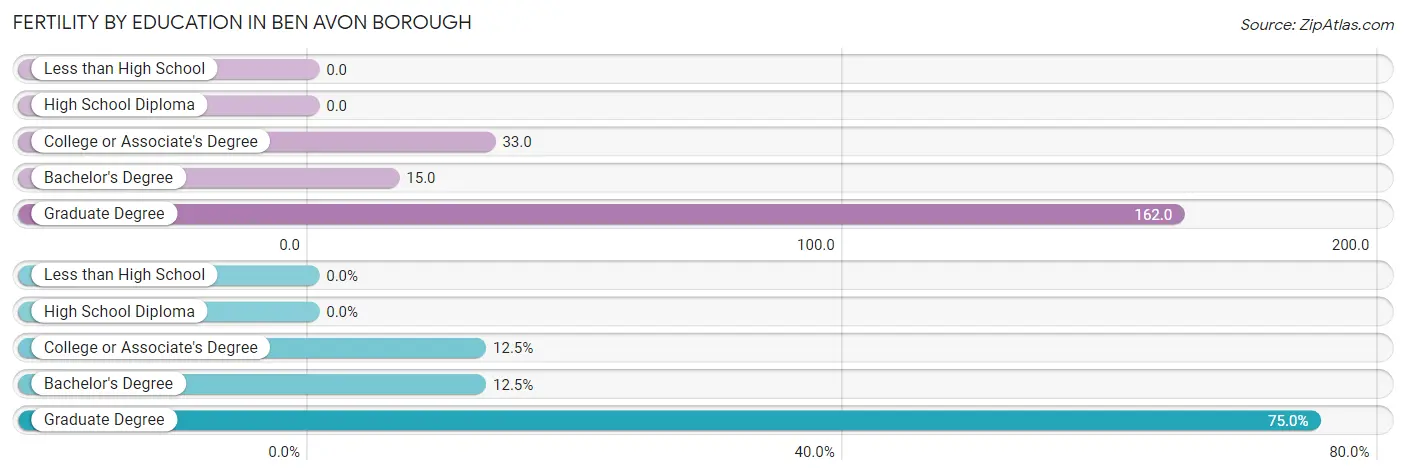
Fertility by Education in Ben Avon borough
| Educational Attainment | Women with Births | Births / 1,000 Women |
| Less than High School | 0 (0.0%) | 0.0 |
| High School Diploma | 0 (0.0%) | 0.0 |
| College or Associate's Degree | 3 (12.5%) | 33.0 |
| Bachelor's Degree | 3 (12.5%) | 15.0 |
| Graduate Degree | 18 (75.0%) | 162.0 |
| Total | 24 (100.0%) | 53.0 |
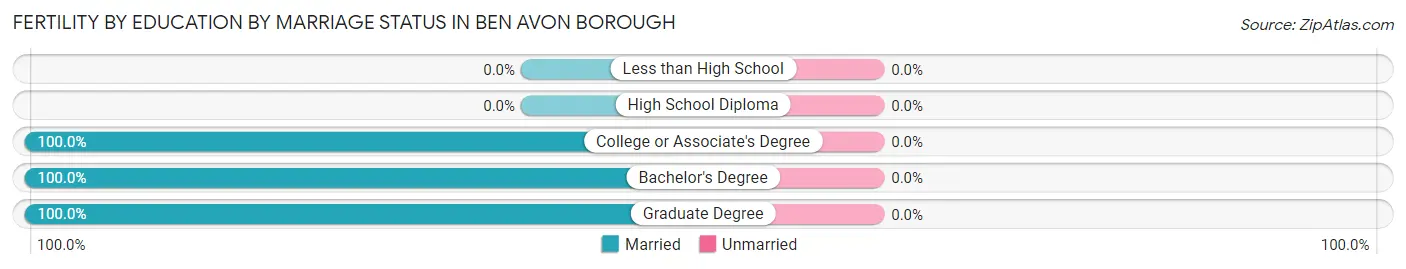
Fertility by Education by Marriage Status in Ben Avon borough
| Educational Attainment | Married | Unmarried |
| Less than High School | 0 (0.0%) | 0 (0.0%) |
| High School Diploma | 0 (0.0%) | 0 (0.0%) |
| College or Associate's Degree | 3 (100.0%) | 0 (0.0%) |
| Bachelor's Degree | 3 (100.0%) | 0 (0.0%) |
| Graduate Degree | 18 (100.0%) | 0 (0.0%) |
| Total | 24 (100.0%) | 0 (0.0%) |
Employment Characteristics in Ben Avon borough
Employment by Class of Employer in Ben Avon borough
Among the 1,012 employed individuals in Ben Avon borough, private company employees (697 | 68.9%), not-for-profit organizations (155 | 15.3%), and self-employed (not incorporated) (63 | 6.2%) make up the most common classes of employment.
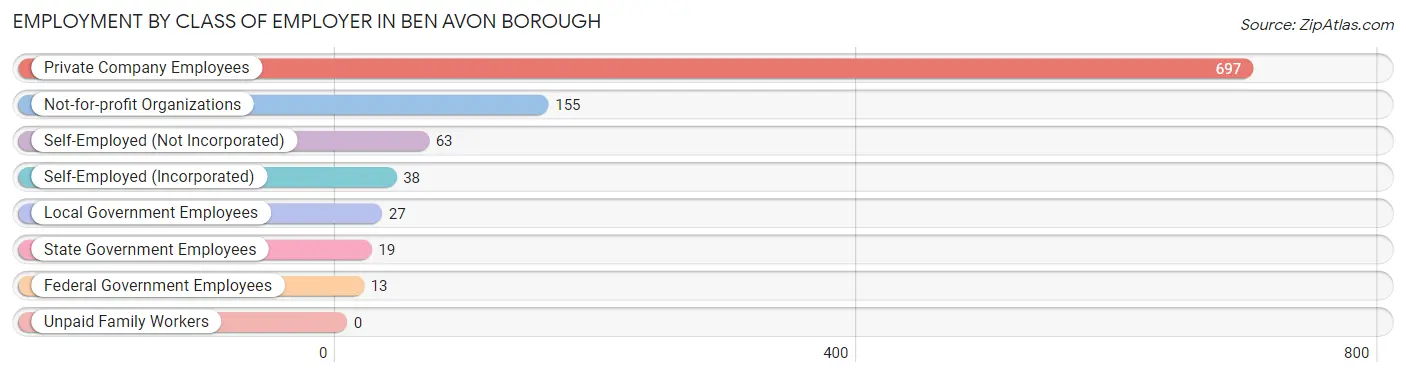
| Employer Class | # Employees | % Employees |
| Private Company Employees | 697 | 68.9% |
| Self-Employed (Incorporated) | 38 | 3.7% |
| Self-Employed (Not Incorporated) | 63 | 6.2% |
| Not-for-profit Organizations | 155 | 15.3% |
| Local Government Employees | 27 | 2.7% |
| State Government Employees | 19 | 1.9% |
| Federal Government Employees | 13 | 1.3% |
| Unpaid Family Workers | 0 | 0.0% |
| Total | 1,012 | 100.0% |
Employment Status by Age in Ben Avon borough
According to the labor force statistics for Ben Avon borough, out of the total population over 16 years of age (1,498), 74.6% or 1,118 individuals are in the labor force, with 3.7% or 41 of them unemployed. The age group with the highest labor force participation rate is 25 to 29 years, with 95.6% or 130 individuals in the labor force. Within the labor force, the 20 to 24 years age range has the highest percentage of unemployed individuals, with 13.2% or 5 of them being unemployed.
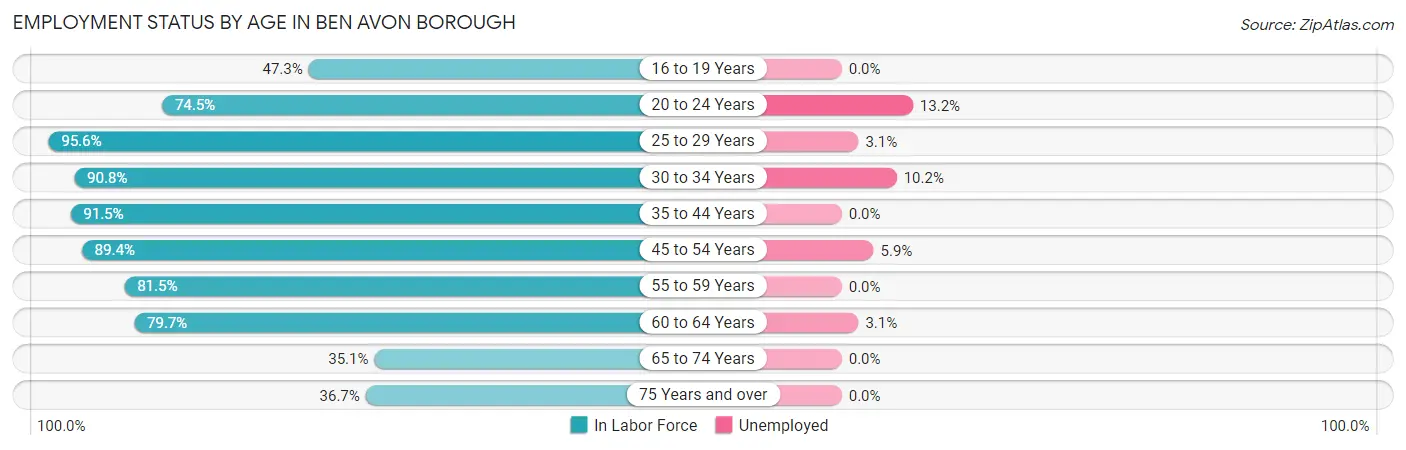
| Age Bracket | In Labor Force | Unemployed |
| 16 to 19 Years | 44 (47.3%) | 0 (0.0%) |
| 20 to 24 Years | 38 (74.5%) | 5 (13.2%) |
| 25 to 29 Years | 130 (95.6%) | 4 (3.1%) |
| 30 to 34 Years | 167 (90.8%) | 17 (10.2%) |
| 35 to 44 Years | 248 (91.5%) | 0 (0.0%) |
| 45 to 54 Years | 203 (89.4%) | 12 (5.9%) |
| 55 to 59 Years | 75 (81.5%) | 0 (0.0%) |
| 60 to 64 Years | 98 (79.7%) | 3 (3.1%) |
| 65 to 74 Years | 60 (35.1%) | 0 (0.0%) |
| 75 Years and over | 55 (36.7%) | 0 (0.0%) |
| Total | 1,118 (74.6%) | 41 (3.7%) |
Employment Status by Educational Attainment in Ben Avon borough
According to labor force statistics for Ben Avon borough, 89.2% of individuals (921) out of the total population between 25 and 64 years of age (1,033) are in the labor force, with 3.9% or 36 of them being unemployed. The group with the highest labor force participation rate are those with the educational attainment of bachelor's degree or higher, with 92.2% or 690 individuals in the labor force. Within the labor force, individuals with less than high school education have the highest percentage of unemployment, with 50.0% or 3 of them being unemployed.
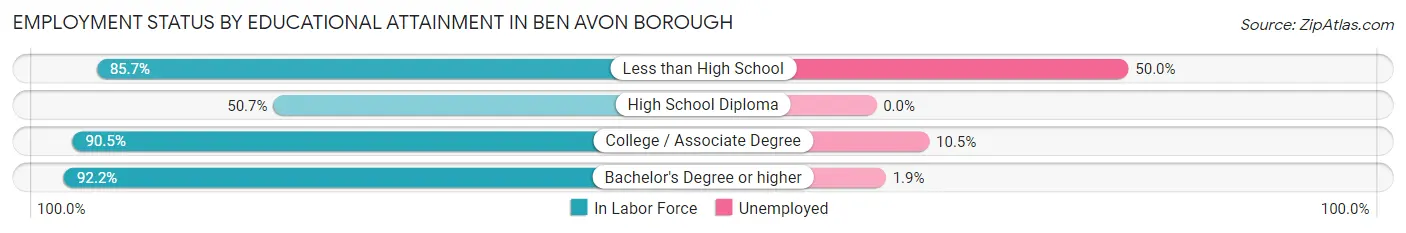
| Educational Attainment | In Labor Force | Unemployed |
| Less than High School | 6 (85.7%) | 4 (50.0%) |
| High School Diploma | 34 (50.7%) | 0 (0.0%) |
| College / Associate Degree | 191 (90.5%) | 22 (10.5%) |
| Bachelor's Degree or higher | 690 (92.2%) | 14 (1.9%) |
| Total | 921 (89.2%) | 40 (3.9%) |
Employment Occupations by Sex in Ben Avon borough
Management, Business, Science and Arts Occupations
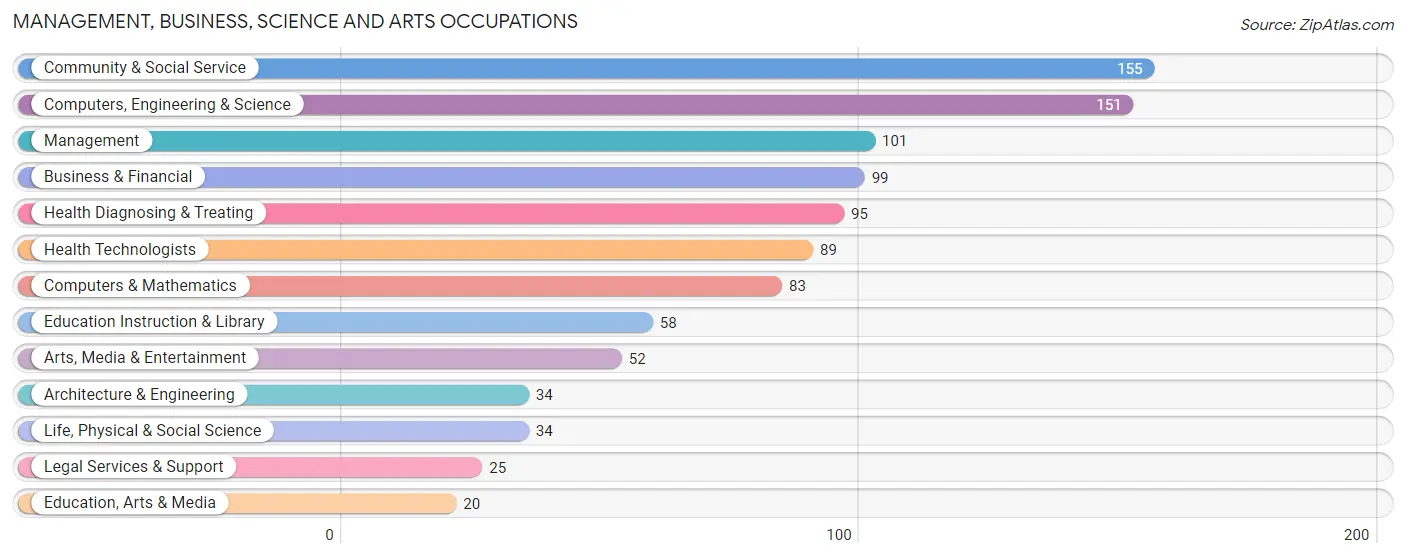
The most common Management, Business, Science and Arts occupations in Ben Avon borough are Community & Social Service (155 | 14.4%), Computers, Engineering & Science (151 | 14.0%), Management (101 | 9.4%), Business & Financial (99 | 9.2%), and Health Diagnosing & Treating (95 | 8.8%).
Management, Business, Science and Arts Occupations by Sex
Within the Management, Business, Science and Arts occupations in Ben Avon borough, the most male-oriented occupations are Computers & Mathematics (96.4%), Computers, Engineering & Science (82.1%), and Legal Services & Support (80.0%), while the most female-oriented occupations are Education, Arts & Media (85.0%), Health Diagnosing & Treating (74.7%), and Health Technologists (74.2%).
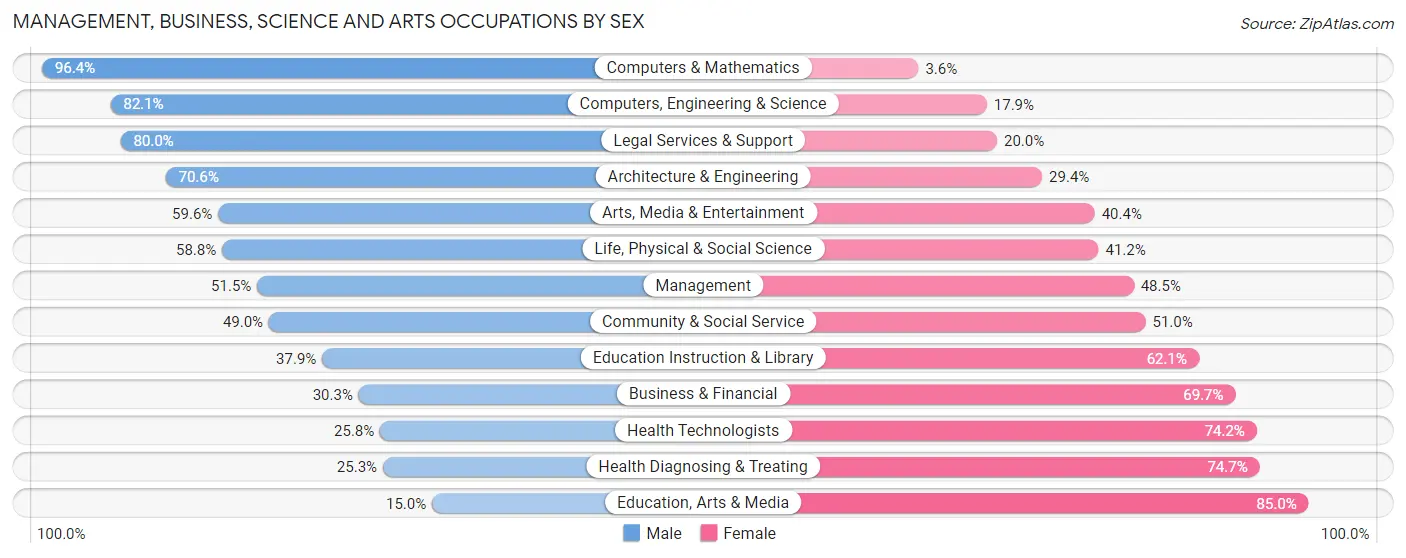
| Occupation | Male | Female |
| Management | 52 (51.5%) | 49 (48.5%) |
| Business & Financial | 30 (30.3%) | 69 (69.7%) |
| Computers, Engineering & Science | 124 (82.1%) | 27 (17.9%) |
| Computers & Mathematics | 80 (96.4%) | 3 (3.6%) |
| Architecture & Engineering | 24 (70.6%) | 10 (29.4%) |
| Life, Physical & Social Science | 20 (58.8%) | 14 (41.2%) |
| Community & Social Service | 76 (49.0%) | 79 (51.0%) |
| Education, Arts & Media | 3 (15.0%) | 17 (85.0%) |
| Legal Services & Support | 20 (80.0%) | 5 (20.0%) |
| Education Instruction & Library | 22 (37.9%) | 36 (62.1%) |
| Arts, Media & Entertainment | 31 (59.6%) | 21 (40.4%) |
| Health Diagnosing & Treating | 24 (25.3%) | 71 (74.7%) |
| Health Technologists | 23 (25.8%) | 66 (74.2%) |
| Total (Category) | 306 (50.9%) | 295 (49.1%) |
| Total (Overall) | 551 (51.2%) | 526 (48.8%) |
Services Occupations
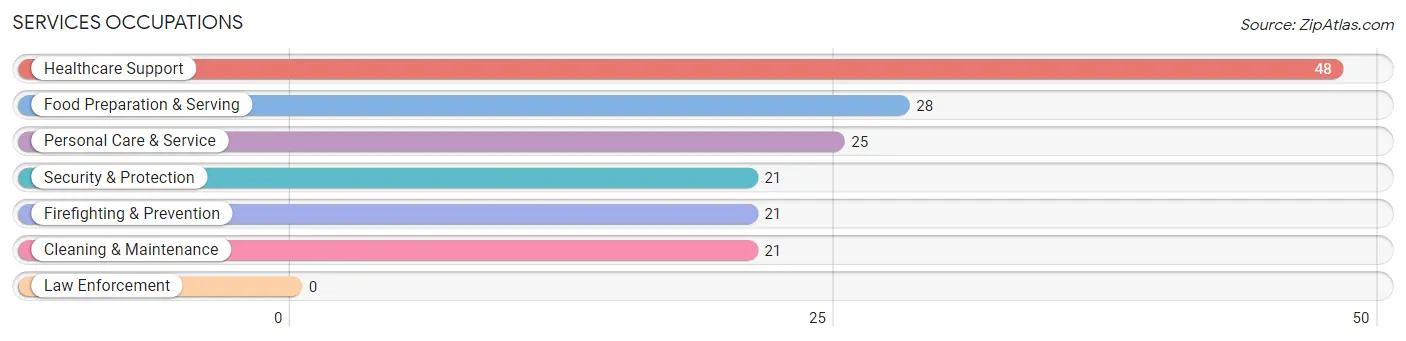
The most common Services occupations in Ben Avon borough are Healthcare Support (48 | 4.5%), Food Preparation & Serving (28 | 2.6%), Personal Care & Service (25 | 2.3%), Security & Protection (21 | 1.9%), and Firefighting & Prevention (21 | 1.9%).
Services Occupations by Sex
Within the Services occupations in Ben Avon borough, the most male-oriented occupations are Security & Protection (100.0%), Firefighting & Prevention (100.0%), and Food Preparation & Serving (53.6%), while the most female-oriented occupations are Healthcare Support (100.0%), Personal Care & Service (88.0%), and Cleaning & Maintenance (47.6%).
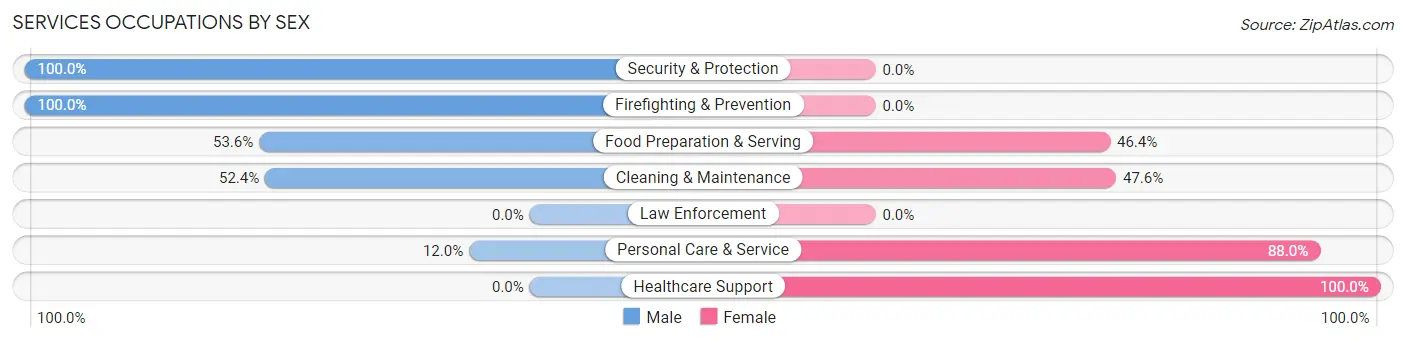
| Occupation | Male | Female |
| Healthcare Support | 0 (0.0%) | 48 (100.0%) |
| Security & Protection | 21 (100.0%) | 0 (0.0%) |
| Firefighting & Prevention | 21 (100.0%) | 0 (0.0%) |
| Law Enforcement | 0 (0.0%) | 0 (0.0%) |
| Food Preparation & Serving | 15 (53.6%) | 13 (46.4%) |
| Cleaning & Maintenance | 11 (52.4%) | 10 (47.6%) |
| Personal Care & Service | 3 (12.0%) | 22 (88.0%) |
| Total (Category) | 50 (35.0%) | 93 (65.0%) |
| Total (Overall) | 551 (51.2%) | 526 (48.8%) |
Sales and Office Occupations
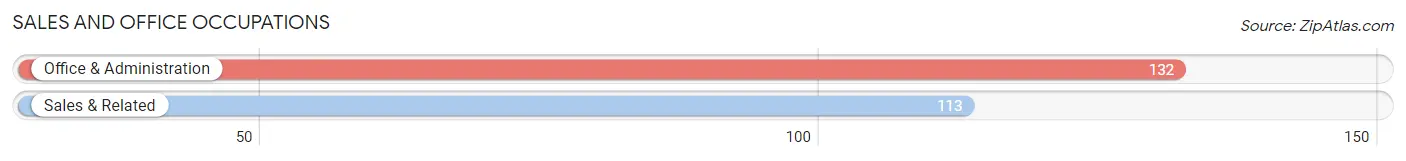
The most common Sales and Office occupations in Ben Avon borough are Office & Administration (132 | 12.3%), and Sales & Related (113 | 10.5%).
Sales and Office Occupations by Sex
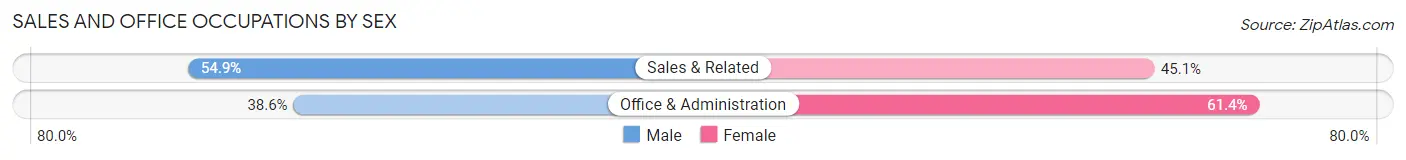
| Occupation | Male | Female |
| Sales & Related | 62 (54.9%) | 51 (45.1%) |
| Office & Administration | 51 (38.6%) | 81 (61.4%) |
| Total (Category) | 113 (46.1%) | 132 (53.9%) |
| Total (Overall) | 551 (51.2%) | 526 (48.8%) |
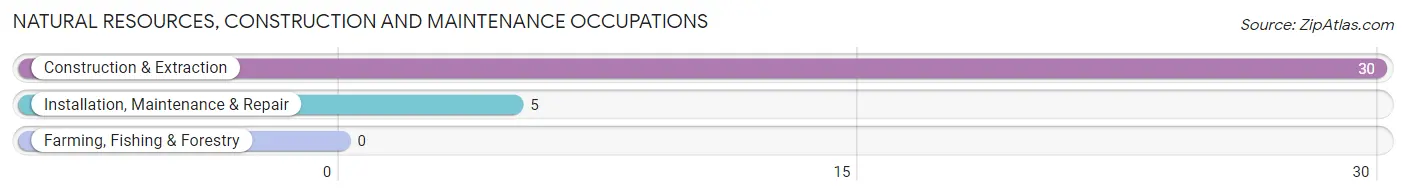
Natural Resources, Construction and Maintenance Occupations
The most common Natural Resources, Construction and Maintenance occupations in Ben Avon borough are Construction & Extraction (30 | 2.8%), and Installation, Maintenance & Repair (5 | 0.5%).
Natural Resources, Construction and Maintenance Occupations by Sex
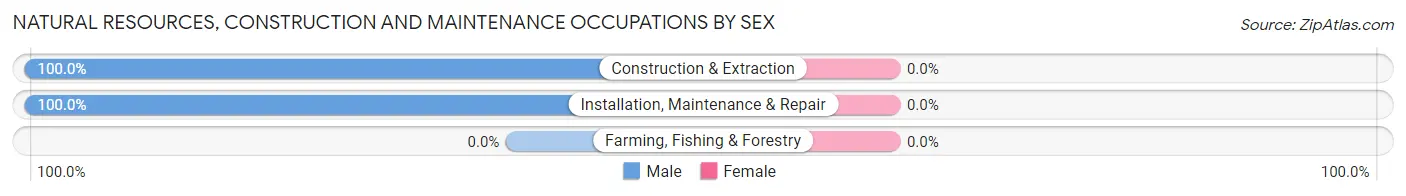
| Occupation | Male | Female |
| Farming, Fishing & Forestry | 0 (0.0%) | 0 (0.0%) |
| Construction & Extraction | 30 (100.0%) | 0 (0.0%) |
| Installation, Maintenance & Repair | 5 (100.0%) | 0 (0.0%) |
| Total (Category) | 35 (100.0%) | 0 (0.0%) |
| Total (Overall) | 551 (51.2%) | 526 (48.8%) |
Production, Transportation and Moving Occupations
The most common Production, Transportation and Moving occupations in Ben Avon borough are Transportation (22 | 2.0%), Material Moving (21 | 1.9%), and Production (10 | 0.9%).
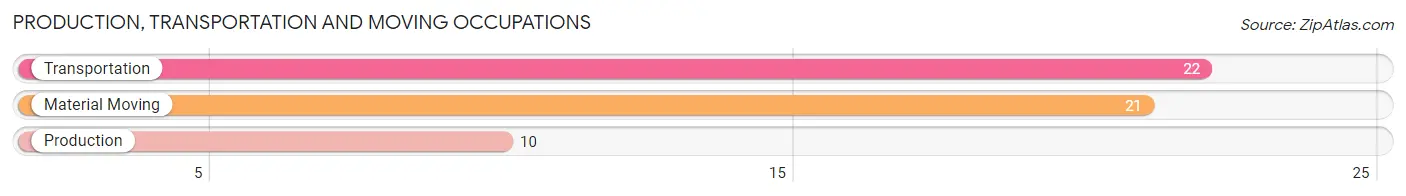
Production, Transportation and Moving Occupations by Sex
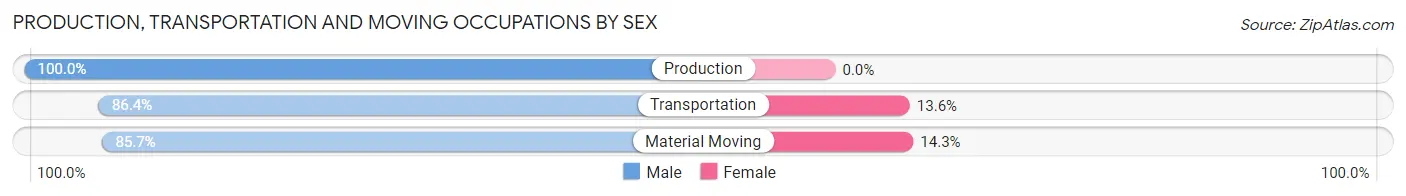
| Occupation | Male | Female |
| Production | 10 (100.0%) | 0 (0.0%) |
| Transportation | 19 (86.4%) | 3 (13.6%) |
| Material Moving | 18 (85.7%) | 3 (14.3%) |
| Total (Category) | 47 (88.7%) | 6 (11.3%) |
| Total (Overall) | 551 (51.2%) | 526 (48.8%) |
Employment Industries by Sex in Ben Avon borough
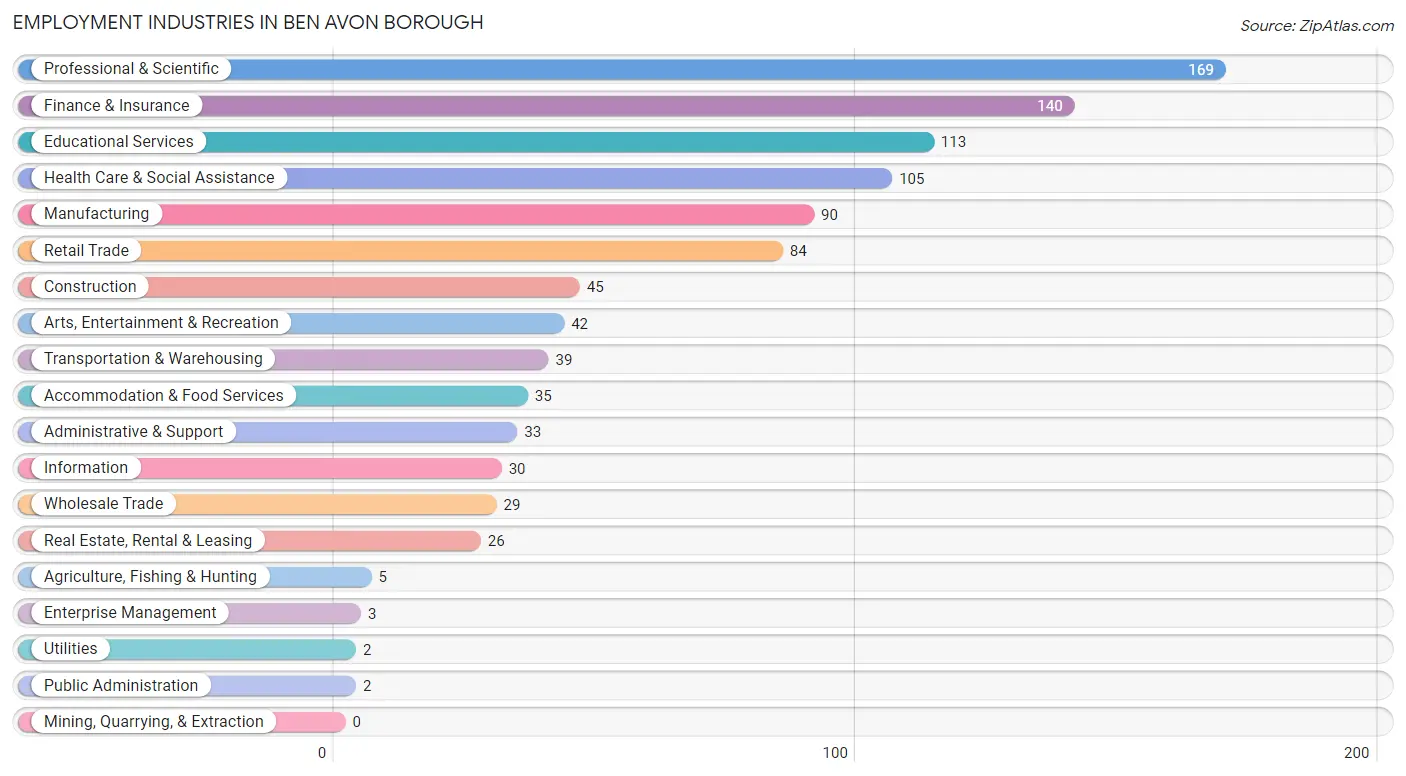
Employment Industries in Ben Avon borough
The major employment industries in Ben Avon borough include Professional & Scientific (169 | 15.7%), Finance & Insurance (140 | 13.0%), Educational Services (113 | 10.5%), Health Care & Social Assistance (105 | 9.8%), and Manufacturing (90 | 8.4%).
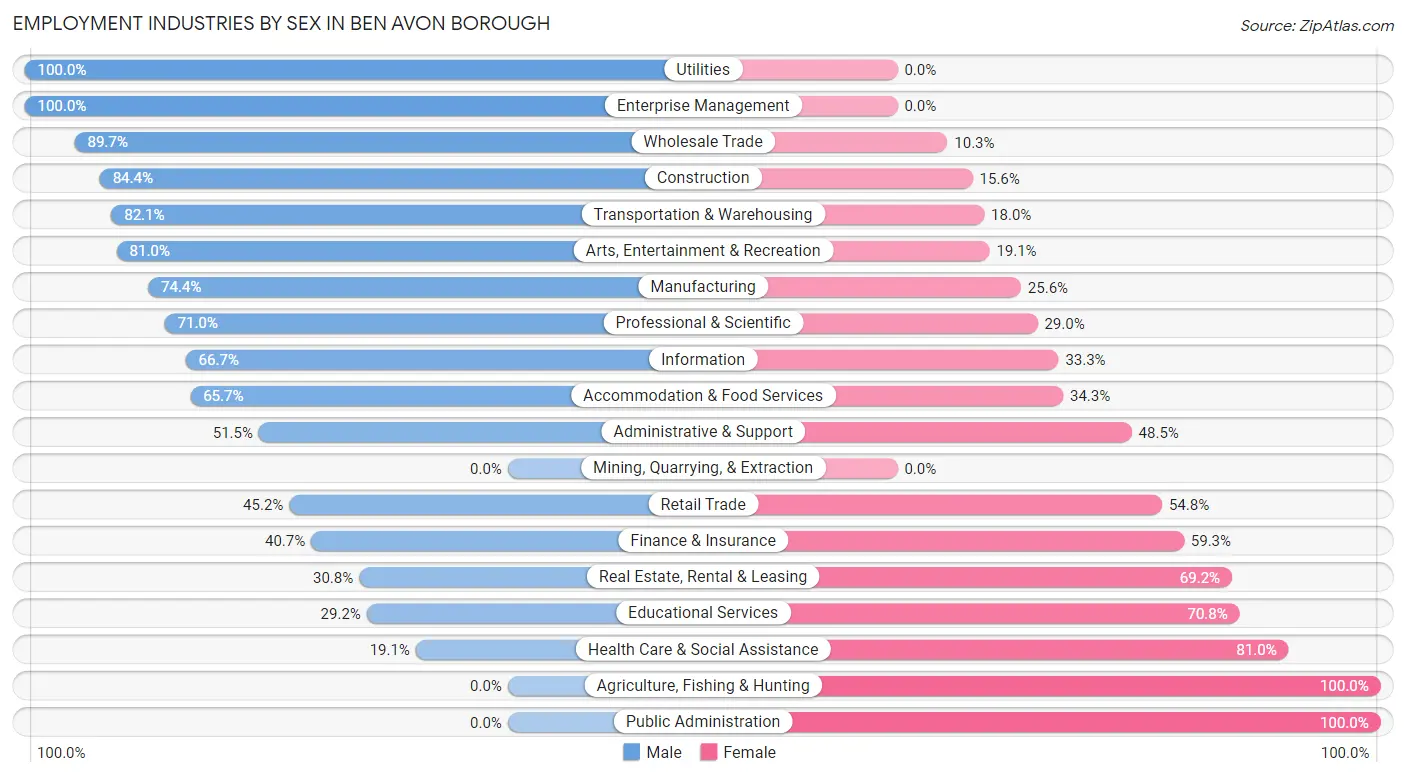
Employment Industries by Sex in Ben Avon borough
The Ben Avon borough industries that see more men than women are Utilities (100.0%), Enterprise Management (100.0%), and Wholesale Trade (89.7%), whereas the industries that tend to have a higher number of women are Agriculture, Fishing & Hunting (100.0%), Public Administration (100.0%), and Health Care & Social Assistance (80.9%).
| Industry | Male | Female |
| Agriculture, Fishing & Hunting | 0 (0.0%) | 5 (100.0%) |
| Mining, Quarrying, & Extraction | 0 (0.0%) | 0 (0.0%) |
| Construction | 38 (84.4%) | 7 (15.6%) |
| Manufacturing | 67 (74.4%) | 23 (25.6%) |
| Wholesale Trade | 26 (89.7%) | 3 (10.3%) |
| Retail Trade | 38 (45.2%) | 46 (54.8%) |
| Transportation & Warehousing | 32 (82.1%) | 7 (17.9%) |
| Utilities | 2 (100.0%) | 0 (0.0%) |
| Information | 20 (66.7%) | 10 (33.3%) |
| Finance & Insurance | 57 (40.7%) | 83 (59.3%) |
| Real Estate, Rental & Leasing | 8 (30.8%) | 18 (69.2%) |
| Professional & Scientific | 120 (71.0%) | 49 (29.0%) |
| Enterprise Management | 3 (100.0%) | 0 (0.0%) |
| Administrative & Support | 17 (51.5%) | 16 (48.5%) |
| Educational Services | 33 (29.2%) | 80 (70.8%) |
| Health Care & Social Assistance | 20 (19.1%) | 85 (80.9%) |
| Arts, Entertainment & Recreation | 34 (80.9%) | 8 (19.1%) |
| Accommodation & Food Services | 23 (65.7%) | 12 (34.3%) |
| Public Administration | 0 (0.0%) | 2 (100.0%) |
| Total | 551 (51.2%) | 526 (48.8%) |
Education in Ben Avon borough
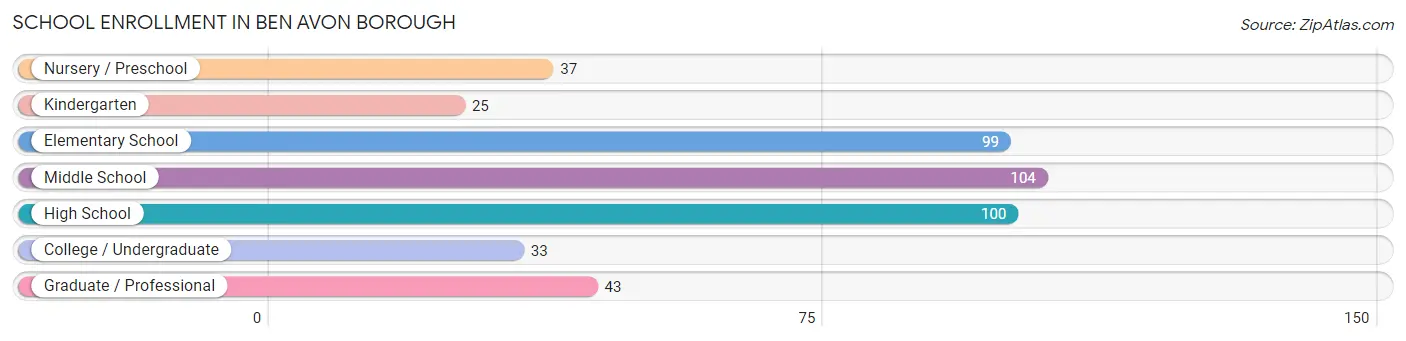
School Enrollment in Ben Avon borough
The most common levels of schooling among the 441 students in Ben Avon borough are middle school (104 | 23.6%), high school (100 | 22.7%), and elementary school (99 | 22.5%).
| School Level | # Students | % Students |
| Nursery / Preschool | 37 | 8.4% |
| Kindergarten | 25 | 5.7% |
| Elementary School | 99 | 22.5% |
| Middle School | 104 | 23.6% |
| High School | 100 | 22.7% |
| College / Undergraduate | 33 | 7.5% |
| Graduate / Professional | 43 | 9.8% |
| Total | 441 | 100.0% |
School Enrollment by Age by Funding Source in Ben Avon borough
Out of a total of 441 students who are enrolled in schools in Ben Avon borough, 85 (19.3%) attend a private institution, while the remaining 356 (80.7%) are enrolled in public schools. The age group of 3 to 4 year olds has the highest likelihood of being enrolled in private schools, with 14 (58.3% in the age bracket) enrolled. Conversely, the age group of 15 to 17 year olds has the lowest likelihood of being enrolled in a private school, with 59 (90.8% in the age bracket) attending a public institution.
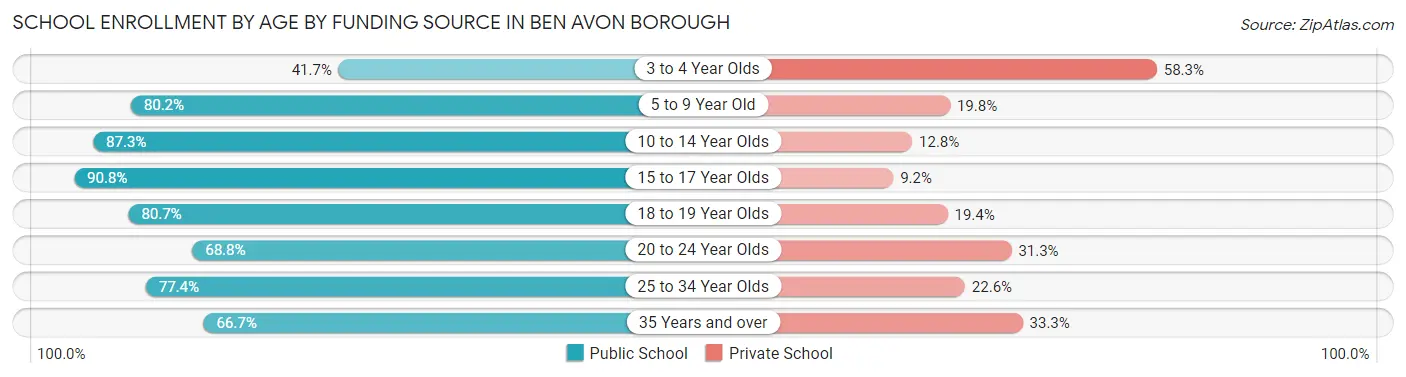
| Age Bracket | Public School | Private School |
| 3 to 4 Year Olds | 10 (41.7%) | 14 (58.3%) |
| 5 to 9 Year Old | 81 (80.2%) | 20 (19.8%) |
| 10 to 14 Year Olds | 130 (87.3%) | 19 (12.8%) |
| 15 to 17 Year Olds | 59 (90.8%) | 6 (9.2%) |
| 18 to 19 Year Olds | 25 (80.6%) | 6 (19.4%) |
| 20 to 24 Year Olds | 11 (68.8%) | 5 (31.2%) |
| 25 to 34 Year Olds | 24 (77.4%) | 7 (22.6%) |
| 35 Years and over | 16 (66.7%) | 8 (33.3%) |
| Total | 356 (80.7%) | 85 (19.3%) |
Educational Attainment by Field of Study in Ben Avon borough
Business (174 | 18.9%), engineering (85 | 9.2%), science & technology (80 | 8.7%), education (78 | 8.5%), and social sciences (74 | 8.0%) are the most common fields of study among 921 individuals in Ben Avon borough who have obtained a bachelor's degree or higher.
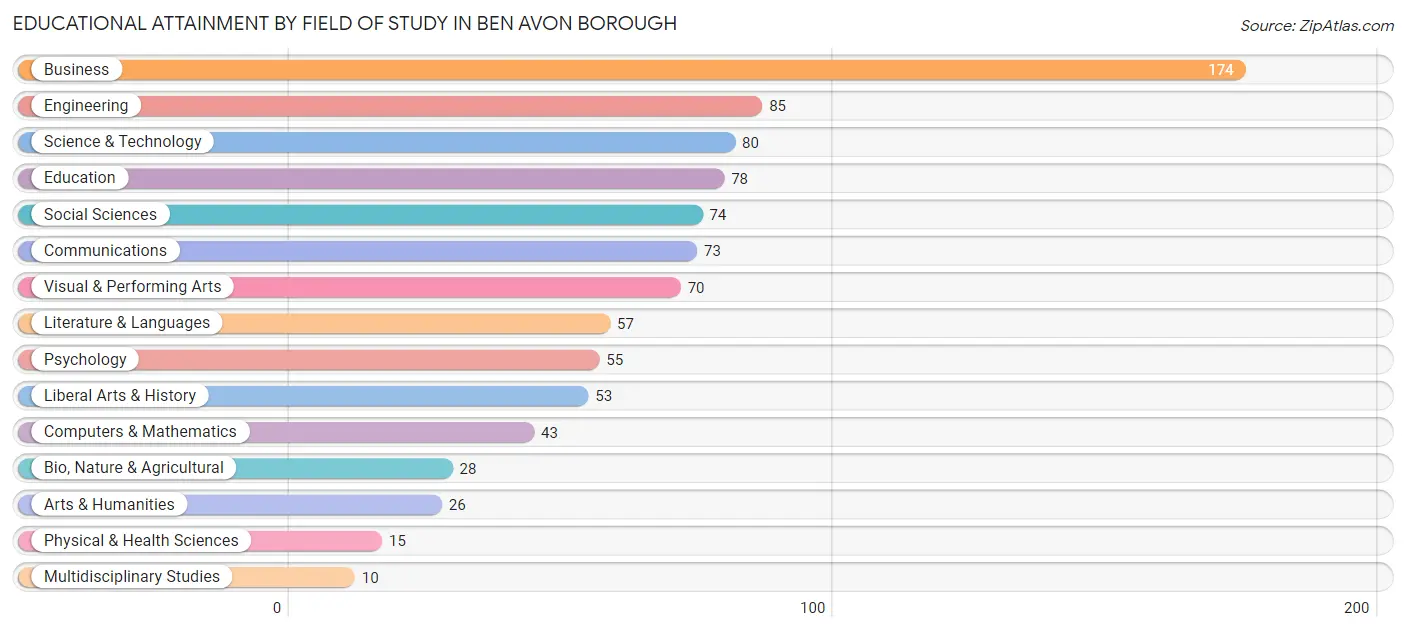
| Field of Study | # Graduates | % Graduates |
| Computers & Mathematics | 43 | 4.7% |
| Bio, Nature & Agricultural | 28 | 3.0% |
| Physical & Health Sciences | 15 | 1.6% |
| Psychology | 55 | 6.0% |
| Social Sciences | 74 | 8.0% |
| Engineering | 85 | 9.2% |
| Multidisciplinary Studies | 10 | 1.1% |
| Science & Technology | 80 | 8.7% |
| Business | 174 | 18.9% |
| Education | 78 | 8.5% |
| Literature & Languages | 57 | 6.2% |
| Liberal Arts & History | 53 | 5.8% |
| Visual & Performing Arts | 70 | 7.6% |
| Communications | 73 | 7.9% |
| Arts & Humanities | 26 | 2.8% |
| Total | 921 | 100.0% |
Transportation & Commute in Ben Avon borough
Vehicle Availability by Sex in Ben Avon borough
The most prevalent vehicle ownership categories in Ben Avon borough are males with 2 vehicles (308, accounting for 57.0%) and females with 2 vehicles (237, making up 65.7%).
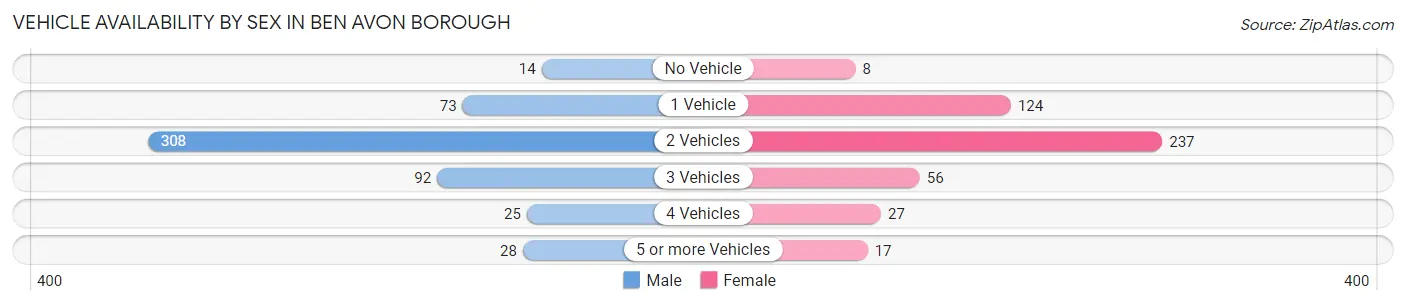
| Vehicles Available | Male | Female |
| No Vehicle | 14 (2.6%) | 8 (1.7%) |
| 1 Vehicle | 73 (13.5%) | 124 (26.4%) |
| 2 Vehicles | 308 (57.0%) | 237 (50.5%) |
| 3 Vehicles | 92 (17.0%) | 56 (11.9%) |
| 4 Vehicles | 25 (4.6%) | 27 (5.8%) |
| 5 or more Vehicles | 28 (5.2%) | 17 (3.6%) |
| Total | 540 (100.0%) | 469 (100.0%) |
Commute Time in Ben Avon borough
The most frequently occuring commute durations in Ben Avon borough are 20 to 24 minutes (198 commuters, 25.5%), 30 to 34 minutes (163 commuters, 20.9%), and 15 to 19 minutes (115 commuters, 14.8%).
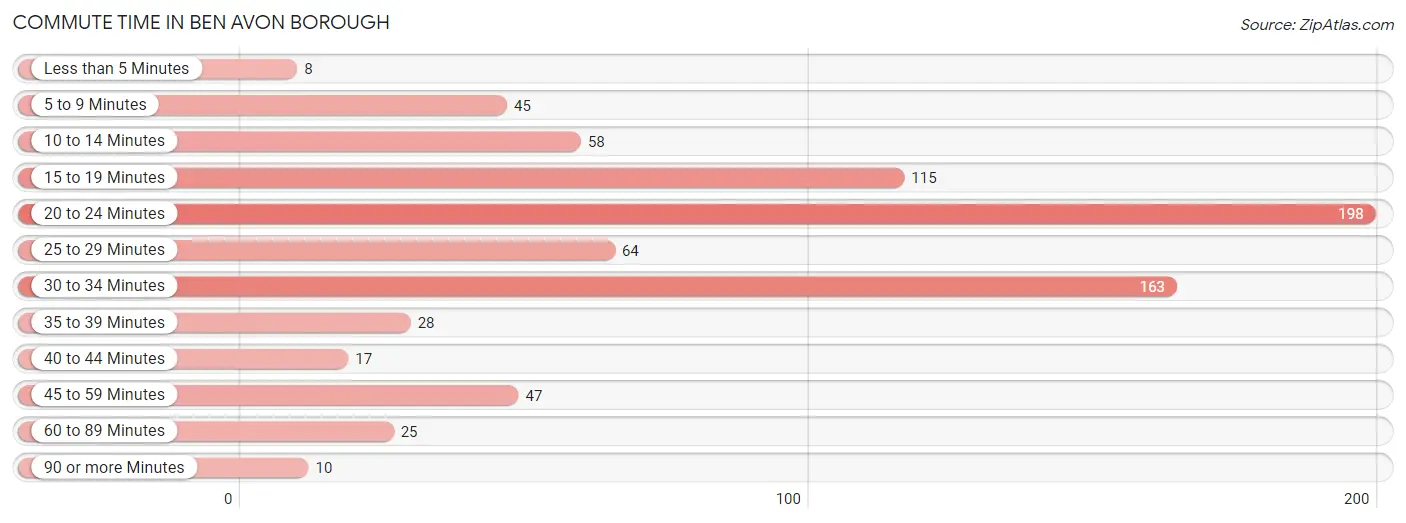
| Commute Time | # Commuters | % Commuters |
| Less than 5 Minutes | 8 | 1.0% |
| 5 to 9 Minutes | 45 | 5.8% |
| 10 to 14 Minutes | 58 | 7.5% |
| 15 to 19 Minutes | 115 | 14.8% |
| 20 to 24 Minutes | 198 | 25.5% |
| 25 to 29 Minutes | 64 | 8.2% |
| 30 to 34 Minutes | 163 | 20.9% |
| 35 to 39 Minutes | 28 | 3.6% |
| 40 to 44 Minutes | 17 | 2.2% |
| 45 to 59 Minutes | 47 | 6.0% |
| 60 to 89 Minutes | 25 | 3.2% |
| 90 or more Minutes | 10 | 1.3% |
Commute Time by Sex in Ben Avon borough
The most common commute times in Ben Avon borough are 30 to 34 minutes (98 commuters, 25.8%) for males and 20 to 24 minutes (116 commuters, 29.1%) for females.
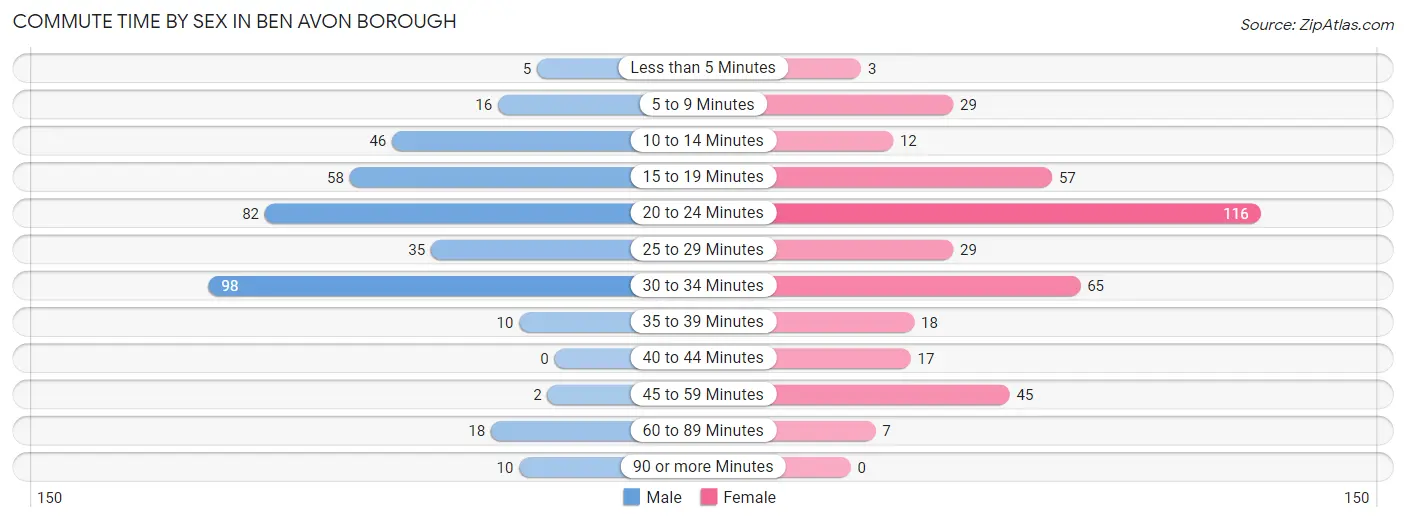
| Commute Time | Male | Female |
| Less than 5 Minutes | 5 (1.3%) | 3 (0.7%) |
| 5 to 9 Minutes | 16 (4.2%) | 29 (7.3%) |
| 10 to 14 Minutes | 46 (12.1%) | 12 (3.0%) |
| 15 to 19 Minutes | 58 (15.3%) | 57 (14.3%) |
| 20 to 24 Minutes | 82 (21.6%) | 116 (29.1%) |
| 25 to 29 Minutes | 35 (9.2%) | 29 (7.3%) |
| 30 to 34 Minutes | 98 (25.8%) | 65 (16.3%) |
| 35 to 39 Minutes | 10 (2.6%) | 18 (4.5%) |
| 40 to 44 Minutes | 0 (0.0%) | 17 (4.3%) |
| 45 to 59 Minutes | 2 (0.5%) | 45 (11.3%) |
| 60 to 89 Minutes | 18 (4.7%) | 7 (1.8%) |
| 90 or more Minutes | 10 (2.6%) | 0 (0.0%) |
Time of Departure to Work by Sex in Ben Avon borough
The most frequent times of departure to work in Ben Avon borough are 8:00 AM to 8:29 AM (71, 18.7%) for males and 7:30 AM to 7:59 AM (81, 20.3%) for females.
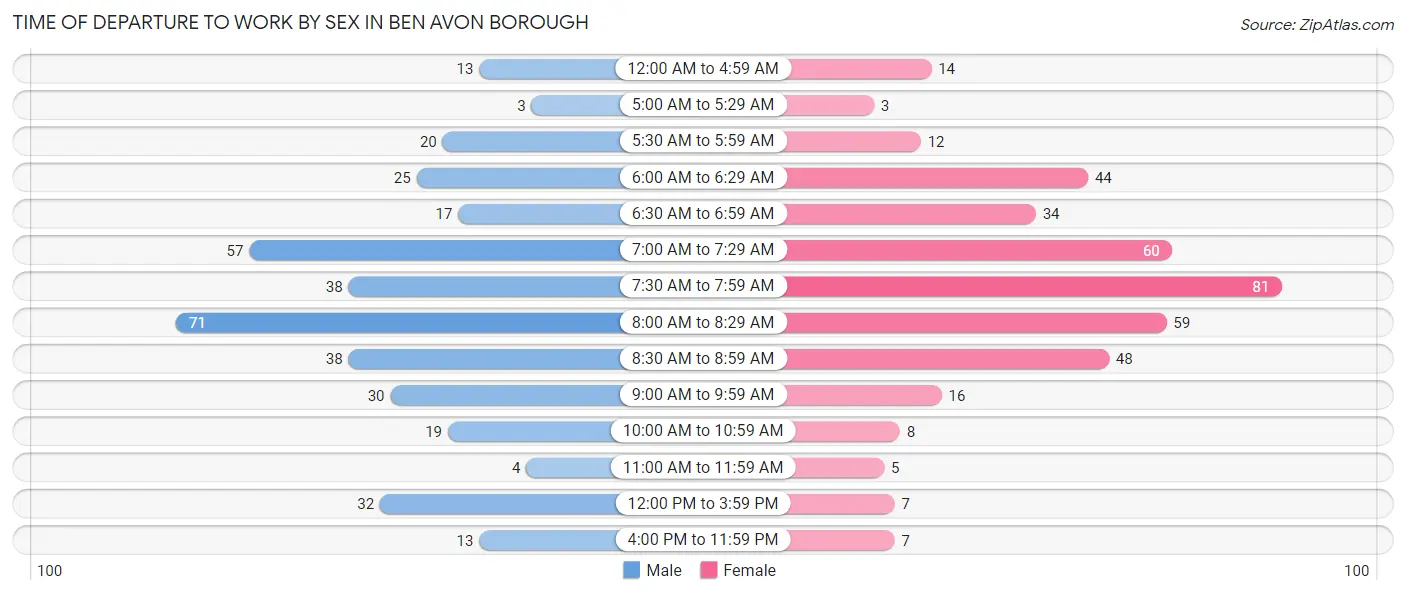
| Time of Departure | Male | Female |
| 12:00 AM to 4:59 AM | 13 (3.4%) | 14 (3.5%) |
| 5:00 AM to 5:29 AM | 3 (0.8%) | 3 (0.7%) |
| 5:30 AM to 5:59 AM | 20 (5.3%) | 12 (3.0%) |
| 6:00 AM to 6:29 AM | 25 (6.6%) | 44 (11.1%) |
| 6:30 AM to 6:59 AM | 17 (4.5%) | 34 (8.5%) |
| 7:00 AM to 7:29 AM | 57 (15.0%) | 60 (15.1%) |
| 7:30 AM to 7:59 AM | 38 (10.0%) | 81 (20.3%) |
| 8:00 AM to 8:29 AM | 71 (18.7%) | 59 (14.8%) |
| 8:30 AM to 8:59 AM | 38 (10.0%) | 48 (12.1%) |
| 9:00 AM to 9:59 AM | 30 (7.9%) | 16 (4.0%) |
| 10:00 AM to 10:59 AM | 19 (5.0%) | 8 (2.0%) |
| 11:00 AM to 11:59 AM | 4 (1.1%) | 5 (1.3%) |
| 12:00 PM to 3:59 PM | 32 (8.4%) | 7 (1.8%) |
| 4:00 PM to 11:59 PM | 13 (3.4%) | 7 (1.8%) |
| Total | 380 (100.0%) | 398 (100.0%) |
Housing Occupancy in Ben Avon borough
Occupancy by Ownership in Ben Avon borough
Of the total 779 dwellings in Ben Avon borough, owner-occupied units account for 594 (76.2%), while renter-occupied units make up 185 (23.7%).
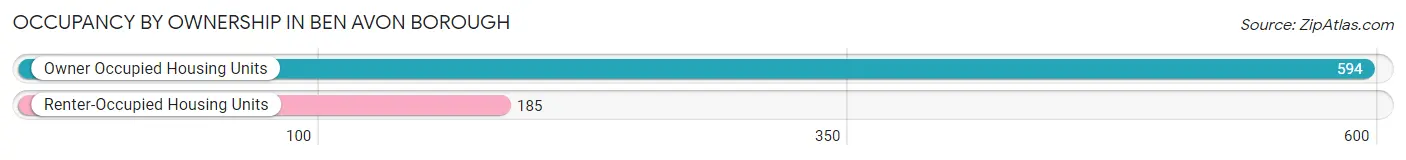
| Occupancy | # Housing Units | % Housing Units |
| Owner Occupied Housing Units | 594 | 76.2% |
| Renter-Occupied Housing Units | 185 | 23.7% |
| Total Occupied Housing Units | 779 | 100.0% |
Occupancy by Household Size in Ben Avon borough
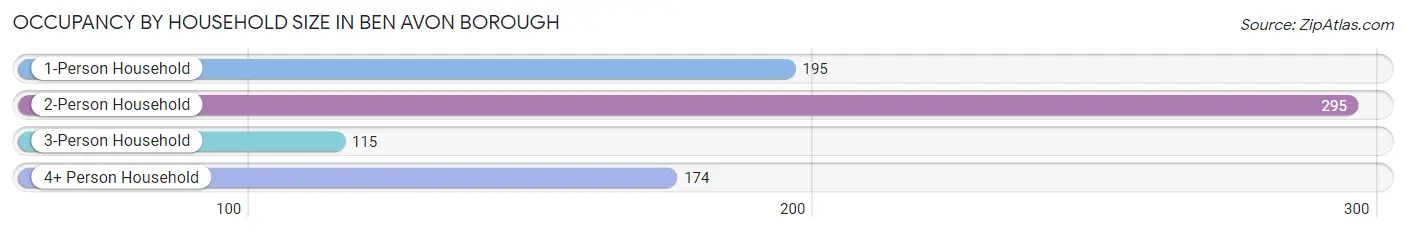
| Household Size | # Housing Units | % Housing Units |
| 1-Person Household | 195 | 25.0% |
| 2-Person Household | 295 | 37.9% |
| 3-Person Household | 115 | 14.8% |
| 4+ Person Household | 174 | 22.3% |
| Total Housing Units | 779 | 100.0% |
Occupancy by Ownership by Household Size in Ben Avon borough
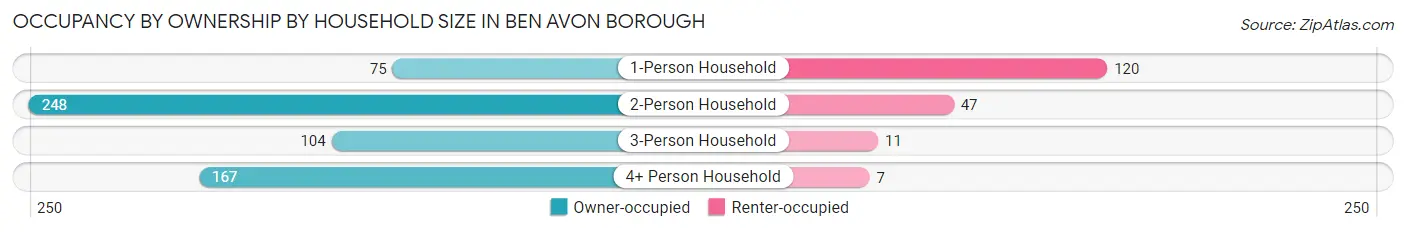
| Household Size | Owner-occupied | Renter-occupied |
| 1-Person Household | 75 (38.5%) | 120 (61.5%) |
| 2-Person Household | 248 (84.1%) | 47 (15.9%) |
| 3-Person Household | 104 (90.4%) | 11 (9.6%) |
| 4+ Person Household | 167 (96.0%) | 7 (4.0%) |
| Total Housing Units | 594 (76.2%) | 185 (23.7%) |
Occupancy by Educational Attainment in Ben Avon borough
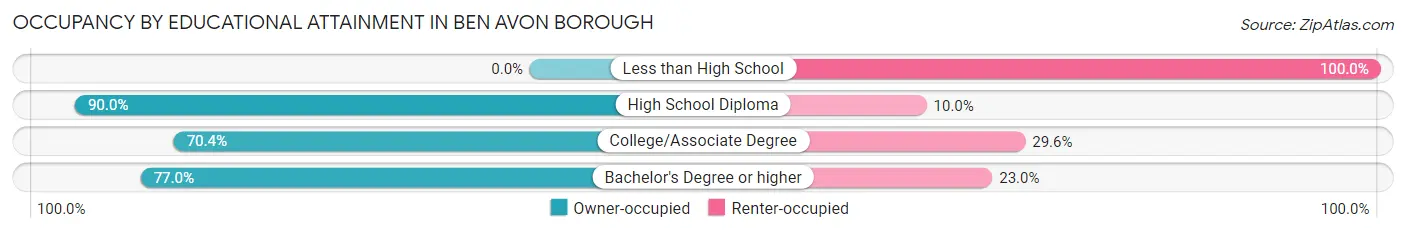
| Household Size | Owner-occupied | Renter-occupied |
| Less than High School | 0 (0.0%) | 5 (100.0%) |
| High School Diploma | 72 (90.0%) | 8 (10.0%) |
| College/Associate Degree | 131 (70.4%) | 55 (29.6%) |
| Bachelor's Degree or higher | 391 (77.0%) | 117 (23.0%) |
Occupancy by Age of Householder in Ben Avon borough
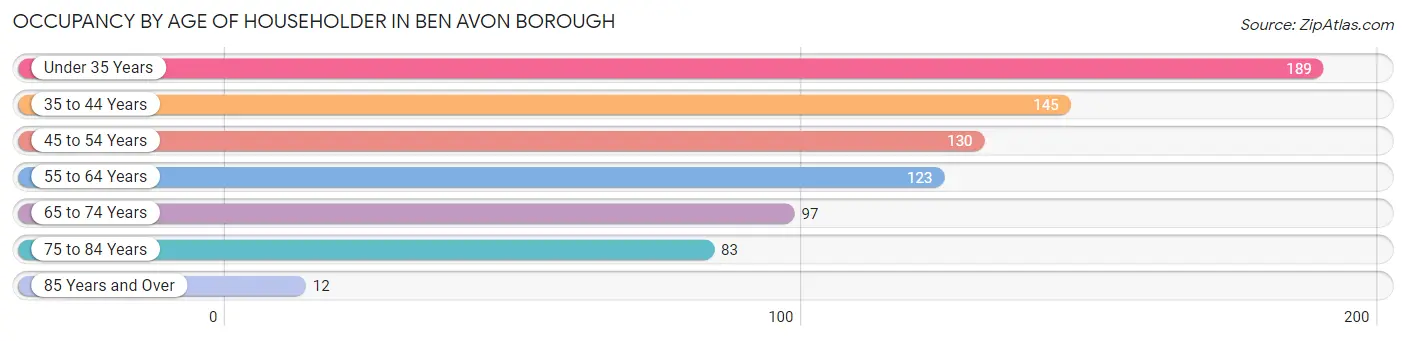
| Age Bracket | # Households | % Households |
| Under 35 Years | 189 | 24.3% |
| 35 to 44 Years | 145 | 18.6% |
| 45 to 54 Years | 130 | 16.7% |
| 55 to 64 Years | 123 | 15.8% |
| 65 to 74 Years | 97 | 12.4% |
| 75 to 84 Years | 83 | 10.6% |
| 85 Years and Over | 12 | 1.5% |
| Total | 779 | 100.0% |
Housing Finances in Ben Avon borough
Median Income by Occupancy in Ben Avon borough
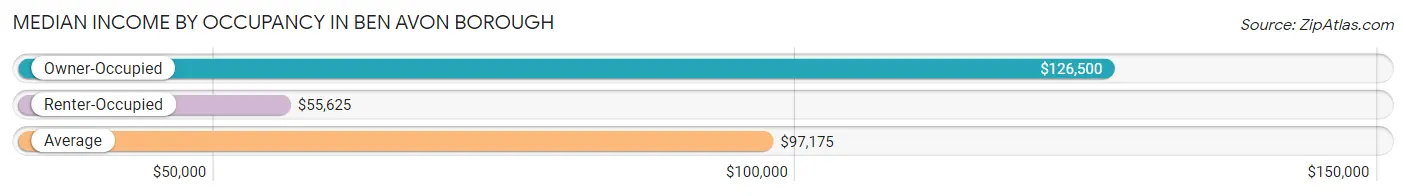
| Occupancy Type | # Households | Median Income |
| Owner-Occupied | 594 (76.2%) | $126,500 |
| Renter-Occupied | 185 (23.7%) | $55,625 |
| Average | 779 (100.0%) | $97,175 |
Occupancy by Householder Income Bracket in Ben Avon borough
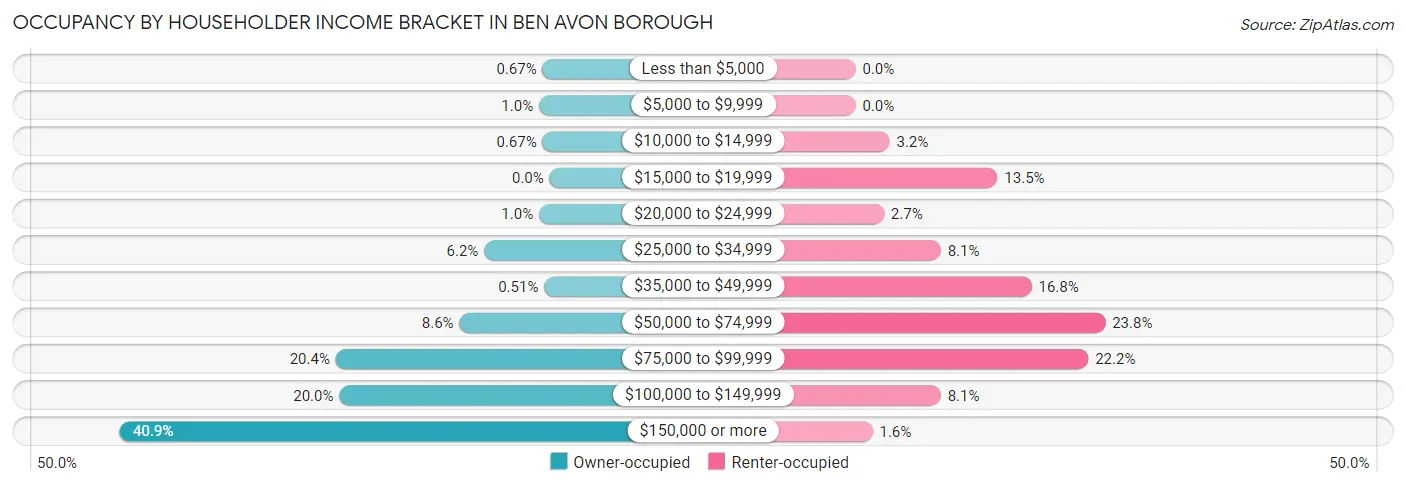
| Income Bracket | Owner-occupied | Renter-occupied |
| Less than $5,000 | 4 (0.7%) | 0 (0.0%) |
| $5,000 to $9,999 | 6 (1.0%) | 0 (0.0%) |
| $10,000 to $14,999 | 4 (0.7%) | 6 (3.2%) |
| $15,000 to $19,999 | 0 (0.0%) | 25 (13.5%) |
| $20,000 to $24,999 | 6 (1.0%) | 5 (2.7%) |
| $25,000 to $34,999 | 37 (6.2%) | 15 (8.1%) |
| $35,000 to $49,999 | 3 (0.5%) | 31 (16.8%) |
| $50,000 to $74,999 | 51 (8.6%) | 44 (23.8%) |
| $75,000 to $99,999 | 121 (20.4%) | 41 (22.2%) |
| $100,000 to $149,999 | 119 (20.0%) | 15 (8.1%) |
| $150,000 or more | 243 (40.9%) | 3 (1.6%) |
| Total | 594 (100.0%) | 185 (100.0%) |
Monthly Housing Cost Tiers in Ben Avon borough
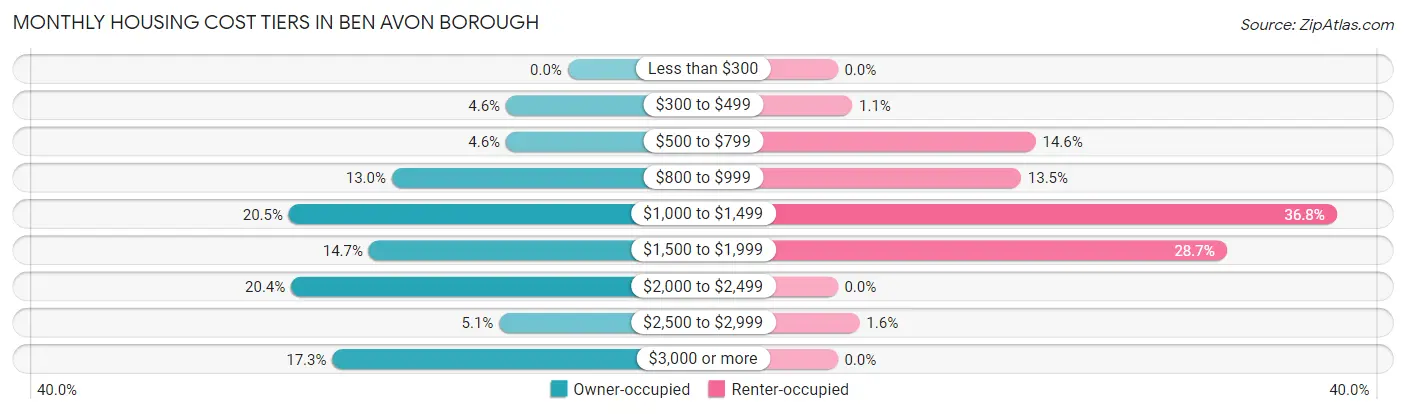
| Monthly Cost | Owner-occupied | Renter-occupied |
| Less than $300 | 0 (0.0%) | 0 (0.0%) |
| $300 to $499 | 27 (4.5%) | 2 (1.1%) |
| $500 to $799 | 27 (4.5%) | 27 (14.6%) |
| $800 to $999 | 77 (13.0%) | 25 (13.5%) |
| $1,000 to $1,499 | 122 (20.5%) | 68 (36.8%) |
| $1,500 to $1,999 | 87 (14.6%) | 53 (28.6%) |
| $2,000 to $2,499 | 121 (20.4%) | 0 (0.0%) |
| $2,500 to $2,999 | 30 (5.1%) | 3 (1.6%) |
| $3,000 or more | 103 (17.3%) | 0 (0.0%) |
| Total | 594 (100.0%) | 185 (100.0%) |
Physical Housing Characteristics in Ben Avon borough
Housing Structures in Ben Avon borough
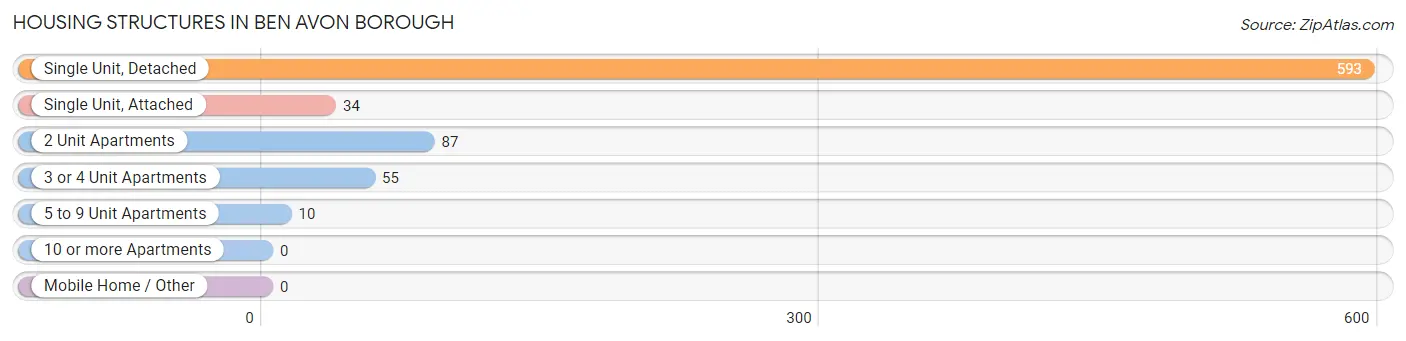
| Structure Type | # Housing Units | % Housing Units |
| Single Unit, Detached | 593 | 76.1% |
| Single Unit, Attached | 34 | 4.4% |
| 2 Unit Apartments | 87 | 11.2% |
| 3 or 4 Unit Apartments | 55 | 7.1% |
| 5 to 9 Unit Apartments | 10 | 1.3% |
| 10 or more Apartments | 0 | 0.0% |
| Mobile Home / Other | 0 | 0.0% |
| Total | 779 | 100.0% |
Housing Structures by Occupancy in Ben Avon borough
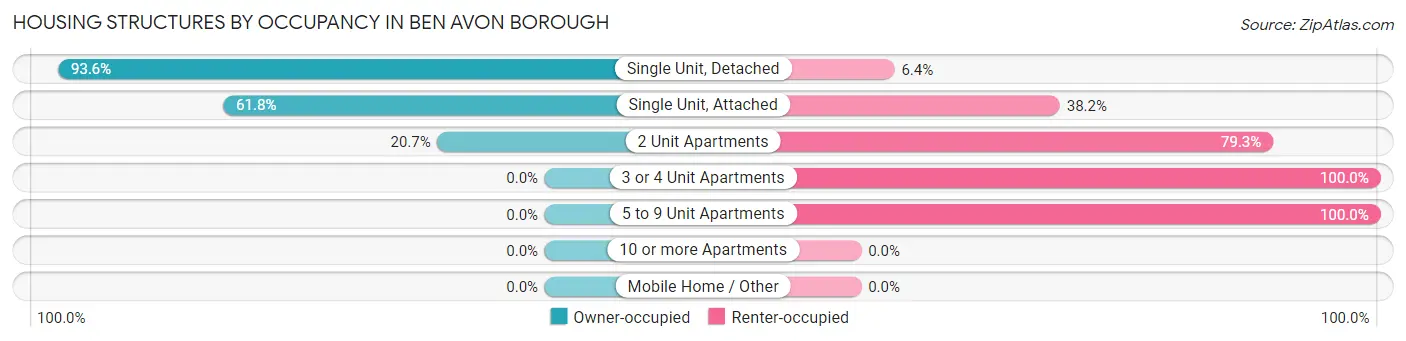
| Structure Type | Owner-occupied | Renter-occupied |
| Single Unit, Detached | 555 (93.6%) | 38 (6.4%) |
| Single Unit, Attached | 21 (61.8%) | 13 (38.2%) |
| 2 Unit Apartments | 18 (20.7%) | 69 (79.3%) |
| 3 or 4 Unit Apartments | 0 (0.0%) | 55 (100.0%) |
| 5 to 9 Unit Apartments | 0 (0.0%) | 10 (100.0%) |
| 10 or more Apartments | 0 (0.0%) | 0 (0.0%) |
| Mobile Home / Other | 0 (0.0%) | 0 (0.0%) |
| Total | 594 (76.2%) | 185 (23.7%) |
Housing Structures by Number of Rooms in Ben Avon borough
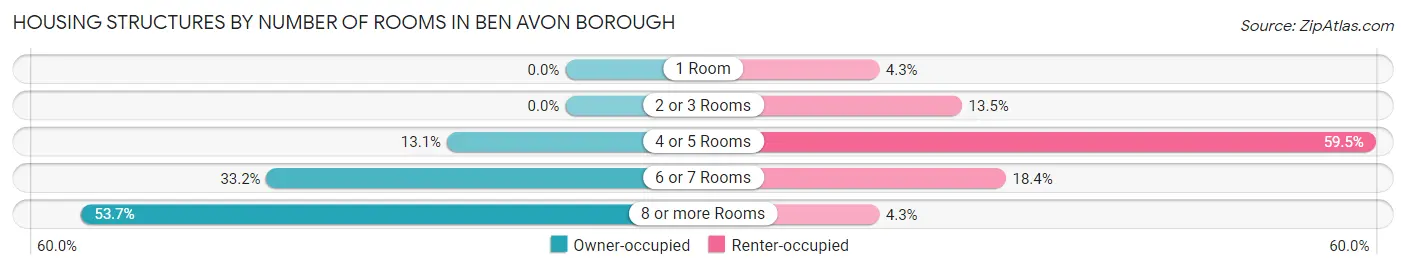
| Number of Rooms | Owner-occupied | Renter-occupied |
| 1 Room | 0 (0.0%) | 8 (4.3%) |
| 2 or 3 Rooms | 0 (0.0%) | 25 (13.5%) |
| 4 or 5 Rooms | 78 (13.1%) | 110 (59.5%) |
| 6 or 7 Rooms | 197 (33.2%) | 34 (18.4%) |
| 8 or more Rooms | 319 (53.7%) | 8 (4.3%) |
| Total | 594 (100.0%) | 185 (100.0%) |
Housing Structure by Heating Type in Ben Avon borough
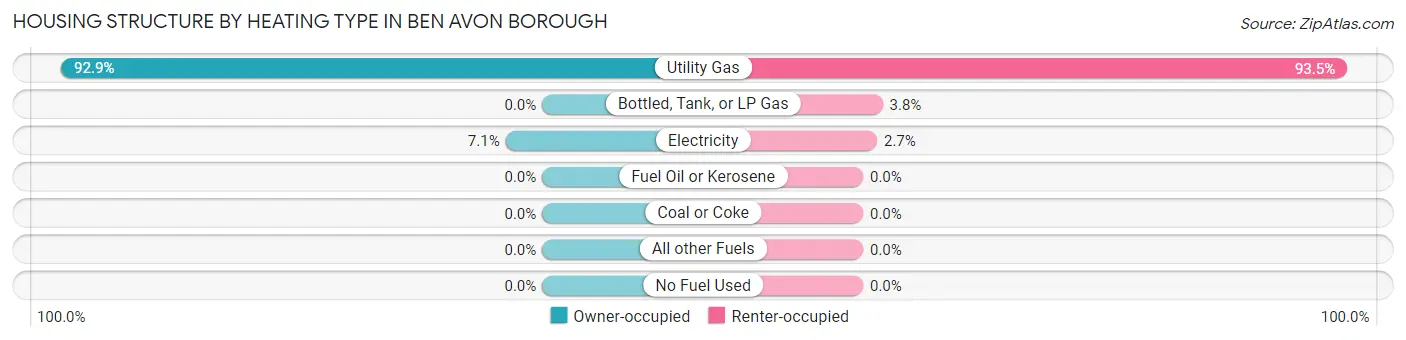
| Heating Type | Owner-occupied | Renter-occupied |
| Utility Gas | 552 (92.9%) | 173 (93.5%) |
| Bottled, Tank, or LP Gas | 0 (0.0%) | 7 (3.8%) |
| Electricity | 42 (7.1%) | 5 (2.7%) |
| Fuel Oil or Kerosene | 0 (0.0%) | 0 (0.0%) |
| Coal or Coke | 0 (0.0%) | 0 (0.0%) |
| All other Fuels | 0 (0.0%) | 0 (0.0%) |
| No Fuel Used | 0 (0.0%) | 0 (0.0%) |
| Total | 594 (100.0%) | 185 (100.0%) |
Household Vehicle Usage in Ben Avon borough
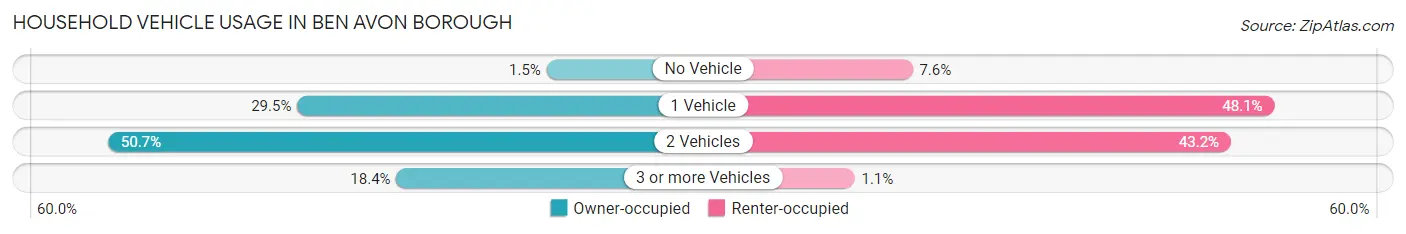
| Vehicles per Household | Owner-occupied | Renter-occupied |
| No Vehicle | 9 (1.5%) | 14 (7.6%) |
| 1 Vehicle | 175 (29.5%) | 89 (48.1%) |
| 2 Vehicles | 301 (50.7%) | 80 (43.2%) |
| 3 or more Vehicles | 109 (18.3%) | 2 (1.1%) |
| Total | 594 (100.0%) | 185 (100.0%) |
Real Estate & Mortgages in Ben Avon borough
Real Estate and Mortgage Overview in Ben Avon borough
| Characteristic | Without Mortgage | With Mortgage |
| Housing Units | 190 | 404 |
| Median Property Value | $320,000 | $336,400 |
| Median Household Income | $96,977 | $191 |
| Monthly Housing Costs | $958 | $103 |
| Real Estate Taxes | $5,950 | $10 |
Property Value by Mortgage Status in Ben Avon borough
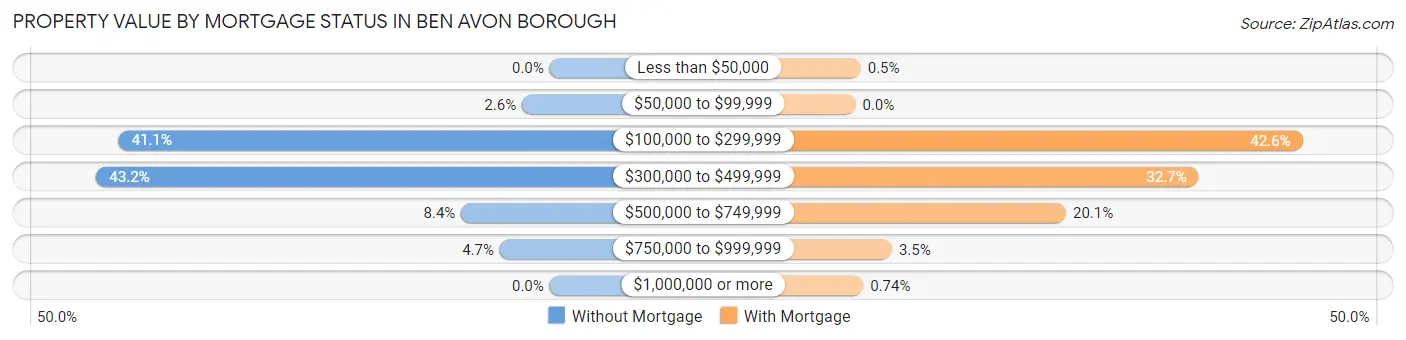
| Property Value | Without Mortgage | With Mortgage |
| Less than $50,000 | 0 (0.0%) | 2 (0.5%) |
| $50,000 to $99,999 | 5 (2.6%) | 0 (0.0%) |
| $100,000 to $299,999 | 78 (41.0%) | 172 (42.6%) |
| $300,000 to $499,999 | 82 (43.2%) | 132 (32.7%) |
| $500,000 to $749,999 | 16 (8.4%) | 81 (20.1%) |
| $750,000 to $999,999 | 9 (4.7%) | 14 (3.5%) |
| $1,000,000 or more | 0 (0.0%) | 3 (0.7%) |
| Total | 190 (100.0%) | 404 (100.0%) |
Household Income by Mortgage Status in Ben Avon borough
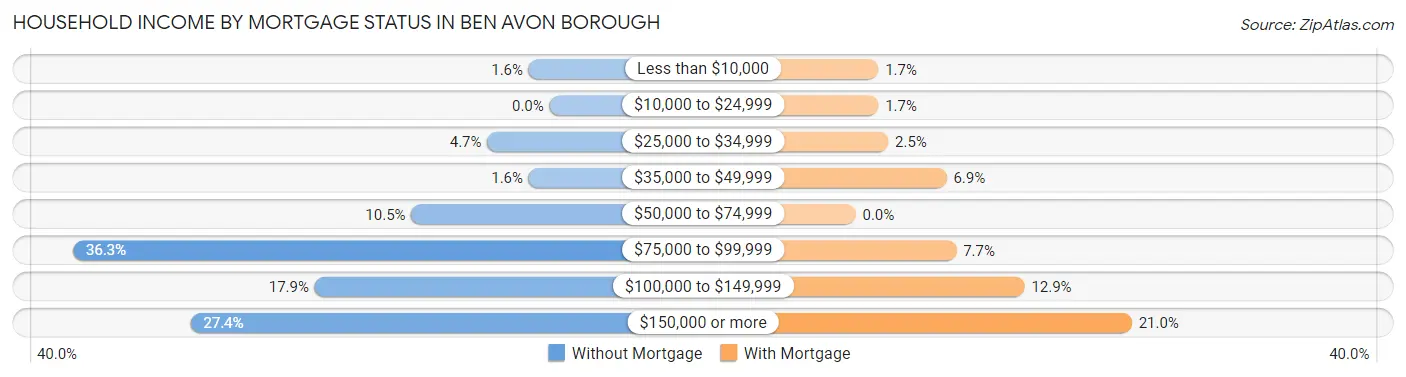
| Household Income | Without Mortgage | With Mortgage |
| Less than $10,000 | 3 (1.6%) | 7 (1.7%) |
| $10,000 to $24,999 | 0 (0.0%) | 7 (1.7%) |
| $25,000 to $34,999 | 9 (4.7%) | 10 (2.5%) |
| $35,000 to $49,999 | 3 (1.6%) | 28 (6.9%) |
| $50,000 to $74,999 | 20 (10.5%) | 0 (0.0%) |
| $75,000 to $99,999 | 69 (36.3%) | 31 (7.7%) |
| $100,000 to $149,999 | 34 (17.9%) | 52 (12.9%) |
| $150,000 or more | 52 (27.4%) | 85 (21.0%) |
| Total | 190 (100.0%) | 404 (100.0%) |
Property Value to Household Income Ratio in Ben Avon borough
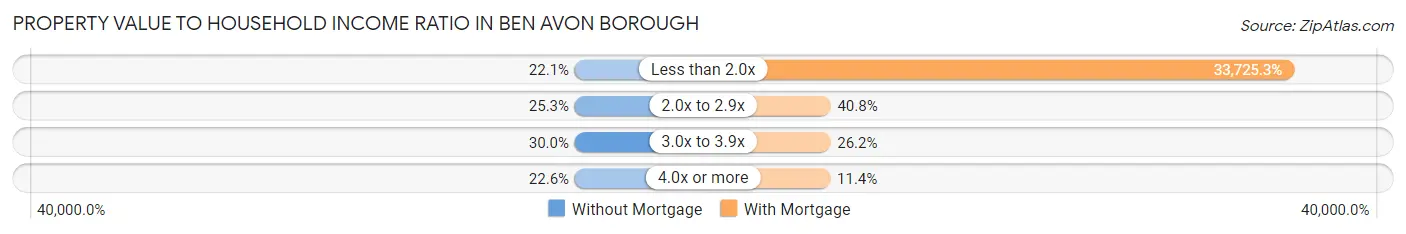
| Value-to-Income Ratio | Without Mortgage | With Mortgage |
| Less than 2.0x | 42 (22.1%) | 136,250 (33,725.2%) |
| 2.0x to 2.9x | 48 (25.3%) | 165 (40.8%) |
| 3.0x to 3.9x | 57 (30.0%) | 106 (26.2%) |
| 4.0x or more | 43 (22.6%) | 46 (11.4%) |
| Total | 190 (100.0%) | 404 (100.0%) |
Real Estate Taxes by Mortgage Status in Ben Avon borough
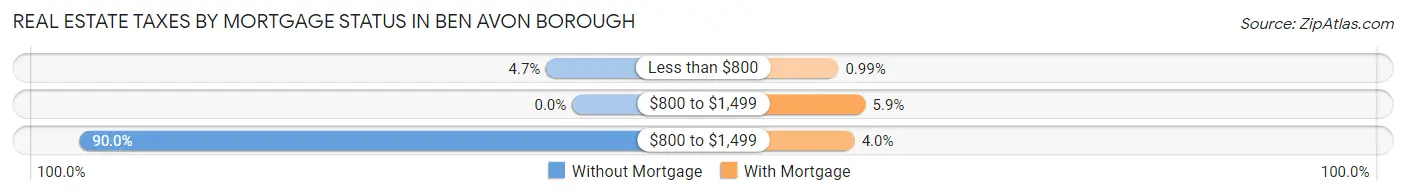
| Property Taxes | Without Mortgage | With Mortgage |
| Less than $800 | 9 (4.7%) | 4 (1.0%) |
| $800 to $1,499 | 0 (0.0%) | 24 (5.9%) |
| $800 to $1,499 | 171 (90.0%) | 16 (4.0%) |
| Total | 190 (100.0%) | 404 (100.0%) |
Health & Disability in Ben Avon borough
Health Insurance Coverage by Age in Ben Avon borough
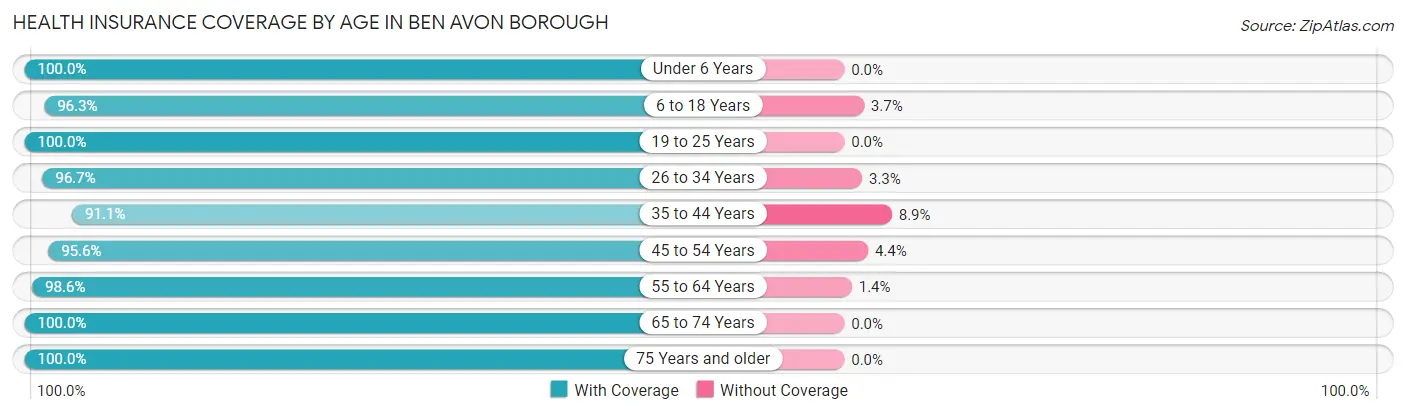
| Age Bracket | With Coverage | Without Coverage |
| Under 6 Years | 140 (100.0%) | 0 (0.0%) |
| 6 to 18 Years | 316 (96.3%) | 12 (3.7%) |
| 19 to 25 Years | 74 (100.0%) | 0 (0.0%) |
| 26 to 34 Years | 292 (96.7%) | 10 (3.3%) |
| 35 to 44 Years | 247 (91.1%) | 24 (8.9%) |
| 45 to 54 Years | 217 (95.6%) | 10 (4.4%) |
| 55 to 64 Years | 212 (98.6%) | 3 (1.4%) |
| 65 to 74 Years | 171 (100.0%) | 0 (0.0%) |
| 75 Years and older | 150 (100.0%) | 0 (0.0%) |
| Total | 1,819 (96.9%) | 59 (3.1%) |
Health Insurance Coverage by Citizenship Status in Ben Avon borough
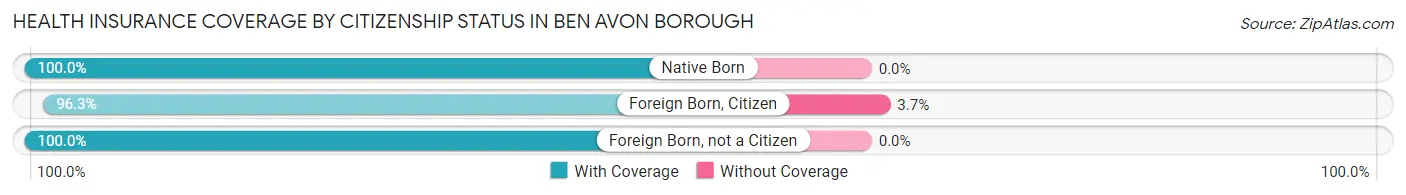
| Citizenship Status | With Coverage | Without Coverage |
| Native Born | 140 (100.0%) | 0 (0.0%) |
| Foreign Born, Citizen | 316 (96.3%) | 12 (3.7%) |
| Foreign Born, not a Citizen | 74 (100.0%) | 0 (0.0%) |
Health Insurance Coverage by Household Income in Ben Avon borough
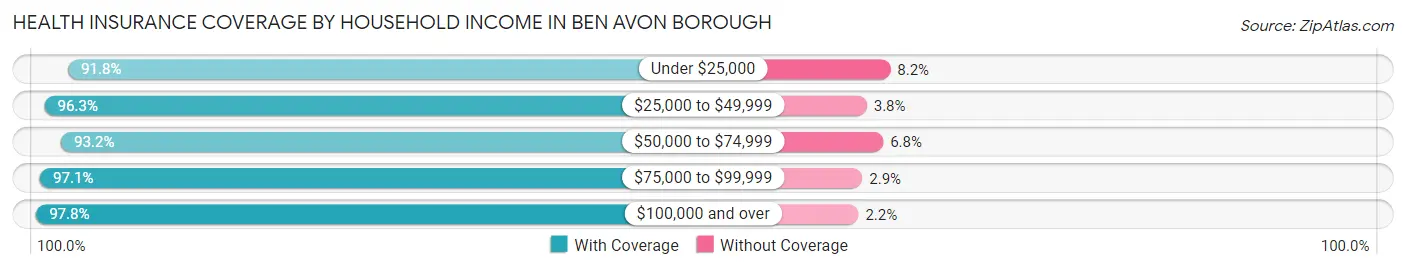
| Household Income | With Coverage | Without Coverage |
| Under $25,000 | 90 (91.8%) | 8 (8.2%) |
| $25,000 to $49,999 | 154 (96.3%) | 6 (3.7%) |
| $50,000 to $74,999 | 150 (93.2%) | 11 (6.8%) |
| $75,000 to $99,999 | 299 (97.1%) | 9 (2.9%) |
| $100,000 and over | 1,118 (97.8%) | 25 (2.2%) |
Public vs Private Health Insurance Coverage by Age in Ben Avon borough
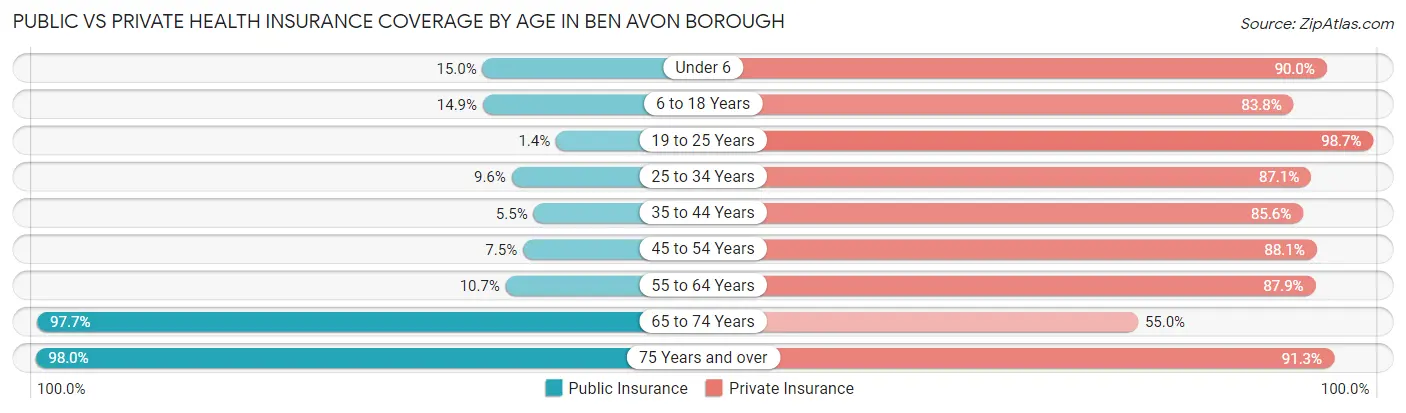
| Age Bracket | Public Insurance | Private Insurance |
| Under 6 | 21 (15.0%) | 126 (90.0%) |
| 6 to 18 Years | 49 (14.9%) | 275 (83.8%) |
| 19 to 25 Years | 1 (1.3%) | 73 (98.7%) |
| 25 to 34 Years | 29 (9.6%) | 263 (87.1%) |
| 35 to 44 Years | 15 (5.5%) | 232 (85.6%) |
| 45 to 54 Years | 17 (7.5%) | 200 (88.1%) |
| 55 to 64 Years | 23 (10.7%) | 189 (87.9%) |
| 65 to 74 Years | 167 (97.7%) | 94 (55.0%) |
| 75 Years and over | 147 (98.0%) | 137 (91.3%) |
| Total | 469 (25.0%) | 1,589 (84.6%) |
Disability Status by Sex by Age in Ben Avon borough
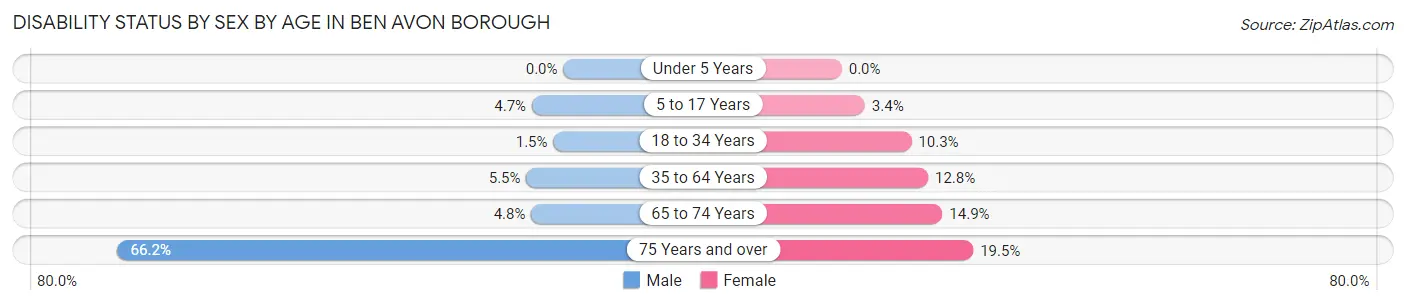
| Age Bracket | Male | Female |
| Under 5 Years | 0 (0.0%) | 0 (0.0%) |
| 5 to 17 Years | 7 (4.7%) | 6 (3.4%) |
| 18 to 34 Years | 3 (1.5%) | 21 (10.3%) |
| 35 to 64 Years | 19 (5.5%) | 47 (12.8%) |
| 65 to 74 Years | 4 (4.8%) | 13 (14.9%) |
| 75 Years and over | 45 (66.2%) | 16 (19.5%) |
Disability Class by Sex by Age in Ben Avon borough
Disability Class: Hearing Difficulty
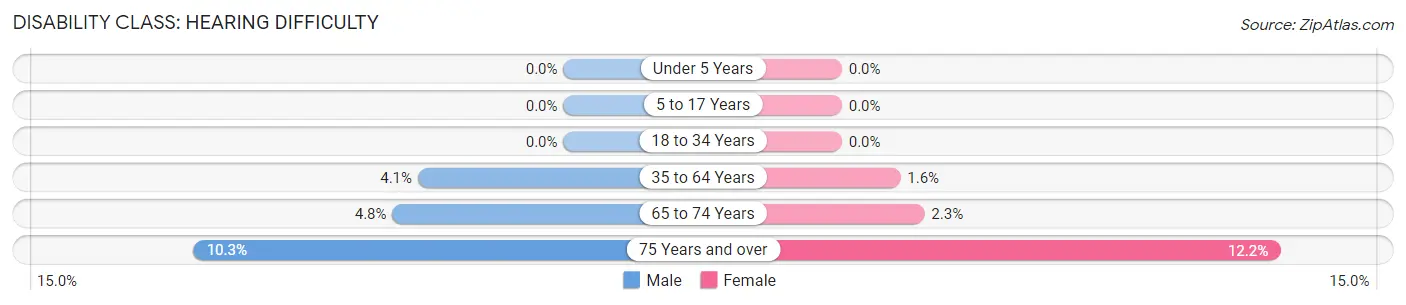
| Age Bracket | Male | Female |
| Under 5 Years | 0 (0.0%) | 0 (0.0%) |
| 5 to 17 Years | 0 (0.0%) | 0 (0.0%) |
| 18 to 34 Years | 0 (0.0%) | 0 (0.0%) |
| 35 to 64 Years | 14 (4.1%) | 6 (1.6%) |
| 65 to 74 Years | 4 (4.8%) | 2 (2.3%) |
| 75 Years and over | 7 (10.3%) | 10 (12.2%) |
Disability Class: Vision Difficulty
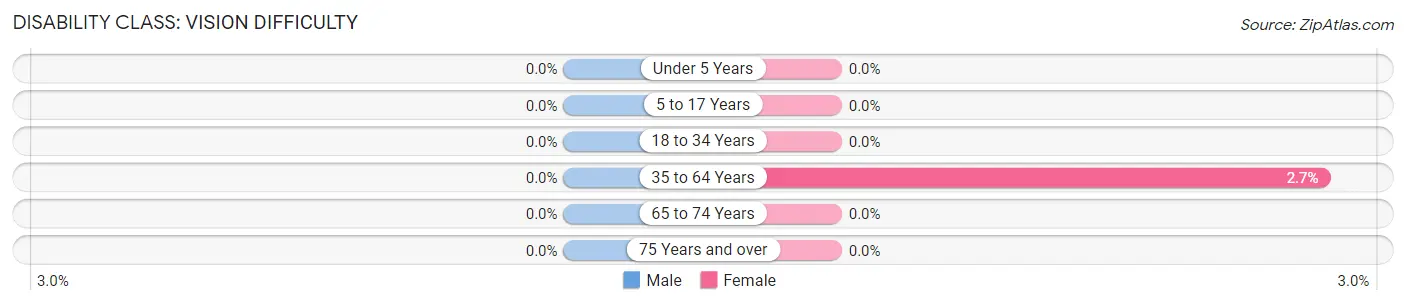
| Age Bracket | Male | Female |
| Under 5 Years | 0 (0.0%) | 0 (0.0%) |
| 5 to 17 Years | 0 (0.0%) | 0 (0.0%) |
| 18 to 34 Years | 0 (0.0%) | 0 (0.0%) |
| 35 to 64 Years | 0 (0.0%) | 10 (2.7%) |
| 65 to 74 Years | 0 (0.0%) | 0 (0.0%) |
| 75 Years and over | 0 (0.0%) | 0 (0.0%) |
Disability Class: Cognitive Difficulty
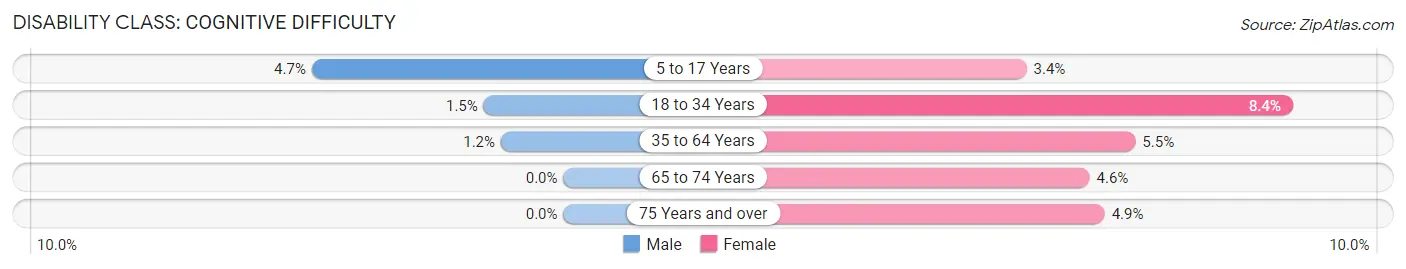
| Age Bracket | Male | Female |
| 5 to 17 Years | 7 (4.7%) | 6 (3.4%) |
| 18 to 34 Years | 3 (1.5%) | 17 (8.4%) |
| 35 to 64 Years | 4 (1.2%) | 20 (5.4%) |
| 65 to 74 Years | 0 (0.0%) | 4 (4.6%) |
| 75 Years and over | 0 (0.0%) | 4 (4.9%) |
Disability Class: Ambulatory Difficulty
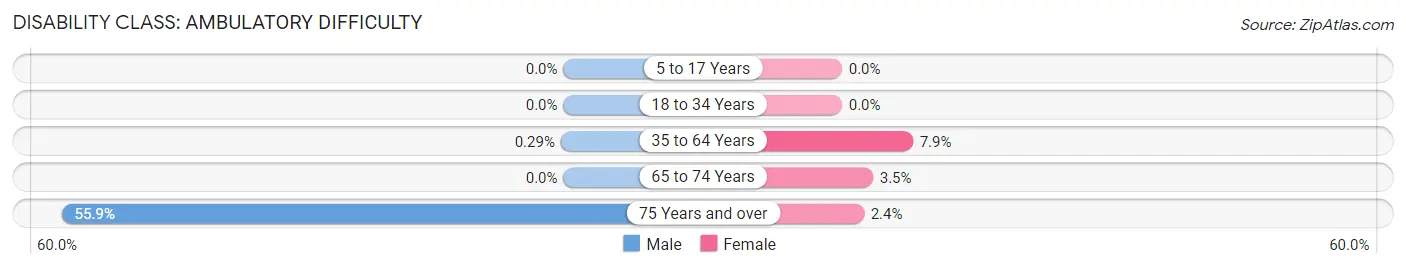
| Age Bracket | Male | Female |
| 5 to 17 Years | 0 (0.0%) | 0 (0.0%) |
| 18 to 34 Years | 0 (0.0%) | 0 (0.0%) |
| 35 to 64 Years | 1 (0.3%) | 29 (7.9%) |
| 65 to 74 Years | 0 (0.0%) | 3 (3.5%) |
| 75 Years and over | 38 (55.9%) | 2 (2.4%) |
Disability Class: Self-Care Difficulty
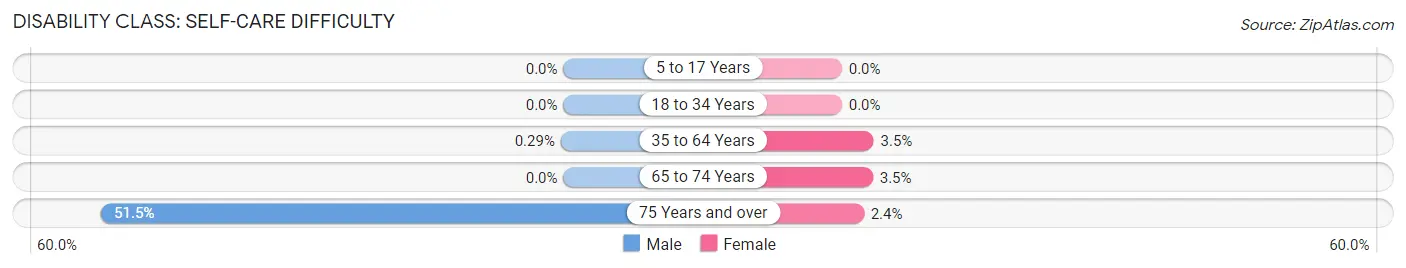
| Age Bracket | Male | Female |
| 5 to 17 Years | 0 (0.0%) | 0 (0.0%) |
| 18 to 34 Years | 0 (0.0%) | 0 (0.0%) |
| 35 to 64 Years | 1 (0.3%) | 13 (3.5%) |
| 65 to 74 Years | 0 (0.0%) | 3 (3.5%) |
| 75 Years and over | 35 (51.5%) | 2 (2.4%) |
Technology Access in Ben Avon borough
Computing Device Access in Ben Avon borough
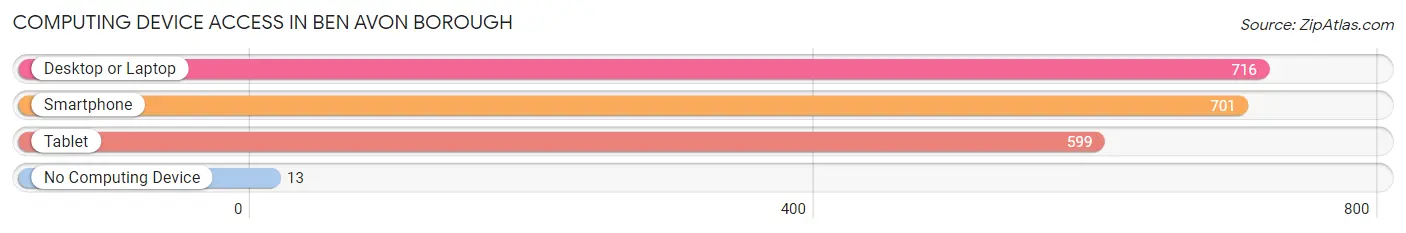
| Device Type | # Households | % Households |
| Desktop or Laptop | 716 | 91.9% |
| Smartphone | 701 | 90.0% |
| Tablet | 599 | 76.9% |
| No Computing Device | 13 | 1.7% |
| Total | 779 | 100.0% |
Internet Access in Ben Avon borough
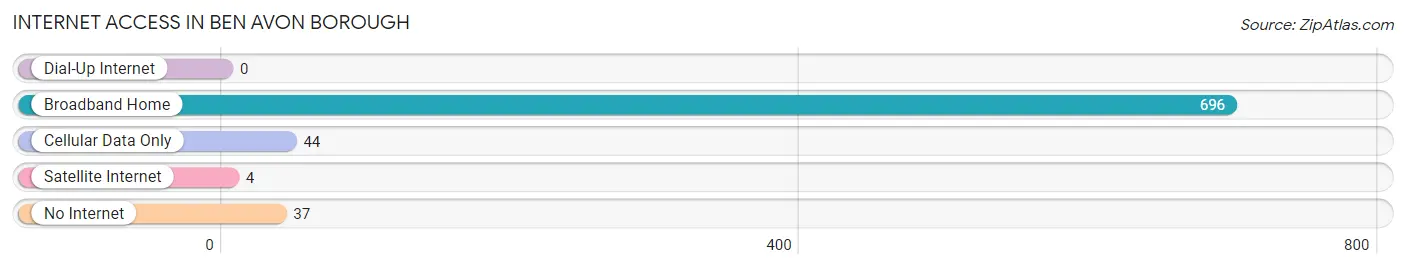
| Internet Type | # Households | % Households |
| Dial-Up Internet | 0 | 0.0% |
| Broadband Home | 696 | 89.3% |
| Cellular Data Only | 44 | 5.7% |
| Satellite Internet | 4 | 0.5% |
| No Internet | 37 | 4.8% |
| Total | 779 | 100.0% |
Ben Avon borough Summary
Ben Avon Borough is a small borough located in Allegheny County, Pennsylvania. It is situated along the Ohio River, just north of Pittsburgh. The borough was incorporated in 1891 and is home to approximately 2,500 people.
Geography
Ben Avon Borough is located in the western part of Allegheny County, Pennsylvania. It is situated along the Ohio River, just north of Pittsburgh. The borough is bordered by the boroughs of Emsworth and Avalon to the north, Kilbuck Township to the east, and Ohio Township to the south. The borough is approximately 1.5 square miles in size and is located at an elevation of 890 feet.
The terrain of Ben Avon Borough is mostly flat, with some rolling hills. The borough is located in the Allegheny Plateau region of Pennsylvania, which is characterized by its hilly terrain and dense forests. The Ohio River forms the western boundary of the borough, and the Allegheny River forms the eastern boundary.
Climate
Ben Avon Borough has a humid continental climate, with hot summers and cold winters. The average annual temperature is around 50 degrees Fahrenheit, with temperatures ranging from an average low of 32 degrees Fahrenheit in the winter to an average high of 72 degrees Fahrenheit in the summer. The average annual precipitation is around 40 inches, with snowfall averaging around 25 inches per year.
Demographics
As of the 2010 census, Ben Avon Borough had a population of 2,541 people. The racial makeup of the borough was 97.3% White, 0.9% African American, 0.3% Native American, 0.4% Asian, 0.1% Pacific Islander, 0.2% from other races, and 0.8% from two or more races. Hispanic or Latino of any race were 0.9% of the population.
The median household income in Ben Avon Borough was $50,938, and the median family income was $60,938. The per capita income for the borough was $25,938. About 4.3% of families and 5.3% of the population were below the poverty line, including 6.3% of those under age 18 and 4.3% of those age 65 or over.
Economy
Ben Avon Borough is primarily a residential community, with most of its residents commuting to nearby Pittsburgh for work. The borough does have a few small businesses, including a few restaurants, a grocery store, and a few retail stores. The borough also has a few industrial businesses, including a steel mill and a chemical plant.
The borough is served by the Port Authority of Allegheny County, which provides public transportation to Pittsburgh and other nearby communities. The borough is also served by the Allegheny Valley Railroad, which provides freight service to the area.
Conclusion
Ben Avon Borough is a small borough located in Allegheny County, Pennsylvania. It is situated along the Ohio River, just north of Pittsburgh. The borough was incorporated in 1891 and is home to approximately 2,500 people. The borough has a humid continental climate, with hot summers and cold winters. The racial makeup of the borough is predominantly white, with a small percentage of African American, Native American, Asian, and Pacific Islander residents. The economy of Ben Avon Borough is primarily residential, with most of its residents commuting to nearby Pittsburgh for work. The borough does have a few small businesses, including a few restaurants, a grocery store, and a few retail stores. The borough is served by the Port Authority of Allegheny County and the Allegheny Valley Railroad.
Common Questions
What is Per Capita Income in Ben Avon borough?
Per Capita income in Ben Avon borough is $55,513.
What is the Median Family Income in Ben Avon borough?
Median Family Income in Ben Avon borough is $134,688.
What is the Median Household income in Ben Avon borough?
Median Household Income in Ben Avon borough is $97,175.
What is Income or Wage Gap in Ben Avon borough?
Income or Wage Gap in Ben Avon borough is 30.4%.
Women in Ben Avon borough earn 69.6 cents for every dollar earned by a man.
What is Inequality or Gini Index in Ben Avon borough?
Inequality or Gini Index in Ben Avon borough is 0.41.
What is the Total Population of Ben Avon borough?
Total Population of Ben Avon borough is 1,878.
What is the Total Male Population of Ben Avon borough?
Total Male Population of Ben Avon borough is 906.
What is the Total Female Population of Ben Avon borough?
Total Female Population of Ben Avon borough is 972.
What is the Ratio of Males per 100 Females in Ben Avon borough?
There are 93.21 Males per 100 Females in Ben Avon borough.
What is the Ratio of Females per 100 Males in Ben Avon borough?
There are 107.28 Females per 100 Males in Ben Avon borough.
What is the Median Population Age in Ben Avon borough?
Median Population Age in Ben Avon borough is 38.5 Years.
What is the Average Family Size in Ben Avon borough
Average Family Size in Ben Avon borough is 2.9 People.
What is the Average Household Size in Ben Avon borough
Average Household Size in Ben Avon borough is 2.4 People.
How Large is the Labor Force in Ben Avon borough?
There are 1,118 People in the Labor Forcein in Ben Avon borough.
What is the Percentage of People in the Labor Force in Ben Avon borough?
74.6% of People are in the Labor Force in Ben Avon borough.
What is the Unemployment Rate in Ben Avon borough?
Unemployment Rate in Ben Avon borough is 3.7%.