Athens borough, PA Map & Demographics
Athens borough Overview
$34,384
PER CAPITA INCOME
$64,028
AVG FAMILY INCOME
$48,503
AVG HOUSEHOLD INCOME
45.4%
WAGE / INCOME GAP [ % ]
54.6¢/ $1
WAGE / INCOME GAP [ $ ]
0.43
INEQUALITY / GINI INDEX
3,270
TOTAL POPULATION
1,837
MALE POPULATION
1,433
FEMALE POPULATION
128.19
MALES / 100 FEMALES
78.01
FEMALES / 100 MALES
48.6
MEDIAN AGE
2.9
AVG FAMILY SIZE
1.8
AVG HOUSEHOLD SIZE
1,615
LABOR FORCE [ PEOPLE ]
58.8%
PERCENT IN LABOR FORCE
3.5%
UNEMPLOYMENT RATE
Income in Athens borough
Income Overview in Athens borough
Per Capita Income in Athens borough is $34,384, while median incomes of families and households are $64,028 and $48,503 respectively.
| Characteristic | Number | Measure |
| Per Capita Income | 3,270 | $34,384 |
| Median Family Income | 677 | $64,028 |
| Mean Family Income | 677 | $76,046 |
| Median Household Income | 1,777 | $48,503 |
| Mean Household Income | 1,777 | $62,912 |
| Income Deficit | 677 | $0 |
| Wage / Income Gap (%) | 3,270 | 45.38% |
| Wage / Income Gap ($) | 3,270 | 54.62¢ per $1 |
| Gini / Inequality Index | 3,270 | 0.43 |
Earnings by Sex in Athens borough
Average Earnings in Athens borough are $44,375, $51,444 for men and $28,099 for women, a difference of 45.4%.
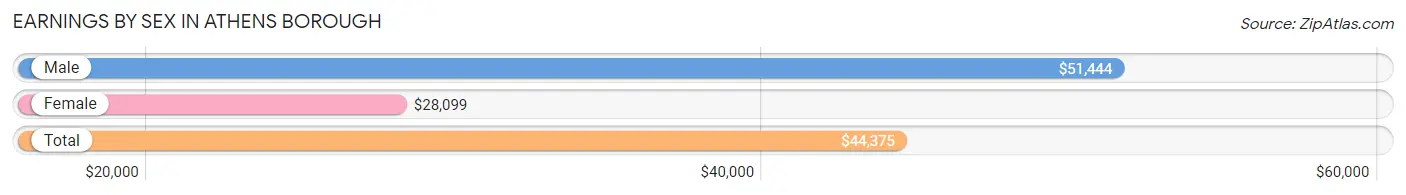
| Sex | Number | Average Earnings |
| Male | 1,064 (62.3%) | $51,444 |
| Female | 643 (37.7%) | $28,099 |
| Total | 1,707 (100.0%) | $44,375 |
Earnings by Sex by Income Bracket in Athens borough
The most common earnings brackets in Athens borough are $75,000 to $99,999 for men (236 | 22.2%) and $25,000 to $29,999 for women (115 | 17.9%).
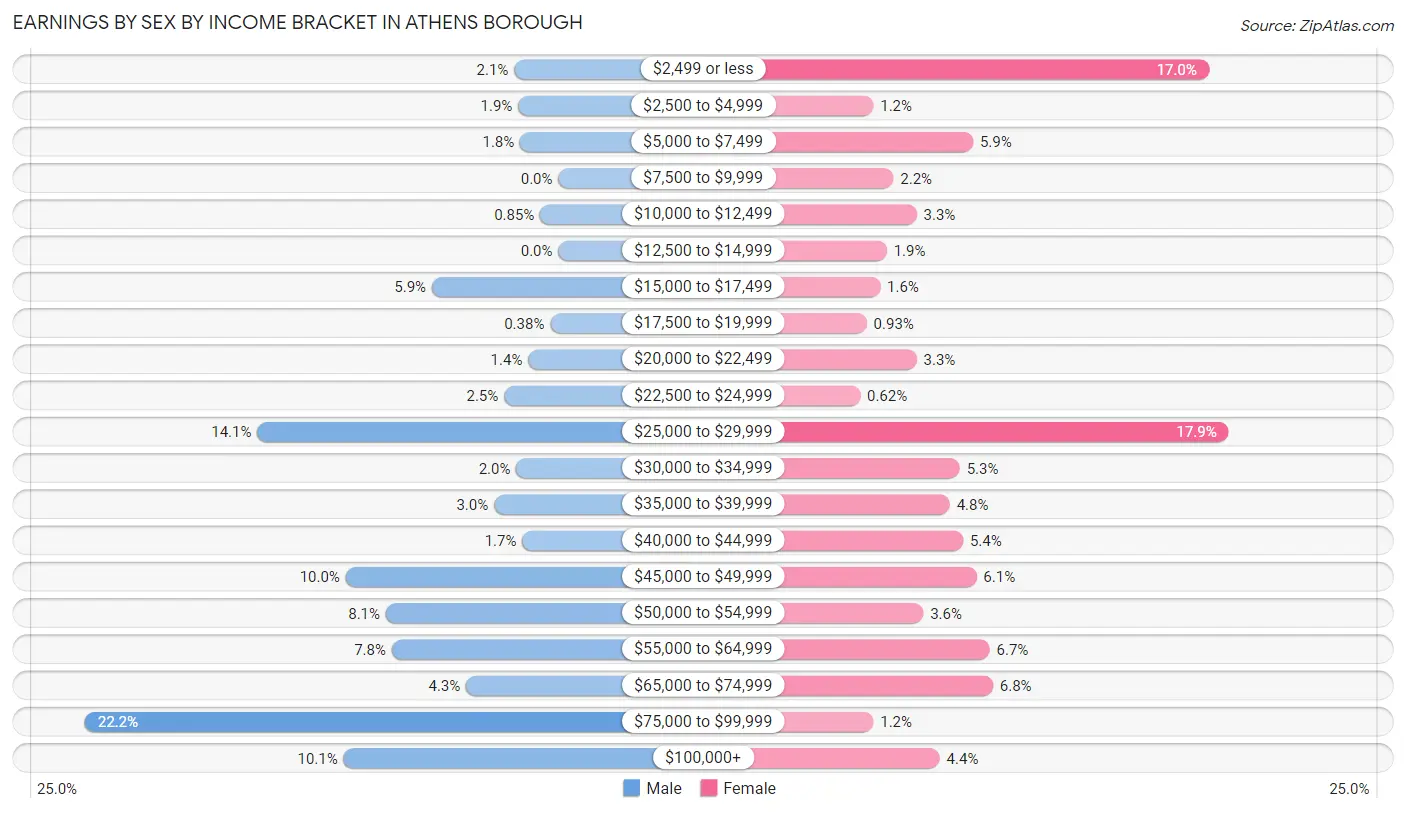
| Income | Male | Female |
| $2,499 or less | 22 (2.1%) | 109 (17.0%) |
| $2,500 to $4,999 | 20 (1.9%) | 8 (1.2%) |
| $5,000 to $7,499 | 19 (1.8%) | 38 (5.9%) |
| $7,500 to $9,999 | 0 (0.0%) | 14 (2.2%) |
| $10,000 to $12,499 | 9 (0.9%) | 21 (3.3%) |
| $12,500 to $14,999 | 0 (0.0%) | 12 (1.9%) |
| $15,000 to $17,499 | 63 (5.9%) | 10 (1.6%) |
| $17,500 to $19,999 | 4 (0.4%) | 6 (0.9%) |
| $20,000 to $22,499 | 15 (1.4%) | 21 (3.3%) |
| $22,500 to $24,999 | 27 (2.5%) | 4 (0.6%) |
| $25,000 to $29,999 | 150 (14.1%) | 115 (17.9%) |
| $30,000 to $34,999 | 21 (2.0%) | 34 (5.3%) |
| $35,000 to $39,999 | 32 (3.0%) | 31 (4.8%) |
| $40,000 to $44,999 | 18 (1.7%) | 35 (5.4%) |
| $45,000 to $49,999 | 106 (10.0%) | 39 (6.1%) |
| $50,000 to $54,999 | 86 (8.1%) | 23 (3.6%) |
| $55,000 to $64,999 | 83 (7.8%) | 43 (6.7%) |
| $65,000 to $74,999 | 46 (4.3%) | 44 (6.8%) |
| $75,000 to $99,999 | 236 (22.2%) | 8 (1.2%) |
| $100,000+ | 107 (10.1%) | 28 (4.3%) |
| Total | 1,064 (100.0%) | 643 (100.0%) |
Earnings by Sex by Educational Attainment in Athens borough
Average earnings in Athens borough are $60,250 for men and $29,323 for women, a difference of 51.3%. Men with an educational attainment of bachelor's degree enjoy the highest average annual earnings of $88,805, while those with college or associate's degree education earn the least with $60,909. Women with an educational attainment of high school diploma earn the most with the average annual earnings of $32,143, while those with college or associate's degree education have the smallest earnings of $26,175.
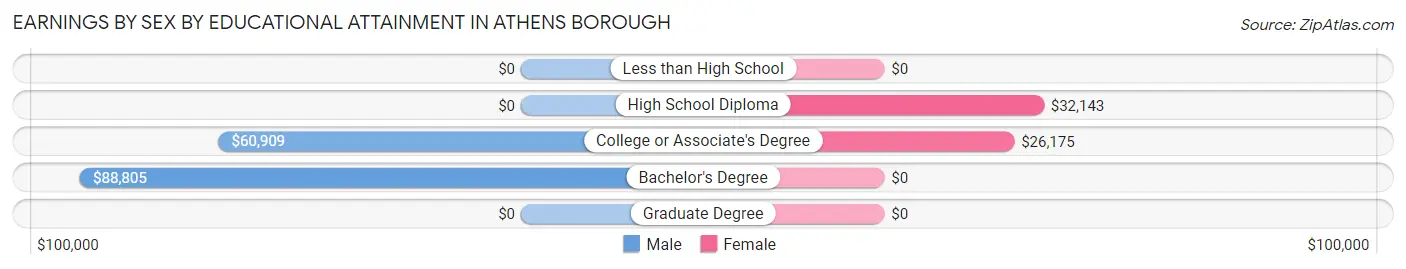
| Educational Attainment | Male Income | Female Income |
| Less than High School | - | - |
| High School Diploma | - | - |
| College or Associate's Degree | $60,909 | $26,175 |
| Bachelor's Degree | $88,805 | $0 |
| Graduate Degree | - | - |
| Total | $60,250 | $29,323 |
Family Income in Athens borough
Family Income Brackets in Athens borough
According to the Athens borough family income data, there are 165 families falling into the $75,000 to $99,999 income range, which is the most common income bracket and makes up 24.4% of all families. Conversely, the $10,000 to $14,999 income bracket is the least frequent group with only 17 families (2.5%) belonging to this category.
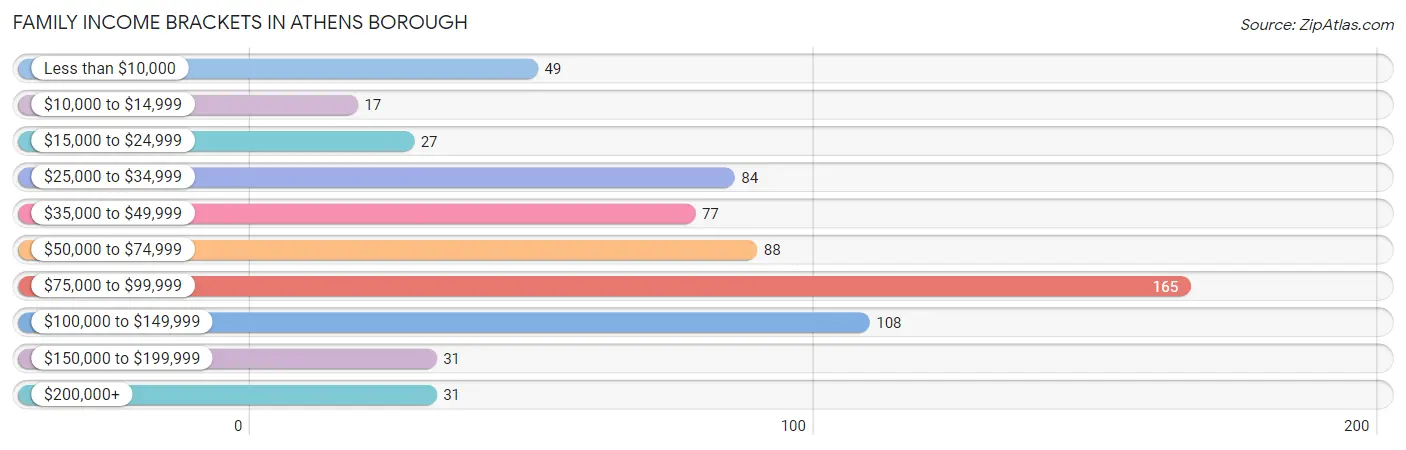
| Income Bracket | # Families | % Families |
| Less than $10,000 | 49 | 7.2% |
| $10,000 to $14,999 | 17 | 2.5% |
| $15,000 to $24,999 | 27 | 4.0% |
| $25,000 to $34,999 | 84 | 12.4% |
| $35,000 to $49,999 | 77 | 11.4% |
| $50,000 to $74,999 | 88 | 13.0% |
| $75,000 to $99,999 | 165 | 24.4% |
| $100,000 to $149,999 | 108 | 16.0% |
| $150,000 to $199,999 | 31 | 4.6% |
| $200,000+ | 31 | 4.6% |
Family Income by Famaliy Size in Athens borough
2-person families (382 | 56.4%) account for the highest median family income in Athens borough with $51,154 per family, while 2-person families (382 | 56.4%) have the highest median income of $25,577 per family member.
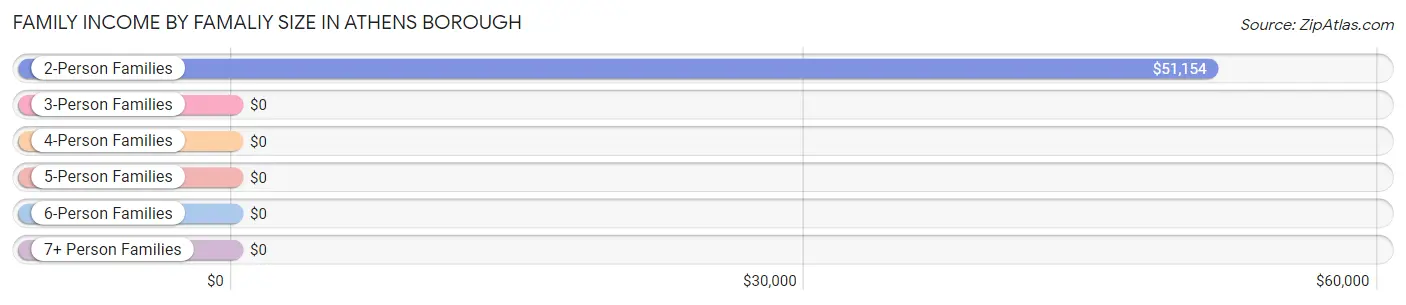
| Income Bracket | # Families | Median Income |
| 2-Person Families | 382 (56.4%) | $51,154 |
| 3-Person Families | 73 (10.8%) | $0 |
| 4-Person Families | 154 (22.8%) | $0 |
| 5-Person Families | 24 (3.5%) | $0 |
| 6-Person Families | 39 (5.8%) | $0 |
| 7+ Person Families | 5 (0.7%) | $0 |
| Total | 677 (100.0%) | $64,028 |
Family Income by Number of Earners in Athens borough
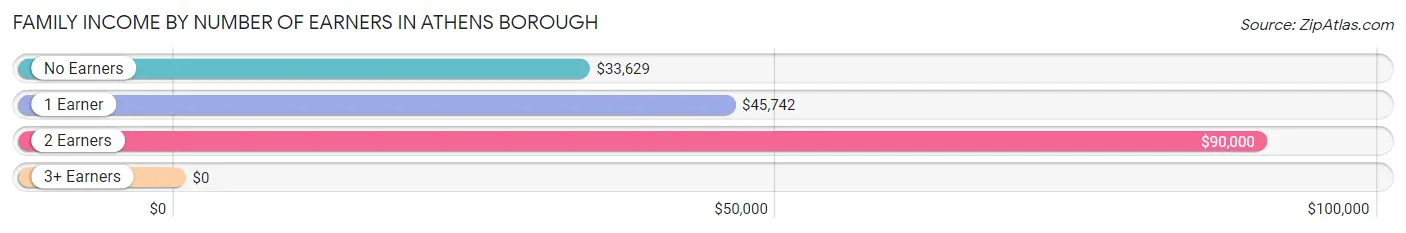
| Number of Earners | # Families | Median Income |
| No Earners | 116 (17.1%) | $33,629 |
| 1 Earner | 247 (36.5%) | $45,742 |
| 2 Earners | 234 (34.6%) | $90,000 |
| 3+ Earners | 80 (11.8%) | $0 |
| Total | 677 (100.0%) | $64,028 |
Household Income in Athens borough
Household Income Brackets in Athens borough
With 386 households falling in the category, the $75,000 to $99,999 income range is the most frequent in Athens borough, accounting for 21.7% of all households. In contrast, only 37 households (2.1%) fall into the $150,000 to $199,999 income bracket, making it the least populous group.
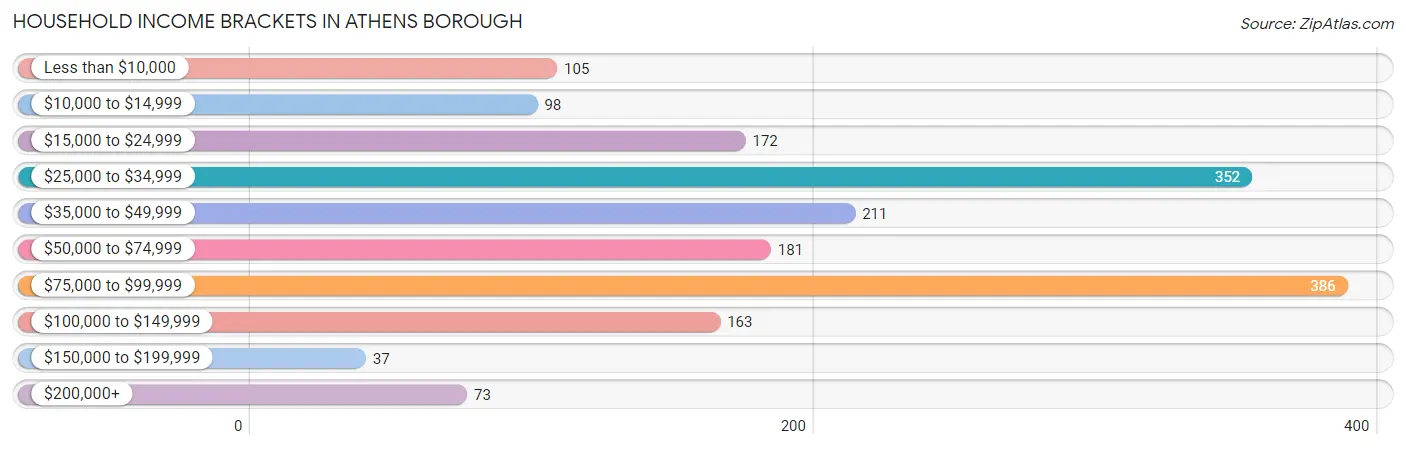
| Income Bracket | # Households | % Households |
| Less than $10,000 | 105 | 5.9% |
| $10,000 to $14,999 | 98 | 5.5% |
| $15,000 to $24,999 | 172 | 9.7% |
| $25,000 to $34,999 | 352 | 19.8% |
| $35,000 to $49,999 | 211 | 11.9% |
| $50,000 to $74,999 | 181 | 10.2% |
| $75,000 to $99,999 | 386 | 21.7% |
| $100,000 to $149,999 | 163 | 9.2% |
| $150,000 to $199,999 | 37 | 2.1% |
| $200,000+ | 73 | 4.1% |
Household Income by Householder Age in Athens borough
The median household income in Athens borough is $48,503, with the highest median household income of $76,750 found in the 25 to 44 years age bracket for the primary householder. A total of 427 households (24.0%) fall into this category. Meanwhile, the 65+ years age bracket for the primary householder has the lowest median household income of $28,311, with 539 households (30.3%) in this group.
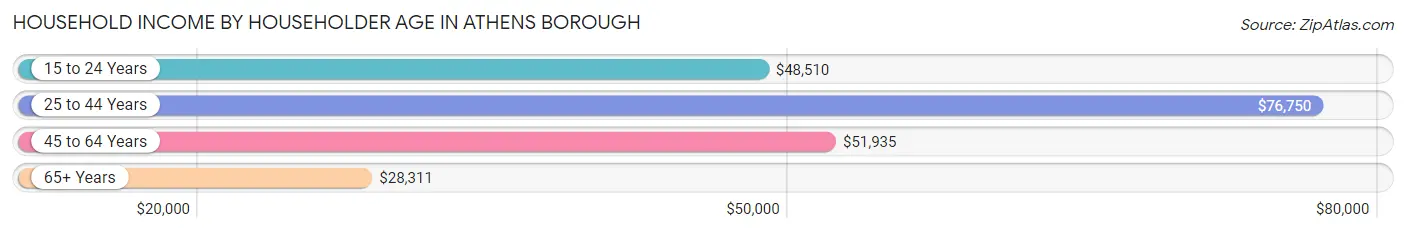
| Income Bracket | # Households | Median Income |
| 15 to 24 Years | 165 (9.3%) | $48,510 |
| 25 to 44 Years | 427 (24.0%) | $76,750 |
| 45 to 64 Years | 646 (36.3%) | $51,935 |
| 65+ Years | 539 (30.3%) | $28,311 |
| Total | 1,777 (100.0%) | $48,503 |
Poverty in Athens borough
Income Below Poverty by Sex and Age in Athens borough
With 11.0% poverty level for males and 20.7% for females among the residents of Athens borough, under 5 year old males and under 5 year old females are the most vulnerable to poverty, with 43 males (65.1%) and 42 females (91.3%) in their respective age groups living below the poverty level.
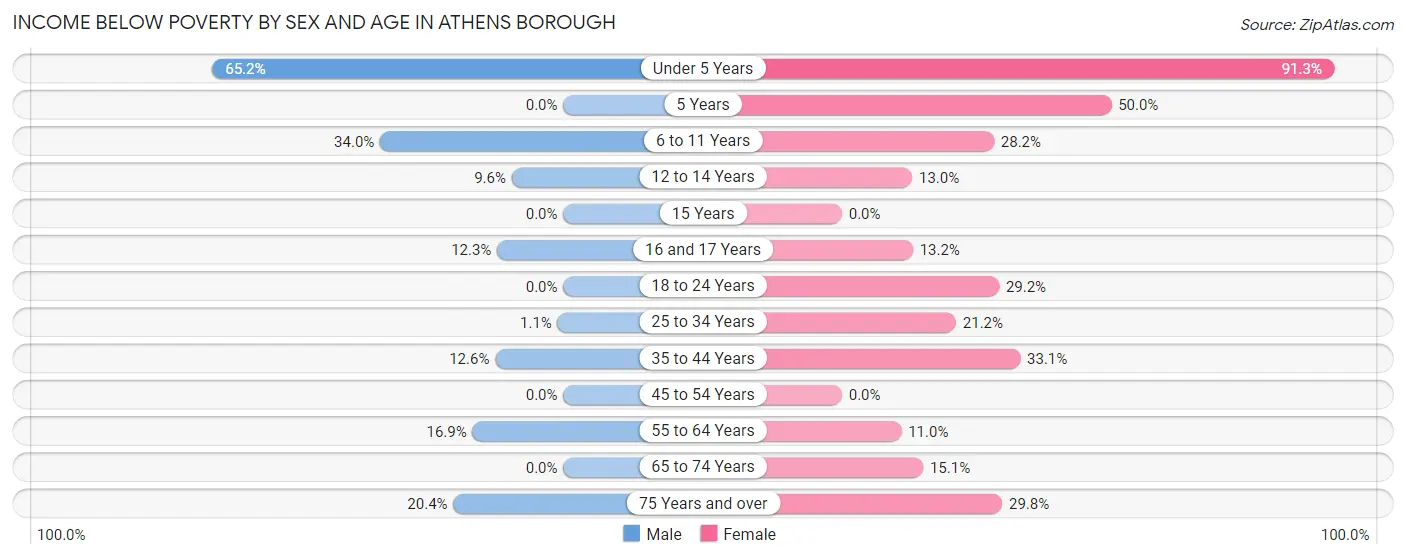
| Age Bracket | Male | Female |
| Under 5 Years | 43 (65.1%) | 42 (91.3%) |
| 5 Years | 0 (0.0%) | 8 (50.0%) |
| 6 to 11 Years | 34 (34.0%) | 35 (28.2%) |
| 12 to 14 Years | 9 (9.6%) | 6 (13.0%) |
| 15 Years | 0 (0.0%) | 0 (0.0%) |
| 16 and 17 Years | 7 (12.3%) | 5 (13.2%) |
| 18 to 24 Years | 0 (0.0%) | 21 (29.2%) |
| 25 to 34 Years | 2 (1.1%) | 29 (21.2%) |
| 35 to 44 Years | 23 (12.6%) | 48 (33.1%) |
| 45 to 54 Years | 0 (0.0%) | 0 (0.0%) |
| 55 to 64 Years | 60 (16.9%) | 31 (11.0%) |
| 65 to 74 Years | 0 (0.0%) | 41 (15.1%) |
| 75 Years and over | 20 (20.4%) | 25 (29.8%) |
| Total | 198 (11.0%) | 291 (20.7%) |
Income Above Poverty by Sex and Age in Athens borough
According to the poverty statistics in Athens borough, males aged 5 years and females aged 15 years are the age groups that are most secure financially, with 100.0% of males and 100.0% of females in these age groups living above the poverty line.
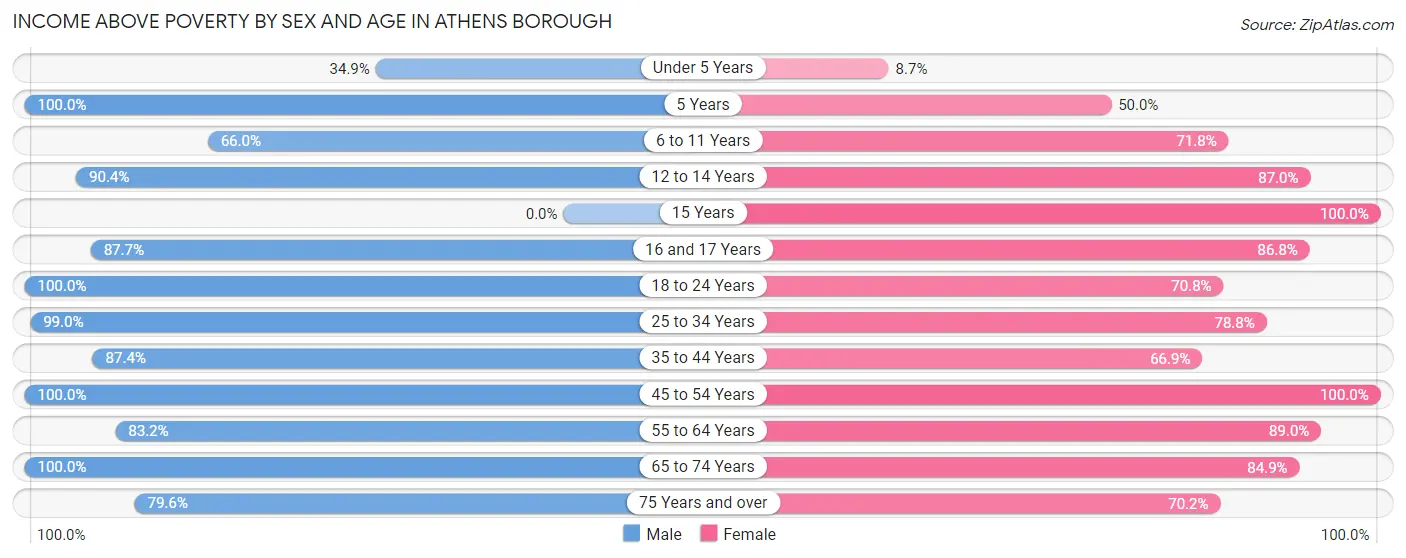
| Age Bracket | Male | Female |
| Under 5 Years | 23 (34.8%) | 4 (8.7%) |
| 5 Years | 25 (100.0%) | 8 (50.0%) |
| 6 to 11 Years | 66 (66.0%) | 89 (71.8%) |
| 12 to 14 Years | 85 (90.4%) | 40 (87.0%) |
| 15 Years | 0 (0.0%) | 7 (100.0%) |
| 16 and 17 Years | 50 (87.7%) | 33 (86.8%) |
| 18 to 24 Years | 197 (100.0%) | 51 (70.8%) |
| 25 to 34 Years | 189 (99.0%) | 108 (78.8%) |
| 35 to 44 Years | 159 (87.4%) | 97 (66.9%) |
| 45 to 54 Years | 195 (100.0%) | 139 (100.0%) |
| 55 to 64 Years | 296 (83.2%) | 250 (89.0%) |
| 65 to 74 Years | 246 (100.0%) | 231 (84.9%) |
| 75 Years and over | 78 (79.6%) | 59 (70.2%) |
| Total | 1,609 (89.0%) | 1,116 (79.3%) |
Income Below Poverty Among Married-Couple Families in Athens borough
The poverty statistics for married-couple families in Athens borough show that 2.9% or 15 of the total 522 families live below the poverty line. Families with 3 or 4 children have the highest poverty rate of 12.5%, comprising of 6 families. On the other hand, families with 1 or 2 children have the lowest poverty rate of 0.0%, which includes 0 families.
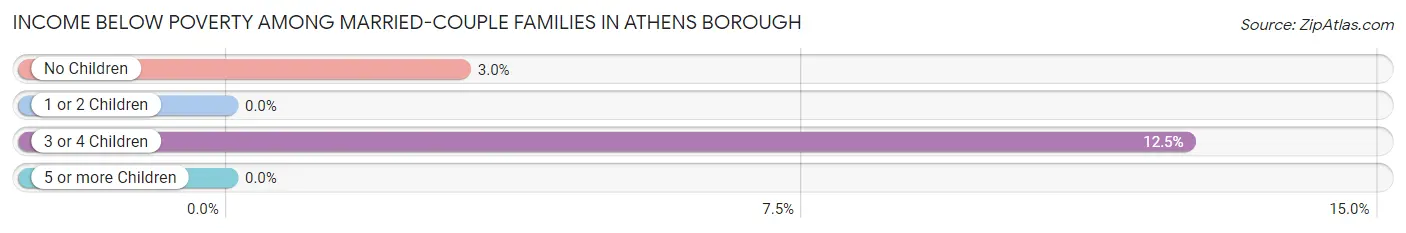
| Children | Above Poverty | Below Poverty |
| No Children | 287 (97.0%) | 9 (3.0%) |
| 1 or 2 Children | 178 (100.0%) | 0 (0.0%) |
| 3 or 4 Children | 42 (87.5%) | 6 (12.5%) |
| 5 or more Children | 0 (0.0%) | 0 (0.0%) |
| Total | 507 (97.1%) | 15 (2.9%) |
Income Below Poverty Among Single-Parent Households in Athens borough
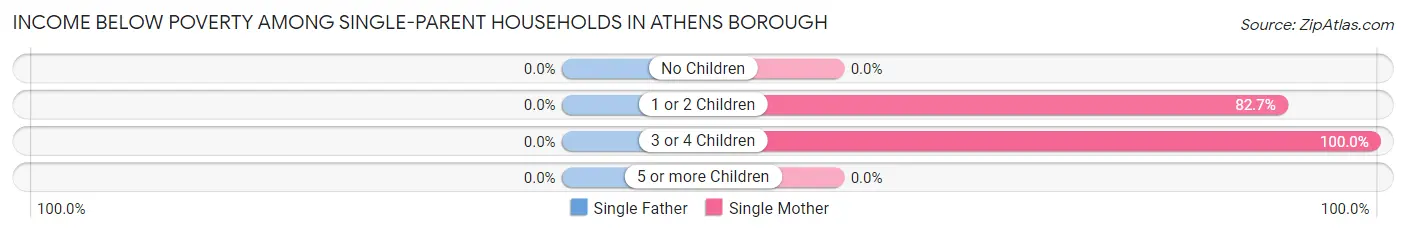
| Children | Single Father | Single Mother |
| No Children | 0 (0.0%) | 0 (0.0%) |
| 1 or 2 Children | 0 (0.0%) | 62 (82.7%) |
| 3 or 4 Children | 0 (0.0%) | 16 (100.0%) |
| 5 or more Children | 0 (0.0%) | 0 (0.0%) |
| Total | 0 (0.0%) | 78 (69.6%) |
Income Below Poverty Among Married-Couple vs Single-Parent Households in Athens borough
The poverty data for Athens borough shows that 15 of the married-couple family households (2.9%) and 78 of the single-parent households (50.3%) are living below the poverty level. Within the married-couple family households, those with 3 or 4 children have the highest poverty rate, with 6 households (12.5%) falling below the poverty line. Among the single-parent households, those with 3 or 4 children have the highest poverty rate, with 16 household (100.0%) living below poverty.
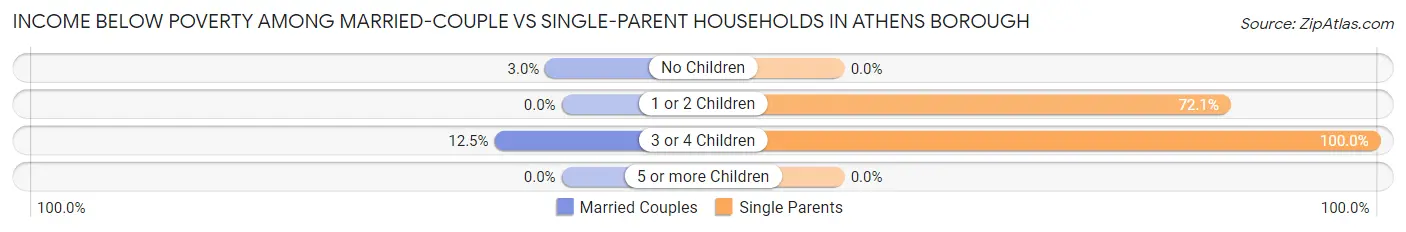
| Children | Married-Couple Families | Single-Parent Households |
| No Children | 9 (3.0%) | 0 (0.0%) |
| 1 or 2 Children | 0 (0.0%) | 62 (72.1%) |
| 3 or 4 Children | 6 (12.5%) | 16 (100.0%) |
| 5 or more Children | 0 (0.0%) | 0 (0.0%) |
| Total | 15 (2.9%) | 78 (50.3%) |
Race in Athens borough
The most populous races in Athens borough are White / Caucasian (3,065 | 93.7%), Asian (86 | 2.6%), and Two or more Races (54 | 1.7%).
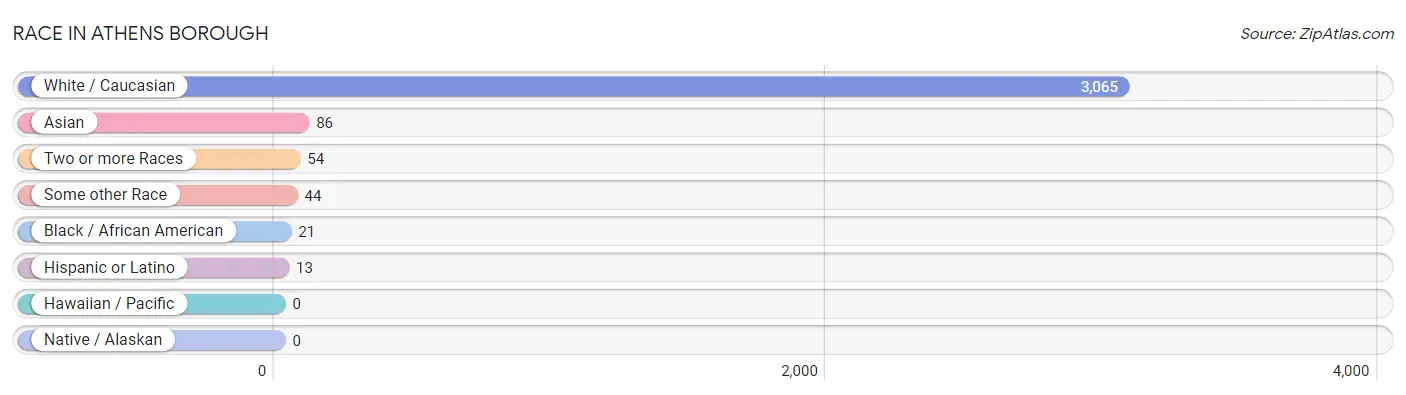
| Race | # Population | % Population |
| Asian | 86 | 2.6% |
| Black / African American | 21 | 0.6% |
| Hawaiian / Pacific | 0 | 0.0% |
| Hispanic or Latino | 13 | 0.4% |
| Native / Alaskan | 0 | 0.0% |
| White / Caucasian | 3,065 | 93.7% |
| Two or more Races | 54 | 1.7% |
| Some other Race | 44 | 1.3% |
| Total | 3,270 | 100.0% |
Ancestry in Athens borough
The most populous ancestries reported in Athens borough are German (587 | 17.9%), English (463 | 14.2%), Irish (422 | 12.9%), Scottish (252 | 7.7%), and Italian (215 | 6.6%), together accounting for 59.3% of all Athens borough residents.
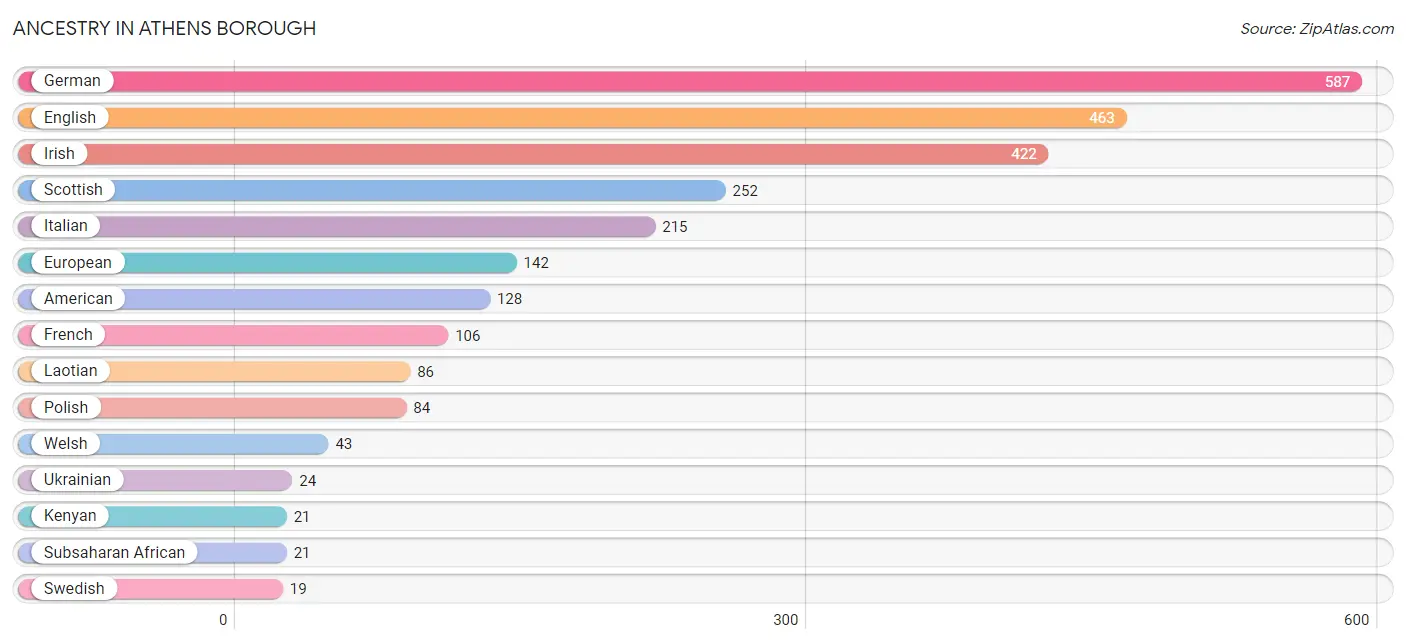
| Ancestry | # Population | % Population |
| American | 128 | 3.9% |
| Blackfeet | 17 | 0.5% |
| British | 8 | 0.2% |
| Central American | 13 | 0.4% |
| Cherokee | 17 | 0.5% |
| Czechoslovakian | 12 | 0.4% |
| English | 463 | 14.2% |
| European | 142 | 4.3% |
| French | 106 | 3.2% |
| French Canadian | 12 | 0.4% |
| German | 587 | 17.9% |
| Guatemalan | 13 | 0.4% |
| Irish | 422 | 12.9% |
| Italian | 215 | 6.6% |
| Kenyan | 21 | 0.6% |
| Laotian | 86 | 2.6% |
| Lithuanian | 14 | 0.4% |
| Norwegian | 8 | 0.2% |
| Polish | 84 | 2.6% |
| Russian | 9 | 0.3% |
| Scottish | 252 | 7.7% |
| Subsaharan African | 21 | 0.6% |
| Swedish | 19 | 0.6% |
| Ukrainian | 24 | 0.7% |
| Welsh | 43 | 1.3% | View All 25 Rows |
Immigrants in Athens borough
The most numerous immigrant groups reported in Athens borough came from Africa (21 | 0.6%), Asia (21 | 0.6%), Eastern Africa (21 | 0.6%), Indonesia (21 | 0.6%), and Kenya (21 | 0.6%), together accounting for 3.2% of all Athens borough residents.
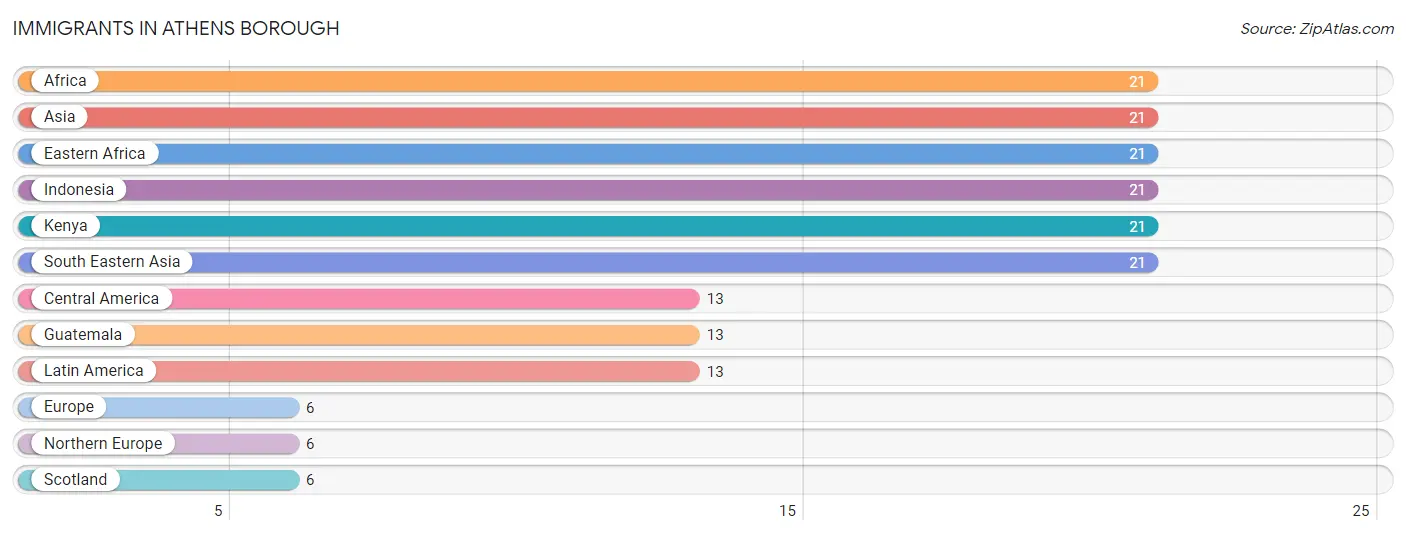
| Immigration Origin | # Population | % Population |
| Africa | 21 | 0.6% |
| Asia | 21 | 0.6% |
| Central America | 13 | 0.4% |
| Eastern Africa | 21 | 0.6% |
| Europe | 6 | 0.2% |
| Guatemala | 13 | 0.4% |
| Indonesia | 21 | 0.6% |
| Kenya | 21 | 0.6% |
| Latin America | 13 | 0.4% |
| Northern Europe | 6 | 0.2% |
| Scotland | 6 | 0.2% |
| South Eastern Asia | 21 | 0.6% | View All 12 Rows |
Sex and Age in Athens borough
Sex and Age in Athens borough
The most populous age groups in Athens borough are 55 to 59 Years (263 | 14.3%) for men and 65 to 69 Years (191 | 13.3%) for women.
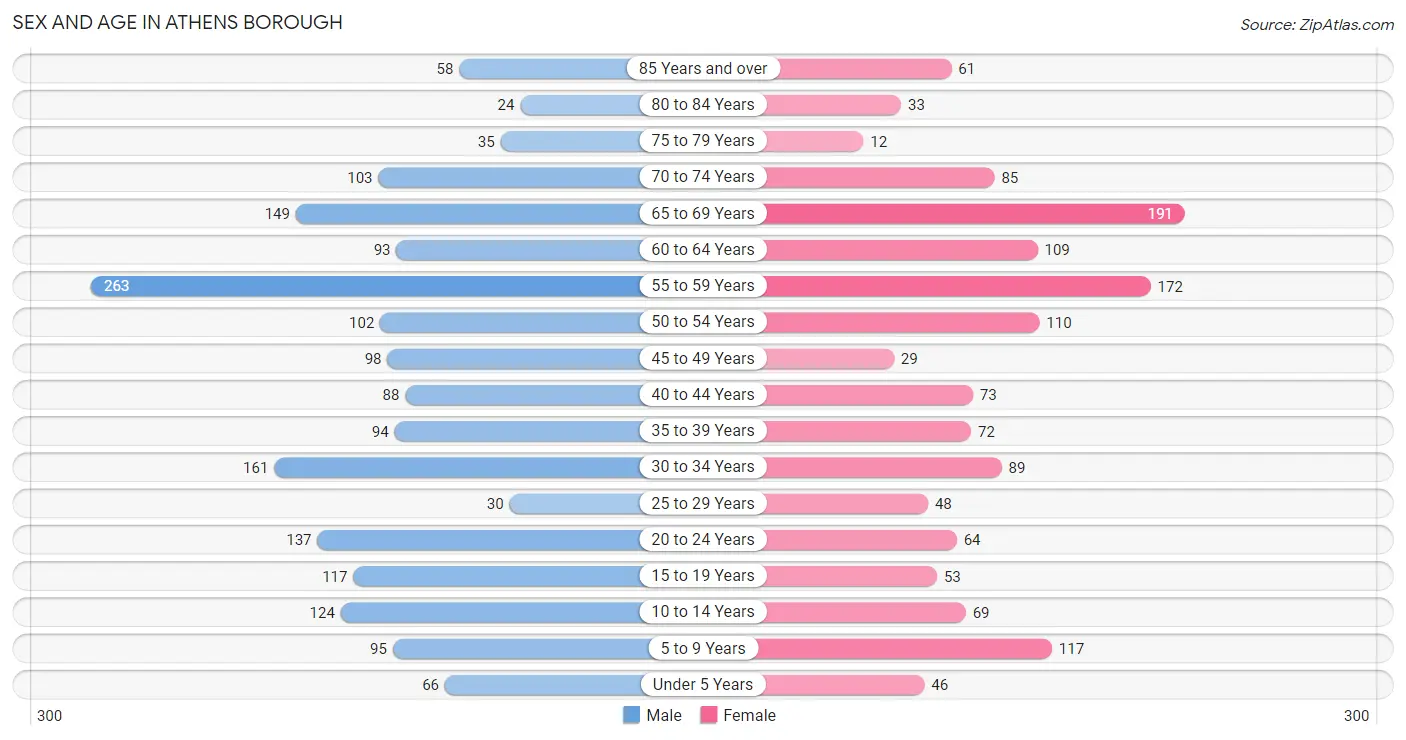
| Age Bracket | Male | Female |
| Under 5 Years | 66 (3.6%) | 46 (3.2%) |
| 5 to 9 Years | 95 (5.2%) | 117 (8.2%) |
| 10 to 14 Years | 124 (6.8%) | 69 (4.8%) |
| 15 to 19 Years | 117 (6.4%) | 53 (3.7%) |
| 20 to 24 Years | 137 (7.5%) | 64 (4.5%) |
| 25 to 29 Years | 30 (1.6%) | 48 (3.4%) |
| 30 to 34 Years | 161 (8.8%) | 89 (6.2%) |
| 35 to 39 Years | 94 (5.1%) | 72 (5.0%) |
| 40 to 44 Years | 88 (4.8%) | 73 (5.1%) |
| 45 to 49 Years | 98 (5.3%) | 29 (2.0%) |
| 50 to 54 Years | 102 (5.6%) | 110 (7.7%) |
| 55 to 59 Years | 263 (14.3%) | 172 (12.0%) |
| 60 to 64 Years | 93 (5.1%) | 109 (7.6%) |
| 65 to 69 Years | 149 (8.1%) | 191 (13.3%) |
| 70 to 74 Years | 103 (5.6%) | 85 (5.9%) |
| 75 to 79 Years | 35 (1.9%) | 12 (0.8%) |
| 80 to 84 Years | 24 (1.3%) | 33 (2.3%) |
| 85 Years and over | 58 (3.2%) | 61 (4.3%) |
| Total | 1,837 (100.0%) | 1,433 (100.0%) |
Families and Households in Athens borough
Median Family Size in Athens borough
The median family size in Athens borough is 2.93 persons per family, with single female/mother families (112 | 16.5%) accounting for the largest median family size of 3.21 persons per family. On the other hand, single male/father families (43 | 6.4%) represent the smallest median family size with 2.49 persons per family.
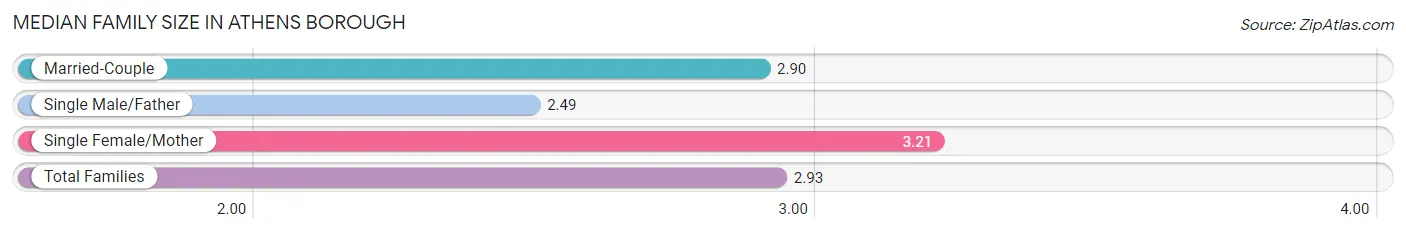
| Family Type | # Families | Family Size |
| Married-Couple | 522 (77.1%) | 2.90 |
| Single Male/Father | 43 (6.4%) | 2.49 |
| Single Female/Mother | 112 (16.5%) | 3.21 |
| Total Families | 677 (100.0%) | 2.93 |
Median Household Size in Athens borough
The median household size in Athens borough is 1.81 persons per household, with single female/mother households (112 | 6.3%) accounting for the largest median household size of 3.87 persons per household. non-family households (1,100 | 61.9%) represent the smallest median household size with 1.05 persons per household.
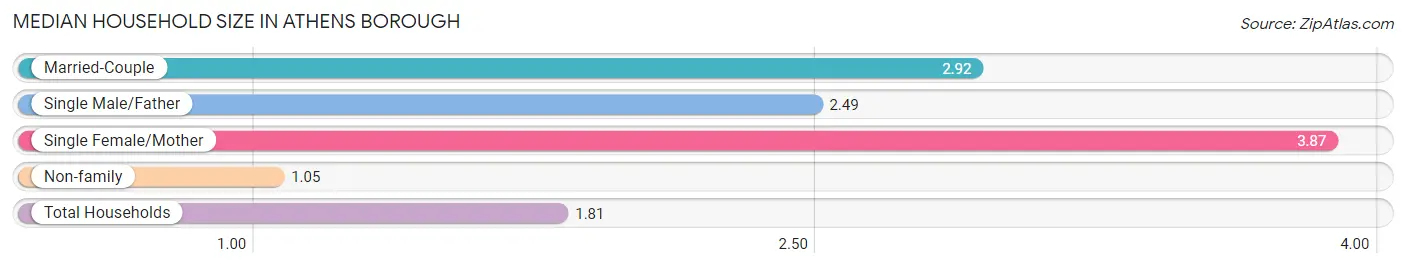
| Household Type | # Households | Household Size |
| Married-Couple | 522 (29.4%) | 2.92 |
| Single Male/Father | 43 (2.4%) | 2.49 |
| Single Female/Mother | 112 (6.3%) | 3.87 |
| Non-family | 1,100 (61.9%) | 1.05 |
| Total Households | 1,777 (100.0%) | 1.81 |
Household Size by Marriage Status in Athens borough
Out of a total of 1,777 households in Athens borough, 677 (38.1%) are family households, while 1,100 (61.9%) are nonfamily households. The most numerous type of family households are 2-person households, comprising 330, and the most common type of nonfamily households are 1-person households, comprising 1,044.
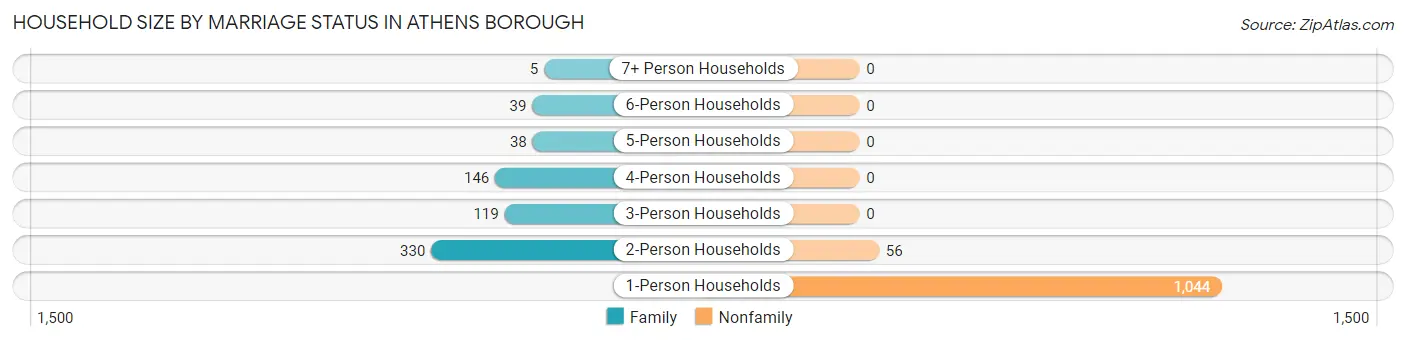
| Household Size | Family Households | Nonfamily Households |
| 1-Person Households | - | 1,044 (58.8%) |
| 2-Person Households | 330 (18.6%) | 56 (3.2%) |
| 3-Person Households | 119 (6.7%) | 0 (0.0%) |
| 4-Person Households | 146 (8.2%) | 0 (0.0%) |
| 5-Person Households | 38 (2.1%) | 0 (0.0%) |
| 6-Person Households | 39 (2.2%) | 0 (0.0%) |
| 7+ Person Households | 5 (0.3%) | 0 (0.0%) |
| Total | 677 (38.1%) | 1,100 (61.9%) |
Female Fertility in Athens borough
Fertility by Age in Athens borough
Average fertility rate in Athens borough is 7.0 births per 1,000 women. Women in the age bracket of 20 to 34 years have the highest fertility rate with 15.0 births per 1,000 women. Women in the age bracket of 20 to 34 years acount for 100.0% of all women with births.
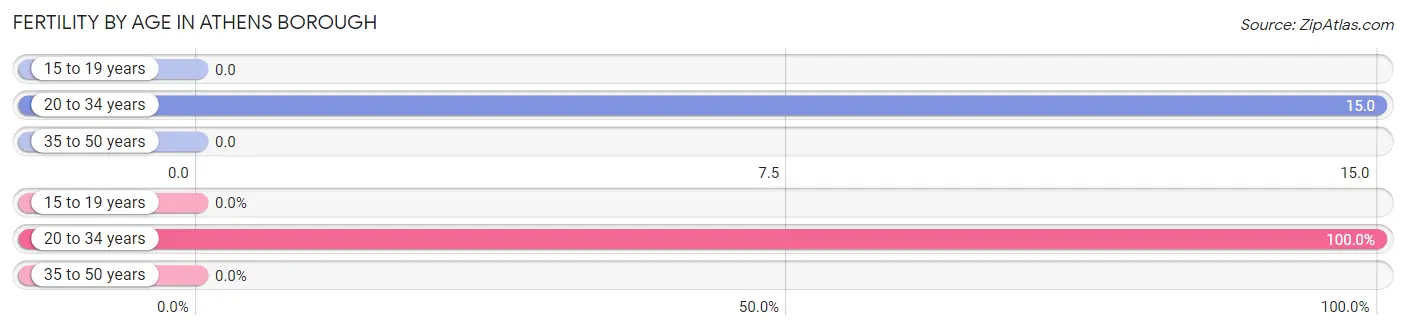
| Age Bracket | Women with Births | Births / 1,000 Women |
| 15 to 19 years | 0 (0.0%) | 0.0 |
| 20 to 34 years | 3 (100.0%) | 15.0 |
| 35 to 50 years | 0 (0.0%) | 0.0 |
| Total | 3 (100.0%) | 7.0 |
Fertility by Age by Marriage Status in Athens borough
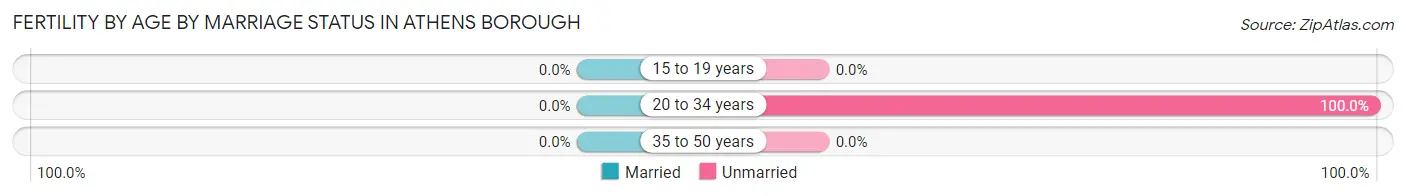
| Age Bracket | Married | Unmarried |
| 15 to 19 years | 0 (0.0%) | 0 (0.0%) |
| 20 to 34 years | 0 (0.0%) | 3 (100.0%) |
| 35 to 50 years | 0 (0.0%) | 0 (0.0%) |
| Total | 0 (0.0%) | 3 (100.0%) |
Fertility by Education in Athens borough
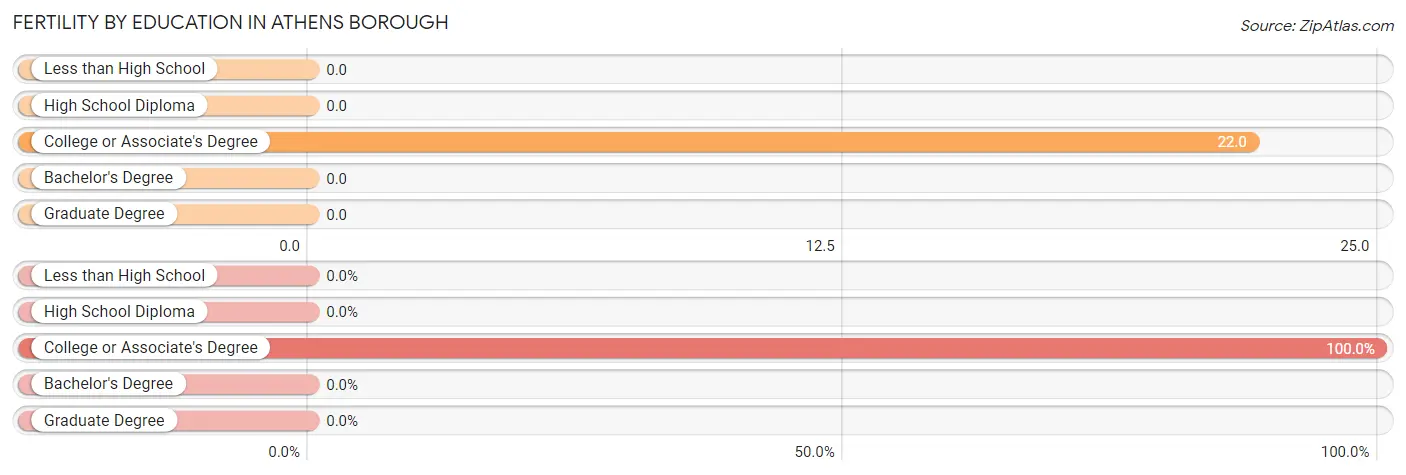
| Educational Attainment | Women with Births | Births / 1,000 Women |
| Less than High School | 0 (0.0%) | 0.0 |
| High School Diploma | 0 (0.0%) | 0.0 |
| College or Associate's Degree | 3 (100.0%) | 22.0 |
| Bachelor's Degree | 0 (0.0%) | 0.0 |
| Graduate Degree | 0 (0.0%) | 0.0 |
| Total | 3 (100.0%) | 7.0 |
Fertility by Education by Marriage Status in Athens borough
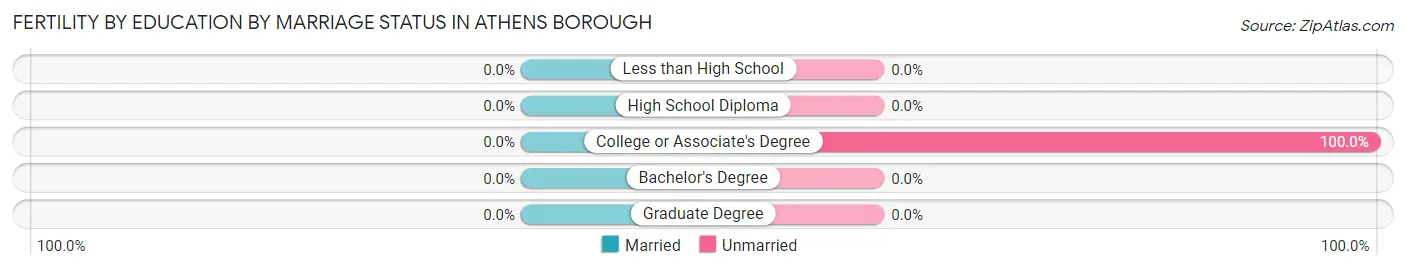
| Educational Attainment | Married | Unmarried |
| Less than High School | 0 (0.0%) | 0 (0.0%) |
| High School Diploma | 0 (0.0%) | 0 (0.0%) |
| College or Associate's Degree | 0 (0.0%) | 3 (100.0%) |
| Bachelor's Degree | 0 (0.0%) | 0 (0.0%) |
| Graduate Degree | 0 (0.0%) | 0 (0.0%) |
| Total | 0 (0.0%) | 3 (100.0%) |
Employment Characteristics in Athens borough
Employment by Class of Employer in Athens borough
Among the 1,503 employed individuals in Athens borough, private company employees (1,185 | 78.8%), not-for-profit organizations (129 | 8.6%), and state government employees (92 | 6.1%) make up the most common classes of employment.
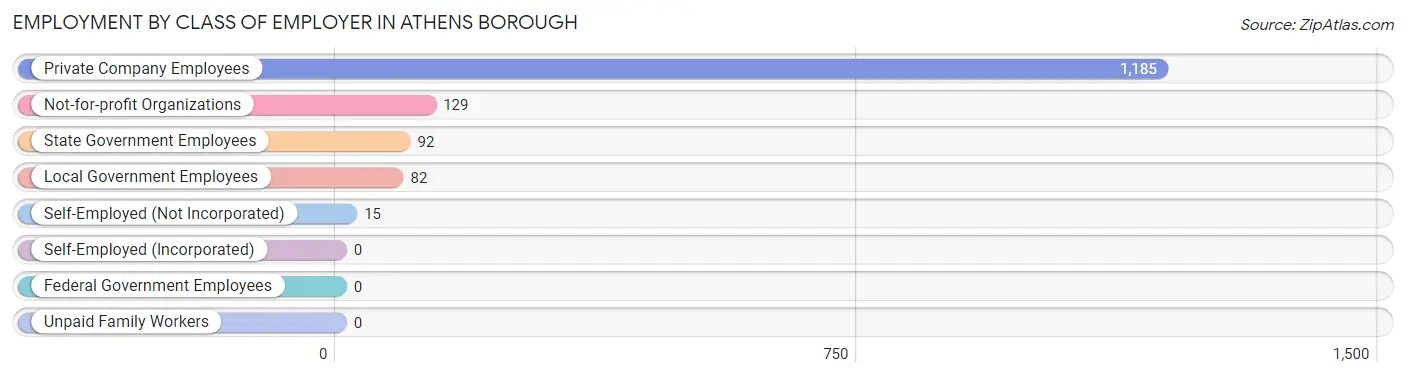
| Employer Class | # Employees | % Employees |
| Private Company Employees | 1,185 | 78.8% |
| Self-Employed (Incorporated) | 0 | 0.0% |
| Self-Employed (Not Incorporated) | 15 | 1.0% |
| Not-for-profit Organizations | 129 | 8.6% |
| Local Government Employees | 82 | 5.5% |
| State Government Employees | 92 | 6.1% |
| Federal Government Employees | 0 | 0.0% |
| Unpaid Family Workers | 0 | 0.0% |
| Total | 1,503 | 100.0% |
Employment Status by Age in Athens borough
According to the labor force statistics for Athens borough, out of the total population over 16 years of age (2,746), 58.8% or 1,615 individuals are in the labor force, with 3.5% or 57 of them unemployed. The age group with the highest labor force participation rate is 25 to 29 years, with 100.0% or 78 individuals in the labor force. Within the labor force, the 65 to 74 years age range has the highest percentage of unemployed individuals, with 11.1% or 11 of them being unemployed.
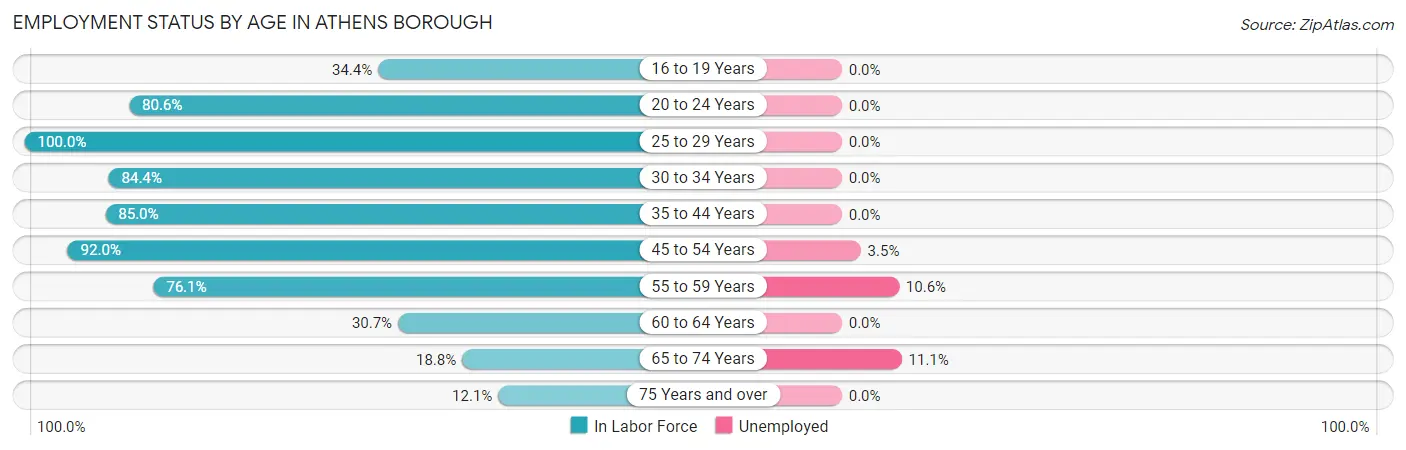
| Age Bracket | In Labor Force | Unemployed |
| 16 to 19 Years | 56 (34.4%) | 0 (0.0%) |
| 20 to 24 Years | 162 (80.6%) | 0 (0.0%) |
| 25 to 29 Years | 78 (100.0%) | 0 (0.0%) |
| 30 to 34 Years | 211 (84.4%) | 0 (0.0%) |
| 35 to 44 Years | 278 (85.0%) | 0 (0.0%) |
| 45 to 54 Years | 312 (92.0%) | 11 (3.5%) |
| 55 to 59 Years | 331 (76.1%) | 35 (10.6%) |
| 60 to 64 Years | 62 (30.7%) | 0 (0.0%) |
| 65 to 74 Years | 99 (18.8%) | 11 (11.1%) |
| 75 Years and over | 27 (12.1%) | 0 (0.0%) |
| Total | 1,615 (58.8%) | 57 (3.5%) |
Employment Status by Educational Attainment in Athens borough
According to labor force statistics for Athens borough, 78.0% of individuals (1,272) out of the total population between 25 and 64 years of age (1,631) are in the labor force, with 3.6% or 46 of them being unemployed. The group with the highest labor force participation rate are those with the educational attainment of bachelor's degree or higher, with 89.9% or 337 individuals in the labor force. Within the labor force, individuals with college / associate degree education have the highest percentage of unemployment, with 8.2% or 35 of them being unemployed.
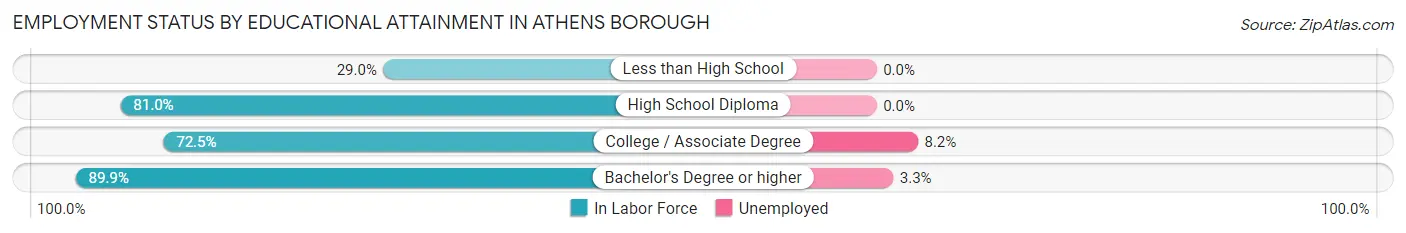
| Educational Attainment | In Labor Force | Unemployed |
| Less than High School | 18 (29.0%) | 0 (0.0%) |
| High School Diploma | 489 (81.0%) | 0 (0.0%) |
| College / Associate Degree | 428 (72.5%) | 48 (8.2%) |
| Bachelor's Degree or higher | 337 (89.9%) | 12 (3.3%) |
| Total | 1,272 (78.0%) | 59 (3.6%) |
Employment Occupations by Sex in Athens borough
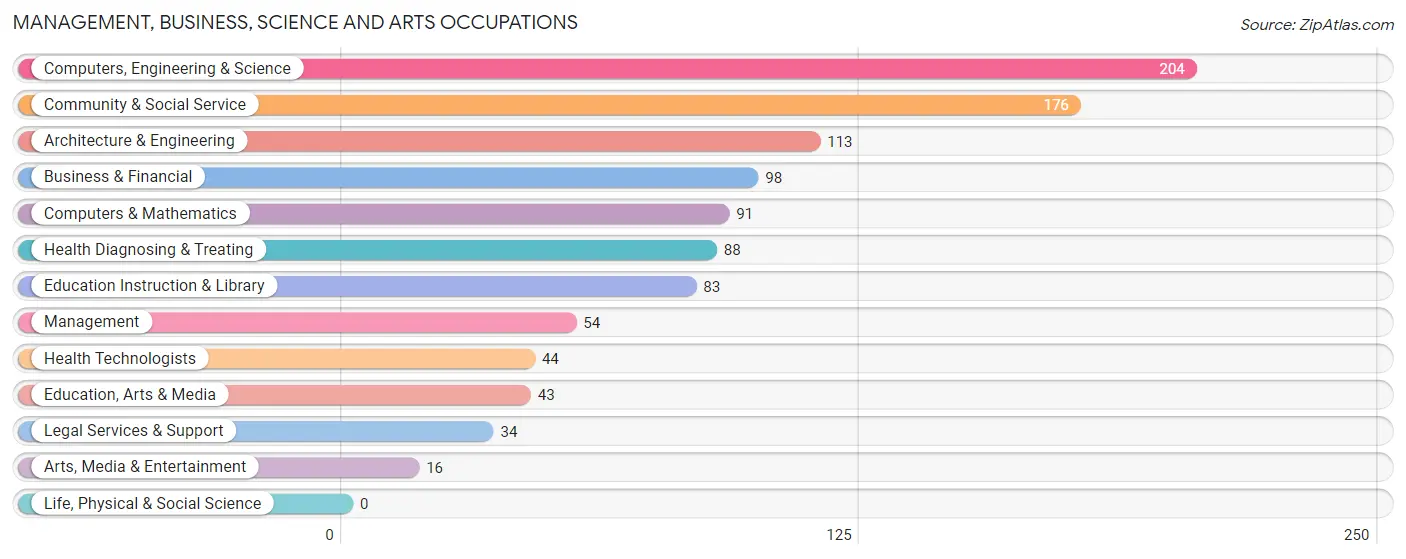
Management, Business, Science and Arts Occupations
The most common Management, Business, Science and Arts occupations in Athens borough are Computers, Engineering & Science (204 | 13.1%), Community & Social Service (176 | 11.3%), Architecture & Engineering (113 | 7.2%), Business & Financial (98 | 6.3%), and Computers & Mathematics (91 | 5.8%).
Management, Business, Science and Arts Occupations by Sex
Within the Management, Business, Science and Arts occupations in Athens borough, the most male-oriented occupations are Architecture & Engineering (100.0%), Arts, Media & Entertainment (100.0%), and Computers, Engineering & Science (91.2%), while the most female-oriented occupations are Health Diagnosing & Treating (80.7%), Education, Arts & Media (76.7%), and Business & Financial (72.5%).
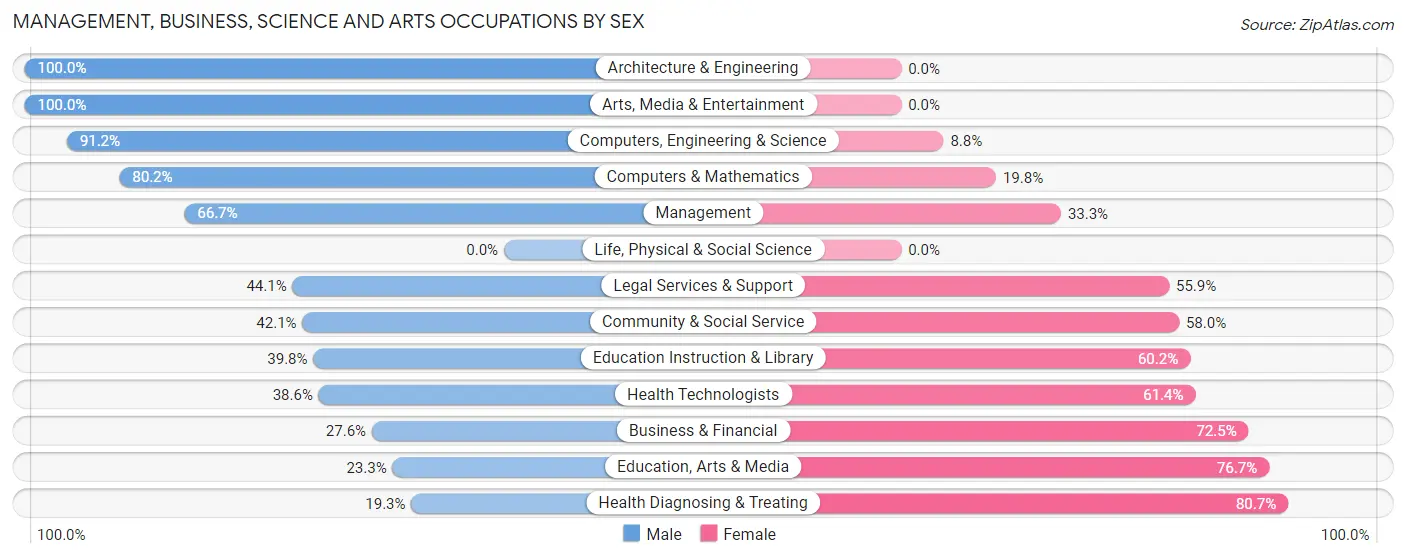
| Occupation | Male | Female |
| Management | 36 (66.7%) | 18 (33.3%) |
| Business & Financial | 27 (27.6%) | 71 (72.5%) |
| Computers, Engineering & Science | 186 (91.2%) | 18 (8.8%) |
| Computers & Mathematics | 73 (80.2%) | 18 (19.8%) |
| Architecture & Engineering | 113 (100.0%) | 0 (0.0%) |
| Life, Physical & Social Science | 0 (0.0%) | 0 (0.0%) |
| Community & Social Service | 74 (42.0%) | 102 (58.0%) |
| Education, Arts & Media | 10 (23.3%) | 33 (76.7%) |
| Legal Services & Support | 15 (44.1%) | 19 (55.9%) |
| Education Instruction & Library | 33 (39.8%) | 50 (60.2%) |
| Arts, Media & Entertainment | 16 (100.0%) | 0 (0.0%) |
| Health Diagnosing & Treating | 17 (19.3%) | 71 (80.7%) |
| Health Technologists | 17 (38.6%) | 27 (61.4%) |
| Total (Category) | 340 (54.8%) | 280 (45.2%) |
| Total (Overall) | 984 (63.1%) | 575 (36.9%) |
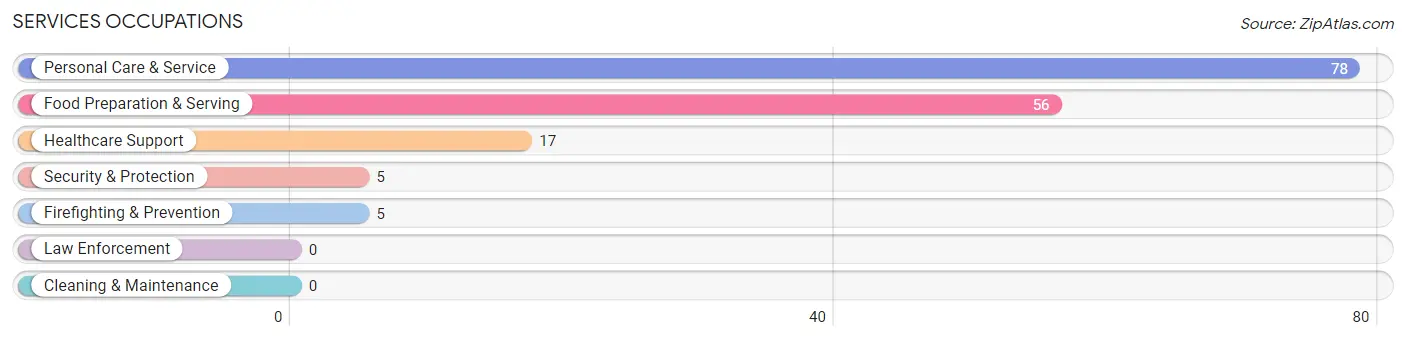
Services Occupations
The most common Services occupations in Athens borough are Personal Care & Service (78 | 5.0%), Food Preparation & Serving (56 | 3.6%), Healthcare Support (17 | 1.1%), Security & Protection (5 | 0.3%), and Firefighting & Prevention (5 | 0.3%).
Services Occupations by Sex
Within the Services occupations in Athens borough, the most male-oriented occupations are Security & Protection (100.0%), Firefighting & Prevention (100.0%), and Food Preparation & Serving (76.8%), while the most female-oriented occupations are Personal Care & Service (100.0%), Healthcare Support (47.1%), and Food Preparation & Serving (23.2%).
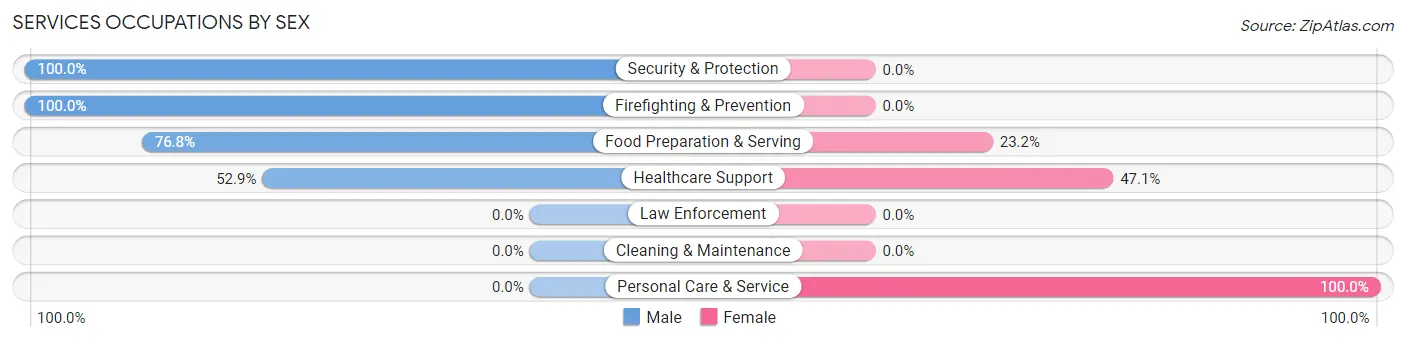
| Occupation | Male | Female |
| Healthcare Support | 9 (52.9%) | 8 (47.1%) |
| Security & Protection | 5 (100.0%) | 0 (0.0%) |
| Firefighting & Prevention | 5 (100.0%) | 0 (0.0%) |
| Law Enforcement | 0 (0.0%) | 0 (0.0%) |
| Food Preparation & Serving | 43 (76.8%) | 13 (23.2%) |
| Cleaning & Maintenance | 0 (0.0%) | 0 (0.0%) |
| Personal Care & Service | 0 (0.0%) | 78 (100.0%) |
| Total (Category) | 57 (36.5%) | 99 (63.5%) |
| Total (Overall) | 984 (63.1%) | 575 (36.9%) |
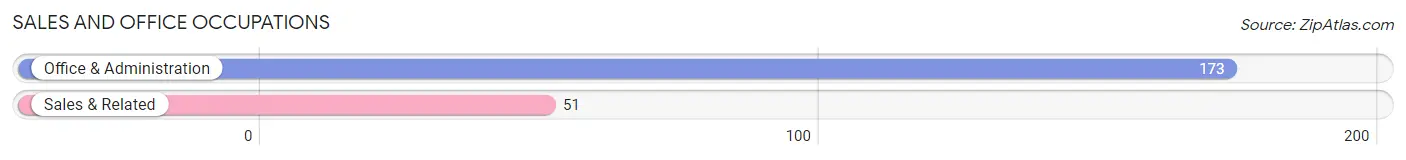
Sales and Office Occupations
The most common Sales and Office occupations in Athens borough are Office & Administration (173 | 11.1%), and Sales & Related (51 | 3.3%).
Sales and Office Occupations by Sex
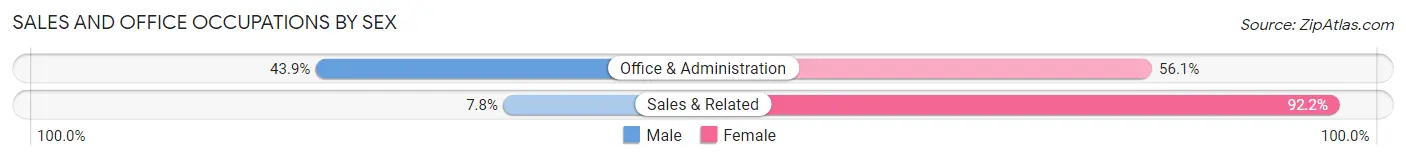
| Occupation | Male | Female |
| Sales & Related | 4 (7.8%) | 47 (92.2%) |
| Office & Administration | 76 (43.9%) | 97 (56.1%) |
| Total (Category) | 80 (35.7%) | 144 (64.3%) |
| Total (Overall) | 984 (63.1%) | 575 (36.9%) |
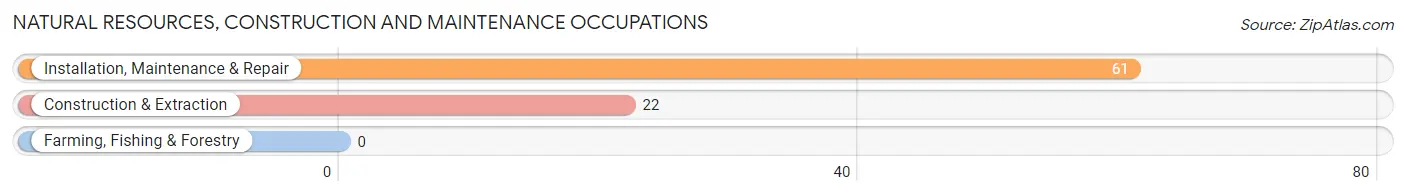
Natural Resources, Construction and Maintenance Occupations
The most common Natural Resources, Construction and Maintenance occupations in Athens borough are Installation, Maintenance & Repair (61 | 3.9%), and Construction & Extraction (22 | 1.4%).
Natural Resources, Construction and Maintenance Occupations by Sex
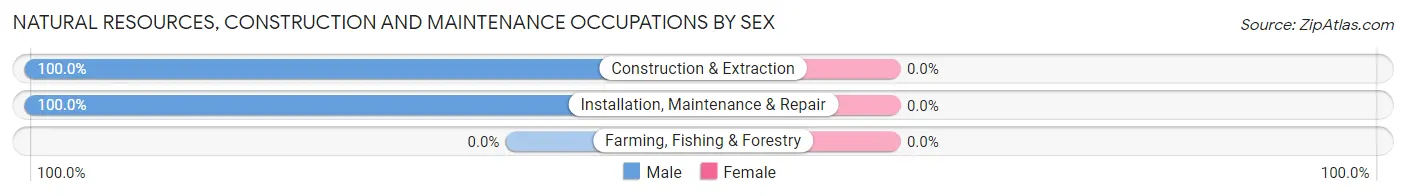
| Occupation | Male | Female |
| Farming, Fishing & Forestry | 0 (0.0%) | 0 (0.0%) |
| Construction & Extraction | 22 (100.0%) | 0 (0.0%) |
| Installation, Maintenance & Repair | 61 (100.0%) | 0 (0.0%) |
| Total (Category) | 83 (100.0%) | 0 (0.0%) |
| Total (Overall) | 984 (63.1%) | 575 (36.9%) |
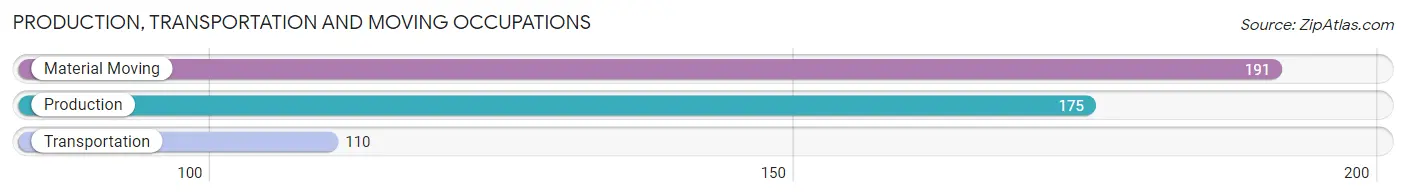
Production, Transportation and Moving Occupations
The most common Production, Transportation and Moving occupations in Athens borough are Material Moving (191 | 12.2%), Production (175 | 11.2%), and Transportation (110 | 7.1%).
Production, Transportation and Moving Occupations by Sex
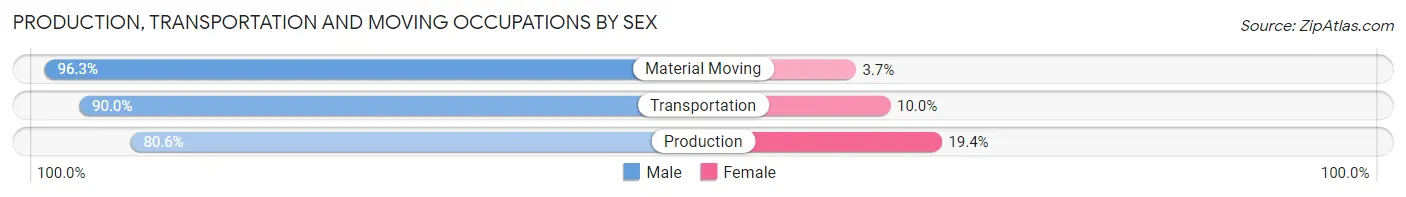
| Occupation | Male | Female |
| Production | 141 (80.6%) | 34 (19.4%) |
| Transportation | 99 (90.0%) | 11 (10.0%) |
| Material Moving | 184 (96.3%) | 7 (3.7%) |
| Total (Category) | 424 (89.1%) | 52 (10.9%) |
| Total (Overall) | 984 (63.1%) | 575 (36.9%) |
Employment Industries by Sex in Athens borough
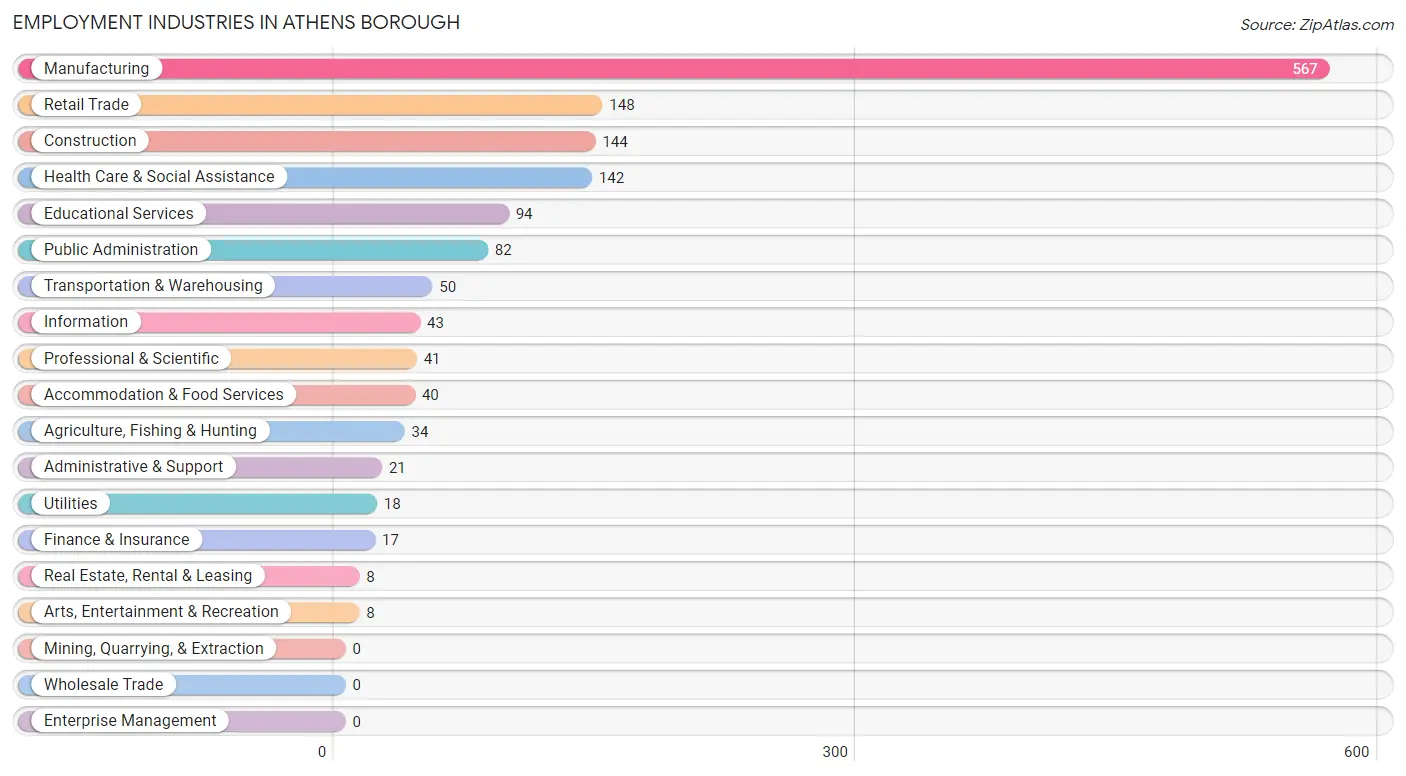
Employment Industries in Athens borough
The major employment industries in Athens borough include Manufacturing (567 | 36.4%), Retail Trade (148 | 9.5%), Construction (144 | 9.2%), Health Care & Social Assistance (142 | 9.1%), and Educational Services (94 | 6.0%).
Employment Industries by Sex in Athens borough
The Athens borough industries that see more men than women are Construction (100.0%), Utilities (100.0%), and Real Estate, Rental & Leasing (100.0%), whereas the industries that tend to have a higher number of women are Agriculture, Fishing & Hunting (100.0%), Finance & Insurance (100.0%), and Administrative & Support (100.0%).
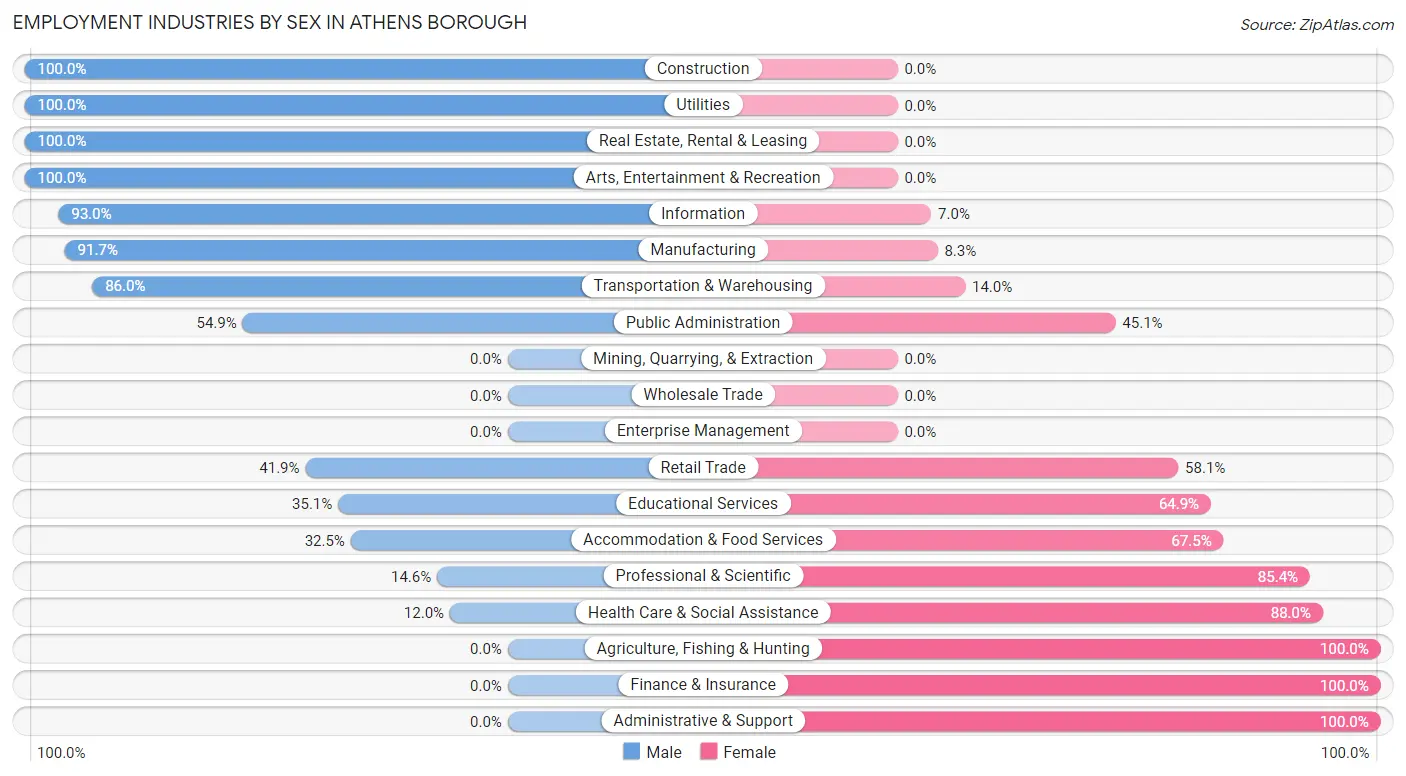
| Industry | Male | Female |
| Agriculture, Fishing & Hunting | 0 (0.0%) | 34 (100.0%) |
| Mining, Quarrying, & Extraction | 0 (0.0%) | 0 (0.0%) |
| Construction | 144 (100.0%) | 0 (0.0%) |
| Manufacturing | 520 (91.7%) | 47 (8.3%) |
| Wholesale Trade | 0 (0.0%) | 0 (0.0%) |
| Retail Trade | 62 (41.9%) | 86 (58.1%) |
| Transportation & Warehousing | 43 (86.0%) | 7 (14.0%) |
| Utilities | 18 (100.0%) | 0 (0.0%) |
| Information | 40 (93.0%) | 3 (7.0%) |
| Finance & Insurance | 0 (0.0%) | 17 (100.0%) |
| Real Estate, Rental & Leasing | 8 (100.0%) | 0 (0.0%) |
| Professional & Scientific | 6 (14.6%) | 35 (85.4%) |
| Enterprise Management | 0 (0.0%) | 0 (0.0%) |
| Administrative & Support | 0 (0.0%) | 21 (100.0%) |
| Educational Services | 33 (35.1%) | 61 (64.9%) |
| Health Care & Social Assistance | 17 (12.0%) | 125 (88.0%) |
| Arts, Entertainment & Recreation | 8 (100.0%) | 0 (0.0%) |
| Accommodation & Food Services | 13 (32.5%) | 27 (67.5%) |
| Public Administration | 45 (54.9%) | 37 (45.1%) |
| Total | 984 (63.1%) | 575 (36.9%) |
Education in Athens borough
School Enrollment in Athens borough
The most common levels of schooling among the 650 students in Athens borough are elementary school (177 | 27.2%), high school (169 | 26.0%), and middle school (117 | 18.0%).
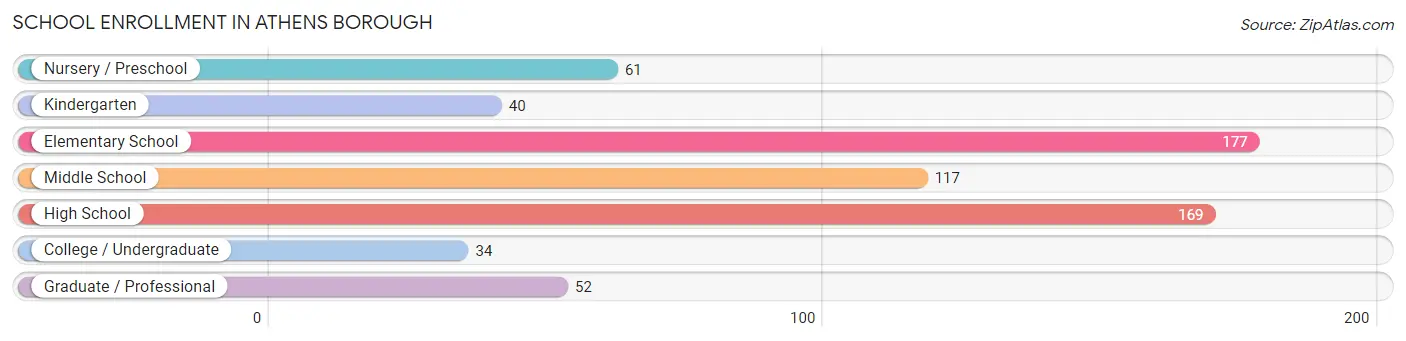
| School Level | # Students | % Students |
| Nursery / Preschool | 61 | 9.4% |
| Kindergarten | 40 | 6.1% |
| Elementary School | 177 | 27.2% |
| Middle School | 117 | 18.0% |
| High School | 169 | 26.0% |
| College / Undergraduate | 34 | 5.2% |
| Graduate / Professional | 52 | 8.0% |
| Total | 650 | 100.0% |
School Enrollment by Age by Funding Source in Athens borough
Out of a total of 650 students who are enrolled in schools in Athens borough, 164 (25.2%) attend a private institution, while the remaining 486 (74.8%) are enrolled in public schools. The age group of 3 to 4 year olds has the highest likelihood of being enrolled in private schools, with 39 (100.0% in the age bracket) enrolled. Conversely, the age group of 35 years and over has the lowest likelihood of being enrolled in a private school, with 10 (100.0% in the age bracket) attending a public institution.
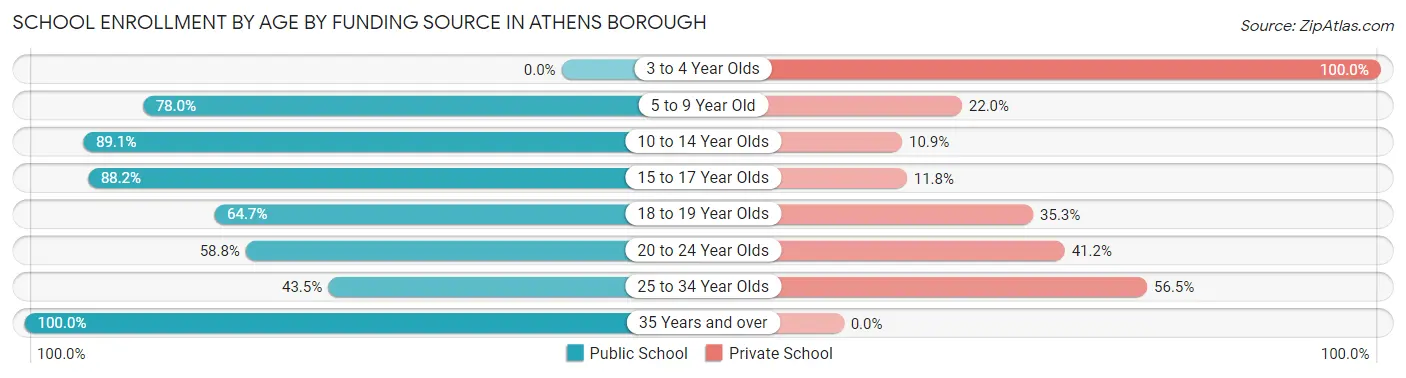
| Age Bracket | Public School | Private School |
| 3 to 4 Year Olds | 0 (0.0%) | 39 (100.0%) |
| 5 to 9 Year Old | 163 (78.0%) | 46 (22.0%) |
| 10 to 14 Year Olds | 172 (89.1%) | 21 (10.9%) |
| 15 to 17 Year Olds | 90 (88.2%) | 12 (11.8%) |
| 18 to 19 Year Olds | 11 (64.7%) | 6 (35.3%) |
| 20 to 24 Year Olds | 20 (58.8%) | 14 (41.2%) |
| 25 to 34 Year Olds | 20 (43.5%) | 26 (56.5%) |
| 35 Years and over | 10 (100.0%) | 0 (0.0%) |
| Total | 486 (74.8%) | 164 (25.2%) |
Educational Attainment by Field of Study in Athens borough
Science & technology (148 | 24.4%), arts & humanities (94 | 15.5%), business (90 | 14.8%), education (90 | 14.8%), and multidisciplinary studies (40 | 6.6%) are the most common fields of study among 607 individuals in Athens borough who have obtained a bachelor's degree or higher.
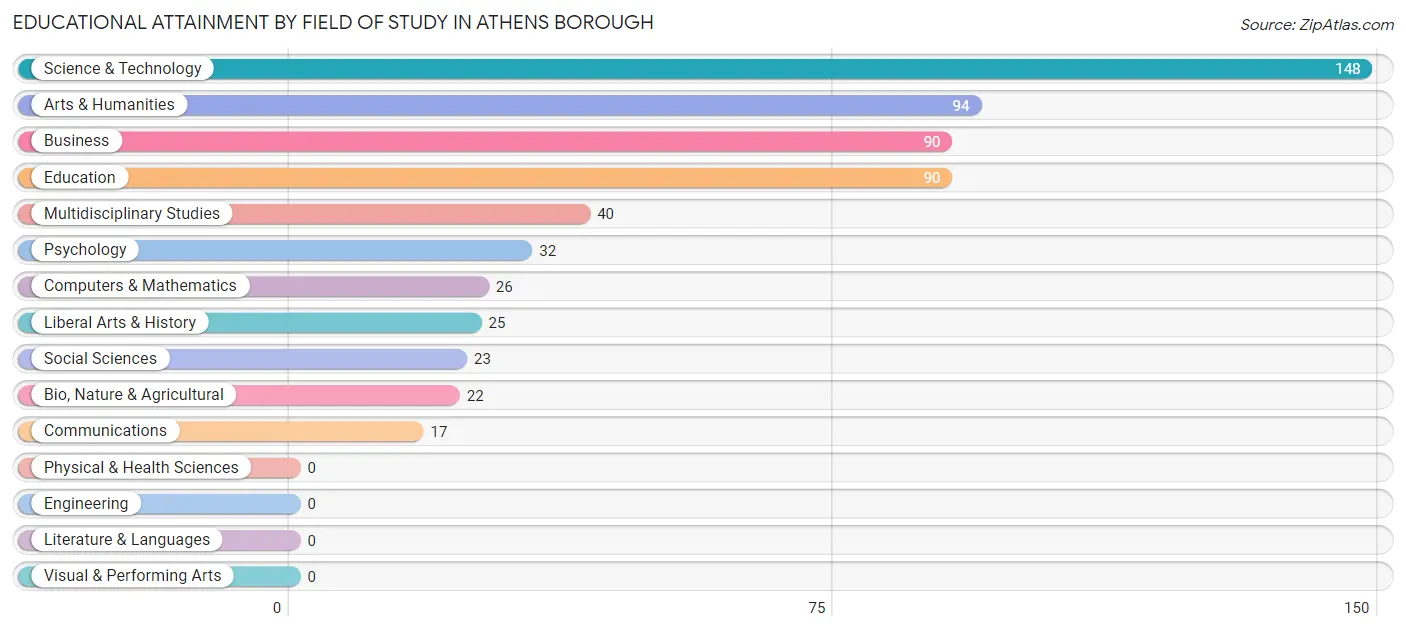
| Field of Study | # Graduates | % Graduates |
| Computers & Mathematics | 26 | 4.3% |
| Bio, Nature & Agricultural | 22 | 3.6% |
| Physical & Health Sciences | 0 | 0.0% |
| Psychology | 32 | 5.3% |
| Social Sciences | 23 | 3.8% |
| Engineering | 0 | 0.0% |
| Multidisciplinary Studies | 40 | 6.6% |
| Science & Technology | 148 | 24.4% |
| Business | 90 | 14.8% |
| Education | 90 | 14.8% |
| Literature & Languages | 0 | 0.0% |
| Liberal Arts & History | 25 | 4.1% |
| Visual & Performing Arts | 0 | 0.0% |
| Communications | 17 | 2.8% |
| Arts & Humanities | 94 | 15.5% |
| Total | 607 | 100.0% |
Transportation & Commute in Athens borough
Vehicle Availability by Sex in Athens borough
The most prevalent vehicle ownership categories in Athens borough are males with 1 vehicle (396, accounting for 42.3%) and females with 1 vehicle (175, making up 69.8%).
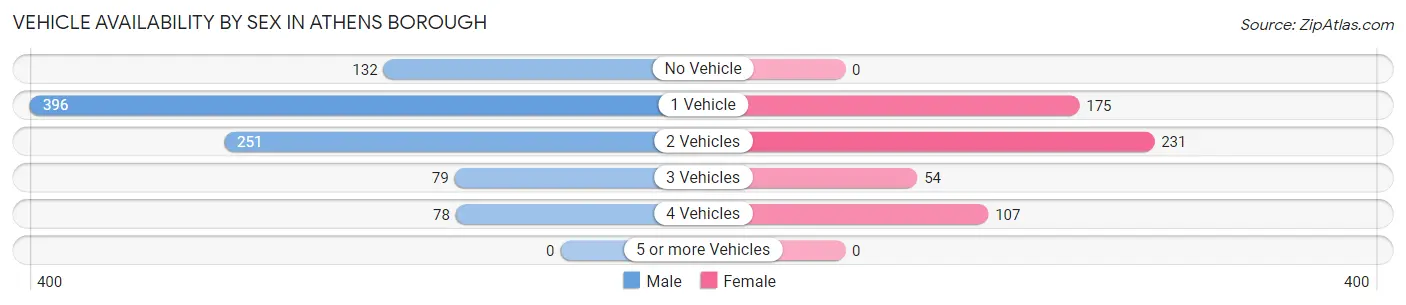
| Vehicles Available | Male | Female |
| No Vehicle | 132 (14.1%) | 0 (0.0%) |
| 1 Vehicle | 396 (42.3%) | 175 (30.9%) |
| 2 Vehicles | 251 (26.8%) | 231 (40.7%) |
| 3 Vehicles | 79 (8.4%) | 54 (9.5%) |
| 4 Vehicles | 78 (8.3%) | 107 (18.9%) |
| 5 or more Vehicles | 0 (0.0%) | 0 (0.0%) |
| Total | 936 (100.0%) | 567 (100.0%) |
Commute Time in Athens borough
The most frequently occuring commute durations in Athens borough are 5 to 9 minutes (475 commuters, 32.8%), 10 to 14 minutes (216 commuters, 14.9%), and 20 to 24 minutes (203 commuters, 14.0%).
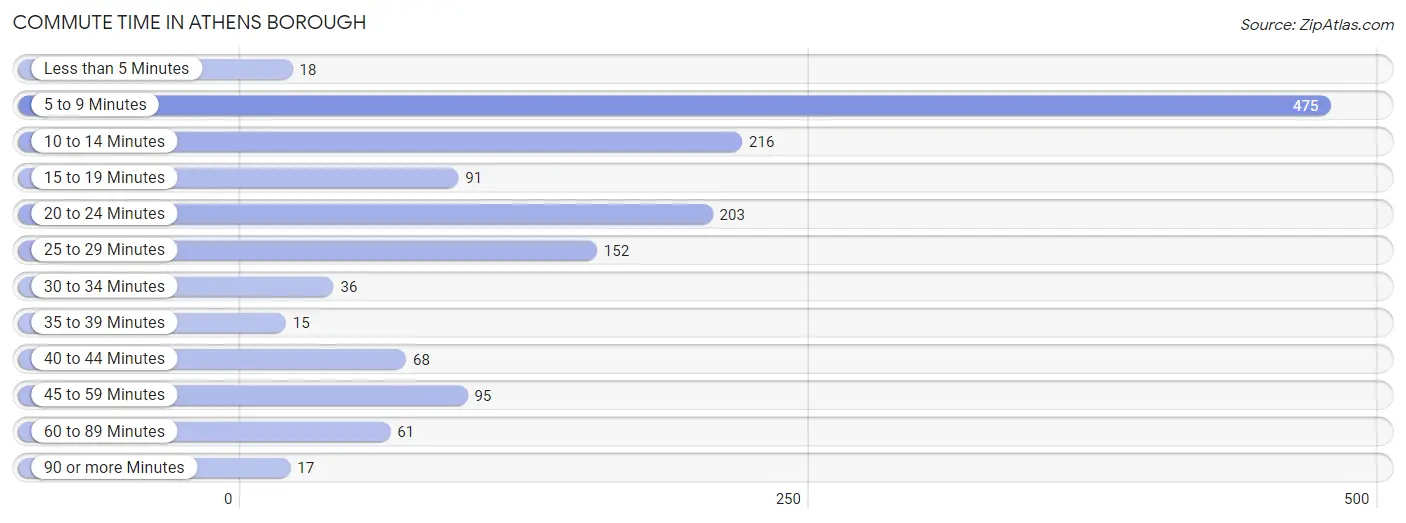
| Commute Time | # Commuters | % Commuters |
| Less than 5 Minutes | 18 | 1.2% |
| 5 to 9 Minutes | 475 | 32.8% |
| 10 to 14 Minutes | 216 | 14.9% |
| 15 to 19 Minutes | 91 | 6.3% |
| 20 to 24 Minutes | 203 | 14.0% |
| 25 to 29 Minutes | 152 | 10.5% |
| 30 to 34 Minutes | 36 | 2.5% |
| 35 to 39 Minutes | 15 | 1.0% |
| 40 to 44 Minutes | 68 | 4.7% |
| 45 to 59 Minutes | 95 | 6.6% |
| 60 to 89 Minutes | 61 | 4.2% |
| 90 or more Minutes | 17 | 1.2% |
Commute Time by Sex in Athens borough
The most common commute times in Athens borough are 5 to 9 minutes (340 commuters, 36.6%) for males and 10 to 14 minutes (165 commuters, 31.8%) for females.
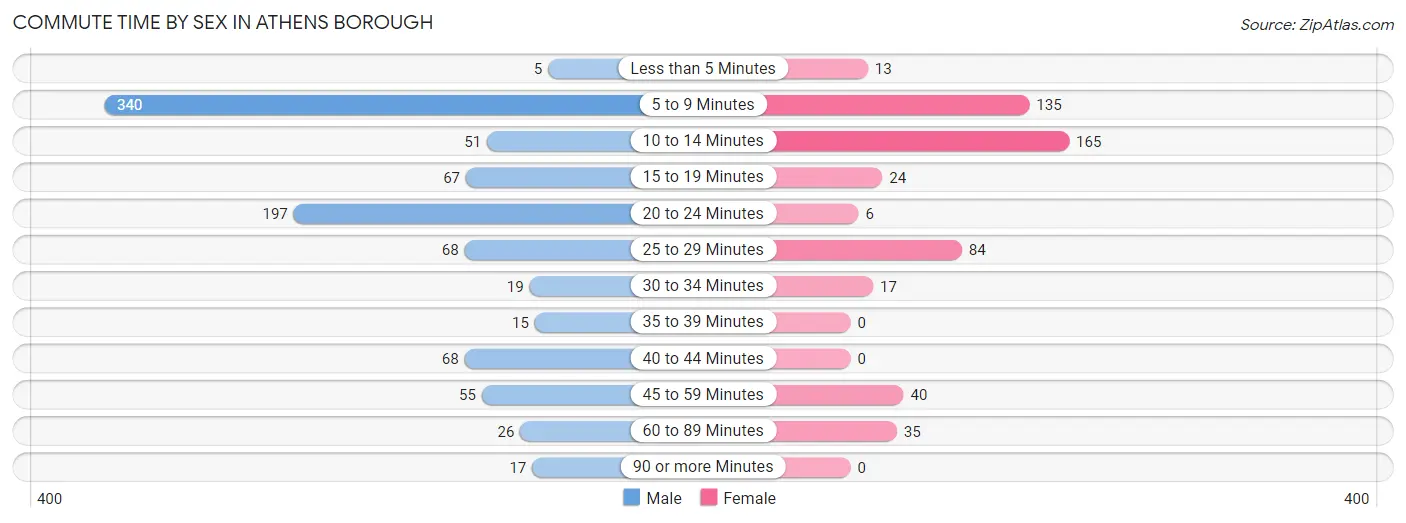
| Commute Time | Male | Female |
| Less than 5 Minutes | 5 (0.5%) | 13 (2.5%) |
| 5 to 9 Minutes | 340 (36.6%) | 135 (26.0%) |
| 10 to 14 Minutes | 51 (5.5%) | 165 (31.8%) |
| 15 to 19 Minutes | 67 (7.2%) | 24 (4.6%) |
| 20 to 24 Minutes | 197 (21.2%) | 6 (1.2%) |
| 25 to 29 Minutes | 68 (7.3%) | 84 (16.2%) |
| 30 to 34 Minutes | 19 (2.1%) | 17 (3.3%) |
| 35 to 39 Minutes | 15 (1.6%) | 0 (0.0%) |
| 40 to 44 Minutes | 68 (7.3%) | 0 (0.0%) |
| 45 to 59 Minutes | 55 (5.9%) | 40 (7.7%) |
| 60 to 89 Minutes | 26 (2.8%) | 35 (6.7%) |
| 90 or more Minutes | 17 (1.8%) | 0 (0.0%) |
Time of Departure to Work by Sex in Athens borough
The most frequent times of departure to work in Athens borough are 7:00 AM to 7:29 AM (240, 25.9%) for males and 8:30 AM to 8:59 AM (83, 16.0%) for females.
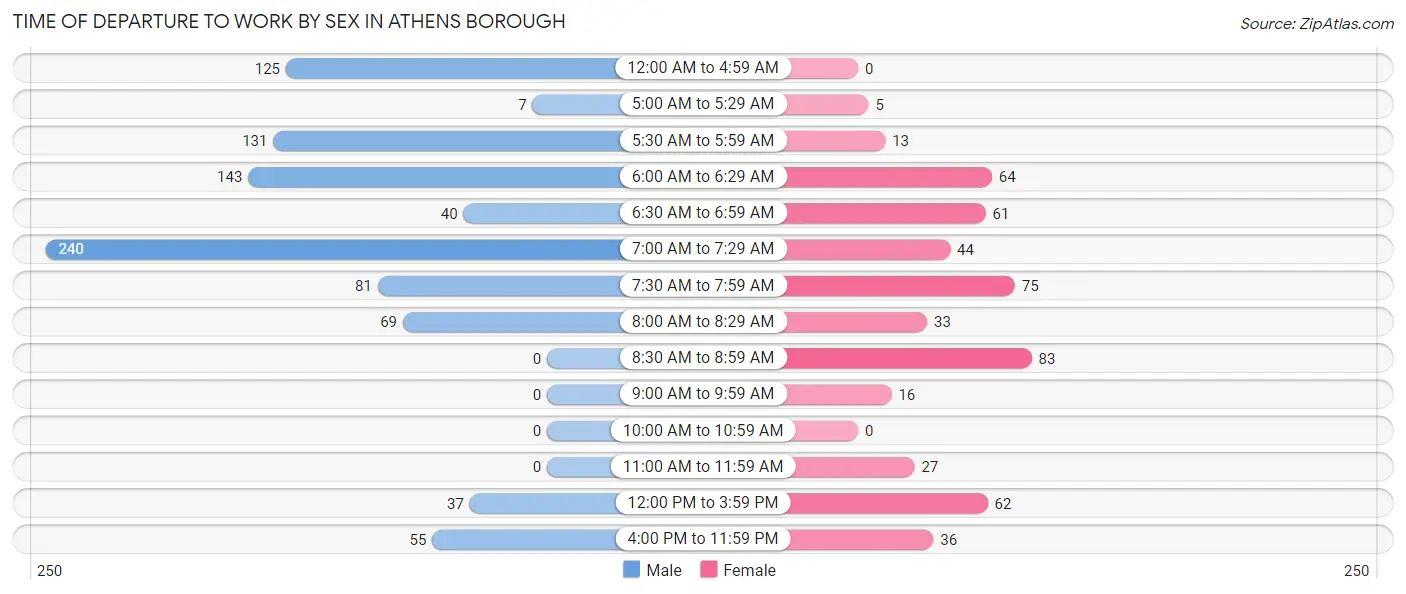
| Time of Departure | Male | Female |
| 12:00 AM to 4:59 AM | 125 (13.5%) | 0 (0.0%) |
| 5:00 AM to 5:29 AM | 7 (0.7%) | 5 (1.0%) |
| 5:30 AM to 5:59 AM | 131 (14.1%) | 13 (2.5%) |
| 6:00 AM to 6:29 AM | 143 (15.4%) | 64 (12.3%) |
| 6:30 AM to 6:59 AM | 40 (4.3%) | 61 (11.7%) |
| 7:00 AM to 7:29 AM | 240 (25.9%) | 44 (8.5%) |
| 7:30 AM to 7:59 AM | 81 (8.7%) | 75 (14.4%) |
| 8:00 AM to 8:29 AM | 69 (7.4%) | 33 (6.4%) |
| 8:30 AM to 8:59 AM | 0 (0.0%) | 83 (16.0%) |
| 9:00 AM to 9:59 AM | 0 (0.0%) | 16 (3.1%) |
| 10:00 AM to 10:59 AM | 0 (0.0%) | 0 (0.0%) |
| 11:00 AM to 11:59 AM | 0 (0.0%) | 27 (5.2%) |
| 12:00 PM to 3:59 PM | 37 (4.0%) | 62 (11.9%) |
| 4:00 PM to 11:59 PM | 55 (5.9%) | 36 (6.9%) |
| Total | 928 (100.0%) | 519 (100.0%) |
Housing Occupancy in Athens borough
Occupancy by Ownership in Athens borough
Of the total 1,777 dwellings in Athens borough, owner-occupied units account for 762 (42.9%), while renter-occupied units make up 1,015 (57.1%).
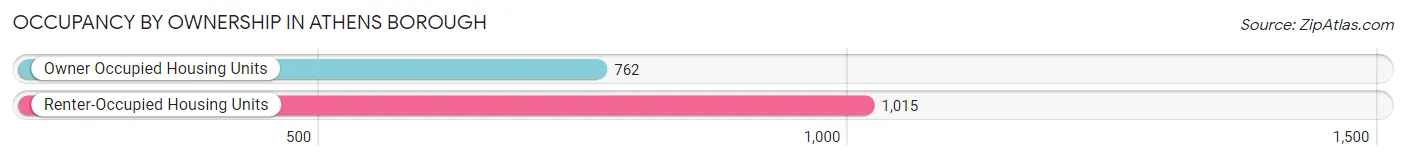
| Occupancy | # Housing Units | % Housing Units |
| Owner Occupied Housing Units | 762 | 42.9% |
| Renter-Occupied Housing Units | 1,015 | 57.1% |
| Total Occupied Housing Units | 1,777 | 100.0% |
Occupancy by Household Size in Athens borough
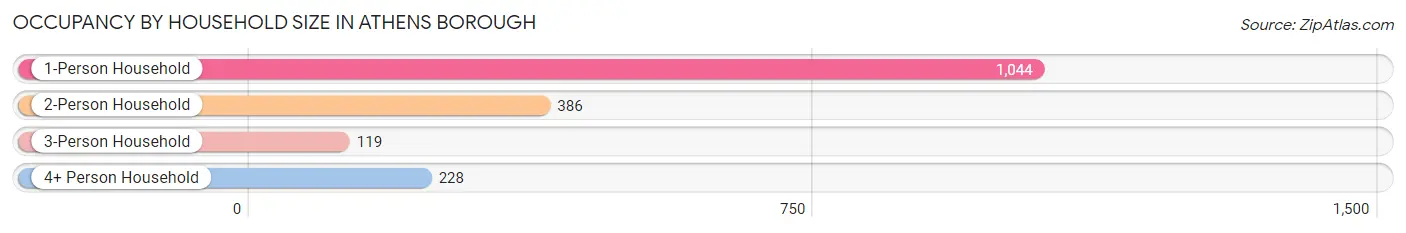
| Household Size | # Housing Units | % Housing Units |
| 1-Person Household | 1,044 | 58.8% |
| 2-Person Household | 386 | 21.7% |
| 3-Person Household | 119 | 6.7% |
| 4+ Person Household | 228 | 12.8% |
| Total Housing Units | 1,777 | 100.0% |
Occupancy by Ownership by Household Size in Athens borough
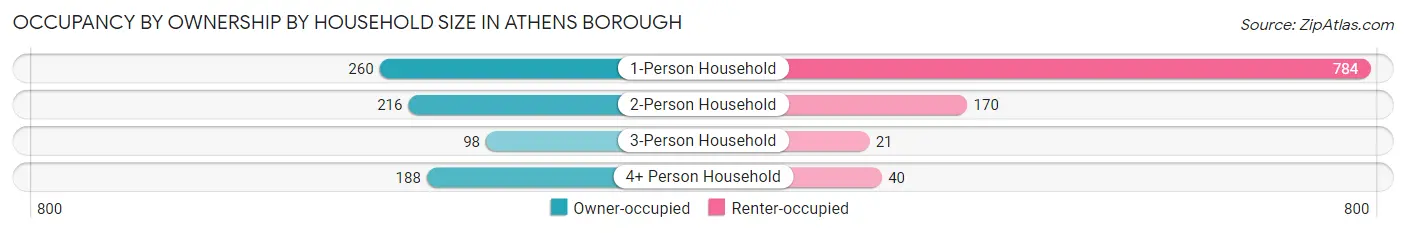
| Household Size | Owner-occupied | Renter-occupied |
| 1-Person Household | 260 (24.9%) | 784 (75.1%) |
| 2-Person Household | 216 (56.0%) | 170 (44.0%) |
| 3-Person Household | 98 (82.4%) | 21 (17.6%) |
| 4+ Person Household | 188 (82.5%) | 40 (17.5%) |
| Total Housing Units | 762 (42.9%) | 1,015 (57.1%) |
Occupancy by Educational Attainment in Athens borough
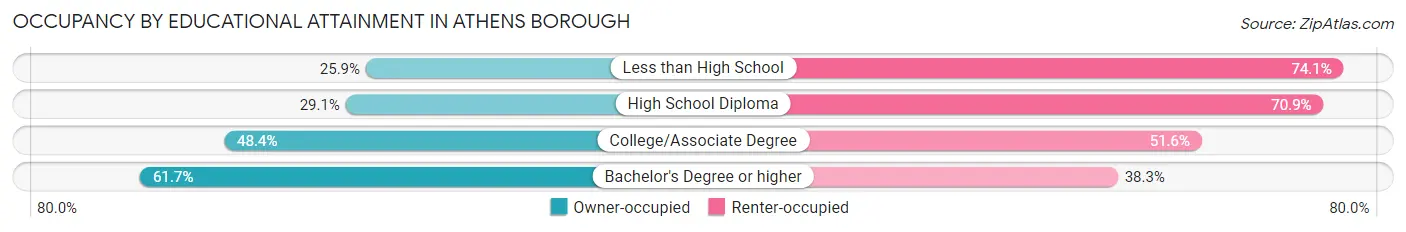
| Household Size | Owner-occupied | Renter-occupied |
| Less than High School | 37 (25.9%) | 106 (74.1%) |
| High School Diploma | 198 (29.1%) | 483 (70.9%) |
| College/Associate Degree | 221 (48.4%) | 236 (51.6%) |
| Bachelor's Degree or higher | 306 (61.7%) | 190 (38.3%) |
Occupancy by Age of Householder in Athens borough
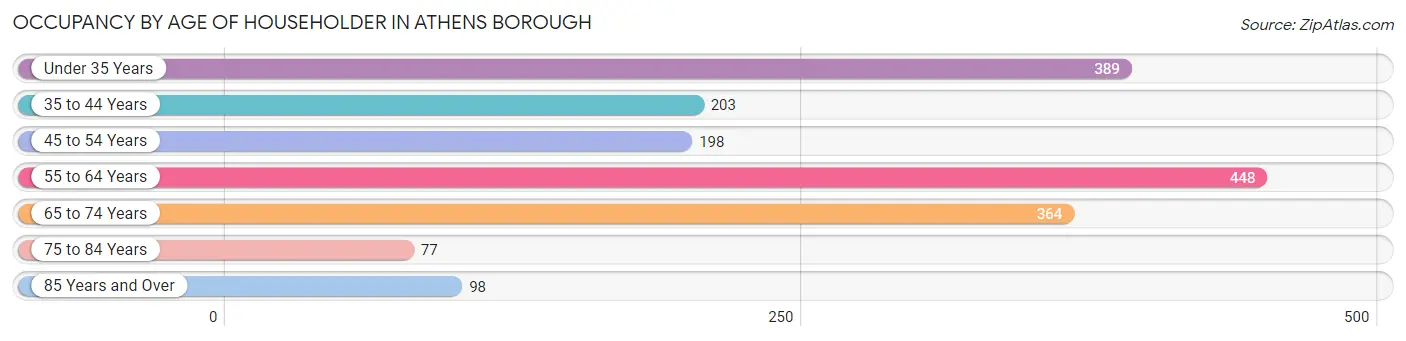
| Age Bracket | # Households | % Households |
| Under 35 Years | 389 | 21.9% |
| 35 to 44 Years | 203 | 11.4% |
| 45 to 54 Years | 198 | 11.1% |
| 55 to 64 Years | 448 | 25.2% |
| 65 to 74 Years | 364 | 20.5% |
| 75 to 84 Years | 77 | 4.3% |
| 85 Years and Over | 98 | 5.5% |
| Total | 1,777 | 100.0% |
Housing Finances in Athens borough
Median Income by Occupancy in Athens borough
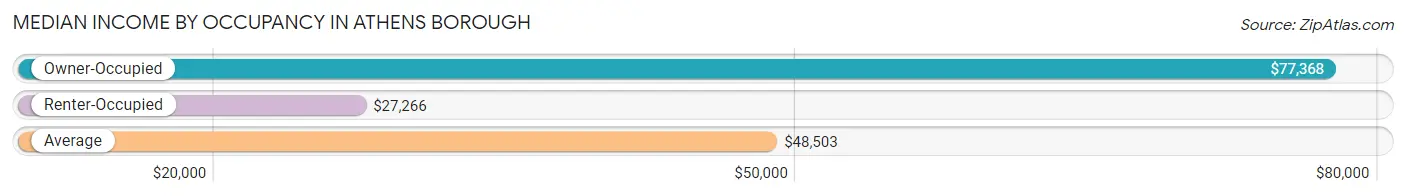
| Occupancy Type | # Households | Median Income |
| Owner-Occupied | 762 (42.9%) | $77,368 |
| Renter-Occupied | 1,015 (57.1%) | $27,266 |
| Average | 1,777 (100.0%) | $48,503 |
Occupancy by Householder Income Bracket in Athens borough
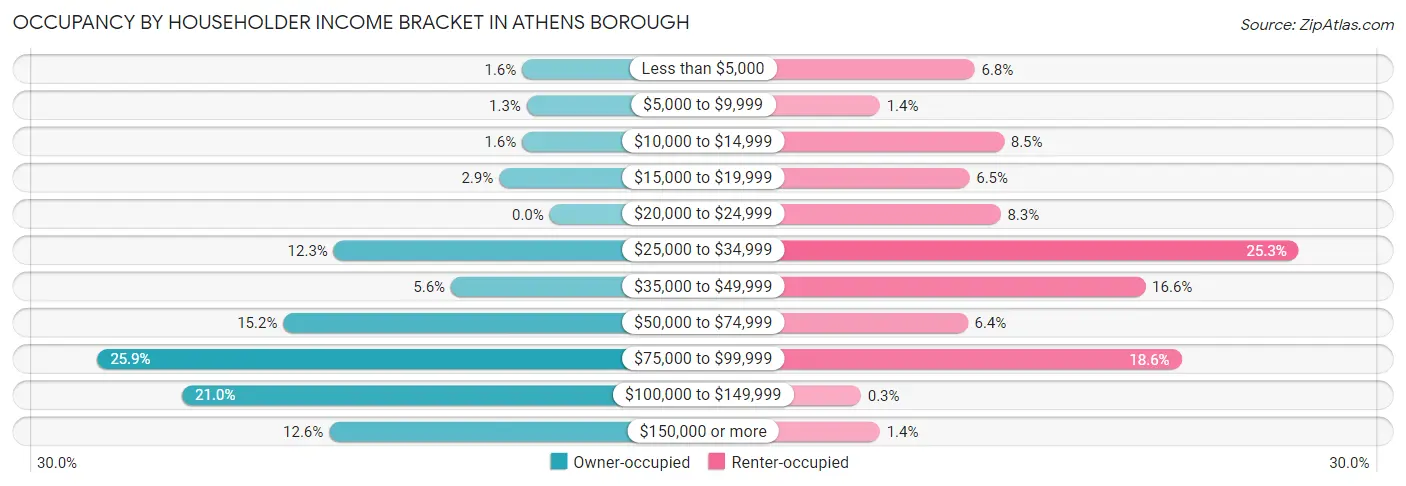
| Income Bracket | Owner-occupied | Renter-occupied |
| Less than $5,000 | 12 (1.6%) | 69 (6.8%) |
| $5,000 to $9,999 | 10 (1.3%) | 14 (1.4%) |
| $10,000 to $14,999 | 12 (1.6%) | 86 (8.5%) |
| $15,000 to $19,999 | 22 (2.9%) | 66 (6.5%) |
| $20,000 to $24,999 | 0 (0.0%) | 84 (8.3%) |
| $25,000 to $34,999 | 94 (12.3%) | 257 (25.3%) |
| $35,000 to $49,999 | 43 (5.6%) | 168 (16.6%) |
| $50,000 to $74,999 | 116 (15.2%) | 65 (6.4%) |
| $75,000 to $99,999 | 197 (25.9%) | 189 (18.6%) |
| $100,000 to $149,999 | 160 (21.0%) | 3 (0.3%) |
| $150,000 or more | 96 (12.6%) | 14 (1.4%) |
| Total | 762 (100.0%) | 1,015 (100.0%) |
Monthly Housing Cost Tiers in Athens borough
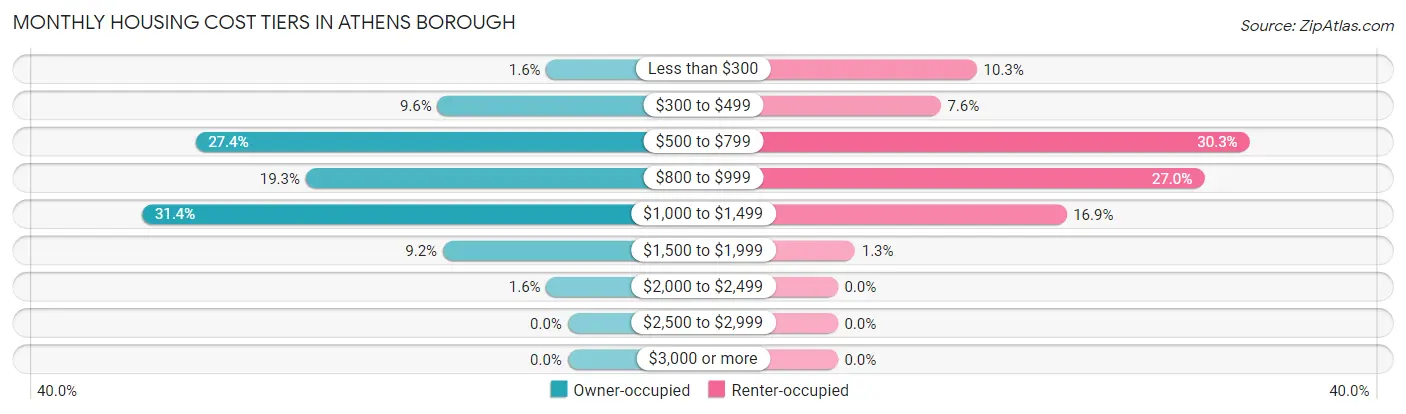
| Monthly Cost | Owner-occupied | Renter-occupied |
| Less than $300 | 12 (1.6%) | 104 (10.2%) |
| $300 to $499 | 73 (9.6%) | 77 (7.6%) |
| $500 to $799 | 209 (27.4%) | 308 (30.3%) |
| $800 to $999 | 147 (19.3%) | 274 (27.0%) |
| $1,000 to $1,499 | 239 (31.4%) | 171 (16.9%) |
| $1,500 to $1,999 | 70 (9.2%) | 13 (1.3%) |
| $2,000 to $2,499 | 12 (1.6%) | 0 (0.0%) |
| $2,500 to $2,999 | 0 (0.0%) | 0 (0.0%) |
| $3,000 or more | 0 (0.0%) | 0 (0.0%) |
| Total | 762 (100.0%) | 1,015 (100.0%) |
Physical Housing Characteristics in Athens borough
Housing Structures in Athens borough
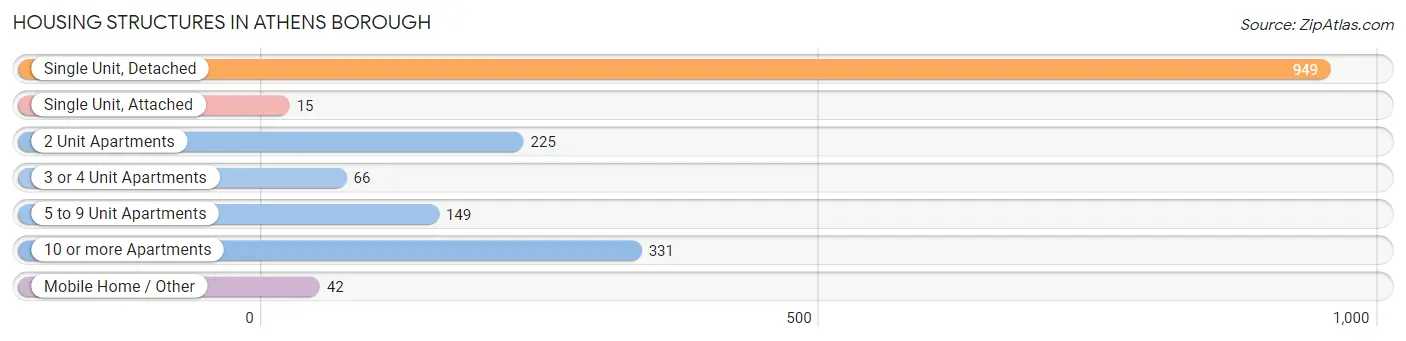
| Structure Type | # Housing Units | % Housing Units |
| Single Unit, Detached | 949 | 53.4% |
| Single Unit, Attached | 15 | 0.8% |
| 2 Unit Apartments | 225 | 12.7% |
| 3 or 4 Unit Apartments | 66 | 3.7% |
| 5 to 9 Unit Apartments | 149 | 8.4% |
| 10 or more Apartments | 331 | 18.6% |
| Mobile Home / Other | 42 | 2.4% |
| Total | 1,777 | 100.0% |
Housing Structures by Occupancy in Athens borough
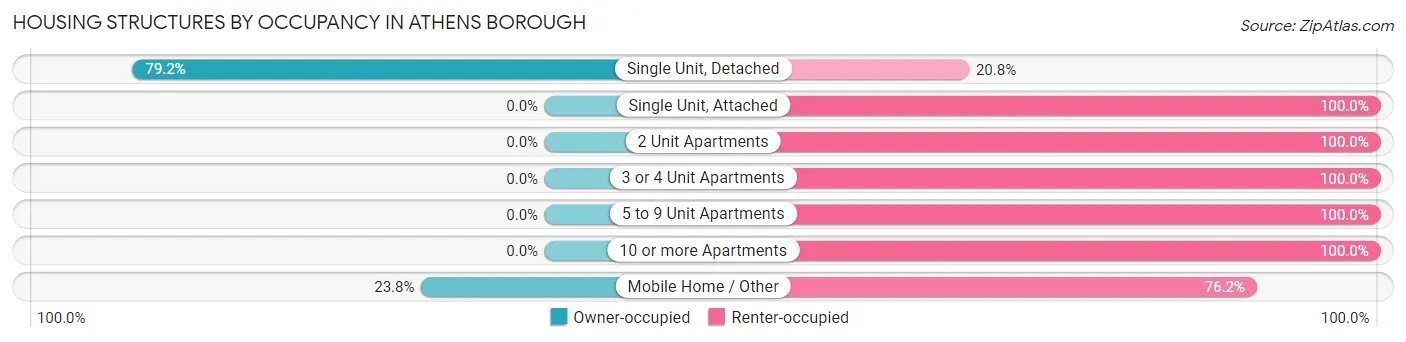
| Structure Type | Owner-occupied | Renter-occupied |
| Single Unit, Detached | 752 (79.2%) | 197 (20.8%) |
| Single Unit, Attached | 0 (0.0%) | 15 (100.0%) |
| 2 Unit Apartments | 0 (0.0%) | 225 (100.0%) |
| 3 or 4 Unit Apartments | 0 (0.0%) | 66 (100.0%) |
| 5 to 9 Unit Apartments | 0 (0.0%) | 149 (100.0%) |
| 10 or more Apartments | 0 (0.0%) | 331 (100.0%) |
| Mobile Home / Other | 10 (23.8%) | 32 (76.2%) |
| Total | 762 (42.9%) | 1,015 (57.1%) |
Housing Structures by Number of Rooms in Athens borough
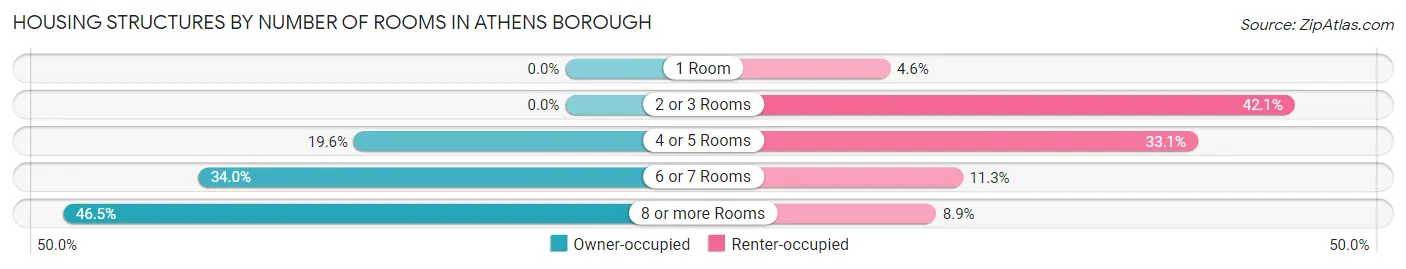
| Number of Rooms | Owner-occupied | Renter-occupied |
| 1 Room | 0 (0.0%) | 47 (4.6%) |
| 2 or 3 Rooms | 0 (0.0%) | 427 (42.1%) |
| 4 or 5 Rooms | 149 (19.6%) | 336 (33.1%) |
| 6 or 7 Rooms | 259 (34.0%) | 115 (11.3%) |
| 8 or more Rooms | 354 (46.5%) | 90 (8.9%) |
| Total | 762 (100.0%) | 1,015 (100.0%) |
Housing Structure by Heating Type in Athens borough
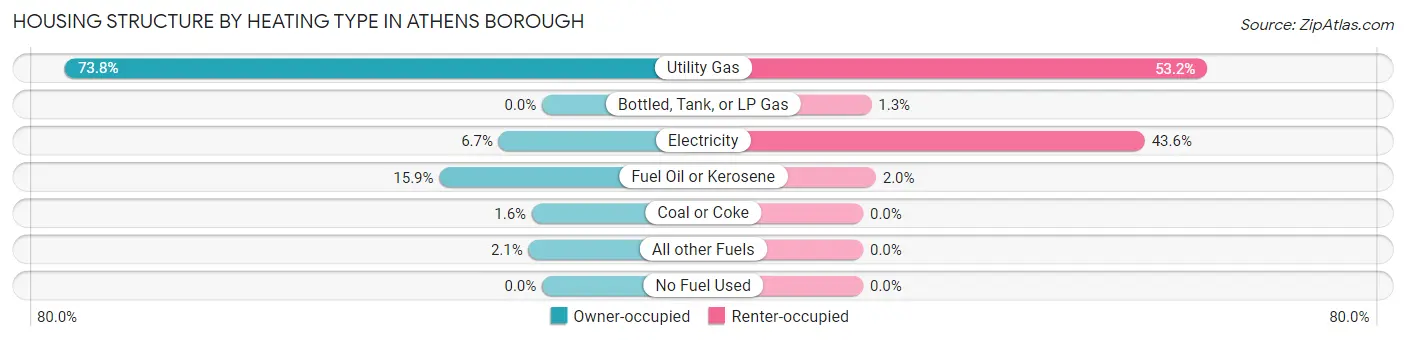
| Heating Type | Owner-occupied | Renter-occupied |
| Utility Gas | 562 (73.8%) | 540 (53.2%) |
| Bottled, Tank, or LP Gas | 0 (0.0%) | 13 (1.3%) |
| Electricity | 51 (6.7%) | 442 (43.5%) |
| Fuel Oil or Kerosene | 121 (15.9%) | 20 (2.0%) |
| Coal or Coke | 12 (1.6%) | 0 (0.0%) |
| All other Fuels | 16 (2.1%) | 0 (0.0%) |
| No Fuel Used | 0 (0.0%) | 0 (0.0%) |
| Total | 762 (100.0%) | 1,015 (100.0%) |
Household Vehicle Usage in Athens borough
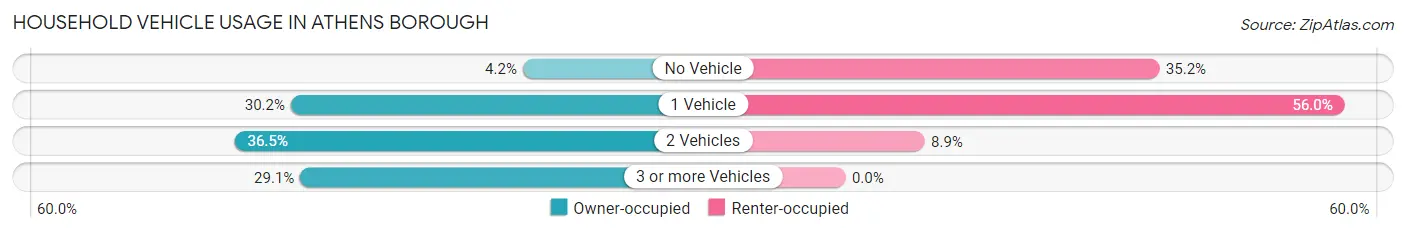
| Vehicles per Household | Owner-occupied | Renter-occupied |
| No Vehicle | 32 (4.2%) | 357 (35.2%) |
| 1 Vehicle | 230 (30.2%) | 568 (56.0%) |
| 2 Vehicles | 278 (36.5%) | 90 (8.9%) |
| 3 or more Vehicles | 222 (29.1%) | 0 (0.0%) |
| Total | 762 (100.0%) | 1,015 (100.0%) |
Real Estate & Mortgages in Athens borough
Real Estate and Mortgage Overview in Athens borough
| Characteristic | Without Mortgage | With Mortgage |
| Housing Units | 352 | 410 |
| Median Property Value | $153,100 | $142,200 |
| Median Household Income | $70,455 | $34 |
| Monthly Housing Costs | $651 | $0 |
| Real Estate Taxes | $3,267 | $0 |
Property Value by Mortgage Status in Athens borough
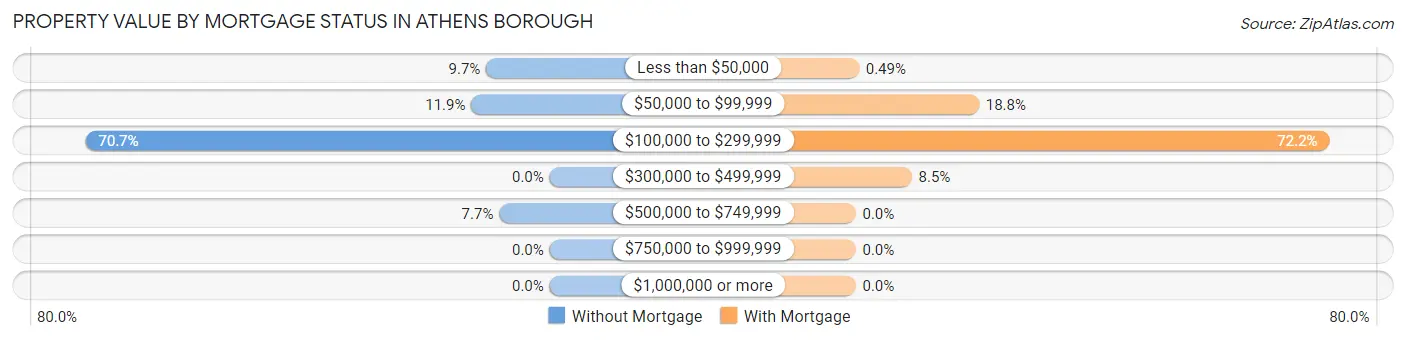
| Property Value | Without Mortgage | With Mortgage |
| Less than $50,000 | 34 (9.7%) | 2 (0.5%) |
| $50,000 to $99,999 | 42 (11.9%) | 77 (18.8%) |
| $100,000 to $299,999 | 249 (70.7%) | 296 (72.2%) |
| $300,000 to $499,999 | 0 (0.0%) | 35 (8.5%) |
| $500,000 to $749,999 | 27 (7.7%) | 0 (0.0%) |
| $750,000 to $999,999 | 0 (0.0%) | 0 (0.0%) |
| $1,000,000 or more | 0 (0.0%) | 0 (0.0%) |
| Total | 352 (100.0%) | 410 (100.0%) |
Household Income by Mortgage Status in Athens borough
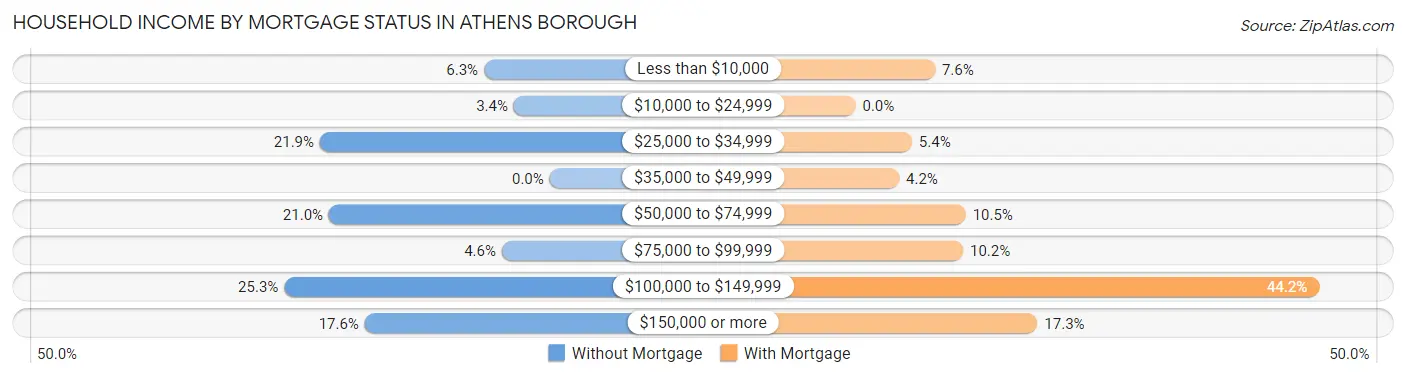
| Household Income | Without Mortgage | With Mortgage |
| Less than $10,000 | 22 (6.2%) | 31 (7.6%) |
| $10,000 to $24,999 | 12 (3.4%) | 0 (0.0%) |
| $25,000 to $34,999 | 77 (21.9%) | 22 (5.4%) |
| $35,000 to $49,999 | 0 (0.0%) | 17 (4.2%) |
| $50,000 to $74,999 | 74 (21.0%) | 43 (10.5%) |
| $75,000 to $99,999 | 16 (4.5%) | 42 (10.2%) |
| $100,000 to $149,999 | 89 (25.3%) | 181 (44.2%) |
| $150,000 or more | 62 (17.6%) | 71 (17.3%) |
| Total | 352 (100.0%) | 410 (100.0%) |
Property Value to Household Income Ratio in Athens borough
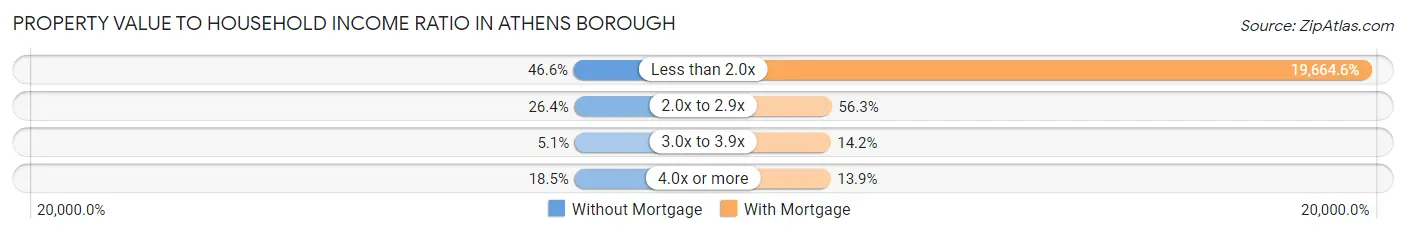
| Value-to-Income Ratio | Without Mortgage | With Mortgage |
| Less than 2.0x | 164 (46.6%) | 80,625 (19,664.6%) |
| 2.0x to 2.9x | 93 (26.4%) | 231 (56.3%) |
| 3.0x to 3.9x | 18 (5.1%) | 58 (14.1%) |
| 4.0x or more | 65 (18.5%) | 57 (13.9%) |
| Total | 352 (100.0%) | 410 (100.0%) |
Real Estate Taxes by Mortgage Status in Athens borough
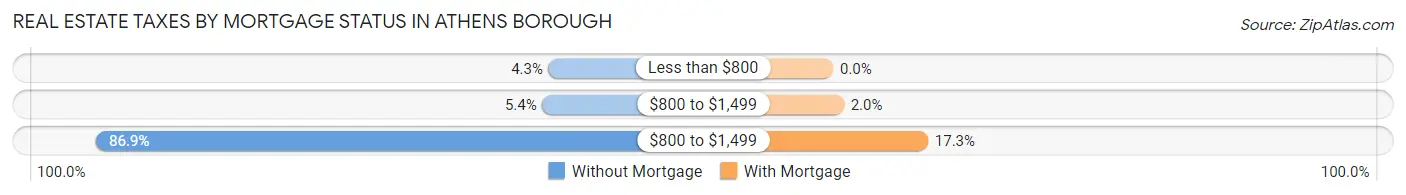
| Property Taxes | Without Mortgage | With Mortgage |
| Less than $800 | 15 (4.3%) | 0 (0.0%) |
| $800 to $1,499 | 19 (5.4%) | 8 (1.9%) |
| $800 to $1,499 | 306 (86.9%) | 71 (17.3%) |
| Total | 352 (100.0%) | 410 (100.0%) |
Health & Disability in Athens borough
Health Insurance Coverage by Age in Athens borough
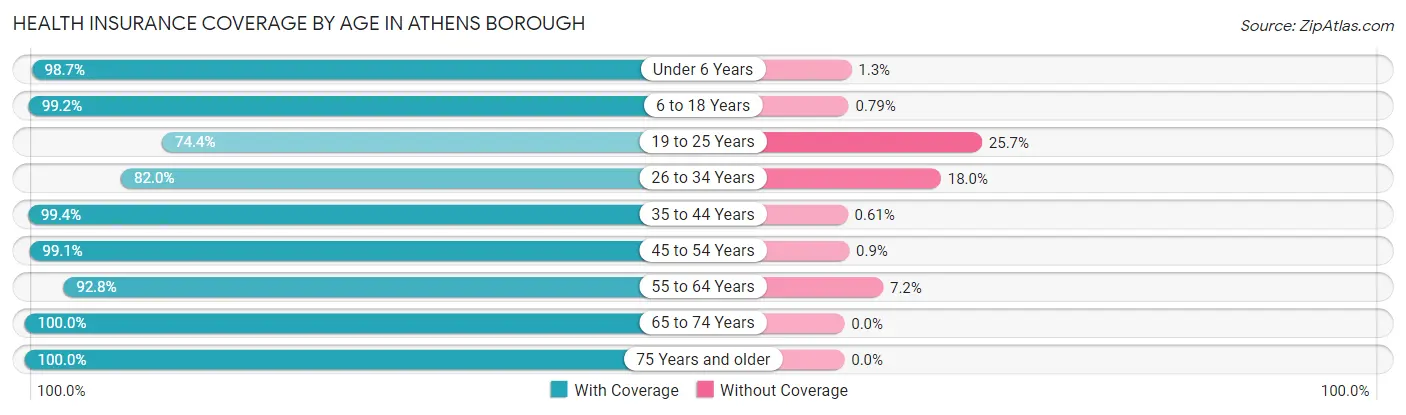
| Age Bracket | With Coverage | Without Coverage |
| Under 6 Years | 151 (98.7%) | 2 (1.3%) |
| 6 to 18 Years | 501 (99.2%) | 4 (0.8%) |
| 19 to 25 Years | 171 (74.4%) | 59 (25.7%) |
| 26 to 34 Years | 269 (82.0%) | 59 (18.0%) |
| 35 to 44 Years | 325 (99.4%) | 2 (0.6%) |
| 45 to 54 Years | 331 (99.1%) | 3 (0.9%) |
| 55 to 64 Years | 591 (92.8%) | 46 (7.2%) |
| 65 to 74 Years | 518 (100.0%) | 0 (0.0%) |
| 75 Years and older | 182 (100.0%) | 0 (0.0%) |
| Total | 3,039 (94.6%) | 175 (5.4%) |
Health Insurance Coverage by Citizenship Status in Athens borough
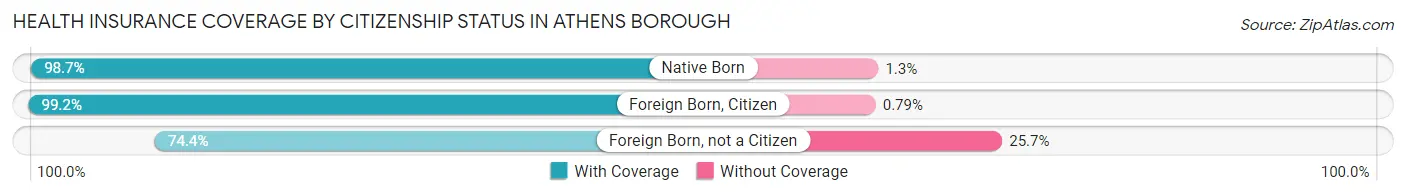
| Citizenship Status | With Coverage | Without Coverage |
| Native Born | 151 (98.7%) | 2 (1.3%) |
| Foreign Born, Citizen | 501 (99.2%) | 4 (0.8%) |
| Foreign Born, not a Citizen | 171 (74.4%) | 59 (25.7%) |
Health Insurance Coverage by Household Income in Athens borough
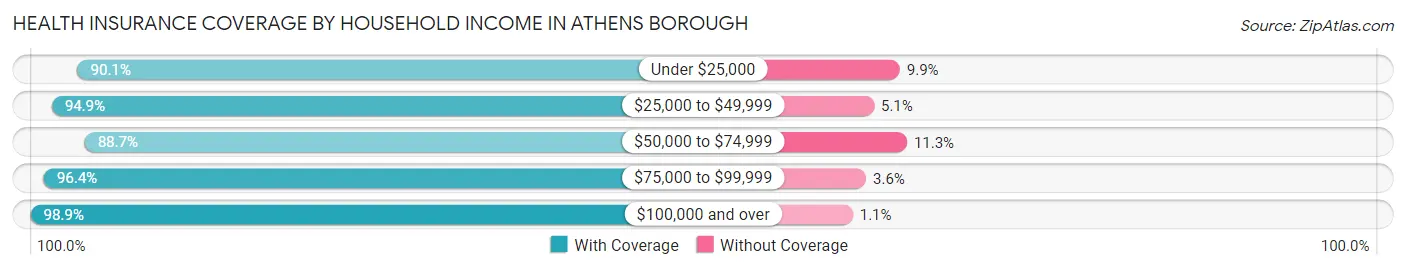
| Household Income | With Coverage | Without Coverage |
| Under $25,000 | 462 (90.1%) | 51 (9.9%) |
| $25,000 to $49,999 | 781 (94.9%) | 42 (5.1%) |
| $50,000 to $74,999 | 370 (88.7%) | 47 (11.3%) |
| $75,000 to $99,999 | 719 (96.4%) | 27 (3.6%) |
| $100,000 and over | 705 (98.9%) | 8 (1.1%) |
Public vs Private Health Insurance Coverage by Age in Athens borough
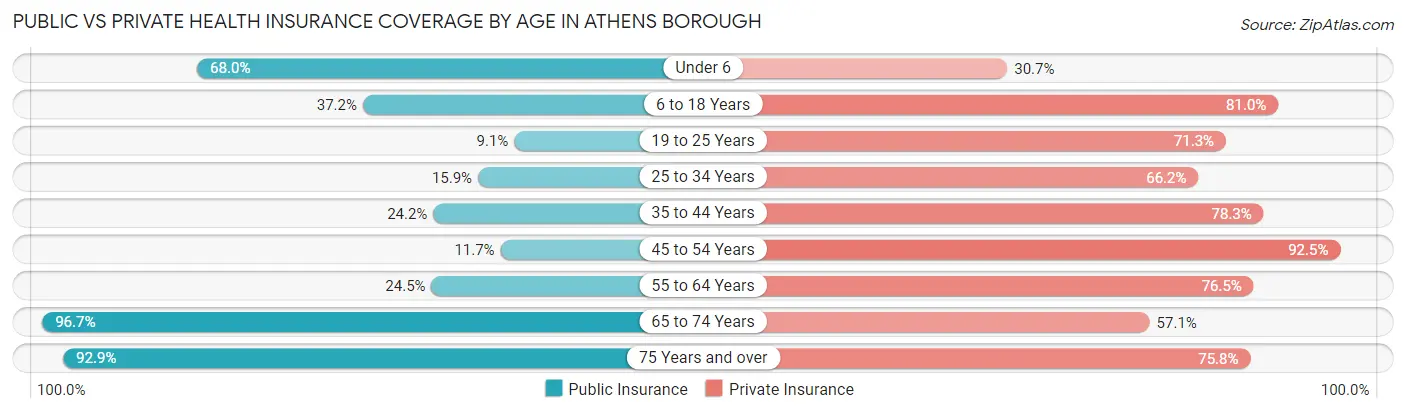
| Age Bracket | Public Insurance | Private Insurance |
| Under 6 | 104 (68.0%) | 47 (30.7%) |
| 6 to 18 Years | 188 (37.2%) | 409 (81.0%) |
| 19 to 25 Years | 21 (9.1%) | 164 (71.3%) |
| 25 to 34 Years | 52 (15.9%) | 217 (66.2%) |
| 35 to 44 Years | 79 (24.2%) | 256 (78.3%) |
| 45 to 54 Years | 39 (11.7%) | 309 (92.5%) |
| 55 to 64 Years | 156 (24.5%) | 487 (76.4%) |
| 65 to 74 Years | 501 (96.7%) | 296 (57.1%) |
| 75 Years and over | 169 (92.9%) | 138 (75.8%) |
| Total | 1,309 (40.7%) | 2,323 (72.3%) |
Disability Status by Sex by Age in Athens borough
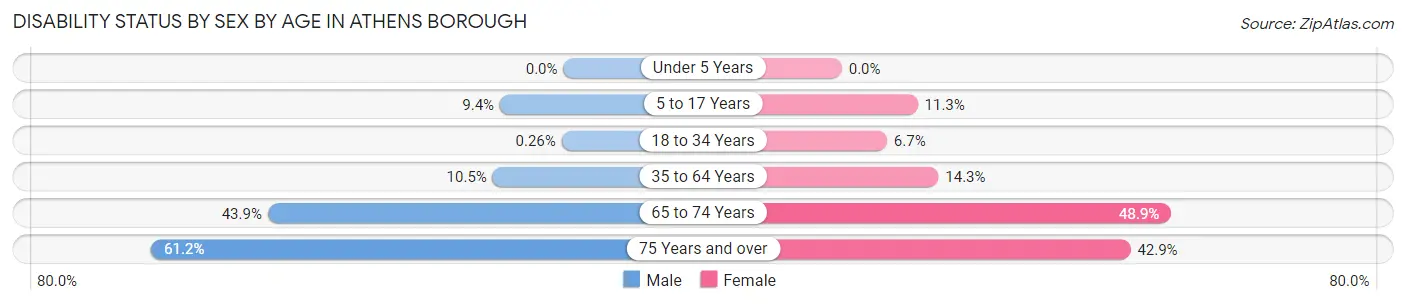
| Age Bracket | Male | Female |
| Under 5 Years | 0 (0.0%) | 0 (0.0%) |
| 5 to 17 Years | 26 (9.4%) | 26 (11.3%) |
| 18 to 34 Years | 1 (0.3%) | 14 (6.7%) |
| 35 to 64 Years | 77 (10.5%) | 81 (14.3%) |
| 65 to 74 Years | 108 (43.9%) | 133 (48.9%) |
| 75 Years and over | 60 (61.2%) | 36 (42.9%) |
Disability Class by Sex by Age in Athens borough
Disability Class: Hearing Difficulty
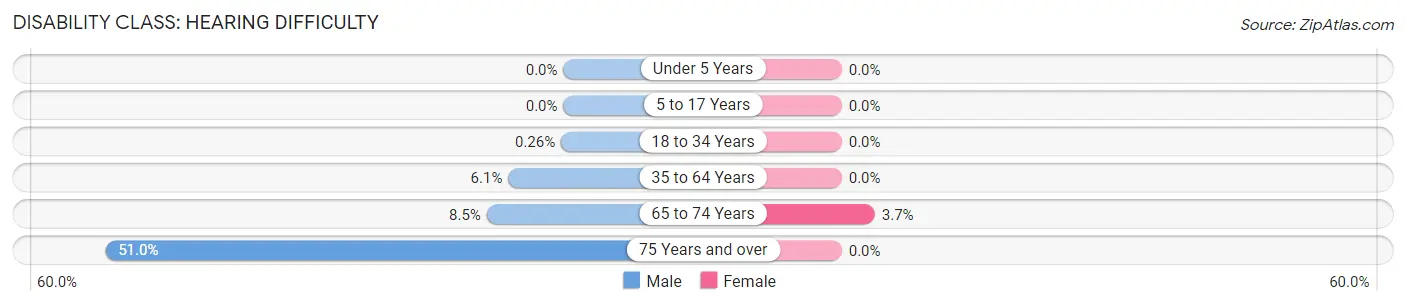
| Age Bracket | Male | Female |
| Under 5 Years | 0 (0.0%) | 0 (0.0%) |
| 5 to 17 Years | 0 (0.0%) | 0 (0.0%) |
| 18 to 34 Years | 1 (0.3%) | 0 (0.0%) |
| 35 to 64 Years | 45 (6.1%) | 0 (0.0%) |
| 65 to 74 Years | 21 (8.5%) | 10 (3.7%) |
| 75 Years and over | 50 (51.0%) | 0 (0.0%) |
Disability Class: Vision Difficulty
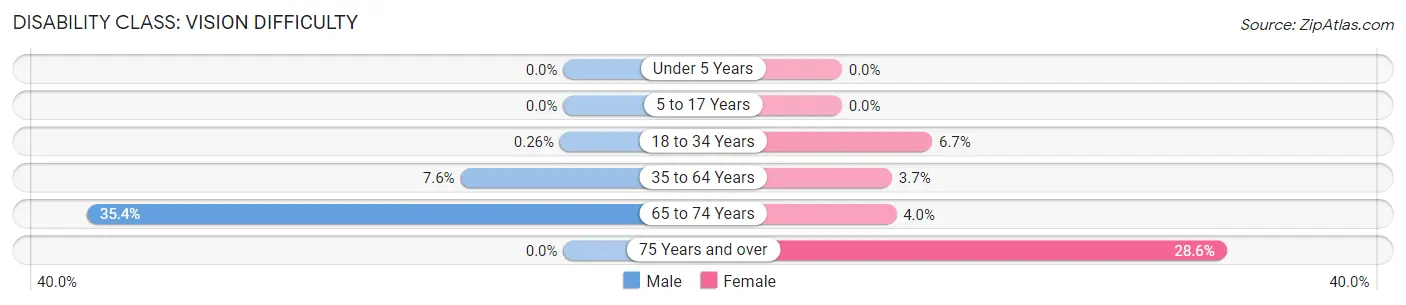
| Age Bracket | Male | Female |
| Under 5 Years | 0 (0.0%) | 0 (0.0%) |
| 5 to 17 Years | 0 (0.0%) | 0 (0.0%) |
| 18 to 34 Years | 1 (0.3%) | 14 (6.7%) |
| 35 to 64 Years | 56 (7.6%) | 21 (3.7%) |
| 65 to 74 Years | 87 (35.4%) | 11 (4.0%) |
| 75 Years and over | 0 (0.0%) | 24 (28.6%) |
Disability Class: Cognitive Difficulty
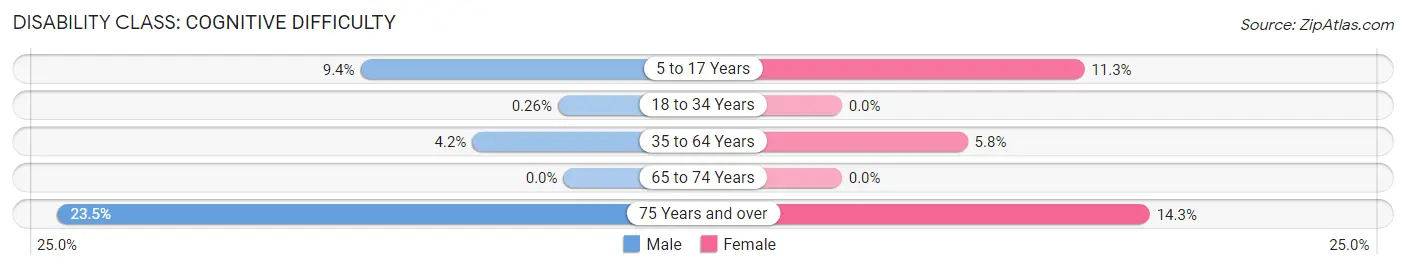
| Age Bracket | Male | Female |
| 5 to 17 Years | 26 (9.4%) | 26 (11.3%) |
| 18 to 34 Years | 1 (0.3%) | 0 (0.0%) |
| 35 to 64 Years | 31 (4.2%) | 33 (5.8%) |
| 65 to 74 Years | 0 (0.0%) | 0 (0.0%) |
| 75 Years and over | 23 (23.5%) | 12 (14.3%) |
Disability Class: Ambulatory Difficulty
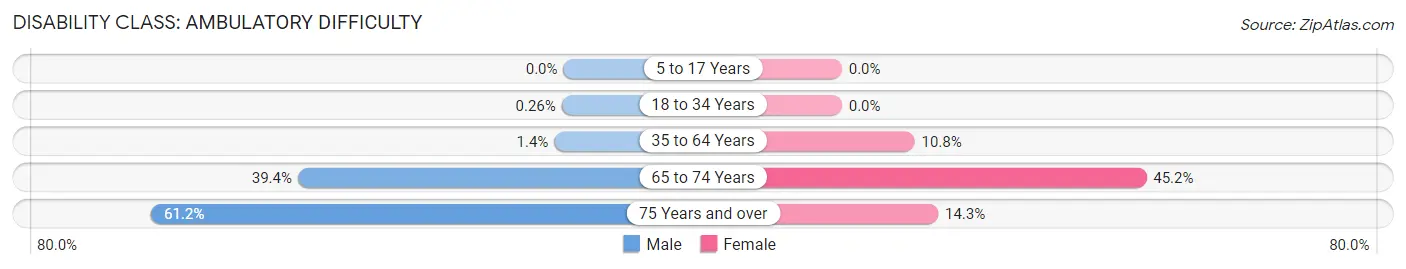
| Age Bracket | Male | Female |
| 5 to 17 Years | 0 (0.0%) | 0 (0.0%) |
| 18 to 34 Years | 1 (0.3%) | 0 (0.0%) |
| 35 to 64 Years | 10 (1.4%) | 61 (10.8%) |
| 65 to 74 Years | 97 (39.4%) | 123 (45.2%) |
| 75 Years and over | 60 (61.2%) | 12 (14.3%) |
Disability Class: Self-Care Difficulty
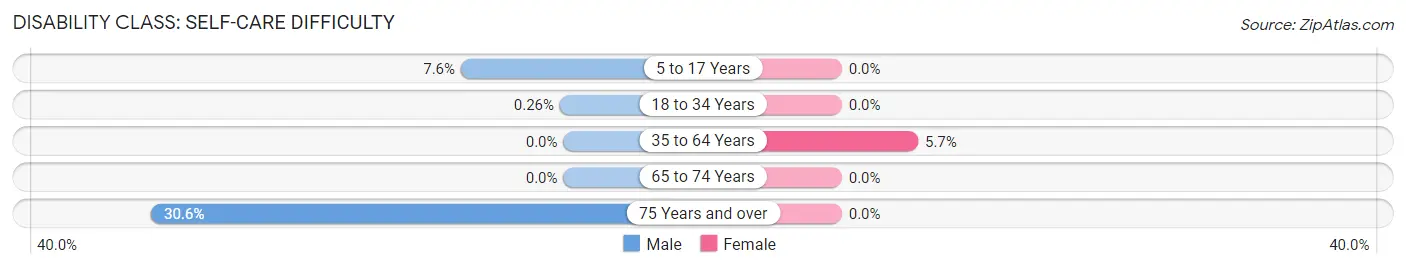
| Age Bracket | Male | Female |
| 5 to 17 Years | 21 (7.6%) | 0 (0.0%) |
| 18 to 34 Years | 1 (0.3%) | 0 (0.0%) |
| 35 to 64 Years | 0 (0.0%) | 32 (5.7%) |
| 65 to 74 Years | 0 (0.0%) | 0 (0.0%) |
| 75 Years and over | 30 (30.6%) | 0 (0.0%) |
Technology Access in Athens borough
Computing Device Access in Athens borough
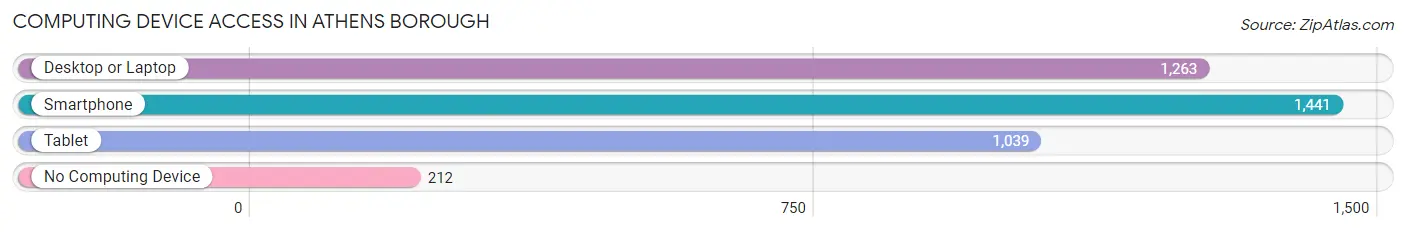
| Device Type | # Households | % Households |
| Desktop or Laptop | 1,263 | 71.1% |
| Smartphone | 1,441 | 81.1% |
| Tablet | 1,039 | 58.5% |
| No Computing Device | 212 | 11.9% |
| Total | 1,777 | 100.0% |
Internet Access in Athens borough
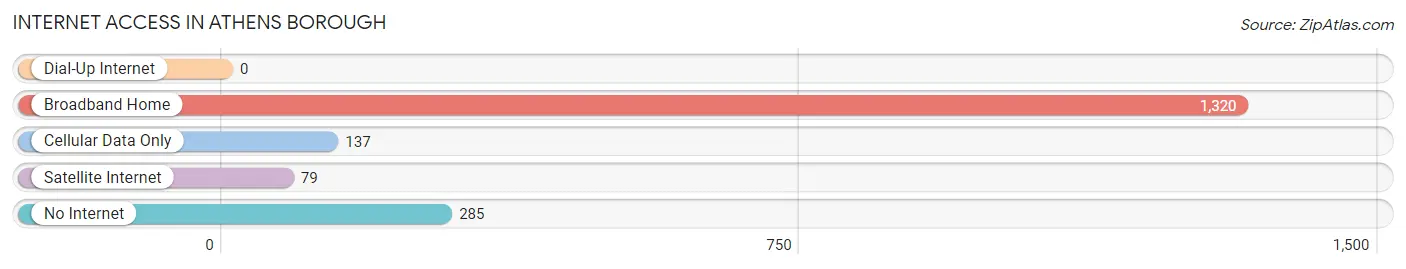
| Internet Type | # Households | % Households |
| Dial-Up Internet | 0 | 0.0% |
| Broadband Home | 1,320 | 74.3% |
| Cellular Data Only | 137 | 7.7% |
| Satellite Internet | 79 | 4.4% |
| No Internet | 285 | 16.0% |
| Total | 1,777 | 100.0% |
Athens borough Summary
Athens Borough is a small borough located in Bradford County, Pennsylvania. It is situated along the Susquehanna River, and is part of the Sayre, PA Micropolitan Statistical Area. The population of Athens Borough was 2,717 at the 2010 census.
History
Athens Borough was founded in 1815 by a group of settlers from Athens, New York. The settlers were attracted to the area by the abundance of natural resources, including timber and coal. The town was originally known as "Athensville," but the name was changed to "Athens Borough" in 1825.
Athens Borough was an important stop on the Erie Railroad, which ran through the town from 1851 to 1952. The railroad brought economic growth to the area, and the town became a center for manufacturing and industry. The town also became a popular tourist destination, with many visitors coming to enjoy the scenic views of the Susquehanna River.
Athens Borough was also home to a number of notable people, including the first female doctor in the United States, Elizabeth Blackwell, and the first African-American doctor in the United States, James McCune Smith.
Geography
Athens Borough is located at 41°56'N, 76°25'W (41.933, -76.417). It is situated along the Susquehanna River, and is part of the Sayre, PA Micropolitan Statistical Area.
The borough has a total area of 1.2 square miles, all of which is land. The terrain is mostly flat, with some rolling hills.
Economy
Athens Borough is a small, rural community with a population of just over 2,700 people. The economy is largely based on agriculture and tourism.
The town is home to several small businesses, including a grocery store, a hardware store, a pharmacy, and a few restaurants. There are also several small manufacturing companies in the area, including a furniture factory and a paper mill.
The town is also home to a number of tourist attractions, including the Athens Historical Society Museum, the Athens Railroad Station, and the Athens Community Park.
Demographics
Athens Borough has a population of 2,717 people, according to the 2010 census. The racial makeup of the borough is 97.3% White, 0.7% African American, 0.2% Native American, 0.3% Asian, 0.1% Pacific Islander, 0.3% from other races, and 1.2% from two or more races. Hispanic or Latino of any race were 1.2% of the population.
The median household income in Athens Borough is $37,917, and the median family income is $45,938. The per capita income is $19,945. About 11.3% of families and 14.2% of the population are below the poverty line.
Common Questions
What is Per Capita Income in Athens borough?
Per Capita income in Athens borough is $34,384.
What is the Median Family Income in Athens borough?
Median Family Income in Athens borough is $64,028.
What is the Median Household income in Athens borough?
Median Household Income in Athens borough is $48,503.
What is Income or Wage Gap in Athens borough?
Income or Wage Gap in Athens borough is 45.4%.
Women in Athens borough earn 54.6 cents for every dollar earned by a man.
What is Inequality or Gini Index in Athens borough?
Inequality or Gini Index in Athens borough is 0.43.
What is the Total Population of Athens borough?
Total Population of Athens borough is 3,270.
What is the Total Male Population of Athens borough?
Total Male Population of Athens borough is 1,837.
What is the Total Female Population of Athens borough?
Total Female Population of Athens borough is 1,433.
What is the Ratio of Males per 100 Females in Athens borough?
There are 128.19 Males per 100 Females in Athens borough.
What is the Ratio of Females per 100 Males in Athens borough?
There are 78.01 Females per 100 Males in Athens borough.
What is the Median Population Age in Athens borough?
Median Population Age in Athens borough is 48.6 Years.
What is the Average Family Size in Athens borough
Average Family Size in Athens borough is 2.9 People.
What is the Average Household Size in Athens borough
Average Household Size in Athens borough is 1.8 People.
How Large is the Labor Force in Athens borough?
There are 1,615 People in the Labor Forcein in Athens borough.
What is the Percentage of People in the Labor Force in Athens borough?
58.8% of People are in the Labor Force in Athens borough.
What is the Unemployment Rate in Athens borough?
Unemployment Rate in Athens borough is 3.5%.